Alineamiento Matricial (Harr Plot, Matrix Plot, Dot Plot, Dot Matrix)
Upload
nguyenlienCategory
view
217download
0
U.S. Department of the InteriorU.S. Geological Survey
Gas and Isotope Chemistry of Thermal Featuresin Yellowstone National Park, Wyoming
Scientific Investigations Report 2011–5012Version 1.1, September 2014

FRONT COVERUSGS researchers sample gas from a fumarole of the Quagmire Group, Lower Geyser Basin. (USGS photograph by Kathryn Flynn, September 21, 2005).

Gas and Isotope Chemistry of Thermal Features in Yellowstone National Park, Wyoming
By Deborah Bergfeld, Jacob B. Lowenstern, Andrew G. Hunt, W.C. Pat Shanks III, and William C. Evans
Scientific Investigations Report 2011–5012Version 1.1, September 2014
U.S. Department of the InteriorU.S. Geological Survey

U.S. Department of the InteriorSALLY JEWELL, Secretary
U.S. Geological SurveySuzette M. Kimball, Acting Director
U.S. Geological Survey, Reston, VirginiaFirst release: 2011Revised: September 2014 (ver. 1.1)
For more information on the USGS—the Federal source for science about the Earth, its natural and living resources, natural hazards, and the environment—visit http://www.usgs.gov or call 1–888–ASK–USGS
For an overview of USGS information products, including maps, imagery, and publications, visit http://www.usgs.gov/pubprod
To order this and other USGS information products, visit http://store.usgs.gov
Any use of trade, firm, or product names is for descriptive purposes only and does not imply endorsement by the U.S. Government.
Although this information product, for the most part, is in the public domain, it also may contain copyrighted materials as noted in the text. Permission to reproduce copyrighted items must be secured from the copyright owner.
Suggested citation: Bergfeld, Deborah, Lowenstern, J.B., Hunt, A.G., Shanks, W.C.P., III, and Evans, W.C., 2014, Gas and isotope chemistry of thermal features in Yellowstone National Park, Wyoming (ver. 1.1, September 2014): U.S. Geological Survey Scien-tific Investigations Report 2011–5012, 28 p. and data files, http://dx.doi.org/10.3133/sir20115012. ISSN 2328-0328 (online)

iii
Contents
Abstract ...........................................................................................................................................................1Introduction.....................................................................................................................................................1Background and Previous Work .................................................................................................................1
Early Work ..............................................................................................................................................1Conceptual Models of the Yellowstone Geothermal System ........................................................3Gas Isotope Signatures and Fluid Origins ........................................................................................3Hydrocarbon Gases ..............................................................................................................................4Gas Chemistry........................................................................................................................................4
Objectives........................................................................................................................................................4Methods...........................................................................................................................................................5
Sampling .................................................................................................................................................5Analytical................................................................................................................................................6Data Formats and Uncertainties: Table 2 Gas Analyses ................................................................7Data Formats and Uncertainties: Table 3 Water Analyses ..........................................................15
Results ...........................................................................................................................................................15Bulk Gas Chemistry.............................................................................................................................15Gas to Steam Ratio (Xg) .....................................................................................................................18Isotopes ................................................................................................................................................18
Discussion .....................................................................................................................................................20Water and Steam Isotopes (δ18O and δD) .......................................................................................20Gas Chemistry......................................................................................................................................20
Summary........................................................................................................................................................25Acknowledgments .......................................................................................................................................26References ....................................................................................................................................................26Appendix 1. Site photos and summary information for Yellowstone gas and water samples (attached file; http://pubs.usgs.gov/sir/2011/5012/sir2011-5012_appendixes/sir2011-5012_appendix1.pdf).Appendix 2. Google Earth KML file linked to sample locations (attached file;
http://pubs.usgs.gov/sir/2011/5012/sir2011-5012_appendixes/sir2011-5012_appendix2.kmz/).Appendix 3. ArcGIS shape file with gas geochemical data and locations (attached file; http://pubs.usgs.gov/sir/2011/5012/sir2011-5012_appendixes/sir2011-5012_appendix3_gis.zip).
Figures 1. Map showing sample locations (green dots) within this database and other locations mentioned in the text. ................................................................................................2
2. Photos showing examples of sampled thermal features represented in this gas geochemistry database ..............................................................................................................5
3. Plot of δD vs. δ18O relative to Vienna Standard Mean Ocean Water (VSMOW) for condensed steam from selected Yellowstone fumaroles and for hot and cold
spring waters. ............................................................................................................................19 4. Histogram showing δ13C values relative to the standard Vienna PeeDee
Belemnite (VPDB) for CO2 in Yellowstone gas ......................................................................19
iv
5. Histogram showing 3He/4He Rc /Ra values for 73 gas samples collected from Yellowstone ................................................................................................................................20 6. Pie charts demonstrate the differences among gas discharges at Yellowstone. ..........21 7. Ternary diagram showing He, N2, and Ar relations for gas collected from
fumaroles and frying pans. ......................................................................................................22 8. Ternary diagram showing He, CH4, and Ar relations for gas collected from fumaroles and frying pans .......................................................................................................22 9. Map from Christiansen (2001) of the area around Norris Geyser Basin showing some of the gas-sample localities plotted as colored dots sized in proportion
to the CH4/He ratio .....................................................................................................................23 10. Plot showing mol percent CH4 versus mol percent C2H6 for samples from Eastern Yellowstone, Washburn Hot Springs, Norris Geyser Basin, and Heart Lake. .............................................................................................................................................2411. Plot showing the ethane to methane ratio (C2/C1) versus the δ13C value of methane (C1) as normalized by the same ratio in the standard Vienna PeeDee Belemnite (VPDB), for gas collected from fumaroles, frying pans, and pools at Yellowstone ............................................................................................................................25
Tables 1. Details concerning sample groupings and water types as discussed in the text ..................................................................................................................................................6 2. Sample collection parameters and major and trace chemical data for gas
samples collected within and around Yellowstone National Park, Wyoming during 2003 through 2012 ............................................................................................................8
3. Water chemistry, stable isotope values, and sample collection parameters for waters collected within and around Yellowstone Park, Wyoming, during 2003 through 2012.......................................................................................................................16 4. Statistical synthesis of individual gas species and radiogenic and stable isotope data for Yellowstone gas samples ............................................................................18

v
Conversion FactorsSI to Inch/Pound
Multiply By To obtain
Lengthcentimeter (cm) 0.3937 inch (in.)millimeter (mm) 0.03937 inch (in.)meter (m) 3.281 foot (ft) kilometer (km) 0.6214 mile (mi)kilometer (km) 0.5400 mile, nautical (nmi) meter (m) 1.094 yard (yd)
Volumeliter (L) 33.82 ounce, fluid (fl. oz)liter (L) 2.113 pint (pt)liter (L) 1.057 quart (qt)liter (L) 0.2642 gallon (gal)
Massmilligram (mg) 0.00003527 ounce, avoirdupois (oz)gram (g) 0.03527 ounce, avoirdupois (oz)
Temperature in degrees Celsius (°C) may be converted to degrees Fahrenheit (°F) as follows:°F=(1.8×°C)+32Vertical coordinate information is referenced to the North American datum of 1983 (NAD 83).Horizontal coordinate information is referenced to the North American Datum of 1983 (NAD 83).Altitude, as used in this report, refers to distance above the vertical datum.Concentrations of chemical constituents in water are given in milligrams per liter (mg/L).


Gas and Isotope Chemistry of Thermal Features in Yellowstone National Park, Wyoming
By Deborah Bergfeld, Jacob B. Lowenstern, Andrew G. Hunt, W.C. Pat Shanks III, and William C. Evans
AbstractThis report presents 167 gas analyses and 59 related
water analyses on samples collected from thermal features at Yellowstone between 2003 and 2012. An overview of previ-ous studies of gas emissions at Yellowstone is also given. The analytical results from the present study include bulk chemis-try of gases and waters and isotope values for water and steam (d18O, dD), carbon dioxide (d13C only), methane (d13C only), helium, neon, and argon. We include appendixes containing photos of sample sites, geographic information system (GIS) files including shape and kml formats, and analytical results in spreadsheets. In addition, we provide a lengthy discussion of previous work on gas chemistry at Yellowstone and a general discussion of the implications of our results. We demonstrate that gases collected from different thermal areas often have distinct chemical signatures, and that differences across the thermal areas are not a simple function of surface temperatures or the type of feature. Instead, gas chemistry and isotopic composition are linked to subsurface lithologies and varying contributions from magmatic, crustal, and meteoric sources.
Introduction Yellowstone National Park hosts an active hydrothermal
system with more than 10,000 individual thermal springs, pools, and fumaroles (Fournier, 1989). These thermal features exist because of heat generated by intrusion and crystallization of magma beneath the Yellowstone Caldera and its surroundings coincident to an abundant water supply (Lowenstern and Hurwitz, 2008). The heat that is transferred upwards into voluminous groundwater reservoirs produces hydrothermal fluids that may boil on ascent, feeding surface hot springs and fumaroles. Gases in hot springs and fumaroles are sufficient in volume and flux that significant magmatic input is required, at least for the carbon dioxide (Werner and Brantley, 2003; Lowenstern and Hurwitz, 2008). The different gas species have a variety of potential sources in addition to magma (see, for example, Giggenbach and Poreda, 1993; Minissale and others, 1997; Lowenstern and Janik, 2003), including descending meteoric waters, as well as reactions with volcanic and nonvolcanic wallrocks and organic
material. The water and gas chemistry is also affected by high-temperature interaction with silicate rocks (Giggenbach, 1984; Hurwitz and others, 2010) and by biological activity at the surface, including respiration by thermophilic organisms that reside within and around the thermal features (see, for example, Nordstrom and others, 2006; Shock and others, 2010). The chemistry of gas emanations provides important clues about the history and ongoing process of magma degassing, metamorphism, water-rock interaction, hydrothermal reservoir conditions, and biological activity.
This report presents a database of gas and isotope chemistry for 167 samples collected from fumaroles, pools, and “frying pans” from areas within and around Yellowstone National Park. Some of the 167 analyses represent replicate samples collected back-to-back in different bottles on the same day, and others are samples collected from the same location in different years. All of the samples were collected in August or September from 2003 to 2012. This report focuses on gas-phase samples because they provide information on the underlying magmatic system and various crustal rocks. Dissolved gas concentrations, by contrast, are more likely to reflect solubility constraints at near-surface conditions, rather than conditions established deep in the system.Following a discussion of previous work, we present a brief discussion of the general geochemistry of the collected gases. We also provide sufficient metadata (locations, photographs, and temperatures) to aid with interpretation of the chemical characteristics of the gases. Finally, we consider the systematic variations in gas concentrations and ratios and their significance for understanding the gas sources. Future publications will further develop interpretations and will discuss the implications for magmatism, crustal metamorphism, and hydrothermal processes.
Background and Previous Work
Early Work
Early trappers and explorers in the Yellowstone region recognized sulfurous odors and brimstone (sulfur-bearing) deposits, plus the “soda gas” (CO2) emerging at Mammoth Hot Springs (fig. 1). Indeed, C.L. Heizmann, the chemist for

2 Gas and Isotope Chemistry of Thermal Features in Yellowstone National Park, Wyoming44
° 45
N44
° 15
N
111°00 W 110°30 W 110°00 W
16-Heart Lake
15-Upper Geyser Basin
12-Smoke-jumper Hot Springs
9-Brimstone Basin
7-Terrace Springs
3-Lower Geyser Basin
13-Potts Basin
8-Norris Geyser Basin
18-Gibbon River Basins
6-Roaring Mountain
17-North of Norris11-EasternYellowstone
14-Mud Volcano
2-WashburnHot Springs
4-Mammoth Hot Springs
5-Forest Springs
10-GasVents
1-Snake River Hot Spring
1-Crater Hills
1-Tower
1-Ochre Springs
NRoads
Resurgent domesNational park boundary
Thermal areasSamples
Caldera outer scarp
0 5 10 miles
0 5 10 15 km
CS
DG
RS
EXPLANATION
Lake
Figure 1. Map showing sample locations (green dots) within this database and other locations mentioned in the text. Sample groups 2–18 are circled by bold black lines and are labeled with the group name and group number as listed in table 1. Sample group 1 contains miscellaneous samples located in four areas that are shown in italicized text. CS=Calcite Spring, DG=Death Gulch, RS=Rainbow Springs.
Background and Previous Work 3
the 1873 Jones Expedition was able to confirm the presence of both sulfur and carbonic gases (Jones, 1875). Gooch and Whitfield (1888) published a remarkable set of analyses of thermal waters, but they made no attempt to analyze gas bubbles emerging from the waters or nearby soils. Weed (1889) described gas vents along Cache Creek, dubbing the area “Death Gulch” (fig. 1) for the dead animals (including six deceased bears) that were found at the time to have succumbed to the effects of noxious gas. Jaggar (1899) later revisited and documented the gas vents of “Death Gulch,” and Traphagen (1904) analyzed the gases, finding lethal amounts of both CO2 and H2S within cracks and near ground level.
In his paper “Origin of the Thermal Waters in the Yellowstone National Park,” Hague (1911) reported gas analyses by F.C. Phillips of Pittsburgh, Pennsylvania. Most samples appear to have been contaminated by significant amounts of air, but many were dominated by CO2 and some contained H2S and CH4. Hague (1911) argued that the thermal waters of Yellowstone were meteoric in origin and had descended a sufficient distance to acquire heat and solutes before ascending back to the surface. The waters were believed to be acidic at depth and subsequently neutralized through degassing of H2S and CO2.
It was not until the monumental work of Allen and Day (1935) that a detailed study of gases from Yellowstone National Park was completed. Their 525-page treatise presented detailed summaries of most of Yellowstone’s thermal areas, including water chemistry, flow rates, and heat discharge. Many of their measurements, especially with respect to spring and stream discharge, have not been redetermined in the subsequent 75 years. With respect to gas chemistry, Allen and Day (1935) provided analyses for most of the major species from 40 locations and showed that CO2 dominated other gases, CO was essentially absent, and H2S was the next most abundant gas after steam and CO2. They recognized that little water flowed from the acid terrains, whereas considerable water flow could be found in the alkaline, Cl-rich thermal areas. They also noted more abundant gas associated with the acid waters; they were able to collect 1 liter of gas in about 6 minutes from acid waters, whereas it could take more than ten times that long to collect the same volume of gas from alkaline waters (Allen and Day, 1935, p. 90). Finally, Allen and Day (1935) noted that gases from alkaline waters were much richer in N2 and other air-sourced gases. Their thinking was fundamentally different from that of Hague (1911), because they hypothesized that magmatic gas rose straight to the surface and was composed of superheated steam and CO2 with minor amounts of H2, CH4, N2, Ar, and H2S. They thus believed that fumaroles, or steam vents, were features that discharged gases from depth. Alkaline waters issued in topographically low areas where groundwater was most abundant and could minimize the mass of rising acid gas. Higher areas with deeper groundwater were overwhelmed by fumarolic emanations, resulting in acid waters and acid-altered terrains. This model represented a great departure from that of Hague (1911), who envisioned that both acid and alkaline
waters were ultimately meteoric in origin, with alkaline waters as degassed or reacted equivalents of acid waters.
Conceptual Models of the Yellowstone Geothermal System
White (1957) provided a new conceptual view that differed from those of previous workers and could be applied to a variety of Yellowstone’s acid sulfate regions (his terminology) located close to areas bearing alkaline waters. He believed the acid sulfate waters (those acid waters high in sulfate but low in chloride) represented the steam boiled off alkaline waters. Condensation of the steam and shallow oxidation of H2S (the latter also discussed by Allen and Day, 1935) created hot, acid-altered terrain. This theme was later expanded upon in White and others (1971), using abundant data from Yellowstone, including lessons learned from scientific drilling in Yellowstone during the late 1960s (White and others, 1975). Truesdell and Fournier (1976) and Fournier (1989) focused their efforts mainly on the neutral chloride fluids, finding evidence that most of the waters in and near the Yellowstone Caldera could be derived from a single parent fluid at 340°C and with ~400 mg/l Cl-. Waters boiled off this fluid would rise in acid sulfate regions. Divergent mixing, cooling, and boiling paths would result in the diversity of neutral to alkaline waters in the geyser basins.
Morgan and others (2003) and Morgan and Shanks (2005) suggested that lava flows exert a fundamental control on the locations of thermal basins through lateral flow of deep-seated waters in basal breccias, resulting in venting at edges of lava flows in drainage basins. Hurwitz and others (2007, 2010) noted the pronounced differences in river chemistries around the caldera, attributing the variability to significant (shallow) lateral migration of originally deep Cl-rich geothermal fluids that emerge at the surface primarily at low elevations along the Firehole, Gibbon, and Snake rivers, near Heart Lake, and at West Thumb. The acid-sulfate terrains, mostly concentrated in the eastern part of the caldera, reflect areas of deep boiling and gas discharge (Fournier, 1989). Nordstrom and others (2006, 2009) discussed the detailed geochemistry of H2S oxidation in acid sulfate systems, the formation of abiogenic sulfur mounds, and oxidation and reduction reactions, some biotic, that form sulfuric acid, thiosulfate, polythionate, and sulfate. Nordstrom and others (2009) classified acid sulfate waters as “MG,” reflecting their inferred origin as meteoric (M) waters fluxed with hot gas (G).
Gas Isotope Signatures and Fluid Origins
With the development of tools in nuclear isotope geochemistry following World War II, many researchers began to apply isotopic analyses to understanding the origins of the geothermal waters and gases of Yellowstone. Craig (1953) looked at the isotopes of carbon from numerous gases, carbonates, organic materials, and other sources in an overview of the systematics of carbon at Yellowstone. The d13C value of

4 Gas and Isotope Chemistry of Thermal Features in Yellowstone National Park, Wyoming
CO2 in Yellowstone gases averaged –2.8 per mil, which was similar to values from limestone but greater than that seen in igneous rocks (at that time thought to be < –20 per mil), causing him to conclude that the gases were likely sourced primarily from limestone. Later work on hydrogen and oxygen isotopes (Craig and others, 1956) showed that water and steam from Yellowstone were almost entirely of meteoric origin. Gas ratios determined by Mazor and Wasserburg (1965) and later by Gunter and Musgrave (1966) also pointed to a clear meteoric origin of the waters, because noble gas ratios displayed atmospheric values. Excess He was attributed to radioactive decay of crustal materials. Later studies on gases from geothermal drillholes in Yellowstone confirmed the presence of radiogenic He and Ar, but no evidence was found for crustal or magmatic sources of H2O (Mazor and Fournier, 1973).
Craig and others (1978) were the first to document high 3He/4He ratios in Yellowstone gases, finding R/Ra values (the 3He/4He ratio of the sample relative to that of air) as high as 15 and attributing this to the hotspot setting. They also remarked that in some areas (for example, Mud Volcano) there was minimal influence of continental crust on the mantle-derived He isotope signatures. Further evidence for a diversity of gas sources came from subsequent studies of noble gases. Kennedy and others (1985, 1987) undertook a detailed study of the noble gas isotope systematics, and they found evidence for three primary end members—atmospheric, crustal and magmatic, the latter best exemplified by gases from Mud Volcano. The crustal endmember had 40*Ar/4*He of 0.245 (the * denoting radiogenic origin), consistent with a K/U source ratio of about 14,000 (Kennedy and others, 1985). Results from Werner and others (2008) extended the K/U ratio to a value as low as 2,000 for gas from the Hot Spring Basin region, consistent with derivation from limestone or quartz-rich sedimentary rocks.
More local studies undertaken on the Lower Geyser Basin (Kennedy and others, 1987) and in Shoshone Geyser Basin (Hearn and others, 1990) found that R/Ra values were correlated with bicarbonate concentrations in spring waters. Both groups concluded that degassing of the waters lowered their He (and bicarbonate) concentrations, allowing greater influence of mixing with crustal (radiogenic) He (see also Fournier and others, 1994). The most magmatic He-isotope signatures were retained by samples that cooled without considerable boiling during upflow. Evans and others (2006) undertook a detailed study of the chemistry of waters and gases from springs northeast of the Yellowstone Caldera, searching for evidence of an inferred CO2-rich gas body thought to be located between Norris Junction and Hebgen Lake (Husen and others, 2004). The low flux of dead (old) carbon and low R/Ra provided little evidence for the accumulation of magmatic or metamorphic gas in that region.
Hydrocarbon Gases
Other workers have focused on the origin of organic gases such as methane (CH4) and higher hydrocarbons. Such gases at Yellowstone are especially abundant in eastern areas of the
park, including those known to produce small seeps of liquid petroleum (Love and Good, 1970). Des Marais and others (1981) demonstrated convincingly that the decomposition of sediments containing organic material was responsible for generating methane. They noted that the ratio of methane to higher hydrocarbons was far lower than would be predicted by full equilibration of C-O-H gases under geothermal conditions and were consistent with disequilibrium breakdown of organic matter in wallrocks. Clifton and others (1990) studied “hydrothermal” petroleum and inferred Eocene mudstone sources for Rainbow Springs (fig. 1), whereas petroleum found at Calcite Spring was inferred to be derived from the Permian Phosphoria Formation and recent sediments filling the valley of the Yellowstone River. Lorenson and others (1991) published hydrocarbon gas and isotopic analyses from these and a variety of other springs and seeps throughout the park.
Gas ChemistryAfter Allen and Day (1935), few subsequent studies have
reported complete analyses of gas compositions. Hearn and others (1990) published nine full analyses of gases from hot springs and fumaroles sampled at Shoshone Geyser Basin in 1982 and 1986. Sheppard and others (1992), using results from sites sampled between 1974 and 1986, demonstrated that gases obtained from large pools were unlikely to yield reliable results because of differential gas solubility in the near-surface water. They concluded that most Yellowstone gases represent a mixture of gas derived from air-saturated meteoric water with gas containing a He-rich crustal endmember, consistent with the findings of Kennedy and others (1985). Werner (2002) and Werner and Brantley (2003) provided 15 full analyses of gases from Yellowstone in conjunction with calderawide estimates of CO2 flux. Goff and Janik (2002) compared nine of these samples and three others from Yellowstone with those from the Valles and Long Valley calderas and concluded that at Yellowstone, gas was derived from air-saturated meteoric water and a He-rich endmember that could originate from either mantle or crustal materials. Relative CH4 abundances were higher than in gases from the Valles and Long Valley calderas. Werner and others (2008) demonstrated that Hot Spring Basin gases were relatively rich in rock-derived crustal components such as He, CH4, and H2.
ObjectivesThree different types of features—fumaroles, “frying
pans,” and thermal pools (fig. 2)—were sampled to provide a comprehensive overview of gas geochemistry in Yellowstone National Park and to provide information on the gas geochemistry of the hydrothermal and magmatic systems. We sought fumarole samples (steam and gas vented through cracks or holes in the ground) whenever possible, because they provide the best samples of deep-seated gases. Fumaroles only exist where the temperature of the thermal feature equals

Methods 5
or exceeds that of the local boiling point of water. In thermal areas where the subsurface is water saturated, one often finds a terrain of “frying pans” (sizzling ground), features whose temperatures are close to the boiling point. In locations where there were no fumaroles (or locations where an existing fumarole could not be sampled) frying pans provided the next-best sampling point. Some areas lack fumaroles and frying pans and instead have pools, where gas bubbles emerge from the surface of liquid water. Though some pools are connected to flowing springs, other pools lack outlet channels and consist of stagnant or convecting water. Gases rising through such pools and through frying pans cannot be attributed simply to boiling of the water in the pools but must come from depth.
Locations for gas samples are shown in figure 1, a map of Yellowstone National Park with dots for individual samples and showing sample groups as defined in table 1 and keyed to the remainder of the tables and figures in the manuscript. For the purpose of this report, water types of specific thermal areas are defined as follows: (1) acid sulfate waters are waters with pH < 5 and sulfate as the primary anion, (2) neutral Cl waters have pH > 5 and Cl as the primary anion, and (3) Na and Ca carbonate waters have carbonate as the dominant anion, with either Na or Ca as the primary cation. Thermal areas with more than one water type are denoted as “various” in table 1. Other papers (for example, Fournier, 1989; Nordstrom and others, 2009) provide more detailed descriptions of water chemistry. Photographs and summary tables for each gas sample are provided in appendix 1. Appendixes 2 and 3 contain KML and shape files to be used with Google Earth and ArcGIS software programs, respectively.
Methods Sampling
Gas, water, and steam-condensate samples were collected and analyzed using standard field and laboratory methods. Sampling sites at locations with multiple features were selected on the basis of comparison of vent temperatures and the strength of gas outflow. At all locations, temperatures were measured using a K-type thermocouple and digital thermometer. At warm and cold springs, pH was measured using a calibrated meter, and indicator strips were used at hot springs and pools.
Bulk gas composition was determined following methods outlined in Fahlquist and Janik (1992). Fumarole samples were collected via a titanium tube, whereas a funnel fitted with flexible tubing was used to collect gas from frying pans and pools (fig. 2). Silicone tubing was used to connect the funnel or titanium tube to the sample bottle for all samples before the 2005 field season. Tygon tubing was used for some samples in 2005, and in all subsequent years. At fumaroles, a separate aliquot of condensed steam was often collected into glass bottles for stable-isotope analysis. The steam was condensed by adding a length of Tygon tubing to the sampling
Figure 2. Photos showing examples of sampled thermal features represented in this gas geochemistry database. A, Fumaroles are features where steam/gas emerges from dry ground or through a crack. B, Pools and springs are features where water issues from the ground (with associated gas bubbles) or where gas rises through standing water. C, “Frying pans” are areas of sizzling ground with abundant steam/gas discharge and small amounts of liquid water.
YL09-11 Frying Pan
YL06-05 Pool
YL08-02Fumarole
A
B
C
6 Gas and Isotope Chemistry of Thermal Features in Yellowstone National Park, Wyoming
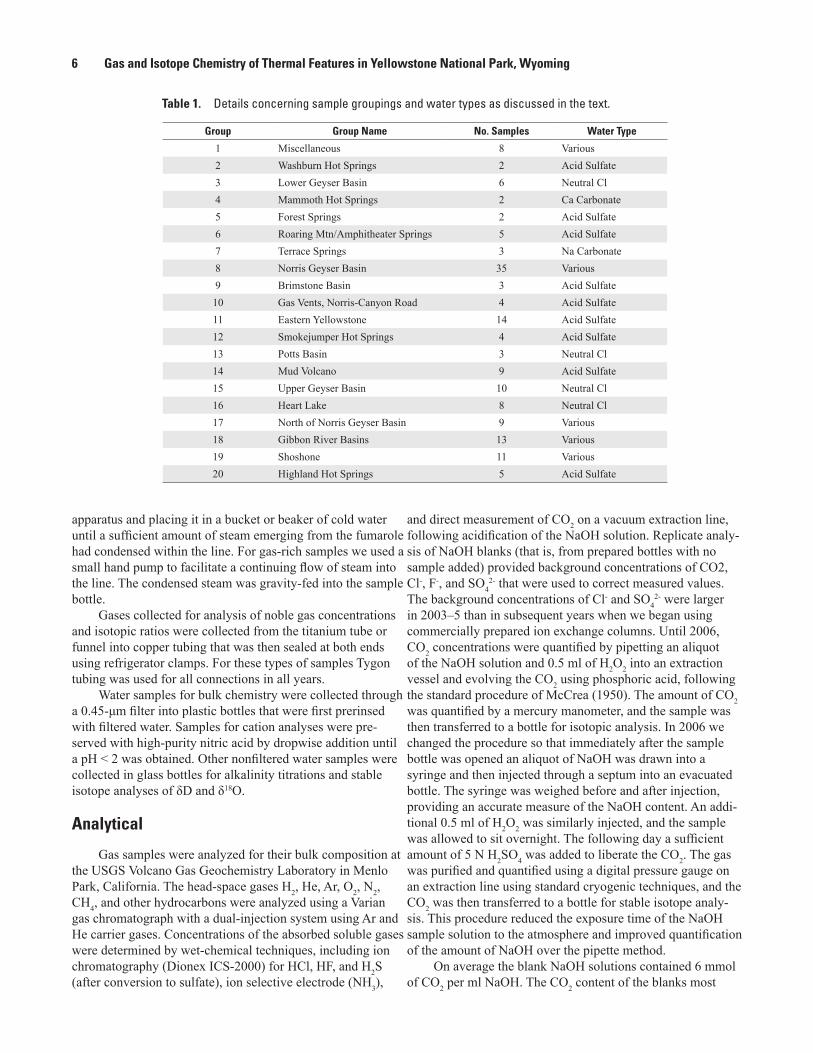
Group Group Name No. Samples Water Type
1 Miscellaneous 8 Various2 Washburn Hot Springs 2 Acid Sulfate3 Lower Geyser Basin 6 Neutral Cl4 Mammoth Hot Springs 2 Ca Carbonate5 Forest Springs 2 Acid Sulfate6 Roaring Mtn/Amphitheater Springs 5 Acid Sulfate7 Terrace Springs 3 Na Carbonate8 Norris Geyser Basin 35 Various9 Brimstone Basin 3 Acid Sulfate
10 Gas Vents, Norris-Canyon Road 4 Acid Sulfate11 Eastern Yellowstone 14 Acid Sulfate12 Smokejumper Hot Springs 4 Acid Sulfate13 Potts Basin 3 Neutral Cl14 Mud Volcano 9 Acid Sulfate15 Upper Geyser Basin 10 Neutral Cl16 Heart Lake 8 Neutral Cl17 North of Norris Geyser Basin 9 Various18 Gibbon River Basins 13 Various19 Shoshone 11 Various20 Highland Hot Springs 5 Acid Sulfate
Table 1. Details concerning sample groupings and water types as discussed in the text.
apparatus and placing it in a bucket or beaker of cold water until a sufficient amount of steam emerging from the fumarole had condensed within the line. For gas-rich samples we used a small hand pump to facilitate a continuing flow of steam into the line. The condensed steam was gravity-fed into the sample bottle.
Gases collected for analysis of noble gas concentrations and isotopic ratios were collected from the titanium tube or funnel into copper tubing that was then sealed at both ends using refrigerator clamps. For these types of samples Tygon tubing was used for all connections in all years.
Water samples for bulk chemistry were collected through a 0.45-μm filter into plastic bottles that were first prerinsed with filtered water. Samples for cation analyses were pre-served with high-purity nitric acid by dropwise addition until a pH < 2 was obtained. Other nonfiltered water samples were collected in glass bottles for alkalinity titrations and stable isotope analyses of δD and δ18O.
Analytical
Gas samples were analyzed for their bulk composition at the USGS Volcano Gas Geochemistry Laboratory in Menlo Park, California. The head-space gases H2, He, Ar, O2, N2, CH4, and other hydrocarbons were analyzed using a Varian gas chromatograph with a dual-injection system using Ar and He carrier gases. Concentrations of the absorbed soluble gases were determined by wet-chemical techniques, including ion chromatography (Dionex ICS-2000) for HCl, HF, and H2S (after conversion to sulfate), ion selective electrode (NH3),
and direct measurement of CO2 on a vacuum extraction line, following acidification of the NaOH solution. Replicate analy-sis of NaOH blanks (that is, from prepared bottles with no sample added) provided background concentrations of CO2, Cl-, F-, and SO4
2- that were used to correct measured values. The background concentrations of Cl- and SO4
2- were larger in 2003–5 than in subsequent years when we began using commercially prepared ion exchange columns. Until 2006, CO2 concentrations were quantified by pipetting an aliquot of the NaOH solution and 0.5 ml of H2O2 into an extraction vessel and evolving the CO2 using phosphoric acid, following the standard procedure of McCrea (1950). The amount of CO2 was quantified by a mercury manometer, and the sample was then transferred to a bottle for isotopic analysis. In 2006 we changed the procedure so that immediately after the sample bottle was opened an aliquot of NaOH was drawn into a syringe and then injected through a septum into an evacuated bottle. The syringe was weighed before and after injection, providing an accurate measure of the NaOH content. An addi-tional 0.5 ml of H2O2 was similarly injected, and the sample was allowed to sit overnight. The following day a sufficient amount of 5 N H2SO4 was added to liberate the CO2. The gas was purified and quantified using a digital pressure gauge on an extraction line using standard cryogenic techniques, and the CO2 was then transferred to a bottle for stable isotope analy-sis. This procedure reduced the exposure time of the NaOH sample solution to the atmosphere and improved quantification of the amount of NaOH over the pipette method.
On average the blank NaOH solutions contained 6 mmol of CO2 per ml NaOH. The CO2 content of the blanks most

Methods 7
likely reflects exposure of the solution to atmospheric CO2 during bottle preparation. Results of five analyses of the blank-generated CO2 had d13C-CO2 values between –21.1 and –17.6 per mil, the low d13C values resulting from kinetically controlled isotopic fractionation when atmospheric CO2 (d13C ≈ –8 per mil) diffuses into the NaOH (Fritz and others, 1985). For most samples the influence of this small amount of atmospherically derived CO2 on the final carbon isotope composition is not detectable. Comparison of d13C-CO2 values from replicates where one sample is collected in NaOH and a second sample is collected in an evacuated bottle show that, at CO2 concentrations greater than 50 mmol per ml NaOH, there is no discernable isotopic shift. All samples with CO2 isotope data in table 2 have concentrations above this cutoff value.
Starting in 2008, an aliquot of the head-space gas from samples with sufficient CH4 was reserved for carbon isotopic analysis. Water and CO2 were removed from the bulk gas using standard cryogenic techniques. The remaining gas, mostly N2 and CH4, was introduced to a section of the vacuum line containing a copper-oxide furnace and the temperature raised to 800°C (Kiyosu and Krouse, 1989). To ensure total conversion of CH4 to CO2 the gas was held at 800°C for 2 hours. Upon completion, the temperature was lowered and the furnace cooled slowly to 400°C. After cooling, the volume of produced CO2 was determined and the sample was sent to the USGS lab in Reston, Virginia, for d13C analysis.
Isotope analyses were preformed at several laboratories. Carbon isotope analyses were performed at USGS laboratories in Menlo Park and Reston. The 3He/4He determination was run at the USGS Noble Gas Laboratory in Denver, Colorado, as discussed in Werner and others (2008). dD and d18O analyses of waters (dDw, d18Ow) and condensed steam (dDs, d18Os) were performed at the USGS laboratory in Denver. During 2003-8 the water and steam isotope analyses were performed using techniques outlined in Coleman and others (1982) and Epstein and Mayeda (1953). In 2009 these analyses were performed by laser cavity ring-down spectroscopy.
Anion concentrations were determined using ion chromatography (Cl-, F-, SO4
2-) and titration (HCO3
-). Cation concentrations were determined using either inductively coupled plasma mass spectroscopy (Perkin Elmer ELAN 6000, 2003-7) or inductively coupled plasma optical emission spectroscopy (Thermo Scientific icap 6000, 2008-9) at USGS laboratories in Menlo Park.
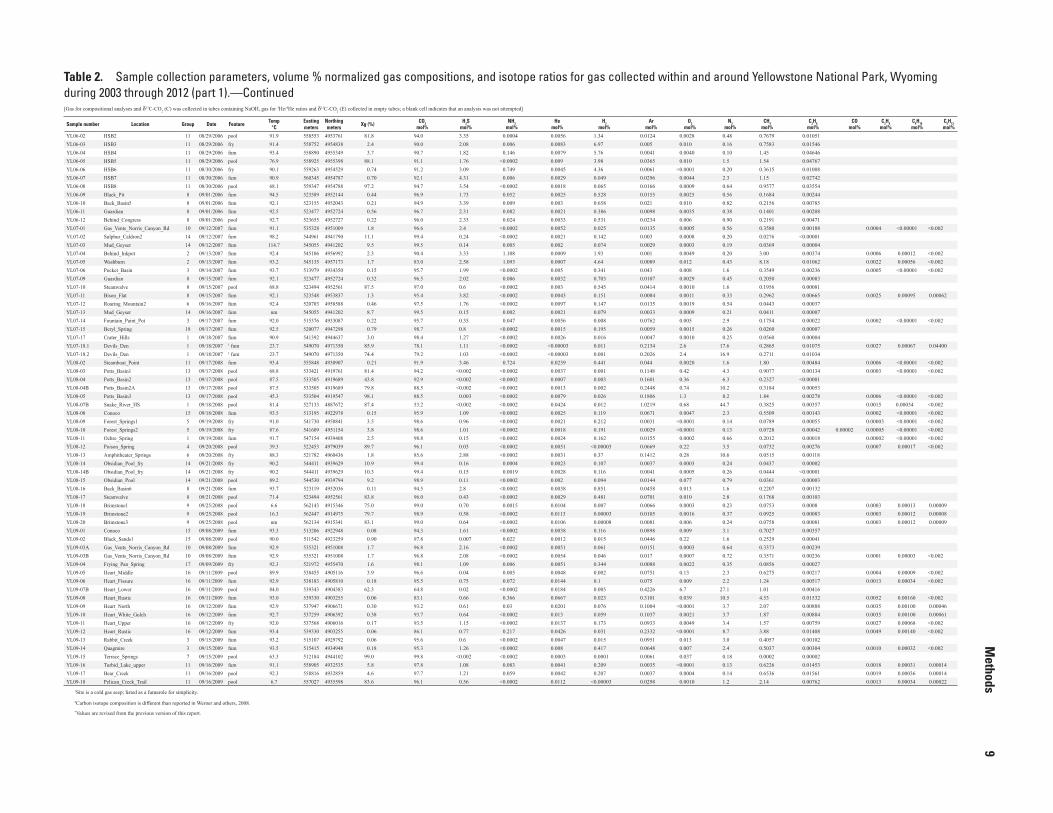
Data Formats and Uncertainties: Table 2 Gas Analyses
Below we outline the data columns in table 2 and information relevant for interpretation of values and their related uncertainties.
Sample: Alpha-numeric codes begin with YL followed by a two-digit year code (03 for 2003, for
example), a hyphen, and a sample number for that year.
Location: Informal name for the sampled feature. The name could be a defined thermal feature or could indicate simply that the sample was taken in the same general location. When we sampled an actual thermal feature denoted in the Yellowstone Thermal Features database (http://www.rcn.montana.edu/Features/Search.aspx), we list the name of that feature in the“YNP Thermal Features Database” column.
Group: One of twenty groups defined for the purpose of explication and plot generation. Except for group 1 (Miscellaneous) and group 11 (Eastern Yellowstone), samples in a group are generally closely located. The groups shown below are also described and categorized in table 1.
1. Miscellaneous 2. Washburn Hot Springs 3. Lower Geyser Basin 4. Mammoth Hot Springs 5. Forest Springs 6. Roaring Mountain/Amphitheater Springs 7. Terrace Springs 8. Norris Geyser Basin 9. Brimstone Basin 10. Gas Vents (Norris-Canyon Road) 11. Eastern Yellowstone 12. Smokejumper Hot Springs 13. Potts Basin 14. Mud Volcano 15. Upper Geyser Basin 16. Heart Lake 17. North of Norris Geyser Basin 18. Gibbon River Basins19. Shoshone 20. Highland Hot Springs
Date Sampled: In month/day/year format (mm/dd/yyyy).Feature: Split into three types: (1) fum (fumarole), (2) fry
(frying pan), and (3) pool (pools and springs). Some fumaroles may be steaming ground or subboiling gas seeps.
Temp: Temperature in degrees Celsius. Temperature can be reproducibly measured to within 0.1°C, but accuracy may be limited to ~0.5°C because of temperature variability within the feature and instrumental variations.
Easting: East-west location in Universal Transverse Mercator (UTM) coordinate system, Zone 12. Datum is NAD83 (nearly identical to WGS84). Units are in meters. Uncertainties are generally ~3 m.
Northing: North-south location in Universal Transverse Mercator (UTM) coordinates, Zone 12. Datum is NAD83 (nearly identical to WGS84). Units are in meters. Uncertainties are generally ~3 m.
Xg%: Mole percent gas relative to gas plus steam. A sample with no steam would have a value of 100 (for example,

Sample number Location Group Date Feature Temp°C
Eastingmeters
Northingmeters Xg (%) CO2
mol%H2S
mol%NH3
mol%He
mol%H2
mol%Ar
mol%O2
mol%N2
mol%CH4
mol%C2H6
mol%CO
mol%C3H8
mol%C4H10mol%
C5H12mol%
YL03-01A Lone_Star 15 09/04/2003 fry 94.0 515429 4918413 0.11 87.6 3.68 0.081 0.0041 0.770 0.1583 0.49 6.3 0.8768 0.00183YL03-02A Fountain_Paint_Pot 3 09/05/2003 fum 111.1 515386 4933083 0.48 94.3 0.45 0.02 0.0051 0.008 0.1014 0.28 4.0 0.8543 0.00103YL03-03A Black_Sands1 15 09/05/2003 fry 92.2 511542 4923256 0.50 95.3 0.25 0.028 0.0019 0.023 0.0959 0.48 3.4 0.4218 0.0005YL03-04A Black_Sands2 15 09/05/2003 pool 76.1 511628 4923190 82.4 77.6 0.22 0.002 0.0093 <0.00003 0.4473 2.7 17.4 1.66 0.00226YL03-05B Near_DB 8 09/06/2003 fum 94.7 523214 4952111 0.05 75.1 7.6 0.037 0.0021 0.598 0.348 1.7 14.5 0.1444 0.00041YL03-06B Green_Dragon 8 09/06/2003 pool 88.6 523196 4951898 37.7 84.5 0.4 0.002 0.0045 0.091 0.343 0.60 13.8 0.2981 0.00115YL03-07 Son_of_Green_Dragon 8 09/06/2003 fum 94.1 523208 4952035 0.15 90.2 3.94 0.007 0.0012 0.318 0.121 0.48 4.8 0.0858 0.00011YL03-08 Dishwater 8 09/06/2003 pool 89.4 523384 4952086 9.4 91.0 0.6 0.005 0.0024 0.376 0.1733 0.59 6.8 0.1654 0.00058YL03-09B Beryl_Spring 18 09/07/2003 fum 99.6 520077 4947298 1.1 98.3 0.83 0.009 0.0011 0.141 0.0176 0.0005 0.73 0.0183 0.00001YL03-10B Black_Growler 8 09/07/2003 fum 93.6 523502 4952728 0.30 93.6 2.91 0.139 0.0016 0.388 0.0716 0.009 2.8 0.1032 0.00041YL03-11B Black_Pit 8 09/07/2003 pool 82.3 523588 4952139 80.5 94.0 0.69 0.0006 0.0023 0.649 0.0954 0.52 3.9 0.1557 0.00063YL03-12A Porcelain_Terrace1 8 09/07/2003 fum 93.9 523746 4953112 1.0 96.9 2.0 0.0012 0.0045 0.333 0.0134 0.0008 0.47 0.2849 0.00063YL03-13A Nymph_Lake_new_feature 17 09/08/2003 fum 93.6 521471 4955495 0.93 97.7 0.92 0.021 0.0041 0.232 0.0257 0.013 1.0 0.0641 0.00014YL03-14B Terrace_Springs 7 09/08/2003 pool 63.3 512184 4944102 86.6 99.8 <0.002 <0.0002 0.0003 0.001 0.0054 0.036 0.17 0.0003 <0.00001YL03-15A W_Nymph_Lake_Thermal_Area1 17 09/09/2003 pool 82.0 520335 4954609 43.6 97.7 0.4 <0.0002 0.008 0.187 0.0389 0.028 1.5 0.1363 0.00018YL03-16A W_Nymph_Lake_Thermal_Area2 17 09/09/2003 fry 92.0 520244 4954683 2.8 98.5 0.73 0.001 0.0039 0.161 0.0125 0.0002 0.52 0.0712 0.00009YL03-17A Conoco 15 09/10/2003 fum 94.5 513205 4922954 0.20 91.3 1.55 0.039 0.0021 0.074 0.1468 0.81 5.6 0.4836 0.0008YL03-18A Smokejumper1 12 09/12/2003 pool 85.0 503793 4917530 75.5 83.0 1.06 0.001 0.0146 5.27 0.2254 0.30 8.7 1.43 0.00323YL03-19A Smokejumper2 12 09/12/2003 fum 92.1 503260 4918509 0.47 89.5 3.86 0.02 0.0069 2.28 0.0924 0.0032 3.5 0.6940 0.00175YL03-20 Smokejumper3 12 09/12/2003 fum 92.1 503273 4918792 0.36 89.0 4.09 0.008 0.0058 2.63 0.0846 0.013 3.6 0.5705 0.00143YL03-21A Smokejumper4 12 09/12/2003 fry 92.1 503559 4918096 0.29 88.3 4.44 0.026 0.0072 3.13 0.0841 0.032 3.3 0.6862 0.00175YL04-01 Black_Pit 8 09/13/2004 fum 92.6 523588 4952139 0.68 97.6 0.59 0.058 0.0022 0.484 0.0268 0.0016 1.1 0.1423 0.00073YL04-02 nr_Gibbon_R1 8 09/13/2004 pool 84.0 523658 4954007 4.7 96.5 1.44 0.008 0.0037 0.546 0.024 0.0005 0.94 0.2855 0.00884YL04-03 nr_Gibbon_R2 8 09/13/2004 pool 72.8 523680 4954101 93.3 97.5 1.29 <0.0002 0.0031 0.324 0.0121 0.0028 0.50 0.3367 0.02172YL04-04 Nymph_Lake_new_feature 17 09/13/2004 fry 93.0 521444 4955530 1.2 97.8 0.67 0.007 0.0045 0.195 0.0278 0.0009 1.2 0.0729 0.00014YL04-05 Conoco 15 09/14/2004 fum 94.3 513182 4922973 0.20 93.3 1.05 0.011 0.0022 0.088 0.1245 0.10 4.8 0.5016 0.00055YL04-06 Bison_Kill 8 09/14/2004 pool 8.5 523471 4954042 61.4 96.1 0.04 <0.0002 0.0013 0.0003 0.0683 0.68 3.0 0.1406 0.00446YL04-07 Bison_Flat1 8 09/14/2004 fum 92.9 523527 4953778 2.9 97.1 1.87 <0.0002 0.0046 0.023 0.0158 0.0013 0.66 0.2939 0.00564YL04-08 Back_Basin1 8 09/15/2004 fum nm 523182 4952090 0.21 94.3 2.17 0.008 0.002 0.268 0.0739 0.006 3.0 0.1190 0.00026YL04-09 Back_Basin2 8 09/15/2004 pool 67.4 522963 4952193 91.7 93.8 0.39 <0.0002 0.0015 0.011 0.1537 0.024 5.5 0.1008 0.0002YL04-10 Green_Dragon 8 09/15/2004 pool 76.8 523197 4951894 3.1 93.9 0.92 0.001 0.0026 0.43 0.0661 0.057 4.4 0.1679 0.00075YL04-11 Steamboat_mud_volcano 8 09/15/2004 fum 92.8 523502 4952272 0.56 96.7 2.31 0.082 0.0021 0.386 0.0098 0.0035 0.38 0.1401 0.00208YL04-12 Porcelain_Terrace2 8 09/15/2004 fum 92.6 523732 4953033 1.0 97.1 1.29 0.001 0.0041 0.498 0.0206 0.0006 0.80 0.2616 0.00144YL04-13 Hundred_Springs_Plain 8 09/15/2004 pool 89.1 523113 4953330 23.4 93.9 0.23 0.0003 0.0057 0.556 0.118 0.047 4.8 0.3261 0.00172YL04-14 Beryl_Spring 18 09/16/2004 fum 93.1 520093 4947311 0.76 95.6 0.7 0.015 0.0007 0.083 0.0604 0.017 3.5 0.0101 0.00001YL04-15 Devils_Den 1 09/16/2004 1 fum 27.2 549077 4971336 89.3 98.0 1.08 0.0002 0.0006 0.002 0.0071 0.0030 0.30 0.5873 0.01778YL04-17 Sylvan_Springs1 18 09/17/2004 pool 22.4 517878 4949941 87.3 98.6 0.16 <0.0002 0.0034 0.134 0.0253 0.0049 1.1 0.0226 0.00002YL04-19 Sylvan_Springs2 18 09/17/2004 fum 97.8 518326 4949582 6.5 99.0 0.47 0.0004 0.0035 0.142 0.0075 0.0005 0.32 0.0216 0.00002YL04-20 Sylvan_Springs3 18 09/17/2004 fry 91.9 518326 4949582 3.9 98.9 0.45 <0.0002 0.0033 0.117 0.0114 0.0005 0.48 0.0206 0.00002YL04-21 Gas_Vents_Norris_Canyon_Rd 10 09/18/2004 fum 92.1 535329 4951004 1.5 97.3 1.33 0.0003 0.0048 0.031 0.0258 0.0016 1.0 0.3216 0.00154YL04-22 Artist_Paintpot 18 09/18/2004 fry 91.7 520838 4948760 0.16 87.9 0.66 0.005 0.0013 0.079 0.1971 2.7 8.4 0.0393 0.00065YL05-01 Black_Pit 8 09/13/2005 fum 91.7 523589 4952144 0.92 97.7 0.73 0.025 0.0032 0.624 0.0124 0.0007 0.45 0.2074 0.00159YL05-02 Terrace_Springs 7 09/13/2005 pool 62.3 512184 4944102 55.0 99.7 0.01 <0.0002 0.0004 0.0001 0.0086 0.058 0.25 0.0003 0.00015YL05-03 Frying_Pan_Spring 17 09/14/2005 fry 91.8 521979 4955476 1.5 98.7 0.49 0.006 0.0042 0.368 0.0101 0.0006 0.38 0.0866 0.00051YL05-04 Gibbon_River_Bridge 18 09/14/2005 fum 93.4 520295 4947980 3.0 99.3 0.34 <0.0002 0.0016 0.195 0.0039 0.0005 0.17 0.0286 0.00038YL05-05 Conoco 15 09/14/2005 fum 92.5 513181 4922972 0.18 96.0 0.72 <0.0002 0.0026 0.119 0.0744 0.005 2.5 0.6078 0.00266YL05-06 Back_Basin3 8 09/15/2005 fum 92.6 523170 4952046 0.09 93.4 2.74 <0.0002 0.002 0.345 0.1088 0.011 3.2 0.1243 0.01314YL05-07 Back_Basin4 8 09/15/2005 pool 87.4 523011 4952171 82.2 91.1 0.72 <0.0002 0.0021 0.001 0.2227 0.0017 7.8 0.0985 0.00181YL05-08 Black_Growler 8 09/15/2005 fum 93.6 523496 4952728 0.53 97.7 1.11 0.011 0.0029 0.529 0.0141 0.0011 0.49 0.1742 0.00146YL05-09 Bison_Flat2 8 09/16/2005 fum 93.9 523538 4953830 1.7 97.6 1.53 <0.0002 0.0052 0.122 0.0113 0.0006 0.41 0.3246 0.00726YL05-10 Nymph_Lake_new_feature 17 09/16/2005 fum 93.5 521456 4955507 2.7 98.9 0.45 0.0008 0.0044 0.224 0.0081 0.0004 0.30 0.0727 0.00034YL05-11 Chocolate_Pots 18 09/16/2005 pool 52.5 520496 4950780 93.1 98.5 0.002 <0.0002 0.0013 0.0001 0.0401 0.014 1.4 0.0328 0.00044YL05-12 Sulphur_Caldron1 14 09/17/2005 pool 68.9 544992 4941758 93.5 99.3 0.16 <0.0002 0.0021 0.139 0.0077 0.016 0.36 0.0313 <0.00001YL05-13 Mud_Geyser 14 09/17/2005 fum 112.9 545055 4941205 10.6 99.5 0.14 0.0008 0.0022 0.078 0.0035 0.0002 0.21 0.0423 0.00011YL05-13A Mud_Geyser 14 09/17/2005 fum 112.9 545056 4941209 14.0 99.5 0.15 0.0003 0.0022 0.075 0.0032 0.0001 0.20 0.0411 0.0001YL05-14 Roaring_Mountain1 6 09/19/2005 fum 92.7 520861 4958599 2.9 98.9 0.61 <0.0002 0.0104 0.086 0.0091 0.0002 0.32 0.0456 0.00047YL05-15 Narrow_Gauge 4 09/19/2005 pool 74.8 522880 4979593 96.1 99.5 0.25 <0.0002 0.00003 0.0003 0.0049 0.0043 0.19 0.0021 0.00017YL05-17A Quagmire 3 09/21/2005 fry 93.4 515413 4934949 0.12 93.0 2.81 0.008 0.0081 0.511 0.0878 0.007 3.0 0.5680 0.00533YL05-17B Quagmire 3 09/21/2005 fry 93.4 515402 4934942 0.13 94.0 2.22 0.012 0.0078 0.471 0.0761 0.0026 2.7 0.5221 0.00446YL05-18A Gibbon_River_Bridge 18 09/21/2005 fum 93.2 520295 4947980 2.6 99.3 0.38 <0.0002 0.0015 0.188 0.0035 0.0005 0.14 0.0271 0.0003YL05-18B Gibbon_River_Bridge 18 09/21/2005 fum 93.2 520295 4947980 2.2 99.3 0.32 <0.0002 0.0014 0.183 0.0036 0.0002 0.16 0.0260 0.00023YL05-18C Gibbon_River_Bridge 18 09/21/2005 fum 93.2 520295 4947980 2.3 99.3 0.35 <0.0002 0.0014 0.175 0.0047 0.0012 0.16 0.0249 0.00023YL05-18D Gibbon_River_Bridge 18 09/21/2005 fum 93.2 520295 4947980 2.3 99.1 0.3 <0.0002 0.0014 0.177 0.0103 0.0003 0.42 0.0255 0.00026YL06-01A HSB1 11 08/27/2006 fum 91.9 558800 4954767 1.4 93.2 2.33 0.003 0.008 3.53 0.0051 0.007 0.17 0.7683 0.01643
Table 2. Sample collection parameters, volume % normalized gas compositions, and isotope ratios for gas collected within and around Yellowstone National Park, Wyoming during 2003 through 2012 (part 1).[Gas for compositional analyses and δ13C-CO2 (C) was collected in tubes containing NaOH, gas for 3He/4He ratios and δ13C-CO2 (E) collected in empty tubes; a blank cell indicates that an analysis was not attempted]
8
Gas and Isotope Chemistry of Therm
al Features in Yellowstone N
ational Park, Wyom
ing
*Values are revised from the previous version of this report.
2Carbon isotope composition is different than reported in Werner and others, 2008.
1Site is a cold gas seep; listed as a fumarole for simplicity.
Sample number Location Group Date Feature Temp°C
Eastingmeters
Northingmeters Xg (%) CO2
mol%H2S
mol%NH3
mol%He
mol%H2
mol%Ar
mol%O2
mol%N2
mol%CH4
mol%C2H6
mol%CO
mol%C3H8
mol%C4H10mol%
C5H12mol%
YL06-02 HSB2 11 08/29/2006 pool 91.9 558553 4953761 81.8 94.0 3.35 0.0004 0.0056 1.34 0.0124 0.0028 0.48 0.7679 0.01051YL06-03 HSB3 11 08/29/2006 fry 91.4 558752 4954838 2.4 90.0 2.08 0.006 0.0083 6.97 0.005 0.010 0.16 0.7583 0.01546YL06-04 HSB4 11 08/29/2006 fum 93.4 558890 4955349 3.7 90.7 1.82 0.146 0.0079 5.76 0.0041 0.0040 0.10 1.45 0.04646YL06-05 HSB5 11 08/29/2006 pool 76.9 558925 4955398 88.1 91.1 1.76 <0.0002 0.009 3.98 0.0365 0.010 1.5 1.54 0.04767YL06-06 HSB6 11 08/30/2006 fry 90.1 559263 4954529 0.74 91.2 3.09 0.749 0.0045 4.36 0.0061 <0.0001 0.20 0.3615 0.01008YL06-07 HSB7 11 08/30/2006 fum 90.9 560345 4954787 0.70 92.1 4.31 0.006 0.0029 0.049 0.0296 0.0044 2.3 1.15 0.02742YL06-08 HSB8 11 08/30/2006 pool 68.1 559347 4954788 97.2 94.7 3.54 <0.0002 0.0018 0.065 0.0166 0.0009 0.64 0.9577 0.03554YL06-09 Black_Pit 8 09/01/2006 fum 94.5 523589 4952144 0.44 96.9 1.73 0.052 0.0025 0.528 0.0155 0.0025 0.56 0.1684 0.00244YL06-10 Back_Basin5 8 09/01/2006 fum 92.1 523155 4952043 0.21 94.9 3.39 0.009 0.003 0.658 0.021 0.010 0.82 0.2156 0.00785YL06-11 Guardian 8 09/01/2006 fum 92.5 523477 4952724 0.56 96.7 2.31 0.082 0.0021 0.386 0.0098 0.0035 0.38 0.1401 0.00208YL06-12 Behind_Congress 8 09/01/2006 pool 92.7 523655 4952727 0.22 96.0 2.33 0.024 0.0033 0.531 0.0234 0.006 0.90 0.2191 0.00471YL07-01 Gas_Vents_Norris_Canyon_Rd 10 09/12/2007 fum 91.1 535328 4951009 1.8 96.6 2.4 <0.0002 0.0052 0.025 0.0135 0.0005 0.56 0.3580 0.00188 0.0004 <0.00001 <0.002YL07-02 Sulphur_Caldron2 14 09/12/2007 fum 98.2 544961 4941790 11.1 99.4 0.24 <0.0002 0.0021 0.142 0.003 0.0008 0.20 0.0276 <0.00001YL07-03 Mud_Geyser 14 09/12/2007 fum 114.7 545055 4941202 9.5 99.5 0.14 0.005 0.002 0.074 0.0029 0.0003 0.19 0.0369 0.00004YL07-04 Behind_Inkpot 2 09/13/2007 fum 92.4 545106 4956992 2.3 90.4 3.33 1.108 0.0009 1.93 0.001 0.0049 0.20 3.00 0.00374 0.0006 0.00012 <0.002YL07-05 Washburn 2 09/13/2007 fum 93.2 545135 4957173 1.7 83.0 2.58 1.093 0.0007 4.64 0.0089 0.012 0.43 8.18 0.01062 0.0022 0.00056 <0.002YL07-06 Pocket_Basin 3 09/14/2007 fum 93.7 513979 4934350 0.15 95.7 1.99 <0.0002 0.005 0.341 0.043 0.008 1.6 0.3549 0.00236 0.0005 <0.00001 <0.002YL07-09 Guardian 8 09/15/2007 fum 92.1 523477 4952724 0.32 96.5 2.02 0.086 0.0032 0.703 0.0107 0.0029 0.45 0.2050 0.00083YL07-10 Steamvalve 8 09/15/2007 pool 68.8 523494 4952561 87.5 97.0 0.6 <0.0002 0.003 0.545 0.0414 0.0010 1.6 0.1956 0.00081YL07-11 Bison_Flat 8 09/15/2007 fum 92.1 523548 4953837 1.3 95.4 3.82 <0.0002 0.0043 0.151 0.0084 0.0011 0.33 0.2962 0.00665 0.0025 0.00095 0.00062YL07-12 Roaring_Mountain2 6 09/16/2007 fum 92.4 520703 4958588 0.46 97.5 1.76 <0.0002 0.0097 0.147 0.0135 0.0019 0.54 0.0443 0.00037YL07-13 Mud_Geyser 14 09/16/2007 fum nm 545055 4941202 8.7 99.5 0.15 0.002 0.0021 0.079 0.0033 0.0009 0.21 0.0411 0.00007YL07-14 Fountain_Paint_Pot 3 09/17/2007 fum 92.0 515376 4933087 0.22 95.7 0.35 0.047 0.0056 0.008 0.0762 0.005 2.9 0.1754 0.00022 0.0002 <0.00001 <0.002YL07-15 Beryl_Spring 18 09/17/2007 fum 92.5 520077 4947298 0.79 98.7 0.8 <0.0002 0.0015 0.195 0.0059 0.0015 0.26 0.0260 0.00007YL07-17 Crater_Hills 1 09/18/2007 fum 90.9 541392 4944637 3.0 98.4 1.27 <0.0002 0.0026 0.016 0.0047 0.0010 0.25 0.0560 0.00004YL07-18.1 Devils_Den 1 09/18/2007 1 fum 23.7 549070 4971350 85.9 78.1 1.11 <0.0002 <0.00003 0.011 0.2134 2.6 17.6 0.2865 0.01075 0.0027 0.00067 0.04400YL07-18.2 Devils_Den 1 09/18/2007 1 fum 23.7 549070 4971350 74.4 79.2 1.03 <0.0002 <0.00003 0.001 0.2026 2.4 16.9 0.2711 0.01034YL08-02 Steamboat_Point 11 09/17/2008 fum 93.4 555848 4930907 0.21 91.9 3.46 0.724 0.0239 0.441 0.044 0.0020 1.6 1.80 0.00484 0.0006 <0.00001 <0.002YL08-03 Potts_Basin1 13 09/17/2008 pool 68.8 533421 4919761 81.4 94.2 <0.002 <0.0002 0.0037 0.001 0.1148 0.42 4.3 0.9077 0.00134 0.0003 <0.00001 <0.002YL08-04 Potts_Basin2 13 09/17/2008 pool 87.5 533505 4919689 43.8 92.9 <0.002 <0.0002 0.0007 0.003 0.1601 0.36 6.3 0.2327 <0.00001YL08-04B Potts_Basin2A 13 09/17/2008 pool 87.5 533505 4919689 79.8 88.5 <0.002 <0.0002 0.0013 0.002 0.2448 0.74 10.2 0.3184 0.00053YL08-05 Potts_Basin3 13 09/17/2008 pool 45.3 533504 4919547 98.1 88.5 0.003 <0.0002 0.0079 0.026 0.1806 1.3 8.2 1.84 0.00278 0.0006 <0.00001 <0.002YL08-07B Snake_River_HS 1 09/18/2008 pool 81.4 527133 4887672 87.4 53.2 <0.002 <0.0002 0.0424 0.012 1.0219 0.68 44.7 0.3825 0.00357 0.0015 0.00034 <0.002YL08-08 Conoco 15 09/18/2008 fum 93.5 513195 4922978 0.15 95.9 1.09 <0.0002 0.0025 0.119 0.0671 0.0047 2.3 0.5509 0.00143 0.0002 <0.00001 <0.002YL08-09 Forest_Springs1 5 09/19/2008 fry 91.0 541730 4950841 3.5 98.6 0.96 <0.0002 0.0021 0.212 0.0031 <0.0001 0.14 0.0789 0.00055 0.00003 <0.00001 <0.002YL08-10 Forest_Springs2 5 09/19/2008 fry 87.6 541609 4951154 3.8 98.6 1.01 <0.0002 0.0018 0.191 0.0029 <0.0001 0.13 0.0728 0.00042 0.00002 0.00005 <0.00001 <0.002YL08-11 Ochre_Spring 1 09/19/2008 fum 91.7 547154 4939408 2.5 98.8 0.15 <0.0002 0.0024 0.162 0.0155 0.0002 0.66 0.2012 0.00018 0.00002 <0.00001 <0.002YL08-12 Poison_Spring 4 09/20/2008 pool 39.3 522453 4979039 89.7 96.1 0.03 <0.0002 0.0051 <0.00003 0.0669 0.22 3.5 0.0732 0.00276 0.0007 0.00017 <0.002YL08-13 Amphitheater_Springs 6 09/20/2008 fry 88.3 521782 4960436 1.8 85.6 2.88 <0.0002 0.0031 0.37 0.1412 0.28 10.6 0.0515 0.00118YL08-14 Obsidian_Pool_fry 14 09/21/2008 fry 90.2 544411 4939629 10.9 99.4 0.16 0.0004 0.0023 0.107 0.0037 0.0003 0.24 0.0437 0.00002YL08-14B Obsidian_Pool_fry 14 09/21/2008 fry 90.2 544411 4939629 10.3 99.4 0.15 0.0019 0.0028 0.116 0.0041 0.0005 0.26 0.0444 <0.00001YL08-15 Obsidian_Pool 14 09/21/2008 pool 89.2 544530 4939794 9.2 98.9 0.11 <0.0002 0.002 0.094 0.0144 0.077 0.79 0.0361 0.00003YL08-16 Back_Basin6 8 09/21/2008 fum 93.7 523119 4952036 0.11 94.5 2.8 <0.0002 0.0038 0.851 0.0458 0.013 1.6 0.2207 0.00132YL08-17 Steamvalve 8 09/21/2008 pool 71.4 523494 4952561 83.8 96.0 0.43 <0.0002 0.0029 0.481 0.0701 0.010 2.8 0.1768 0.00103YL08-18 Brimstone1 9 09/25/2008 pool 6.6 562143 4915346 75.0 99.0 0.70 0.0015 0.0104 0.007 0.0066 0.0003 0.23 0.0753 0.0008 0.0003 0.00013 0.00009YL08-19 Brimstone2 9 09/25/2008 pool 16.3 562447 4914975 79.7 98.9 0.58 <0.0002 0.0113 0.00003 0.0105 0.0016 0.37 0.0925 0.00083 0.0003 0.00012 0.00008YL08-20 Brimstone3 9 09/25/2008 pool nm 562134 4915341 83.1 99.0 0.64 <0.0002 0.0106 0.00008 0.0081 0.006 0.24 0.0758 0.00081 0.0003 0.00012 0.00009YL09-01 Conoco 15 09/08/2009 fum 93.3 513206 4922948 0.08 94.3 1.61 <0.0002 0.0038 0.116 0.0898 0.009 3.1 0.7027 0.00357YL09-02 Black_Sands1 15 09/08/2009 pool 90.0 511542 4923259 0.90 97.8 0.007 0.022 0.0012 0.015 0.0446 0.22 1.6 0.2529 0.00041YL09-03A Gas_Vents_Norris_Canyon_Rd 10 09/08/2009 fum 92.9 535321 4951008 1.7 96.8 2.16 <0.0002 0.0051 0.061 0.0151 0.0003 0.64 0.3373 0.00239YL09-03B Gas_Vents_Norris_Canyon_Rd 10 09/08/2009 fum 92.9 535321 4951008 1.7 96.8 2.08 <0.0002 0.0054 0.046 0.017 0.0007 0.72 0.3571 0.00236 0.0001 0.00003 <0.002YL09-04 Frying_Pan_Spring 17 09/09/2009 fry 92.3 521972 4955470 1.6 98.1 1.09 0.006 0.0051 0.344 0.0088 0.0022 0.35 0.0856 0.00027YL09-05 Heart_Middle 16 09/11/2009 pool 89.9 538455 4905116 3.9 96.6 0.04 0.005 0.0048 0.002 0.0751 0.13 2.3 0.6275 0.00217 0.0004 0.00009 <0.002YL09-06 Heart_Fissure 16 09/11/2009 fum 92.9 538183 4905810 0.18 95.5 0.75 0.072 0.0144 0.1 0.075 0.009 2.2 1.24 0.00517 0.0013 0.00034 <0.002YL09-07B Heart_Lower 16 09/11/2009 pool 84.0 539343 4904383 62.3 64.8 0.02 <0.0002 0.0184 0.005 0.4226 6.7 27.1 1.01 0.00416YL09-08 Heart_Rustic 16 09/11/2009 fum 93.0 539330 4903255 0.06 83.1 0.66 0.366 0.0667 0.023 0.3101 0.039 10.5 4.53 0.01532 0.0052 0.00160 <0.002YL09-09 Heart_North 16 09/12/2009 fum 92.9 537947 4906671 0.30 93.2 0.61 0.03 0.0201 0.076 0.1004 <0.0001 3.7 2.07 0.00888 0.0035 0.00100 0.00046YL09-10 Heart_White_Gulch 16 09/12/2009 fum 92.7 537259 4906392 0.38 93.7 0.64 <0.0002 0.013 0.059 0.1037 0.0021 3.7 1.87 0.00884 0.0035 0.00100 0.00061YL09-11 Heart_Upper 16 09/12/2009 fry 92.0 537568 4906016 0.17 93.5 1.15 <0.0002 0.0137 0.173 0.0933 0.0049 3.4 1.57 0.00759 0.0027 0.00068 <0.002YL09-12 Heart_Rustic 16 09/12/2009 fum 93.4 539330 4903255 0.06 86.1 0.77 0.217 0.0426 0.031 0.2332 <0.0001 8.7 3.88 0.01408 0.0049 0.00140 <0.002YL09-13 Rabbit_Creek 3 09/15/2009 fum 93.2 515107 4929792 0.06 95.6 0.6 <0.0002 0.0047 0.015 0.0951 0.013 3.0 0.4057 0.00102YL09-14 Quagmire 3 09/15/2009 fum 93.5 515415 4934948 0.18 95.3 1.26 <0.0002 0.008 0.417 0.0648 0.007 2.4 0.5037 0.00304 0.0010 0.00032 <0.002YL09-15 Terrace_Springs 7 09/15/2009 pool 63.3 512184 4944102 99.0 99.8 <0.002 <0.0002 0.0003 0.0001 0.0061 0.037 0.18 0.0002 0.00002YL09-16 Turbid_Lake_upper 11 09/16/2009 fum 91.1 558905 4932535 5.8 97.8 1.08 0.083 0.0041 0.209 0.0035 <0.0001 0.13 0.6226 0.01453 0.0018 0.00031 0.00014YL09-17 Bear_Creek 11 09/16/2009 pool 92.3 558816 4932859 4.6 97.7 1.21 0.059 0.0042 0.207 0.0037 0.0004 0.14 0.6536 0.01561 0.0019 0.00036 0.00014YL09-18 Pelican_Creek_Trail 11 09/16/2009 pool 6.7 557027 4935598 83.6 96.1 0.56 <0.0002 0.0112 <0.00003 0.0298 0.0010 1.2 2.14 0.00762 0.0013 0.00034 0.00022
Table 2. Sample collection parameters, volume % normalized gas compositions, and isotope ratios for gas collected within and around Yellowstone National Park, Wyoming during 2003 through 2012 (part 1).—Continued[Gas for compositional analyses and δ13C-CO2 (C) was collected in tubes containing NaOH, gas for 3He/4He ratios and δ13C-CO2 (E) collected in empty tubes; a blank cell indicates that an analysis was not attempted]
Methods
9
*Values are revised from the previous version of this report.
2Carbon isotope composition is different than reported in Werner and others, 2008.
1Site is a cold gas seep; listed as a fumarole for simplicity.

Sample number Location Group Date Feature Temp°C
Eastingmeters
Northingmeters Xg (%) CO2
mol%H2S
mol%NH3
mol%He
mol%H2
mol%Ar
mol%O2
mol%N2
mol%CH4
mol%C2H6
mol%CO
mol%C3H8
mol%C4H10mol%
C5H12mol%
VHZDB11-01 Big 102 14 09/12/2012 soil gas 546322 4940154YL11-02 Conoco 15 09/09/2011 fum 93.9 513199 4922960 0.2 95.6 1.10 0.030 0.004 0.107 0.0702 0.0037 2.4 0.5688 0.00135 0.0033 0.0004 <0.00001 <0.002YL11-03 Mud_Geyser 14 09/10/2011 fum 113.4 545054 4941203 12.0 99.5 0.15 0.002 0.002 0.084 0.0035 <0.0001 0.23 0.0453 0.00003 0.0001YL11-04 Back_Basin6 8 09/10/2011 fum 93.2 523119 4952036 0.15 94.8 3.29 0.045 0.003 0.570 0.0249 0.010 0.87 0.1846 0.00139 <0.00001 <0.00001 <0.002YL11-05 Steamboat_mud_volcano 8 09/10/2011 fum 93.6 523502 4952272 1.4 97.0 2.04 0.005 0.002 0.501 0.0081 0.0005 0.30 0.1548 0.00086YL11-06 Gibbon_River_Bridge 18 09/10/2011 fum 94.1 520295 4947980 2.1 99.0 0.56 0.005 0.001 0.188 0.0045 0.0006 0.20 0.0277 0.00013 0.0003YL11-07 Shoshone_01 19 09/12/2011 fum 92.6 516273 4911441 0.23 91.4 5.81 0.027 0.003 0.272 0.0482 0.023 1.8 0.5314 0.00162 0.0012 0.0001 <0.00001 <0.002YL11-11 Shoshone_03 19 09/12/2011 pool 86.5 516447 4911596 87.0 89.9 0.72 <0.0002 0.004 1.97 0.1427 <0.0001 6.6 0.6765 0.00218 0.0001YL11-13 Shoshone_04 19 09/13/2011 fum 92.8 516153 4911145 0.4 92.2 3.69 0.020 0.004 1.29 0.0545 <0.0001 2.1 0.6310 0.00176 0.0009YL11-14 Shoshone_05 19 09/13/2011 fum 92.7 516308 4911063 0.23 92.3 4.72 0.013 0.003 0.166 0.0547 0.0041 2.1 0.6118 0.00168 0.0030 0.0001 <0.00001 <0.002YL11-15_1 Shoshone_06 19 09/13/2011 fum 94.7 516224 4911474 0.32 91.6 5.01 0.009 0.003 0.203 0.0553 0.0016 2.5 0.5870 0.00174 0.0009YL11-15_2 Shoshone_06 19 09/13/2011 fum 94.7 516224 4911474 0.32 91.8 4.96 0.012 0.002 0.309 0.0527 <0.0001 2.2 0.5567 0.00166 0.0008YL11-16 Shoshone_07 19 09/14/2011 fum 91.6 515879 4911472 0.20 96.8 0.03 0.093 0.002 0.005 0.0773 0.20 2.5 0.2160 0.00051 0.0013 <0.00001 <0.00001 <0.002YL11-17_1 Shoshone_08 19 09/14/2011 pool 87.6 515863 4911232 39.0 89.7 <0.002 0.009 0.007 0.051 0.2413 0.19 8.8 0.8038 0.00184YL11-17_2 Shoshone_08 19 09/14/2011 pool 87.6 515863 4911232 7.5 90.1 0.01 <0.0002 0.006 0.048 0.2323 0.19 8.5 0.7744 0.00185YL11-18 Shoshone_09 19 09/14/2011 pool 76.5 515954 4910960 63.0 65.7 0.05 <0.0002 0.003 0.023 0.4078 6.2 27.0 0.4444 0.00123YL11-19 Shoshone_10 19 09/14/2011 pool 85.2 516121 4911400 77.0 92.0 0.14 <0.0002 0.005 0.848 0.1652 <0.0001 6.0 0.8297 0.00224 0.0003 0.0002 <0.00001 <0.002YL11-27 Shoshone_11 19 09/15/2011 pool 84.9 516196 4911471 91.0 92.4 0.62 <0.0002 0.003 1.71 0.1113 <0.0001 4.4 0.7055 0.00219 0.0002YL11-31 Shoshone_12 19 09/15/2011 fum 92.3 516277 4911554 0.4 92.8 4.37 0.025 0.002 1.06 0.0358 <0.0001 1.4 0.3725 0.00108YL12-01 Gas_Vents_Norris_Canyon_Rd 10 07/10/2012 fum 92.4 535355 4950974 1.2 96.4 2.72 <0.0002 0.004 0.018 0.0115 0.0022 0.55 0.2854 0.00159 0.00002 <0.00001 <0.002YL12-02 Mary Bay 11 07/11/2012 fry 92.9 555264 4933613 0.52 89.5 5.08 0.037 0.008 1.97 0.0473 0.005 2.0 1.38 0.00321 0.0002 <0.00001 <0.002YL12-03 Butte Springs 11 07/11/2012 fry 95.1 557460 4929966 0.06 90.7 2.94 1.169 0.028 0.650 0.0870 0.038 3.2 1.16 0.00258 0.0006 <0.00001 <0.002YL12-04 Cinder Pool 8 07/14/2012 pool 84.2 522980 4953269 13.0 96.8 1.63 <0.0002 0.002 0.001 0.0353 0.0012 1.5 0.0901 0.00037 0.00002 <0.00001 <0.002YL12-05 Amphitheater_Springs 6 07/15/2012 fum ~92 521490 4960810 0.9 96.5 2.96 0.002 0.008 0.049 0.0099 0.014 0.40 0.0823 0.00144YL12-06 Helen’s Cool Pool 14 07/25/2012 pool 23.2 545673 4941001YL12-07 Monument Fumarole 18 09/06/2012 fum 114.2 519532 4947894 4.3 99.2 0.49 0.003 0.002 0.131 0.0028 0.0007 0.13 0.0196 0.00010 0.0001YL12-09 Highland #1 20 09/08/2012 fum 90.8 530167 4939875 0.8 80.0 14.91 <0.0002 0.004 0.094 0.0682 0.0020 4.6 0.3017 0.00006 0.0004YL12-10 Highland #2 20 09/08/2012 fum 91.5 530298 4939495 0.06 63.6 30.18 <0.0002 0.004 0.466 0.0977 0.052 5.4 0.2246 0.00011 0.0046YL12-11 Highland #3 20 09/09/2012 fum 92.5 530540 4939141 0.16 50.1 20.52 0.002 0.002 0.492 0.3491 0.018 28.3 0.1606 <0.00001 <0.0001YL12-14 Highland #4 20 09/09/2012 fum 92.3 530698 4938710 0.3 74.3 19.64 <0.0002 0.005 0.156 0.0768 0.023 5.6 0.2154 0.00004 0.0004YL12-15 Highland #5 20 09/09/2012 fum 92.3 530716 4938613 0.3 55.1 13.15 <0.0002 0.006 0.080 0.3876 0.019 31.1 0.1395 <0.00001 0.0002YL12-19 Nymph_Lake_new_feature 17 09/13/2012 fum 92.7 521452 4955523 2.1 98.5 0.97 <0.0002 0.005 0.104 0.0078 0.0015 0.32 0.0737 0.00025 0.0002 <0.00001 <0.00001 <0.002YL12-20 Nymph frying pan 17 09/13/2012 fry 91.4 521481 4955449 1.9 98.3 0.94 <0.0002 0.006 0.313 0.0096 0.0029 0.38 0.0887 0.00024YL12-21 Obsidian Creek Pool gas 6 09/13/2012 pool 68.8 520644 4959557 150.0 97.0 0.03 <0.0002 0.006 0.058 0.0501 0.75 2.0 0.0521 0.00075 0.0002 0.0001 0.00004 <0.002YL12-22 Gibbon_River_Bridge 18 09/13/2012 fum 93.3 520295 4947980 2.3 99.1 0.56 <0.0002 0.001 0.176 0.0031 0.0012 0.15 0.0264 0.00043 0.0002YL12-24 Sulfur Hills Fumarole #1 1 09/14/2012 fum 103.4 553792 4938184 0.24 80.4 6.60 0.461 0.006 8.63 0.0344 0.013 1.6 0.7420 0.00160 0.0019 0.0002 0.00007 <0.002YL12-25 Sulfur Hills Fumarole #2 1 09/14/2012 fum 114.3 554027 4938193 0.17 77.9 10.95 0.058 0.007 8.67 0.0511 0.083 1.6 0.6426 0.00783 0.0023
Table 2. Sample collection parameters, volume % normalized gas compositions, and isotope ratios for gas collected within and around Yellowstone National Park, Wyoming during 2003 through 2012 (part 1).—Continued[Gas for compositional analyses and δ13C-CO2 (C) was collected in tubes containing NaOH, gas for 3He/4He ratios and δ13C-CO2 (E) collected in empty tubes; a blank cell indicates that an analysis was not attempted]
10
Gas and Isotope Chemistry of Therm
al Features in Yellowstone N
ational Park, Wyom
ing
*Values are revised from the previous version of this report.
2Carbon isotope composition is different than reported in Werner and others, 2008.
1Site is a cold gas seep; listed as a fumarole for simplicity.

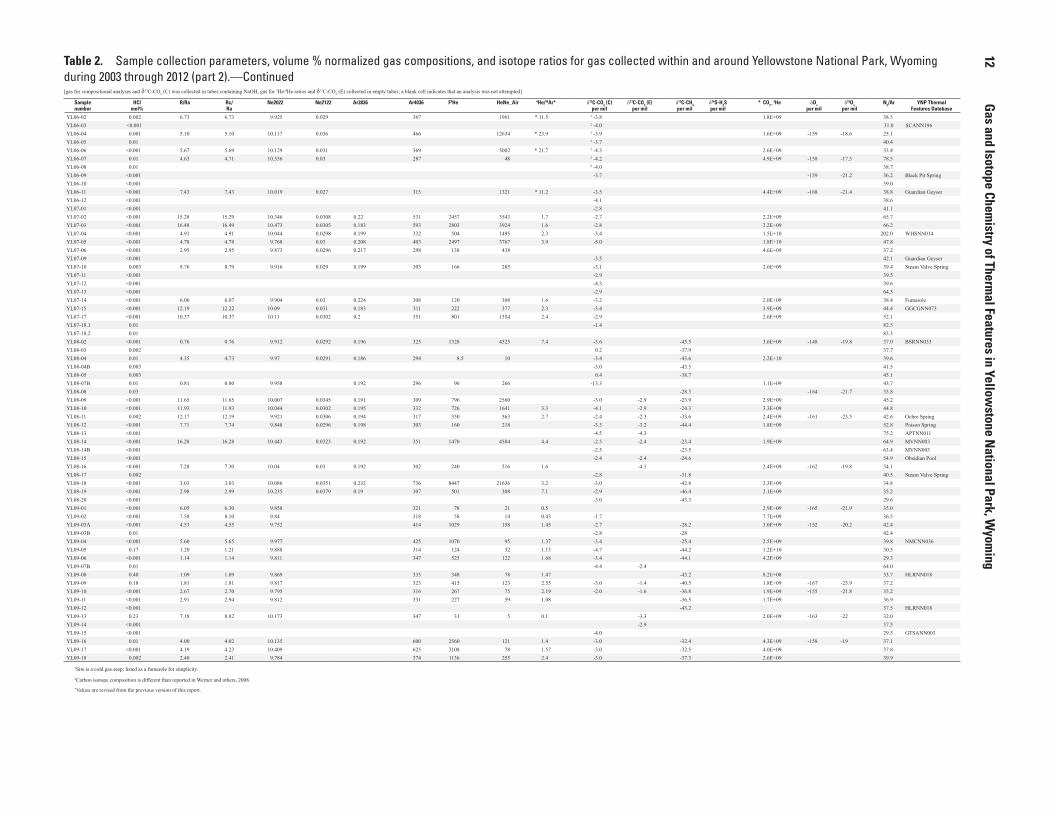
Sample number
HClmol%
R/Ra Rc/Ra
Ne2022 Ne2122 Ar3836 Ar4036 F4He HeNe_Air 4He/40Ar* δ13C-CO2 (C)per mil
δ13C-CO2 (E)per mil
δ13C-CH4per mil
δ34S-H2Sper mil
* CO2_3He δDs
per milδ18Os
per milN2/Ar YNP Thermal
Features DatabaseYL03-01A <0.001 7.32 7.37 9.952 0.0291 284 32 2.1E+09 -173 -21 40.0YL03-02A <0.001 6.11 6.13 9.888 0.0293 287 84 -3.2 2.2E+09 -175 -22.7 39.3 FumaroleYL03-03A <0.001 -3.4 -178 -21.1 35.2YL03-04A <0.001 -3.4 38.9YL03-05B <0.001 6.85 7.17 9.919 0.0292 291 5 3.7E+09 -172 -20.2 41.6YL03-06B <0.001 -3.0 40.2 Green Dragon SpringYL03-07 <0.001 6.87 7.04 9.992 0.0293 284 10 7.8E+09 -167 -20.2 40.0 Son of Green Dragon
SpringYL03-08 0.26 -2.7 39.1 Dishwater SpringYL03-09B <0.001 12.34 12.40 10.013 278 53 -1.0 5.2E+09 -178 -21.1 41.5 GGCGNN073YL03-10B <0.001 7.29 7.35 10.018 0.0295 281 29 -4.7 5.7E+09 -168 -20.8 39.4 Black GrowlerYL03-11B <0.001 -2.7 41.1 Black Pit SpringYL03-12A <0.001 -3.3 -171 -20.8 34.9YL03-13A <0.001 4.93 4.94 10.07 0.0303 287 124 -3.0 0.2 3.5E+09 -167 -19.8 39.8YL03-14B <0.001 7.92 7.93 9.761 292 186 -4.3 3.0E+10 31.3 GTSANN003YL03-15A <0.001 6.32 6.32 9.905 0.0289 299 220 -3.0 -1.2 1.4E+09 39.1YL03-16A <0.001 6.26 6.26 10.014 325 740 2.9E+09 41.3YL03-17A <0.001 7.72 7.82 294 19 -3.6 4.0E+09 -171 -22 38.1YL03-18A 0.01 -4.0 38.4YL03-19A <0.001 5.49 5.50 9.987 0.0294 292 95 -4.9 1.7E+09 -163 -20.6 38.1YL03-20 <0.001 -4.9 42.0YL03-21A <0.001 5.62 5.64 9.968 0.0294 302 95 -4.8 1.6E+09 -162 -21.7 39.0YL04-01 0.002 -3.7 40.1 Black Pit SpringYL04-02 0.20 -2.0 39.3YL04-03 0.01 -1.9 40.9YL04-04 0.02 4.74 4.75 10.306 312 1021 -3.5 3.3E+09 -159 -19.3 42.6YL04-05 0.01 7.39 7.45 10.102 293 100 -3.5 4.1E+09 -174 -23.3 38.7YL04-06 0.002 3.26 3.28 10.36 289 159 -2.6 1.6E+10 43.3YL04-07 0.003 -3.2 -176 -23.4 41.9YL04-08 0.02 -4.1 -174 -22.4 40.8YL04-09 0.004 7.66 7.81 9.947 285 48 -2.7 5.8E+09 36.0 NBBNN032YL04-10 0.002 -2.5 66.8 Green Dragon SpringYL04-11 <0.001 -3.4 -175 -23.4 38.8YL04-12 0.01 4.48 4.48 10.363 299 635 -3.1 3.8E+09 -169 -22 39.0YL04-13 0.04 6.20 6.22 9.896 292 205 -2.6 1.9E+09 40.7YL04-14 0.01 11.57 12.13 9.871 297 20 -4.1 8.4E+09 -171 -20.7 58.0YL04-15 0.01 0.84 9.855 294 1.3 -2.3 1.4E+11 41.7YL04-17 0.001 7.25 7.32 10.458 286 101 -3.0 2.9E+09 41.5YL04-19 <0.001 7.13 7.14 10.168 345 714 -3.2 2.8E+09 -164 -21.3 43.2 GSSGNN060YL04-20 0.003 -3.2 -149 -18.8 42.4 GSSGNN060YL04-21 0.01 5.07 5.08 9.978 314 -2.9 2.9E+09 -162 -21.6 39.4 GSSGNN076YL04-22 0.03 10.02 10.40 10.073 345 4.8E+09 42.7YL05-01 0.22 6.48 6.48 10.5 335 2106 -3.8 3.4E+09 -163 -21.7 36.5 Black Pit SpringYL05-02 0.01 -4.8 29.3 GTSANN003YL05-03 <0.001 -3.8 -143 -16.3 37.1 NMCNN036YL05-04 0.01 12.14 12.15 11.4 383 2476 -3.6 3.7E+09 -163 -22 43.3 GGCGFM002YL05-05 0.01 -4.6 -166 -22.1 33.7YL05-06 <0.001 7.26 7.31 10.4 301 148 4.6E+09 -162 -20.1 29.5YL05-07 0.002 -3.7 35.2YL05-08 <0.001 -3.9 -161 -20.7 34.9 Black GrowlerYL05-09 <0.001 -3.4 -166 -21.8 36.6YL05-10 <0.001 4.71 4.71 10.1 329 1533 -3.2 3.4E+09 -164 -20.5 37.4YL05-11 <0.001 -4.1 34.0 GCPNN006 YL05-12 0.001 14.97 14.98 11.3 397 1441 -2.7 2.3E+09 47.1YL05-13 0.01 15.29 15.29 10.6 606 4354 -2.9 2.1E+09 60.0YL05-13A <0.001 -2.9 61.9YL05-14 <0.001 1.87 1.87 10.1 480 9832 -4.2 3.6E+09 -155 -20.1 34.7YL05-15 <0.001 -4.4 38.4 Narrow Gauge Spring
and TerraceYL05-17A <0.001 3.48 3.48 10.3 344 722 2.4E+09 -171 -22.2 34.5YL05-17B <0.001 35.6YL05-18A <0.001 -3.2 -164 -21.4 40.6 GGCGFM002YL05-18B <0.001 -3.2 -160 -22.2 43.1 GGCGFM002YL05-18C <0.001 -3.2 33.6 GGCGFM002YL05-18D <0.001 -3.2 -2.7 41.0 GGCGFM002YL06-01A <0.001 5.52 5.52 10.08 0.036 418 12006 * 22.5 2 -4.2 1.5E+09 -148 -15.7 33.5
Table 2. Sample collection parameters, volume % normalized gas compositions, and isotope ratios for gas collected within and around Yellowstone National Park, Wyoming during 2003 through 2012 (part 2).—Continued
Methods
11
[Gas for compositional analyses and δ13C-CO2 (C) was collected in tubes containing NaOH, gas for 3He/4He ratios and δ13C-CO2 (E) collected in empty tubes; a blank cell indicates that an analysis was not attempted]
*Values are revised from the previous version of this report.
2Carbon isotope composition is different than reported in Werner and others, 2008.
1Site is a cold gas seep; listed as a fumarole for simplicity.
Sample number
HClmol%
R/Ra Rc/Ra
Ne2022 Ne2122 Ar3836 Ar4036 F4He HeNe_Air 4He/40Ar* δ13C-CO2 (C)per mil
δ13C-CO2 (E)per mil
δ13C-CH4per mil
δ34S-H2Sper mil
* CO2_3He δDs
per milδ18Os
per milN2/Ar YNP Thermal
Features DatabaseYL06-02 0.002 6.73 6.73 9.925 0.029 367 1961 * 11.5 2 -3.8 1.8E+09 38.5YL06-03 <0.001 2 -4.0 31.0 SCANN196YL06-04 0.001 5.10 5.10 10.117 0.036 466 12634 * 23.9 2 -3.9 1.6E+09 -159 -18.6 25.1YL06-05 0.01 2 -3.7 40.4YL06-06 <0.001 5.67 5.69 10.129 0.031 369 5002 * 21.7 2 -4.3 2.6E+09 33.4YL06-07 0.01 4.63 4.71 10.556 0.03 287 48 2 -4.2 4.9E+09 -158 -17.5 78.5YL06-08 0.01 2 -4.0 38.7YL06-09 <0.001 -3.7 -159 -21.2 36.2 Black Pit SpringYL06-10 <0.001 39.0YL06-11 <0.001 7.43 7.43 10.019 0.027 315 1321 * 11.2 -3.5 4.4E+09 -168 -21.4 38.8 Guardian GeyserYL06-12 <0.001 -4.1 38.6YL07-01 <0.001 -2.8 41.1YL07-02 <0.001 15.28 15.29 10.346 0.0308 0.22 531 2457 3543 1.7 -2.7 2.2E+09 65.7YL07-03 <0.001 16.48 16.49 10.473 0.0305 0.183 593 2803 3924 1.6 -2.8 2.2E+09 66.2YL07-04 <0.001 4.91 4.91 10.044 0.0298 0.199 332 504 1495 2.3 -3.4 1.5E+10 202.0 WHSNN014YL07-05 <0.001 4.78 4.78 9.768 0.03 0.208 403 2497 3767 3.9 -5.0 1.8E+10 47.8YL07-06 <0.001 2.95 2.95 9.873 0.0296 0.217 298 138 438 4.6E+09 37.2YL07-09 <0.001 -3.5 42.1 Guardian GeyserYL07-10 0.003 8.76 8.79 9.916 0.029 0.199 303 166 285 -3.1 2.6E+09 39.4 Steam Valve SpringYL07-11 <0.001 -2.9 39.5YL07-12 <0.001 -4.3 39.6YL07-13 <0.001 -2.9 64.5YL07-14 <0.001 6.06 6.07 9.904 0.03 0.224 308 120 308 1.6 -3.2 2.0E+09 38.4 FumaroleYL07-15 <0.001 12.19 12.22 10.09 0.031 0.183 311 222 377 2.3 -3.4 3.9E+09 44.4 GGCGNN073YL07-17 <0.001 10.37 10.37 10.11 0.0302 0.2 351 801 1354 2.4 -2.9 2.6E+09 52.1YL07-18.1 0.01 -1.4 82.5YL07-18.2 0.01 83.3YL08-02 <0.001 0.76 0.76 9.912 0.0292 0.196 325 1328 4525 7.4 -3.6 -45.5 3.6E+09 -148 -19.8 37.0 BSRNN033YL08-03 0.002 0.2 -37.9 37.7YL08-04 0.01 4.35 4.73 9.97 0.0291 0.186 294 8.5 10 -3.4 -43.6 2.2E+10 39.6YL08-04B 0.003 -3.0 -43.5 41.5YL08-05 0.003 0.4 -38.7 45.1YL08-07B 0.01 0.81 0.80 9.958 0.192 296 96 266 -13.3 1.1E+09 43.7YL08-08 0.03 -28.3 -164 -21.7 33.8YL08-09 <0.001 11.65 11.65 10.007 0.0345 0.191 309 796 2560 -3.0 -2.9 -23.9 2.9E+09 45.2YL08-10 <0.001 11.93 11.93 10.044 0.0302 0.195 332 726 1641 3.3 -4.1 -2.9 -24.3 3.3E+09 44.8YL08-11 0.002 12.17 12.19 9.921 0.0306 0.194 317 350 563 2.7 -2.4 -2.3 -33.6 2.4E+09 -161 -23.5 42.6 Ochre SpringYL08-12 <0.001 7.71 7.74 9.848 0.0296 0.198 303 160 218 -3.3 -3.2 -44.4 1.8E+09 52.8 Poison SpringYL08-13 <0.001 -4.5 -4.3 75.2 APTNN011YL08-14 <0.001 16.28 16.28 10.443 0.0323 0.192 351 1470 4584 4.4 -2.5 -2.4 -23.4 1.9E+09 64.9 MVNN003YL08-14B <0.001 -2.5 -23.5 63.4 MVNN003YL08-15 <0.001 -2.4 -2.4 -24.6 54.9 Obsidian PoolYL08-16 <0.001 7.28 7.30 10.04 0.03 0.192 302 240 516 1.6 -4.1 2.4E+09 -162 -19.8 34.1YL08-17 0.002 -2.8 -31.8 40.5 Steam Valve SpringYL08-18 <0.001 3.03 3.03 10.086 0.0351 0.232 736 8447 21636 3.2 -3.0 -42.8 2.3E+09 34.8YL08-19 <0.001 2.98 2.99 10.235 0.0379 0.19 307 501 308 7.1 -2.9 -46.4 2.1E+09 35.2YL08-20 <0.001 -3.0 -43.3 29.6YL09-01 <0.001 6.05 6.30 9.858 321 78 21 0.5 2.9E+09 -165 -21.9 35.0YL09-02 <0.001 7.58 8.10 9.84 318 58 14 0.43 -1.7 7.7E+09 36.5YL09-03A <0.001 4.53 4.55 9.752 414 1029 158 1.45 -2.7 -28.2 3.0E+09 -152 -20.2 42.4YL09-03B 0.01 -2.8 -28 42.4YL09-04 <0.001 5.60 5.65 9.977 425 1070 95 1.37 -3.4 -25.4 2.5E+09 39.8 NMCNN036YL09-05 0.17 1.20 1.21 9.888 314 124 32 1.13 -4.7 -44.2 1.2E+10 30.5YL09-06 <0.001 1.14 1.14 9.811 347 525 122 1.68 -3.4 -44.1 4.2E+09 29.3YL09-07B 0.01 -4.4 -2.4 64.0YL09-08 0.40 1.09 1.09 9.869 335 348 78 1.47 -43.2 8.2E+08 33.7 HLRNN018YL09-09 0.18 1.81 1.81 9.817 323 415 123 2.55 -3.0 -1.4 -40.5 1.8E+09 -167 -23.9 37.2YL09-10 <0.001 2.67 2.70 9.795 316 267 75 2.19 -2.0 -1.6 -36.8 1.9E+09 -155 -21.8 35.2YL09-11 <0.001 2.91 2.94 9.812 331 227 59 1.08 -36.5 1.7E+09 36.9YL09-12 <0.001 -43.2 37.5 HLRNN018YL09-13 0.23 7.18 8.82 10.173 347 31 5 0.1 -3.3 2.0E+09 -163 -22 32.0YL09-14 <0.001 -2.9 37.5YL09-15 <0.001 -4.0 29.5 GTSANN003YL09-16 0.01 4.00 4.02 10.135 600 2560 121 1.4 -3.0 -32.4 4.3E+09 -158 -19 37.1YL09-17 <0.001 4.19 4.23 10.409 625 3108 78 1.57 -3.0 -32.5 4.0E+09 37.8YL09-18 0.002 2.40 2.41 9.784 374 1136 255 2.4 -3.0 -37.3 2.6E+09 39.9
Table 2. Sample collection parameters, volume % normalized gas compositions, and isotope ratios for gas collected within and around Yellowstone National Park, Wyoming during 2003 through 2012 (part 2).—Continued[gas for compositional analyses and δ13C-CO2 (C) was collected in tubes containing NaOH, gas for 3He/4He ratios and δ13C-CO2 (E) collected in empty tubes; a blank cell indicates that an analysis was not attempted]
12
Gas and Isotope Chemistry of Therm
al Features in Yellowstone N
ational Park, Wyom
ing
*Values are revised from the previous version of this report.
2Carbon isotope composition is different than reported in Werner and others, 2008.
1Site is a cold gas seep; listed as a fumarole for simplicity.

Sample number
HClmol%
R/Ra Rc/Ra
Ne2022 Ne2122 Ar3836 Ar4036 F4He HeNe_Air 4He/40Ar* δ13C-CO2 (C)per mil
δ13C-CO2 (E)per mil
δ13C-CH4per mil
δ34S-H2Sper mil
* CO2_3He δDs
per milδ18Os
per milN2/Ar YNP Thermal
Features DatabaseVHZDB11-01 3.61 6.19YL11-02 0.11 7.60 7.64 9.858 0.0290 0.1896 300 76 197 -2.3 -28.0 2.3E+09 -186 -25.4 34.6YL11-03 0.004 15.96 15.97 10.430 0.0358 0.1804 600 2401 5146 1.3 -2.9 -2.3 -21.2 2.2E+09 -161 -21.0 64.9YL11-04 0.19 7.10 7.13 9.891 0.1845 306 309 240 5.1 3.2E+09 -164 -19.4 35.0YL11-05 0.02 -3.1 -27.3 37.3YL11-06 0.005 12.26 0.1797 373 844 1.8 -3.0 -2.8 -- 5.8E+09 -167 -22.0 44.8YL11-07 0.08 4.20 4.21 9.876 0.0290 0.1850 301 106 352 -3.8 -2.3 -27.5 5.2E+09 -155 -19.9 37.1YL11-11 0.02 7.49 7.56 9.899 0.0291 0.1891 297 58 104 -2.2 -1.7 -32.9 2.1E+09 45.9 SBSGNN009YL11-13 0.05 7.91 7.94 9.822 0.0290 0.1853 299 91 222 -2.8 -2.2 -27.0 2.1E+09 -158 -20.9 37.7YL11-14 0.04 3.18 3.19 9.826 0.0290 0.1836 301 76 231 -3.4 -2.2 -25.8 6.9E+09 -162 -21.3 37.5YL11-15_1 0.03 7.58 7.60 9.843 0.0266 0.1896 297 136 381 -3.0 -2.4 -27.5 2.9E+09 -164 -21.4 45.4YL11-15_2 0.03 -2.9 -27.2 42.4YL11-16 0.11 8.59 8.60 9.893 0.0290 0.1898 299 386 1008 4.0E+09 -177 -24.2 32.5YL11-17_1 0.01 8.92 8.99 9.859 0.0290 0.1919 300 46 121 -3.9 1.0E+09 36.5YL11-17_2 0.01 -3.8 36.5YL11-18 0.03 8.60 8.89 9.852 0.0290 -5.1 1.8E+09 66.2 SCGNN006 YL11-19 0.02 8.66 8.72 9.868 0.0290 0.1888 297 60 131 -2.5 -2.3 -29.0 1.5E+09 36.3 SMMGNN014YL11-27 0.01 9.858 0.0290 -2.6 -2.0 -32.2 39.3YL11-31 <0.001 -2.9 -23.0 37.9YL12-01 <0.001 5.14 5.15 10.380 0.0302 0.1993 324 660 1 3.8 -3.2 -27.4 3.4E+09 48.1YL12-02 <0.001 4.75 4.76 9.748 0.0301 0.1880 308 373 1 4.9 -5.7 -37.8 1.7E+09 41.6YL12-03 <0.001 192.9 37.3YL12-04 <0.001 -2.9 -28.4 41.0YL12-05 <0.001 -4.6 40.3YL12-06 16.43 16.43 -2.3YL12-07 <0.001 12.31 12.31 10.060 0.0312 0.1945 372 1378 5 3.0 -2.9 -2.6 2.9E+09 -161 -21 45.5YL12-09 <0.001 8.45 8.59 10.160 0.0306 0.1962 293 114 0.06 -3.3 -2.7 -23.6 1.7E+09 -193 -27 67.4YL12-10 <0.001 8.47 8.55 10.350 0.0297 0.1943 295 113 0.10 -2.6 1.3E+09 -169 -21.8 55.4YL12-11 <0.001 7.62 8.73 9.753 0.0292 0.2022 296 7 0.01 -2.7 2.4E+09 -159 -20.1 81.1YL12-14 <0.001 8.03 8.22 10.430 0.0301 0.2009 287 95 0.04 -2.7 1.3E+09 -177 -24.4 72.5YL12-15 <0.001 5.17 5.65 9.800 0.0290 0.1952 287 21 0.01 -2.7 1.3E+09 -172 -22.7 80.3YL12-19 <0.001 -3.1 -2.8 -24.8 -162 -20.9 40.5YL12-20 <0.001 -3.1 -25.2 39.1YL12-21 <0.001 -3.2 40.0YL12-22 <0.001 -2.9 -2.8 -163 -22.7 48.8YL12-24 1.5 7.48 7.48 9.942 0.0295 0.2007 304 319 1.00 -2.5 -37.2 1.3E+09 -147 -18.3 46.6YL12-25 0.12 6.97 6.98 9.798 0.0302 0.1881 308 316 0.74 4.1 -2.7 1.1E+09 -151 -18.5 30.3
*Values are revised from the previous version of this report.
2Carbon isotope composition is different than reported in Werner and others, 2008.
1Site is a cold gas seep; listed as a fumarole for simplicity.
Table 2. Sample collection parameters, volume % normalized gas compositions, and isotope ratios for gas collected within and around Yellowstone National Park, Wyoming during 2003 through 2012 (part 2).—Continued[Gas for compositional analyses and δ13C-CO2 (C) was collected in tubes containing NaOH, gas for 3He/4He ratios and δ13C-CO2 (E) collected in empty tubes; a blank cell indicates that an analysis was not attempted]
Methods
13
14 Gas and Isotope Chemistry of Thermal Features in Yellowstone National Park, Wyoming
typically pools have higher Xg because the steam condenses as it bubbles through the water). The value for a gas-free sample would approach
zero. Our expected accuracy is 10 percent relative; that is, an Xg of 10 should be between 9 and 11 mol percent gas.
CO2: Mole percent carbon dioxide relative to all other gases (H2O-free). One-sigma uncertainty is 0.2 mol percent (absolute) based on replicate analysis of individual samples. Uncertainty based solely on counting statistics is less than 0.1 mol percent.
H2S: Mole percent hydrogen sulfide relative to all other gases (H2O-free). In samples from 2003 through 2006, sulfate concentrations were not corrected (for the blank), and samples with very low H2S from those years may have slightly higher reported values than their actual concentrations. One-sigma uncertainty is ~5 percent relative, based on replicate analysis of individual samples.
NH3: Mole percent ammonia relative to all other gases (H2O-free). One-sigma uncertainty is 10 percent relative based on replicate analysis of individual samples.
He: Mole percent helium relative to all other gases (H2O-free). One-sigma uncertainty based on replicate analysis of samples is ~1 percent relative.
H2: Mole percent hydrogen relative to all other gases (H2O-free). One-sigma uncertainty based on replicate analysis of samples is ~1 percent relative.
Ar: Mole percent argon relative to all other gases (H2O-free). One-sigma uncertainty based on replicate analysis of samples is ~1 percent relative.
O2: Mole percent oxygen relative to all other gases (H2O-free). Most samples had very little O2. For samples with low O2 contents, the one-sigma uncertainty is 50 percent relative, based on replicate analysis of individual samples. Most variability is from small amounts of air entrained during sampling. Samples with more than 0.1 mol percent O2 have much lower uncertainty, and their values should be accurate to within 5 percent relative.
N2: Mole percent nitrogen relative to all other gases (H2O-free). One-sigma uncertainty based on replicate analysis of samples is ~2 percent relative. As with O2, most variation is due to small variations in entrained air.
CH4: Mole percent methane relative to all other gases (H2O-free). One-sigma uncertainty based on replicate analysis of samples is ~1 percent relative.
C2H6: Mole percent ethane relative to all other gases (H2O-free). One-sigma uncertainty based on replicate analysis of samples is ~15 percent relative.
HCl: Mole percent hydrogen chloride relative to all other gases (H2O-free). In reality, nearly all Cl- in the gas sample is not from HCl-bearing gas, but comes from small droplets of Cl--bearing thermal
water that enter into the gas stream at bubbling pools and frying pans. Samples with high apparent HCl may also have anomalous H2S by the same process. The one-sigma analytical uncertainty is 5 percent relative, but the random appearance of Cl- (through entrainment of thermal water) within replicate samples implies that reproducibility is low.
R/Ra: 3He/4He ratio of sample divided by that in air (1.399x10⁻⁶). One-sigma analytical error is 0.01.
Rc/Ra: 3He/4He ratio of sample divided by that in air (1.399x10⁻⁶) and corrected for any air that may have been mixed into the sample.
Ne2022: 20Ne/22Ne ratio in the gas. One-sigma analytical error is 0.003.
Ne2122: 21Ne/22Ne ratio in the gas. One-sigma analytical error is 0.0001.
Ar3836: 38Ar/36Ar ratio in the gas. One-sigma analytical error is 0.004.
Ar4036: 40Ar/36Ar ratio in the gas. The air ratio is 298.6. One sigma uncertainty is 2.
F4He: 4He/36Ar in sample divided by the same ratio in air.HeNe_Air: The He/Ne ratio in the sample divided by
the same ratio in air.4He/40Ar*: Counts of 4He divided by the calculated
radiogenic 40Ar (that is, subtracting that 40Ar calculated as derived from air). This value approximates the decay ratio of U, Th, and other elements that produce He daughter products compared with those that produce Ar (that is, K).
d13C-CO2: The 13C/12C ratio in CO2, as normalized by the same ratio in the standard Vienna PeeDee Belemnite (VPDB). Units in per mil. d13Csample = {(13C/12C sample) / (13C/12C standard) – 1} x 1000. Two-sigma uncertainty is 0.2 per mil.
d13C-CH4: The 13C/12C ratio in CH4, as normalized by the same ratio in the standard Vienna PeeDee Belemnite (VPDB). Units in per mil. d13Csample = {(13C/12C sample) / (13C/12C standard) – 1} x 1000. Two-sigma uncertainty is 0.2 per mil.
d34S-H2S: The 34S/32S ratio in H2S, as normalized by the 34S/32S ratio in the standard Canyon Diablo Troilite (CDT). Units in per mil. d34Ssample = {(34S/32S sample) / (34S/32S standard) – 1} x 1000. One sigma uncertainty is 0.1 per mil.
CO2_3He: The molar ratio of CO2 to 3He in the gas sample. The propagated one-sigma uncertainty is 5 percent relative.
dDs: The ratio of D/H in steam condensed from the gas sample. Steam was condensed to liquid water in select fumarole and frying pan samples. The value is normalized to the D/H ratio in the standard Vienna Standard Mean Ocean Water (VSMOW). Units are reported in per mil (‰). dDsample = {(D/H sample) / (D/H standard) – 1} x 1000. Analytical uncertainty of 1.0 per mil (2003-8) and 0.3 permil (2009), respectively.

Results 15
d18Os: The ratio of 18O/16O in steam condensed from the gas sample. Steam was condensed to liquid water in select fumarole and frying pan samples. The value is normalized to the 18O/16O ratio in the standard Vienna Standard Mean Ocean Water (VSMOW). Units are reported in per mil (‰). d18Osample = {(18O/16O sample) / (18O/16O standard) – 1} x 1,000. Analytical uncertainty is 0.1 per mil.
N2/Ar: The N2/Ar ratio in the sample. For comparison, the air ratio is 83.6. The ratio in air-equilibrated meteoric water at 10°C is 37.7 (Wilhelm and others, 1977). Propagated one-sigma uncertainty is 1.4 percent relative.
YNP Thermal Features Database: The name of our sampled feature in the Yellowstone National Park Thermal Features Database (http://www.rcn.montana.edu/Features/Search.aspx).We only provide the name if our thermal featureis believed to be precisely the same as that shownin the thermal features database.
Data Formats and Uncertainties: Table 3 Water Analyses
Below we outline the data columns in table 3 and information relevant for interpretation of values and their related uncertainties.
Sample: Alpha-numeric codes begin with YL and are followed by a two-digit year code (03 for 2003, for example), a hyphen, and a sample number for that year, finishing with a W (for water).
Location: Informal name for the sampled feature. The name could be a defined thermal feature or could indicate simply that it was sampled in the same general location. When we sampled an actual thermal feature denoted in the Yellowstone Thermal Features database (http://www.rcn.montana.edu/Features/Search.aspx), we list the name of thatfeature in the “YNP Thermal Features Database”column.
Identical Feature: If the water sample comes from the same feature that was sampled for gas (with the same sample name excepting the “W”), then the answer is YES. If the water sample comes from a nearby feature, the answer is NO. For example, the fumarole sampled as YL07-04 is from a steaming area near Inkpot Spring, whereas YL07-04W came from Inkpot Spring itself. In addition, two water samples were collected from areas where gas was not sampled.
Date: In month/day/year format (mm/dd/yyyy).Temp: Temperature in degrees Celsius. Temperature
can be reproducibly measured to within 0.1°C, but accuracy may be limited to ~0.5°C because of temperature variability within the feature and instrumental variations.
Easting: East-west location in Universal Transverse Mercator (UTM) coordinate system, Zone 12. Datum is NAD83 (nearly identical to WGS84). Units are in meters. Uncertainties are generally ~3 m.
Northing: North-south location in Universal Transverse Mercator (UTM) coordinates, Zone 12. Datum is NAD83 (nearly identical to WGS84). Units are in meters. Uncertainties are generally ~3 m.
dDw: The ratio of D/H in the sampled thermal water. The value is normalized to the D/H ratio in the standard Vienna Standard Mean Ocean Water (VSMOW). Units are reported in per mil (‰). dDsample = {(D/H sample) / (D/H standard) – 1} x 1,000. Analytical uncertainty of 1.0 per mil (2003-8) and 0.3 per mil (2009), respectively.
d18Ow: The ratio of 18O/16O in the sampled thermal water. The value is normalized to the 18O/16O ratio in the standard Vienna Standard Mean Ocean Water (VSMOW). Units in per mil (‰). d18Osample = {(18O/16O sample) / (18O/16O standard) – 1} x 1,000. Analytical uncertainty of 0.1 per mil.
pH (F): pH as measured in the field. For hot spring waters, we used paper indicator strips with an uncertainty of about 0.5. For cold spring waters pH was measured using a calibrated meter with an uncertainty of about 0.1.
pH (L): pH as measured in the laboratory using a calibrated meter with an uncertainty of about 0.1.
Cond. µS/cm: Specific conductance as measured in the laboratory using a calibrated meter.
Cations: Al, B, Br, Ca, Fe, K, Mg, Na, NH4+, and SiO2 in mg/l. As, Ba, Cd, Co, Cr, Cs, Cu, Li, Mn, Mo, Ni, Sr, Ti, U, and Zn in µg/l.
Anions: Br, Cl-, CO32-, F, HCO3
-, PO43-, and SO4
2- in mg/l. TDS: Total dissolved solids in mg/l.Cation: Cation totals in meq/l.Anion: Anion totals in meq/l.Balance: percentage mismatch between anions and
cations.
Results
Bulk Gas Chemistry
Nearly all samples were dominated by CO2 (table 2), most with more than 90 mol percent on a dry-gas basis (excluding water from steam). Exceptions were a few samples high in atmospheric gases either from air contamination during sampling or from boiling of meteoric water (usually samples with low Xg). The next most abundant gas was N2, averaging 3.1 mol percent and with a median of 1.0 percent, followed by H2S (average of 1.3 mol percent, median of 0.9 percent) (table 4). Gas from a slow-bubbling pool near the Snake River, south of the park (fig. 1) had a very anomalous N2 content in excess of 44 mol percent.

Table 3. Water chemistry, stable isotope values, and sample collection parameters for waters collected within and around Yellowstone Park, Wyoming during 2003 through 2012 (part 1). [Analyte concentrations are reported in mg/l or mg/l. Stable isotope values of water are reported in per mil relative to SMOW (δD and δ18O). A blank cell indicates that an analysis was not attempted. Field pH values (pH F) in bold were determined using a meter, and others were determined using indicator paper. Laboratory pH values (pH L) were determined using a meter.]
16
Gas and Isotope Chemistry of Therm
al Features in Yellowstone N
ational Park, Wyom
ing
Sample number
Location Feature Identical Feature
Date Temp°C
Eastingmeters
Northingmeters
δDwper mil
δ18Owper mil
pH (F)
pH (L)
Cond.µS/cm
Almg/l
Asµg/l
Bmg/l
Baµg/l
Brmg/l
Camg/l
Cdµg/l
Clmg/l
Coµg/l
CO3mg/l
Crµg/l
YL03-01W Lone_Star hot spring pool No 09/04/2003 94.0 515429 4918413 -145 -15.7 8.0 0.50 1460 4.9 5.09 1.32 1.6 434YL03-08W Dishwater pool with gas Yes 09/06/2003 89.4 523384 4952086 -132 -9.1 3.1 1.58 2400 9.3 32.5 1.96 6.1 655YL03-09W Beryl_Spring hot spring pool No 09/07/2003 93.6 520077 4947298 -145 -14.6 6.6 0.35 2700 7.2 1.68 1.58 4.0 559YL03-11W Black_Pit pool with gas Yes 09/07/2003 93.9 523595 4952211 -119 -9.6 6.6 0.18 16 1.7 20.9 0.07 2.2 41.8YL03-13W Nymph_Lake_new_feature fry Yes 09/08/2003 93.6 521471 4955495 -144 -15.2 8.1 0.38 3620 6.4 12.5 1.37 3.7 443YL03-14W Terrace_Springs pool with gas Yes 09/08/2003 63.3 512184 4944102 -156 -18.6 6.5 0.03 190 1.0 5.27 0.16 20 65.4YL03-15W W._Nymph_Lake_Thermal_Area1 hot spring pool Yes 09/09/2003 82.0 520335 4954609 -118 -6.7 ( 1 ) 6.8 3.1 0.58 107 <0.01 9.6 1.3YL03-21W Smokejumper4 pool with gas Yes 09/12/2003 92.1 503559 4918096 -137 -15.6 5.3 0.72 <0.26 <0.04 6.24 <0.01 0.4 1.1YL04-06W Bison_Kill pool with gas Yes 09/14/2004 8.5 523471 4954042 -102 -12.4 6.6 0.03 7.3 90.9 0.50 28 370YL04-09W Back_Basin2 pool with gas Yes 09/15/2004 67.4 522963 4952193 -128 -10.7 2 3.1 1.30 8.6 29.1 1.90 5.8 605YL04-13W Hundred_Springs_Plain pool with gas Yes 09/15/2004 89.1 523113 4953330 -147 -15.6 6.4 0.12 8.3 81.4 1.90 2.1 617YL04-16W Y. River Spring near Tower hot spring flowing No 09/16/2004 31.6 548920 4971425 -152 -17.4 5.5 0.10 13.0 59.3 0.32 120 104YL04-AW Nymph_Lake_new_feature fry No 05/24/2004 61.0 521471 4955495 -136 -14.3 5.5 0.14 6.4 20.3 1.30 4.1 4486YL05-11W Chocolate_Pots hot spring flowing Yes 09/16/2005 52.5 520496 4950780 -148 -19.1 5.0 8.47 686 0.16 37 0.5 53.1 0.07 20 0.030 32.5 <0.1 <0.3YL05-02W Terrace_Springs pool with gas Yes 09/13/2005 62.3 512184 4944102 -150 -18.9 6.5 8.40 1402 0.04 176 1.0 12.2 0.13 19 0.350 64.8 <0.1 0.5YL05-03W Frying_Pan_Spring fry Yes 09/15/2005 91.8 521979 4955476 -113 -8.9 3 1.5 2.02 4810 26 9.0 0.09 75.6 0.10 7.9 2.65 0.30 3.4 8.8YL05-10W Nymph_Lake_new_feature fry Yes 09/16/2005 93.5 521456 4955507 -135 -15.0 7.0 8.06 1823 0.08 3090 6.5 29.0 1.50 4.2 0.090 478 <0.1 <0.3YL05-15W Narrow_Gauge hot spring flowing Yes 09/19/2005 74.8 522880 4979593 -149 -18.3 7.0 7.51 2580 0.03 501 3.4 77.6 0.40 330 <0.02 162 <0.1 <0.3YL05-17W Quagmire hot spring flowing Yes 09/21/2005 93.4 515413 4934949 -142 -16.4 8.5 9.34 1563 0.20 1340 4.3 7.22 1.00 1.5 0.360 343 <0.1 <0.3YL07-04W Behind_Inkpot hot spring flowing No 09/13/2007 92.0 545104 4956992 -120 -8.1 5.0 3800 0.25 0.2 22.0 52.8 <0.01 44 0.20YL07-10W Steamvalve pool with gas Yes 09/15/2007 68.8 523494 4952561 3.5 2.20 0.6 5.0 26.3 0.80 2.4 <3 249 <0.4 <3YL07-16W Beryl_Spring hot spring pool No 09/17/2007 88.9 520077 4947298 6.0 0.25 2.4 8.9 19.4 1.70 5.3 <3 575 <0.4 <3YL08-03W Potts_Basin1 pool with gas Yes 09/17/2008 68.8 533421 4919761 -124 -8.9 6.0 0.02 947 1.7 1.59 0.34 0.29 4.52 140 4.5 2.9YL08-07W Snake_River_HS hot spring flowing Yes 09/18/2008 81.4 527133 4887672 -140 -18.4 6.0 <0.01 525 1.7 349 0.40 56 2.34 150 <0.001 1.0YL08-12W Poison_Spring pool with gas Yes 09/20/2008 39.3 522453 4979039 -146 -18.0 6.0 0.01 560 3.6 62.7 0.38 315 2.31 160 <0.001 4.3YL08-15W Obsidian_Pool pool with gas Yes 09/21/2008 89.2 544530 4939794 -132 -13.9 5.0 0.77 319 6.2 38.8 0.68 8.8 1.33 250 0.45 0.9YL08-18W Brimstone1 pool with gas Yes 09/25/2008 6.6 562143 4915346 -146 -23.9 4 3.0 130 24.6 0.02 7.95 0.0005 169 0.45 0.56 0.56 135YL08-19W Brimstone2 pool with gas Yes 09/25/2008 16.3 562447 4914975 -139 -21.7 2.0 23 6.2 <0.02 8.72 0.01 53 <0.001 0.29 0.77 44YL08-20W Brimstone3 pool with gas Yes 09/25/2008 ~13 562134 4915341 -140 -22.3 5 1.5 69 8.6 0.01 12.4 0.0005 96 <0.001 2.00 0.65 140YL09-05W Heart_Middle pool with gas Yes 09/11/2009 85.8 538455 4905116 7.7 8.02 1822 0.34 1230 3.9 <5 0.88 0.9 5.80 300 <5 2.1 <25YL09-18W Pelican_Creek_Trail pool with gas Yes 09/16/2009 6.7 557027 4935598 -135 -17.5 5.0 4.83 418 8.0 2.9 <0.02 51.0 0.06 30 <2 0.68 <2 <10YL11-08W Shoshone_02 fry No 09/12/2011 83.2 516451 4911476 -129 -14.7 1.6 3800 15.0 2 0.08 72 <0.08 0.96 <2 0.24 <2 0 <10YL11-09W Shoshone_13 hot spring pool No 09/12/2011 93.0 516361 4911273 -139 -16.6 2.3 1468 5.96 241 1.1 76 0.2 2.69 <5 72 <5 0 <25YL11-10W Shoshone_14 hot spring pool No 09/12/2011 86.5 516430 4911320 -136 -15.9 2.2 1638 5.10 203 0.9 72 0.16 3.75 <5 56 <5 0 <25YL11-11W Shoshone_03 pool with gas Yes 09/12/2011 86.5 516447 4911596 -141 -16.2 6.9 825 0.27 61 1.3 6 0.26 0.62 <2 90 <2 0.1 <10YL11-12W Shoshone_19 hot spring flowing No 09/13/2011 91.0 516019 4910663 -147 -17.9 7.9 1791 0.14 1212 2.7 <5 0.56 0.48 7 200 <5 4.6 <25YL11-13W Shoshone_04 (nr) fry No 09/13/2011 86.5 516142 4911145 -117 -9.9 1.7 2900 9.84 <5 0.52 83 <0.1 0.47 <5 0.16 <5 0 <25YL11-15W Shoshone_11 (nr) pool No 09/13/2011 86.2 516196 4911471 -140 -15.7 7.0 1760 0.37 1225 4.4 <5 0.92 0.09 7 330 <5 0.3 <25YL11-18W Shoshone_09 pool with gas Yes 09/14/2011 76.5 515954 4910960 -142 -16.5 7.2 1815 0.12 1149 3.1 <5 0.64 0.53 6 240 <5 0.5 <25YL11-19W Shoshone_10 pool with gas Yes 09/14/2011 85.2 516121 4911400 -141 -16.4 7.0 1492 0.35 621 2.2 <5 0.44 0.60 <5 160 <5 0.3 <25YL11-20W Taurus_Spring hot spring pool No 09/13/2011 94.4 516029 4911098 -145 -17.7 8.1 1831 0.23 897 2.6 <5 0.52 0.16 <5 190 <5 11.2 <25YL11-21W Gourd_Spring hot spring pool No 09/13/2011 92.8 516070 4911320 -145 -18.1 7.9 1625 0.23 616 2.1 <5 0.4 0.58 <5 160 <5 6 <25YL11-22W Shoshone_15 hot spring pool No 09/13/2011 93.3 516113 4911366 -145 -18.2 7.8 1636 0.14 597 2.1 <5 0.4 0.61 <5 150 <5 8.4 <25YL11-23W Shoshone_20 lake No 09/13/2011 17.0 520051 4912754 -131 -16.8 7.7 88.4 0.02 25 0.10 2 0.02 2.84 <1 7.6 <1 0 <5YL11-28W Coral_Spring hot spring pool No 09/15/2011 80.7 515779 4911112 -144 -17.1 8.3 1517 0.27 773 2.5 <5 0.52 0.50 <5 190 <5 19.1 <25YL11-29W Shoshone_08 hot spring pool No 09/15/2011 88.0 515863 4911232 -144 -17.3 7.4 1560 4.21 769 2.3 <6 0.44 3.15 8 170 <6 1 <6YL11-30W Shoshone_18 creek No 09/14/2011 13.3 516000 4912504 -143 -18.9 7.2 21.5 <0.01 1 <0.01 9 <0.01 1.10 <1 0.34 <1 0 <5YL11-SCD Shoshone_16 creek No 09/14/2011 20.0 516066 4910752 -143 -18.7 7.9 240 0.04 80 0.34 2 0.07 2.19 <1 26 <1 0 <5YL11-SCU Shoshone_17 creek No 09/14/2011 13.6 515831 4912474 -144 -19.0 7.0 101.7 0.03 15 0.12 2 0.03 2.65 <1 9.7 <1 0 <5YL12-06 W Helen's Cool Pool pool with gas Yes 07/25/2012 23.2 545673 4941001 -150 -19.5 5.6 611 0.1 45 0.31 96 <0.01 44.1 <2 16 <2 0 8YL12-08 W Monument Frying Pan fry No 09/06/2012 90.7 519507 4947902 -122 -12.4 1.7 3230 69.3 39 0.35 67 <0.2 3.1 <5 0.4 <5 0 9YL12-12 W Pool Highland Basin hot spring pool No 09/09/2012 77.7 530483 4939260 -127 -11.5 1.6 3410 2.23 369 <0.03 76 <0.2 0.3 5 0.2 <3 0 <3YL12-13 W Muddy Pool Highland Basin hot spring pool No 09/09/2012 89.1 530491 4939253 -120 -9.2 1.8 2790 72.5 871 <0.05 93 <0.2 1.8 11 0.0 <5 0 96YL12-16 W Nez Perce Creek creek No 09/11/2012 13.7 523264 4937794 -146 -18.7 8.1 509 0.02 10 0.84 6 0.16 8.2 <2 60.0 <2 0.0 <2YL12-17 W Spruce Creek creek No 09/11/2012 21.5 523240 4937756 -146 -19.3 7.8 287 0.23 15 0.31 2 0.05 7.8 <1 20 <1 0 <1YL12-19 W Nymph_Lake_new_feature fry Yes 09/13/2012 85.8 521452 4955523 -129 -10.7 1.7 5040 114 81 0.41 42 <0.5 6.7 <5 0.5 <5 0 51YL12-21W Obsidian Creek Pool water pool with gas Yes 09/13/2012 68.8 520644 4959557 -139 -14.4 6.1 1180 114 1672 4.8 35 0.76 11.4 17 260 <3.5 0 <3.5YL12-23 W Ebro Hot Spring hot spring flowing No 09/14/2012 57.9 552358 4937398 -140 -14.6 2.6 932 14.4 260 1.4 28 <0.04 4.3 4 14.0 <3 0 10YL12-25 W Sulfur Hills Fumarole #2 water fry Yes 09/14/2012 83.2 554027 4938193 -111 -8.8 1.9 3300 65.8 61 14.0 56 <0.2 1.5 <5 25.0 <5 0 51
1pH for YL03-15 not measured and charge balance optimized by assuming a pH = 2.0. 4YL08-18 charge balance optimized by assuming a pH of 2.1.
2YL04-09 charge balance optimized by assuming a pH of 2.5. 5YL08-20 charge balance optimized by assuming a pH of 1.75.
3YL05-03 charge balance optimized by assuming a pH of 1.82. 6YL05-11 likely lost CO2 to degassing.
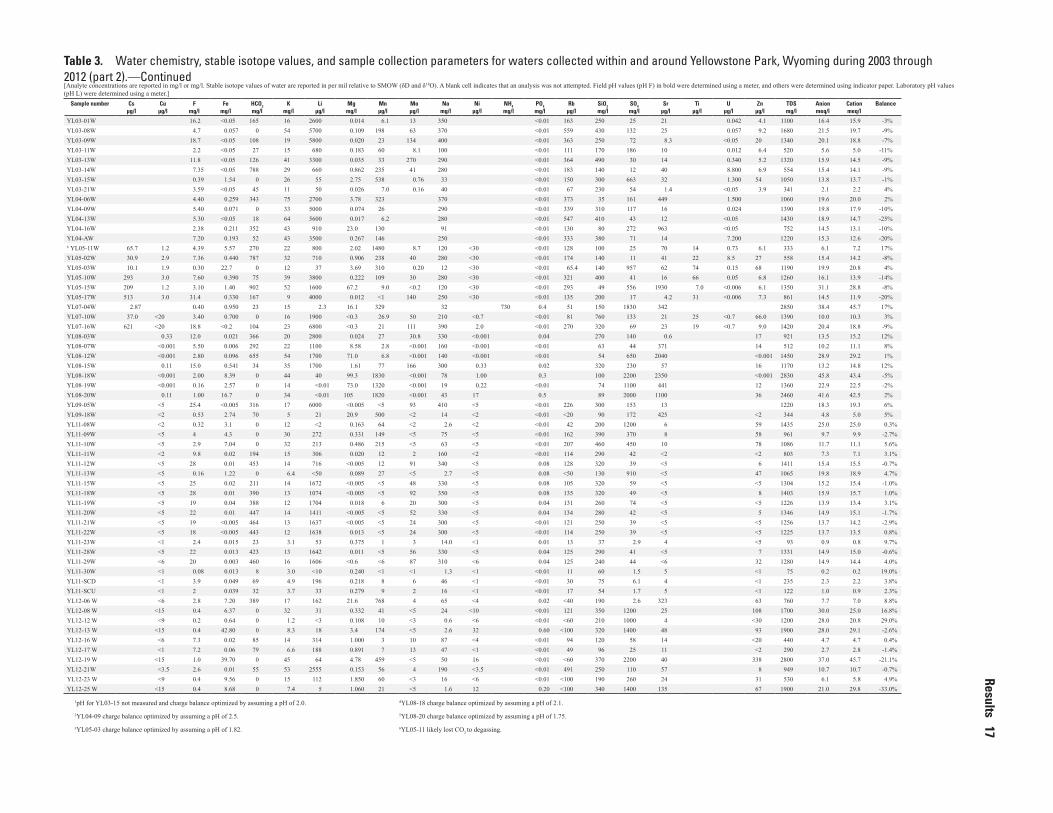
Sample number Csµg/l
Cuµg/l
Fmg/l
Femg/l
HCO3
mg/lK
mg/lLi
µg/lMg
mg/lMnµg/l
Moµg/l
Namg/l
Niµg/l
NH4
mg/lPO4
mg/lRb
µg/lSiO2
mg/lSO4
mg/lSr
µg/lTi
µg/lU
µg/lZn
µg/lTDSmg/l
Anionmeq/l
Cationmeq/l
Balance
YL03-01W 16.2 <0.05 165 16 2600 0.014 6.1 13 350 <0.01 163 250 25 21 0.042 4.1 1100 16.4 15.9 -3%YL03-08W 4.7 0.057 0 54 5700 0.109 198 63 370 <0.01 559 430 132 25 0.057 9.2 1680 21.5 19.7 -9%YL03-09W 18.7 <0.05 108 19 5800 0.020 23 134 400 <0.01 363 250 72 8.3 <0.05 20 1340 20.1 18.8 -7%YL03-11W 2.2 <0.05 27 15 680 0.183 60 8.1 100 <0.01 111 170 186 10 0.012 6.4 520 5.6 5.0 -11%YL03-13W 11.8 <0.05 126 41 3300 0.035 33 270 290 <0.01 364 490 30 14 0.340 5.2 1320 15.9 14.5 -9%YL03-14W 7.35 <0.05 788 29 660 0.862 235 41 280 <0.01 183 140 12 40 8.800 6.9 554 15.4 14.1 -9%YL03-15W 0.39 1.54 0 26 55 2.75 538 0.76 33 <0.01 150 300 663 32 1.300 54 1050 13.8 13.7 -1%YL03-21W 3.59 <0.05 45 11 50 0.026 7.0 0.16 40 <0.01 67 230 54 1.4 <0.05 3.9 341 2.1 2.2 4%YL04-06W 4.40 0.259 343 75 2700 3.78 323 370 <0.01 373 35 161 449 1.500 1060 19.6 20.0 2%YL04-09W 5.40 0.071 0 33 5000 0.074 26 290 <0.01 339 310 117 16 0.024 1390 19.8 17.9 -10%YL04-13W 5.30 <0.05 18 64 5600 0.017 6.2 280 <0.01 547 410 43 12 <0.05 1430 18.9 14.7 -25%YL04-16W 2.38 0.211 352 43 910 23.0 130 91 <0.01 130 80 272 963 <0.05 752 14.5 13.1 -10%YL04-AW 7.20 0.193 52 43 3500 0.267 146 250 <0.01 333 380 71 14 7.200 1220 15.3 12.6 -20%6 YL05-11W 65.7 1.2 4.39 5.57 270 22 800 2.02 1480 8.7 120 <30 <0.01 128 100 25 70 14 0.73 6.1 333 6.1 7.2 17%YL05-02W 30.9 2.9 7.36 0.440 787 32 710 0.906 238 40 280 <30 <0.01 174 140 11 41 22 8.5 27 558 15.4 14.2 -8%YL05-03W 10.1 1.9 0.30 22.7 0 12 37 3.69 310 0.20 12 <30 <0.01 65.4 140 957 62 74 0.15 68 1190 19.9 20.8 4%YL05-10W 293 3.0 7.60 0.390 75 39 3800 0.222 109 30 280 <30 <0.01 321 400 41 16 66 0.05 6.8 1260 16.1 13.9 -14%YL05-15W 209 1.2 3.10 1.40 902 52 1600 67.2 9.0 <0.2 120 <30 <0.01 293 49 556 1930 7.0 <0.006 6.1 1350 31.1 28.8 -8%YL05-17W 513 3.0 31.4 0.330 167 9 4000 0.012 <1 140 250 <30 <0.01 135 200 17 4.2 31 <0.006 7.3 861 14.5 11.9 -20%YL07-04W 2.87 0.40 0.950 23 15 2.3 16.1 329 32 730 0.4 51 150 1830 342 2850 38.4 45.7 17%YL07-10W 37.0 <20 3.40 0.700 0 16 1900 <0.3 26.9 50 210 <0.7 <0.01 81 760 133 21 25 <0.7 66.0 1390 10.0 10.3 3%YL07-16W 621 <20 18.8 <0.2 104 23 6800 <0.3 21 111 390 2.0 <0.01 270 320 69 23 19 <0.7 9.0 1420 20.4 18.8 -9%YL08-03W 0.33 12.0 0.021 366 20 2800 0.024 27 30.8 330 <0.001 0.04 270 140 0.6 17 921 13.5 15.2 12%YL08-07W <0.001 5.50 0.006 292 22 1100 8.58 2.8 <0.001 160 <0.001 <0.01 63 44 371 14 512 10.2 11.1 8%YL08-12W <0.001 2.80 0.096 655 54 1700 71.0 6.8 <0.001 140 <0.001 <0.01 54 650 2040 <0.001 1450 28.9 29.2 1%YL08-15W 0.11 15.0 0.541 34 35 1700 1.61 77 166 300 0.33 0.02 320 230 57 16 1170 13.2 14.8 12%YL08-18W <0.001 2.00 8.39 0 44 40 99.3 1830 <0.001 78 1.00 0.3 100 2200 2350 <0.001 2830 45.8 43.4 -5%YL08-19W <0.001 0.16 2.57 0 14 <0.01 73.0 1320 <0.001 19 0.22 <0.01 74 1100 441 12 1360 22.9 22.5 -2%YL08-20W 0.11 1.00 16.7 0 34 <0.01 105 1820 <0.001 43 17 0.5 89 2000 1100 36 2460 41.6 42.5 2%YL09-05W <5 25.4 <0.005 316 17 6000 <0.005 <5 93 410 <5 <0.01 226 300 153 13 1220 18.3 19.3 6%YL09-18W <2 0.53 2.74 70 5 21 20.9 500 <2 14 <2 <0.01 <20 90 172 425 <2 344 4.8 5.0 5%YL11-08W <2 0.32 3.1 0 12 <2 0.163 64 <2 2.6 <2 <0.01 42 200 1200 6 59 1435 25.0 25.0 0.3%YL11-09W <5 4 4.3 0 30 272 0.331 149 <5 75 <5 <0.01 162 390 370 8 58 961 9.7 9.9 -2.7%YL11-10W <5 2.9 7.04 0 32 213 0.486 215 <5 63 <5 <0.01 207 460 450 10 78 1086 11.7 11.1 5.6%YL11-11W <2 9.8 0.02 194 15 306 0.020 12 2 160 <2 <0.01 114 290 42 <2 <2 803 7.3 7.1 3.1%YL11-12W <5 28 0.01 453 14 716 <0.005 12 91 340 <5 0.08 128 320 39 <5 6 1411 15.4 15.5 -0.7%YL11-13W <5 0.16 1.22 0 6.4 <50 0.089 27 <5 2.7 <5 0.08 <50 130 910 <5 47 1065 19.8 18.9 4.7%YL11-15W <5 25 0.02 211 14 1672 <0.005 <5 48 330 <5 0.08 105 320 59 <5 <5 1304 15.2 15.4 -1.0%YL11-18W <5 28 0.01 390 13 1074 <0.005 <5 92 350 <5 0.08 135 320 49 <5 8 1403 15.9 15.7 1.0%YL11-19W <5 19 0.04 388 12 1704 0.018 6 20 300 <5 0.04 131 260 74 <5 <5 1226 13.9 13.4 3.1%YL11-20W <5 22 0.01 447 14 1411 <0.005 <5 52 330 <5 0.04 134 280 42 <5 5 1346 14.9 15.1 -1.7%YL11-21W <5 19 <0.005 464 13 1637 <0.005 <5 24 300 <5 <0.01 121 250 39 <5 <5 1256 13.7 14.2 -2.9%YL11-22W <5 18 <0.005 443 12 1638 0.013 <5 24 300 <5 <0.01 114 250 39 <5 <5 1225 13.7 13.5 0.8%YL11-23W <1 2.4 0.015 23 3.1 53 0.375 1 3 14.0 <1 0.01 13 37 2.9 4 <5 93 0.9 0.8 9.7%YL11-28W <5 22 0.013 423 13 1642 0.011 <5 56 330 <5 0.04 125 290 41 <5 7 1331 14.9 15.0 -0.6%YL11-29W <6 20 0.003 460 16 1606 <0.6 <6 87 310 <6 0.04 125 240 44 <6 32 1280 14.9 14.4 4.0%YL11-30W <1 0.08 0.013 8 3.0 <10 0.240 <1 <1 1.3 <1 <0.01 11 60 1.5 5 <1 75 0.2 0.2 19.0%YL11-SCD <1 3.9 0.049 69 4.9 196 0.218 8 6 46 <1 <0.01 30 75 6.1 4 <1 235 2.3 2.2 3.8%YL11-SCU <1 2 0.039 32 3.7 33 0.279 9 2 16 <1 <0.01 17 54 1.7 5 <1 122 1.0 0.9 2.3%YL12-06 W <6 2.8 7.20 389 17 162 21.6 768 4 65 <4 0.02 <40 190 2.6 323 63 760 7.7 7.0 8.8%YL12-08 W <15 0.4 6.37 0 32 31 0.332 41 <5 24 <10 <0.01 121 350 1200 25 108 1700 30.0 25.0 16.8%YL12-12 W <9 0.2 0.64 0 1.2 <3 0.108 10 <3 0.6 <6 <0.01 <60 210 1000 4 <30 1200 28.0 20.8 29.0%YL12-13 W <15 0.4 42.80 0 8.3 18 3.4 174 <5 2.6 32 0.60 <100 320 1400 48 93 1900 28.0 29.1 -2.6%YL12-16 W <6 7.3 0.02 85 14 314 1.000 3 10 87 <4 <0.01 94 120 58 14 <20 440 4.7 4.7 0.4%YL12-17 W <1 7.2 0.06 79 6.6 188 0.891 7 13 47 <1 <0.01 49 96 25 11 <2 290 2.7 2.8 -1.4%YL12-19 W <15 1.0 39.70 0 45 64 4.78 459 <5 50 16 <0.01 <60 370 2200 40 338 2800 37.0 45.7 -21.1%YL12-21W <3.5 2.6 0.01 55 53 2555 0.153 56 4 190 <3.5 <0.01 491 250 110 57 8 949 10.7 10.7 -0.7%YL12-23 W <9 0.4 9.56 0 15 112 1.850 60 <3 16 <6 <0.01 <100 190 260 24 31 530 6.1 5.8 4.9%YL12-25 W <15 0.4 8.68 0 7.4 5 1.060 21 <5 1.6 12 0.20 <100 340 1400 135 67 1900 21.0 29.8 -33.0%
Table 3. Water chemistry, stable isotope values, and sample collection parameters for waters collected within and around Yellowstone Park, Wyoming during 2003 through 2012 (part 2).—Continued [Analyte concentrations are reported in mg/l or mg/l. Stable isotope values of water are reported in per mil relative to SMOW (δD and δ18O). A blank cell indicates that an analysis was not attempted. Field pH values (pH F) in bold were determined using a meter, and others were determined using indicator paper. Laboratory pH values (pH L) were determined using a meter.]
Results
17
1pH for YL03-15 not measured and charge balance optimized by assuming a pH of 2.0. 4YL08-18 charge balance optimized by assuming a pH of 2.1.
2YL04-09 charge balance optimized by assuming a pH of 2.5. 5YL08-20 charge balance optimized by assuming a pH of 1.75.
3YL05-03 charge balance optimized by assuming a pH of 1.82. 6YL05-11 likely lost CO2 to degassing.

18 Gas and Isotope Chemistry of Thermal Features in Yellowstone National Park, Wyoming
Units Minimum Maximum Average 1 sigma Median No. Samples
Xg (%) 0.050 150 25 38 2.1 116CO2 mol % 50.1 99.8 92.1 9.5 95.0 117H2S mol % 0.0020 30.18 2.51 4.33 1.1 117NH3 mol % 0.0002 1.17 0.10 0.26 0.0 114He mol % 0.00003 0.0547 0.0059 0.0073 0.0040 117H2 mol % 0.00003 8.67 0.80 1.65 0.18 117Ar mol % 0.0010 1.02 0.08 0.13 0.0 117O2 mol % 0.0002 6.68 0.26 0.97 0.0 117N2 mol % 0.10 44.7 3.7 6.8 1.6 117CH4 mol % 0.0003 8.18 0.58 0.97 0.3 117C2H6 mol % 0.00002 0.0477 0.0046 0.0083 0.0016 117CO mol % 0.00002 0.0049 0.0011 0.0013 0.0004 24C3H8 mol % 0.00002 0.0051 0.0010 0.0012 0.0004 38C4H10 mol % 0.00003 0.0015 0.0004 0.0004 0.0003 36C5H12 mol % 0.0001 0.0006 0.0003 0.0002 0.0001 32HCl mol % 0.0010 1.50 0.07 0.21 0.0 116R/Ra 0.76 16.43 6.62 3.66 6.73 85Rc/Ra 0.76 16.43 6.80 3.63 6.86 84Ar40/36 281 736 344 93 308 83δ13C-CO2 per mil -13.3 0.4 -3.4 1.5 -3.2 94δ13C-CH4 per mil -46.4 -21 -33 7.7 -32.3 42N2/Ar 25.1 202 43.7 18.6 39.3 117
Table 4. Statistical synthesis of individual gas species, and radiogenic and stable isotope data for Yellowstone gas samples. [Summary data include one result per sample location; for sites with replicate analyses the data were averaged]
Within individual thermal basins, H2S tended to have higher values in samples with low Xg. Hydrogen averaged 0.5 percent but ranged as high as 6.9 percent and was particularly high at Smokejumper Hot Springs, Washburn Hot Springs, and Hot Spring Basin. Similarly, CH4 averaged 0.5 percent but reached 8.2 percent at Washburn Hot Springs. NH3 was notable in samples from Washburn Hot Springs, where concentrations exceeded 1 mol percent, and was > 0.5 percent in a few samples from the Eastern Yellowstone group. Ar values ranged from 0.001 to 1.0 percent, and N2/Ar ratios were consistent with derivation of these gases primarily from air-saturated meteoric water. All but 12 samples had ratios within the range of 30 to 50; the N2/Ar of air-saturated water at 10°C should be 37.7, compared with a value of 83.6 in air (Wilhelm and others, 1977). Samples with the highest N2 and Ar generally were those with the most entrained air. However, O2 was found in far less abundance than would be appropriate for air-saturated mete-oric water (N2/O2 = 1.84), probably reflecting reaction of O2 in groundwater or hydrothermal fluid before mixing/boiling and return to the surface in geothermal gas.
Gas to Steam Ratio (Xg)
The range of gas contents of frying pans (Xg <11 per-cent) and high-temperature fumaroles (≤14 percent) (table 2) are similar, reflecting boiling and addition of some steam from surface waters. The highest Xg values in high-temperature fumaroles were found consistently at Mud Volcano (fig. 1) and ranged from 10 to 14 percent. The lowest Xg value of any Yel-lowstone fumarole was 0.05 percent (equivalent to a steam/gas molar ratio of 2,000) in the Norris Back Basin (fig. 1).
Because steam may be lost from gas as it bubbles up through thermal springs, the Xg values of samples from pools are more variable than Xg contents of samples collected at fumaroles or frying pans (table 2). The gas/steam ratios are controlled by temperature, depth of water, and the flux of gas through the feature. Xg ratios for pool samples are generally high (table 2), and most pools with low Xg values are those with temperatures at or close to boiling. The organic-rich gas vents along the Yellowstone River near Tower Junction (Devils Den) (fig. 1) are very unusual in this dataset but are classified in table 2 as fumaroles for simplicity. The Xg contents of the three samples range from 74 to 89 percent (table 2)—these lukewarm (<30°C) gassy emanations lack the steam that is typically a significant component of true fumarole emissions.
Isotopes
Condensed fumarolic steam had δDs values varying from ~ –180 up to –140 per mil, compared with δDw values from –160 to –110 per mil for nearby hot spring waters (tables 2, 3; fig. 3). Hot spring waters in this study have δDw values similar to published values of Yellowstone cold waters (ellipse in fig. 3; Balistrieri and others, 2007; Gemery-Hill and others, 2007; Kharaka and others, 2002; Rye and Truesdell, 1993, 2007) but have slightly higher δ18O values and plot to the right of the Global Meteoric Water Line. Five cold waters from this study have δDw and δ18Ow values ranging from –146 to –102 and –24 to –12 per mil, respectively (table 3).
The δ13C values of CO2 ranged from –13.3 to 0.4 per mil, but the great majority of samples varied only from –5 to –2 (table 2, fig. 4). In fact, 104 of 110 samples fit within that rela-tively narrow range. The lowest value (by far) of
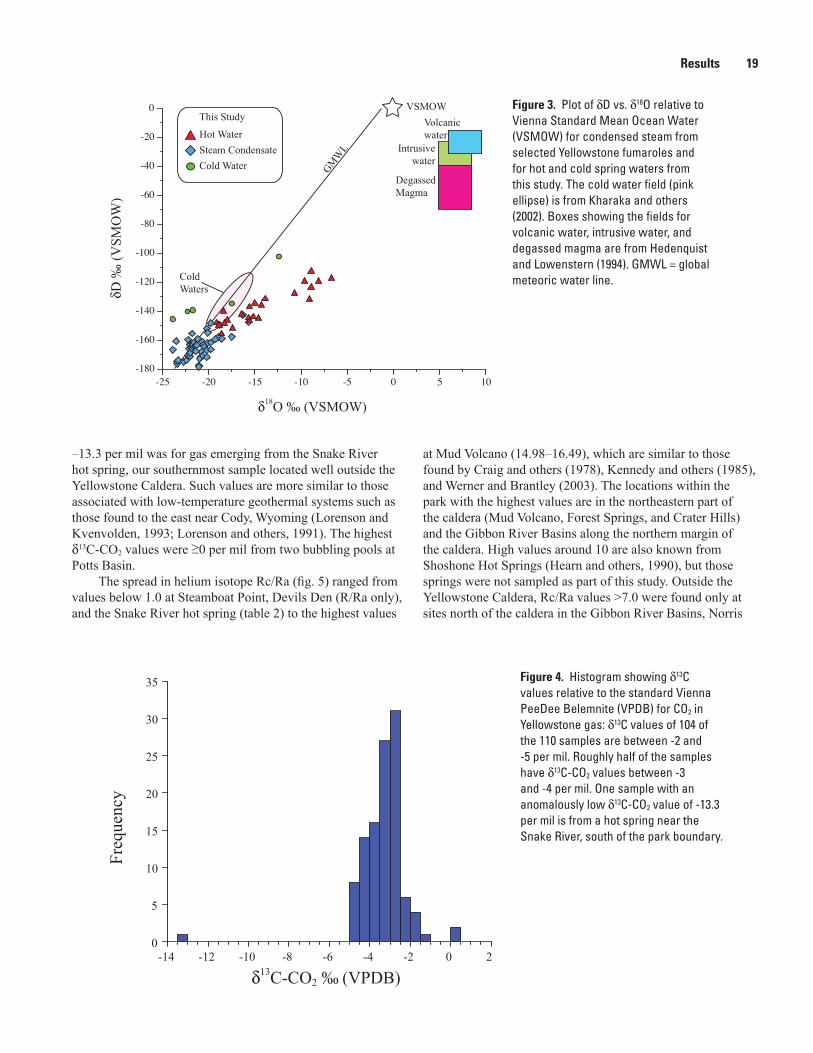
Results 19
δ18O ‰ (VSMOW)
δD ‰
(VSM
OW
)Hot Water
This Study
Steam CondensateCold Water
DegassedMagma
Intrusivewater
Volcanicwater
VSMOW
GMW
L
Cold Waters
-25 -20 -15 -10 -5 0 5 10-180
-160
-140
-120
-100
-80
-60
-40
-20
0Fr
eque
ncy
δ13C-CO2 ‰ (VPDB)
0
5
10
15
20
25
30
35
-14 -12 -10 -8 -6 -4 -2 0 2
Figure 3. Plot of dD vs. d18O relative to Vienna Standard Mean Ocean Water (VSMOW) for condensed steam from selected Yellowstone fumaroles and for hot and cold spring waters from this study. The cold water field (pink ellipse) is from Kharaka and others (2002). Boxes showing the fields for volcanic water, intrusive water, and degassed magma are from Hedenquist and Lowenstern (1994). GMWL = global meteoric water line.
Figure 4. Histogram showing d13C values relative to the standard Vienna PeeDee Belemnite (VPDB) for CO2 in Yellowstone gas: d13C values of 104 of the 110 samples are between -2 and -5 per mil. Roughly half of the samples have d13C-CO2 values between -3 and -4 per mil. One sample with an anomalously low d13C-CO2 value of -13.3 per mil is from a hot spring near the Snake River, south of the park boundary.
–13.3 per mil was for gas emerging from the Snake River hot spring, our southernmost sample located well outside the Yellowstone Caldera. Such values are more similar to those associated with low-temperature geothermal systems such as those found to the east near Cody, Wyoming (Lorenson and Kvenvolden, 1993; Lorenson and others, 1991). The highest d13C-CO2 values were ≥0 per mil from two bubbling pools at Potts Basin.
The spread in helium isotope Rc/Ra (fig. 5) ranged from values below 1.0 at Steamboat Point, Devils Den (R/Ra only), and the Snake River hot spring (table 2) to the highest values
at Mud Volcano (14.98–16.49), which are similar to those found by Craig and others (1978), Kennedy and others (1985), and Werner and Brantley (2003). The locations within the park with the highest values are in the northeastern part of the caldera (Mud Volcano, Forest Springs, and Crater Hills) and the Gibbon River Basins along the northern margin of the caldera. High values around 10 are also known from Shoshone Hot Springs (Hearn and others, 1990), but those springs were not sampled as part of this study. Outside the Yellowstone Caldera, Rc/Ra values >7.0 were found only at sites north of the caldera in the Gibbon River Basins, Norris

20 Gas and Isotope Chemistry of Thermal Features in Yellowstone National Park, Wyoming
Geyser Basin, and Mammoth Hot Springs. Not all samples in the Norris Mammoth Corridor, though, yielded high values, as the sample from Roaring Mountain was notably low (see also Kennedy and others, 1985).
DiscussionWater and Steam Isotopes (d18O and dD)
All water and steam samples are very depleted in D and 18O relative to volcanic gas and magma-derived water (Giggenbach, 1992a), consistent with a meteoric origin for the water with relatively minimal (< a few percent) influence of magmatic water (Craig and others, 1956). The hot spring waters have likely exchanged oxygen during water-rock reaction (Craig and others, 1956), which typically produces a positive shift in d18Ow with little or no change in dDw. The difference in d18O and dD values between seven steam condensates and co-sampled thermal waters (tables 2 and 3) are consistent with fractionation factors expected for boiling at temperatures between 90°C and 110°C (Friedman and O’Neil, 1977; Horita and Wesolowski, 1994). For example, using the equations from Horita and Wesolowski (1994), spring water near Lone Star Geyser, sample YL03-01W (d18OW = –15.7 and dDW = –145), would be in equilibrium at 100°C with steam having an isotopic composition of d18OW = –20.6 and dDW = –173, almost precisely the values observed in fumarolic steam condensate from YL03-01A (table 2).
Gas Chemistry
Different regions had unique gas chemistries (fig. 6). For example, parts of the Norris Geyser Basin were characterized by abundant air-derived gas (N2, Ar, O2), whereas reduced gases (CH4, H2S, H2) were high at Hot Spring Basin and high H2S was found at Roaring Mountain. Relative amounts of He, N2, and Ar in fumaroles and frying pans are such that virtually all samples plot on a single trend, oriented between air-saturated meteoric water and a He-rich end member (fig. 7). With the exception of slightly elevated N2 at Washburn Hot Springs, presumably due to breakdown of organic-rich sediments in the mid to shallow crust, there is little evidence for N2-rich sources as are common in subduction-zone volcanoes (Giggenbach, 1992b).
Systematics of CH4-Ar-He (fig. 8) illustrate that individual thermal areas have a unique character, ranging from Ar-rich (groundwater-derived) to those with diverse CH4/He ratios. In helium-rich samples the helium is usually attributed either to deep crustal sources (low Rc/Ra) or mantle sources (high Rc/Ra) (Giggenbach and others, 1993), both of which are present at Yellowstone. Methane, in contrast, is typically attributed to crustal sources (Giggenbach and others, 1993; Lowenstern and Janik, 2003) and when plotted with helium provides a simple method to help discriminate crustal and magmatic endmembers (Chiodini, 2009).
Some geographic areas—for example, Norris (group 8), the Upper Geyser Basin (group 15), and the Gibbon River Basins (group 18)—have narrowly defined CH4/He and form
Freq
uenc
y
0 2 4 6 8 10 12 14 16 180
2
4
6
8
10
12
Rc/Ra
Figure 5. Histogram showing 3He/4He Rc /Ra values for 73 gas samples collected from Yellowstone. Values range from about 0.8 to 16.5. The highest values are from the Mud Volcano area (group 14).

Discussion 21
Norris Geyser Basin (8)YL03-05
Eastern Yellowstone (11)YL06-04
Roaring Mountain (6)YL05-14
Mud Volcano (14)YL05-13
Gibbon River Basins (18)YL07-15
Smokejumper Hot Springs (12)YL03-19
H2S
H2
Ar
CH4NH3
H2SN2
H2O2
ArHe
CH4
H2S
N2
H2
Ar
NH3
CH4
He
H2S
N2
H2He
Ar
CH4
H2S
H2
NH3
CH4
N2
He
H2S
N2
H2
O2
Ar
NH3 CH4
N2
Figure 6. Pie charts demonstrate the differences among gas discharges at Yellowstone. Each section represents that part of the gas fraction after omitting H2O and CO2. Very narrow sections are extended for visibility. The Norris Geyser Basin is N2-rich, consistent with low Xg from steam produced by boiling of meteoric water. Hot Spring Basin (Eastern Yellowstone group) is comparatively rich in reduced gas species such as H2 and CH4. Beryl Spring (Gibbon River Basins group) and Roaring Mountain contain a greater proportion of H2S relative to the other gases. Numbers in parentheses above each chart correspond to the sample groups as defined in table 1.
22 Gas and Isotope Chemistry of Thermal Features in Yellowstone National Park, Wyoming
Air
ASMW(10°C)
He*1000 Ar*100
N2
Ink
10
3
86
12
5
1817
11
14
1615
12
He*100 Ar*10
CH4Sample Groups
Figure 8. Ternary diagram showing He, CH4, and Ar relations for gas collected from fumaroles and frying pans, which demonstrates that Yellowstone gases can be discriminated by their CH4/He ratios, that discrete geographic areas have unique CH4 /He ratios and that most groups form an array of mixtures of magmatic and crustal gases with those derived from boiling of meteoric waters (Ar-endmember). Numbers listed in the legend correspond to the sample groups as defined in table 1.
Figure 7. Ternary diagram showing He, N2, and Ar relations for gas collected from fumaroles and frying pans, which demonstrates that nearly all represent mixtures derived from air-saturated meteoric water with He-rich endmember(s). Squares show three samples that contain some air. Ink is a N2-rich sample from the Washburn Hot Springs group. ASMW = Air-saturated meteoric water.

Discussion 23
linear trends from the Ar apex (fig. 8). Interestingly, CH4/He ratios in some areas that are distant from one another are similar and fall along the same trends. The North of Norris samples (for example, Frying Pan Springs, Nymph Lake, and the West Nymph Lake Thermal Area, group 17) are collinear with gases from the Gibbon River Basins (group 18), ~5 km to the south, and with Mud Volcano (group 14), 25 km to the southeast. Conversely, spatial proximity does not ensure similarity in CH4/He ratios, as nearby areas have geochemically unique characteristics. CH4/He ratios for the North of Norris Geyser Basin group are distinct from Norris Geyser Basin itself (fig. 9). Of all the groups, only the Heart Lake, Lower Geyser Basin, and Eastern Yellowstone groups show substantial internal diversity in CH4 /He (fig. 8).
The geochemical distinctions that we observed clearly are not related to the type of thermal feature. Fumaroles, pools, and frying pans from the same thermal basin (for example, Norris Geyser Basin) demonstrate similar gas ratios, such as CH4 /He or CO2/H2. Moreover, water chemistry is not a key factor. At the Norris Geyser Basin, gases that issue from
neutral waters at Hundred Springs Plain have the same CH4/He ratio as gases from acid, steam-heated waters nearby at “Bison Flat,” along the Gibbon River. Yet neutral waters of the Upper Geyser Basin are distinct from those at Heart Lake or Crater Hills. Gas from acid, steam-heated terrains at Mud Volcano, Smokejumper Hot Springs, and Forest Springs display remarkable internal consistency within groups (fig. 8) but are different from each other and are each readily identifiable by their distinct gas ratios. Only the gases from the carbonate-forming waters at Mammoth Hot Springs and Terrace Springs share some similarity in having high CO2 and very low He and CH4 (table 2).
Some authors use methane-to-ethane ratios (CH4/C2H6) as the basis for gas geothermometry (Darling, 1998; Tassi and others, 2007), but the strong thermogenic character in some Yellowstone gases (Des Marais and others, 1981) can produce suspicious results. For example, subsurface temperatures calculated for Brimstone Basin (average CH4/C2H6 = 100), an area without any discernible geothermal heat flow, would exceed those of Hot Spring Basin (average CH4/C2H6 = 42),
Figure 9. Map (from Christiansen, 2001) of the area around Norris Geyser Basin, showing some of the gas-sample localities plotted as colored dots sized in proportion to the CH4 /He ratio. Norris Geyser Basin samples are red, Gibbon River Basin are blue, and North of Norris Geyser Basin are black. The CH4 /He ratios for two samples, Sylvan_Springs2 and Porcelain_Terrace1 are shown as examples. Ratios in the Norris Geyser Basin are significantly higher than in the two other areas to the north and south. Geological units are Lava Creek Tuff Unit A (Qyla), Lava Creek Tuff Unit B (Qylb), alluvium (Qs), Gibbon River rhyolite flow (Qprg), Gibbon Hill Dome (Qpoh), Solfatara Plateau flow (Qpcf), and Madison River basalt (Qmr). Orange indicates areas of hydrothermal alteration, gray indicates hot spring deposits, white indicates cemented ice-contact deposits, blue is a lake.
Qmr
Qylb
QylaQs
Qs
QpcfQprg
Qpoh
Qs
Qylb
Qylb
Qyla
Qs
4 km
Yellowstone Caldera Boundary
2.1 Ma Caldera Boundary
CH4/He=6.2
CH4/He=63

24 Gas and Isotope Chemistry of Thermal Features in Yellowstone National Park, Wyoming
seemingly one of the hottest basins at Yellowstone on the basis of other gas geothermometers and geophysical data (Werner and others, 2008). Our findings show that, while CH4/C2H6 ratios vary considerably across Yellowstone (table 2, fig. 10), they are generally constrained within individual thermal groups. These discrete trends in figure 10 show that near-surface biological activity or temperature variations exert limited control and instead imply that lithologies and redox conditions in the source region strongly control the CH4/C2H6 ratio. Although our d13C-CH4 analyses only begin in 2008, a plot of those values against C2H6/CH4 (fig. 11) indicates that the CH4 is mainly a mixture of abiotic and thermogenic end members, with the thermogenic signature strongest in features associated with exposures of the Eocene Absaroka Volcanic Supergroup rocks. Apparent trends toward the biogenic box (at Brimstone Basin, Heart Lake, and Potts Basin) may indicate either minor addition or minor removal of isotopically light CH4 due to near-surface microbial processes.
We note that H2 concentrations (also used as a geothermometer when normalized to Ar; Giggenbach and Goguel, 1989) and H2/CO2 ratios correlate with geography rather than inferred and known subsurface temperatures (White and others, 1975; Fournier, 1989), implying that different areas may have unique oxidation states rather than varying temperatures. For example, figure 7 of Fournier
(1989) shows that chloride-enthalpy relations indicate that Norris and Crater Hills waters rise from the highest temperature geothermal reservoirs. In contrast, hydrogen-argon ratios at Norris (average ratio of 17) and Crater Hills (3.4) are much lower than the hydrogen-rich (seemingly reduced) gases from Eastern Yellowstone (414), Washburn Hot Springs (1,200) and Smokejumper Hot Springs (29).
The distinct gas signatures are most likely related to the lithologies with which subsurface hydrothermal fluids have interacted. Our samples from the Eastern Yellowstone and Washburn Hot Springs groups are enriched in CH4 and have consistently high CH4/He (table 2, fig. 8). The Eastern Yellowstone samples from Hot Spring Basin and areas at the eastern edge of Yellowstone Lake emerge where Eocene Absaroka Volcanic Supergroup rocks are found. Units within these rocks are known for their abundant organic carbon and are associated with petroleum seeps such as those found at Rainbow Hot Springs (Love and Good, 1970; Clifton and others, 1990). Terrace Springs, by contrast, emerges from the north wall of the caldera, closer to sedimentary rocks of the Mesozoic/Paleozoic Gallatin Mountains than any other thermal area within the caldera. Gas from Terrace Springs has little CH4 or H2S, and instead has high concentrations of CO2. In addition, samples from Mud Volcano have low concentrations of CH4, and have very high Xg and Rc/Ra values. Lowenstern and Hurwitz
2 Washburn
11 East Yellowstone16 Heart Lake
8 Norris Geyser Basin
1 2 43 5 6 87
0.01
0.02
0.03
0.04
CH4 (mol %)
C2H
6 (m
ol %
)
Sample Groups
Figure 10. Plot showing mol percent CH4 versus mol percent C2H6 for samples from Eastern Yellowstone, Washburn Hot Springs, Norris Geyser Basin, and Heart Lake (groups 11, 2, 8, and 16, respectively). The discrete linear trends require constant but differing CH4/C2H6 ratios in each of these geographic areas.

Summary 25
(2008) concluded that parts of the Yellowstone hydrothermal systems, especially those in acid sulfate terrains such as Mud Volcano, are gas-saturated down to several kilometers depths. The low CH4 and lack of radiogenic He imply that crustal inputs have less influence on gases in this particular part of the park, potentially because magma is either shallower (Husen and others, 2004), more recently emplaced, or has a more direct connection to the surface.
SummaryWe present a dataset containing 167 gas analyses and 59
water analyses collected from thermal areas at Yellowstone from 2003 through 2012. Data are organized into 17 sampling groups plus a group containing miscellaneous samples. Our gas samples show minimal effects by mixing with air and most have N2/Ar consistent with derivation from air-saturated water. Stable isotope values (d18O and dD) of
waters agree with previous detailed studies that the thermal waters are predominantly derived from meteoric waters. d18O and dD values of condensed steam are 20 to 30 per mil lower than associated thermal waters, consistent with boiling at temperatures between 90°C and 110°C. Isotope values of carbon and helium indicate gases are derived from mixtures of a variety of crustal and magmatic sources. Individual thermal areas have distinct gas signatures that differentiate them from other thermal areas at Yellowstone. We interpret these characteristic gas signatures as indicative of mixing of diverse magmatic, crustal, and meteoric gas sources within the subsurface. Wallrocks influence gas chemistry in some areas, defining local oxidation states, gas concentrations, and gas ratios. Organic species such as CH4 and C2H6 are derived primarily from breakdown of organic-rich sediment, combined with abiogenic reaction of CO2 and H2O under geothermal conditions. Trends toward biogenic CH4 indicate that biological activity may produce a small proportion of the gas flowing from Yellowstone hot springs and fumaroles.
δ13C-CH4 ‰ (VPDB)
C2/
C1
-100 -90 -80 -70 -60 -50 -40 -30 -200.000
0.005
0.010
0.015
0.020
0.025
0.030
0.035
0.040
Thermogenic
Biogenic
Abiotic
17
11
14
1615
13
10
8
1
54
9
Sample Groups
Figure 11. Plot showing the ethane to methane ratio (C2/C1) versus the d13C value of methane (C1), as normalized by the same ratio in the standard Vienna PeeDee Belemnite (VPDB), for gas collected from fumaroles, frying pans, and pools at Yellowstone. Fields for thermogenic and biogenic after Pohlman and others (2009). Numbers listed in the legend correspond to the sample groups as defined in table 1.

26 Gas and Isotope Chemistry of Thermal Features in Yellowstone National Park, Wyoming
AcknowledgmentsNumerous individuals assisted with sampling: 2003: Lizette Christiansen, Cathy Goff, Fraser Goff,
Shaul Hurwitz, Gari Mayberry, Lisa Morgan, Andy Ouimette, Pat Shanks
2004: Cathy Goff, Fraser Goff, Shaul Hurwitz2005: Kathryn Flynn, Florian Schwandner2006: Hank Heasler, Shaul Hurwitz, Cheryl Jaworowski,
John King, Cindy Werner2007: Atosa Abedini, Stefano Caliro, Carlo Cardellini,
Giovanni Chiodini, Italo Giarretta, Luca Guglielmetti, Franco Tassi, Dario Tedesco, Cindy Werner
2008: Angie Diefenbach, Shaul Hurwitz, Alison Philips2009: Sheryl Akagi, Bob YokelsonSample analysis was performed and aided by many
individuals. Andy Ouimette analyzed gas samples in Menlo Park in 2003 and assisted in 2004. Atosa Abedini performed some of the alkalinity titrations in early years and created the KMZ and shape files in the appendix. Joel Robinson assisted with the shape files. Mark Huebner performed the analyses for Cl, F, and SO4 on waters and gases in all years. Huebner also performed the CO2 extraction from the NaOH solution in 2003 through 2006. Roland Thurston and Pam Gemery-Hill performed dD and d18O analyses in Denver. Since 2007 Kinga Revesz performed d13C analyses in Reston.
Thoughtful reviews of the manuscript of this report were provided by Shaul Hurwitz and Cynthia Werner.
References Allen, E.T., and Day, A.L., 1935, Hot springs of the
Yellowstone National Park: Washington, D.C., Carnegie Institution of Washington Publication 466, 525 p.
Balistrieri, L.S., Shanks, W.C., III, Cuhel, R.L., Aguilar, C., and Klump, J.V., 2007, The influence of sublacustrine hydrothermal vents on the geochemistry of Yellowstone Lake, in Morgan, L.A., ed., Integrated geoscience studies in the greater Yellowstone area; volcanic, hydrothermal and tectonic processes in the Yellowstone geoecosystem: U.S. Geological Survey Professional Paper 1717, p. 169-200.
Chiodini, G., 2009, CO2/CH4 ratio in fumaroles; a powerful tool to detect magma degassing episodes at quiescent volcanoes: Geophysical Research Letters, v. 36, L02302, doi:10.1029/2008GL036347.
Christiansen, R.L., 2001. The Quaternary and Pliocene Yellowstone Plateau volcanic field of Wyoming, Idaho, and Montana: U. S. Geological Survey Professional Paper 729-G, p. G1-G145.
Clifton, C.G., Walters, C.C., and Simoneit, B.R.T., 1990, Hydrothermal petroleums from Yellowstone National Park, Wyoming, U.S.A.: Applied Geochemistry, v. 5, p. 169-191.
Coleman, M.L., Shepherd, T.J., Durham, J.J., Rouse, J.E., Moore, G.R., and Gillian, R., 1982, Reduction of water with
zinc for hydrogen isotope analysis: Analytical Chemistry, v. 54, no. 6, p. 993-995.
Craig, H., 1953, The geochemistry of the stable carbon isotopes: Geochimica et Cosmochimica Acta, v. 3, p. 53-92.
Craig, H., Boato, G., and White, D.E., 1956, The isotopic geochemistry of thermal waters, in Nuclear processes in geological settings: National Research Council, Nuclear Science Series Report No. 19, p. 29-38.
Craig, H., Lupton, J.E., Welhan, J.A., and Poreda, R., 1978, Helium isotope ratios in Yellowstone and Lassen Park volcanic gases: Geophysical Research Letters, v. 5, no. 11, p. 897-900.
Darling, W.G., 1998, Geothermal hydrocarbon gases, 1. Genesis and geothermometry: Applied Geochemistry, v. 13, p. 815-824.
Des Marais, D.J., Donchin, J.H., Nehring, N.L., and Truesdell, A.H., 1981, Molecular carbon evidence for the origin of geothermal hydrocarbons: Nature, v. 292, p. 826-828.
Epstein, S., and Mayeda, T., 1953, Variation of 18O content of waters from natural sources: Geochimica et Cosmochimica Acta, v. 4, no. 5, p. 213-224.
Evans, W.C., Bergfeld, D., van Soest, M.C., Huebner, M.A., Fitzpatrick, J., and Revesz, K.M., 2006, Geochemistry of low-temperature springs northwest of Yellowstone caldera; seeking the link between seismicity, deformation, and fluid flow: Journal of Volcanology and Geothermal Research, v. 154, p. 169-180.
Fahlquist, L., and Janik, C., 1992, Procedures for collecting and analyzing gas samples from geothermal systems: U.S. Geological Survey Open-File Report 92-211, 19 p.
Fournier, R.O., 1989, Geochemistry and dynamics of the Yellowstone National Park hydrothermal system: Annual Review of Earth and Planetary Sciences, v. 17, p. 13-53.
Fournier, R.O., Kennedy, B.M., Aoki, M., and Thompson, J.M., 1994, Correlation of gold in siliceous sinters with 3He/4He in hot spring waters of Yellowstone National Park: Geochimica et Cosmochimica Acta, v. 58, p. 5401-5419.
Friedman, I., and O’Neil, J., 1977, Compilation of stable isotope fractionation factors of geochemical interest, in Fleischer, M.K., ed., Data of geochemistry (6th ed.): U.S. Geological Survey Professional Paper 440-KK, 60 p.
Fritz, P., Mozeto, A.A., and Reardon, E.J., 1985, Practical considerations on carbon isotope studies on soil carbon dioxide: Chemical Geology, v. 58, p. 89-95.
Gemery-Hill, P.A, Shanks, W.C., III, Balistrieri, L.S., and Lee, G.K., 2007, Geochemical data for selected rivers, lake waters, hydrothermal vents, and subaerial geysers in Yellowstone National Park, Wyoming and vicinity, 1996-2004, in Morgan, L.A., ed., Integrated geoscience studies in the greater Yellowstone area; volcanic, tectonic, and hydrothermal processes in the Yellowstone geoecosystem: U.S. Geological Survey Professional Paper 1717, p. 365-426.
Giggenbach, W.F., 1984, Mass transfer in hydrothermal alteration systems; a conceptual approach: Geochimica et Cosmochimica Acta, v. 48, no. 12, p. 2693-2711.

References 27
Giggenbach, W.F., 1992a, Isotopic shifts in water from geothermal and volcanic systems along convergent plate boundaries and their origin: Earth and Planetary Science Letters, v. 113, p. 495-510.
Giggenbach, W.F., 1992b, The composition of gases in geothermal and volcanic systems as a function of tectonic setting: International Symposium on Water Rock Interaction, 7th, Park City, Utah, 13 July 1992, Proceedings, p. 873-878.
Giggenbach, W.F., and Goguel, R.L., 1989, Collection and analysis of geothermal and volcanic water and gas discharges: New Zealand Department of Scientific and Industrial Research, Report No. CD2401, 81 p.
Giggenbach, W.F., and Poreda, R.J., 1993, Helium isotopic and chemical composition of gases from volcanic-hydrothermal systems in the Philippines: Geothermics, v. 22, 369-380.
Giggenbach, W.F., Sano, Y., and Wakita, H., 1993, Isotopic composition of helium and CO2 and CH4 contents in gases produced along the New Zealand part of a convergent plate boundary: Geochimica et Cosmochimica Acta, v., 57, p. 3427-3455.
Goff, F., and Janik, C.J., 2002, Gas geochemistry of the Valles caldera region, New Mexico and comparisons with gases at Yellowstone, Long Valley and other geothermal systems: Journal of Volcanology and Geothermal Research, v. 116, p. 299-323.
Gooch, F.A., and Whitfield, J.E., 1888, Analyses of waters of the Yellowstone National Park, with an account of the methods of analysis employed: U.S. Geological Survey Bulletin 47, 84 p.
Gunter, B.D., and Musgrave, B.C., 1966, Gas chromatographic measurements of hydrothermal emanations at Yellowstone National Park: Geochimica et Cosmochimica Acta, v. 30, p. 1175-1189.
Hague, A., 1911, Origin of the thermal waters in the Yellowstone National Park: Bulletin of the Geological Society of America, v. 22, p. 103-122.
Hearn, E.H., Kennedy, B.M., and Truesdell, A.H., 1990, Coupled variations in helium isotopes and fluid chemistry; Shoshone Geyser Basin, Yellowstone National Park: Geochimica et Cosmochimica Acta, v. 54, p. 3103-3113.
Hedenquist, J.W., and Lowenstern, J.B., 1994, The role of magmas in the formation of hydrothermal ore deposits: Nature, v. 370, p. 519-527.
Horita, J., and Wesolowski, D.J., 1994, Liquid-vapor fractionation of oxygen and hydrogen isotopes of water from the freezing to the critical temperature: Geochimica et Cosmochimica Acta, v. 58, p. 3425-3437.
Hurwitz, S., Lowenstern, J.B., and Heasler, H., 2007, Spatial and temporal geochemical trends in the hydrothermal system of Yellowstone National Park; inferences from river solute fluxes: Journal of Volcanology and Geothermal Research, v. 162, p. 149-171.
Hurwitz, S., Evans, W.C., and Lowenstern, J.B., 2010, River solute fluxes reflecting active hydrothermal chemical
weathering of the Yellowstone Plateau Volcanic Field, USA: Chemical Geology, v. 276, p. 331–343.
Husen, S., Smith, R.B., and Waite, G.P., 2004, Evidence for gas and magmatic sources beneath the Yellowstone volcanic field from seismic tomographic imaging: Journal of Volcanology and Geothermal Research, v. 131, no. 3-4, p. 397-410.
Jaggar, T.A., 1899, Death Gulch—a natural bear-trap: Appleton’s Popular Science Monthly, v. 54, no. 4, p. 475-481.
Jones, W.A., 1875, Report upon the reconnaissance of northwestern Wyoming, including Yellowstone National Park, made in the summer of 1873: Washington, D.C., Government Printing Office, House of Representatives, 43rd Congress, Executive Document 285, 331 p.
Kennedy, B.M., Lynch, M.A., Reynolds, J.H., and Smith, S.P., 1985, Intensive sampling of noble gases in fluids at Yellowstone, I. Early overview of the data; regional patterns: Geochimica et Cosmochimica Acta, v. 49, p. 1251-1261.
Kennedy, B.M., Reynolds, J.H., and Smith, S.P., 1987, Helium isotopes; Lower Geyser Basin, Yellowstone National Park: Journal of Geophysical Research, v. 92, p. 12477-12489.
Kharaka, Y.K., Thordsen, J.J., and White, L.D., 2002, Isotope and chemical compositions of meteoric and thermal waters and snow from the greater Yellowstone National Park Region: U.S. Geological Survey Open-File Report 02-194, 75 p.
Kiyosu, Y., and Krouse, H.R., 1989, Carbon isotope effect during abiogenic oxidation of methane: Earth and Planetary Science Letters, v. 95, p. 302-306.
Lorenson, T.D., and Kvenvolden, K.A., 1993, A comparison of hydrocarbon gases from natural sources in the Northwestern United States, in Howell, D.G., and others, eds., The future of energy gases: U.S. Geological Survey Professional Paper 1570, p. 453-470.
Lorenson, T.D., Kvenvolden, K.A., Simoneit, B.R., and Leif, R.N., 1991, Composition of gas seeps in northwestern Wyoming: U.S. Geological Survey Open File Report 91-121, 35 p.
Love, J.D., and Good, J.M., 1970, Hydrocarbons in thermal areas, northwestern Wyoming: U.S. Geological Survey Professional Paper 644-B, p. B1-B23.
Lowenstern, J.B., and Hurwitz, S., 2008, Monitoring a supervolcano in repose; heat and volatile flux at the Yellowstone Caldera: Elements, v. 4, no. 1, p. 35-40.
Lowenstern, J.B., and Janik, C.J., 2003, The origins of reservoir liquids and vapors from The Geysers geothermal field, California (USA), in Simmons, S.F., and Graham, I., eds., Volcanic, geothermal and ore-forming fluids; rulers and witnesses of processes within the Earth: Society of Economic Geologists Special Publication 10, p. 181-195.
Mazor, E., and Fournier, R.O., 1973, More on noble gases in Yellowstone National Park hot waters: Geochimica et Cosmochimica Acta, v. 37, p. 515-525.
Mazor, E., and Wasserburg, G.J., 1965, Helium, neon, argon,
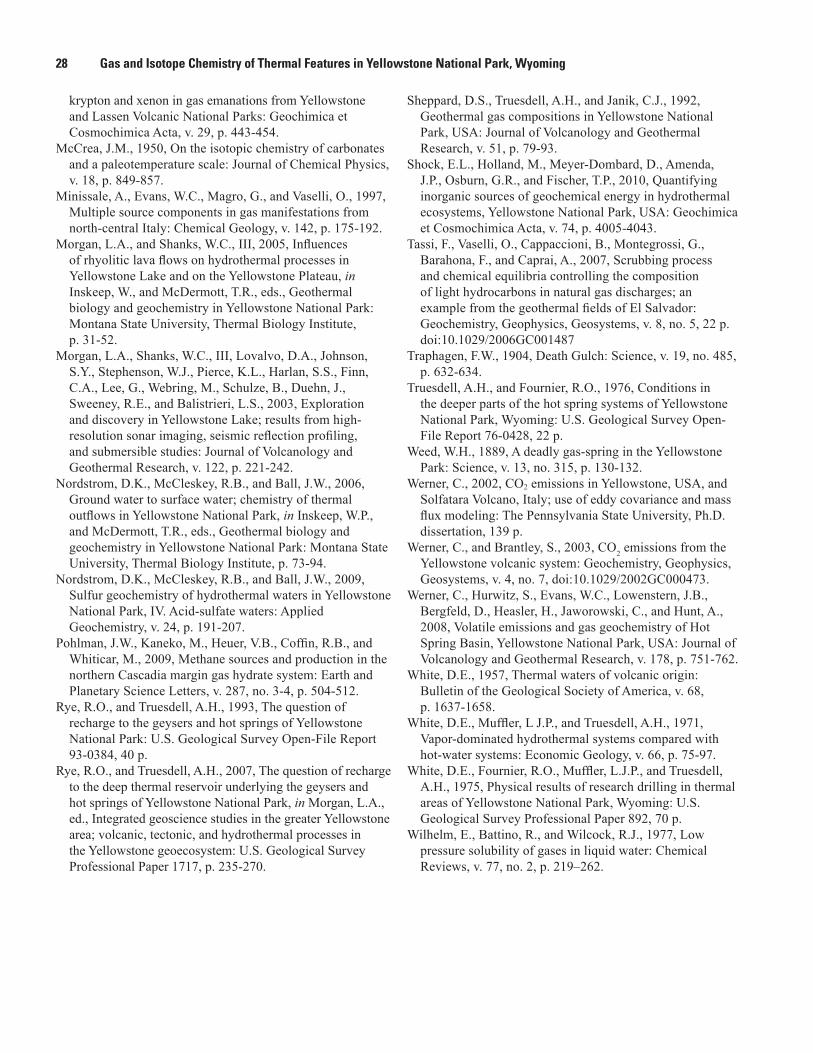
28 Gas and Isotope Chemistry of Thermal Features in Yellowstone National Park, Wyoming
krypton and xenon in gas emanations from Yellowstone and Lassen Volcanic National Parks: Geochimica et Cosmochimica Acta, v. 29, p. 443-454.
McCrea, J.M., 1950, On the isotopic chemistry of carbonates and a paleotemperature scale: Journal of Chemical Physics, v. 18, p. 849-857.
Minissale, A., Evans, W.C., Magro, G., and Vaselli, O., 1997, Multiple source components in gas manifestations from north-central Italy: Chemical Geology, v. 142, p. 175-192.
Morgan, L.A., and Shanks, W.C., III, 2005, Influences of rhyolitic lava flows on hydrothermal processes in Yellowstone Lake and on the Yellowstone Plateau, in Inskeep, W., and McDermott, T.R., eds., Geothermal biology and geochemistry in Yellowstone National Park: Montana State University, Thermal Biology Institute, p. 31-52.
Morgan, L.A., Shanks, W.C., III, Lovalvo, D.A., Johnson, S.Y., Stephenson, W.J., Pierce, K.L., Harlan, S.S., Finn, C.A., Lee, G., Webring, M., Schulze, B., Duehn, J., Sweeney, R.E., and Balistrieri, L.S., 2003, Exploration and discovery in Yellowstone Lake; results from high-resolution sonar imaging, seismic reflection profiling, and submersible studies: Journal of Volcanology and Geothermal Research, v. 122, p. 221-242.
Nordstrom, D.K., McCleskey, R.B., and Ball, J.W., 2006, Ground water to surface water; chemistry of thermal outflows in Yellowstone National Park, in Inskeep, W.P., and McDermott, T.R., eds., Geothermal biology and geochemistry in Yellowstone National Park: Montana State University, Thermal Biology Institute, p. 73-94.
Nordstrom, D.K., McCleskey, R.B., and Ball, J.W., 2009, Sulfur geochemistry of hydrothermal waters in Yellowstone National Park, IV. Acid-sulfate waters: Applied Geochemistry, v. 24, p. 191-207.
Pohlman, J.W., Kaneko, M., Heuer, V.B., Coffin, R.B., and Whiticar, M., 2009, Methane sources and production in the northern Cascadia margin gas hydrate system: Earth and Planetary Science Letters, v. 287, no. 3-4, p. 504-512.
Rye, R.O., and Truesdell, A.H., 1993, The question of recharge to the geysers and hot springs of Yellowstone National Park: U.S. Geological Survey Open-File Report 93-0384, 40 p.
Rye, R.O., and Truesdell, A.H., 2007, The question of recharge to the deep thermal reservoir underlying the geysers and hot springs of Yellowstone National Park, in Morgan, L.A., ed., Integrated geoscience studies in the greater Yellowstone area; volcanic, tectonic, and hydrothermal processes in the Yellowstone geoecosystem: U.S. Geological Survey Professional Paper 1717, p. 235-270.
Sheppard, D.S., Truesdell, A.H., and Janik, C.J., 1992, Geothermal gas compositions in Yellowstone National Park, USA: Journal of Volcanology and Geothermal Research, v. 51, p. 79-93.
Shock, E.L., Holland, M., Meyer-Dombard, D., Amenda, J.P., Osburn, G.R., and Fischer, T.P., 2010, Quantifying inorganic sources of geochemical energy in hydrothermal ecosystems, Yellowstone National Park, USA: Geochimica et Cosmochimica Acta, v. 74, p. 4005-4043.
Tassi, F., Vaselli, O., Cappaccioni, B., Montegrossi, G., Barahona, F., and Caprai, A., 2007, Scrubbing process and chemical equilibria controlling the composition of light hydrocarbons in natural gas discharges; an example from the geothermal fields of El Salvador: Geochemistry, Geophysics, Geosystems, v. 8, no. 5, 22 p. doi:10.1029/2006GC001487
Traphagen, F.W., 1904, Death Gulch: Science, v. 19, no. 485, p. 632-634.
Truesdell, A.H., and Fournier, R.O., 1976, Conditions in the deeper parts of the hot spring systems of Yellowstone National Park, Wyoming: U.S. Geological Survey Open-File Report 76-0428, 22 p.
Weed, W.H., 1889, A deadly gas-spring in the Yellowstone Park: Science, v. 13, no. 315, p. 130-132.
Werner, C., 2002, CO2 emissions in Yellowstone, USA, and Solfatara Volcano, Italy; use of eddy covariance and mass flux modeling: The Pennsylvania State University, Ph.D. dissertation, 139 p.
Werner, C., and Brantley, S., 2003, CO2 emissions from the
Yellowstone volcanic system: Geochemistry, Geophysics, Geosystems, v. 4, no. 7, doi:10.1029/2002GC000473.
Werner, C., Hurwitz, S., Evans, W.C., Lowenstern, J.B., Bergfeld, D., Heasler, H., Jaworowski, C., and Hunt, A., 2008, Volatile emissions and gas geochemistry of Hot Spring Basin, Yellowstone National Park, USA: Journal of Volcanology and Geothermal Research, v. 178, p. 751-762.
White, D.E., 1957, Thermal waters of volcanic origin: Bulletin of the Geological Society of America, v. 68, p. 1637-1658.
White, D.E., Muffler, L J.P., and Truesdell, A.H., 1971, Vapor-dominated hydrothermal systems compared with hot-water systems: Economic Geology, v. 66, p. 75-97.
White, D.E., Fournier, R.O., Muffler, L.J.P., and Truesdell, A.H., 1975, Physical results of research drilling in thermal areas of Yellowstone National Park, Wyoming: U.S. Geological Survey Professional Paper 892, 70 p.
Wilhelm, E., Battino, R., and Wilcock, R.J., 1977, Low pressure solubility of gases in liquid water: Chemical Reviews, v. 77, no. 2, p. 219–262.

Produced in Menlo Park, CaliforniaManuscript approved for publication, December 16, 2010Text edited by Peter H. StaufferLayout and design by Stephen L. Scott

Bergfeld and others—G
as and Isotope Chemistry of Therm
al Features in Yellowstone N
ational Park, Wyom
ing—Scientific Investigations Report 2011-5012, ver. 1.1