
Intercultural Business Communication Instructor: Hsin-Hsin Cindy Lee, PhD.

Publishing Date: January 2017
Publisher:Global Young AcademyEmil Abderhalden Straße 3706108 Halle (Saale)Germany
Authors: Geffers, J., Beaudry, C., Yang, H.-C., Huang, F., Phanraksa, O., Dominik, M., Lin, Y.-C., Huang, M. -C. , Komai, S., Lorimer, K., Piyawattanametha, W., Saengchantr, P., Saleh, H., Tagg, B., and Veerakumarasivam, A.
Design & Layout: Florian Wiencek / florianwiencek.com
Graphics: Hsin-Chou YangTitle Image: Florian Wiencek / florianwiencek.com
ISBN: 978-3-8047-3709-9
Media Contact:[email protected]+49 (0)345 47293-170
www.globalyoungacademy.net
© Global Young Academy 2017
The Global Young Academy gratefully acknowledges funding by the Federal Ministry of Education and Research in Germany,and the National Science, Technology and InnovationPolicy Office in Thailand.

Global State of Young Scientists (GloSYS) in ASEAN – Creativity and Innovation of Young Scientists in ASEAN
Johannes Geffers, Catherine Beaudry, Hsin-Chou Yang, Futao Huang, Orakanoke Phanraksa, Martin Dominik, Yin-Chun Lin, Mei-Chou Huang,
Shoji Komai, Karen Lorimer, Wibool Piyawattanametha, Pattranooj Saengchantr, Hasnawati Saleh, Brendon Tagg
& Abhimanyu Veerakumarasivam
2017
Final Report to the National Science, Technology and Innovation Policy Office (STI)
and the German Federal Ministry of Education and Research (BMBF)
January 2017

4
General Introduction ........................................................................................................................ 9
Co-Chairs’ Foreword ......................................................................................................................................... 9
GloSYS Working Group Preface .............................................................................................................. 10
Contribution and acknowledgements .................................................................................................... 11
Executive Summary ........................................................................................................................................ 12
1. Introduction to GloSYS ASEAN Regional Study ............................ 16
2. International Trends of Higher Education and Developments in Asia ..................................................................................................... 17
2.1. Massive Growth and Differentiation .......................................................................................... 17
2.2. Globalization, Internationalization, and Regionalization ..................................................... 19
2.3. Marketization, New Governance, and Relevance ................................................................ 23
2.4. Gender Inequality ................................................................................................................................. 26
2.5. Summary and Implications for Analysis ................................................................................... 28
3. Study Design .............................................................................................................................. 30
3.1. Overview .................................................................................................................................................. 30
3.2. Terms and Concepts ........................................................................................................................ 30
3.2.1. GloSYS Definition of Young Scientist or Scholar ................................................... 30
3.2.2. Concepts .................................................................................................................................. 30
3.3. Methodology ........................................................................................................................................... 31
3.3.1. Integration of Different Types of Data ........................................................................ 31
3.3.2. Indicator based Description of Countries and their Higher Education
and R&D System .................................................................................................................. 32
3.3.3. Online Questionnaire .......................................................................................................... 33
3.3.4. Semi-structured in-depth Interviews ........................................................................... 34
3.4. Sample Demographics ...................................................................................................................... 35
3.4.1. Demographics of Participants from Online-questionnaire ............................... 35
3.4.2. Characteristics of Participants from Interviews ................................................... 40
Content

5
4. Findings ............................................................................................................................................ 42
4.1. Countries Participating in the Comparative Study .............................................................. 42
4.1.1. Indicators on Country Characteristics and Economy ......................................... 42
4.1.2. Indicators on Higher Education and Research & Development .................... 45
4.2. Findings from Online-Questionnaire ........................................................................................... 53
4.2.1. Career and Work Environment ..................................................................................... 54
4.2.2. Internationalization and Mobility ................................................................................... 63
4.2.3. Funding, Productivity, and Creativity and Innovation ............................................ 68
4.2.4. Discrimination and Unfair Treatment ........................................................................ 73
4.3. Human Resource Development .................................................................................................. 73
4.3.1. Career and Work Environment ..................................................................................... 73
4.3.2. Internationalization and Mobility ................................................................................... 80
4.3.3. Productivity, and Creativity and Innovation .............................................................. 82
4.3.4. Discrimination and Unfair Treatment ........................................................................ 84
4.4. Integration of Findings ...................................................................................................................... 86
3.5. Limitations to the Analysis due to Sample Characteristics ............................................ 40
5. Recommendations .............................................................................................................. 90
References ................................................................................................................................................ 92
The Global Young Academy .................................................................................................. 97

6
Table 1: Academics engaging in international activities 2007-2008 (in %)........................................................ 20
Table 2: Academics engaging in international activities by broad disciplinary fields 2007-2008 (in %) .......... 21
Table 3: Academics’ international mobility by type of experience (in %) ............................................................. 22
Table 4: International research activities at an individual level in selected Asian countries (in %) .................. 22
Table 5: Obtaining doctoral degree in country of current employment (in %) ..................................................... 23
Table 6: Interview participant overview (List) ........................................................................................................ 39
Table 7: Interview participant characteristics by selection criteria ...................................................................... 40
Index of Tables
Figure 1: Gross enrolment ratio, tertiary education, both sexes (in %) – different world regions ..................... 18
Figure 2: Gross enrolment ratio, tertiary education, both sexes (in %) – selected Asian countries ................. 18
Figure 3: Female researchers in different world regions (in %) ........................................................................... 26
Figure 4: Female researchers in selected Asian countries (in %) ...................................................................... 27
Figure 5: Female academic staff in EU-27 and selected countries, Grade A and total, 2010 (in %) ................ 27
Figure 6: Participants by field of research (PhD) .................................................................................................. 36
Figure 7: Participants by sector of employment of main job ............................................................................... 36
Figure 8: Participants of questionnaire by country and field of research (PhD) ................................................. 37
Figure 9: Proportion of participants of questionnaire by country and sector of employment (in %)................. 37
Figure 10: Participants of questionnaire by country and sector of employment (Higher education and research organizations) ........................................................................................................................ 38
Figure 11: Participants of questionnaire by country and gender ........................................................................ 38
Figure 12: Country size (in square kilometres) ..................................................................................................... 42
Figure 13: Population ............................................................................................................................................. 43
Figure 14: GDP per capita (in US$) ....................................................................................................................... 43
Figure 15: Employment in agriculture, industry, and service (in %) .................................................................... 44
Figure 16: High-technology exports (in US$) ........................................................................................................ 44
Figure 17: High-technology exports (in % of manufactured goods) .................................................................... 44
Figure 18: Government expenditure on tertiary education as percentage of GDP (in %).................................. 45
Figure 19: Gross domestic expenditure on R&D (GERD) as percentage of GDP ............................................... 45
Figure 20: Gross domestic expenditure on R&D by source of funds (in %) ........................................................ 46
Figure 21: Gross enrolment ratio in tertiary education (in %) ..............................................................................47
Figure 22: Gross graduation ratio from first degree programmes (ISCED 6 and 7) in tertiary education (in %) .......................................................................................................................................................47
Figure 23: Pupil-teacher ratio in tertiary education (headcount basis) .............................................................. 48
Figure 24: Doctoral graduates / Graduates from ISCED 8 programmes (both sexes)....................................... 48
Figure 25: Percentage of female doctoral graduates (in %) ................................................................................ 49
Figure 26: Scientific and technical journal articles .............................................................................................. 50
Figure 27: Researchers per million inhabitants (headcount) ...............................................................................51
Figure 28: Researchers (headcount) ......................................................................................................................51
Index of Figures

7
Figure 29: Researchers (female, in %) .................................................................................................................. 52
Figure 30: Researchers by sector of employment (in %) ...................................................................................... 52
Figure 31: Researchers by field of research (in %) ............................................................................................... 53
Figure 32: Motivation to start an academic or research-oriented career ........................................................... 54
Figure 33: Employment status ............................................................................................................................... 55
Figure 34: Duration of employment contracts ...................................................................................................... 55
Figure 35: Participants by sector of employment of main job ............................................................................. 56
Figure 36: Working hours in higher / tertiary education ...................................................................................... 56
Figure 37: Working hours in research organizations............................................................................................ 57
Figure 38: Satisfaction with working conditions ................................................................................................... 57
Figure 39: Persons evaluating the performance of young scientists and scholars in higher / tertiary education or research organizations ................................................................................................... 58
Figure 40: Persons evaluating the performance of young scientists in business enterprise ............................ 58
Figure 41: Perception of importance of criteria for performance evaluation ..................................................... 59
Figure 42: Obstacles that influence the career of young scientists and scholars ............................................. 60
Figure 43: Importance of different types of mentoring or support ..................................................................... 61
Figure 44: Groups of people that young scientists and scholars address for career advice ............................ 61
Figure 45: Ability to access adequate childcare ................................................................................................... 62
Figure 46: Support from organization ................................................................................................................... 63
Figure 47: Collaboration on publications .............................................................................................................. 64
Figure 48: Collaboration on research projects ..................................................................................................... 64
Figure 49: Intention to leave the current country within the next 12 months .................................................... 66
Figure 50: Preferred destination of stays abroad within the next 12 months .................................................... 66
Figure 51: Reasons why young scientists intend to leave the current country .................................................. 66
Figure 52: Views on different aspects of international mobility .......................................................................... 67
Figure 53: Reasons to return to home country ..................................................................................................... 67
Figure 54: Satisfaction with Program with the Obligation to Return Home ........................................................ 68
Figure 55: Percentage of research funding from own organization .................................................................... 69
Figure 56: Sources of funding for research over the past three years ............................................................... 69
Figure 57: Type of research applied for funding over the past three years ........................................................ 70
Figure 58: Academic output ................................................................................................................................... 70
Figure 59: Personal characteristics related to creativity and innovation .............................................................71
Figure 60: Knowledge, attributes and behaviours related to creativity and innovation .................................... 72


9
General Introduction
Co-Chairs’ Foreword
Young scientists are widely recognized as being potential creators of great science that can result in improving the quality of life. Therefore, it is in society’s interest to determine how we can encourage success in our next generation of scientists, how we can best support young scientists, to what extent the current research environment motivates them to stay in science, and what can we do to improve the prospects of their career paths. The Global Young Academy (GYA) believes that it is our responsibility to promote the prosperous career paths of the future and current young scientists.
Over the past decade, many countries in Asia, and, in particular in ASEAN, have been transi-tioning from being a manufacturing based to a knowledge based economy. This has led to the need of a skilled workforce. In the field of aca-demia and research, many young ASEAN nation scientists are in the process of establishing their professions. Motivation for their paths as young scientists entails their passion for the field and chance for discovery through research. For this reason, the GYA, in cooperation with the National Science, Technology and Innovation Policy Office (STI) and the National Science and Technology Development Agency (NSTDA) in Thailand, have
undertaken the preliminary assessment of the challenges and opportunities identified by young scientists in four selected countries in ASEAN. We are grateful to the German Federal Ministry of Education and Research (BMBF) for suppor-ting and co-funding the project.
The aims of this project are to obtain a well- rounded picture of young scientists’ status in order to identify trends, challenges, and models for promoting the creativity of young scientists that can contribute to the scientific community and to society at large. More importantly, the ASEAN Economic Community (AEC) has arrived; it is therefore crucial that we know where to fo-cus and promote our efforts, and how best to direct our limited resources to support young scientists in the region so that their careers can be successful and contribute to strengthening the scientific community in the region. Finally, we hope that this report will be a key mechanism to raise the “voice” of young scientists in ASEAN and will provide a knowledge base that enables development of evidence based support struc-tures and policy benefiting young scientists in the region in the future.
Mari-Vaughn Johnson and Orakanoke Phanraksa, GYA Co-Chairs

10
GloSYS Working Group Preface
The report you have before you represents the results of an assessment of the state of young scientists across four ASEAN countries. The need for this study can be traced back to the founding of the GYA itself. In 2008 the InterAcademy Panel: the Global Network of Science Academies and the World Economic Forum brought together outstanding young scientists and scholars from around the world at the WEF’s Annual Meeting of New Champions, or ‘Summer Davos’ in China. At this and subsequent meetings, the experiences and challenges facing young scientists and scholars were aired and key themes identified. And thus the idea for the Global State of Young Scientists study, or GloSYS, was born.
The study that is set out within this report is an important continuation of the initial GYA precur-sor study, which was a snapshot survey of young
scientists and scholars across the globe. The pre-cursor study alerted us to key findings, which war-ranted further in-depth study, including regional differences in the findings. As such, there was a strong appetite by GYA members to conduct follow-up regional studies to continue to assess the ‘state of young scientists’. The GloSYS ASEAN study is the first follow-up, regional study.
We hope this will not be a one-off effort, and this report should by no means be the final word on the state of young researchers. We very much hope others share our sense of purpose and we welcome ideas for further action.
Karen Lorimer(GloSYS Working Group Lead, on behalf of the working group)

11
Contribution and acknowledgements
Authors
(in alphabetical order)
Catherine Beaudry (GloSYS ASEAN Co-Principal Investigator, research tool design, data analysis and report supervision), Martin Dominik (GloSYS WG Member, shaping up research tools), Johannes Geffers (GloSYS Project Officer, research tool design, data analysis, conduct-ing interviews and main report writing), Futao Huang (GloSYS ASEAN Principal Investigator, advising framework of the research tools and shaping up the direction of the report), Mei-Chou Huang and Yin-Chun Lin (data analysis), Shoji Komai (GYA alumni, shaping up the research tools), Karen Lorimer (GloSYS WG Lead, shap-ing of research tools, data analysis and data interpretation), Orakanoke Phanraksa (GloSYS ASEAN Co-Principal Investigator, coordinator for Thailand), Wibool Piyawattanametha (GYA alum-ni, shaping up the research tools), Pattranooj Saengchantr (GloSYS research assistant, digi-tizing the online questionnaire and data prepa-ration for both quantitative and qualitative data for transcription, and report writing), Hasnawati Saleh (coordinator for Indonesia), Brendon Tagg (shaping up research tools), Hsin-Chou Yang (GloSYS WG member, data cleaning and analy-sis), and Abhimanyu Veerakumarasivam (shap-ing up the research tools and coordinator for Malaysia).
Acknowledgements
Project set up
We wish to thank the following individuals and organizations for their contribution to ensure the success of the project. First and foremost, we are grateful for the financial support of the Na-tional Science, Technology, and Innovation Policy Office (STI) in Thailand, and the German Federal Ministry of Education and Research in Germany (BMBF) without which this project would not have been possible. Closely related is the sup-port from the National Science and Technology Development Agency (NSTDA) as well as the Berlin-Brandenburg Academy for Sciences and Humanities (BBAW) for providing office space, administrative and technical support to the project and in cooperation with the GYA Office.
This report would not have been possible without the help of the GYA GloSYS working group, GYA alumni, and the National Young Academies from three ASEAN countries namely Young Scientists Network-Academy of Sciences Malaysia (YSN-ASM), Indonesian Young Academy of Science (AIPI), and Thai Young Scientists Academy (TYSA) for their joint cooperation to this project.
Data collection
We would like to thank other GYA members, including Vanny Narita (Indonesia), Ramesh T. Subramaniam (Malaysia), Lim Boon Ham (Ma-laysia), Kok-Keong Chong (Malaysia), Normi Mohd Yahaya (Malaysia), and Numpon Mahay-otsanun (Thailand) for their assistance in cir-culating the questionnaire to the participants. We further owe our appreciation to Chinawut Chinaprayoon (STI) who provided statistical data on Thailand. More importantly, not only have the authors performed their key roles above, but also distributing the online survey, validat-ing the collected data, and proposing the policy recommendations, based on the collected and integrated data. Our special thanks also go to Mari-Vaughn Johnson (GYA Co-Chair) for her kind assistance of partial editing and valuable inputs on the recommendations.
Finally, we are also indebted to the participants in our interviews and to those who participate in the survey for sharing their experiences with us. They shall remain anonymous for obvious rea-sons. Without them, this report would not have been possible. None of these people or organi-zations are responsible for any remaining errors, and their views expressed in the document are those of the research team and do not reflect those of the organizations above mentioned.

12
Executive Summary
This report provides a snapshot of recent sci-entific literature and new analyses of the state of young researchers in four different countries in ASEAN. Young scientists play a vital role in today‘s research and innovation system. Under-standing how young researchers can succeed in and contribute to the knowledge landscape, and what obstacles they encounter in the process across their home institutes, and the region is the subject of the GloSYS ASEAN project. By ex-ploring the global state of young scientists and identifying their opportunities and concerns, the GloSYS project aims to initiate change and cata-lyse improvement in the global research system.
The GloSYS ASEAN study adopts an inclusive approach focusing on the four countries in ASEAN namely Indonesia, Malaysia, Singapore and Thailand. Methodologically, the study draws on existing statistical data from international sources, literature and on our own empirical data integrating the regionally comparative results from 444 survey respondents with the authentic voices of young scholars gathered in 18 semi-structured interviews. For the GloSYS project, a Young Scientist or Scholar is defined as a post-graduate or early career researcher who has earned her/his PhD or an equivalent advanced research qualification up to 10 years ago and who is working in the following employment sec- tors: higher education, private / public research organizations, business enterprise or other sec-tors where research is conducted (e.g. NGOs). He/she will usually be between 30 and 40 years old.
Below are key findings in responding to the pro-posed research questions.
What are the key factors and challenges that influence the creativity and innova-tion of young scientists and scholars in ASEAN both on a national and individual level?
• Time for meaningful research. This fac-tor has two aspects. First, it applies to funding cycles that young scientists and scholars perceive as too short to produce meaningful findings. Related to this, it is conducive to provide continuity in funding streams in a given area so that research-
ers are not forced to shift between topics and can dedicate themselves to acquire a high level of expertise. Second, it refers to the day-to-day allotment of time reserved for research that is threatened by the time required for other duties that are not by themselves producing value – admin-istrative tasks. In particular those related to performance evaluations seem to take up a rather large part of the time that is available to young scientists and scholars
• Performance evaluation that is not primarily focused on the quantity of the (academic) output. KPIs that put emphasis on the quantitative academic output may be incentives for young sci-entists and scholars to be productive, but the concepts of creativity and innovation primarily related to the creation and im-plementation of something with a new quality.
• Funding and other resources, and the ability to access these resources. Funding of research and international mobility, access to journals, the availabil-ity of adequately qualified support staff are obstacles that young scientists and scholars report as factors with an impact on their career and work. In some cases, the inability to identify funding sources and the limited experience with applica-tion procedures is a factor by itself.
• Opportunities for meaningful exchange. From the accounts of the interviewees, meaningful professional exchange with international researchers and between higher education / research organizations and industry seem to be very helpful oppor-tunities to acquire the personal cognitive capacities required for being creative and being aware of the requirements of the economic sector.
What are support mechanisms that promote the creativity and innovation, and the mobility of young scientists and scholars in ASEAN countries?
• Support of relevant professional ex-change – both at international level be-tween researchers as well as between

13
academia / research organizations and industry. Though data from the question-naire tells that organizations do quite well in providing opportunities of exchange be-tween higher education / research orga- nizations and industry, this is not reflected in actual collaborations on publications or projects.
• Continue bonded PhD programs / pro-grams with the obligation to return home. A high proportion of participants of the online-survey reported that they required the resources offered by those programs to earn their PhD abroad.
To what extent do young scientists tend to continue their research in ASEAN countries?
• Findings from the questionnaire data tell of limited mobility between countries in the career history of the participants of the study and paint the picture of equally limited intentions for regional mobility with a duration of more than 3 months.
• Findings from the questionnaire data tell that the participants have more collabo-ration with researchers from other conti-nents than within the region.
• Findings from the interviews mostly sup-port this impression: Singapore is usually considered the most important and mat- ure higher education and research system that offers opportunities for academic advancement and career opportunities. Nevertheless, some accounts from the interviews with young scientists and schol-ars tell of more differentiated perspec- tives which talk about specific centres of excellence in individual countries that can also be of interest.
Whether experiences gained from the mobility can advance the creativity and innovation of young scientists and schol-ars in ASEAN countries?
Young scientists and scholars have offered accounts on a wide range of issues related to international mobility, with the majority of the accounts referring to subject related matters, learning from new sources, and opportunities to expand their networks and start collaborations.
In general, all these accounts tell of meaningful opportunities for learning, exchange and per-sonal growth. These experiences allow them to see ‘things from a different angle’, get to know different solutions to a problem and also learn of different approaches on how to solve prob-lems in general. All these experiences can there-fore be considered conducive to advance the creativity and innovation of young scientists and scholars in ASEAN countries.
Are there differences in creativity be-tween countries and disciplines?
The descriptive analysis of the questionnaire data and the limited number of interviews do not allow for a thorough comparison between countries. Even the ongoing statistical analysis will face the challenge to account for skewed samples of participants from the 4 countries in-volved in the study and disciplines. Given that Malaysia and Thailand both have a high number of respondents, a comparison between those two countries may be the most rewarding, while comparisons with Indonesia and Singapore will be more limited.
How can policy makers and universities/research institutes in Asia ensure that early career researchers are provided with adequate training and acquire the necessary skill required to contribute to science and research on a global scale and, at the same time, are responsive to the challenges of the Asian continent on a national and regional level?
• Continue to promote international mobility at earlier stages of the career (e.g. grants for masters’ and PhD studies abroad, with or without bonded condition).
• Highlight particular centres of excellence within the ASEAN region and promote lab visits or other sorts of exchange. At the whole system level, the higher education and research systems of most ASEAN countries do not yet seem interesting for young scientists and scholars, in particular to those who had the opportunity to gain experience in more mature systems on other continents.
• Train the mentors – they may not know

14
how to mentor young scientists and scholars.
• Consider adjustments to the regulations of bonded PhD programs. A relevant pro-portion of participants of these programs has voiced the interest not to return immediately after earning the PhD. Possi-bly, extending the allowance to stay for a limited number of postdoc positions may significantly increase the experience that these young scientists and scholars could contribute upon their return. The option to stay abroad for an additional period of time may be related to conditions, such as a postdoc position in a university cur-rently ranked among the top 100 of the world or an equally important measure.
Recommendations
1. Make investment in highly skilled hu-man resources sustainable by providing mentoring and support for young scien-tists and scholars to facilitate access to necessary resources and help them navigate their postdoc career.
Early career researchers who have already earned a PhD at home or abroad can be consid-ered a high value investment which in many cas-es is at least partly based on public funding. For young scientists and scholars to live up to their full potential and continue a research oriented career, it needs a last act of mentoring to help them navigate the new challenges of the post-doc phase of their career. This may be achieved by
• providing systematic training and men-toring on how to identify funding sources and writing applications to allow them to become self-sustainable by acquiring funds from various national and interna-tional sources. This may take the form of half- or full day workshops as a part of an integrated program for an initial phase following the acquisition of the PhD. The program might include other aspects such as balancing research and teaching work-loads.
• supporting the mentors in mentoring early career researchers as the seniors may
not have received mentoring themselves or would benefit of a systematic introduc-tion to the task. This might be achieved by supporting mentoring programs with a short introductory workshop for mentors that provide them with evidence on typical challenges of the postdoc phase and how to address them during the course of a mentoring process that has clear limita-tions on duration and what mentees can expect from their mentor.
2. Foster international, regional, and in-tersectoral collaboration by continuing to support opportunities for meaningful professional exchange.
This could be followed up by
• supporting exchange between academia, the business enterprise sector, and other sectors of the society that facilitate visibil-ity of research and career opportunities. To promote collaboration with industry, opportunities for lab visits are a means to offer early career researchers a better un-derstanding of the expectations and op-portunities in the private business sector.
• promoting international and regional ex- change with other researchers. For regional exchange, joint funding programmes, con-ferences, and grants for stays in neigh-bouring countries may provide incentives for collaboration.
3. Make best use of the potential of early career researchers by ensuring they can play to their strength.
The PhD has the primary objective to train young scientists and scholars to be able to conduct research and to engage in other science related tasks like teaching, consulting, or the implemen-tation of innovations in the business enterprise sector. Supporting them in focusing on what they have been prepared for may be supported by:
• reducing unnecessary administrative du-ties to the required minimum by reviewing system level and organizational policies.
• providing adequate support staff to sup-port them with menial tasks. This requires properly trained staff to help with applica-tions, reporting, guidance in issues such as ethical approval or other tasks that

15
researchers only have to engage in from time to time.
4. Align performance evaluation with the goals to be achieved and review pro-cedures regarding the efficiency of the evaluation process.
Performance evaluation can provide a means to promote productivity, but it can also stifle al-ready existing motivation to achieve excellence. Reviewing existing systems of performance eval-uation might consider
• checking balance of ‘accountability’ and ‘freedom’ to not dampen the curiosity and creativity of young scientists and schol-ars. Systems of performance evaluation should be able to account for different – and changing – strengths of young scien-tists and scholars across different tasks.
• reducing the time required to participate in the mandatory performance evalua-tions. Organizations that have multiple and changing systems performance eva- luation might force their employees to spend unnecessary much time on an ac-tivity that by itself is not productive.
• considering the aims and consequences of the evaluation. Are the outcomes of the evaluation adequately related to a reward and career system? Are there intentions to support the improvement of the young scientists and scholars?
5. Amend bonded PhD programs.
Supporting to earn a PhD has proven to be a successful way of qualifying the pool for the next generation of researchers. During the process of earning the PhD, motivations change and other opportunities may arise that warrant considering current regulations. To make best use of the strengths of young scientists and scholars, it might be worthwhile to
• keep in touch with those abroad and allow for negotiation of the career upon return to the home country. A career plan should be devised between the local universities and research institutions in order for the young scientists to develop relationship abroad that will benefit the country upon the scientists’ return.
• consider to allow a prolonged stay abroad under specified conditions. Offer the op-portunity to stay abroad after completion of the PhD if the young scientist or scholar is able to acquire a postdoc position in a university or department ranked among the top positions in crucial fields of re-search. Depending on additional con-ditions, this might only apply to the first postdoc position.
• evaluate further postdoc positions. Once the young scientists return home after their graduation, home institutions may consider adopting the policy allowing them to do their second postdoc. Time to be spent during the postdoc should be counted under the bonded program.
6. Support further research on the state of young scientists and scholars.
While challenges of the PhD phase have already seen extensive research, it is very much less known how early career researchers navigate the postdoc phase, what obstacles they encounter and what kind of support they require. Further research and monitoring of their work and ca-reer is therefore required. This needs
• improving the statistical information on early career researchers and the most important subgroups (e.g. stratification by age, gender, employment sector, fields of research / academic discipline, and academic rank / position) to allow an assessment of the representativity of fur-ther empirical studies, surveys or panel studies.
• conducting further studies on this par-ticular target group which should include longitudinal studies on career trajectories and a more in-depth understanding of particular challenges such as balancing research and teaching, following alterna-tive career trajectories within and outside academia, and the impact of international mobility and the use of information tech-nologies.

16
1. Introduction to GloSYS ASEAN Regional StudyThe geography of Asia makes it the largest con-tinent on Earth, gifted with a rich diversity in na-tural resources spread over distinct landscapes from the highest mountains to barely charted archipelagos. Its wealth of biodiversity makes it a treasure cove for scientists from all over the world, its cultural heritage and ethnic diversity assure it of deeply rooted intellectual founda-tions and sprawling sources of creativity. The growth of its populations provides most coun-tries in Asia with a solid demographical struc-ture and a resource that they will not run out of anytime soon: human capital. For a long time, many countries in Asia depended on a manufac-turing based economy and are now moving to-ward a knowledge-based economy (ADB, 2011). This move requires the investment in a skilled workforce and leads to far-reaching changes of societal institutions and their collaboration. In particular the state, the economy, and the (hig-her) education sector are being reformed and their relationships realigned to form national innovation systems. The roles are overlapped, but in the most common pattern of roles and functions, the state usually focuses on providing appropriate innovation policies and basic struc-tures, higher education trains the next generati-on of highly skilled professionals and conducts academic research, and the economy trans-forms R&D outcomes into products and services (Mok, 2012).
Research and higher education have proven to have broad positive effects on economic and social development, for both the individual and the public, by providing the people of a country the qualification for better work and income, ge-nerating new knowledge, stimulating internatio-nal cooperation, increasing competitiveness in the global knowledge-based economy, and ge-nerally enhancing a countries’ resources to find innovative solutions to societal problems and needs (e.g. The World Bank, 2000; Schaaper, 2014; Valeria, Parton, & Robb, 2014). Given the importance of research and higher educa-tion, recent decades have seen an increased interest to manage its institutions based on empirical evidence from statistics and research.
This research has first of all focused on financial resources, student enrolment and graduation, output in general, and new forms of governance while research on academic staff has trailed this development. Such generalizations always are oversimplifications as research on academic staff has been given more attention in some parts of the world, e.g. Europe, North America or OECD countries in general, than in other regions (e.g. European Commission, 2013; Auriol, 2010; Auriol, Misu, & Freeman, 2013).
The Global State of Young Scientists (GloSYS) ASEAN regional study aims to fill the gap of knowledge on the working conditions and career perspectives of young scientists and scholars in four ASEAN countries: Indonesia, Malaysia, Singapore, and Thailand. More specifically, it pro-vides a snap-shot of the state of young scientists in these countries and identifies trends, chal-lenges, and models for promoting the creativity of young scientists and scholars that can con-tribute to the scientific community at national and regional levels, and for improvements of the situation of young scholars and scientists across disciplinary areas in ASEAN.
The following chapters will first provide an over-view of international trends in higher education and developments in Asia and will then outline the design of the study. Against this backdrop, the findings will be reported: An outline of the countries participating in the study based on quantitative indicators, followed by the results from both an online-questionnaire and in-depth interviews with young scientists. These findings have been discussed with representatives of National Young Academies from Indonesia, Ma-laysia, and Thailand, and building on these sha-red international perspectives, the Global Young Academy suggests recommendations for policy makers and other stakeholders how to support young scientists and scholars.
17
International Trends of Higher Education and Developments in AsiaHigher education systems adapt to changing conditions of the societies that support them, and so does the academic profession (Arimoto, 2013). Analyzing international trends and chang-es in higher education and research systems in their national and regional contexts will help to identify factors that impact on the working conditions and career perspectives of young sci-entists and scholars.
During the last four to five decades numerous reforms have resulted in extensive changes in higher education systems around the world such as the massive growth of participation and the differentiation of higher education systems, expanding marketization and privatization, the introduction of new forms of university govern-ance, the globalization and internationalization of the academy, and the perception on the rele-vance of contributions of higher education to so-ciety (Zgaga et al., 2015; Cummings & Teichler, 2015; Teichler et al., 2013). Higher education around the world still tends to have a strong national focus, but much of the knowledge pro-duced is universal, academics enjoy to cooperate internationally, cosmopolitan values are wide-spread (IAP, 2016; Teichler, 2015, pp. 866-867; Altbach, Reisberg, & Rumbley, 2009), and major trends such as globalization and international-ization drive the communication between sys-tems of higher education and research. World university rankings, though controversial, can be considered an indicator of the globalization and internationalization of higher education, as they have become a point of reference in an interna-tional competition that is reshaping the strategic planning of universities and driving reforms of higher education around the world (Chien, 2014; Bowman & Bastedo, 2011; Huang, 2015a). Recent research on higher education systems suggests that they retain some of their consist-ency, but there is also evidence for movements towards a “‘globalized’ model of academic work” (Finkelstein, 2015, p. 327). It is therefore nec-essary to evaluate regional and national devel-
opments in light of major international trends to identify commonalities and differences between contexts that impact on the working conditions and career perspectives of scientists and schol-ars.
2.1. Massive Growth and Differentiation
From a western perspective, the time after the Second World War is often referred to as a turn-ing point of higher education: Skilled labour was in high demand for both reconstruction and de-velopment, and there was a social claim by an increasingly larger group of citizens demanding that higher education should furthermore no longer be the privilege of an élite, but should be available for everybody (Zgaga et al., 2015, p. 13). The massive growth of higher education systems from élite, to mass and universal access systems (Trow, 1972, 1973) incurs distinct prob-lems in every part of higher education: Finance, government and administration, the recruitment and training of staff, setting and maintenance of standards, student housing and job placement, and curricula development – the massive and rapid growth surfaced as a driver for change on every activity of the higher education system. Most industrialized countries, in particular North America and in Europe, already had high enrol-ment rates in tertiary education and were bound to move from systems of mass to universal high-er education. In systems of universal access, not earning a tertiary degree means to not com-ply with a new standard of qualification and in-cur a higher risk of unemployment. Other world regions started to catch up with this internation-al trend later, with the first decade of the new 21st century showing strong dynamics in three world regions: South America more than doubled its enrolment ratio between 2000 and 2013 from 25% to 52%, Asia started from a lower level with an even stronger dynamic, increasing en-
2.

18
rolment ratios in tertiary education from 13% to 29%, and Africa started at a low 8% to reach 12% by 2013 (Figure 1).
Differences between levels of enrolment ratios within world regions can be huge, and in par-
ticular Asia is a region with high-ranking coun-tries like Japan, which has seen a more steady increase of enrolment from 49% to 62% be-tween 2000 and 2013. Other South East Asian countries have recently reached enrolment ratios of 30% to 50%, while China and India as
Figure 1: Gross enrolment ratio, tertiary education, both sexes (in %) – different world regions. Source: UIS, latest data available.
Figure 2: Gross enrolment ratio, tertiary education, both sexes (in %) – selected Asian countries Source: UIS, latest data available.

19
the most populous countries are catching up at increasing rates but are still far off reaching levels of universal enrolment (Figure 2).
When training and recruitment of instructors cannot match the increase in student numbers, academic staff will face increasing pressure due to the rising student-instructor ratio. But it is not just absolute numbers that can add to the pres-sure on instructors. With the massive growth in numbers and the increasing demand for lifelong learning, different types of students with distinct needs will appear on the campus that the aca-demic staff has to respond to (Slowey & Schuetze, 2012; Schuetze & Slowey, 2000; Kasworm, 1993; Dollhausen et al., 2013; Wolter, 2012).1 The increase in enrolment in tertiary education in Asia is accompanied by widening access to new target groups, too, with some countries introducing quotas to assure access of under-represented groups (Lee, 2011).
At the system level of higher education institu-tions, two major trends corresponding with the massification of higher education in Asia can be observed: ‘Expanding out and expanding up’ (Chapman & Chien, 2014a, 2014b). ‘Expanding out’ is characterized by increasing the number of institutions for education, hiring addition educational staff, and opening the higher ed-ucation sector to private providers. The growth of private and non-governmental providers is a strong international trend (Bjarnason et al., 2009) that raises the question whether or not the higher education is going through a tran-sition from mass to market higher education systems (Scott, 2015). Private providers of high-er education are bound to take major shares of enrolment in world regions and countries where the public provision of higher education cannot match the rapid growth of student numbers like in Africa (Mohammedbai, 2011, 2014) or Asia (ADB, 2011, 2012; Chapman & Chien, 2014b; Varghese et al., 2014). Mostly serving to under-graduate students, the private higher education has been the fastest growing sector of higher education in Asia (UNESCO, 2014), but is often facing serious quality issues (ADB, 2012). ‘Ex-panding up’ stands for an increased investment in graduate programs to train future teaching staff (Chapman & Chien, 2014a, 2015).
1 Whether or not the assumption of an auto-matic increase of diversity due to a growing student population and the demands of lifelong learning is war-ranted for every region or country, may warrant closer empiric inspection (Wolter, 2015).
2.2. Globalization, Internation-alization, and Regionalization
Given the popularity of the terms globalization and internationalization, a few introductory words on terminology may be the best place to start. Definitions of the terms globalization and internationalization are manifold, they are used interchangeably at times, are interrelated, but refer to distinct phenomena (Mitchell & Nielsen, 2012). Conceptualizations of globalization tend to refer to the integration of the world economy, new information and communications technolo-gies (Altbach, Reisberg, & Rumbley, 2009, p. iv), and globalization describes a process that aims to establish a universally acknowledged model and assumes that the significance of nations and national cultures is decreasing (Huang, 2014a, p. 10). The term internationalization of higher education is no less popular or complex (e.g. Knight, 2004, 2012a; de Wit, 2011), but may be defined “as the process of integrating an international, intercultural, or global dimen-sion into the purpose, functions or delivery of postsecondary education” (Knight, 2003, p. 2). Internationalization is based on the assumption of different countries and stresses the aspect of exchange and communication between those entities (Huang, 2014, p. 10). International-ization may manifest in various ways, such as international mobility of people (both students and scientists or scholars), collaborative re-search, the internationalization of curricular and institutions opening branch campuses abroad, partnerships between institutions or just an increased awareness of the interconnected-ness of higher education and research systems around the world (Altbach, Reisberg, & Rumb-ley, 2009, pp. 24-29; Altbach & Knight, 2007). Regionalization captures the notion of a pro-cess connecting countries, higher education systems or universities of a particular region more closely with one another and less with the world, and, in this sense, is opposing the idea of globalization (Huang, 2014a, p. 11). This trend of increasing intra-regional cooperation and harmonization is occurring in all world regions (Knight, 2012b; Huang, Teichler, & Galaz-Fontes, 2014). The Bologna-Process of the European Union is usually an inspiration or point of reference for initiatives with the aim to create a common higher education system such as the European Higher Education Area (EHEA) that acknowledges differences between countries, but implements standards and tools to ensure

20
that higher education systems become more comparable, compatible, and coherent.
Given the aims of this study, the following over-view will focus on the impact of internationali-zation on the academic faculty. Data from the Changing Academic Profession (CAP) study provides information on the nature and extent of activities related to various aspects of inter-nationalization of higher education performed by scientists and scholars: Research, Teaching, Dissemination, and Mobility (Rostan, Finkel-stein, & Huang, 2014; Rostan & Höhle, 2014; Coates et al., 2014; Rostan, Ceravolo, & Metcalfe, 2014; Rostan, 2015). Table 1 provides an overview of the frequencies of academics and their involvement in activities that can be con-sidered indicators for the internationalization of their work. The top four activities that are re-
ported by at least half of the academics are the integration of international perspectives in their teaching (62%), the characterization of their primary research as international in scope or orientation (55%), publishing in a foreign coun-try (51%), and publishing in a language differ-ent from the language of instruction at their current institution (50%). Among the research related activities, collaboration with international colleagues (41%) and the use of English as second language (36%) rank high, while external for research from international sources is only mentioned by 8% of the respondents of the CAP study. International mobility in the careers of academics is visible primarily by academic de-grees earned in a country different from country of current employment. This applies first to post-doctoral degrees (28%) and doctoral degrees (24%). Based on the replies to their citizenship,
Activity Type of Activity Percent
Emphasize international perspective or content in their courses Teaching 62
Characterize their primary research as international in scope or orientation Research 55
Publish in a foreign country Dissemination 51
Publish in a language different from the language of instruction at their current institution
Dissemination 50
The number of international students has increased since they started teaching
Teaching 43
Collaborate with international colleagues in their research efforts Research 41
Primarily employ English in research as second language Research 36
Individual faculty has the primary influence in establishing international linkages at their institution
Decision making 28
Earned a postdoctoral degree in a country different from country of current employment
Mobility 28
Earned a doctoral degree in a country different from country of current employment
Mobility 24
External funding for their research came from international organizations Research 18
Teaching courses abroad Teaching 9
Country of citizenship is not the country of their current employment Mobility 8
Table 1: Academics engaging in international activities 2007-2008 (in %) Source: Rostan, Finkelstein, & Huang (2014, p. 44, Table 3.3). Findings based on CAP data 2011. Selection of activities by author.

21
only 8% of the respondents can be considered foreign to their current country of employment.
Affinity to a particular academic discipline or field of research tends to have a strong im-pact on various aspects of academic work and careers, and this applies as well to the interna-tionalization of activities of academics. Closer inspection of international research and dissem-ination activities along the soft to hard dimen- sion shows distinct configurations (Table 2). Related to research activities, the often called ‘soft’ and ‘hard’ disciplines differ in particular on international collaboration (35% vs. 46%), the use of English as a second language (26% vs. 45%), and funding for research received from international organizations (15% vs. 21%). Differences between soft and hard disciplines are even more pronounced regarding interna-tional knowledge dissemination: Publishing in a foreign country is distinctively more common in the hard disciplines (60%) than in the soft disci-
plines (40%), and the same applies to publishing with co-authors from other countries (40% vs. 21%). International research collaboration is a particularly demanding type of research with a number of preconditions and benefits (Rostan, Ceravolo, & Metcalfe, 2014, p. 124; Smeby & Gornitzka, 2010): It requires international vis-ibility, the ability to attract international funding, engages scientists and researchers in interna-tional networks and communities, and entails international mobility with regard to travel and knowledge transfer. The benefits of international research collaboration are manifold, and, though differences between disciplines exist, data from the CAP study shows increased individual pro-ductivity as well as more co-authored publi-cations (Rostan, Ceravolo, & Metcalfe, 2014, p. 139).
The international mobility of academics is possi-bly one of the most intensely discussed aspects of the internationalization of higher education
Activity Soft disciplines(in %)
Hard disciplines(in %)
Activities related to research
Primary research is international in scope or orientation 56 55
Collaborate with international colleagues in research 35 46
Primarily employ English in research as their second language 26 45
Primarily employ English in their research as mother tongue 18 13
External funding for research comes from international organizations 15 21
Activities related to international knowledge dissemination
Publish in a foreign country 40 60
Publish in a language different from the language of instruction at current institution
37 61
Publish online or electronically 34 46
Publish work co-authored with colleagues located in other countries 21 40
Table 2: Academics engaging in international activities by broad disciplinary fields 2007-2008 (in %) Source: Rostan, Finkelstein, & Huang (2014, pp. 45-46, Tables 3.5. and 3.6.). Findings based on CAP data 2011. Soft disciplines: teacher training and education science, humanities and arts, social and behavio-ral sciences, and law; hard disciplines: life sciences, physical sciences, mathematics, computer sciences, engineering, manufacturing and construction, architecture, agriculture, medical sciences, health-related sciences, and social services.

22
Type of Experience Percent
Non mobile: no experience abroad throughout entire life course
58
Circulating for study: Short-term 16
Circulating for work: Short-term 10
Circulating for work: Long-term 6
Migration for study: Long-term 5
Migration for work: Long-term 6
Table 3: Academics’ international mobility by type of experience (in %) Source: Rostan & Höhle, 2014, p. 86, Table 5.1; CAP Data, September 2011; Note: due to rounded values the sum of the items exceeds 100%. Short-term is defined as periods lasting 2 years or less, long periods lasting 2 years or more (for definition, see ibid., p. 85, Fn 6).
and is commonly associated with the notion of competition between countries and universities for the most excellent of scientists and scholars which has more popularly been coined ‘The Great Brain Race’ (Wildavsky, 2010). There is evidence that mobile researchers have a larger international network and perform better than their non-mobile peers (Cruz-Castro & Sanz- Menendez, 2010), that they publish more, are cited more often (Baruffaldi & Landoni, 2012; Aksnes, Rorstad, Piro, & Sivertsen, 2013),
Country
Published in a language different from the langu-age of instruction at your current institution (%)
Co-authored with col-leagues located in other (foreign) countries (%)
Published in a foreign country (%)
Yes No Yes No Yes No
Cambodia 45.6 54.4 35.7 64.3 42.7 57.3
Taiwan 59.8 40.2 19.5 80.5 32.8 67.2
Japan 66.0 34.0 28.6 71.4 46.1 53.9
Malaysia 47.1 52.9 40.9 59.1 65.2 34.8
Vietnam 40.5 59.5 19.9 80.1 6.1 93.9
Average 54.9 45.1 30.0 70.0 43.7 56.3
Table 4: International research activities at an individual level in selected Asian countries (in %) Source: Huang, 2015b, p. 61, Table 3.
and that they have better access to funding (Canibano, Otamendi, & Andujar, 2008). Data from the CAP study allows to analyze inter-national mobility of academic staff by type of mobility (Rostan, 2015; Rostan & Höhle, 2014).
Results in Table 3 tell that international mobility of academic staff is an experience that slightly more than 40% share while the majority of aca-demics do not have that experience. Short-term experiences are more common than long-term experiences, with stays abroad for the purpose of earning study or academic degrees (16%) being more common than short-term stays abroad (10%).
Mobility patterns of academics vary between countries of origin, academic disciplines and other factors such as language, gender, and ed-ucational attainment of parents (Rostan, 2015, p. 250).
Higher education in Asia has been influenced by Western academic norms and standards at dif-ferent points in time, sometimes dating back to a nation’s colonial period, in other cases foreign influences were introduced more recently (Lee, 2011, pp. 540-543; Huang, 2015b, 2015c). Against the backdrop of findings on the global state of the internationalization of the academy, results reported from a study conducted between 2012 and 2013 in selected Asian countries

23
CountryResponses
Yes No
Cambodia 22.4 77.6
China 96.0 4.0
Taiwan 55.2 44.8
Japan 95.8 4.2
Malaysia 53.9 46.1
Vietnam 99.4 0.6
Average 83.0 17.0
(Huang, 2015b) allow to get an impression of the current state of internationalization of the academic profession in this world region.
Findings reported in Table 4 show that aca-demics from higher education in Taiwan and Japan, as examples of more mature academic systems, do better than academics from other countries in publishing in a language different from the language of instruction at their current institution. Academics from Malaysia and Cam-bodia do best in co-authoring publications with colleagues in other countries, and academics in Malaysia being particularly successful at pub-lishing in foreign countries.
Findings from the same study (Huang, 2015b) on distributions of doctoral degrees give an impression on international mobility related to study abroad (Table 5). Striking are the differ-ences on the issue whether or not the doctoral degree was earned in the country of current em-ployment: In one group of countries, including China, Japan, and Vietnam, more than 95% of doctoral degrees were earned in the country of employment, while in Taiwan and Malaysia this applies to only slightly more than 50% of the degrees. In Cambodia, only about 22% of aca-demics with a doctoral degree have earned their degree in the same country.
Systems of higher education in Southeast Asia have seen a rapid growth in recent decades, and initiatives of regionalization have gained
Table 5: Obtaining doctoral degree in country of current employment (in %) Source: Source: Huang, 2015, p. 62, Table 4.
considerable importance and depth (for over-views see: Lee, 2011, 2012; Marginson, Kaur, & Sawir, 2011a; Huang, Teichler, & Galaz- Fontes, 2014; Sugimura, 2012). Regionalization of higher education in Southeast Asia has been driven by various economic and political factors that lead to the establishment of intergovern-mental organizations such as the Association of South East Asian Nations (ASEAN) in 1967, the Asia-Pacific Economic Cooperation (APEC), and, to promote collaboration of the education-al sectors, the South East Asian Ministers of Education Organization (SEAMEO). The Regional Institute for Higher Education and Development (RIHED), established in 1970, promoted several initiatives with the aim of creating a common higher education area. Other organizational actors include the ASEAN University Network (AUN), the Southeast Asian Institutions of Higher Learning (ASAIHL), the Malaysia, Indonesia, and Thailand (MIT) organization, and the Asia-Pacific Quality Network (APQN) to name the more prom-inent organizations, networks, and initiatives. As in other world regions, these organizations are involved in facilitating and supporting the mobility of both students and academic staff, fostering collaboration between researchers, and to promote exchange on strategic decisions and management of higher education (Lee, 2011, p. 552).
In comparison to research in other world regions such as Europe and North America, little is known about the regionalization of higher edu-cation in Asia (Huang, Teichler, & Galaz-Fontes, 2014, p. 146). Though research on this matter is getting more prominent in recent years (e.g. Marginson, Kaur, & Sawir, 2011a; Hawkins, Mok, & Neubauer, 2012), there are no findings on the effects of regionalization processes on academic staff with regard to activities such as international mobility or research collaboration within Asia or ASEAN. If cross-border mobility and collaboration in research are researched, it is usually done without distinguishing between regional and other international destinations of partners of collaboration.
2.3. Marketization, New Gov-ernance, and Relevance
The last decades have seen universities and their relation to the state and market under-go intensive, far-reaching change that may

24
well be “the most radical transformation since the emergence of the modern university sys-tem some 150 years ago” (Schuetze & Alvarez Mendiola, 2012a, p. 1). This is a worldwide trend, but many Asian countries have been particularly determined to adjust the roles and relations between the state, industry, and universities to create national innovation systems conducive to economic development: “The roles of the three major stakeholders are often overlapped and not mutually exclusive. But the most common pattern is that the state is more responsible for devising appropriate innovation policies and building basic structures, industry is to trans-form the R&D outputs into profitable products, and higher education takes up the role of culti-vating research talents and conducting academ-ic research” (Mok, 2012, p. 318). The changes to the higher education system and its institu-tions have impact on various aspects, such as the governance of the higher education as a whole, the governance – or management – of each individual institution, and the changes in the perception of what is considered a relevant output of higher education mark a shift towards a system that gives increasing priority to eco-nomical imperatives.
Changes to the government of the higher edu-cation system and its institutions are commonly referred to as marketization (Schuetze & Alvarez Mediola, 2012b; Brown, 2011) and political interventions include actions such as the intro-duction of tuition fees, industry friendly reforms of curricula, the incorporation of institutions of higher education, and a new focus on research aimed at marketable products and services. Terms such as “price and competition, inputs and outputs, resources, costs and benefits, demand and supply, provider and customer, consumers and investors, quality control and accountability” (Schuetze & Alvarez, 2012a, p. 1) have become common in higher education during the last maybe three decades all over the world (for Asia, see Shin, Postiglione, & Huang, 2015; Varghese & Martin, 2014; Mok, 2008a, 2010, 2013, 2014; Rungfamai, 2011). The appearance of these terms is aligned with the introduction of principles of New Public Management (NPM) since the 1980s in the higher education sector and marks a clear shift in government laws and regulations, providing institutions of higher education with greater institutional autonomy and flexibility, ideas that are more commonly associated with private enterprise (Altbach, Reisberg, & Rumbley, 2009,
p. 72). In most countries, these changes were preceded or accompanied by cuts in public resources and funding of higher education sys-tems (Schuetze & Alvarez Mendiola, 2012a, p. 2). To encourage – or push – universities to ‘do more with less’, governments offered universi-ties more institutional autonomy. The intention of the government is to ‘steer’ higher education systems and its institutions ‘from a distance’ (Alvarez Mendiola, 2012a, p. 8.) by defining goals for universities and higher education systems but giving them more freedom on their decisions on how to achieve those goals (‘autonomy and accountability’).
At the institutional level, universities received more autonomy on such matters as setting wages and salaries, relocating budgets from one category to another to account for institutional aims and priorities, engage in collaborations with other agencies more freely, and receive and own assets (Altbach, Reisberg, & Rumbley, 2009, p. 72). At the system level – both national and international –competition between uni-versities was promoted as reflected in national and World University Rankings (Chien, 2014). “Ranking”, as Marginson et al. remark, “has done more than has the WTO to advance the organization of higher education as a market, by defining the field of competition, standardizing the criteria and setting institutions and nations against each other” (Marginson, Kaur, & Sawir, 2011b, p. 18). To comply with the demands of ‘autonomy-for-accountability’ and participate in rankings, universities established evaluation systems to demonstrate their performance in the terms of the new governance system. Eval-uation systems tend to be guided by criteria mostly referring to quantitative indicators such as enrolment or graduation of a given number of students, staff to student ratio, papers indexed in the Science Citation Index or citations per faculty (for an overview of criteria and index-es see Chapman & Chien, 2014b, Apendix III). To align the activities of their staff with these institutional goals, systems of incentives and accountability were created and staff has to report its output in line with Key Performance Indicators (KPIs). Research on the implementa-tion and praxis of KPIs in Malaysia and Thailand tells of mixed perceptions of these systems. In particular university administrators see KPIs as a set of consistent objectives and verifiable indicators, but reception among the faculty is more mixed: Faculty from STEM areas are more inclined to support these systems while faculty
25
from arts, humanities and social sciences are more known to see them as unfair (Chapman & Chien, 2014a, p. 43).
In the newly aligned configuration of state, econ-omy, and higher education, the introduction of a new governance system is to a part more a means to an end than a goal by itself. It is the demand for skilled human resources and research that can be transformed in marketable products and services that both the government and the economy expect to be met. Society and policy makers expect the output of universi-ties to be useful – ‘relevant’ – contributions to economic and societal advancement to show that the funding provided is warranted, and the economy will mostly fund research that war-rants expectations for profit. In policy discourse, the term ‘relevance’ usually comes with a positive connotation and need not be restricted to qualified graduates, the production of system-atic knowledge that can advance technological advancement and economic growth, it may also refer to health and other community services also known as the ‘third mission’ of higher edu-cation (Cummings & Teichler, 2015, p. 2).
The education of a skilled workforce does not only refer to an increased number of graduates as there is also a qualitative aspect to this trend: It has to be the right number of graduates with the required qualifications. The massive growth of student enrolment may have been driven by the claim of a growing group of citizens demanding access to higher education for per-sonal social advancement, but there were also the requirements of an economy shifting from an industrial core towards a service and knowl-edge-based society. These two distinct interests overlap or became relevant for one another and policy makers where the graduates acquire the skills and competencies demanded by the econ-omy and other societal institutions (Arimoto, 2013, 2015). Unsurprisingly, the employability of graduates – the fit of skills of graduates and requirements of the workplace – has become a central aspect of curricular development, while humanities are being displaced (Alvarez Men-diola, 2012a, p. 20). The relevance of higher education is increasingly measured against the economic value of human resources as an output measure of higher education – both in quantity as in quality.
Economic revenue from research conducted at universities is another expectation from govern-
ments (Lendel, Allen, & Feldmann, 2009). For high-income countries, positive evidence for the strategy of university-based economic growth is plentiful while the evidence for low- and mid-dle-income countries is less clear (Schaaper, 2014, p. 51). For Asia, countries such as the Republic of Korea (ibid.; Mok, 2012), Singapore, Taiwan, and Hong Kong (Mok, 2012) have shown to successfully implement national innovation systems where universities cooperate success-fully with industry. As research at universities is usually conducted at graduate level (referring to both master and doctoral degrees), many policy makers are hoping to gain increased economic returns from research conducted at universities while at the same time training the next gener-ation of academics who will educate the next generation of scientists (Varghese et al., 2014). Though it is widely agreed that basic research is the foundation on which applied and experi-mental research can build to generate profitable technological advancements in services or prod-ucts, the current trend shows a stagnation or decline of funding for basic research while funds for applied research are increasing (UNESCO, 2015). This observation has also been coined as an on-going transition of the ‘scholarship of discovery’, aimed at creating fundamental knowledge, towards a ‘scholarship of applica-tion’ (Teichler et al., 2013, p. 16).
The marketization of higher education is still an on-going process that has received both praise and sharp critique. On the positive side, Alvarez Mendiola (2012, p. 20) points to increased ef-ficiency and better performance, better aware-ness and management of costs, attendance to demands of social sectors not properly attended to by public higher education, and generally a better communication with stakeholders and attendance to their needs. On the negative side, the financial pressure on students and their families due to tuition fees have been pointed out, and “questions have been raised concern-ing the pressure to commercialize services; the weakening of the disinterested commitment to knowledge, and of the academic authority of the faculty; the failing of collegiate bodies; the expansion of a barely-regulated, low-quality, profit-seeking private sector, which in many cases does not guarantee consumers’ rights; and the encouragement of curricular models that favour industry while displacing the human-ities” (Alvarez Mendiola, 2012a, p. 20).

26
2.4. Gender Inequality
Women in science and research have been under- represented and under-recognized across the world, a fact that is well documented. Statistics on female researchers2 across world regions is still in need of improvement, but statistical data from the UNESCO Institute for Statistics from 2013 shows shares between 47.1% in Central Asia and 18.9% in South and West Asia with a world average of 28.4% (Figure 3). Striking dif-ferences exist between countries even within seemingly close countries as illustrated by data for selected Asian countries (Figure 4): At the lower end of the dimension are Japan (14.6%) and the Republic of Korea (18.2%), Singapore (29.6%) and Indonesia (30.6%) take somewhat of a middle position with Malaysia (49.9%) and Thailand (52.7%) reporting equal shares of female and male researchers.
2 For the statistical data of the UNESCO, rese-archers are defined as “professionals engaged in the conception or creation of new knowledge, products, processes, methods and systems and also in the ma-nagement of the projects concerned” (OECD, 2002, p. 93). This definition is too broad for the purpose of this study on PhD holders and is of relative use as a proxy, but the best option given the very limited data on the population of academics in general and the subgroup of PhD holders in particular.
Data on academics in higher education show a horizontal and vertical segregation of the academic labour market along the dimensions field of study and rank. Differences between fields of study can be illustrated by data from EU: In 2010, on average throughout the EU-27, the highest proportions of female PhD graduates were reported for education (64%), health and welfare (56%) while the proportion of females for engineering, manufacturing and construction (26%) show that the math-relat-ed fields of science are still male-dominated (European Commission, 2013, p. 53). Data from 2010 on the vertical segregation of female and male academics are equally striking and show that female academics in the EU-27 make up 40% of the academic staff, but their presence at grade A positions amounts to only 20% (European Commission, 2013). Again, diffe- rences between countries can be decisive.
There is a major body of research on gender differences and inequalities from around the world, reporting differences between gender with regard to positions, hiring, funding, sala-ries, patenting, and international mobility (e.g. Larivière et al., 2013; Shen, 2013; Ding, Murray, & Stuart, 2006; Holden, 2001; Ley & Hamilton, 2008; Jiménez-Rodrigo et al., 2008; Vabo et al., 2014). But as the differences between countries suggest, local conditions have to be observed.
Figure 3: Female researchers in different world regions (in %) Source: Data from UIS; Year: 2013; data referring to ‘head count’
World
Arab States
Central and Eastern Europe
Central Asia
East Asia and the Paci�c
Latin America and the Carribean
North America and Western Europe
South and West Asia
Sub-Saharan Africa
28.4
36.8
39.9
47.1
22.6
44.3
32.0
30.0
18.9

27
Figure 4: Female researchers in selected Asian countries (in %) Source: Data from UIS; Year: 2013 or latest year available; data referring to ‘head count’
Figure 5: Female academic staff in EU-27 and selected countries, Grade A and total, 2010 (in %)Source: Based on data from European Commission, 2013, p. 90, Table 3.1.; Definition of Grade A: The single highest grade/position at which research is normally conducted.
Indonesia
Japan
Malaysia
Republic of Korea
Singapore
Thailand
Vietnam
52.7
30.6
14.6
49.9
18.2
29.6
41.7

28
2.5. Summary and Implications for the Analysis
The situation of researchers in general and young scientists and scholars no less is thoroughly intertwined with their immediate working con-text and its dynamics. In particular rapid chang-es of higher education and research systems have an impact on the working conditions and career perspectives of early career researchers. More often than not, these changes produce tensions, frictions and uncertainties that they have to face and find a way to deal with. The fol-lowing summary aims to outline the implications of the major international trends reported above for young scientists and scholars and to outline ‘key challenges’.
• The massive growth and differentiation of the higher education system is char-acterized by two major trends that have been coined ‘expanding out’ and ‘expand-ing up’. The strategy of ‘expanding out’ seeks to address the massive increase in participation in higher education and is characterized by an increase in the number of higher education institutions and the need for additional faculty to ac-count for the increased demand. As public funding of higher education is often insuf-ficient, there is a worldwide trend to open the higher education sector to private providers. ‘Expanding up’ refers to the trend of an increased investment in gradu-ate education, both for training future staff and to push university based research with the aim of attaining a better position in world university rankings which put an emphasis on research related output indicators. These trends of ‘expanding out’ and ‘expanding up’ lead to a horizontal and vertical differentiation of the higher education system with increasingly impor-tant boundaries between different sectors (e.g. teaching vs. research oriented insti-tutions, private vs. public institutions).
These developments can have both positive and negative implications for academic faculty: A growing employment sector first of all offers opportunities to new faculty as, in general, more positions become available than were existent for the previous generation of faculty. If the growth of the system cannot hold pace with the increasing demand, student-
instructor ratios will increase and aca-demic faculty will be faced with higher pressure related to teaching and they will have less time for research that is still the single most important criterion to keep their career moving forward. Finally, the more differentiated a system is, the less opportunities for career movements be-tween different types of institutions will be available.
• Internationalization and regionalization of the higher education and research sys-tems play an increasingly important role in the globalized knowledge economy. International mobility of students and academic staff, the internationalization of curricular, international branch campus-es, international and regional research collaboration, publishing in international journals or generally being present in these fora are examples of these trends that young scientists and scholars need to be aware of and act upon to not ‘stay behind’.
As research related above indicates, the need to conduct international collabora-tive research may depend on the status of the higher education and research sys-tem of a country – larger and more mature system might offer greater opportunities to reach out and they may also offer enough reputable opportunities to publish in national journals. In general, findings related to international experience high-light the benefits of international mobility on issues such as funding, collaboration, publication and being cited. As interna-tionalization is increasingly perceived as an indicator of or at least conducive to re-search excellence and access to resourc-es, the pressure on young scientists and scholars increases to produce output that gives testimony of this demand. Given the importance of international and regional mobility, finding reliable evidence on the prevalence and impact of the mobility of young scientists and scholars is one specific focus of the GloSYS ASEAN study.
• The marketization of higher education and research systems has been char-acterized as possibly the most radical transformation since the emergence of modern universities about 150 years ago. The implications of this transformation impact on a number of aspects of the

29
day-to-day work of young scientists and scholars. First, a shift from a ‘scholarship of discovery’ to a ‘scholarship of appli-cability’ can be stated. It is reflected in changing funding priorities from basic to applied, and from long-term to short-term research – the outcomes of research have to be tangible, and the importance of a possible commercialization may even become greater than academic productivity and impact. The second major change is the change in the governance of the higher education and research systems and their organizations: ‘Accountability for autonomy’ is the principle both at the system level as well as within organiza-tions. To report to funding sources – both public and private – detailed systems of performance evaluations have been intro-duced and young scientists and scholars are measured against ‘key performance indicators’ (KPIs).
This transformation process has received both praise and serious critique and raises several questions: How do young scien-tists and scholars relate to the (new) im-peratives of research? Do the demands for applicability meet with their motivations to start a research career? How do they perceive the new systems of evaluation? Are they perceived as adequate and fair and are the results of the evaluation well aligned with career systems, i.e. do they perceive the career system as meritocratic – does it pay to strive for excellence? As this addresses issues of productivity, it is closely related to the second focus of the GloSYS ASEAN regional study: Searching for evidence on factors that have an im-pact on the creativity and innovation of young scientists and scholars.
• Gender inequality in higher education and research is a fact that has been doc-umented in many respects: under-rep-resentation and under-recognition of women is the prevalent picture, with differ-ences between genders reported but not limited to positions, hiring, salaries, pat-enting and international mobility. Though, differences between different regions of the world, countries, fields of research and employment sectors can be striking. It is widely agreed and on the agenda of international and national bodies to ad-dress these inequalities and to support female scientists and scholars. These
initiatives are based on various reasons, with arguments from a discourse on civil rights (demand for equality of genders) as well as more instrumental arguments relating to the need to access the full human capital of a country brought for-ward. Though some achievements can be observed in recent time, differences have proven to be very resistant to change and advancements have been slow. As the in-equalities observed are not only related to the sphere of work, they cannot be solved here without addressing those factors of the private sphere that have shown to have a stronger impact on female than on male researchers – the distribu-tion of care-work in partnerships.
For the GloSYS project and the GloSYS ASEAN study, the assessment of differ-ences between genders is a theme that cuts across all issues and methods to identify inequalities and barriers, and pro-vide recommendations to address them.
Specifically, we addressed the following re-search objectives:
1. What are the key factors and challenges that influence the creativity and innova-tion of young scientists and scholars in ASEAN both on a national and individual level?
2. What are support mechanisms that pro-mote the creativity and innovation, and the mobility of young scientists and schol-ars in ASEAN countries?
3. To what extent do young scientists tend to continue their research in ASEAN coun-tries?
4. Whether experiences gained from the mo-bility can advance the creativity and inno-vation of young scientists and scholars in ASEAN countries?
5. Are there differences in creativity between countries and disciplines?
6. How can policy makers and universities/research institutes in Asia ensure that early career researchers are provided with adequate training and acquire the necessary skill required to contribute to science and research on a global scale and, at the same time, are responsive to the challenges of the Asian continent on a national and regional level?

30
3. 3.1. Overview
This chapter summarizes the definition of the target group, the methodology and sample de-mographics of quantitative and qualitative data collected for the GloSYS ASEAN regional study. The analysis of the state of young scientists and scholars requires the integrated analyses of various types of data: statistical information on the target group and their most common work contexts, quantitative data on their experiences, and qualitative data from semi-structured inter-views. For further information on the interplay of different data sources, please refer to chapter 3.3.1.
3.2. Terms and Concepts
3.2.1. GloSYS Definition of Young Scien-tist or Scholar
For the GloSYS project, a Young Scientist or Scholar is defined as a postgraduate or early career researcher who has earned her/his PhD or an equivalent advanced research qualifica-tion up to 10 years ago and who is working in the following employment sectors: higher edu-cation, private / public research organizations, business enterprise or other sectors where re-search is conducted (e.g. NGOs). He/she will usually be between 30 and 40 years old. For the GloSYS ASEAN regional study, a particular focus is placed on young scientists and scholars work-ing in STI related fields, academia and research organizations in particular.
3.2.2. Concepts
Academic Work and Employment
Only a minority of those who earn a doctoral degree stay in academia, most will take up a position in another employment sector (Teichler et al., 2013, p. 11). Figures from two European countries illustrate the dimensions of doctorate holders continuing their careers within and out-side academia:
• Data from the United Kingdom tells that only the small minority of 0.45% of sci-entific careers following a PhD will result in the position of a professor while the majority of 53% of the trajectories are aimed for a career outside science short-ly after earning the PhD and even more doctorate holders will leave academia for a non-scientific career at a later stage of their trajectory in academia (The Roy-al Society, 2011, p. 14). About 17% of careers result in non-university research (industry, government etc.) and about 3.5% of doctorate holders will be perma-nent research staff in higher education (ibid.).
• In Germany, roughly 25,000 doctorate degrees are awarded each year while the number of appointments to the position of a professor is roughly about 650 per year (BuWin, 2013) – which would be about 2.6% of PhDs awarded. Earlier stud-ies on careers of doctorate holders from Germany (e.g. Enders & Kottmann, 2009) report that 60 months after earning the PhD, about 36% of doctorate holders had continuous careers in higher education or public funded research organizations, 27% were pursuing non-research activ-ities in the private sector, continuous employment in private funded R&D was reported in 11% of the cases, and about 11% were pursuing non-research careers in the public sector.
These findings on employment in different sec-tors are supported by data from the Careers of Doctorate Holders (CDH) project and highlight the question whether or not doctorate holders are actually doing what they are primarily trained for – research. Findings of the CDH project show that in all countries included in their study, more than 50% of doctorate holders are working in research, but the ratios vary between countries from 50% to 90% (Auriol, Misu, & Freeman, 2013, pp. 22-23). Additionally, countries show differences of employment of doctorate holders in different sectors – with employment in higher
Study Design
31
education ranging from close to 100% in Poland to less than 40% in the Netherlands, where the business, government, and the private non-profit sectors are more important for the employment of doctorate holders (ibid., p. 24).
Clearly, reaching the position of a professor in a university is the exception and not the norm of an academic career following a PhD, and it should be noted that the close link of research and teaching may only hold true for professors at universities. In light of the figures mentioned above, activities more typical for other employ-ment sectors such as consulting and implemen-tation of new inventions need to be considered as normal tasks of researchers as are other activities referred to by the broad term ‘service’ (Macfarlane, 2005; Culum, Roncevic, & Ledic, 2013; Culum, 2015).
Generally, findings from OECD countries show that doctorate holders are well received on the labour market (Auriol, Misu, & Freeman, 2013, pp. 12-13). Though differences between ca-reers paths and fields of research exist, in gen-eral, unemployment rates do not exceed 2% over all time periods of a career, though the first five years after graduation usually show higher rates of unemployment (ibid., p. 13). Gradu-ates from the fields of engineering and social sciences tend to have the lowest unemployment rates while those from the humanities usually have to expect times without employment more often than graduates from other disciplines (ibid., p. 15). Nevertheless, low unemployment rates should not be mistaken as an indica-tor for stable employment based on indefinite contracts: In particular during the first years after graduation, doctoral graduates have to expect to go through a number of postdoctoral positions (ibid., pp. 15-16).
Academic Career
Careers of scientists and scholars show some profound differences to other careers from peo-ple with academic degrees, the most prominent being the very extensive initial phase. While in most countries, professionals with an academic degree will be considered competent following 1-3 years after graduation, it can take 10-15 years after graduation for academics until they are assumed to be competent and are fully ac-cepted as members of the scientific community (Teichler et al., 2013, p. 15). Additionally, the ini-tial phase of an academic career with the goal of
becoming a professor is highly selective. As indi-cated by the figures above, young scientists and scholars have to pass a number of institution-alized transition points while most have to live on short-term contracts. Even if the career goal is not to become a professor, the initial phase of learning, starting independent research, earn a reputation and finally finding an adequate position can take a long time compared to other occupations.
Creativity
Since the pioneering efforts by Guilford (1950) and Torrance (1962, 1974), the concept of crea-tivity has been widely discussed. For the purpose of this study, we refer to the concept of Sternberg where creativity requires the individual to make use of six distinct but interrelated resources: intellectual abilities, knowledge, styles of think-ing, personality, motivation, and environment (Sternberg, 2006, 2012).
Innovation
Over time, the concept of innovation has changed, and with it, the approaches to meas-uring it. For the purpose of this study, we first refer to the Oslo Manual of the OECD. In its 3rd edition, the Oslo Manual defines innovation as follows: “An innovation is the implementation of a new or significantly improved product (good or service), or process, a new marketing method, or a new organisational method in business practices, workplace organisation or external relations.” (OECD, 2005, p. 46) This provides our study with a broad definition of innovation that goes beyond more narrow definitions that confined innovation to technological product or process innovation as it is commonly found in manufacturing. To emphasize the importance of innovation being driven by individuals, we refer to the research framework ‘Innovation Response Behaviour’ (IRB) as outlined by Goepel, Hölzle, & zu Knyphausen-Aufseß (2012).
3.3. Methodology
3.3.1. Integration of Different Types of Data
An analysis on the state of young scientists and scholars requires the combination of different methods and the integrated analysis of different

32
types of data. Details on each method will be provided in the following subchapters while this subchapter will give an overview of the contri-bution of the two major types of data used to provide evidence of the state of young scientists and scholars: Statistical data (censuses and labour force surveys) and empirical data from focused studies (from both the online question-naire and the semi structured interviews).
• Statistical data: Statistical data on young scientists and scholars collected via censuses and other general labour force surveys are required to provide the most basic information on the target pop-ulation: First of all, a good estimate of the number of doctoral holders in a country is required, and, secondly, data needs to be specific enough to identify relevant sub-groups (e.g. stratification by gender, age, fields of research, level of qualification, and major employment sectors). Without this information, all further research on the population will face the challenge to explain whether or not their sample and the findings are representative for the pop-ulation. Further data from international and national sources can provide basic information on a country in general and employment sectors.
• Empirical data from focused studies: Data from statistical sources are too gen-eral to provide in-depth information and cannot explain changes within the popu-lation: Why do young scientists and schol-ars start or leave a research career? What supports their productivity and creativity, which barriers do they encounter, what challenges do they face? Why do PhD holders leave or return to the country? What factors have an impact on their decisions to work in different employment sectors? Are there different challenges, opportunities, and barriers for subgroups (e.g. female vs. male scientists)? Census-es or labour force surveys usually lack the information to support evidence-based answers to these questions.
The information required to perform such analyses of dynamics within populations of academics is usually obtained via pe-riodic surveys or panel studies focusing on different groups of academic degree
holders.3 Though surveys and panel stud-ies are the most common instruments, qualitative research or a combination of quantitative and qualitative methods in mixed methods designs can provide what data from statistical offices cannot: Contribute to a more differentiated de-scription of the population and help ex-plain changes within the population.
The GloSYS ASEAN regional study draws on statistical data from international and selected national sources for an indicator based descrip-tion of the countries participating in the study and their higher education and R&D systems. The most important contribution of the study to the knowledge on young scientists and scholars stems from the combination of data collected from an online-questionnaire and semi-struc-tured interviews combined in a mixed methods approach where the interviews were used to explain the findings from the questionnaire (‘se-quential explanatory design’; Creswell, 2014).
3.3.2. Indicator based Description of Countries and their Higher Education and R&D System
To provide basic background information on the socio-economic context and the higher educa-tion and research systems of each country, a brief indicator based description is provided in chapter 4.1.
3 National surveys on doctorate holders exist in a number of countries, but they usually have limited international comparability. The only major internatio-nal project collecting internationally comparable data on this group is the “Careers of Doctorate Holders (CDH)” project conducted by the framework of OECD / UNESCO Institute for Statistics / Eurostat (Auriol, 2010; Auriol, Schaaper, & Felix, 2012; Auriol, Misu, & Freeman, 2013). Though including an increasing number of countries, the focus of this project are high-income countries while low- and middle-income countries from Africa, Asia or Latin America are almost completely absent. Other major international research projects with a focus on academic work and careers, such as the Carnegie study (e.g. Altbach, 1996, 1998, 2011; Arimoto & Ehara, 1996; Enders, 1997; Maassen & van Vught, 1996; Teichler 1996) and the follow-up project “The Changing Academic Profession (CAP)” (e.g. Teichler, Arimoto, & Cummings, 2013; Huang, 2011; Huang, Finkelstein, & Rostan, 2014), do distinguish between senior and junior staff, and universities and “other institutions of higher education”, but they focus on the sector of higher education and miss other relevant employment sectors of PhD holders.

33
Issues Covered
In broad terms, the description of countries is based on quantitative indicators on the country and economy, and higher education and R&D systems:
• General information on country and econ-omy: Size of country; population; gross domestic product per capita; employment in agriculture, industry, and service; high technology exports
• Higher Education / R&D Indicators: Government expenditure on tertiary education as percentage of GDP; gross domestic expenditure on R&D (GERD) as percentage of GDP; gross domestic expenditure on R&D (GERD) by source of funds in PPP$; scientific and technical journal articles; enrolment rates in higher / tertiary education; gross graduation ratios for ISCED 6 & 7; researchers (by gender, million inhabitants, sector of em-ployment, sector of employment); gradu-ates from ISCED 8 programmes (PhD)
Data Sources
Data from statistical sources used for this report are almost exclusively from the following inter-national sources:
• UNESCO Institute for Statistics (UIS, data.uis.unesco.org)
• United Nations Statistics Di-vision (unstats.un.org)
• UN data (data.un.org)
• The World Bank (data-bank.worldbank.org)
For Thailand, data was supplemented with the help from the National Science Technology and Innovation Policy Agency (STI), Thailand.
Note on Quality of Data
In general, international statistics on higher ed-ucation and R&D systems are regarded as not highly reliable and have to be taken with a ‘grain of salt’. The first reason that applies to data from all countries is that national definitions and the procedures for collecting data vary substan-tially (Teichler et al., 2013, p. 41). Additionally, the use of Science, Technology and Innovation indicators for studies on knowledge systems in
developing countries needs to be aware of ad-ditional limitations, as characteristics of innova-tion systems in developing countries differ from those that gave rise to the statistical standards (Ellis, Polcuch, & Pathirage 2009, p. 171).
3.3.3. Online Questionnaire
Questionnaire Development
For the GloSYS ASEAN regional study, the ques-tionnaire from the GloSYS precursor study has been thoroughly revised to provide the GloSYS project with an updated ‘core set’ of items and a module on the specific research interest of the GloSYS ASEAN – ‘Creativity and Innovation’ and ‘Bonded PhD programs’– has been developed. The major themes addressed in each part of the questionnaire are as follows:
GloSYS Core Questionnaire
• Education (e.g. BA, MA, and PhD with corresponding academic discipline / field of research, and country where degree was obtained)
• Motivation (e.g. factors that influenced respondents to enter an academic or research oriented career)
• Employment (e.g. employment status, sector of employment, additional sources of income)
• Funding (e.g. funding from own organiza-tion and other sources, kind of research pursued)
• Working conditions (e.g. working hours, work-related satisfaction)
• International mobility (e.g. country of residence, history of international mobil-ity, intention to leave country, preferred destinations, funding for mobility)
• Productivity (e.g. publications, contribu-tion to conferences, patents)
• Performance evaluation (e.g. importance of criteria)
• Collaboration (e.g. on projects and publi-cations)
• Challenges (e.g. lack of mentoring, finan-cial resources, discrimination)
• Support and Mentoring (e.g. importance of different types of mentoring and sup-port, access to childcare)

34
• Career Development and Prospects (e.g. perception of a successful career, career prospects, career change, breaks)
• Personal characteristics / demographics
Modules specific for GloSYS ASEAN
• Creativity and Innovation (e.g. perception of individual abilities, importance of activ-ities in daily work related to creativity and innovation, perception of organization)
• Bonded PhD programmes (e.g. satisfac-tion with PhD programmes in general and particular aspects, funding)
After the first revision and development of new items, the draft of the questionnaire was discussed at the kick-off meeting in Bangkok in November 2014 with GYA members, represent-atives of National Young Academies and other young scientists and scholars from participating countries. A pre-test of the questionnaire was conducted in February 2015 and the question-naire was adjusted. After the online question-naire had been launched, a second adjustment of a limited number of items of the questionnaire was required due to high drop-out from issues that had not surfaced in the pre-test. General-ly, data used for this report is from items that remained unchanged. Where data from adjust-ed items is reported, it is noted.
Ethical Approval
Ethical approval for the GloSYS ASEAN regional study was granted by Polytechnique Montréal. All participants were informed on the use of the data, the right to withdraw at any time, and consented to their data from the questionnaire being used in anonymised form for analysis and publication by accessing the online question-naire.
Participant Recruitment and Data Collection
The link to access the online-questionnaire was distributed via the networks of National Young Academies from Indonesia, Malaysia, and Thai-land, and personal networks of members of the Global Young Academy. Data collection began with the first launch of the online questionnaire in May 2015 and continued until October 2015. After performing data cleaning, a total of 444 questionnaires were analysed. Data cleaning involved the following steps: First, only com-
pleted questionnaire were selected for anal-ysis, i.e. the last question had to be answered but respondents may have skipped questions. Second, the criteria of the GloSYS definition for a ‘young scientists or scholar’ were applied, i.e. having a PhD, the PhD was earned not more than 10 years / 120 months ago, and current-ly living in one of the four countries included in the study. Finally, unreasonable answers were excluded. For an overview on the demographics of the participants, please refer to chapter 3.4.1.
Data Analysis
Data was analysed using descriptive and inferential statistics. During a project meeting in June 2015, preliminary findings based on descriptive statistics were discussed with young scientists and scholars from the participating countries and GYA members. For inferential sta-tistics, regression-type analyses were performed to examine the association between a depend-ent variable and an independent variable with an adjustment for four potential confounding factors (gender, country, academic discipline, and employment sector). Linear regression (with permutations), ordinal regression, and multino-mial logistic regression were applied for continu-ous, ordinal, and nominal dependent variables, respectively. P-values of the association tests were provided. When statistical significance was found, a multiple-comparison analysis was performed to further identify which groups of an independent variable differ. Findings from the statistical analyses of the questionnaire data are reported in chapter 4.2.
3.3.4. Semi-structured in-depth Inter-views
Development of Interview Guideline
To guide our interviews, a semi-structured interview topic guide of open, mapping and probing questions (Legard, Keegan, & Ward, 2003) was developed to explore the following major themes:
• Current Job and Career Development
• Productivity, Creativity and Innovation
• Performance Evaluation
• International Mobility
• Career Goals and Support

35
The interview guideline was developed together with young scientists and researchers contrib-uting to the project at our meetings and in on- going discussions. Each section of the interview started with an open question to encourage participants to discuss the issue at length, and to understand the breadth of the topic from the perspective of the interviewee. Probing ques-tions were used to explore issues at depth. This strategy allowed exploring the perceptions of the participants of their contexts in their own words, while at the same time keeping the conversa-tion focused on the topics of particular interest to the project.
Ethical Approval
Ethical approval for the GloSYS ASEAN regional study was granted by Polytechnique Montréal. All participants were informed on the use of the data, the right to withdraw at any time, and con-sented to their data from the interviews being used in anonymised form for analysis and pub-lication.
Participant Recruitment and Data collection
Recruitment of participants followed a criterion based or purposive sampling strategy (Ritchie, Lewis, & Elam, 2003) to aim for a detailed explo-ration of the breadth of the field. The selection process was guided by the following criteria: Country of residence, gender, and affiliation to different fields of research and working in differ-ent employment sectors (e.g. higher education, research organizations, business enterprise, other). The aim of this sampling strategy is not to achieve statistical representativity of the sample, but to capture the heterogeneity of the field.
In total, 18 in-depth interviews were conducted. All but two participants for the interviews were recruited from the sample of the questionnaire. To account for the requirements of the criterion based sampling strategy, additional efforts were required to include specific combinations of cri-teria in the sample. The interviews were conduct-ed in English language via Skype. All interviews were recorded, one interview had to be exempt from the analysis due to language issues (incom-plete understanding) and technical issues. Due to limited resources, only 18 interviews were transcribed intelligent verbatim. The selection was based on notes taken during the interviews accounting for the aim of the sampling strategy to include a wide range of accounts from different
contexts. For demographics of participants of the interview, please refer to chapter 3.4.2.
Data Analysis
Transcripts were analysed by first chunk coding the data by the major themes of the interview guideline, identifying recurring themes and pre-paring a descriptive analysis. Additional themes or concepts were then developed to construct an index of themes evolving from the accounts of the participants. All data was then labelled using the index of themes and data was sorted by theme or concept to summarize the data to a manageable amount. Though not in every detail, the process followed a procedure referred to as ‘framework analysis’ (Ritchie, Spencer, & O’Con-nor, 2003).
Findings from the analysis of the interview data are reported in chapter 4.3.
3.4. Sample Demographics
3.4.1. Demographics of Participants from Online-questionnaire
In total, 444 complete responses to the ques-tionnaire have been analysed after data clean-ing. To account for the aims of the study and factors that can be considered to have a major impact on the working conditions and career perspectives of young scientists and scholars, an overview of further characteristics of the sample by country is presented below.
General demographics
The average age of the participants was 36 years (average year of birth: 1979). Of all re-spondents, 232 (52%) were female and 212 (48%) were male. Most young scientists and scholars who answered the questionnaire were permanently staying in one of the four countries: 379 (85%) were citizens by birth, 20 (5%) were citizens by naturalization, 26 (6%) were per-manent residents, and only 19 (4%) were non- permanent residents. Slightly more than half of the respondents (N=233, 54%) were married or living in a marriage-like relationship (N=14, 3%) and 186 (43%) were single.
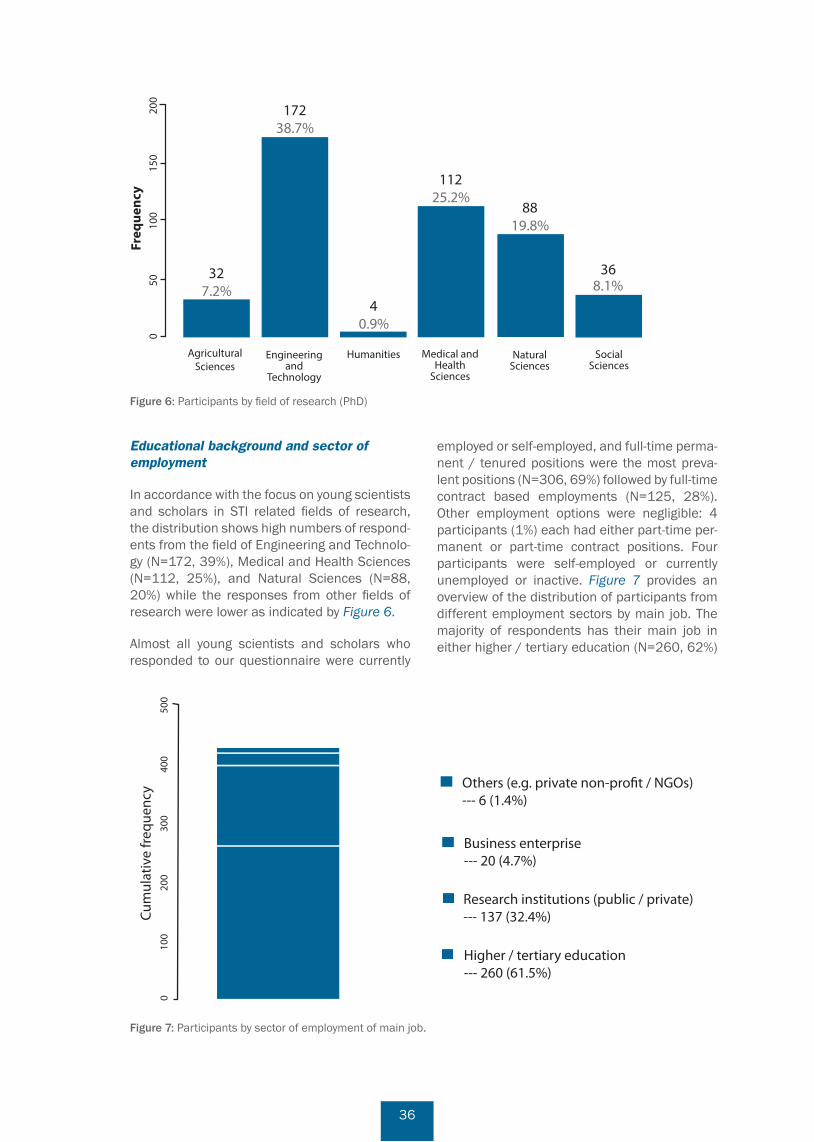
36
Educational background and sector of employment
In accordance with the focus on young scientists and scholars in STI related fields of research, the distribution shows high numbers of respond-ents from the field of Engineering and Technolo-gy (N=172, 39%), Medical and Health Sciences (N=112, 25%), and Natural Sciences (N=88, 20%) while the responses from other fields of research were lower as indicated by Figure 6.
Almost all young scientists and scholars who responded to our questionnaire were currently
employed or self-employed, and full-time perma-nent / tenured positions were the most preva-lent positions (N=306, 69%) followed by full-time contract based employments (N=125, 28%). Other employment options were negligible: 4 participants (1%) each had either part-time per-manent or part-time contract positions. Four participants were self-employed or currently unemployed or inactive. Figure 7 provides an overview of the distribution of participants from different employment sectors by main job. The majority of respondents has their main job in either higher / tertiary education (N=260, 62%)
Figure 6: Participants by field of research (PhD)
Figure 7: Participants by sector of employment of main job.
AgriculturalSciences
Engineeringand
Technology
Humanities Medical andHealth
Sciences
NaturalSciences
SocialSciences
Freq
uenc
y
327.2%
40.9%
11225.2%
8819.8%
368.1%
17238.7%
0
5
0
10
0
150
2
00

37
or in private or public funded research institu-tions (N=137, 32%).
Selected sample characteristics by country
The distribution of participants between coun-tries is highly skewed: 204 (46%) of responses are from Thailand, 155 (35%) are from Malaysia,
45 (10%) are from Indonesia, and 40 (9%) are from Singapore. Within countries, the samples differ with regard to the distribution by field of research (Figure 8), employment sector (Figures 9 and 10), and gender (Figure 11).
In each country, the majority of respondents have earned her or his PhD in either the field of
Figure 8: Participants of questionnaire by country and field of research (PhD)
Figure 9: Proportion of participants of questionnaire by country and sector of employment (in %)
prop
otio
n0
2
0
40
6
0
80
100
Indonesia Malaysia Singapore Thailand
Higher/teriary education Reasearch institutions Business enterprise Others
300
4510.1%
NS/AS Eng/Tech Med/Health Humanities/SS
15534.9%
409.0%
20445.9%

38
Figure 10: Participants of questionnaire by country and sector of employment (Higher education and research organizations)
Figure 11: Participants of questionnaire by country and gender
Natural Sciences or Engineering and Technolo-gy. Respondents from the fields of Medical and Health Sciences and from the field of Agricultural Sciences also contribute major shares to the sample of each country while respondents from the Social Sciences and Humanities have only added minor shares to the sample. As figures for
some fields of research were too low for statis-tical analyses, we decided to cluster the fields of research into four groups based on statistical analysis and informed by existing classifica-tions (OECD, 2007): 1) Natural and Agricultural Sciences, 2) Engineering and Technology, 3) Health and Medical Sciences, and 4) Human-
Freq
uenc
y
Indonesia Malaysia ThailandSingapore
4510.1%
409.0%
20445.9%
155
Male Female
34.9%
0 50
10
0 15
0 20
0 25
0 30
0

39
ities and Social Sciences. The distribution of participants by country and fields of research is presented in Figure 8 below. The higher propor-tion of responses from the first 3 clusters is in line with the aim of the GloSYS ASEAN study to focus on STI related fields of research. Though we tried to reach out for more responses from the social sciences and humanities, we were unable to receive more responses. For a discus-sion on the representativity of the sample for the population of young scientists and scholars in the countries please refer to the section on limitations (Chapter 3.5).
With regard to the distribution across employ-ment sectors, we received most responses from
the higher education sector with the exception of Singapore, where the responses from research organizations outnumbered those from all other sectors (Figure 9). Though we tried to reach out to more young scientists and scholars from the business enterprise sector, we were unable to collect more responses. Due to the low number of responses from business enterprise, only responses from higher education and research organizations were used for comparisons be-tween employment sectors (Figure 10).
Female and male young scientists and scholars participated almost equally across countries (Figure 11), with Malaysia and Thailand report-ing a slightly larger share of female participants
ID Inter-view
Country Employment Sector Gender Field of Research (PhD)
YS-07 Indonesia Higher Education Female Agricultural Sciences
YS-08 Indonesia Higher Education Male Natural Sciences
YS-20 Indonesia Higher Education Female Engineering and Technology
YS-23 Indonesia Higher Education Male Social Sciences
YS-01 Malaysia Higher Education Female Natural Sciences
YS-06 Malaysia Higher Education Male Social Sciences
YS-11 Malaysia Higher Education Female Medical and Health Sciences
YS-13 Malaysia Higher Education Male Engineering and Technology
YS-02 Singapore Business Enterprise Female Engineering and Technology
YS-05 Singapore Business Enterprise Female Medical and Health Sciences
YS-17 Singapore Research Organization Female Medical and Health Sciences
YS-19 Singapore Business Enterprise Male Medical and Health Sciences
YS-22 Singapore Higher Education Male Social Sciences
YS-03 Thailand Research Organization Female Medical and Health Sciences
YS-04 Thailand Higher Education Female Social Sciences
YS-09 Thailand Research Organization Male Natural Sciences
YS-18 Thailand Higher Education Male Engineering and Technology
YS-21 Thailand Research Organization Female Agricultural Sciences
Table 6: Interview participant overview (List)

40
while the samples of Indonesia and Singapore in particular having a higher proportion of re-sponses of male participants.
3.4.2. Characteristics of Participants from Interviews
All participants matched the definition of the tar-get group of a young scientist or scholar provided in chapter 2.2.1., e.g. had earned a PhD no more than 10 years ago and were living in one of the countries participating in our study. Brief information on the participants by combination of criteria is presented in Table 6. An overview of participants by criteria is provided in Table 7.
At the beginning, we had intended to achieve an identical spread across countries, a better distribution across fields of research (PhD) and we would have preferred to include more partic-ipants from the business enterprise sector. Due to the skewed sample of the online question-naire and though we were trying to reach out to additional participants from the business enter-prise sector and particular fields of research, we were unable to recruit sufficient participants to account for a better spread of characteristics. The high number of participants from the higher education needs to be viewed in light of our in-tention to include scholars from the humanities
and social sciences, which are less common in the business enterprise and research organi-zation sector. At the same time, we wanted to include scientists from both natural sciences and engineering working in higher education as well to compare their situation with those from business enterprise and research organiza-tions. Given the requirement of combining four important criteria in a small sample, the result-ing sample frame provides a breadth of per-spectives and still allows for some comparisons between cases.
3.5. Limitations to the Analysis due to Sample Characteristics
At the end of this chapter on the methodology of the study, we want to outline some limitations to the analysis due to the characteristics of the samples for both the statistical analysis of the questionnaire data as well as qualitative analy-sis of the interview data.
Limitations to the statistical analysis of the ques-tionnaire data arise from mainly two sources: First, as outlined in chapter 3.4.1., the distri-butions of participants across countries, fields of research and employment sectors differ to
Criterion No. of Interviews
Country
Indonesia 4
Malaysia 4
Singapore 5
Thailand 5
Employment Sector
Business Enterprise 3
Higher Education 11
Research Organization 4
Criterion No. of Interviews
Field of Research (PhD)
Agricultural Sciences 2
Engineering & Technology 4
Humanities 1
Medical & Health Sciences 5
Natural Sciences 3
Social Sciences 3
Gender
Female 10
Male 8
Table 7: Interview participant characteristics by selection criteria

41
various degrees. In sum, they limit the range of statistical methods and it was required to group sub-samples (e.g. fields of research) or exclude sub-samples (e.g. business enterprise) when clustering respondents from this sub-group with other sub-groups was not supported by statisti-cal analysis. In addition, participation by mem-bers of national young academies (NYAs) has to be observed as membership indicates a specific selection based on academic excellence and possibly other criteria such as service to society. Analysis of the questionnaire data indicates a significantly higher proportion of members of NYAs in the sample of Indonesia than in the sample of Malaysia (p <.01) and the proportion of members of an NYA in Malaysia is significantly higher in comparison to the sample of Thailand (p <.01). Second, the assessment of the repre-sentativity of the sample for the population of young scientists and scholars in the four coun-tries participating in the study would require the knowledge of its size and relevant sub-groups, data which is not at all or only partially available from international sources used for this study. Based on the sources mentioned in chapter 3.3.2., rough figures for the size of the popu-lation of PhD holders are available for 3 of the countries (Indonesia, Malaysia, and Thailand) and are reported in chapter 4.2., but informa-tion on other relevant factors such as fields of research, employment sectors, gender, and age are not readily available across countries. Given the importance of these aspects for the work-ing conditions and career perspectives of young scientists and scholars, the lack of this infor-mation presents a severe limitation to every study on this particular target group not just the GloSYS ASEAN regional study. The data sourc-es used are better at providing the required information on ‘Researchers’, but the defini-tion used to identify this group of persons is too broad4 (e.g. includes persons of different levels of qualification and tasks) to produce informa-tion that would allow to use the information as a reliable proxy.
The sampling strategy for the qualitative analysis of the interview data does not rely on the concept of statistical representativity and is therefore
4 Definition of ‘researcher’ in the Frascati Ma-nual that is being used by international organizations such as the UNESCO or The World Bank: “Researchers are professionals engaged in the conception or creation of new knowledge, products, processes, methods and systems and also in the management of the projects concerned.” (OECD, 2002, p. 93).
independent of the limitations mentioned for the questionnaire data (Ritchie, Lewis, & Elam, 2003, p. 78). The main aim and criterion for the evaluation of possible limitations is whether or not the sample is able to cover all relevant features of a group or of subgroups of a popu-lation. Given our basic criteria for the sampling frame (country, fields of research, employment sector, and gender), we were able to cover an acceptable spread of perspectives. Neverthe-less, the final sample of 18 young scientists and scholars may still be considered too small to cover the full breadth of perspectives. We consider the following factors to be most critical for the assessment of how much the sample is able to cover the relevant features of the popula-tion: First of all, the questionnaire has been pre-sented in English and the interviews have been conducted in English language. Though English is accepted as the lingua franca of academic research, we will have to assume processes of self-selection to apply to both instruments, but they will most probably be stronger for the inter-views than for the questionnaire. In addition, it would have been beneficial to include additional factors or criteria for the sampling process, such as positions in world-class research universi-ties vs. other institutions of higher education or secondary employment in other sectors. In particular the last factor can be considered an interesting aspect to follow up for the analysis of STI related issues, e.g. when work is being conducted in business enterprise and higher education or in a research organization. Though secondary to the first criterion of maximum breadth, systematically minimalizing differenc-es between cases (i.e. all but one of the selec-tion criteria are identical) can also be a fruitful strategy to gain a better understanding of the impact of the differing factor and possible dependencies.

42
4. 4.1. Countries Participating in the Comparative Study
4.1.1. Indicators on Country Characteris-tics and Economy
Indicators on characteristics of the country, its economy, labour market are commonly viewed as relevant information to assess the societal contexts of higher education and research sys-tems. They provide information on potentials and limitations and are therefore required for comparative research to evaluate the findings against the backdrop of the differences between countries.
Figure 12 provides an overview of country size of the countries participating in the study and high-lights the striking differences between them. In addition to the size, other relevant features of a countries’ geography can have a high relevance for its higher education and research systems: In particular Indonesia and Malaysia face the challenge of connecting their scientific hubs. Even though advanced information technologies
allow for new possibilities of communication and exchange, both countries have large are-as of land that are separated by the sea which requires substantial investment in infrastruc-ture and transport to support exchange within its scientific community and with business enterprise. Singapore is the other extreme, with all institutions of higher education, research and the economy concentrated in a single city-state.
Equally remarkable are the differences in the size of the population as illustrated in Figure 13. Assessing the size of a population and its growth rate is imperative to predict demands for educa-tion in general and higher education in particular. As has already been reported in chapter 2.1. with regard to the growth of higher education systems, all Asian countries have seen a rapid increase of gross enrolment ratios in higher edu-cation even though their populations have been growing at the same time.
Figure 14 provides an overview of the gross do-mestic product (GDP) per capita which is a com-monly used indicator to measure the economic wealth of a country. Again, the differences be-tween countries are evident with Singapore
Findings
Figure 12: Country size (in square kilometres). Source: UNdata
1,910,931
2,500,000
1,500,000
500,000
0
1,000,000
2,000,000
Indonesia
330,290
Malaysia
513,120
Thailand
716
Singapore

43
Figure 13: Population. Source: UNdata
Figure 14: GDP per capita (in US$). Source: The World Bank (data from 2014)
taking the position of a singular leader in the region.
In addition to the indicator on economic wealth, the employment in agriculture, industry, and service is commonly used to characterize the economy of a country. Higher proportions of employment in industry and service in particu-lar are widely considered an indicator of an advanced economy. Again, the overview in Figure 15 shows differences but also common-alities between countries: At the one extreme,
the figures for Singapore indicate an economy that is dominated by the service sector, and at the other extreme both Indonesia and Thailand report relatively high proportions of employment in the agricultural sector making this sector highly interesting for rationalization and scientific im-provements of its products.
In the newly aligned national innovation systems, both research organizations and institutions of higher education are expected to contribute to new scientific knowledge and technological inno-
252,182,000
300,000,000
180,000,000
60,000,000
0
120,000,000
240,000,000
Indonesia
30,188,000
5,517,000
67,223,000
Malaysia ThailandSingapore
Indonesia Malaysia ThailandSingapore
5,561
56,287
10,830
3,515
60,000
36,000
12,000
0
24,000
48,000

44
Figure 15: Employment in agriculture, industry, and service (in %) Source: The World Bank (for Indonesia, Malaysia, and Thailand), CIA-Factbook (Indonesia), data from 2014 or latest data available
Figure 16: High-technology exports (in US$). Source: The World Bank (data from 2013)
Figure 17: High-technology exports (in US$). Source: The World Bank (data from 2013)
Indonesia
Agriculture Industry Service
Malaysia ThailandSingapore
100
60
20
0
40
80 44.8
60.3
83.9
37.544.8
60.3
83.9
37.5
21.0
34.3
27.4
12.2 14.8
1.3
20.3
41.9
135,601,531,429
33,901,233,425
60,371,906,718
4,818,332,512
Indonesia Malaysia ThailandSingapore
32,000,000,000
64,000,000,000
96,000,000,000
128,000,000,000
160,000,000,000
0
47
20
44
7
Indonesia Malaysia ThailandSingapore
10
20
30
40
50
0

45
Figure 18: Government expenditure on tertiary education as percentage of GDP (in %) Source: UIS (data from 2013 or latest year available)
Figure 19: Gross domestic expenditure on R&D (GERD) as percentage of GDP Source: UIS (data from 2013 or latest year available; data from Indonesia is from 2009 and should therefore be considered out-dated)
vation with the potential of being commercialised. High-technology exports – products with a high R&D intensity such as computers, pharmaceu-ticals or scientific instruments – can be consid-ered indicators for the capacity of the institutions destined to provide the basis for technological innovation. Figures 16 and 17 below present an overview of the total amount and proportion of high technology of manufactured goods.
4.1.2. Indicators on Higher Education and Research & Development
As noted in chapter 3.3.2., international statis-tics on higher education and R&D systems face various challenges related to different national
definitions and procedures of collecting data. Nevertheless, the data allows presenting a gen-eral picture based on quantitative information on some important aspects of these systems.
Both the government expenditure on tertiary education as a percentage of the GDP (Figure 18) and the gross domestic expenditure on R&D (GERD) as a percentage of the GDP (Figure 19) allow to get an impression on the funding avail-able for the sectors and activities of relevance for young scientists and scholars pursuing a research oriented career. Apart from the differ-ences in scale, the data highlights the empha-sis of the government of Malaysia in keeping its higher education system relatively well funded
1.03
0.71
2.14
0.55
Indonesia Malaysia ThailandSingapore
0.5
1
1.5
2
2.5
0
2.00
0.47
1.13
0.08
Indonesia Malaysia ThailandSingapore
0.5
1
1.5
2
2.5
0

46
to become an international hub of higher educa-tion (Day & Muhammad, 2011; Azman, Sirat, & Ahmat, 2014).
A detailed view on the distribution of the gross domestic expenditure on R&D by source of funds (Figure 20) provides further insight on the relevance of different societal sectors for research funding and can provide an approx-imation on the kind of research being funded: In Malaysia, Singapore, and Thailand the busi-ness enterprise sector is strongest source for research funding followed by funding from the government sector. Singapore in particular and Malaysia to a lesser degree are able to attract a significant percentage of research funding from abroad, highlighting the attractiveness of their research capacities.
Enrolment and Graduation
Increasing the skill level of a population to move from a manufacturing-based to a knowl-edge-based economy has been on the agenda of many countries, and Asian countries have been particularly successful in raising the enrol-ment in higher education (see chapter 2.1. for an overview). Figure 21 provides an overview of gross enrolment ratios for Indonesia, Malaysia, and Thailand, with information on Singapore missing in the UNESCO Institute for Statistics database. Data is also incomplete for Malaysia
regarding different enrolment ratios of female and male students.
Along with the enrolment ratio, the gross gradu-ation ratio from first-degree programmes (ISCED 6: Bachelor, ISCED 7: Master’s degree) is an indi-cator to characterize the output of the higher ed-ucation system. Figure 22 presents an overview for the percentage of students who are able to realize final degrees in tertiary education. Data exists for three countries, Indonesia, Malaysia, and Thailand, though data for Thailand is from 2008 and should be considered out-dated.
The comparison of female and male graduation ratios shows that in Malaysia and Thailand, the graduation ratios of female students are much higher than those of their male counterparts. For Thailand, the relative difference between females and males who successfully enrol and complete their studies has actually increased – for the enrolment in tertiary education, Thailand has a Gender Parity Index of 1.3 which increases to 1.5 for the graduation. Data for Indonesia tells of the inverse direction, where the Gender Parity Index for enrolment is 1.1 and 0.9 for the grad-uation of students. This raises the question why there is higher dropout rate for female students in the higher education sector of Indonesia. Any country that wants to address the discrimina-tion of women and promote equal opportuni-ties in higher education and science in general
Figure 20: Gross domestic expenditure on R&D by source of funds (in %). Source: UIS (data from 2013 or latest year available; data from Indonesia is from 2000 and should therefore be considered out-dated)
Indonesia Malaysia ThailandSingapore
20
40
60
80
100
0
1.1
72.7
1.1
72.7
25.7
60.253.4
40.1
25.7
60.2
4.63.04.63.0 5.9
2.2
38.5
5.92.2
38.5
53.4
40.1
36.7
2.62.7
17.3
36.7
2.62.7
17.3
Business enterprise
Government
Higher education
Private non-prof it
Abroad
Not specf ied
29.729.7
2.52.5

47
Figure 21: Gross enrolment ratio in tertiary education (in %). Source: UNESCO Institute for Statistics (data from 2013)
Figure 22: Gross graduation ratio from first degree programmes (ISCED 6 and 7) in tertiary education (in %). Source: UNESCO Institute for Statistics (data from 2012; data from Thailand is from 2008 and should be considered out-dated)
will need to investigate the causes of particular high drop-out rates of female students (or either gender) to assure that equal shares of qualified female and male students are able to attain the next step for a career in higher education and research.
Large differences between enrolment and grad-uation ratios may also be an indicator for defi-ciencies in the quality of higher education or for other circumstances that increase the drop-out from programmes which, from an economic per-spective, needs to be observed in light of the ob-jective of human capital development. A quan-titative indicator that may provide a first clue
Indonesia Malaysia ThailandSingapore
both sexes female male
50
60
70
30
10
0
20
4031.3
32.929.7
38.5
51.4
58.9
44.0
15.6 15.016.2
21.8
25.2
18.2
30.8
36.9
24.830
10
0
20
40
Indonesia Malaysia ThailandSingapore
both sexes female male

48
is the pupil-teacher ratio in tertiary education (Figure 23). Though data is incomplete for all countries to allow a thorough time series anal-ysis, the existing data may allow for an approxi-mation of trends in the four countries. Figures for both Malaysia and Singapore show a relatively low pupil-teacher ratio and a more or less con-stant level between 2000 and 2013. Develop-ments in Indonesia and Thailand mark opposed trends, with Thailand reducing the ratio between 2000 and 2011 from 37.5 to 20.4 while the ratio in Indonesia almost doubled from 14.4
in 2000 to 27.0 in 2013. For young scientists and scholars working in higher education, these trends will be reflected in their day-to-day duties related to teaching and service to students and will have an impact on the amount of time they can spend on activities related to research and other activities. It has to be noted though that this indicator has to be considered a very rough measure of the impact of teaching duties as there may be large differences between types of study (undergraduate vs. graduate educa-tion), types of institutions (teaching vs. research
Figure 23: Pupil-teacher ratio in tertiary education (headcount basis). Source: UNESCO Institute for Statistics.
Figure 24: Doctoral graduates / Graduates from ISCED 8 programmes (both sexes). Source: UNESCO Institute for Statistics (data for Singapore is missing, data for Indonesia is incomplete)
709522
1051
738881629 568
1283
687
1604
719871 750
1521
2508
20632260
1268
19332119
289828532989
3983 39114104
Indonesia Malaysia Thailand
2002
0
1,000
2,000
3,000
4,000
2003 2004 2005 2006 2007 2008 2009 2010 2011 2012

49
Figure 25: Percentage of female doctoral graduates (in %). Source: UNESCO Institute for Statistics (data for Singapore is missing, data for Indonesia is incomplete).
oriented universities), and between public and private funded institutions of higher education (see ADB, 2011, 2012 and Chapman & Chien, 2014 for different strategies of countries in Asia to address the implications of increasing demand for higher education).
A different group of graduates are doctoral grad-uates (graduates from ISCED 8 programmes) that can be both considered an output of the higher education system as well as the recruit-ment pool for the next generation of scientists and scholars. Data on PhD holders is often missing, and the numbers provided in Figure 24 may be inaccurate for various reasons, e.g. may underestimate the number of PhD holders added to the labour force of a country from inter-national sources such as graduates returning to their countries after completion of a PhD funded by a scholarship programme with the obligation to return home. The UNESCO database does provide information on the gender of doctoral graduates, but additional information on the stratification of the population is missing.
The timeline presented in Figure 24 gives evidence of the development of the number of doctoral graduates in Indonesia, Malaysia, and Thailand. In general, both complete time-lines for Malaysia and Thailand demonstrate a strong increase in the number of graduates be-tween 2002 and 2012: Malaysia now produces more than 5 times the number of PhD holders (from 522 in 2002 to 2,898 in 2012). During
the same time, Thailand reported an increase from 709 graduates in 2002 to 2,119 in 2012, although it had reached a maximum of grad-uates in 2010, when almost 3,000 doctoral degrees were awarded. Time series data for Indonesia is incomplete and shows a sharp drop in 2010. For the short period of time where data is available, the average number of PhDs award may be close to 4,000. These absolute numbers have to be evaluated in light of the differences of the population of the countries reported in chapter 4.1.1. (Indonesia: 252 million, Malaysia: 30 million, and Thailand: 67 million).
Data of the UNESCO Institute for statistics provides information on the share of female doctoral graduates as shown in Figure 25. The time series for Thailand demonstrates the high-est share of female doctoral graduates with a percentage ranging between 50% and 60% since 2002, with a slow but steady decrease since 2009. The time series for Malaysia shows shares of female graduates between 35% and 40%, with a sharp spike in 2011. The data for Indonesia only covers the time between 2009 and 2012 and indicates a steady share of about 40% female doctoral graduates. These figures on the whole population of PhD holders should not be generalized across disciplines or fields of research which would be necessary to iden-tify the existence of a horizontal segmentation of the academic labour market, but data from international sources does not support a more in-depth analysis.
Indonesia Malaysia Thailand
52.9 53.7 55.2
49.8
61.3 60
53.3
57.8 57.454.851.5
49.8
40.939.6
35.536.434
39.339.738.137.3
40.141
35.934.9
2002 2003 2004 2005 2006 2007 2008 2009 2010 2011 2012
010
2030
4050
6070

50
Academic Productivity
One measure for the academic productivity of a higher education and research system is the number of scientific and technical journal arti-cles.5 Due to its definition, this indicator is valua-ble to get an approximation of the academic pro-ductivity related to innovation processes and its contribution to the national innovation system. As it does not include contributions from the social sciences and the humanities, it should not be considered an adequate measure for the entire higher education and research system of a country.
Figure 26 presents an overview of the number of articles from each of the four countries. As absolute numbers they have to be weighed against the characteristics of the measures presented above. The data show that all coun-tries have been able to increase their academic output in science related fields, but different trends have to be noted. Malaysia in particular has been the most successful to increase the number of publications from 3,156 to 17,720
5 Scientific and Technical Journal Articles’ are defined by the World Bank as “The number of scienti-fic and engineering articles published in the following fields: physics, biology, chemistry, mathematics, clinical medicine, biomedical research, engineering and technology, and earth and space sciences. The NSF considers article counts from a set of journals covered by Science Citation Index (SCI) and Social Sciences Citation Index (SSCI).”
between 2006 and 2013, which is both the larg-est absolute and relative growth (562%). Though Indonesia started at a low of 553 publications in these fields, the increase to 2,928 publica-tions equals the second largest relative growth (530%). Thailand, starting at 4,271 publications, managed to more than double (202%) its con-tributions in these fields to 8,631 publications. Singapore, starting as the unchallenged leader in this field with 7,986 has managed to increase its number of publications to 10,659, but has been outpaced by Malaysia since 2009. These figures illustrate the determination of all four countries to invest in innovation oriented fields of research but should also be viewed in light of the aspirations of governments outlined in chapter 2.3 to see their universities highly ranked in world university rankings where the number of publications are considered a major criterion of the evaluation.
Researchers
Along with academic publications and other contributions from higher education, tertiary educated professionals are a second measure of the output of higher education systems. Among all professionals, researchers are the group of highly skilled persons who can contribute to the conception or production of knowledge, prod-ucts, processes, methods and the management of projects (OECD, 2002, p. 93). This definition of the Frascati Manual is commonly used for na-tional and international statistics, and it does
Figure 26: Scientific and technical journal articles. Source: The World Bank.
2006 2007 2008 2009 2010 2011 2012 2013
0
5,000
10,000
15,000
20,000
Indonesia Malaysia ThailandSingapore
7,986 8,015 8,468 8,550
9,617 9,89710,602 10,659
8,6318,3657,553
6,9665,9895,709
3,8513,156
553 542 644 956 1,281 1,769 1,9922,928
4,2714,788
6,216
11,281
14,96215,931
17,720

51
not only refer to PhD holders or even graduates of tertiary education but might also include persons with other kinds of post-secondary degrees. Therefore, information on this popula-tion can only be a rough approximation of the human capital of a country dedicated to research and cannot, for example, serve as a proxy for the assessment of the population of PhD holders. Nevertheless, the information provided can indi-cate further clues on several aspects related to innovation systems of a country.
Figure 27 provides and overview of the number of researchers per million inhabitants of a country and highlights the position of Singapore as a highly advanced country with a high share of its population contributing to its knowledge-based society.
The total numbers of researchers pictured in Figure 28 provide an approximation of the absolute potential of a country that can contribute to research processes. Figure 29 presents the share of female researchers of all researchers
Figure 27: Researchers per million inhabitants (headcount).Source: UNESCO Institute for Statistics (data from 2012 or latest year available; data for Indonesia is from 2009 and should be considered out-dated); data for Thailand is from STI
Figure 28: Researchers (headcount). Source: UNESCO Institute for Statistics (data from 2012 or latest year available; data for Indonesia is from 2009 and should be considered out-dated); data for Thailand from STI
7,252
765
2,593
173
Indonesia Malaysia ThailandSingapore
2,000
4,000
6,000
8,000
0
38,432
88,631
75,257
41,143
Indonesia Malaysia ThailandSingapore
20,000
60,000
80,000
100,000
0
40,000

52
in the countries participating in our study. For both Malaysia and Thailand, the data present evidence that, in general, both men and wom-en participate equally in research processes while for both Indonesia and Singapore, the pro-portion of female researchers is close to 30% and may be an indication that women are less
accepted in the field of research. As the defini-tion of researcher is very broad, the data cannot provide information on the vertical segmenta-tion of the research labour market, e.g. whether or not men tend to be represented stronger in higher positions while female researchers are more restricted to subordinate positions.
Figure 29: Researchers (female, in %).Source: UNESCO Institute for Statistics (data from 2012 or latest year available; data for Indonesia is from 2009 and should be considered out-dated); data for Thailand from STI
Figure 30: Researchers by sector of employment (in %). Source: UNESCO Institute for Statistics (data from 2012 or latest year available; data for Indonesia is from 2009 and should be considered outdated); data for Thailand from STI
29.6
52.749.9
30.6
Indonesia Malaysia ThailandSingapore
10
0
20
30
40
50
60
Indonesia Malaysia ThailandSingapore
20
40
60
80
100
0
Business enterprise
Government
Higher education
Private non-prof it
Not specf ied sectors
64.1
45.2
86.3
54.5
27.0
18.4 5.48.3
6.2
48.515.8
19.5
64.1
45.2
86.3
54.5
27.0
18.4 5.48.3
6.2
48.515.8
19.5

53
Figure 31: Researchers by field of research (in %). Source: UNESCO Institute for Statistics (data from 2012 or latest year available; data for Indonesia is from 2005 and should be considered out-dated); data for Thailand from STI
While Figure 20 on the gross expenditure on R&D by source of funds (see above) provides an indication on where researchers will have to apply for funding, the distribution of researchers between different sectors of employment pre-sented in Figure 30 provides an approximation of where research is being conducted.
The data for the distribution of researchers across employment sectors shows striking differences between countries: In Malaysia, 86% of the researchers are working in the higher education sector making it the single most dom-inant sector where research is being conducted. This has to be viewed in light of the funding structure of the country presented in Figure 20, indicating a share of 60% of funding for research from the business enterprise sector and a share of 30% from the government sector. The other extreme with regard to the distribution of researchers is Singapore, where almost half of the researchers work in the business enterprise sector and slightly less than the other half in higher education. Both Indonesia and Thailand are taking up a middle position with the highest share of research being conducted in higher ed-ucation, but still rather different distributions for research in governmental organizations.
Finally, Figure 31 provides information on the distribution of researchers across different fields of research. Data reported from Singapore tells
of a highly STI related structure of researchers with only 6% of researchers in the social sciences or humanities. Malaysia, though with a higher proportion of researchers in the social sciences otherwise shows a similar structure. Data for both Indonesia and Thailand are highly inconclu-sive, as large shares of researchers are working in not specified fields.
4.2. Findings from Online- Questionnaire
In the following chapter, findings from the online-questionnaire will be reported in three sections: First, issues related to the career and work environment will be presented, including aspects such as the motivation to start a re-search oriented career, working and employ-ment conditions, performance evaluation, and support. The second part of this chapter will fo-cus on aspects of internationalization, such as international collaboration and mobility, and it will provide brief information on bonded PhD pro-grams. In the third and last part of the chapter, findings on the academic productivity of young scientists and scholars will be presented, as will be the findings related to creativity and innova-tion.
Agricultural sciences
Social sciences
Humanities
Natural sciences
Engineering and technology
Medical and health sciences
Not specf ied sectors
19.6
4.03.0
31.6
7.3
18.2
13.4
7.3
11.1
11.1
16.1
6.63.9
42.8
27.6
2.0
16.6
61.0
16.3
3.2
28.1
8.8
8.8
12.8
18.7
19.6
4.03.0
31.6
7.3
18.2
13.4
7.3
11.1
11.1
16.1
6.63.9
42.8
27.6
2.0
16.6
61.0
16.3
3.2
28.1
8.8
8.8
12.8
18.720
40
60
80
100
0Indonesia Malaysia ThailandSingapore

54
4.2.1. Career and Work Environment
Motivation to Start a Research Oriented Ca-reer
As depicted in Figure 32, young scientists and scholars were first of motivated by research related aspects to pick up a scientific career, and second major factor was their wish to apply their knowledge to better or improve the society, each with 91% agreement (including the answering options ‘agree’ and ‘strongly agree’, N=402). Furthermore, a large proportion of respondents reported that they wanted to see their research become a product or service (N=343, 77%), that they appreciated the opportunity to train the next generation of students (N=337, 76%), and that they valued the flexibility of working hours (N=329, 74%) as well as the prospect of collab-oration / networking (N=328, 74%). Very few (16%) respondents entered a research career because they did not have other employment options.
Regarding different motivations to enter a re-search oriented career, job security was men-tioned significantly more often (p <.01) by female scholars and scientists with children indicated significantly than any other group – other women or men with and without children.
Working Conditions
Figure 33 shows the employment status of the participants. Among all young scientists and scholars who responded to our questionnaire, full-time permanent / tenured positions were the most prevalent positions (N=306, 69%) followed by full-time contract based employ-ments (N=125, 28%). Other employment op-tions were negligible: 4 participants (1%) each had either part-time permanent or part-time contract positions.
Highly significant (p <.01) differences exist be-tween countries: Full-time permanent positions are the most common type of employment in Indonesia, Malaysia, and Thailand with a preva-lence of full-time permanent positions between 71% in Malaysia to 91% in Indonesia. Only in Singapore are full-time contract positions the most common form of employment (67.5%) with full-time permanent positions as the sec-ond most common type (22.5%). In our sample, we could not find any significant differences between fields of research or male and female researchers.
In Figure 34, among those 125 participants who work on a full-time contract basis, the majority have committed to one- to three-year contracts (N=98, 80%), with those on a one-year contract outnumbering the other two by around one-third.
Figure 32: Motivation to start an academic or research-oriented career
Other employment not available
Seeing your research become a product or service
Applying knowledge to better/improve society
High social status / respect
Remuneration
Autonomy / freedom to chart career path
Job security
Training the next generation of students
Research (process / f indings)
Collaboration / networking
Work/life balance
Flexibility of workihg hours
Strongly agree Agree Neither agree nordisagree
Disagree Strongly Disagree NA Mean
0 20 40 60 80 100(%)
0 1 2 3 4 5(Mean)
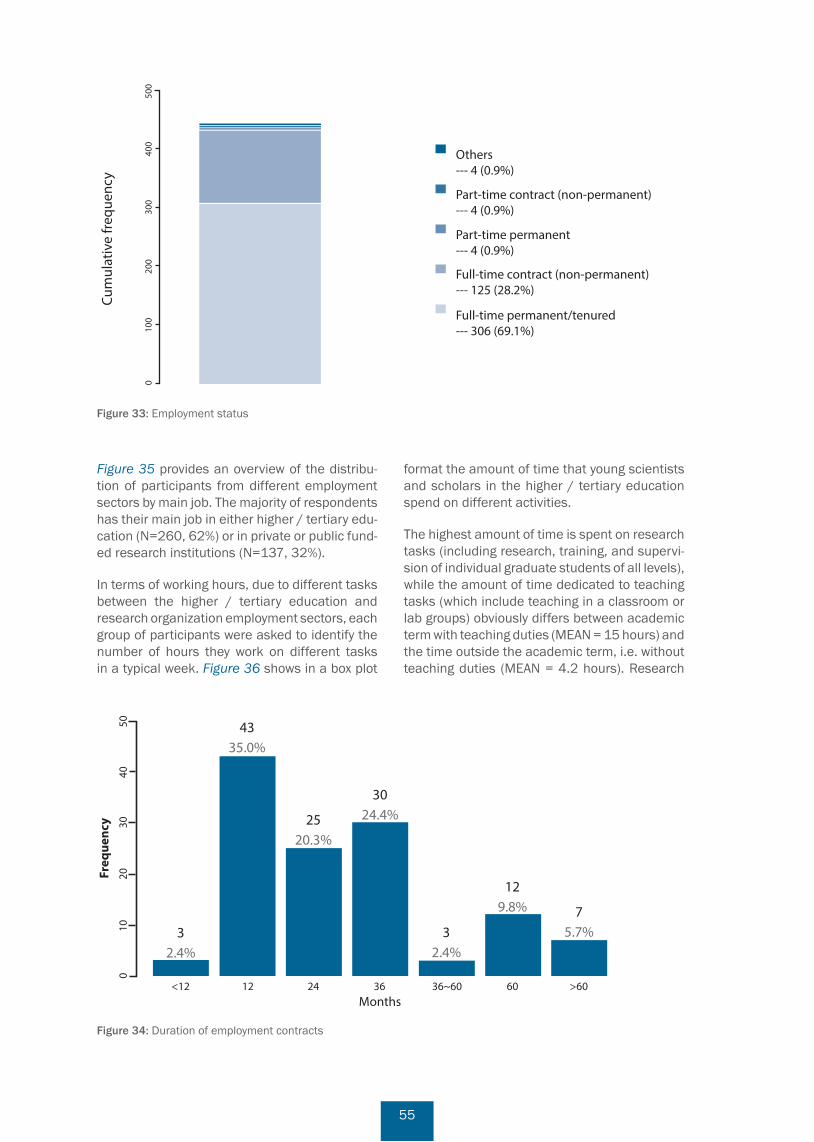
55
Figure 35 provides an overview of the distribu-tion of participants from different employment sectors by main job. The majority of respondents has their main job in either higher / tertiary edu-cation (N=260, 62%) or in private or public fund-ed research institutions (N=137, 32%).
In terms of working hours, due to different tasks between the higher / tertiary education and research organization employment sectors, each group of participants were asked to identify the number of hours they work on different tasks in a typical week. Figure 36 shows in a box plot
format the amount of time that young scientists and scholars in the higher / tertiary education spend on different activities.
The highest amount of time is spent on research tasks (including research, training, and supervi-sion of individual graduate students of all levels), while the amount of time dedicated to teaching tasks (which include teaching in a classroom or lab groups) obviously differs between academic term with teaching duties (MEAN = 15 hours) and the time outside the academic term, i.e. without teaching duties (MEAN = 4.2 hours). Research
Figure 33: Employment status
Figure 34: Duration of employment contracts
Others--- 4 (0.9%)
Part-time contract (non-permanent)--- 4 (0.9%)
Full-time contract (non-permanent)--- 125 (28.2%)
Part-time permanent--- 4 (0.9%)
Full-time permanent/tenured--- 306 (69.1%)
Months
75.7%
129.8%
32.4%
3024.4%25
20.3%
32.4%
4335.0%
>606036~60362412<12
Freq
uenc
y0
10
20
30
40
50

56
Figure 35: Participants by sector of employment of main job
Figure 36: Working hours in higher / tertiary education
tasks, however, remain almost equally high re-gardless of whether they have teaching duties or not (MEAN = 14.4 during an academic term, and 18.8 hours outside an academic term). Another major duty that demands a relevant amount of time is related to administrative tasks (including paperwork, committees, and department meet-ings) that consume much of their time all year round, with approximate 12 hours per week on average – more than the time spent on teaching.
We did not find any significant differences be-tween fields of research, countries or gender.
For those working in the research organization sector, as depicted in Figure 37, most of their working hours are allocated to research, training and supervision (MEAN = 34 hours per week). While young scientists in the higher education sector cannot focus on research alone as they have teaching and other duties particular to this
Higher / tertiary education--- 260 (61.5%)
Research institutions (public / private)--- 137 (32.4%)
Business enterprise--- 20 (4.7%)
Others (e.g. private non-pro�t / NGOs)--- 6 (1.4%)
Cum
ulat
ive
freq
uenc
y
0 10
0 20
0 30
0 40
0
500
020
4060
80
Resp. num 259(99%)
259(99%)
259(99%)
259(99%)
259(99%)
259(99%)
259(99%)
259(99%)
259(99%)
259(99%)
259(99%)
259(99%)
259(99%)
259(99%)
259(99%)
259(99%)Resp. rate
Hou
rs
Teaching etc Research etc Administration
Without teaching duties
Service Consulting etc Fund-raising Other Total
With teaching duties

57
Figure 37: Working hours in research organizations
Figure 38: Satisfaction with working conditions
employment sector, those in research organiza-tions sector can focus better on their core task, but as in higher education, administrative tasks also consume a relevant amount of time (MEAN = 15 hours per week).
In the business enterprise sector, most of the time is spent on research, training and super-vision (MEAN = 23 hours per week), followed by consulting or the implementation of research (MEAN = 13.6 hours per week), and manage-
ment / administration tasks (MEAN = 12.5 hours per week). As only 4.7% of the respondents are working in the business enterprise sector, it was decided to focus the analysis on the two major employment sectors.
Figure 38 provides an overview of the satisfac-tion of young scientists with different aspects of their working conditions. Around 70% of the par-ticipants are either satisfied or very satisfied with their overall working conditions. The aspect with
Resp. num 58(42.3%)
57(41.6%)
45(32.8%)
43(31.4%)
33(24.1%)
26(19.0%)
24(17.5%)Resp. rate
020
4060
80
Hou
rs p
er w
eek
Researchetc
Administration Service Consultingetc
Fund-raising Other Total
Very satisf ied Satisf ied Unsure Dissatisf ied Very dissatisf ied NA Mean
Overall satisfaction
Work content
Career options / Advancement
Appropriateness of qualif ication for position
Challenging tasks
Contribution to society
Infrastructure (e.g. rooms, equipment)
Working hours (�exibility)
Working hours (scope / extend)
Job security
Income
Social Status
0 20 40 60 80 100(%)
0 1 2 3 4 5
(Mean)

58
which young scientists are satisfied the most is the flexibility of working hours (76%), followed by challenging tasks and social status (74% each), and appropriateness of qualification for position (72%). The aspects they are least satisfied with are infrastructure such as rooms and equipment (44%) and income (47%).
Our data indicates very few significant differ- ences between subgroups, and these only refer to differences between countries: Young scien-tists and scholars from Malaysia and Singapore rated their satisfaction with income significantly higher (p <.01) than those from Thailand. Comparing with all other countries, the highest satisfaction related to infrastructure is reported
Figure 39: Persons evaluating the performance of young scientists and scholars in higher / tertiary education or research organizations
Figure 40: Persons evaluating the performance of young scientists in business enterprise
Freq
uenc
y
0 10
0 20
0 30
0 40
0
Your service Your managementYour teaching
Yourpeers...
Your research
116
(30.
69%
)15
3 (4
0.48
%)
101
(26.
72%
)10
6 (2
8.04
%)
Othermembers...
58 (1
5.34
%)
100
(26.
46%
)86
(22.
75%
)84
(22.
22%
)Yourself... No one...
148
(39.
15%
)18
8 (4
9.74
%)
146
(38.
62%
)15
1 (3
9.95
%)
Seniorsta�...
90 (2
3.81
%)
148
(39.
15%
)12
1 (3
2.01
%)
119
(31.
48%
)
Externalreviewers
39 (1
0.32
%)
183(
48.4
1%)
41 (1
0.85
%)
40 (1
0.58
%)
20 (5
.29%
)
33 (8
.73%
)32
(8.4
7%)
22 (5
.82%
)
Yourstudents
260
(68.
78%
)39
(10.
32%
)42
(11.
11%
)23
(6.0
8%)
Thehead...
215
(56.
88%
) 311
(82.
28%
)26
2 (6
9.31
%)
247
(65.
34%
)
Your managementYour training and supervision Your research
Freq
uenc
y
0 5
10
15
20
Yourpeers...
4 (1
9.05
%)
8 (3
8.1%
)9
(42.
86%
)
Othermembers...
3 (1
4.29
%) 6 (2
8.57
%)
8 (3
8.1%
)
Yourself... No one...
8 (3
8.1%
)12
(57.
14%
)14
(66.
67%
)
Seniorsta�...
3 (1
4.29
%) 7
(33.
33%
) 10 (4
7.62
%)
Externalreviewers
5 (2
3.81
%)
4 (1
9.05
%)
5 (2
3.81
%)
3 (1
4.29
%)
Yourstudents
5 (2
3.81
%)
6 (2
8.57
%)
Thehead...
9 (4
2.86
%)
16 (7
6.19
%)
19 (9
0.48
%)

59
Figure 41: Perception of importance of criteria for performance evaluation
from Singapore (p <.01), while early career researchers from Indonesia reported a signif-icantly higher satisfaction related to academic freedom (p <.01).
Performance Evaluation
The majority (95.9%) of young scientists participating in the GloSYS ASEAN study are evaluated by their organization. These par-ticipants were asked to provide the informa-tion as to who evaluates which tasks they are performing (teaching, research, service, and management tasks). In Figure 39, we can see different groups of stakeholders from inside and outside the organization participating in the performance evaluation in the higher / tertiary education and research organizations. Superi-ors, such as the head of the department or unit, play a major role in evaluating all performance of young scientists, be it teaching, research, service, or management. Students, who are a key stakeholder in higher education, take a large part in evaluating the teaching performance of young scientists (68.8%) while external review-ers are there to mainly evaluate their research (48.4%). Figure 40 illustrates how performance evaluation is conducted in the business enter-prise sector, which is different from that in higher / tertiary education or research organizations, in that there is a stronger focus on the evaluation
of management tasks; and those who play a major role in performance evaluation are the head of the department or unit and young scientists respectively. Again, the small number of respondents (N=20) in the business enter-prise sector should be taken into consideration.
Figure 41 presents an overview of the percep-tion of young scientists and scholars related to which criteria are most important in assessing their performance. It is the perception of most young scientists and scholars that the number of publications is the most important criterion (88%, including ‘important’ and ‘very impor-tant’), followed by the reputation of the journals chosen for publication (84%). The ability to attract funding, i.e. attain grants (83%) is also considered a very important criterion, while the least important aspects in assessing their performance seem to be international mobility (58%) and the number of patents (60%).
Our data indicates few significant differences regarding which criteria are perceived as par-ticularly important by different subgroups. It may not come as a surprise that young scientists with a PhD in natural / agricultural sciences, engineering and technology, and medical sciences rated the importance of patents signif-icantly higher (p <.01) than young scholars with a PhD in the humanities or social sciences. With-out getting into details, significant differences
0 1 2 3 4 5
(Mean)
0 20 40 60 80 100(%)
Societal impact
International mobility
Committee work
Mentoring of students
Teaching evaluations
Interdisciplinary work
Outreach
Awards
Grants
Number of conference presentations
Bibliometric measures (e.g. impact factor, h-index)
Reputation of tha journals chosen for publication
Number of patents
Number of citations
Number of publications
Very Important Important Neither importantnor unimportant
Unimportant Very unimportant Not applicable NA Mean
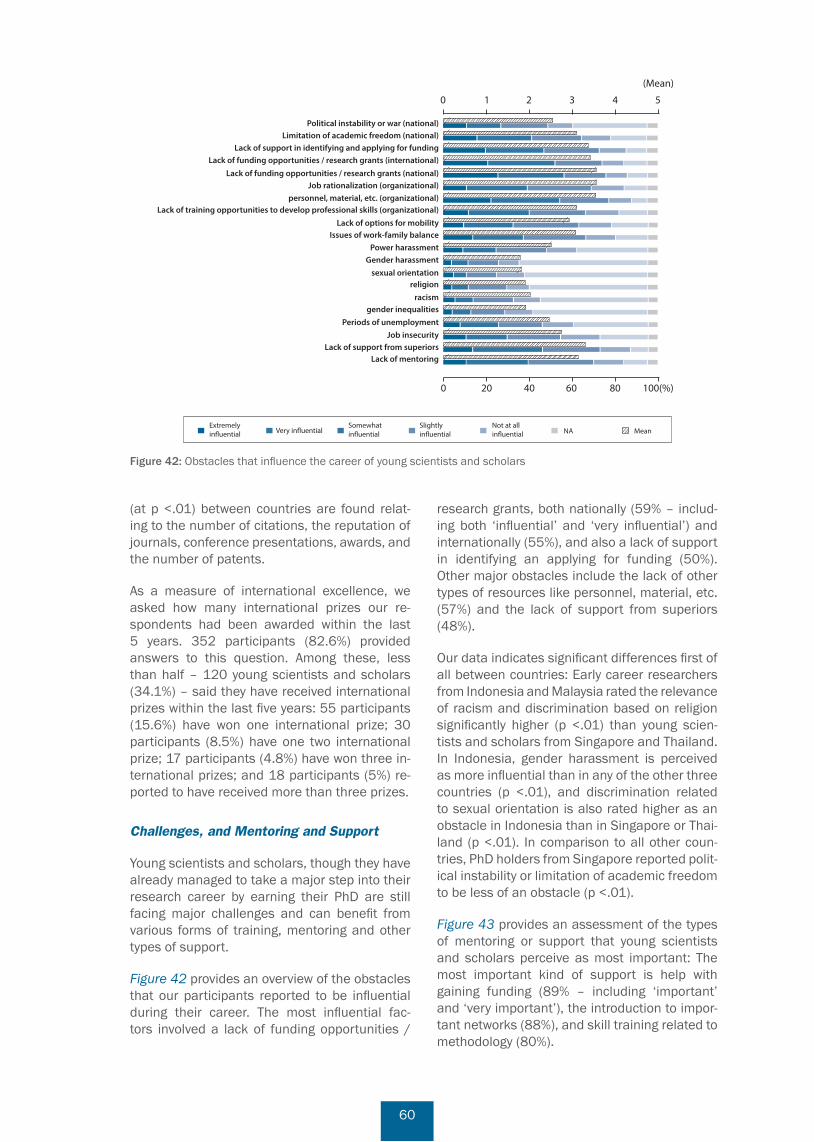
60
(at p <.01) between countries are found relat-ing to the number of citations, the reputation of journals, conference presentations, awards, and the number of patents.
As a measure of international excellence, we asked how many international prizes our re-spondents had been awarded within the last 5 years. 352 participants (82.6%) provided answers to this question. Among these, less than half – 120 young scientists and scholars (34.1%) – said they have received international prizes within the last five years: 55 participants (15.6%) have won one international prize; 30 participants (8.5%) have one two international prize; 17 participants (4.8%) have won three in-ternational prizes; and 18 participants (5%) re-ported to have received more than three prizes.
Challenges, and Mentoring and Support
Young scientists and scholars, though they have already managed to take a major step into their research career by earning their PhD are still facing major challenges and can benefit from various forms of training, mentoring and other types of support.
Figure 42 provides an overview of the obstacles that our participants reported to be influential during their career. The most influential fac-tors involved a lack of funding opportunities /
research grants, both nationally (59% – includ-ing both ‘influential’ and ‘very influential’) and internationally (55%), and also a lack of support in identifying an applying for funding (50%). Other major obstacles include the lack of other types of resources like personnel, material, etc. (57%) and the lack of support from superiors (48%).
Our data indicates significant differences first of all between countries: Early career researchers from Indonesia and Malaysia rated the relevance of racism and discrimination based on religion significantly higher (p <.01) than young scien-tists and scholars from Singapore and Thailand. In Indonesia, gender harassment is perceived as more influential than in any of the other three countries (p <.01), and discrimination related to sexual orientation is also rated higher as an obstacle in Indonesia than in Singapore or Thai-land (p <.01). In comparison to all other coun-tries, PhD holders from Singapore reported polit-ical instability or limitation of academic freedom to be less of an obstacle (p <.01).
Figure 43 provides an assessment of the types of mentoring or support that young scientists and scholars perceive as most important: The most important kind of support is help with gaining funding (89% – including ‘important’ and ‘very important’), the introduction to impor-tant networks (88%), and skill training related to methodology (80%).
Figure 42: Obstacles that influence the career of young scientists and scholars
(Mean)
Political instability or war (national)Limitation of academic freedom (national)
Lack of support in identifying and applying for fundingLack of funding opportunities / research grants (international)
Lack of funding opportunities / research grants (national)Job rationalization (organizational)
personnel, material, etc. (organizational)Lack of training opportunities to develop professional skills (organizational)
Lack of options for mobilityIssues of work-family balance
Power harassmentGender harassment
sexual orientationreligion
racismgender inequalities
Periods of unemploymentJob insecurity
Lack of support from superiorsLack of mentoring
Extremelyin�uential
Somewhatin�uential
Slightlyin�uential
Not at allin�uentialVery in�uential NA Mean
0 20 40 60 80 100(%)
0 1 2 3 4 5

61
Our data indicates that early career researchers from Indonesia, Malaysia, and Singapore almost consistently rated the importance of most types of support or mentoring significantly higher than PhD holders from Thailand (p <.01). Neverthe-less, as indicated in Figure 42 above and as a result of the in-depth statistical analysis, we could not find differences between countries with regard to a perceived lack of mentoring. With regard to differences between academic
disciplines, early career researchers from natu-ral / agricultural sciences and medical sciences rated skill trainings both related to academic writing and management significantly higher (p <.01) than those PhD holders from engineer-ing and technology.
Figure 44 shows who young scientists and schol-ars would ask for career advice. There are three major groups of people who are important to
Figure 43: Importance of different types of mentoring or support
Figure 44: Groups of people that young scientists and scholars address for career advice
Very Important Important Unimportant Very UnimportantNeither importantnor un-important NA Mean
Management
Presentation of results
(Scienti�c) Writing
Fundraising
Methodology
Family / care-related support
Gain funding
Attain a position / job via direct intervention throughpersonal resources (of the mentor / supporter)
Introduction to important networks
Advice on career decisions
(Mean)
0 1 2 3 4 5
0 20 40 60 80 100(%)
Career advisor / Career o�cer
Friends / family
Superior
Mentor
Colleagues from the same gender
Colleagues from other countries
Colleagues from other research �elds in the same country
Colleagues from other units in the same country
Colleagues from same a�liation
0 20 40 60 80 100(%)
(Mean)
0 1 2 3 4 5
Very Important Important Unimportant Very unimportantNeither importantnor un-important NA Mean

62
young scientists and scholars in terms of career advice: mentors (82% – including ‘important’ and ‘very important’), superiors and colleagues from same affiliation (80% each). Career advi-sors or officers, however, do not have a signifi-cant position in providing career advice (53%).
Having a child or children is an important decision in the life of every person, but in a particularly time intensive career path such as in higher education and research, the decision to have children is widely seen as a predicament – in particular for female young scientists and schol-ars. We therefore asked our participants whether or not they have access to adequate child-care. Figure 45 shows that most respondents do not consider this applicable to their current situation, and out of 153 (37.8%) respondents that answered, 107 (26.4%) have access to ade-quate childcare while 46 (11.4%) have not. Only considering those who chose to answer, almost one third of the participants report to not have access to adequate childcare. Statistical differ-ences exist between countries, with young scien-tists and scholars from Indonesia and Malaysia stating more often than early career researchers from Thailand having adequate access to child-care (p <.01).
Career Development
What makes up a successful career in the view of young scientists includes both personal and societal aspects. In order to be successful
in their career, the majority of young scientists agree that they need to be enjoying the work that they do (97% – including ‘agree’ and ‘strongly agree’) while maintaining a good work / life balance (93%). Continuous advancement (91%) is another key attribute towards a suc-cessful career. The societal aspects have a little less impact than personal ones but still play a significant part: 89% stated that doing good for humanity and being recognized in the scientific community could contribute to their success. Young scientists do not value the income as much as other attributes as can be seen from the lower percentage of respondents who agree with the ‘earning a lot of money’ attribute (68%).
About 70% of 420 respondents are quite confi-dent that their scientific oeuvre is good enough to build an academic research career on, and over half of the respondents (53%) are quite positive about their career prospects.
Organizational Support
Do young scientists and scholars feel that they have the support to engage uncertain and risky research? We asked our participants how they perceived the support from their organizations with regard to various aspects related to the conduct of research. Figure 46 provides an over-view of their perceptions. With regard to organi-zational support, especially to enhance creativity and innovation of young scientists, three key factors could be said to be crucial to the young
Figure 45: Ability to access adequate childcare
Cum
ulat
ive
freq
uenc
y
0 10
0 20
0 30
0 40
0
500
Yes--- 107 (26.4%)
No--- 47 (11.4%)
Not applicable--- 252 (62.2%)

63
scientists’ research career, namely networking / exchange of knowledge or expertise, empower-ment, and leadership. Judging from the respons-es, the organizations do best in supporting exchange between academia and industry (66% – including ‘agree’ and ‘strongly agree’) and facilitating opportunities for valuable, professional exchange (66%). Another highly rated aspect is the perception of the young scientists and scholars that their organizations put trust in their employees (57%). From the view of the participants, the organizations do least well with regard to providing enough time to pur-sue rigorous research, providing necessary staff and other resources, and in handling failure that results from uncertain and risky research. These figures may provide a first assessment of where organizations do relatively good and where they need to improve the most, but it remains up to each organization and other decision makers to provide guidance on the question of the propor-tion of positive responses that should be consid-ered a benchmark.
Statistically relevant differences between sub-groups are almost non-existing, with PhD holders from Singapore reporting a stronger agreement to the question whether or not their organization supports exchange between academia, industry, and research organizations (p <.01).
4.2.2. Internationalization and Mobility
In chapter 2.2, we discussed the concepts of glo-balization, internationalization, and regionaliza-tion and highlighted their relevance for different countries and individual careers. The following chapter will provide an overview of findings from the questionnaire on two aspects of internation-alization: collaboration and international mobility of academic staff.
Collaboration
Findings on international and regional collabora-tion are presented together with the findings on other types of collaboration, such as collabora-tion between different employment sectors and other possible aspects to provide a comparison between various types of national and interna-tional / regional collaboration.
Not surprisingly, we found that most collabora-tions occur within the organization especially in universities or research organizations (69% - including ‘often’ and ‘very often or always’) as depicted in Figure 47. Collaboration across genders is also widely practiced in this region (57%) as well as collaboration with other univer-sities or research organizations within the same country (41%). However, collaboration with re-searchers from private companies (9%) is still
Figure 46: Support from organization
Strongly agree Agree Neither agree nordisagree
Disagree Strongly Disagree NA Mean
0 20 40 60 80 100(%)
(Mean)
0 1 2 3 4 5
puts trust in its employees
looks for reasos for failure rather than wrongdoers
provides necessary funding to pursue innovation
provides necessary sta� to pursue innovation
provides necessary equipment to pursue innovation
shows openness for change of processes and regulations...
encourages critique of existing processes and regulations...
has leaders who support creativity and innovation
is able to recognize creativity and innovation
provides enough time to pursue rigorous research
handles failure that results from uncertain and...
supports exchange between academia, industry, and...
facilitates opportunities for valuable, professional exchange
encourages curiosity
rewards individuals for being creative and innovative
rewards groups for being creative and innovative

64
uncommon and so is collaboration with partners from other countries in the region (14%). With regard to regional collaboration in ASEAN, the data shows that our respondents seem to have better connections to countries from a different continent than to countries within the region.
Figure 48 shows a similar trend for collaboration on research projects. As most of our respond-ents come from the higher education sector or a research organization, collaboration on projects will almost certainly result in collaborations on publications as presented above. Again, most
Figure 47: Collaboration on publications
Figure 48: Collaboration on research projects
0 20 40 60 80 100(%)
(Mean)
0 1 2 3 4 5
Researchers from private companies
Researchers from the other gender
Researchers from other disciplines / research �elds
Researchers from other countries (other continent)
Researchers from other countries (same continent)
Researchers from other universities or researchorganizations in your own country
Researchers from own university / research organization
Very often oralways Often sometimes Rarely
Never or very rarely NA Mean
Very often oralways Often sometimes Rarely
Never or very rarely NA Mean
0 20 40 60 80 100(%)
(Mean)
0 1 2 3 4 5
Researchers from the other gender
Researchers from other disciplines / research �elds
Researchers from other countries (other continent)
Researchers from other countries (same continent)
Researchers from other organizations in your owncountry
Researchers from own university / organization
65
collaborations on research projects will include partners from their own university or research organization (69% – including ‘often’ and ‘very often or always’), with researchers from the other gender (56%), and with researchers from other organization in the country (45%). Collab-oration within the region remains low (18%) and is even less frequent than collaboration with partners from countries on a different continent.
Our data indicates that, in general and in varying combinations, international / regional collabora-tion on research projects and publications is sig-nificantly more common in the medical sciences and natural / agricultural sciences than in the humanities and social sciences (p <.01). Higher levels of collaboration on publications on the same continent were reported from Indonesia (p <.01), and Thai young scientists and scholars reported less collaboration with other research-ers from other continents than any other country (p <.01).
International Mobility
The respondents are currently residing or work-ing in one of the four ASEAN countries partici-pating in the study, namely Indonesia, Malaysia, Singapore, and Thailand with skewed distribu-tion across countries (see Chapter 3.4.1., Figure 8). Below, we will provide findings on funding for past international mobility, intentions to leave the current country of residence, reasons related to leave or return to their country, and finally aspects related to bonded PhD programs / pro-grams with the obligation to return home.
With regard to their history of international mobility during the last 10 years, 72% of the participants responded to have lived, worked or study abroad at least once for 3 months or more. The highest levels of international mobility in our study were reported from Indonesia (88.9%), Thailand (78.2%), and Singapore (69.2%) with Malaysia (59.5%) reporting the lowest rate of international mobility.
The majority of respondents (90.5%) received funding and/or support to facilitate work or study abroad, 64.4% of which participated in a bonded program while 26.1% received funding without a bonded condition. In terms of fund-ing to support their mobility over the past ten years, slightly more than half of the respond-ents agreed (53.9% – including ‘agree’ and ‘strongly agree’) that the funding was sufficient
to cover the costs of mobility while 27.2% disa-greed or strongly disagreed that the funding was sufficient.
The Figures 49-51 presented below provide an overview on intentions to leave the country, pre-ferred destinations, and the most important rea-sons for the intended stay abroad, respectively. With regard to the mobility of the young scien-tists and scholars in the near future, it seems unlikely that the majority will be internationally mobile in the next 12 months: around 68.9% do not plan to leave the country where they are currently residing or working. This figure needs to be assessed in light of the fact that 191 (43%) respondents participated in a scholarship or similar program with the obligation to return, which may still demand of them to stay in their home country to fulfil the requirements of the bonded program (see section on Bonded PhD programs below). For those who plan to go abroad, only a few (7.8%) intend to leave the current country permanently whereas the remaining 23.3% intend to temporarily leave the current country for at least three months.
The most preferred countries for their intended stays abroad within the next 12 months (Figure 50) include first of all the United States (23.8%), followed by the United Kingdom (19.2%), and Japan (15.4%). Only 9 participants and there-fore less than 7% of those who intend to leave their countries in the next 12 months, named countries in Southeast Asia as their preferred destinations. The most important reasons why these young scientists intend to go overseas (Figure 51) are related to research as well as improving their competency and networking: to develop or continue their research work (92% – including ‘important’ and ‘very important’), to acquire skills or new techniques (92%), to have better access to collaboration networks (89%), and to have better prospects for career advance-ment or personal development (87%).
When asked about their view on internation-al mobility, most respondents are concerned about being apart from family and friends (69% – including ‘important’ and ‘very important’) as much as having to worry about finding work after the contract ends (69%). Many young scientists are also concerned about the risk of being dis-appointed in the new job environment (61%) and doubt the benefit of mobility for future career prospects (61%). An environment dominated by scholars from the other gender, however, is not a

66
Figure 49: Intention to leave the current country within the next 12 months
Figure 50: Preferred destination of stays abroad within the next 12 months
Figure 51: Reasons why young scientists intend to leave the current country
Cum
ulat
ive
freq
uenc
y
0 10
0 20
0 30
0 40
0
500
Yes, permanently--- 34 (7.8%)
Yes, temporarily (for at least threemonths)--- 102 (23.3%)
No--- 301 (68.9%)
107.7%
129.2%
2015.4%
2519.2%
3123.8%
1410.8%
96.9%
43.1%
53.8%
Others
Others
in Europe
Others
in Asia
United States
United Kingdom
SingaporeJapan
Germany
Australia
Freq
uenc
y
0 10
20
30
40
Very Important Important Unimportant Very UnimportantNeither importantnor un-important NA Mean
0 20 40 60 80 100(%)
(Mean)
0 1 2 3 4 5
Political or immigration reasons...
Family or personal reasons
Better prospects for career advancement or...
Better access to collaboration networks
Better access to research grants
Create own research team or new research area
Acquisition of skills or new techniques
Work in an area that does not exist in current country
Development or continuity of research work
More prestigious institution
Better salary/income
Other job related or economic factors...
Obligation to return to my home country...
End of short visiting research, postdoc or job contract

67
major concern since almost half of the respond-ents (40%) view this as unimportant. The overall views are portrayed in Figure 52.
Figure 53 provides an overview of the findings on reasons for young scientists and scholars to return to their home country. Most important are family or personal issues (84% - including
‘important’ and very important’), followed by job-related or economic factors such as being sent by an employer, guarantee or offer of a job, bonded educational scholarship program (76%), the possibility of creation of own research team or new research area (73%), and the develop-ment or continuity of research work (71%).
Figure 52: Views on different aspects of international mobility
Figure 53: Reasons to return to home country
Very Important Important Unimportant Very UnimportantNeither importantnor unimportant NA Mean
0 20 40 60 80 100(%)
(Mean)
0 1 2 3 4 5
Di�cult Language and culture
Tough economic climate
Environment dominated by scholars from the other gender
Changing your entire life for just a short period oftime
Being apart from family and friends
Doubting the bene�t of mobility for personaldevelopment
Doubting the bene�t of mobility for future careerprospects
Leaving your professional network behind
Risk of being disappointed in the new job environment
Having to adapt to unfamiliar environment
Having to worry about �nding work after the contractends
Strongly agree Strongly disagreeAgree DisagreeNeither agree nor disagree NA Mean
Political or immigration reasons...
Family or personal reasons
Better prospects for career advancement or...
Better access to collaboration networks
Better access to research grants
Possibility of creation of own research team or newresearch area
Acquisition of skills or new techniques
Work in a speci�c area not existent inside the countryyou are currently working
Development or continuity of research work
More prestigious institution
Better salary/income
Job related or economic factors...
0 20 40 60 80 100(%)
(Mean)
0 1 2 3 4 5

68
Bonded PhD Programs
Less than half of the respondents (N=191; 43.1%) have participated in a bonded schol-arship program to obtain their PhD abroad or a similar program with the obligation to return to their home country. Among these 191 respondents, 62.3% agree or strongly agree that they would not have been able to realize their PhD abroad without such a bonded program. However, there are 23.6% who disagree or strongly disagree to this.
In terms of overall satisfaction towards the program, as shown in Figure 54, about 55% are satisfied or very satisfied with the program and the aspect they are mostly satisfied is the requirement to receive a degree in a limited time (71% – including ‘satisfied’ and ‘very satisfied’) whereas the aspect they are most dissatisfied with is the obligation to return home immediately after the completion of PhD (47% – including ‘very dissatisfied’ and ‘dissatisfied’).
Among these 191 respondents who have partic-ipated in the bonded PhD program, the majority (44%) would choose to stay in the host country for up to three years after the completion of their PhD if the opportunity arose; and after that
period of three years was over, around 60% would now choose to return to their home coun-try. After returning to their home country from the bonded program, if the same amount of repaying back working time condition would apply, they tend to consider the government and private sectors as equally attractive.
Data indicates only a single significant differ-ence between subgroups related to levels of satisfaction with bonded PhD programs: Young scientists and scholars from Thailand and Indo-nesia are significantly more satisfied with the amount of budget for the scholarship than those from Malaysia (p <.01).
4.2.3. Funding, Productivity, and Creativi-ty and Innovation
Funding
Asking for the sources of funding of research can provide information on different aspects: First, we wanted to know how much the young researchers are can depend on receiving fund-ing for research from their own organization. High proportions indicate that they need or cannot reach out to other donors and will there-fore have to answer to stakeholders within their
Figure 54: Satisfaction with Program with the Obligation to Return HomeNote: The difference in the number of respondents to the ‘Overall satisfaction’ and all sub-aspects is due to a change of sub-items of this question between batch 1 and 2 (see section on methodology for further information).
Very satis�ed Satis�ed UnsureVerydissatis�ed Not applicableDissatis�ed NA Mean
(Mean)
0 1 2 3 4 5
0 20 40 60 80 100(%)
Required to work for a speci�c amount of time in yourhome country
Required to return to a speci�c workplace in your homecountry
Restriction to move or transfer to another employmentsector
Dependability on scholarship payment in timely manner
Amount of budget for scholarship
Overall satisfaction
Obligation to return home immediately after completionof PhD
Requirement to receive degree in a limited time
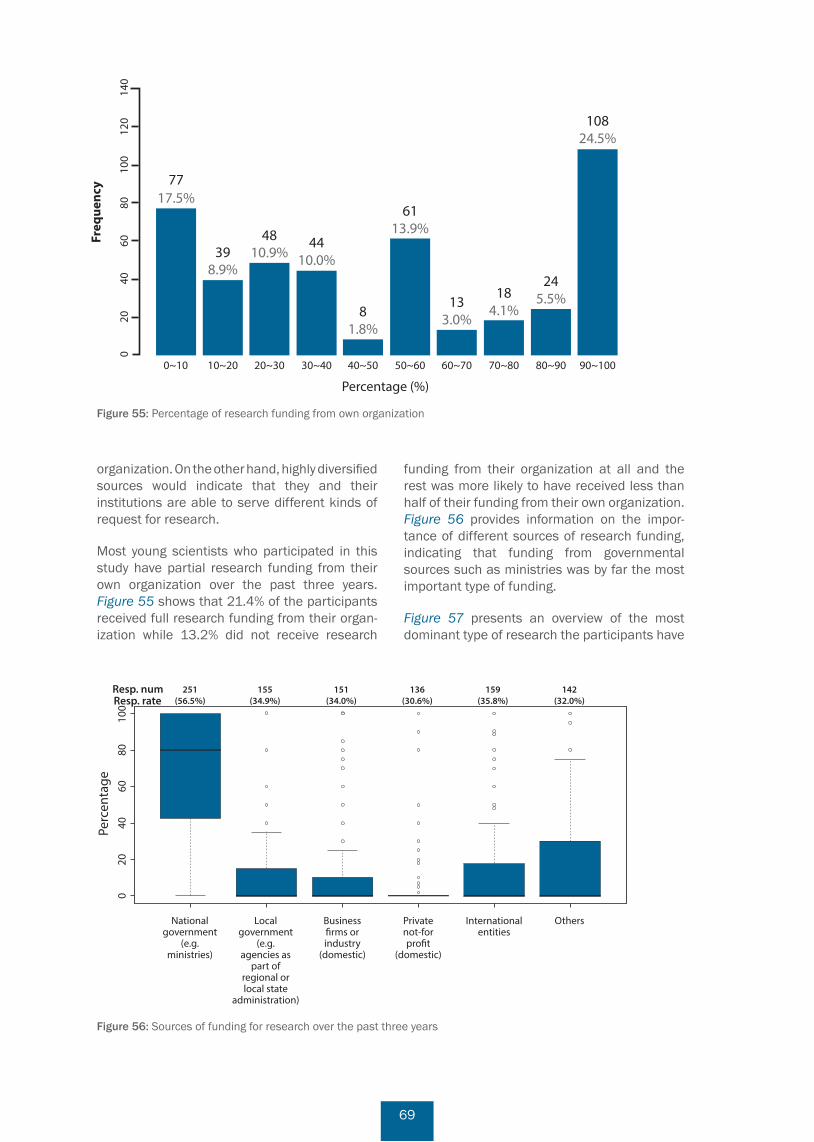
69
organization. On the other hand, highly diversified sources would indicate that they and their institutions are able to serve different kinds of request for research.
Most young scientists who participated in this study have partial research funding from their own organization over the past three years. Figure 55 shows that 21.4% of the participants received full research funding from their organ-ization while 13.2% did not receive research
funding from their organization at all and the rest was more likely to have received less than half of their funding from their own organization. Figure 56 provides information on the impor-tance of different sources of research funding, indicating that funding from governmental sources such as ministries was by far the most important type of funding.
Figure 57 presents an overview of the most dominant type of research the participants have
Figure 55: Percentage of research funding from own organization
Figure 56: Sources of funding for research over the past three years
Percentage (%)
7717.5%
398.9%
0~10 10~20
4810.9%
20~30
4410.0%
30~40
81.8%
40~50
6113.9%
50~60
133.0%
60~70
184.1%
70~80
245.5%
80~90
10824.5%
90~100
Freq
uenc
y
0 20
40
60
80
10
0 12
0 14
0
Resp. num 251(56.5%)
155(34.9%)
151(34.0%)
136(30.6%)
159(35.8%)
142(32.0%)Resp. rate
020
4060
8010
0
Perc
enta
ge
Nationalgovernment
(e.g.ministries)
Localgovernment
(e.g.agencies as
part ofregional orlocal state
administration)
Business�rms orindustry
(domestic)
Privatenot-forpro�t
(domestic)
Internationalentities
Others

70
applied for during the last three years. As presented below, young scientists and scholars applied more often for applied than for basic research, and more short-term than long-term projects. This finding matches with the trend outlined in chapter 2.3. and is reported in the UNESCO Science Report (UNESCO, 2015), which
shows that funds for applied research have been increasing.
Young scientists from natural and agricultural sciences agree significantly stronger to have applied for basic research than those from all other fields of research (p <.01).
Figure 57: Type of research applied for funding over the past three years
Figure 58: Academic output
Strongly agree Strongly disagreeAgree DisagreeNeither agree nor disagree NA Mean
Long-term projects
Short-term projects
Applied research
Basic research
0 20 40 60 80 100(%)
(Mean)0 1 2 3 4 5
Resp. numResp. rate
260(58.6%)
414(93.2%)
224(50.5%)
340(76.6%)
217(48.9%)
389(87.6%)
351(79.1%)
331(74.5%)
323(72.7%)
327(73.6%)
319(71.8%)
322(72.5%)
317(71.4%)
324(73.0%)
319(71.8%)
319(71.8%)
24
68
100
Num
ber o
f out
put
Article
s (NATIO
NAL)...
Article
s (IN
TERNATIONAL)...
Books...
Books chapters.
..
Essays, n
ewspaper a
rticle
s or...
Presentatio
ns at in
ternatio
nal conference
s
Patent APPLICATIO
NS
Patents GRANTED
Patents resu
lting in
commerci
alized pro
ducts etc
Other c
ontributio
ns to cu
rrently
used etc
Companies starte
d
Contributio
ns to la
w-making pro
cesse
s...
Expert reports
addressing so
cietal o
r...
Computer pro
grams...
Artisti
c works o
f art
perform
ed...
Films o
r videos

71
Figure 59: Personal characteristics related to creativity and innovation
Productivity
In this study, the productivity of young scientists is measured by the quantity of output they pro-duced over the last three years. Figure 58 shows that a high number of respondents published in international journals, with around 5 articles per person on average, followed by about 4 presentations at international conferences, and publishing in national journals with about 3 articles respectively.
Our data indicates no significant differences be-tween subgroups, neither with regard to country, academic discipline or gender.
Creativity and Innovation
Our conceptualization of the measurement of aspects related to creativity and innovation by means of the questionnaire starts with defini-tions of both terms as outlined in chapter 3.2.2. By the definition provided, creativity builds on the use of 6 different but interrelated resources: intellectual abilities, knowledge, styles of think-ing, personality, motivation, and the environment. Therefore, creativity is to a large extent a cognitive construct, but also builds on additional personal characteristics and resources. Innovation as-defined by the OECD has the focus on the im-
plementation of something which is new or sig-nificantly improved. For the analysis of factors that are conducive to creativity and innovation, we considered the measurement of factors that can roughly be clustered into a) personal characteristics related to creativity and inno-vation, b) activities related to creativity and innovation, and c) the support provided by the organization as the context in which the imple-mentation takes place. In addition to the ques-tions in the interviews with young scientists and scholars as reported below, we included three questions with a range of items related to the three dimensions mentioned above in the online-questionnaire. The findings from two of the items – those related to personal character-istics and activities – are reported below. The findings on the support provided by organiza-tions have already been presented in chapter 4.2.1. (Figure 46) together with the other find-ings on careers of young scientists and scholars, and their work environment.
In general, the findings presented in Figures 59 and 60 on personal characteristics, attributes and behaviours show very high measures of agreement across most items and provide little information on distinct features. With regard to the findings on personal characteristics and motivations displayed in Figure 59, apart from
Strongly agree Strongly disagreeAgree DisagreeNeither agree nor disagree NA Mean
0 20 40 60 80 100(%)
(Mean)
0 1 2 3 4 5
I enjoy looking for the most e�ective and e�cient way to tranform an idea...
I enjoy managing the implementation of my ideas or inventions
When i have an idea, I can usually make a plan to realize it
I can usually persuade others to see the value of my ideas
I can be very passionate about what I am doing
I can easily tell which idea i should pursue and which is less promising
I like to �gure out new ways to see a problem
I readily share new ideas even if I may not get credit for them
I enjoy exploring ideas or research matters beyond what I have been asked to do
I can engage in long a research process even if results do not support my assumptions
I can easily connect thoughts from di�erent people
I fell comfortable with uncertainly in research
I dislike it when others tell me what to do
If I am convinced of an idea, I am happy to have a dispute with superiors...
If I am convinced of an idea, I am happy to have a dispute with colleagues...
I enjoy trying theories or instruments even if it may not lead to good results
I often come up wjth ideas

72
Figure 60: Knowledge, attributes and behaviors related to creativity and innovation
the negatively worded item ‘I dislike it when others tell me what to do’, most items attain high levels of agreement (‘agree’ and ‘strongly agree’) of 60% or even 80% and above.
Statistical analysis of the data suggests that early career researchers from Malaysia and Indonesia agree significantly stronger (p <.01) to a number of items above, such as the ability to make up a plan to follow up on an idea, figuring out new ways to see a problem or being passionate about their work. This trend of Indonesians and Malaysians scoring higher, though with mixed ranks across the other items, is consistent. Why there is such a consistent trend, and whether or not Thai and, to a lesser degree, Singaporean researchers may have been more humble in replying to this very ‘me’ or ‘I’ oriented type of questions will need further investigation.
The descriptive analysis of items on knowledge, additional attributes and behaviours presented in Figure 60 show an even more homogenous picture than the findings presented above. Again, the statistical analysis with regard to country differences shows the same trend, with Indonesian and Malaysian young scientists and scholars showing a consistently higher level of agreement across all items, most significant at
the p <.01 level or at p <.05. The differences between academic disciplines are limited, e.g. PhD holders from natural/agricultural sciences and humanities reporting significantly (p <.01) higher levels of agreement on two aspects: Responsibility (working independently and taking responsibility) as well understanding the employment context, i.e. how the organization works.
In general, the data indicates a rather homog-enous field that has an underlying trend that is primarily related to differences between coun-tries. The homogeneity of the findings presented above may have different reasons: First, meas-uring concepts such as creativity and innova-tion by means of a questionnaire is highly likely to face the effect of social desirability in the answers: In particular in this highly knowledge intensive field, most of the aspects presented to the participants can be considered impor-tant and few would check the answering options at the lower end of the scale. This effect may have been moderated by cultural factors. Still, we had hoped to find different configurations of personal characteristics and behaviours related to different careers, sectors of employment sector or fields of research. And this may be a sec-ond reason for the highly homogenous findings: The vast majority of our participants comes from
(Mean)
0 1 2 3 4 5
0 20 40 60 80 100(%)
Leadership...
Critical Analysis...
Project management...
Languages...
Subject knowledge...
Employment context...
Networking...
Responsibility...
Flexibility...
Methodology...
Creativity...
E�ective communication...
Problem Solving...
Career Management...
Enthusiasm...
Teamwork...
Innovation...
Very Important Important Of littleImportant
Not at allImportant
ModeratelyImportant NA Mean

73
two employment sectors (higher education and research organizations) that are rather similar with regard to the way how research is conducted, while we have very few respondents from the business enterprise sector, where we would ex-pect different attributes and behaviours to have more relevance than in the other two sectors.
4.2.4. Discrimination and Unfair Treatment
Science and scholarship needs to be an inclusive enterprise. Equal opportunities are not only a matter of basic human rights and fairness, but science and scholarship require tapping into the brightest minds to advance knowledge. Therefore, any obstacle related to the discrimi-nation of a particular group carries a particular relevance that is of a different quality from other obstacles and challenges that all scientists and scholars face and has to be addressed to elimi-nate inequalities.
Gender Inequalities
The statistical analysis of the questionnaire data has revealed few differences between female and male PhD holders related to the dimension presented above. If asked directly about chal-lenges and obstacles related to their career, as in our question on influential obstacles (see chapter 4.2.1., Figure 42), gender harassment or gender inequalities were not mentioned as particularly strong influences in comparison to other factors but were present nonetheless and need to be addressed. The analysis of relative differences between countries indicated signif-icantly higher levels of gender harassment in Indonesia. But differences do not only exist with-in the sphere of work, and our data indicates that women with child contribute significantly higher (p <.01) both to care work and general housework, limiting the time and focus they can allocate to pursuing a research oriented career. Women also reported that job security is a stronger factor that has influenced them to take up a research or academic oriented career (p <.01). While job security is not commonly known as a prevalent characteristic of early ca-reers in academia and research, the data for Indonesia, Malaysia, and Thailand indicate a very high level of permanent positions (Figure 33).
Discrimination and Unfair Treatment related to Ethnicity / Race or Religion
As outlined in chapter 4.2.1. (Figure 42), discrim-ination related to ethnicity/racism and religion have also been reported and were indicated as comparatively stronger in Indonesia and Malaysia than in Thailand or Singapore. The issue will be investigated further analysis based on the in-formation we have on the ethnicity which our respondents indicated they would identify with. Findings will be reported in future country based reports.
4.3. Findings from Interviews with Young Scientists and Scholars
The presentation of the findings from the inter-views with young scientists and scholars follows two major aims: First, to present additional infor-mation related to the themes presented above. Therefore, the presentation of the findings from the analysis of the interviews mostly follows the structure of the findings from the questionnaire in the previous chapter. Minor amendments had to be made to account for the slightly different structure of the interviews and the way the inter-viewees connected different aspects. The second aim however is to present genuine findings from the interviews. As the semi-open structure of the interviews allows the young scientists and schol-ars to elaborate on the issues in greater detail and to tell of relations between different aspects (e.g. performance evaluation and productivity or international mobility and their work experi-ence), this source of information has particular strengths that the quantitative findings from the questionnaire do not offer.
4.3.1. Career and Work Environment
Motivation to Start a Research Oriented Ca-reer
The young scientists and scholars tell of a range of factors that had an influence on their decision to start a research oriented career, but three factors have been the most common: First, motivations related to curiosity and the will to know more; second, the intention to help people or the society, and third, an early contact with and involvement in science and research.

74
Curiosity as related by the interviewees can take various forms and can either be a strong moti-vation by itself to drive the researchers forward or it is closely related to other motivations or personal strivings (Emmons, 1988) that struc-ture day-to-day goals and projects throughout a longer period of time, in some cases throughout a life-time of research.
Actually I enjoy the research life; keep on finding something new; I adopt some new knowledge, and sometimes when I think of something new, even though somebody has done it, I feel, ‘Ok, my thinking is still within the scope, not dreaming.’ And if I find some-thing there is nobody doing yet and it’s feasi-ble, then I feel I’m quite interested. (YS13) 6
I looked into my future and then there’re sort of things I can do, I guess. I see myself doing something new, probably not discovering something totally new, I wouldn’t say so, it just sounds too big for me, but rather some-thing like meeting new people and corporate my ideas to their ideas to create some more innovation for the world. (YS09)
The last quote already hinted at a motivation that is not only focused on a very personal facet of motivation that could be termed ‘wanting-to-do-something-that-no-one-has-done-before’, it al-ready highlights the relation of science to a world outside and the collective creation of new knowl-edge with other researchers, i.e. the scientific community. Many interviewees told of their in-tention to do research that is useful in one way or another – by addressing societal problems, promoting science or contributing to innovation.
Basically, it’s my own motivation because when I was very young, I was very curious about things and I really liked to make things happen. It was also just my own motivation that I want to make something that will be useful to other people. And that kind of draw me to this direction to be a researcher. And also I’m a university professor so I felt like having the ability to create something use-ful and also an ability to teach or to transfer that type of process or knowledge to the other people, are the two main things that draw me to become a researcher in the university. (YS17)
6 Abbreviations such as ‚YS13’ are the short form of ‚Young Scientist / Scholar’ followed by the ID of the particular interviewee. General information on each interviewee is presented in chapter 3.4.2.
Actually I like to learn more about what is going on in our country because when I studied, most of the cases are from the foreign countries. So I want to compare and contrast the difference between our countries and another, and also to solve the problem that occurs within our country. (YS04)
The most enjoyable… the people that I get to meet, get interesting findings, the in-depth relationship that comes out after that, especially in civil society and you do the kind of work that exposes us of questions and exploration; that really gave me satisfaction. We’re just helping with a book on abused women in [an ASEAN country]. They had NGO there who did some translation but it didn’t quite read very well so I helped them to proofread and to adjust the edited copy. But just by doing that I’ve read so much, I’ve learned so much about the context (…); what so many other people have gone through, and the kind of work that you have to meet there. It brings me great satisfaction to meet these people and understand what they’re doing, and whatever little that I can give or con-tribute, it’s a great privilege, I think. (YS22)
It does not come as a surprise that young sci-entists and scholars come with different prefer-ences regarding what kind of tasks they prefer most: research, teaching, or service to name but the most prominent. But for some, the different tasks were basically interdependent and one without the other did not seem to work for them.
I really enjoy all 3 of them. I can’t really take one of them out because I feel like I can’t miss any one of them. I can’t stop teaching; I can’t stop doing research; I feel like I need to do… actually and they are all a part of one thing because it’s not that I do different things or different fields. All of them are in one field – my expertise. I’m using my expertise to teach. I’m using my expertise to do my own research, to be more expert. And also I’m using my expertise to help the industry and the local communities based on my research skills. It’s just one thing, but different chan-nels. So I can’t really take one out because I feel like students need me, the industries, the communities also need me. I have to do my own basic research. I have to go out and solve the problems through my associations. So that’s something I feel I can’t name what’s number one. I feel like they have to go together. (YS18)

75
Research. I love doing research compared to teaching. When I have some results from the research, I can talk more to the students to try more research. And you may not believe it but second-semester undergraduate students sometimes they come to me and said, ‘I want to try to do some research with you, can I?’ and I said, ‘Sure, of course. Just try with the easy one.’ And then I give them some read-ings, ‘Try to read this one. You can come any time and we can discuss, but try to read the easy one, for example, introduction. Just try to get the idea what these people have done.’ (YS20)
The factor summarized in the introduction as ‘early contact or involvement in science or re-search’ relates to various situations or events, such as early contact with science and teaching in the family, or during school or in higher edu-cation. In general, these contacts were more of an opportunity to get to know more of a scientific career than a motivation by itself.
Motivation – goals, strivings, and expectations – drives the activities of scientists and scholars from day-to-day tasks to projects, across work contexts and possibly throughout a lifetime. Even though the interviews required the interviewees to report on earlier events, which may be distorted by their present framing of their memories or experiences, these accounts provide valuable information on how they give meaning to what they are doing. This information is particularly valuable in light of the intentions to focus the activities of young scientists and scholars through the implementation of performance evaluations in general and instruments such as key performance indicators (KPIs): If the motivations and the goals of an organization match, this can enhance their productivity, but if personal motivations and organizational goals get into conflict, the cognitive conflicts will have an impact on the performance of young scien-tists and scholars.
Working Conditions and Career Obstacles
In general, working conditions impact on almost all aspects reported here, and as obstacles in the present are also problems in driving a research career forwarded, we decided to report them together. Issues directly related to specific themes – such as performance evaluation, support or creativity and innovation – are report-ed in the respective sections.
General obstacles or challenges reported by the young scientists and scholars first of all referred to various aspects of resources: funding, access to journals, human resources, and infra-structure. In some cases, these challenges were due to limited experience on how to access the required resources. Though the effect for the young scientists and scholars is the same – they cannot fund their research – the solution to solving the problem is providing training, men-toring or other kind of institutional support.
Getting research grants at the beginning was difficult. I didn’t have any experience getting research grants, writing research grants; so that was an obstacle. Looking for the right students to join my project, I was quite fresh at recruiting research students and much better now at identifying who’s good for my group. (YS11)
Most challenging is that I want to (..) be outstanding and hope to be like an expert in certain field of my research. For example, (..) if you talk about [my particular field of research], although there is some research carried out, there are many giant compa-nies in the world that are carrying out the research as well. And even institutions all over the world because [it] is quite a hot topic, popular topic. So with my limited time and limited funding and also limited students, it is quite tough and challenging for me to be outstanding from that. I must be very creative on that to find out a way that there is something new and novel. (YS13)
Even when young researchers have acquired the skill to identify sources of funding and have gained experience in applying for financial re-sources, they face the next challenge: To con-stantly keep rolling out new ideas, to move from a success to constant performance and face the constant pressure this implies.
The biggest obstacle is to find the grant. To answer this question, what’s next? (…) So that is one thing, and the other block is, how long do you think a person can keep on rolling out good research? I do at times feel worn out. You are not a generator. You can’t keep generating out great bright ideas all the time. There are times when you’re not able to do that. And that’s the end of my job because that’s how the things work here: you have to be on your toes all the time especially

76
in research. The moment you put your feet down, you’ll never know what’ll happen. Then you’ll have to find the lab, you have to be with another professor, and then the start of the whole vicious cycle again. So those are the challenges, I think. (YS02)
Another obstacle mentioned by young scien-tists and scholars as a more general challenge to conducting research is the interaction with policies and administration at their institutions. At the level of policies and regulations, funding horizons and cycles were reported to inhibit the conduct of good, sustainable research. Regu-lations differ between countries participating in the study, but both with regard to long-term strategic planning and short-term reporting on individual projects, some accounts of concerns and critique were brought forward.
So due to long period of purchasing and application to purchase something, then the industry people they cannot wait. Normally if they want to go for research, they want to solve the problem or something, and they want to be quick. And because they are fight-ing for the business. So this is like, they will think research is too far from them, otherwise they will try to do the research themselves, in the industry. And on top of that, [ASEAN country] is basically a country – maybe good in manufacturing, but not good in research. That’s why most of the companies, they’d rather wait for new things to come out, and then maybe they try to collaborate how to get the business, so they won’t involve in research. (YS13)
They just need to reduce red tape. The number of signatures that have to be on a form for me to order a bottle of [a chemical substance]... There are too many signatures needed so they need to reduce red tape. They need to under-stand the very nature of research. A scientist will obviously employ the post-doc that is best for his or her project and I don’t understand why the university has to get involved in that process, in the selection process. (YS11)
I think here (...) we have an office that will try to help you with writing proposals for overseas grants, I think that’s a step forward. But I think many people still feel that it is a process that’s difficult and tedious, with a lot of non-scientific issues that come into play, in terms of, say IP re-amends or contractual
terms, so it feels like a lot of red tape in try-ing to find and go to a lab overseas right now. (YS03)
The most barrier in [ASEAN country], for people to be creative or innovative – not only my experience, is the administrative proce-dure here is quite difficult. For example, if we would like to have the innovative research, or creative research, or maybe approaching something prototype, the financing system follows the government budget. For example, the budget of grants or research grants from the government will be in April or May, but in October or November, you have to finish everything. So it’s quite impossible to have good research or good innovative idea, because you have to fulfil all the requirements in November, to submit any administra-tive work to the university’s administrators because everything has to follow the govern-ment sequence. (YS23)
At the level of their organizations, our inter-viewees reported high proportions of their time being dedicated to ‘bureaucracy’, which first and foremost was related to the evaluation of their performance and compliance with regulations to conduct research. Both aspects will be cov-ered in the respective sub-chapters below.
Performance Evaluation
The evaluation of performance has become a rather common feature in almost all types of organizations and has be to be seen as a central aspect of the international trend of marketiza-tion of higher education and research outlined in chapter 2.3: Performance evaluation as a general principle and the introduction of Key Perfor-mance Indicators (KPIs) are elementary aspects of the introduction of a new governance prin-ciple or system (‘autonomy for accountability’, new public management) and the participation in world university rankings.
The interviews tell of a widespread implementa-tion of KPIs and basically every young scientist or scholar had an opinion on the issue. Though there was no complete agreement on whether or not they were fair or adequate, many inter-viewees thought they would benefit of being improved with regard to how they are being con-ducted which includes both the criteria and the effort required to participate in the process.

77
With regard to the time and efforts needed to participate in the mandatory process, there was a wide agreement that the ends do not warrant the means and that the workload related to reporting all the required information should be reduced.
But, for example, administration work, we are exposed to many, many, many systems that we have to learn, and it keeps changing, and it’s just very, very troublesome. For example, for our teaching, we have a learning management system, that’s one system. And then for submitting grades and attendance of our students, we have to fill it in another system. So there’re 2 systems already. And then, for the industry and community link, there’s another system that we have to fill in. For KPI, there’s another system. And then to have all of our records like for calculation or for KPI’s, there’s another system. I think I already lost how many was it, but you get the idea, right? There’re so many systems that we have to learn, and we have to manage it by ourselves. We don’t have anybody to help us out, but we have to learn and do it, no matter what. (YS01)
Yes, actually it’s fair. I just don’t think it’s good to let the staff spend lots of time to do that report. We have to report everything. (…) Yes, we have to report every day that we have class. We have to type into the Internet to the program to say how many days a week we have a class; how many days a week we give the advice to our students. We have to inform them on everything what we do. (YS04)
I think that focusing specifically on (…) uni-versities, there’s just too much bureaucracy (or rather I’d call them bureau-crazies), people putting in controls or additional costs with-out actually evaluating what additional value it will bring. From the business perspective, you do not add cost unless that activity or that investment is perceived to bring more value at the end, whether it be tangible or intangible. I find that [ASEAN country] universities do not do that evalua-tion very well. (YS06)
Critique of how performance evaluation is being conducted is not restricted to the amount of time needed to participate in the evaluation, it also addresses the aims implied in the criteria
and praxis of evaluation. One trend in higher education that had been outlined in chapter 2.3. was the shift from a ‘scholarship of discovery’ to a ‘scholarship of applicability’, which can also be found in observations of young scientists and scholars:
Everything counts into the performance in each year. So each year they evaluate my performance: do I have papers; did I go to any conference, and they’re going to assign me the grade just like in high school, like 3-point- or 2-point-something. (…) It’s like a huge class, but instead of doing exams, they evaluate the whole year of your work. And of course if you have papers, that helps. If you have patents, or course that helps a lot. If you have gone to conferences, sure, why not. So, along this line, anything that comes as a concrete work: papers, patents, especially if a private com-pany comes and, like, co-project with your patent, this is the best thing because they always want to make sure that the research got into the public. They care more about that than the paper, actually. (YS09)
I think this is a matter of politics because we are a national research institute. We get funding from the government and the government gets the funding from tax payers, and every year we have to justify our budget to the parliament and these are of course elected officials who need to show output within a short period of time. And [ASEAN country] politics are specially unstable in a sense that many governments still last one or two years and so the pressure to produce something tangible is even stronger than, say, in [a major western country], where at least you get a period of 4 years to show what you can do. So I think there’s a very strong pressure for each government to fund only projects that produce something tangible. (YS03)
The notion of ‘tangible outcomes’ is receiving mixed accounts of both praise and critique with regard to making the quantity of publications or other output a major criterion for the assessment of performance. For some, focusing on tangible outcomes means bringing more objectivity into the evaluation process, while others perceive this focus a disregard for the aspect of assess-ing the quality of the output.
In my institution, we have a formal set of criteria, key performance index that we have

78
to fulfil, and we actually have a half-yearly reviews and appraisals by our supervisors. This covers all aspects of our work including research and teaching. So it’s actually a dedicated template that they have to fill in every six months. So they will look at indicators like numbers of articles published, numbers of posters that you put up, numbers of grants, chapters of books that you’ve writ-ten, patents, things like that…very tangible things. (…) It’s very objective. There’s not very much room for errors basically. It’s out-put-driven. (YS05)
We have to focus on the quantity than qual-ity as they count how much research that we can do per year. They didn’t want to know in details of the research, whether it’s valuable enough. They’d just like to see the number of research. (YS04)
The only thing that they cannot measure right now is the impact of your work, which I understand is quite difficult. Everyone has different ways of interpreting their own impact so it’s quite difficult that this point, how they judge the impact of each person. And everything that they’ve done, it comes out to the very small change in the incentives or rewards. For example, we have spent a lot of time and resources in order to do these two evaluations. But results that we get, they don’t quite reflect at all. We have filled out so many things and then they tell you that you are good, and that’s pretty much it, or you’re not good enough, or you’re very good. I think it’s the system where they just want to evaluate, for the sake of evaluation, but not for the sake of enhancement or development or supports. They just want to judge every-one, and based on the findings they will just increase this much salary for you but it’s not for the development or the enhancement of any individual at all. So I feel like it defeats the purpose of doing the evaluation. From my understanding, if you want to evaluate something, that means your attitude wants to make it better, wants to improve some-thing, otherwise why evaluating? But the system right now that we have, it’s just for the sake of: fill out the form, just get it done. There is no mechanism, no supports, or no analysis even, to improve anything. (YS18)
Whether or not the quality of research is given sufficient importance in performance evaluation
is also related to one of our focal objectives: the promotion of creativity and innovation. Though it can be argued that creativity and innovation can also be incremental processes that can be documented in a larger number of papers, it will still be difficult to argue that the quantity of the output alone is a good measure of creativity or innovation in research. As various interviewees had a strong opinion on the relation of perfor-mance evaluation and creativity / innovation, we decided to report these findings in the sec-tion related to this topic (see chapter 4.3.3.).
To summarize our findings on the perception of the evaluation of performance: It did not come as a surprise to see different opinions on per-formance evaluations in general and their spe-cific implementation in particular – the issue is discussed world wide and the different threads and opinions can be found throughout the international research community. In general, the interviews give the impression of a percep-tion that the (public funded) higher education and research systems need to answer to the societies and governments that fund their re-search. This matches with the individual moti-vation of young scientists and researchers to ‘help people’ or serve their societies, which was reported above. Still, based on our impressions from the interviews, the issue of performance evaluation should be considered a ‘hot topic’ as it has a high impact on the motivation of young scientists and scholars and more often than not seems to be in need of adjustments. Though our study did not focus on performance evaluation, we would like to share some of the thoughts our interviewees brought forward in addition to reducing the time required and the discussion of criteria:
• Acknowledge different strengths and offer more flexibility in the evaluation. Young scientists and researchers may not be equally good or interested in per-forming different tasks, such as research, teaching, collaborating with industry or providing different kinds of services. Sys-tems of performance evaluation might be improved by offering some flexibility to ac-count for these different strengths.
• Include resources and different per-spectives in the evaluation. Including perspectives from different stakeholders and also involving the relation between the superior and the young researcher in the evaluation process can contribute to

79
improving the evaluation as is taking into account relevant resources (e.g. support staff, students, financial and infrastruc-tural resources).
• Clarify the aim and the consequenc-es of the evaluation. Is the evaluation used to identify both strengths and poten-tials of young researches and are there resources to address identified poten-tials for improvement? Are the outcomes of the performance evaluation properly connected to reward and career systems, i.e. does the evaluation contribute to a meritocratic system?
Support
To gain a thorough impression of the support the young scientists and scholars need, we ex-plicitly asked for their opinions and analysed the interviews with a focus on reported problems, obstacles or challenges they were facing. The reported issues can be summed up into the fol-lowing major themes: Resources and supporting access to resources, facilitating opportunities for exchange, and training and mentoring.
Accounts about the access to resources first of all relate to financial resources both for conduct-ing research and international travel. The lack of sufficient financial resources often proves a problem for research and given the resource intensive research in many fields (e.g. infra-structure, materials, human resources) this is a problem that is particular eminent in developing and emerging countries. The data from the inter-views can only tell of perceptions of shortage of resources and not the objective availability, but we would like to point to those reports that may provide particular hints on the problem.
Financial resources may not be accessible to young scientists and scholars not because they do not exist, but because they cannot access them due to insufficient knowledge on how to apply or because administrative procedures get in the way.
In the country where I come from, the government tries very hard to encourage research and creativity. They have a lot of constructs; they have a lot of official, like for-mal funds or grants or programs to encourage it. But the problem is that there doesn’t seem to be a lot of support on the ground… in the sense that there is direction from the higher
powers that this is important but it doesn’t really translate to there being actual mentors for people who are interested in helping stu-dents who enjoy research. (YS05)
Now we have like a grant. Our government gives us a small grant to collaboration. The big problem is to understand each other. This is an important point. Like the other uni-versity wants to help us, they have to un-derstand well the regulations in [ASEAN country], and we have to understand well the regulations of the university that would like to help us. Sometimes this is a big prob-lem because regulations are different and we can’t continue the collaboration. (YS08)
At various points throughout the interviews, interactions with non-academic or supporting staff were mentioned. This may refer to very dif-ferent events and activities such performance evaluation, applications for funding, interna-tional travel, collaboration between institutions or conducting particular kinds of research. Sometimes, conflicts arise from interactions be-tween the members of the administration and researchers, but how these interactions play out may depend a lot on how both sides are able to deal with the situation. This is where the quality of the support staff can have a strong impact on the performance of researchers which usu-ally do not have to deal with a particular issue very often and are usually less skilled in particu-lar tasks that are day-to-day routine for support staff.
Supporting opportunities for professional ex-change was the second major topic young scientists and scholars mentioned. First of all, this was related to international and, to a less-er extent, regional mobility to meet with other researchers (please refer to chapter 4.3.2. for more information on international mobility and collaboration). The gap between higher educa-tion and industry is not mentioned explicitly from many interviewees as something they would like to see addressed. It is sometimes mentioned as a problem related to industry to gain funding or collaborate or in case an interviewee consid-ers changing to a different employment sector at a later stage of their career. One young sci-entist describes the kind of support needed as something related to the visibility of work and challenges in each sector that is more commonly addressed at the bachelor level of education but seems rather limited at the masters and PhD level.

80
Whatever we do in academics, I think it’s most everywhere, but whatever we do in academics, it’s not visible to industry. I don’t know, if I’m working on a problem, ultimately the question asked would be, ‘How applicable your solution or your research is to the present industry or to the present world?’ Again, I cannot answer if I’m being locked and I’m only hearing the academics. There should be move over labs between industries. They should come visit us, we should go and visit them, which is at the bachelor’s level, but I think the master’s and the PhD’s are hardly there. I think if I know what other problems that the real industries are facing, I can be more creative in solving those prob-lems or being more innovative or at least diversifying my research, finding solutions, which are nagging to the people right now. I think that is one thing, which I feel is lag-ging or is a constraint on my profile, that I don’t have that kind of visibility or that kind of exposure. (YS02)
In the interviews, the demand for formal training was not a kind of support the young scientists and scholars wanted to talk about. When they addressed their potentials for learning, they were more intent on highlighting situations of interpersonal exchange at conferences, in work-shops or with mentors. Guidance from mentors would be expected with regard to a wide range of academic activities such as what and where to publish, where and how to apply for funding or to comment on a project. A notion that a young researcher conveyed on the issue of mentoring was the ability or inability of mentors to provide the support for young scientists and scholars. As the senior academics may not have participated in a mentoring program themselves, they might probably be unsure about how to guide young scientists and would themselves benefit from some introduction.
I would say, there should be a more struc-tured program to support us the young ones – the junior lecturers – because currently they just assigned us mentors, but then the mentors are not really…I don’t think it’s the mentors’ faults as well because they don’t know what to do with us, because probably in their time they don’t have the system like mentor-mentee program. I don’t think they know what they should do with us, how they can help. Maybe there should be a structured program, layout, module or whatever that
can actually be given to these mentors and tell them that, ok this is what you should do to help them out. (YS01)
4.3.2. Internationalization and Mobility
Internationalization and international mobility were topics most of the respondents were very happy to talk about and share their usually posi-tive experiences and challenges. This sub-chap-ter will provide an overview of the findings on benefits from international mobility, mobility in ASEAN, mobility related to PhD programs funded by governments, and also on obstacles and spe-cific challenges.
Benefits from international mobility report-ed by the young researchers had three major sub-themes: getting in contact with different perspectives on subject-related matters and re-search in general, learning from new sources, and the opportunity to start collaborations or expand their networks.
The positive aspect would be learning from… it’s just opening up your perspectives. That is the most important thing if you’re having the international mobility. I think it’s crucial right now, in any time, any era because if you know what the other people are doing, first of all, you might be able to help them. Secondly, they might be able to help you. Thirdly we might be able to share resources. That is the most important thing at this point of time because in anywhere if we can help each other to do something better for both sides, or even at the larger scale, I think that is something very good for the interna-tional mobility. (YS18)
International mobility is essential today for researchers because they need not just to read other people’s papers but also to establish this face-to-face propinquity, the beauty to estab-lish quick trust with other researchers. Only then through the establishment will the other researchers be willing enough to share / dis-close ideas, things that they wouldn’t want to disclose if they hadn’t had a face-to-face discussion. (YS06)
As many interviewees had the opportunity to stay overseas during their masters or PhD stud-ies and therefore at a rather early or even pre-paratory phase of their professional career, the sum of the experiences can often be summed

81
up as a general experience of personal growth and a great boost of confidence as one young researcher describes it:
The positive aspects are huge. If I never went overseas, then I would only have the local experience and I wouldn‘t know what the overseas experience was. It could have been similar to local experience; it could’ve been different, but regardless I wouldn’t have known. So that scares me, the fact that I would have done everything locally I wouldn’t know if the overseas experience is the same or different. Not knowing is scary so that’s a bit positive I was able to go over-seas and understand what that experience was like. Confidence boosting. The whole philosophy of research… because I did my PhD overseas and I didn’t do a master’s, so the PhD was really a growth curve, and that growth curve came from overseas. So I would say that my whole philosophy of research was really governed by that over-seas experience. And even today, it might be a little bit biased, but every time I speak to someone, or to a researcher who’s from over-seas, I just get a little bit more excited because I think it’s just a simple fact that they’re far away, geographically different location, and therefore they have different perspective or different experience, and I’m always keen to latch onto that. (YS11)
The majority of our interviewees were less inter-ested in mobility in the ASEAN region than going to countries with more mature higher education and research systems. Accounts from our inter-viewees differed with regard to where our re-sponded were coming from or where they were currently living and what they were expecting from a stay in an ASEAN country.
Young scientists and scholars from Singapore did not see how their academic skills or networks would benefit from a stay in another ASEAN country, and their interest to go to a conference in one of these conferences was more related to look for some funding for their research at home or engage additional vendors of their products. A young scientist employed in business enter-prise described the relation between Singapore and its ASEAN neighbours pointedly as a very unequal relationship.
If you’re talking about research, then no, because to move from Singapore to any of the
other ASEAN countries to do research is a career suicide. It is more often the other way, where ASEAN countries move to Singapore to do research. (YS19)
Though interviewees from the other 3 countries participating in the study do agree that Singa-pore is the most interesting country to go in the region to learn and advance their careers, they tend to have a more differentiated view on the opportunities offered by other countries’ higher education and research systems. For once, some interviewees were more aware of capacities in particular fields of research, and, in a particu-lar, witnessing what other countries’ scientists were able to do with their even more limited resources.
Analysing experiences with ‘bonded PhD pro-grams’ or ‘programs with the obligation to return home after completion of the degree’ was not a dedicated focus of the study and the selection process for the interviewees did not consider this factor as a criterion. Therefore, we have few accounts related to this kind of funding of international mobility and studies. The accounts we have speak equally positive of the benefits attributed to international mobility as outlined above. The few negative issues mentioned were related to the bureaucratic management of the program or problems with the funding being provided at the designated time, which incurred major problems to finance the stay.
Obstacles reported to international mobility primarily focused on the lack or limited fund-ing available for international mobility such as attending conferences or visiting labs. An issue brought forward with more emphasis by female than by male researchers was related to combin-ing international mobility and having children.
Right now international mobility is not an issue. People are moving in and out; they’re going for overseas experiences, coming back. There’s lots of exposure and thanks to the internet people know each other. Mobility’s there. Definitely much more than it used to be 10 years back, but again I will come back to the point, which it will link back to the gender issues. As a woman, especially as a family woman, how difficult it is for me or how easy it is for me to have this mobility, I find it really hard. People or my previous boss told me, “why don’t you go overseas?” (…) Two years and then done. Having a family set up

82
here and leaving all that behind, being there. I don’t want to drag my [partner] who has a good stable job here so it means going alone, and staying away from the family, how important, again, it’s a priority. It’s a priority issue for me. Some people do that and I really appreciate I don’t look down upon them. But for me, it’s finding a balance. Am I ready to give up my family, my child’s happiness, to see him grow, for 5 years of research experi-ence? For me the answer is no, so that’s why I would feel I’m restricted in terms of overseas or international mobility. But I think this will depend a lot on the family situation… what I want. (YS02)
In terms of international mobility, first, if you want to be mobile, you can’t have a family, to be frank, which is why I was able to work in [a western country] with no worries because I was single, and I am still single. (YS19)
Due to the limited number of interviews and in-terviewees with children in particular, there are too few accounts to provide a better impression of gender differences related to international mobility.
4.3.3. Productivity, and Creativity and In-novation
In the following chapter, findings on productivity, and creativity and innovation will be presented. As many important aspects related to promoting productivity have already been addressed along with the presentation of findings on working con-ditions, performance evaluation, support, and international mobility, the following account will be more of a brief summary and account of issues that have not already been covered.
Productivity
Accounts related to research productivity often referred to missing resources, such as funding of research and international travel, access to journals and equipment, and time constraints due to high teaching workloads. As incentives that promote publications, young scientists and scholars mentioned the need to respond to the requirements of KPIs and individual strategies that helped them to get their work done, e.g. by discussing ideas with peers and reporting work to them.
Creativity and Innovation
The findings from the interviews reported on cre-ativity and innovation will first address how the young scientists and scholars understand both terms before aspects that impede or facilitate creativity and innovation will be reported.
In general, the accounts of our interviewees re-flect the definitions given in chapter 3.2.2. for creativity and innovation, according to which cre-ativity may be characterized first and foremost as a ‘the idea’ and a combination of individual resources primarily related to an intellectual or cognitive process, while innovation is related to the implementation of the idea or ‘something new’. Though, in general, many participants were able to offer an outline of both concepts, there was obviously a wide range of understandings of related details and a blurring of boundaries be-tween those concepts to be observed between and sometimes within an interview.
In my view, creativity might be only the idea is creative, but if you can make it happen, it can be innovation, innovative. (YS04)
Creativity, for me, is looking at the same thing, but from a different angle. (…) When you talk of innovation, innovation is some-thing you come up with a new kind of solu-tion. Again more or less for me they are both interlinked, creativity and innovation. It’s kind of producing a new solution; it’s kind of producing a new answer to an old problem or solving a new problem entirely by itself. Or building on what is already there, I mean, if there is a base available, you try to just add some new knowledge, even that, for me, is innovation. (YS02)
I think of technology. I think of the tools, of cutting-edge tools that we would need to do things that are different and unique and to pursue research in the direction that we haven’t gone before. And I also think of the limitations we have right now in terms of the technology and equipment that we have at our disposal. (…) To me, innovation feels closer to applied science, in terms of taking knowledge and using it for something that is practical in new ways, where creativity to me sounds more general and seems like inspi-ration that can come at any stage of process

83
of science, whether it’s in the designing and experiment, or implementing it or finding ways for the knowledge to be used or applied. (YS03)
Given that there was no complete identity in the definitions of creativity and innovation and an even more widespread blurring of boundaries between the concepts, obstacles and facilitators related to both activities cannot be completely disentangled.
As far as creativity was primarily considered an individual, cognitive capacity, barriers or obsta-cles reported by the participants were few and were primarily related to aspects of overly short funding periods, the required obedience to senior scientists which they sometimes considered to be too removed from the lab bench, or aspects that implied a conflict between different goals implied in the KPIs and what the young scien-tists and scholars considered a requirement to conduct good research and be creative:
I totally understand, because we have some-thing called ‘mission’ or ‘KPI’, some exact goals like you have to reach 2 papers per year, which is OK, people need to have goals to motivate them. And they start to feel that if they’re going to come use or if we’re going to get the paper out, their names are going to be on the paper. They start to ask for what they’re going to gain before even starting to work, which I don’t think it’s their fault, but I’d say it limits their work because it’s a main obstacle. So I think there should be a middle line that will allow you to do so I guess. I think that’s the main problem. (YS09)
They should actually let us have more free-dom to choose. For example, some lecturers prefer teaching. Actually our KPI’s, it covers a lot of aspects: you have to be involved in or-ganizing seminars; you have to be involved in teaching, research, initiatives, professional service to the society. It tries to make us like superman, with ‘everything I can do’. This is not great to my understanding. Some people they are good – have special skills, they can ex-tend these skills. And some people, they don’t like research – they just like teaching tasks. So they should let us choose. For example, I don’t like to teach so much then I can put more concentration on my research. And then we have more time to do our research and maybe can be more creative and exposed to
more literature review, then we will think. Because if we don’t have time – I think cre-ativity must be something related to time as well. When I start to read—input a lot on knowledge, then I can think of something new from that. I have nothing, I have no time, busy with paperwork, I won’t be able to be creative. (YS13)
On the other hand, our interviewees were more ready to provide thoughts on how their creativity could be enhanced: by providing opportunities for valuable exchange between peers in a work context with diverse members, international ex-change, and exchange between industry and academia.
Some young scientists and scholars addressed issues related to the wider educational system, both in secondary and tertiary education.
So that may be related to our education system. For such a long time I think in most of the Asian countries, our education is something we have to fit you, have to force you to get into exam; you have to study this one and that one; you have no freedom.(…) So you have to be very excellent; put a lot of efforts on study. But that kind of study is some-what spoon-feeding, and lack of hands-on projects. In my time, it’s still ok, but nowa-days it’s even worse. In the class, they don’t have experiments, in the secondary schools. They have to memorize all the steps how to do the experiments; they don’t do the exper-iments actually. So our education system, I would think that it has blocked out thinking. (YS13)
[W]e are graded by the students, believe it or not. The students tell us basically whether we are on the right track or not. Well, I have issue to that because, first of all, it’s like an organizational mindset again. It’s like the students are our customers. We’re out to please the customers. You are service providers; you are after-sales person to attend to their needs. How can you introduce innovative teaching techniques, how do we break away the stifling bureaucracy that’s being put into the curricular if we are held ransom by stu-dents? I’m not say all; of course there are en-lightened students [who] really enjoy the ex-ploratory nature of what we do, but are also tied by some very conservative students who really don’t understand what we’re trying
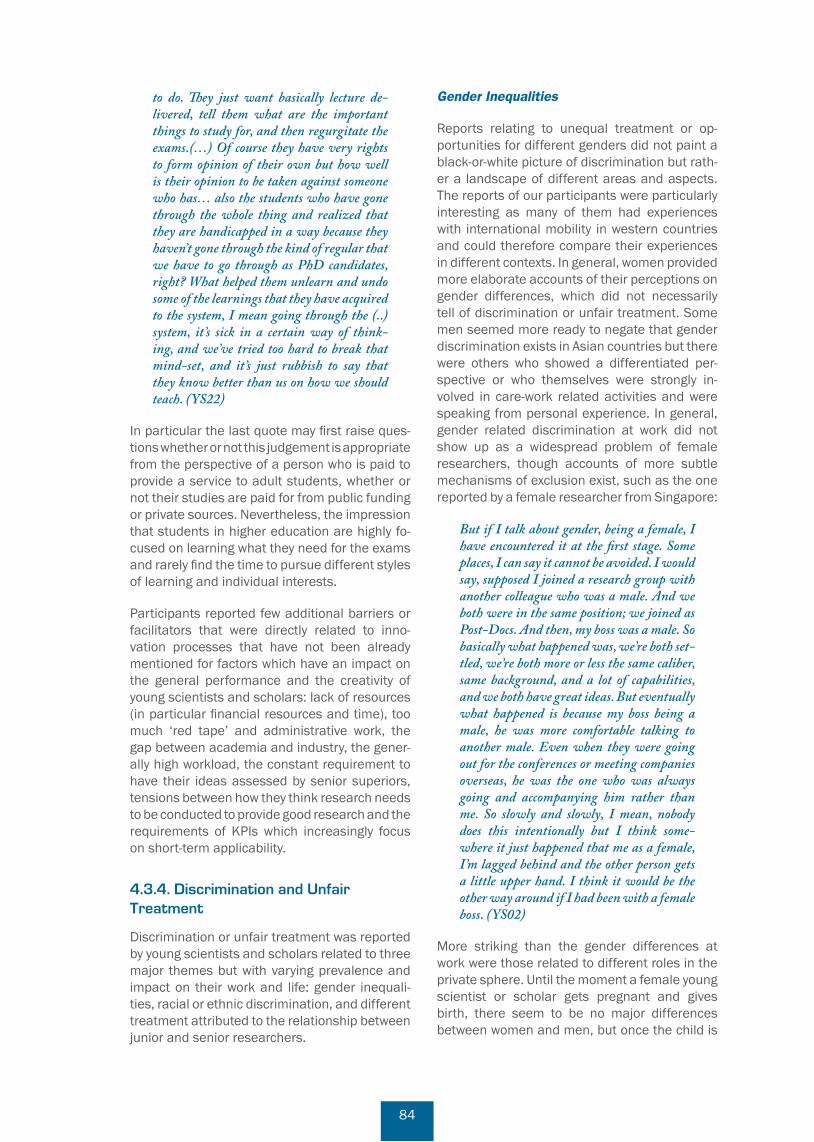
84
to do. They just want basically lecture de-livered, tell them what are the important things to study for, and then regurgitate the exams.(…) Of course they have very rights to form opinion of their own but how well is their opinion to be taken against someone who has… also the students who have gone through the whole thing and realized that they are handicapped in a way because they haven’t gone through the kind of regular that we have to go through as PhD candidates, right? What helped them unlearn and undo some of the learnings that they have acquired to the system, I mean going through the (..) system, it’s sick in a certain way of think-ing, and we’ve tried too hard to break that mind-set, and it’s just rubbish to say that they know better than us on how we should teach. (YS22)
In particular the last quote may first raise ques-tions whether or not this judgement is appropriate from the perspective of a person who is paid to provide a service to adult students, whether or not their studies are paid for from public funding or private sources. Nevertheless, the impression that students in higher education are highly fo-cused on learning what they need for the exams and rarely find the time to pursue different styles of learning and individual interests.
Participants reported few additional barriers or facilitators that were directly related to inno-vation processes that have not been already mentioned for factors which have an impact on the general performance and the creativity of young scientists and scholars: lack of resources (in particular financial resources and time), too much ‘red tape’ and administrative work, the gap between academia and industry, the gener-ally high workload, the constant requirement to have their ideas assessed by senior superiors, tensions between how they think research needs to be conducted to provide good research and the requirements of KPIs which increasingly focus on short-term applicability.
4.3.4. Discrimination and Unfair Treatment
Discrimination or unfair treatment was reported by young scientists and scholars related to three major themes but with varying prevalence and impact on their work and life: gender inequali-ties, racial or ethnic discrimination, and different treatment attributed to the relationship between junior and senior researchers.
Gender Inequalities
Reports relating to unequal treatment or op-portunities for different genders did not paint a black-or-white picture of discrimination but rath-er a landscape of different areas and aspects. The reports of our participants were particularly interesting as many of them had experiences with international mobility in western countries and could therefore compare their experiences in different contexts. In general, women provided more elaborate accounts of their perceptions on gender differences, which did not necessarily tell of discrimination or unfair treatment. Some men seemed more ready to negate that gender discrimination exists in Asian countries but there were others who showed a differentiated per-spective or who themselves were strongly in-volved in care-work related activities and were speaking from personal experience. In general, gender related discrimination at work did not show up as a widespread problem of female researchers, though accounts of more subtle mechanisms of exclusion exist, such as the one reported by a female researcher from Singapore:
But if I talk about gender, being a female, I have encountered it at the first stage. Some places, I can say it cannot be avoided. I would say, supposed I joined a research group with another colleague who was a male. And we both were in the same position; we joined as Post-Docs. And then, my boss was a male. So basically what happened was, we’re both set-tled, we’re both more or less the same caliber, same background, and a lot of capabilities, and we both have great ideas. But eventually what happened is because my boss being a male, he was more comfortable talking to another male. Even when they were going out for the conferences or meeting companies overseas, he was the one who was always going and accompanying him rather than me. So slowly and slowly, I mean, nobody does this intentionally but I think some-where it just happened that me as a female, I’m lagged behind and the other person gets a little upper hand. I think it would be the other way around if I had been with a female boss. (YS02)
More striking than the gender differences at work were those related to different roles in the private sphere. Until the moment a female young scientist or scholar gets pregnant and gives birth, there seem to be no major differences between women and men, but once the child is
85
born, caring for the child becomes the primary responsibility of women. This does not seem to imply that they need to stop working immediate-ly. From all accounts we received, the somewhat modernized configuration of roles in young fami-lies ‘allows’ women to continue to work as much as they are willing and able as long as the male partner does not have to change his work and career trajectory in a significant way. As long as the mothers are able to organize care for their children – be it family or paid childcare – they are free to pursue their career. But if the net-work of family and paid childcare fails, it will be them who will have to step in.
As far as the actual research goes in our coun-try, I think there’s not much gender bias going on. Honestly speaking, there isn’t really very much. The only barrier to being female is that we’re still in a conservative society so the burden of childbearing still falls mainly to the female party. Of course things are getting better. My [partner] helps, and a lot of other [partners] do. But still, the last responsibility is the mothers. But I think things are much better than it used to be in my parents’ gen-eration. (YS05)
But keeping that aside, if I close my eyes and say, whether really having children does affect my work, yes it does. Unfortunately in Asian culture, again I’m talking about Asian culture, women are supposed to be present with the child when the need arises. If he falls sick, or if he needs me, I’m the one leaving work early. It will never be my [partner]. Whose work does suffer? My work. Does it take down to my performance? Yes, it does. Now I can safely say I have my child; I passed the way; I’m back on to my gear, and he’s talking about the second child. (YS02)
My husband has been encouraging about my career, but it’s been a very short time that we’ve been together. But I know my parents would always encourage the career to carry on because they’re the kind of parents that even if my mom doesn’t understand what I do, but every time I tell her we publish in a particular journal, we get excited and we go out for dinner. They would want that to continue and they would support me in the sense that if they think I need to focus more at work, I’m sure mom will help take care of my child. Whether I want it or not, I’m not sure, but I know she’ll step in. (…) My [partner] has been encouraging about my career in the
past, but you know things can change with the baby, and we haven’t spoken about it. We both joke sometimes, ‘maybe I should just leave my job,’ but we don’t consider that seriously so I suppose that’s sign of him being encouraging. He doesn’t talk seriously about me quitting my job. (YS11)
These accounts do not tell of a set of gender roles that would prevent women from pursuing a research oriented career, but once they become mothers, they take on a different role that is still more heavily related to care-work related re-sponsibilities than it is for men / fathers.
Discrimination Related to Ethnicity / Racism
We did not hear many accounts of racial or ethnic discrimination, but while the discrimination of women does not refer to a minority, racial or ethnic discrimination usually does and it should therefore be less likely that we hear of it. While talking about the existence and effects of gender discrimination did not seem difficult because it seemed a rather commonly acknowledged topic, talking about racial or ethnic discrimination seemed to be accompanied by a more tense at-mosphere and the interviewees usually seemed less willing to discuss the issue in-depth. As the low number of accounts defies the chance to tell whether or not we are talking about a more gen-eral issue, we would just like to point to a particu-lar kind of racial or ethnic discrimination where members of the majority of a country are being discriminated in their own country: it refers to the situation where Asians apply for a position in pri-vate institutions in higher education that have ties with universities in western countries and are discriminated because the customers of these institutions seem to expect to be taught by west-ern academics.
I think we’re quite… our institutions are mature enough to see beyond race. In fact my school has a lot of Asians. I can’t say the same for many other institutions, private institu-tions, you know, like the ones that tie with (..) universities [of western countries]. They like to see the white face. It’s not something that I mean we can change them. It’s just the way things are. It works against us. (YS22)
86
Particular Relevance of Seniority in Asia
The last kind of discrimination reported some interviewees was related to seniority and its particular importance in Asia. The difference in power between junior and senior is a rather com-mon aspect that does not relate to the biological age but can usually be attribute to different po-sitions achieved during differently long careers where senior scientists and scholars usually end up in positions of superiority related to the eval-uation of performance, career advancement, and funding to name but a few examples. Never-theless, the way our participants described the situations and could relate to their experiences in western countries, may highlight a particular importance of seniority in Asia.
No, I have not [been discriminated / been treated unfairly], whether in terms of being female, or in terms of being international student (..). There’s a hierarchy in [ASEAN country] so I guess there could be a difference, or what you might call discrimination based on age and experience, which is much less noticeable than in [western country] where once you’re graduate student, I think people treat you as a peer, as a scientist more than here (..), where you’re seen as a young sci-entist, and that you’re still learning, which is true of course, but the hierarchy is more pronounced here (..). (YS03)
4.4. Integration of Findings
The following chapter will provide integrated find-ings focused on the specific research objectives for the GloSYS ASEAN regional study as outlined in chapter 2.5. This integration of findings needs to observe some limitations First, the focus will be on the integration of the findings based on the data from questionnaire and interviews (chapters 4.2. and 4.3) as this is genuinely new data collected by this project. Still, problem that cannot be solved within the limitations of this study is the assessment of the representativity of the sample as relevant information on the stratification of the target population is missing the data sources available to this project. Second, findings based on interpretation of statistical data on the higher education and research sys-tems of the countries participating in the study (chapter 4.1) can only provide a very impression of the countries as the indicators that could be included within the limits of this study are
rather rough measures which can only provide a basic outline of national contexts, but are not detailed enough to support direct causal inter-pretations. In particular, more advanced analy-ses of other features salient to understanding the national higher education and research sys-tems would be required, which would include aspects such as the structure of higher educa-tion and research systems (types and number of different institutions), systems of performance evaluation, promotion systems, more detailed information from funding agencies, alternate labour market opportunities, and other more general aspects such as gender relations. Some of this information could be gradually covered by the indicators provided in chapter 4.1, other aspects will require further investigation.
What are the key factors and challenges that influence the creativity and innovation of young scientists and scholars in ASEAN both on a na-tional and individual level?
Findings from the analysis of the questionnaire data and interviews highlight the following fac-tors that should be considered of major rele-vance:
• Time for meaningful research. This fac-tor has two aspects. First, it applies to funding cycles that young scientists and scholars perceive as too short to produce meaningful findings. Related to this, it is conducive to provide continuity in funding streams in a given area so that research-ers are not forced to shift between topics and can dedicate themselves to acquire a high level of expertise. Second, it refers to the day-to-day allotment of time reserved for research that is threatened by the time required for other duties that are not by themselves producing value – admin-istrative tasks. In particular those related to performance evaluations seem to take up a rather large part of the time that is available to young scientists and scholars (see chapter 4.2.1., Figure 36). Findings from the interviews reported in chapter 4.3.1. support the impression, that per-formance evaluation is a very time con-suming tasks as it often seems to be both extensive and requires staying up-to-date with changing KPI systems.
• Performance evaluation that is not pri-marily focused on the quantity of the (academic) output. KPIs that put em-
87
phasis on the quantitative academic out-put may be incentives for young scientists and scholars to be productive, but the con-cepts of creativity and innovation primarily relate to the creation and implementation of something with a new quality. Assess-ing the quality of creative work is a widely acknowledged challenge but it is indis-pensable to identify those early career researchers that are able to go beyond quantitative achievements. The world wide trend towards the measurement of quanti-tative indicators of performance has been outlined in chapter 2.3. as part of a new governance system in higher education and the aim to participate successfully in world university rankings. Though attaining a high position in these ranking may be a reasonable strategic goal for the higher education system at the national level, it may not be helpful to promote creative research that can result in successful innovation and collaboration with local communities and economy as related by some interviewees (see chapter 4.3.3).
• Funding and other resources, and the ability to access these resources. Funding of research and international mo-bility, access to journals, the availability of adequately qualified support staff are obstacles that young scientists and schol-ars report as factors with an impact on their career and work. In some cases, the inability to identify funding sources and the limited experience with application procedures is a factor by itself as reported in the findings from the questionnaire (see chapter 4.2.1., Figure 42) and inter-views (chapter 4.3.1.).
• Opportunities for meaningful exchange. From the accounts of the interviewees, meaningful professional exchange with international researchers and between higher education / research organizations and industry seem to be very helpful oppor-tunities to acquire the personal cognitive capacities required for being creative. Data from the questionnaire indicates that Singapore and, to a lesser degree, Malaysia are performing comparatively well in providing these kind of exchanges (see chapter 4.2.1, Figure 46).
What are support mechanisms that promote the creativity and innovation, and the mobili-ty of young scientists and scholars in ASEAN countries?
• Support of relevant professional ex-change – both at international level be-tween researchers as well as between academia / research organizations and industry. Though data from the question-naire tells that organizations do quite well in providing opportunities of exchange be-tween higher education / research organ-izations and industry (see Figure 46), this is not reflected in actual collaborations on publications or projects (see Figures 47 and 48). Findings from the interviews would still support the impression of a gap between higher education and industry (see chapter 4.3.1., section on ‘Support’).
• Continue bonded PhD programs / pro-grams with the obligation to return home. A high proportion of participants of the online-survey reported that they required the resources offered by those programs to earn their PhD abroad.
To what extent do young scientists tend to continue their research in ASEAN countries?
• Findings from the questionnaire data tell of limited mobility between countries in the region based on accounts from the ca-reer history of the participants. The inten-tions for regional mobility with a duration of more than 3 months are reported to be equally limited. The rather low motivation to leave the country needs to be consid-ered in light of possible restrictions on mobility due to recent participation in a bonded PhD program.
• Findings from the questionnaire data tell that the participants have more collabo-ration with researchers from other conti-nents than within the region (see Figures 47 and 48, chapter 4.2.2.).
• Findings from the interviews mostly sup-port this impression: Singapore is usually considered the most important and ma-ture higher education and research sys-tem that offers opportunities for academic advancement and career opportunities. Nevertheless, some accounts from the in-terviews with young scientists and schol-ars tell of more differentiated perspec-
88
tives which talk about specific centres of excellence in individual countries that can also be of interest.
Whether experiences gained from the mobility can advance the creativity and innovation of young scientists and scholars in ASEAN countries?
Young scientists and scholars have offered accounts on a wide range of issues related to international mobility, with the majority of the accounts referring to subject related matters, learning from new sources, and opportunities to expand their networks and start collabora-tions (see chapter 4.3.2.). In general, all these accounts tell of meaningful opportunities for learning, exchange and personal growth. These experiences allow them to see ‘things from a dif-ferent angle’, get to know different solutions to a problem and also learn of different approaches on how to solve problems in general. All these experiences can therefore be considered con-ducive to advance the creativity and innovation of young scientists and scholars in ASEAN coun-tries.
Are there differences in creativity between countries and disciplines?
At first sight, the analysis of the questionnaire data provides the picture of a rather homoge-neous sample. Statistical analysis indicates that respondents from Indonesia and Malaysia tend to agree more strongly with the items on personal characteristics, knowledge, attributes, and be- haviours in comparison to early career research-ers from Singapore and Thailand (see Figures 59 and 60 in chapter 4.3.3). Their answers could be interpreted as particular strengths. Why these differences exist cannot be answered by the data from the questionnaire. As the trend ob-served in the data is rather consistent, cultural differences in answering this particular type of questions may moderate answers to this ques-tion. Differences between disciplines or fields of research are very limited. The number of inter-views should be considered too small to support a sustainable comparison between countries or disciplines.
How can policy makers and universities/ research institutes in Asia ensure that early career researchers are provided with ade-quate training and acquire the necessary
skill required to contribute to science and research on a global scale and, at the same time, are responsive to the challenges of the Asian continent on a national and regional level?
• Continue to promote international mobility at earlier stages of the ca-reer (e.g. grants for masters’ and PhD studies abroad, with or without bonded condition). Findings from the interviews (chapter 4.3.2.) tell of broad gains related to the acquisition of skills and general experience that allows to better assess standards of research in international comparison. Though differences with re-gard to different resources and opportu-nities may be apparent when returning to the home country, the benefit of personal experience and opportunities to establish personal networks seem to outweigh the realization of current limitations.
• Highlight particular centres of excel-lence within the ASEAN region and promote lab visits or other sorts of ex-change. At the whole system level, the higher education and research systems of most ASEAN countries do not yet seem interesting for young scientists and schol-ars, in particular to those who had the opportunity to gain experience in more mature systems on other continents. Find-ings based on data from the question- naire (Figures 47 and 48 in chapter 4.2.2) tell of higher levels of collaboration with researchers from other continents than from the region, which may be due to high rates of participation in bonded PhD programs. Notwithstanding, findings from the interviews tell of a more differentiat-ed assessment of regional opportunities by the participants of the study (chapter 4.3.2.).
• Train the mentors – they may not know how to mentor young scientists and scholars. The skill to guide early career researchers in their development is some- thing that some senior researchers may have acquired during the course of their career by process of informal learning, but there is little evidence senior research- ers have systematic knowledge on how to guide young scientists and scholars in their post-doc phase. While teaching and mentoring PhD students is a more

89
aspect of their day to day teaching and research experience, supporting early ca-reer researchers navigating their career in the post-doc phase requires a different approach and is still less researched. This is reflected in data from the ques-tionnaire and comments in the interviews that highlight some particular challenges of early career researchers that address issues beyond the research related skills that are of main concern during the PhD phase of their career. Findings from the questionnaire highlight support in gaining funding and being introduced to impor-tant networks to be of the highest priority (Figure 43, chapter 4.2.1.). Experiences related by early career researchers during the interviews leave the impression that it may need some luck to encounter a good mentor which implies that mentoring of sustainable value to the early career re-search cannot yet be considered a given fact and needs to be developed.
• Consider adjustments to the regula-tions of bonded PhD programs. A rele-vant proportion of participants of these programs has voiced in the interviews the interest not return immediately after earning the PhD. Possibly, extending the allowance to stay for a limited number of postdoc positions may significantly in-crease the experience that these young scientists and scholars could contribute upon their return or by different means. The option to stay abroad an additional period of time may be related to condi-tions, such as a postdoc position in a uni-versity or institute currently ranked highly and specific obligations to the country.

90
5. The last section (4.4 Integration of findings), leads us to propose the following 6 recommen-dations:
1. Make investment in highly skilled hu-man resources sustainable by providing mentoring and support for young scien-tists and scholars to facilitate access to necessary resources and help them navi-gate their postdoc career.
Early career researchers who have already earned a PhD at home or abroad can be con-sidered a high value investment which in many cases is at least partly based on public funding. For young scientists and scholars to live up to their full potential and continue a research ori-ented career, it needs a last act of mentoring to help them navigate the new challenges of the postdoc phase of their career. This may be achieved by
• providing systematic training and men-toring on how to identify funding sources and writing applications to allow them to become self-sustainable by acquiring funds from various national and interna-tional sources. This may take the form of half- or full day workshops as a part of an integrated program for an initial phase following the acquisition of the PhD. The program might include other aspects such as balancing research and teaching workloads.
• supporting the mentors in mentoring early career researchers as the seniors may not have received mentoring themselves or would benefit of a systematic introduction to the task. This might be achieved by sup- porting mentoring programs with a short introductory workshop for mentors that provide them with evidence on typical challenges of the postdoc phase and how to address them during the course of a mentoring process that has clear limita-tions on duration and what mentees can expect from their mentor.
2. Foster international, regional, and intersectoral collaboration by continuing to support opportunities for meaningful professional exchange.
This could be followed up by
• supporting exchange between academia, the business enterprise sector, and other sectors of the society that facilitate visibi-lity of research and career opportunities. To promote collaboration with industry, opportunities for lab visits are a means to offer early career researchers a better un-derstanding of the expectations and op-portunities in the private business sector.
• promoting international and regional exchange with other researchers. For regi-onal exchange, joint funding programmes, conferences, and grants for stays in neigh-bouring countries may provide incentives for collaboration.
3. Make best use of the potential of early career researchers by ensuring they can play to their strength.
The PhD has the primary objective to train young scientists and scholars to be able to conduct research and to engage in other science related tasks like teaching, consulting, or the implemen-tation of innovations in the business enterprise sector. Supporting them in focusing on what they have been prepared for may be supported by:
• reducing unnecessary administrative du-ties to the required minimum by reviewing system level and organizational policies.
• providing adequate support staff to sup-port them with menial tasks. This requires properly trained staff to help with applica-tions, reporting, guidance in issues such as ethical approval or other tasks that researchers only have to engage in from time to time.
Recommendations

91
4. Align performance evaluation with the goals to be achieved and review procedu-res regarding the efficiency of the evalua-tion process.
Performance evaluation can provide a means to promote productivity, but it can also stifle already existing motivation to achieve excellence. Revie-wing existing systems of performance evaluati-on might consider
• checking balance of ‘accountability’ and ‘freedom’ to not dampen the curiosity and creativity of young scientists and scho-lars. Systems of performance evaluation should be able to account for different – and changing – strengths of young scien-tists and scholars across different tasks.
• reducing the time required to participate in the mandatory performance evalua-tions. Organizations that have multiple and changing systems performance eva- luation might force their employees to spend unnecessary much time on an acti-vity that by itself is not productive.
• considering the aims and consequences of the evaluation. Are the outcomes of the evaluation adequately related to a reward and career system? Are there intentions to support the improvement of the young scientists and scholars?
5. Amend bonded PhD programs.
Supporting to earn a PhD has proven to be a successful way of qualifying the pool for the next generation of researchers. During the process of earning the PhD, motivations change and other opportunities may arise that warrant conside-ring current regulations. To make best use of the strengths of young scientists and scholars, it might be worthwhile to
• keep in touch with those abroad and allow for negotiation of the career upon return to the home country. A career plan should be devised between the local universities and research institutions in order for the young scientists to develop relationship abroad that will benefit the country upon the scientists’ return.
• consider to allow a prolonged stay abroad under specified conditions. Offer the op-portunity to stay abroad after completion of the PhD if the young scientist or scholar
is able to acquire a postdoc position in a university or department ranked among the top positions in crucial fields of rese-arch. Depending on additional conditions, this might only apply to the first postdoc position.
• evaluate further postdoc positions. Once the young scientists return home after their graduation, home institutions may consider adopting the policy allowing them to do their second postdoc. Time to be spent during the postdoc should be counted under the bonded program.
6. Support further research on the state of young scientists and scholars.
While challenges of the PhD phase have alrea-dy seen extensive research, it is very much less known how early career researchers navigate the postdoc phase, what obstacles they en-counter and what kind of support they require. Further research and monitoring of their work and career is therefore required. This needs
• improving the statistical information on early career researchers and the most important subgroups (e.g. stratification by age, gender, employment sector, fields of research / academic discipline, and aca-demic rank / position) to allow an assess-ment of the representativity of further em-pirical studies, surveys or panel studies.
• conducting further studies on this parti-cular target group which should include longitudinal studies on career trajectories and a more in-depth understanding of particular challenges such as balancing research and teaching, following alterna-tive career trajectories within and outside academia, and the impact of internatio-nal mobility and the use of information technologies.

92
Aksnes, D. W., Rørstad, K., Piro, F. N., & Sivertsen, G. (2013). Are mobile researchers more productive and cited than non-mobile researchers? A large-scale study of norwegian scientists. Research Evaluation, 1–9. http://doi.org/10.1093/reseval/rvt012
Altbach, P. G. (Ed.). (1996). The International Academic Profession. Portraits of Fourteen Countries. San Francisco: Jossey-Bass.
Altbach, P. G. (1998). An International Crisis? The American Professoriate in Comparative Perspective. In P. G. Altbach (Ed.), Comparative Higher Education: Knowledge, the University and Development (pp. 75–91). Greenwich and London: Ablex Publishing Corporation.
Altbach, P. G. (Ed.). (2011). American Higher Education in the Twenty-First Century: Social, Political, and Economic Challenges. Baltimore: Johns Hopkins University Press.
Altbach, P. G., & Knight, J. (2007). The Internationalization of Higher Education: Motivations and Realities. Journal of Studies in International Education, 11(3-4), 290–305. http://doi.org/10.1177/1028315307303542
Altbach, P. G., Reisberg, L., & Rumbley, L. E. (2009). Trends in Global Higher Education : Tracking an Academic Revo-lution Trends in Global Higher Education. Higher Educa-tion, 22. http://doi.org/10.1016/j. Bse.2004.04.006
Arimoto, A. (2013). The Academic Profession in International and Comparative Perspectives : trends in Asia and the world. RIHE International Seminar Reports, (20), 1–22.
Arimoto, A. (2015). Institutionalization of the R-T-S Nexus in the Academic Profession from an International, Comparative Perspective. RIHE International Seminar Reports, (22), 1–26.
Arimoto, A., & Ehara, T. (Eds.). (1996). Daigaku kyôjushoku no daigakukyôjushoku [International comparison of the academic profession]. Tokyo: Tamagawa University Press.
Asian Development Bank (ADB). (2011). Higher Education Across Asia. An Overview of Issues and Strategies. Retrieved from http://www. Adb.org/sites/default/files/publication/29407/higher-education-across-asia.pdf
Asian Development Bank (ADB). (2012). Private Higher Education Across Asia: Expanding Access, Searching for Quality. Mandaluyong City: Asian Development Bank. Retrieved from http://www. Adb.org/sites/default/files/publication/29869/private-higher-education-across-asia.pdf
Auriol, L. (2010). Careers of Doctorate Holders: Employment and Mobility Patterns. Retrieved from http://www.uis.unesco.org/ScienceTechnology/Documents/44893058.pdf
Auriol, L., Misu, M., & Freeman, R. A. (2013). Careers of Doctorate Holders: Analysis of Labour Market and Mobility Indicators. Retrieved from http://www.oecd-ilibrary.org/docserver/download/5k43nxgs289w.
pdf?expires=1418306888&id=id&accname=-g u e s t & c h e c k s u m = 2 D 0 C 4 B 5 5 5 B B 7 B C 7 2 A -DE865A6434606DF
Auriol, L., Schaaper, M., & Felix, B. (2012). Mapping Careers and Mobility of Doctorate Holders: Draft Guidelines, Model Questionnaire and Indicators – Third Edition. Retrieved from http://www.oecd-ili-brary.org/docserver/download/5k4dnq2h4n5c.pdf?expi res=1418307167&id=id&accname=-g u e s t & c h e c k s u m = 3 D E E 4 8 5 3 B 8 D 2 F 76 C B -9B20617102A960A
Azman, N., Sirat, M., & Ahmad, A. R. (2014). Higher Education, Learning Regions and the Malaysian Transformation Policies. Higher Education Policy, 27(3), 301–321. http://doi.org/10.1057/hep.2013.26
Baruffaldi, S. H., & Landoni, P. (2012). Return mobility and scientific productivity of researchers working abroad: The role of home country linkages. Research Policy, 41(6), 1655–1665.
Bjarnason, S., Cheng, K.-M., Fielden, J., Lemaitre, M.-J., Levy, D., & Varghese, N. V (Eds.). (2009). A New Dynamic: Private Higher Education A New Dynamic: Private Higher Education. Secretary. Paris: UNESCO. Retrieved from http://unesdoc.unesco.org/images/0018/001831/183174e.pdf
Bowman, N. A., & Bastedo, M. N. (2011). Anchoring effects in world university rankings: exploring biases in reputation scores. Higher Education, 61(4), 431–444. http://doi.org/10.1007/s10734-010-9339-1
Brown, R. (Ed.). (2011). Higher Education and the Market. New York: Routledge. http://doi.org/10.1017/CBO9781107415324.004
Canibano, C., & Bozeman, B. (2009). Curriculum vitae method in science policy and research evaluation: the state-of-the-art. Research Evaluation, 18(2), 86–94. http://doi.org/10.3152/095820209X441754
Chapman, D. W., & Chien, C.-L. (2014a). Expanding out and up: What are the system-level dynamics? Case study of Malaysia and Thailand. In D. W. Chapman & C.-L. Chien (Eds.), Higher Education in Asia: Expanding Out, Expanding Up. The rise of graduate education and university research. (pp. 37–48). Montreal: UNESCO. Retrieved from http://www.uis.unesco.org/Library/Documents/higher-education-asia-graduate-university-research-2014-en.pdf
Chapman, D. W., & Chien, C.-L. (Eds.). (2014b). Higher education in Asia: Expanding Out, Expanding Up. The rise of graduate education and university research. Montreal: UNESCO. Retrieved from http://www.uis.unesco.org/Library/Documents/higher-education-asia-graduate-university-research-2014-en.pdf
Chapman, D. W., & Chien, C.-L. (2015). Dilemmas of Expansion: The Growth of Graduate Education in Malaysia and Thailand. Higher Education Studies, 5(3), 1–10. http://doi.org/10.5539/hes.v5n3p1
References

93
Chien, C.-L. (2014). International University Rankings: How do they compare? In D. W. Chapman & C.-L. Chien (Eds.), Higher Education in Asia: Expanding Out, Expanding Up. (pp. 65–68). Montreal: UNESCO. Retrieved from www.uis.unesco.org/Library/Documents/higher-education-asia-graduate-university-research-2014-en.pdf
Coates, H., Dobson, I. R., Goedegebuure, L., & Meek, V. L. (2014). The International Dimension of Teaching and Learning. In Huang, M. Finkelstein, & M. Rostan (Eds.), The Internationalization of the Academy: Changes, Realities and Prospects (pp. 105–118). Dordrecht: Springer.
Creswell, John W. (2014). Research Design: qualitative, quantitative, and mixed methods approaches. Los Angeles: Sage.
Cruz-Castro, L., & Sanz-Menendez, L. (2010). Mobility versus job stability: Assessing tenure and productivity outcomes. Research Policy, 39(1), 27–38. http://doi.org/10.1016/j.respol.2009.11.008
Culum, B. (2015). Academics and Service to Community: An International (European) Perspective. In W. K. Cummings & U. Teichler (Eds.), The Relevance of Academic Work in Comparative Perspective (pp. 139–162). Cham: Springer.
Culum, B., Roncevic, N., & Ledic, J. (2013). Facing new expectations – Integrating third mission activities into the university. In B. Kehm & U. Teichler (Eds.), The academic profession in Europe: New tasks and new challenges (pp. 163–195). Dordrecht: Springer.
Cummings, W. K., & Teichler, U. (Eds.). (2015). The Relevance of Academic Work in Comparative Perspective. Cham: Springer. http://doi.org/10.1007/978-3-319-11767-6
Day, N., & Muhammad, A. bin. (2011). Malaysia. The Atlas of Islamic-World Science and Innovation. Country Case Study No. 1. Retrieved from https://royalsociety.org/~/media/policy/projects/atlas-islamic-world/atlas-final-report. PDF
De Wit, H. (2011). Globalisation and Internationalisation of Higher Education. Revista de Universidad Y Sociedad Del Conocimiento (RUSC)., 8(2), 241–248. Retrieved from http://rusc.uoc.edu/ojs/index.php/rusc/article/view/v8n2-dewit/v8n2-dewit-eng
Ding, W. W., Murry, F., & Stuart, T. E. (2006). Gender Differences in Patenting in the Academic Life Sciences. Science, 313, 665–667.
Dollhausen, K., Lattke, S., Scheliga, F., Wolter, A., Spexard, A., Geffers, J., & Banscherus, U. (2013). Opening Higher Education to Adults. Final Report. Retrieved from http://ec.europa.eu/education/library/study/2013/adult-opening_en.pdf
Ellis, S., Polcuch, E. F., & Pathirage, R. (2009). Measuring R & D in Developing Countries: International Comparability and Policy Relevance. In V. L. Meek, U. Teichler, & M.-L. Kearny (Eds.), Higher Education, Research and Innovation: Changing Dynamics. (pp. 171–186). Kassel: INCHER. Retrieved from http://www.oei.es/pdf2/183071E.pdf
Emmons, R. A., & King, L. A. (1988). Conflict among personal strivings: immediate and long-term implications for psychological and physical well-being. Journal of Personality and Social Psychology, 54(6), 1040–1048. doi:10.1037/0022-3514.54.6.1040
Enders, J. (1997). The Academic Profession in Europe: A View from the Status Perspective. SSRN Electronic Journal, (97). http://doi.org/10.2139/ssrn.85948
Enders, J., & Kottmann, A. (2009). Neue Ausbildungs-formen – andere Werdegänge? Ausbildungs- und Berufsverläufe von Absolventinnen und Absolventen der Graduiertenkollegs der DFG. Weinheim: Wiley-VCH.
European Commission (2013). She Figures 2012. Gender in Research and Innovation. Statistics and Indicators.Economy and Society. Luxembourg. Retrieved from http://ec.europa.eu/research/science-society/docu-ment_library/pdf_06/she-figures-2012_en.pdf
Finkelstein, M. J. (2015). How National Contexts Shape Academic Careers: A Preliminary Analysis. In U. Teichler & W. K. Cummings (Eds.), Forming, Recruiting, and Managing the Academic Profession (pp. 317–328). Cham: Springer.
Friesenhahn, I., & Beaudry, C. (2014). Global State of Young Scientists: Project Report and Recommendations. Berlin. Retrieved from http://globalyoungacademy.net/wp-content/uploads/2015/06/GYA_GloSYS-report_webversion.pdf
Goepel, M., Hölzle, K., & Knyphausen-Aufseß, D. zu. (2012). Individuals’ Innovation Response Behaviour - A Framework of Antecedents and Opportunities for Future Research. Creativity and Innovation Management, 21(4), 412–426.
Hawkins, J. N., Mok, K. H., & Neubauer, D. E. (Eds.). (2012). Higher Education Regionalization in Asia Pacific: Implications for Governance, Citizenship, and University Transformation. New York: Palgrave Macmillan.
Holden, C. (2001). General Contentment masks Gender Gap in First AAAS Salary and Job Survey. Science, 294, 396–411.
Huang, F. (2011). The Academic Profession in East Asia : Changes and realities. RIHE International Seminar Reports, (17), 113–132.
Huang, F. (2014). The Internationalisation of the Academic Profession. In F. Huang, M. J. Finkelstein, & M. Rostan (Eds.), The Internationalization of the Academy: Changes, Realities and Prospects (pp. 1–21). Springer Netherlands. http://doi.org/10.1007/978-94-007-7278-6
Huang, F. (2015a). Building the world-class research univer-sities: a case study of China. Higher Education, 203–215. http://doi.org/10.1007/s10734-015-9876-8
Huang, F. (2015b). The Internationalization of the Academy in Asia: Major findings from the international survey. RIHE International Seminar Reports, (22), 55–68. http://doi.org/10.1007/978-3-319-16080-1_14

94
Huang, F. (2015c). The internationalization of the academy in East Asia. In U. Teichler & W. K. Cummings (Eds.), Forming, Recruiting and Managing the Academic Profession (pp. 259–270). Cham: Springer International Publishing. http://doi.org/10.1007/978-3-319-16080-1_14
Huang, F., Teichler, U., & Galaz-Fontes, J. F. (2014). Regionalisation of Higher Education and the Academic Profession in Asia, Europe, and North America. In F. Huang, M. Finkelstein, & M. Rostan (Eds.), The Internationalization of the Academy: Changes, Realities and Prospects (pp. 145–181). Dordrecht: Springer.
InterAcademy Partnership (IAP) (2016). Doing Global Science. A Guide to Responsible Conduct in the Global Research Enterprise. Princeton & Oxford: Princeton University Press. Retrieved from http://www.interacademycouncil.net/File. Aspx?id=29431
Jimenez-Rodrigo, M. L., Martinez-Morante, E., Garcia-Calvente, M. del M., & Alvarez-Dardet, C. (2008). Through gender parity in scientific publications. Journal of Epidemiology and Community Health, 62(6), 474–475.
Kasworm, C. E. (1993). Adult higher education from an international perspective. Higher Education, 25(4), 411–423.
Knight, J. (2003). Updated Definition of Internationalisation. The Boston College Center for International Higher Education, (33), 2–3. Retrieved from http://www. Bc.edu/content/dam/files/research_sites/cihe/pdf/IHEpdfs/ihe33.pdf
Knight, J. (2004). Internationalization remodeled: Definition, approaches, and rationales. Journal of Studies in International Education, 8(1), 5–31. http://doi.org/10.1177/1028315303260832
Knight, J. (2012a). Concepts, Rationales, and Interpretative Frameworks in the Internationalization of Higher Education. In D. K. Deardorff, H. de Wit, J. D. Heyl, & T. Adams (Eds.), The Sage Handbook of International Higher Education (pp. 27–42). Los Angeles: Sage.
Knight, J. (2012b). A Conceptual Framework for the Regionalization of Higher Education: Application to Asia. In J. N. Hawkins, K. H. Mok, & D. E. Neubauer (Eds.), Higher Education Regionalization in Asia Pacific. Implications for Governance, Citizenship and University Transformation (pp. 17–35). Palgrave Macmillan.
Lavriere, V., Ni, C., Gingras, B., & Sugimoto, C. (2013). Global gender disparities in science. Nature, 12, 211–213.
Lee, M. N. N. (2011). Higher Education in Southeast Asia in the Era of Globalization. In J. J. F. Forest & P. G. Altbach (Eds.), International Handbook of Higher Education (pp. 539–555). Dordrecht: Springer. http://doi.org/10.1007/978-1-4020-4012-2_27
Lee, M. N. N. (2012). Regional Cooperation in Higher Education in Asia and the Pacific. In J. N. Hawkins, K. H. Mok, & D. E. Neubauer (Eds.), Higher Education
Regionalization in Asia Pacific. Implications for Gover-nance, Citizenship and University Transformation (pp. 37–44). New York: Palgrave Macmillan.
Legard, R., Keegan, J., & Ward, K. (2003). In-depth Interviews. In J. Ritchie & J. Lewis (Eds.), Qualitative Research Practice. A Guide for Social Science Students and Researchers (pp. 138–169). London: Sage.
Lendel, I., Allen, P., & Feldman, M. (2009). University-based Economic Growth. In M. Tight, K. H. Mok, J. Huisman, & C. C. Morphew (Eds.), The Routlegde International Handbook of Higher Education (pp. 381–396). Routledge.
Levin, R. C. (2010). The Rise of Asia’s Universities. Retrieved from http://communications.yale.edu/president/speeches/2010/01/31/rise-asia-s-universities
Ley, T. J., & Hamilton, B. H. (2008). The Gender Gap in NIH Grant Applications. Science, 322, 1472–1474.
Maassen, P. A. M., & Vught, F. van (Eds.). (1996). Inside Aca-demia. New Challenges for the Academic Profession. Utrecht: De Tijdstroom.
Macfarlane, B. (2005). Placing service in academic life. In R. Barnett (Ed.), Reshaping the university: New relations between research scholarship and teaching (pp. 165–177). Berkshire: Open University Press.
Marginson, S., Kaur, S., & Sawir, E. (2011b). Global, Local, National in the Asia-Pacific. In S. Marginson, S. Kaur, & E. Sawir (Eds.), Higher Education in the Asia-Pacific. Strategic Responses to Globalization. (pp. 3–34). Dordrecht: Springer.
Marginson, S., Kaur, S., & Sawir, E. (Eds.). (2011a). Higher Education in the Asia-Pacific. Strategic Responses to Globalization. Dordrecht: Springer.
Mitchell, D. E., & Nielsen, S. Y. (2012). Internationalization and Globalization in Higher Education. Globalization – Education and Management Agendas, 3–22. http://doi.org/http://dxDoi.org/10.5772/48702
Mohamedbhai, G. (2011). Higher Education in Africa: The Challenges Ahead. Higher Education Forum, 8, 23–26.
Mohamedbhai, G. (2014). Massification in Higher Educa-tion Institutions in Africa: Causes, Consequences, and Responses. International Journal of African Higher Education, 1(1), 59–81.
Mok, K. H. (2007). Questing for internationalization of universities in Asia: Critical reflections. Journal of Studies in International Education, 11(3-4), 433–454. http://doi.org/10.1177/1028315306291945
Mok, K. H. (2008a). Changing education governance and management in Asia. International Journal of Educational Management, 22(6), 462–463. http://doi.org/10.1108/09513540810895408
Mok, K. H. (2008b). Singapore’s global education hub ambitions: University governance change and trans-

95
national higher education. International Journal of Educational Management, 22(6), 527–546. http://doi.org/10.1108/09513540810895444
Mok, K. H. (2010). When state centralism meets neo- liberalism: Managing university governance change in Singapore and Malaysia. Higher Education, 60(4), 419–440. http://doi.org/10.1007/s10734-009-9307-9
Mok, K. H. (2012). The quest for innovation and entrepre-neurship: the changing role of university in East Asia. Globalisation, Societies and Education, 10(3), 317–335. http://doi.org/10.1080/14767724.2012.710120
Mok, K. H. (2013). The quest for an entrepreneurial univer-sity in East Asia: Impact on academics and administra-tors in higher education. Asia Pacific Education Review, 14(1), 11–22. http://doi.org/10.1007/s12564-013-9249-x
Mok, K. H. (2014). Enhancing Quality of Higher Education for World-Class Status. Chinese Education & Society, 47(August 2015), 44–64. http://doi.org/10.2753/CED1061-1932470103
Mok, K. H., & Wei, I. P. (2008). Contested Concepts, Similar Practices: The Quest for the Global University. Higher Education Policy, 21(4), 429–438. http://doi.org/10.1057/hep.2008.23
OECD (2002). Frascati Manual: Proposed Standard Practice for Surveys on Research and Experimental Development. The Measurement of Scientific and Technological Activities (Vol. 6th). http://doi.org/10. 1787/9789264199040-en
OECD (2005). Oslo Manual. Guidelines for Collecting and Interpreting Innovation Data. Communities (Vol. Third edit). Paris: OECD Publications. Retrieved from http://www.oecd-ilibrary.org/docserver/download/ 9205111e.pdf?expires=1462388475&id=id&accna-me=guest&checksum=4339A57E405D9852254A-604ABDECC303
OECD (2007). Revised fields of science and technology (FOS) Classification in the Frascati Manual. Retrieved from http://www.oecd.org/sti/inno/38235147.pdf
Ritchie, J., Lewis, J., & Elam, G. (2003). Designing and Selec-ting Samples. In J. Ritchie & J. Lewis (Eds.), Qualitative Research Practice. A Guide for Social Science Students and Researchers (pp. 77–108). London: Sage.
Ritchie, J., Spencer, L., & O’Connor, W. (2003). Carrying out Qualitative Analysis. In J. Ritchie & J. Lewis (Eds.), Qualitative Research Practice. A Guide for Social Science Students and Researchers (pp. 219–262). London: Sage.
Rostan, M. (2015). International Aspects of Academic Work and Career at the Beginning of the Twenty-First Century. In U. Teichler & W. K. Cummings (Eds.), Forming, Recru-iting and Managing the Academic Profession (pp. 241–258). Cham: Springer. http://doi.org/10.1007/978-3-319-16080-1
Rostan, M., & Höhle, E. A. (2014). The International Mobi-lity of Faculty. In F. Huang, M. Finkelstein, & M. Rostan (Eds.), The Internationalization of the Academy: Chan-ges, Realities and Prospects (pp. 55–77). Dordrecht: Springer.
Rostan, M., Ceravolo, F. A., & Metcalfe, A. S. (2014). The Internationalization of Research. In F. Huang, M. Finkelstein, & M. Rostan (Eds.), The Internationalization of the Academy: Changes, Realities and Prospects (pp. 119–143). Dordrecht: Springer.
Rostan, M., Finkelstein, M., & Huang, F. (2014). A Profile of CAP Participating Countries and a Global Overview of Academic Internationalization in 2007-2008. In F. Huang, M. Finkelstein, & M. Rostan (Eds.), The Inter-nationalization of the Academy: Changes, Realities and Prospects (pp. 37–54). Dordrecht: Springer.
Rungfamai, K. (2011). Research Universities in Thai-land : Challenges to Governance. The University of Hong Kong. Retrieved from http://hub.hku.hk/hand-le/10722/174344
Schaaper, M. (2014). The Case for Graduate Education: Does University-Based Research really lead to National Economic Development? In D. W. Chapman & C.-L. Chien (Eds.), Higher Education in Asia: Expanding Out, Expanding Up. The rise of graduate education and university research. (pp. 49–64). Montreal: UNESCO. Retrieved from http://www.uis.unesco.org/Library/Documents/higher-education-asia-graduate-university-research-2014-en.pdf
Schuetze, H. G., & Alvarez Mendiola, G. (2012a). Introduction. In H. G. Schuetze & G. Alvarez Mendiola (Eds.), State and Market in Higher Education Reforms (pp. 1–5). Rotterdam: Sense Publishers.
Schuetze, H. G., & Alvarez Mendiola, G. (Eds.). (2012b). State and Market in Higher Education Reforms Trends, Policies and Experiences. Sense Publishers.
Schuetze, H. G., & Slowey, M. (Eds.). (2000). Higher Educa-tion and Lifelong Learners: International Perspectives on Change. London: RoutledgeFalmer.
Scott, P. (2015). Mass to Market Higher Education Systems: New Transitions or False Dawn? In P. Zgaga, U. Teichler, H. G. Schuetze, & A. Wolter (Eds.), Higher Education Reform: Looking Back – Looking Forward (pp. 49–63). Frankfurt/Main: Peter Lang.
Shen, H. (2013). Mind the Gender Gap. Nature, 495, 22–24.
Shin, J. C., Jung, J., Postiglione, G. A., & Azman, N. (2014). Research Productivity of Returnees from Study Abroad in Korea, Hong Kong, and Malaysia. Minerva, 52(4), 467–487. http://doi.org/10.1007/s11024-014-9259-9
Shin, J. C., Postiglione, G. A., & Huang, F. (Eds.). (2015). Mass Higher Education Development in East Asia. Springer. http://doi.org/10.1007/978-3-319-12673-9
96
Slowey, M., & Schuetze, H. G. (2012). All change – no change? Lifelong learners and higher education revisited. In Global Perspectives on Higher Education and Lifelong Learners (pp. 3–21).
Smeby, J.-C., & Gornitzka, A. (2010). All cosmopolitans now? The changing international contacts of university researchers. In A. Gornitzka & L. Langfeldt (Eds.), Borderless Knowledge. Understanding the “new” in-ternationalization of research and higher education in Norway. (pp. 37–50). Dordrecht: Springer.
Sternberg, R. J. (2006). The Nature of Creativity. Creativity Research Journal, 18(1), 87–98.
Sternberg, R. J. (2012). The Assessment of Creativity: An In-vestment-Based Approach. Creativity Research Journal, 24(1), 3–12.
Sugimura, M. (2012). The Function of Regional Networks in East Asian Higher Education. In J. N. Hawkins, K. H. Mok, & D. E. Neubauer (Eds.), Higher Education Regio-nalization in Asia Pacific. Implications for Governance, Citizenship and University Transformation (pp. 45–64). New York: Palgrave Macmillan.
Teichler, U. (1996). The Conditions of the Academic Profession: An International, Comparative Analysis of the Academic Profession in Western Europe, Japan and the USA. In P. A. M. Maassen & F. A. van Vught (Eds.), Inside Academia: New Challenges of the Academic Profession (pp. 15–65). Utrecht: De Tijdstroom.
Teichler, U. (1998). Massification: A challenge for institutions of higher education. Tertiary Education & Management, 4(1), 17–27. http://doi.org/10.1080/13583883.1998.9966942
Teichler, U. (2006). Principles of Comparative Higher Education Research. In Reports of Changing Academic Profession Project Workshop on Quality, Relevance, and Governance in the Changing Academia: International Perspectives (pp. 267–277). Hiroshima: RIHE. Retrieved from http://rihejoho.hiroshima-u. Ac.jp/pdf/73782.pdf
Teichler, U. (2011). Academic Staff Mobility. In U. Teichler, I. Ferencz, & B. Wächter (Eds.), Mapping mobility in European higher edcuation. Volume I: Overview and trends (pp. 111–146). Brussels. Retrieved from http://www. Acup. Cat/sites/default/files/teichlerfe-renczwaechtermappingmobilityineuropeanhighere-ducation.pdf
Teichler, U., Arimoto, A., & Cummings, W. K. (Eds.). (2013). The Changing Academic Profession. Major Findings of a Comparative Survey. Dordrecht: Springer.
The Royal Society. (2010). The Scientific Century. Securing our Future Prosperity. London. Retrieved from https://royalsociety.org/~/media/Royal_Society_Content/policy/publications/2010/4294970126.pdf
The World Bank. (2000). Higher education in developing countries: Peril and promise. Washington. Retrieved from http://siteresources.worldbank.org/INTAFR-REGTOPTEIA/Resources/Peril_and_Promise.pdf
Torrance, E. P. (1962). Guiding Creative Talent. NJ: Prentice Hall.
Torrance, E. P. (1974). Torrance Tests of Creative Thinking. Lexington, MA: Personnel Press.
Trow, M. (1972). The expansion and transformation of higher education. International Review of Education, 18(1), 61–84. http://doi.org/10.1007/BF01450272
Trow, M. (1973). Problems in the Transtition from Elite to Mass Higher Education. Carnegie Commission on Higher Education.
UNESCO. (2015). UNESCO Science Report. Towards 2030. Retrieved from: http://unesdoc.unesco.org/images/ 0023/002354/235406e.pdf
Vabo, A., Padilla-Gonzalez, L. E., Waagene, E., & Naess, T. (2014). Gender and Faculty Internationalization. In F. Huang, M. Finkelstein, & M. Rostan (Eds.), The Internationalization of the Academy: Changes, Realities and Prospects (pp. 183–205). Dordrecht: Springer.
Valerio, A., Parton, B., & Robb, A. (2014). Entrepreneurship Education and Training Programs around the World. Dimensions for Success. http://doi.org/10.1596/978-1-4648-0202-7
Varghese, N. V., & Martin, M. (Eds.). (2014). Governance Reforms in Higher Education: A study of institutional autonomy in Asian Countries. Paris: International Institute for Educational Planning (iiep). Retrieved from http://www.iiep.unesco.org/fileadmin/user_upload/Info_Services_Publications/pdf/2013/Gov_reform_in_HE_Asia.pdf
Varghese, N. V., Chien, C.-L., Montjourides, P., Tran, H., Sigdel, Sh., Katayama, H., & Chapman, D. W. (2014). The Reshaping of Higher Education Across Asia. In D. W. Chapman & C.-L. Chien (Eds.), Higher Education in Asia: Expanding Out, Expanding Up. The rise of graduate education and university research. (pp. 15–35). Montreal: UNESCO. Retrieved from http://www.uis.unesco.org/Library/Documents/higher-education-asia-graduate-university-research-2014-en.pdf
Wildavsky, B. (2010). The Great Brain Race. How Global Universities Are Reshaping the World. Princeton & Oxford: Princeton University Press.
Wolter, A. (2012). Germany: From individual talent to institutional permeability: changing policies for non-traditional access routes in German higher education. In M. Slowey & H. G. Schuetze (Eds.), Global Perspectives on Higher Education and Lifelong Learners (pp. 43–59). London: Routledge.
Wolter, A. (2015). Massification and Diversity: Has the Expansion of Higher Education Led to a Changing Composition of the Student Body? European and German Evidence. In P. Zgaga, U. Teichler, H. G. Schuetze, & A. Wolter (Eds.), Higher Education Reform: Looking Back - Looking Forward (pp. 149–171). Frankfurt/Main: Peter Lang.
Zgaga, P., Teichler, U., Schuetze, H. G., & Wolter, A. (2015). Introduction. Reforming Higher Education for a Changing World. In Higher Education Reform: Looking Back - Looking Forward (Vol. 8, pp. 11–25).

97
The Global Young Academy
The Global Young Academy aims to become the voice of young scientists around the world. To realize our vision we develop, connect, and mo-bilize new talent from six continents. Moreover we empower young researchers to lead interna-tional, interdisciplinary, and intergenerational dialogue with the goal to make global decision making evidence-based and inclusive.
Who we are
The GYA provides a rallying point for outstanding young scientists from around the world to come together to address topics of global importance. In 2014, the GYA has reached its full capacity with 200 members, leading young scientists (defined as an average age of 35 years and at the beginning of their independent academic career) from 67 countries and all continents, and 134 alumni. Members are selected for the excellence of their science and their commit-ment to service and are serving five-year terms. The vibrancy of the GYA results from the energy of its members who are passionate about the role of science in creating a better world. The GYA is governed by an Executive Committee that reflects the diversity of its membership and is supported by a Senior Advisory Board composed of outstanding scientists and science managers, respectively.
What we do
Global Young Academy activities are divided into three themes namely science and society, research environment, and science education and outreach. The GYA also supports the esta-blishment and coordination of National Young Academies around the world. The GYA has hel-ped to establish NYAs for example in Egypt, the Philippines, Japan, Zimbabwe, South Africa, Ni-geria, Israel, and Kenya, and has co-organized regional and global meetings.
As the voice of young scientists around the world, the GYA publishes statements on international science policy and the research environment for early-career researchers. The organization also maintains active links with international science organizations including the UN Secretary Gene-ral’s Scientific Advisory Board, the IAP – the Glo-bal Network of Science Academies, the Global Research Council and ICSU – International
Council for Science. As part of its global remit, the GYA works to reduce the science gap bet-ween developed and developing countries by connecting young scientists from different coun-tries. GYA members believe that scientists need to contribute more than their own research fin-dings to society. For example, many members take part in science education and outreach activities at schools and universities around the world.
Background
The GYA grew out of discussions amongst top young scientists from around the world conve-ned by the IAP for the Annual Meeting of New Champions of the World Economic Forum (“Summer Davos” meetings) in 2008 and 2009. The GYA was officially founded in February, 2010 with support by the IAP: the Global Network of Science Academies. With the help of the German National Academy of Sciences Leopoldina, the Berlin-Brandenburg Academy of Sciences and Humanities BBAW and the German Young Aca-demy, the GYA has received start-up funding from the Volkswagen Foundation. From 2011 until 2016, the GYA has been hosted generously by the BBAW in Berlin, and is now located at the Na-tional Academy of Sciences Leopoldina in Halle, Germany lead by a Managing Director with ex-tensive international experience. Since 2014 the German Federal Ministry of Education and Research is providing ample core-funding to the GYA.
www.globalyoungacademy.net


2017


![CSIE30300 Computer Architecture Unit 06: Containing Control Hazards Hsin-Chou Chi [Adapted from material by Patterson@UCB and Irwin@PSU]](https://static.fdocuments.us/doc/165x107/56649f455503460f94c664f1/csie30300-computer-architecture-unit-06-containing-control-hazards-hsin-chou.jpg)

![CSIE30300 Computer Architecture Unit 04: Basic MIPS Pipelining Hsin-Chou Chi [Adapted from material by Patterson@UCB and Irwin@PSU]](https://static.fdocuments.us/doc/165x107/5697c0131a28abf838ccc889/csie30300-computer-architecture-unit-04-basic-mips-pipelining-hsin-chou-chi.jpg)


![CSIE30300 Computer Architecture Unit 9: Improving Cache Performance Hsin-Chou Chi [Adapted from material by Patterson@UCB and Irwin@PSU]](https://static.fdocuments.us/doc/165x107/56649f075503460f94c1c9c7/csie30300-computer-architecture-unit-9-improving-cache-performance-hsin-chou.jpg)