Published 17 May 2018 Criminal Justice Statistics quarterly, … · 2018-05-17 · 1 Published 17...
30
1 Published 17 May 2018 Criminal Justice Statistics quarterly, England and Wales, 2017 Main points 1.64 million individuals dealt with by the CJS The total number of individuals formally dealt with by the criminal justice system is at a record low level (period 1970 to the year to 2017), at 1.64 million in the latest year. 1.39 million defendants were prosecuted The number of defendants prosecuted at magistrates’ courts has declined by 4% since 2016. This was largely driven by a 45,000 decrease in summary offences. The conviction ratio was 86% The overall conviction ratio increased in the latest year, from 85% in 2016 to 86% in 2017. It has seen a steady increase of around one percentage point per year since 2013. For indictable offences, the custody rate was 31.8% and ACSL was 20.0 months The custody rate for indictable offences has been increasing since 2010, from 23.9% to 31.8%. Over the last 10 years, average custodial sentence length (ACSL) has increased for these offences from 15.2 months to 20.0 months. Offenders with long criminal careers now account for over a third of the offending population, and the proportion of first time offenders has risen for the third year Over a third (36%) of the offending population had a long criminal career; an increase of 8 percentage points since 2010 and the proportion of first time offenders increased for the third year, with a 2 percentage point rise since 2010. This is the 2017 Criminal Justice Statistics calendar year annual bulletin; it is based on data that has undergone additional quality assurance (compared with year ending March and September data) and includes cases for previous periods that have become available since those previous publications. In addition to enabling the examination of high level trends, this bulletin includes a wider range of commentary on topics not covered in other quarterly publications, and is accompanied by various tools and experimental statistics enabling users to examine particular offences, outcomes and offender profiles in greater detail (see list below for details). For technical detail about sources, quality and terminology, please refer to the accompanying guide to criminal justice statistics.
Transcript of Published 17 May 2018 Criminal Justice Statistics quarterly, … · 2018-05-17 · 1 Published 17...

1
Published 17 May 2018
Criminal Justice Statistics quarterly, England and
Wales, 2017
Main points
1.64 million individuals dealt
with by the CJS
The total number of individuals formally dealt with by
the criminal justice system is at a record low level
(period 1970 to the year to 2017), at 1.64 million in
the latest year.
1.39 million defendants were
prosecuted
The number of defendants prosecuted at
magistrates’ courts has declined by 4% since 2016.
This was largely driven by a 45,000 decrease in
summary offences.
The conviction ratio was 86%
The overall conviction ratio increased in the latest
year, from 85% in 2016 to 86% in 2017. It has seen a
steady increase of around one percentage point per
year since 2013.
For indictable offences, the
custody rate was 31.8% and
ACSL was 20.0 months
The custody rate for indictable offences has been
increasing since 2010, from 23.9% to 31.8%. Over
the last 10 years, average custodial sentence length
(ACSL) has increased for these offences from 15.2
months to 20.0 months.
Offenders with long criminal
careers now account for over a
third of the offending
population, and the proportion
of first time offenders has
risen for the third year
Over a third (36%) of the offending population had a long criminal career; an increase of 8 percentage points since 2010 and the proportion of first time offenders increased for the third year, with a 2 percentage point rise since 2010.
This is the 2017 Criminal Justice Statistics calendar year annual bulletin; it is based on data
that has undergone additional quality assurance (compared with year ending March and
September data) and includes cases for previous periods that have become available since
those previous publications. In addition to enabling the examination of high level trends, this
bulletin includes a wider range of commentary on topics not covered in other quarterly
publications, and is accompanied by various tools and experimental statistics enabling
users to examine particular offences, outcomes and offender profiles in greater detail (see
list below for details). For technical detail about sources, quality and terminology, please
refer to the accompanying guide to criminal justice statistics.

2
Contents Introduction ................................................................................................................ 3
Changes and revisions in this publication .................................................................. 4
1. Overview of the Criminal Justice System ............................................................ 5
2. Out of Court Disposals ....................................................................................... 9
3. Court Proceedings and Convictions ................................................................. 14
4. Remands .......................................................................................................... 20
5. Sentencing ....................................................................................................... 23
6. Motoring ........................................................................................................... 27
7. Offending Histories ........................................................................................... 29
Further information ................................................................................................... 30
Products published as part of the Criminal Justice Statistics (annual) publication The following products are published as part of this release:
• This statistical bulletin, with commentary on trends in criminal justice statistics. The annual edition includes an additional chapter on motoring offences that is not included in the quarterly edition.
• An infographic showing key messages.
• A technical guide providing further information on how data is collected and processed, as well as information on legislation relevant to sentencing trends and background on the functioning of the criminal justice system.
• A set of overview tables, covering each section of this bulletin: an overview, out of court disposals, prosecutions, convictions, remand decisions, sentencing, motoring and offending histories. The overview tables document also includes a diagram showing numerical flows through the criminal justice system.
• Interactive data tools for Outcomes by Offence (which breaks down proceedings and outcomes by offence), Court outcomes by Police Force Area, Cautions and Penalty Notices for Disorder (Out of Court Disposals), Prosecutions and Convictions, Magistrates’ Court Remands, Crown Court Remands, Sentencing, Motoring, Crown Courts, Magistrates’ Courts, and Experimental Statistics: Principal offence proceedings and outcomes by Home Office offence code.
• CSV files underpinning all data tools, together with two additional CSV files being published for the first time, showing experimental statistics on information at the Home Office offence code level (i.e. by individual offence or the lowest-level grouping) – one on an all offence basis which gives information about prosecutions and convictions, and the other allows users to examine the non-principal offences for which defendants were prosecuted alongside their principal offence.
• Three Offending History data tools providing further information on first time entrants, previous offences and sanction statistics.
• An offence group classification guide outlining how offences are grouped in the ‘detailed offence group’ used in most of the tools.
• Links to interactive Sankey diagrams (a type of flow diagram, in which the width of the arrows is shown proportionally to the number each represents) presenting flows through the criminal justice system and offending histories.

3
Introduction
This report presents the key statistics on activity in the Criminal Justice System (CJS) for England and Wales. It provides information for January to December 2017 (referred to as the ‘latest year’) with accompanying commentary, analysis and presentation of longer term trends.
The data provides users with information about proven offending and its outcomes in England and Wales. The contents of this bulletin will be of interest to government policy makers in the development of policy and their subsequent monitoring and evaluation. Others will be interested in the way different crimes are dealt with in the CJS. Where appropriate, comparisons are made with various sources covering activity in the CJS – in particular, numbers of crimes recorded by and the outcomes assigned to those crimes by the police, which is the starting point for some of the crimes dealt with by other CJS agencies.
In this publication, criminal offences are divided into four main offence groups:
• Indictable proceedings cover the more serious offences such as violent and sexual offences and robbery. Initial proceedings are heard at magistrates’ courts but they then may be passed on to the Crown Court, either for sentencing, or for a full trial with a judge and jury. They are split into two categories:
• Indictable only offences, which can only be tried on indictment in the Crown Court by a judge and jury1; and
• Triable either-way offences, which are triable either summarily in a magistrates’ court or on indictment in the Crown Court;
• Summary proceedings cover typically less serious offences which are almost always handled entirely in magistrates’ courts when dealt with in court, with the majority being completed at the first hearing. They are split into two categories:
• Summary non-motoring proceedings, such as TV license evasion and less serious criminal damage; and
• Summary motoring proceedings, such as speeding and driving whilst disqualified.
The majority of information presented in this publication is reported on the principal offence and principal sentence. Where proceedings involve more than one offence, the principal offence is reported. The basis for the selection of the principal offence is as follows:
• Where a defendant is found guilty of one offence and acquitted of another, the offence selected is the one for which they are found guilty;
• Where a defendant is found guilty of two or more offences, the offence selected is the one for which the heaviest sentence is imposed;
1 All offences committed by a child or young person (someone aged 10-17 years old) can be dealt with by a youth court, subject to the following exceptions which mean that the offence must be dealt with by the Crown Court: homicide; grave crimes where the youth court has determined that, if convicted, a sentence beyond its powers should be available; firearms possession by 16-17 year olds; offences that would attract at least four years custody under the dangerousness provisions; and where it is necessary in the interests of justice to try a youth and adult together.

4
• Where the same disposal is imposed for two or more offences, the offence selected is the one for which the statutory maximum penalty is the most severe.
The offence shown for each court proceeding is the one for which the court took its final decision and is not necessarily the same as the offence for which the defendant was initially prosecuted, for example where the defendant is tried for murder but found guilty of manslaughter. Unless otherwise stated, the sentence shown is the most severe sentence or order given for the principal offence (i.e. the principal sentence) with secondary sentences given for the principal offence and sentences for non-principal offences not being counted in the tables. These statistics reflect all type of criminal offence dealt with by the courts, including those prosecuted by bodies other than the police (such as the TV license enforcement office).
Changes and revisions in this publication
Some additions and amendments have been made to the interactive tools published alongside this publication:
• Ethnicity – this was previously available in some tools and has now been made available across all tools where self-identified ethnicity data is collected.
• Quarter – An additional variable has been added to allow users to examine data on a quarterly basis. This is particularly useful for conducting further analysis on alternative time periods, such as financial year.
• Age group/range – where age groupings are available in the tools, they have been made consistent and greater transparency has been added to unknown ages. Previously, adults of unknown age were set to a default of 25, and juveniles with unknown age were set to 17. Further work has been completed and it is now possible to separate out individuals with unknown ages for juveniles and adults.
The tool which was previously known as Courts by CJA has been renamed as Court Outcomes by Police Force Area to more accurately represent the breakdowns available. A new CSV has been produced which covers proceedings and convictions by Home Office offence code on an all offence basis, called ‘Experimental statistics – All offence prosecutions and convictions by Home Office offence code’. This is particularly useful as it provides greater transparency around prosecutions for offences that typically happen alongside other offences that are more likely to attract a longer sentence. Additionally, there is an CSV file accompanying this bulletin called ‘Experimental statistics: Prosecutions for non-principal offences, by principal offence’ which presents experimental statistics on the numbers of defendants prosecuted for non-principal offences, alongside the principal offence for which the defendant was prosecuted. Data are presented at the offence detailed group level.

5
1. Overview of the Criminal Justice System
1.64 million individuals have been dealt with by the CJS
The total number of individuals formally dealt with by the criminal justice system is at a record low level (period 1970 to the year to 2017), at 1.64 million in the latest year.
The total number of individuals (which includes people and companies) prosecuted or given an out of court disposal in England and Wales has been declining since 2007, and was 1.64 million in 2017.
The number of defendants proceeded against fell by 4% compared to 2016, continuing the broad downward trend over the last 10 years, as can be seen in Figure 1.1. The chart also shows the reduction in use of out of court disposals, which fell by 14% in the last year, driven by a 28% reduction in Penalty Notices for Disorder (PNDs) and a 19% reduction in cautions.
Figure 1.1: Individuals dealt with by the CJS, 2007 to 2017 (Source: Prosecutions and
Convictions data tool and Out of Court Disposals data tool)
0
250
500
750
1,000
1,250
1,500
1,750
2,000
2,250
2,500
2,750
3,000
2007 2008 2009 2010 2011 2012 2013 2014 2015 2016 2017
To
tal in
div
idu
als
d
ealt
wit
h
(th
ou
san
ds)
12 months ending December
Proceeded against at magistrates' courts Issued out of court disposal
Comparisons with crime statistics
The flow chart in the overview tables and Sankey diagram accompanying this publication highlight flows through the Criminal Justice system. It is useful to consider associated crime data in the flow through to courts to provide additional context, though it is really police charges that are likely to be the in-flow for some prosecutions (rather than volumes of crimes themselves).

6
Firstly, the Crime Survey for England and Wales (CSEW)2 provides a broad estimate of victimisation. It showed there were 10.6 million incidents of crime in 2017, a 7% decrease compared with the previous year. The CSEW covers crimes against households and individuals and includes crimes which do not come to the attention of the police. The CSEW excludes a range of other crimes that would be recorded by either the police (such as murder, possession offences and ‘victimless’ crimes) or other authorities (such as television licence evasion or rail fare evasion). This is because the survey asks householders for their experience as victims (rather than offenders). A different source of crime information, police recorded crime3 increased by 13% compared to the previous year, to 5.4 million. This increase is believed to be a driven by improved recording among police forces and victims’ greater willingness to report crimes, with genuine increases in some low volume crime types. Police recorded crime covers all indictable and triable either-way offences. Additionally, a few closely associated summary offences are included.
Once a crime is recorded by the police, an investigation takes place and the police force assigns one of a number of outcomes to the crime4. These include where a suspect is charged or summonsed, an out of court disposal or an explanation as to why no further action is taken, for example due to evidential difficulties, the offender having died, or no suspect being identified. It seems reasonable to expect figures on prosecutions to broadly follow trends in police charges for similar offences. However, there are important issues to consider:
- Time-lag – once a police charge has been issued, the next step is to send the case to court, typically the magistrates’ court in the first instance, and for the more serious offences, subsequently to the Crown Court. Prosecution figures in this publication are based on cases completing within magistrates’ courts (which often includes where the case is sent for trial to the Crown Court).
- Differences in counting – Home Office data count the number of offences where at least one person was charged by the police or summonsed, so will include offences where more than one suspect was later prosecuted. Criminal justice data on prosecutions count the number of defendants proceeded against
- Differences in coverage – although the offence grouping names are the same for recorded crime and prosecution data, our data on prosecutions count summary offences outside of the main offence categories. For example, prosecutions for common assault and battery (assault without injury) are recorded in summary non-motoring offences, but Home Office data on charges includes in violence.
The number of recorded crimes where somebody was charged by the police or summonsed in 2017 was 510,584, a 3% decrease on 2016. Meanwhile, the number of defendants prosecuted for indictable offences (excluding fraud, to be consistent with charges) fell over the same period by around 7%. Variations between these two figures are expected given the factors outlined above.
2 More information on the Crime Survey for England and Wales can be found here: https://www.ons.gov.uk/surveys/informationforhouseholdsandindividuals/householdandindividualsurveys/crimesurveyforenglandwales 3 More information on police recorded crime published by ONS can be found here: https://www.ons.gov.uk/peoplepopulationandcommunity/crimeandjustice/bulletins/crimeinenglandandwales/yearendingdecember2017 4 Crime outcomes recorded by the police are published by the Home Office: https://www.gov.uk/government/statistics/crime-outcomes-in-england-and-wales-year-to-december-2017-data-tables
7
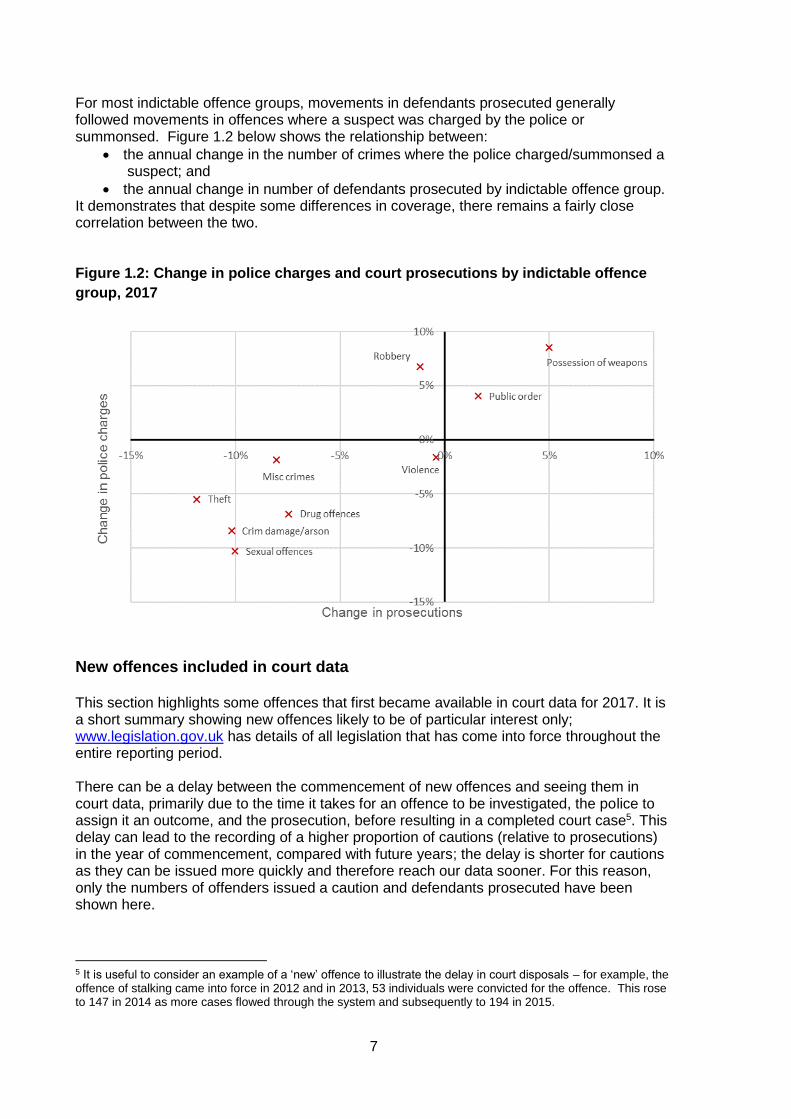
For most indictable offence groups, movements in defendants prosecuted generally followed movements in offences where a suspect was charged by the police or summonsed. Figure 1.2 below shows the relationship between:
• the annual change in the number of crimes where the police charged/summonsed a suspect; and
• the annual change in number of defendants prosecuted by indictable offence group. It demonstrates that despite some differences in coverage, there remains a fairly close correlation between the two. Figure 1.2: Change in police charges and court prosecutions by indictable offence
group, 2017
New offences included in court data This section highlights some offences that first became available in court data for 2017. It is a short summary showing new offences likely to be of particular interest only; www.legislation.gov.uk has details of all legislation that has come into force throughout the entire reporting period. There can be a delay between the commencement of new offences and seeing them in court data, primarily due to the time it takes for an offence to be investigated, the police to assign it an outcome, and the prosecution, before resulting in a completed court case5. This delay can lead to the recording of a higher proportion of cautions (relative to prosecutions) in the year of commencement, compared with future years; the delay is shorter for cautions as they can be issued more quickly and therefore reach our data sooner. For this reason, only the numbers of offenders issued a caution and defendants prosecuted have been shown here.
5 It is useful to consider an example of a ‘new’ offence to illustrate the delay in court disposals – for example, the offence of stalking came into force in 2012 and in 2013, 53 individuals were convicted for the offence. This rose to 147 in 2014 as more cases flowed through the system and subsequently to 194 in 2015.

8
Immigration Act 2016
New offences under the Immigration Act 2016 were introduced in 2017. These included triable either-way offences relating to contraventions of tenancy agreements in relation to immigration status, which have a max penalty of five years imprisonment. Additionally, schedule 4A introduced summary offences relating to information disclosure and failing to comply with requirements made by relevant officer. Air Navigation Order 2016
Several new triable either-way and summary non-motoring offences were introduced under the Air Navigation Order in 2017 relating to contraventions in aircraft operation, performance of duties and conduct. One of these offences relates to being drunk in an aircraft, which is a triable either way offence with a maximum penalty of 2 years imprisonment. For this offence there were 51 prosecutions and 47 convictions in 2017. Serious Crime Act 2015
Section 67 of the Serious Crime Act 2015 brought in a new triable either-way offence relating to sexual communication with a child. The maximum penalty for this offence is 2 years imprisonment; in 2017, 46 defendants were prosecuted and 21 convicted.

9
2. Out of Court Disposals
Out of court disposals6 have been declining since 2007 Out of court disposals (OOCDs) are sanctions that are used by the police to address offences without the need to be dealt with at court. The use of out of court disposals has decreased since 2007. In 2017, 246,000 people were issued an out of court disposal, compared with 670,000 in 2007; a 63% fall overall. This fall would be even greater (79%) if considered excluding community resolutions (for which we hold data back to 2015) from the 2017 total. Community resolutions are an out of court disposal the police can use to deal with antisocial behaviour and low-level crime. Previous editions of this bulletin excluded community resolutions in totals for out of court disposals; they were rolled out in 2008/097, but this is the first annual publication for which three full years of data are available for incorporation into the OOCD trend. Figure 2.1: Out of court disposals issued, by disposal type, 2007 to 2017 (Source:
Table A1.1)
0
100
200
300
400
500
600
700
2007 2008 2009 2010 2011 2012 2013 2014 2015 2016 2017Pers
on
s issu
ed
an
ou
t o
f co
urt
dis
po
sal
(th
ou
san
ds)
12 months ending DecemberCommunity Resolutions Cannabis and khat warnings
Penalty Notices for Disorder Cautions for summary non-motoring offences
Cautions for indictable offences There are a number of likely reasons for the decrease, many of which shift the focus towards more serious offences, including:
- The removal of the Offences Brought to Justice (OBTJ) target in 2008 - Changes in police activity, including a reduction in the use of police stop and
searches since 2010 - Changes in targets set within police forces on ‘clear up’ rates that may have
promoted use of these disposals,
6 Out of court disposals (OOCDs) are sanctions that are used by the police, with reference to the Crown Prosecution Service (CPS), to address offences without recourse to the courts. The out of court disposals available to the police and the Crown Prosecution Service in 2017 included penalty notices for disorder (PNDs), simple and conditional cautions, cannabis and khat warnings and community resolutions. 7 Separately identifiable data on community resolutions were collected from police forces for the first time under the full crime outcomes framework introduced from April 2014. As such, data for years prior to year ending December 2015 are not available.

10
- Other changes in legislation that have restricted the use of cautions (Criminal Justice and Courts Act 2015) and PNDs (to adults only from 2013)
The proportion of people issued Penalty Notices for Disorder (PNDs) has decreased The use of PNDs has been decreasing year on year. In 2017, 25,900 were issued compared with 36,200 in 2016; a 28% decrease. Since 2007, the volume of PNDs issued decreased by 88%.
In 2017, four higher tier offences comprised of 91% of all PNDs issued; namely drunk and disorderly (41%), possession of cannabis (20%), retail theft of goods under the value of
£100 (19%) and behaviour likely to cause harassment, alarm or distress (12%). The predominance of these offences has been broadly consistent over time since 2009, when the four offences comprised 86% of the total volume of PNDs issued. Figure 2.2: Penalty Notices for Disorder issued for higher and lower tier offences,
2007 to 2017 (Source: Table Q2.1)
0%
10%
20%
30%
40%
50%
60%
70%
80%
90%
100%
2007 2008 2009 2010 2011 2012 2013 2014 2015 2016 2017
Pro
po
rtio
n o
f P
ND
's issu
ed
12 months ending December
Causing harassment, alarm or distress Drunk and disorderlyTheft (retail under £100) Possession of CannabisOther higher tier offences Lower tier offences
The proportion of people who paid their fines in full remained relatively stable in 2017, compared with 2016; falling one percentage point from 51% (18,500) to 50% (12,800). Those fined for late payment also remained stable, falling one percentage point in 2017 (32%) compared with 2016 (33%).

11
Police cautions and cautioning rates have decreased In 2017, 84,000 offenders were given either a simple or conditional caution8; an 19% decrease compared with 2016. The trend for cautions issued has fallen since 2007, when 362,900 were issued (representing a 77% decline). Around half (51%) of cautions issued in 2017 were for indictable offences. Drug offences, theft and violence against the person were the most common indictable offences for which an offence received a caution (accounting for 80% of all cautions for indictable offences). Volumes of cautions decreased across all offence groups in 2017 compared to 2016, except for violence against the person and robbery, both of which rose slightly in 2017. The volume of cautions issued to offenders for indictable sexual offences decreased by 26% in 2017 compared with 2016; and continuing the downward trend with a 63% fall from 2007. In 2017, 2% of offenders cautioned for indictable offences were cautioned for sexual offences. Figure 2.3: Proportion of offenders cautioned for indictable offences, by offence
group, 2007 to 2017 (Source: Table Q2.2)
8 The majority of information presented in this publication is on the principal offence and principal sentence. Where prosecutions involve more than one offence, the principal offence is reported. See the technical guide for more information.

12
The overall cautioning rate9 has decreased to 10.7% in 2017, compared with 12.5% during 2016 – this reflects reductions in cautioning rates for both juveniles (37.3% to 35.1%) and adults (11.3% to 9.6%) over that period. The cautioning rate for indictable offences also decreased in 2017, continuing the downward trend in each year since 2007. In 2017, the cautioning rate decreased to 15.9% compared with 17.3% in 2016 and from 39.6% at its peak in 2007. The cautioning rate decreased across all offence groups except robbery and violence against the person, where in 2017 they increased by less than one percentage point compared with 2016. The summary offence cautioning rate also continues to decline, and in the latest year it decreased to 8.0% compared with a peak of 24.3% in 2007. Figure 2.4: Cautioning rate for indictable and summary offences, 2007 to 2017
(Source: Table Q2.3)
0%
5%
10%
15%
20%
25%
30%
35%
40%
45%
2007 2008 2009 2010 2011 2012 2013 2014 2015 2016 2017
Cau
tio
nin
g r
ate
12 months ending December
Cautioning rate: Indictable Offences Cautioning rate: Summary Offences
Cautioning rate: All Offences
9 The cautioning rate is the number of offenders who were given a caution divided by the number who were either cautioned or convicted (excluding convictions for motoring offences).

13
Cautions for rape offences are less common than a decade ago There were 18 cautions administered for rape offences in 2017, compared with 11 cautions in 2016. All 18 of these were administered to juveniles10, 7 were aged 12-14 and 11 aged 15-17.
Of the 18 cautions administered in 2017:
• 11 were for rape of a female aged under 13;
• 5 were for rape of a male aged under 13;
• 1 was for rape of a female aged under 16; and
• 1 was for rape of a male aged under 16.
The number of cautions given for rape offences has generally decreased over time. Between 2007 and 2011, an average of 29 cautions for rape offences were given each year. This compares with 17 per year between 2012 and 2017. There were around 3,100 offenders prosecuted for rape in 2017. While this is considerably higher than 2007 (2,400 prosecutions), the number of offenders prosecuted for rape has fallen consecutively in the last two years. The use of cannabis and khat warnings continues to decline The trend for cannabis and khat warnings issued has been declining since 2008 (108,300 issued)11. In 2017, 32,000 cannabis and khat warnings were issued. This is a decrease of 7% compared with 2016 (when 34,300 were issued), and a fall of 68% since 2007 (when there were 99,500). Fewer community resolutions12 were issued in 2017 compared with 2016 In 2017, 104,100 community resolutions were administered by the police. This has decreased by 7% since 2016, when 111,500 were issued.
10 Reasons for giving a caution for a rape offence are presented in the technical guide 11 See Table A1.1 in the accompanying Overview Tables. 12 Further information about community resolutions can be obtained from the Home Office publication: https://www.gov.uk/government/collections/crime-outcomes-in-england-and-wales-statistics

14
3. Court Proceedings and Convictions
1.39 million defendants were prosecuted in 2017
The number of defendants prosecuted at magistrates’ courts has declined by 4% since
2016. This was largely driven by a 45,000 decrease in summary offences.
The conviction ratio was 86%
The overall conviction ratio increased in the latest year, from 85% in 2016 to 86% in
2017. It has seen a steady increase of around one percentage point per year since 2013.
Defendants will start proceedings at magistrates’ courts, regardless of the seriousness of the offence charged against them13. Less serious offences (summary offences) will be entirely dealt with by magistrates’ courts. The most serious indictable offences (indictable only offences) must be tried at the Crown Court, the remaining indictable offences (triable either-way) can either be tried at a magistrates’ court or Crown Court. The number of defendants prosecuted has shown a further decrease in 2017 In 2017, 1.39 million defendants were prosecuted at magistrates’ courts, a reduction of 4% since 2016. While the number of defendants prosecuted has fallen generally since 2007 (by 20% overall), there have been some short-term fluctuations with a recent peak in 2015. Summary offences have continued the decline seen in 2016, driving the large decrease in the number of offenders prosecuted. Summary non-motoring and summary motoring have decreased by 5% and 3% respectively in the latest year. The number of defendants prosecuted for indictable offences also decreased between 2016 and 2017 fell by 7% between 2016 and 2017 and by 33% since 2007, however, these offences account for a smaller number of prosecutions than summary offences
13 There are rare exceptions, as mentioned in the accompanying technical guide.

15
Figure 3.1 Defendants prosecuted at magistrates’ courts, 2007 to 2017, and proportions of all proceedings for 2007, 2012, and 2017 (Source: Table Q3.2)
0
100
200
300
400
500
600
700
800
2007 2008 2009 2010 2011 2012 2013 2014 2015 2016 2017
Defe
nd
an
ts p
roceed
ed
ag
ain
st
(th
ou
san
ds)
Year
Indictable offences Summary non-motoring offences
Summary motoring offences Prosecutions for all groups of indictable offences have declined since 2016, except for possession of weapons and public order offences. The number of defendants prosecuted for possession of weapons increased by 5% between 2016 and 2017 (15,500 defendants prosecuted). The number of defendants prosecuted for public order offences increased by 2%, from 17,500 to 17,800. This follows an increase since 2016 for both of these offences, prior to which they had seen a steady decline since 2010. The number of defendants prosecuted for sexual offences decreased by 10%, from 12,600 in 2016 to 11,300 in 2017, as previously noted, these changes are broadly in line with the figures on police charges. Compared to 2016, there were large falls in the number of defendants prosecuted for:
• theft offences (a 12% decrease to 88,700 defendants),
• criminal damage and arson (10% decrease to 2,800 defendants), and
• sexual offences (10% decrease to 11,300).
In 2017, defendants prosecuted for summary motoring and summary non-motoring offences accounted for the same proportion of all defendants prosecuted (40% each). This trend has remained stable since last year, following a convergence over the last decade as the proportion of defendants prosecuted for summary motoring offences decreased as the proportion of summary non-motoring offences has increased.
16
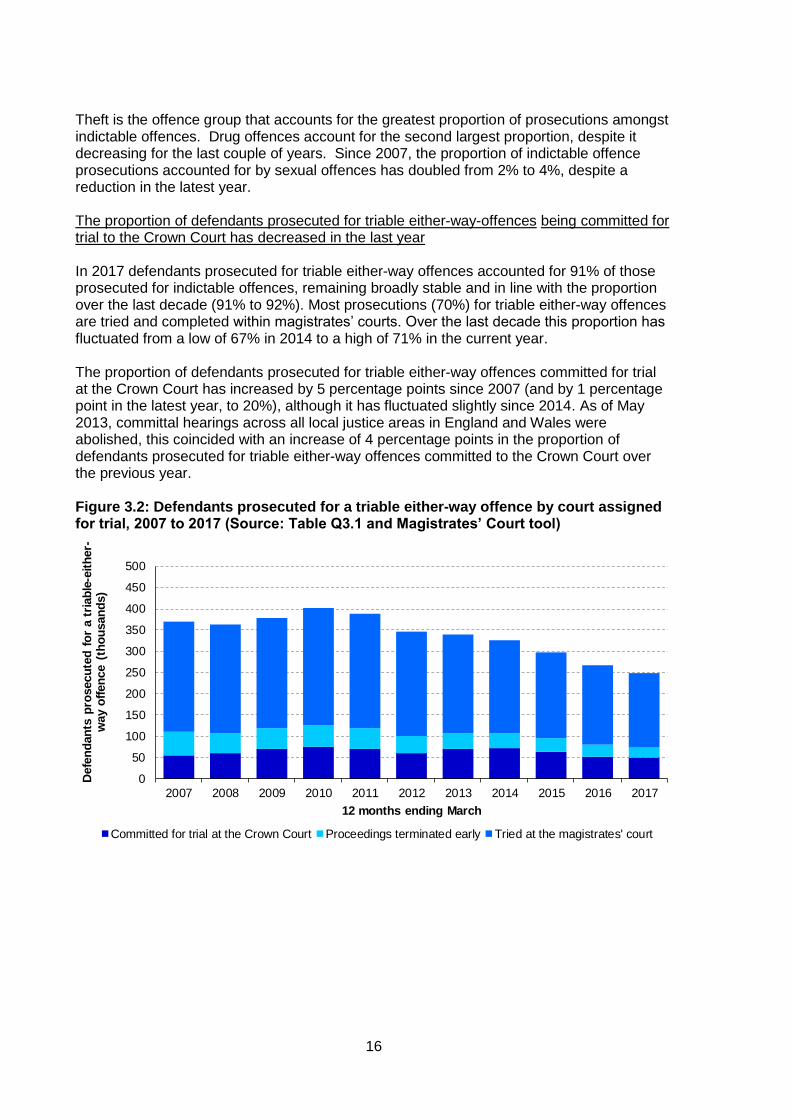
Theft is the offence group that accounts for the greatest proportion of prosecutions amongst indictable offences. Drug offences account for the second largest proportion, despite it decreasing for the last couple of years. Since 2007, the proportion of indictable offence prosecutions accounted for by sexual offences has doubled from 2% to 4%, despite a reduction in the latest year. The proportion of defendants prosecuted for triable either-way-offences being committed for trial to the Crown Court has decreased in the last year In 2017 defendants prosecuted for triable either-way offences accounted for 91% of those prosecuted for indictable offences, remaining broadly stable and in line with the proportion over the last decade (91% to 92%). Most prosecutions (70%) for triable either-way offences are tried and completed within magistrates’ courts. Over the last decade this proportion has fluctuated from a low of 67% in 2014 to a high of 71% in the current year. The proportion of defendants prosecuted for triable either-way offences committed for trial at the Crown Court has increased by 5 percentage points since 2007 (and by 1 percentage point in the latest year, to 20%), although it has fluctuated slightly since 2014. As of May 2013, committal hearings across all local justice areas in England and Wales were abolished, this coincided with an increase of 4 percentage points in the proportion of defendants prosecuted for triable either-way offences committed to the Crown Court over the previous year. Figure 3.2: Defendants prosecuted for a triable either-way offence by court assigned for trial, 2007 to 2017 (Source: Table Q3.1 and Magistrates’ Court tool)
0
50
100
150
200
250
300
350
400
450
500
2007 2008 2009 2010 2011 2012 2013 2014 2015 2016 2017
Defe
nd
an
ts p
rosecu
ted
fo
r a t
riab
le-e
ith
er-
way o
ffen
ce (
tho
usan
ds)
12 months ending March
Committed for trial at the Crown Court Proceedings terminated early Tried at the magistrates' court
17
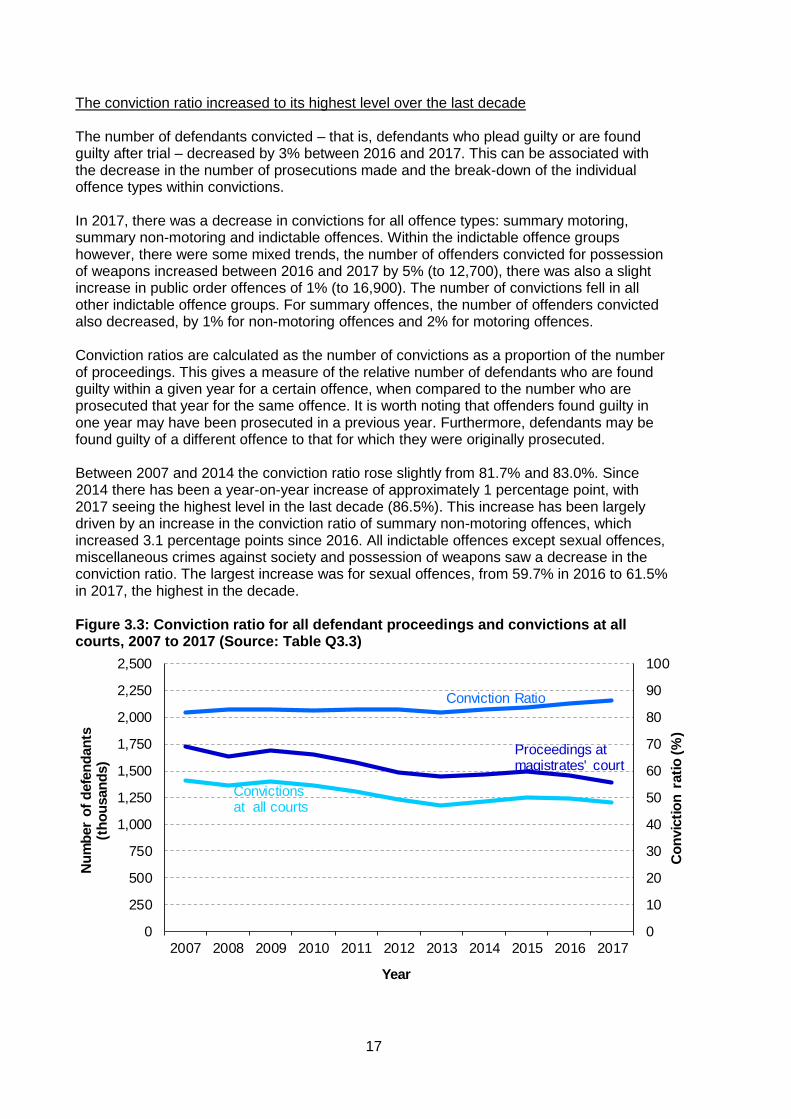
The conviction ratio increased to its highest level over the last decade The number of defendants convicted – that is, defendants who plead guilty or are found guilty after trial – decreased by 3% between 2016 and 2017. This can be associated with the decrease in the number of prosecutions made and the break-down of the individual offence types within convictions. In 2017, there was a decrease in convictions for all offence types: summary motoring, summary non-motoring and indictable offences. Within the indictable offence groups however, there were some mixed trends, the number of offenders convicted for possession of weapons increased between 2016 and 2017 by 5% (to 12,700), there was also a slight increase in public order offences of 1% (to 16,900). The number of convictions fell in all other indictable offence groups. For summary offences, the number of offenders convicted also decreased, by 1% for non-motoring offences and 2% for motoring offences. Conviction ratios are calculated as the number of convictions as a proportion of the number of proceedings. This gives a measure of the relative number of defendants who are found guilty within a given year for a certain offence, when compared to the number who are prosecuted that year for the same offence. It is worth noting that offenders found guilty in one year may have been prosecuted in a previous year. Furthermore, defendants may be found guilty of a different offence to that for which they were originally prosecuted. Between 2007 and 2014 the conviction ratio rose slightly from 81.7% and 83.0%. Since 2014 there has been a year-on-year increase of approximately 1 percentage point, with 2017 seeing the highest level in the last decade (86.5%). This increase has been largely driven by an increase in the conviction ratio of summary non-motoring offences, which increased 3.1 percentage points since 2016. All indictable offences except sexual offences, miscellaneous crimes against society and possession of weapons saw a decrease in the conviction ratio. The largest increase was for sexual offences, from 59.7% in 2016 to 61.5% in 2017, the highest in the decade. Figure 3.3: Conviction ratio for all defendant proceedings and convictions at all courts, 2007 to 2017 (Source: Table Q3.3)
0
10
20
30
40
50
60
70
80
90
100
0
250
500
750
1,000
1,250
1,500
1,750
2,000
2,250
2,500
2007 2008 2009 2010 2011 2012 2013 2014 2015 2016 2017
Co
nvic
tio
n r
ati
o (
%)
Nu
mb
er
of
defe
nd
an
ts
(th
ou
san
ds)
Year
Convictions at all courts
Proceedings at magistrates' court
Conviction Ratio

18
Conviction ratios by offence group Conviction ratios vary markedly for offence groups and this variation is driven by a number of factors, including the likelihood of a guilty plea for that offence, availability and accessibility of evidence and a number of secondary factors that can influence these (such as sentence lengths, witness and victim support, trial lengths etc.). In the latest year, conviction ratios ranged from around 62% for sexual offences to over 90% for public order and drug offences. Latest data for 2016 show that the guilty plea rate for public order and drug offences are relatively high, at around 66% and 82% respectively (see https://www.gov.uk/government/uploads/system/uploads/attachment_data/file/622925/ccsq-pivot-tables-by-offence-jan-mar-2017.xls) and it is also likely that evidence will be strong since for many drug offences, the defendant is found in possession of the items for the offence they have been accused of and for public order, often the offences are breaches of particular orders (anti-social behaviour or non-molestation). By contrast, sexual offences has the lowest guilty plea rate across all offence groups at around 34%, and can involve complex court cases, especially for those where consent is a significant issue for the case to consider. In addition, disclosure of evidence has been highlighted in recent high profile serious sexual offences cases and the CPS undertook a review of disclosure in early 201814. The impact of this review is likely to be seen over the course of the coming year in prosecutions and convictions for sexual offences, with a possible reduction in prosecutions, and increase in the proportion of these that result in a conviction. Convictions per 100,000 people continue to decrease for both adults and juveniles. Considering the number of convictions per 100,000 population enables an assessment of the rate at which a group is convicted, separate from any parallel changes in the number of that group in the population15. In 2017, there were 2,334 convictions per 100,000 population. The rate of juvenile and adult convictions per 100,000 population have both declined in the last decade to 1,782 per 100,000 and 3,106 per 100,000 population respectively. However, juvenile convictions per 100,000 population have declined by 74% over the last decade whereas the adult rate has declined by 18%. In 2017 the rate for juveniles decreased by 9% compared with 4% for adults. There are differences in the composition of offences by juveniles and adults. This means that although there are similar year on year trends in individual offence groups for adults and juveniles, they have differing effects on the overall rate. Specifically, both age groups saw a decrease in the number of prosecutions and convictions for summary motoring offences in 2017 compared with the previous year but this will have a much stronger effect on the overall adult rate. In 2017 summary motoring offences accounted for 41% of adults prosecuted and 42% of those convicted, compared with 9% of juveniles prosecuted and 10% of juveniles convicted. In contrast, indictable offences, for which the number of prosecutions and convictions has fallen for both adults and juveniles, accounted for 55% of juveniles prosecuted and 54% of those convicted, compared to 19% of adults prosecuted and 18% convicted in 2017.
14 https://www.cps.gov.uk/cps/news/joint-press-release-crown-prosecution-service-and-national-police-chiefs-council-action 15 To calculate proportions of convictions per 100,000 population, the total number of convictions for a specific year are divided by the population in the previous year. Population figures come from the ONS mid-year population estimates. The population of the previous year is used due to population data available at the time of publication.

19
Figure 3.4: Convictions per 100,000 population for juveniles and adults, 2007 to 2017 (Source: Table A3.1 and Office for National Statistics population estimates)
0
500
1,000
1,500
2,000
2,500
3,000
3,500
2007 2008 2009 2010 2011 2012 2013 2014 2015 2016 2017
Nu
mb
er
of
off
en
ders
co
nvic
ted
per
100,0
00
po
pu
lati
on
Year
Adult Juvenile

20
4. Remands
Police bail and custodial remands have been declining
In 2017 there were 1.46 million defendants directed to appear at magistrates’ courts (including those who failed to appear), decreasing by 4% between 2016 and 2017. Police officers make decisions on whether to detain or bail a defendant pending their first appearance in court or send a notice summoning them to appear in court. The number of defendants receiving either police bail or custodial remand has been decreasing over the last five years, whilst the number of defendants that were summonsed have been increasing. The proportion of defendants remanded in custody by the police has remained stable at 10% since 2015. The proportion of defendants arrested and bailed by police decreased to 19% in 2017, from 22% in the previous year and continuing the downward trend seen over the last five years. However, the proportion of defendants being summonsed increased from 68% to 71% between 2016 and 2017. The proportion of defendants remanded in custody at both magistrates’ and the Crown Court remained stable in 2017.
Court remands are court decisions on whether a defendant charged with a criminal offence should be held in custody, or released on bail, during the period of their trial or while they are awaiting sentence. Overall, the proportion of defendants remanded in custody has remained relatively stable at both courts over the last 5 years. In 2017, 35% of defendants tried or sentenced at Crown Court were remanded in custody, compared to 4% at magistrates.
Figure 4.1: Defendants’ remand status in magistrates’ courts and the Crown Court,
2013 to 2017 (Source: Table Q4.2 and Q4.3)
0%
10%
20%
30%
40%
50%
60%
70%
80%
90%
100%
2013 2014 2015 2016 2017 2013 2014 2015 2016 2017
Magistrates Court Crown Court
Remandedin custody
Remandedon bail
Notremanded

21
In the latest year, bail was granted to 16% of defendants prosecuted at magistrates’ courts, while 4% were remanded in custody and the remaining 80% were not remanded at magistrates’ courts. The proportion of defendants proceeded against at magistrates’ court who were not remanded has continued to increase over the last 5 years whereas the proportion of defendants remanded on bail has decreased and the proportion remanded in custody has remained relatively stable. Defendants are more likely to be remanded in custody for more serious, indictable offences than summary offences – as a result, the proportion of defendants remanded in custody at the Crown Court is higher than at magistrates’ courts. In the latest year, the proportion of defendants tried at the Crown Court who were remanded in custody was 35%, little change from the previous year. However, the proportion of defendants remanded on bail at Crown Court decreased between 2016 and 2017, from 47% to 45%. Defendants remanded in custody at the Crown Court were more likely to receive immediate custodial sentences Of those defendants remanded in custody at the Crown Court in 2017, 73% were sentenced to immediate custody, whereas, 16% of defendants remanded in custody by magistrates’ courts were sentenced to immediate custody. This contrast is likely to be associated with the high proportion (60%) of defendants remanded in custody at magistrates’ court who were committed for trial or sentencing at Crown Court. This reflects the more serious nature of their crimes, and as such it is expected that considerably more defendants remanded in custody at magistrates’ court will ultimately have received a custodial sentence. Figure 4.2: Outcome of proceedings for defendants remanded in custody in
magistrates’ courts and the Crown Court, 2017 (Source: Table Q4.4)
0% 10% 20% 30% 40% 50% 60% 70% 80% 90% 100%
Committed to trial/Sentenced
Aquitted
Failed to appear
Non Custodial Sentence
Immediate custody
Magistrates' Courts
Crown Court

22
In 2017, 77% of defendants remanded in custody received immediate custodial sentences of 12 months or more. In comparison, 78% of defendants remanded on bail and 46% of defendants not remanded received a custodial sentence of 12 months or more. Sentence lengths for defendants remanded in custody in the Crown Court who went on to receive an immediate custodial sentence have remained broadly similar over the last 5 years. Figure 4.3: Custodial sentence length for defendants remanded in custody and given
an immediate custodial sentence in the Crown Court, 2017 (Source: Crown Court
remand tool)
0%
10%
20%
30%
40%
50%
60%
70%
80%
90%
100%
2013 2014 2015 2016 2017
Over 12 months
12 months
Over 6 months toless than 12 months
6 months
Less than 6 months
23
5. Sentencing
For indictable offences, the custody rate was 31.8% and ACSL was 20.0 months
The custody rate for indictable offences has been increasing since 2010, from 23.9% to
31.8%. Over the last 10 years, average custodial sentence length (ACSL) has increased
for these offences from 15.2 months to 20.0 months.
The number of offenders sentenced at all courts continues to decrease, with 1.20 million
offenders sentenced in 2017; a 3% decrease since 2016, in line with a similar fall in
convictions. The decrease since 2016 is largely driven by triable either-way offences (a
18,500 decrease) and summary offences (a 18,400 decrease) across both court types.
There were small decreases in all sentences across all offence groups since 2016, with the
exception of possession of weapons which increased by 6% and public order offences
which increased by 1%.
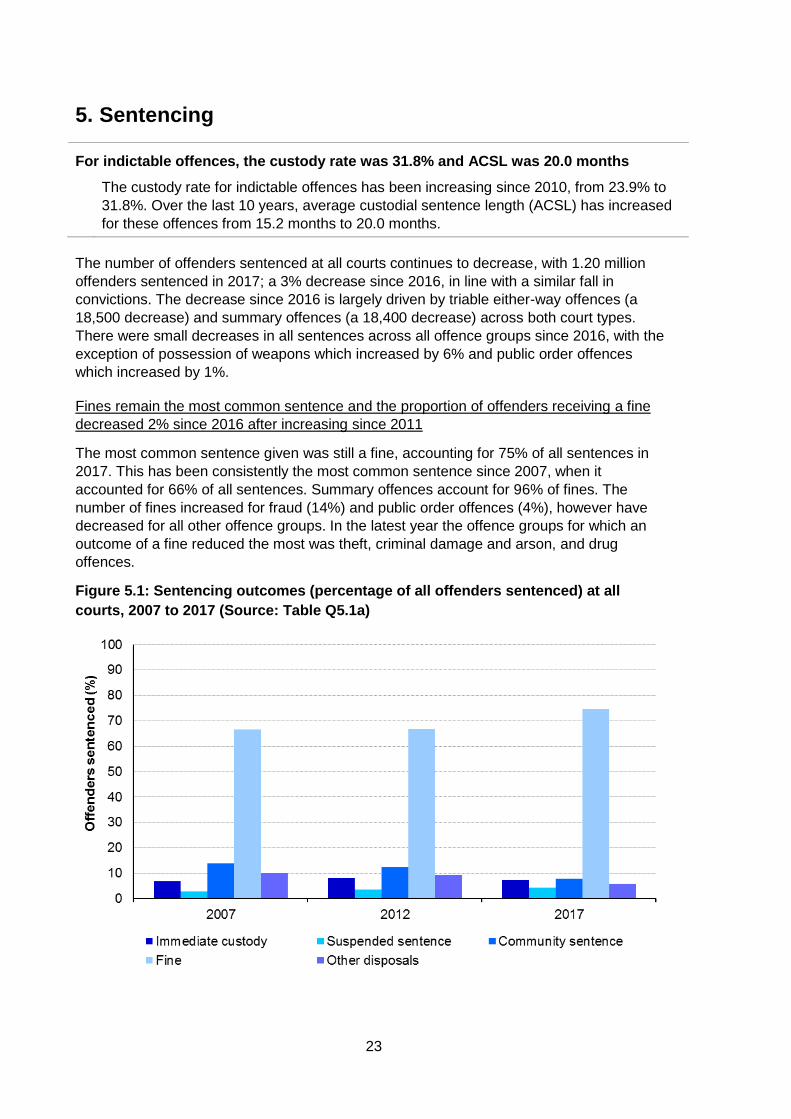
Fines remain the most common sentence and the proportion of offenders receiving a fine
decreased 2% since 2016 after increasing since 2011
The most common sentence given was still a fine, accounting for 75% of all sentences in
2017. This has been consistently the most common sentence since 2007, when it
accounted for 66% of all sentences. Summary offences account for 96% of fines. The
number of fines increased for fraud (14%) and public order offences (4%), however have
decreased for all other offence groups. In the latest year the offence groups for which an
outcome of a fine reduced the most was theft, criminal damage and arson, and drug
offences.
Figure 5.1: Sentencing outcomes (percentage of all offenders sentenced) at all
courts, 2007 to 2017 (Source: Table Q5.1a)

24
Offender outcomes vary by offence type
In 2017, 7% of all offenders received an immediate custody sentence, of which, 16% of
these sentences were 1 month or less, a 5% decrease since 2016. However, the proportion
(16%) remains the same. This was the most common custodial sentence length for
indictable offences (14%), however it is mainly driven by triable either way offences
receiving a custodial sentence of 1 month or less.
For indictable only offences, 73% received immediate custody, a larger proportion than any
other offence type, 70% of which received an immediate custodial sentence of 2 years or
more (including life sentences). Triable either way offences received a much wider variety of
sentences, however the most frequent outcome (29%) were also sentenced to immediate
custody. Of those committing triable either way offences and sentenced to immediate
custody, almost half (48%) were sentenced to less than 6 months in custody.
Figure 5.2: Sentencing outcomes for indictable only, triable either-way and summary
offences at all courts, 2017 (Source: Table Q5.1)
Considering indictable offences separately from summary offences makes it easier to see
trends in sentences other than fines for summary offences.

25
Figure 5.3: Trends in sentencing outcomes for indictable offences at all courts, 2007
to 2017 (Source: Table Q5.1)
The use of suspended sentences has been increasing
The number of offenders given a suspended sentence for indictable offences increased by
39% since 2007. Suspended sentences were considerably less common before the
introduction of the suspended sentence order with community requirements by the Criminal
Justice Act (CJA) in 2003. Under the LASPO Act 2012, these provisions were amended so
that, since December 2012, custodial sentences of two years or less can be suspended and
the imposition of community requirements is discretionary. This may have also contributed
to the 19% increase in suspended sentences for all offence types since 2012.
Community sentences continue to decline, and discharges have varied over the last few
years
The use of community sentences is decreasing across all offence and age groups; it has
decreased by 8% in the last year and by 52% over the past decade. The greatest decreases
in community sentences in 2017were for criminal damage and arson and miscellaneous
crimes against society. Community sentences for theft and drug offences decreased by
14% each since 2016.
After the sharp drop in absolute discharges in 2016 (of 47%), the latest year has seen an
increase of 10% to 5,200. Conditional discharges decreased by 14% since last year. This
translates to a 53% and 49% decrease for absolute and conditional charges respectively
since 2007.
The overall custody rate remains stable, despite a decrease in offenders being sentenced to
immediate custody
The custody rate (i.e. the proportion of sentences which result in immediate custody) has
remained broadly stable compared to the previous year, at 7.2%. It peaked in 2011 at 8.1%,
having increased since 2007 (when it was 6.8%), but fell between 2011 and 2017.

26
The number of people sentenced for possession of weapons increased by 6% between
2016 and 2017, of those sentenced, 35% were given immediate custody. Over the last year,
the number of immediate custodial sentences for possession of weapon offences increased
by 12% to 4,500, this is in contrast to the overall trend of fewer immediate custodial
sentences given for indictable offences by 4%.
The custody rate for sexual offences remained stable since 2016 and fraud offences
decreased from 21.2% to 20.2%, but for all other indictable offence groups, it increased.
The custody rate for indictable offences has increased by 1.3 percentage points since 2016,
to the highest rate of the last decade, (31.8%).
The largest increase in this period was seen in criminal damage and arson, from 28.0% in
2016 to 31.3% in 2017. Robbery continues to have the highest custody rate at 69.8%.
Average custodial sentence length is continuing to increase
Average custodial sentence length (ACSL) has increased since 2007 (from 12.4 to 16.9
months in 2017). This is despite a fall in the number of people sentenced to immediate
custody, meaning that less people are being sentenced to custody but those that are
generally receive longer sentences. This may be due to numerous changes in legislation
over the decade, including:
• The LASPO Act, which abolished IPPs and Extended Sentences for Public
Protection (EPPs) and replaced them with new Extended Determinate Sentences
(EDSs). EDSs are included within the ACSL calculation, whilst IPPs and EPPs were
previously excluded.
• The introduction of the Criminal Justice and Immigration Act (CJIA) in 2008 restricted
the use of indeterminate sentences for Public Protection (IPPs), which as
mentioned are excluded from ASCL. Following this, there has been an increase in
long determinate sentences (defined as for 10 years or more).
• Further legislative changes have made sentence lengths longer for certain offences
– for example, the powers to sentence offenders convicted of a third domestic
burglary offence to a mandatory minimum sentence of three years custody, as
introduced by the Crime (Sentences) Act 1997 for offences committed after 30th
November 1999, have been used increasingly in the last decade.
There was a small drop in ACSL of 0.2 months for sexual offences in the latest year,
although still 38% longer than a decade ago. The ACSL for sexual offences has been
consistently the longest amongst all offence groups, driving the total ACSL for all indictable
offences to 20.0 months in 2017. The largest increase in ACSL was for robbery; this
increased by 2.7 months in 2017.
The longer term increase of 4.5 months in overall ACSL is in part caused by the number of
people sentenced to immediate custody for sexual offences increasing by 47% as well as
the ACSL for sexual offences increasing by 16.6 months since 2007. The largest increase
within this offence group was for rape of a female child under 13 by a male, for which ACSL
has almost doubled and the number sentenced has doubled since 2007.
The total number of persons sentenced for sexual offences in 2017 was 7,000, up from
5,000 in 2007, but a decrease from 7,500 in 2016. This change was mirrored in
prosecutions and convictions.

27
6. Motoring
Prosecutions and convictions for motoring offences have increased The number of defendants prosecuted for motoring offences has decreased by 0.4% over the last year, from 667,000 in 2016 to 664,000, while the numbers of offenders convicted and sentenced have increased by 0.8%. Just over half (51%) of defendants prosecuted for motoring offences in 2017 were for prosecuted for speed limit and vehicle insurance offences. The conviction ratio for all motoring offences was at 90% in 2017 and has been increasing year on year since 2013, where the conviction ratio was 85%. Figure 6.1: Defendants prosecuted for motoring offences, 201716,17 (Source –
Motoring tool)
The offence with the largest decrease in the number of defendants prosecuted was ‘Speed limit offences’ (a 4% decrease; from 183,000 in 2016 to 176,000 in 2017). There were also decreases for ‘Using or causing others to use a mobile phone whilst driving’ (a 30% decrease; from 13,000 in 2016 to 9,000 in 2017) and ‘Driving with alcohol in the blood above the prescribed limit’ (an 8% decrease; from 38,000 in 2016 to 35,000 in 2017). Both of these offences had the lowest number of prosecutions in a decade. The offences with the largest increase in the number of defendants prosecuted were seen in ‘Vehicle registration and excise licence offences’ (a 20% increase; from 77,000 in 2016 to
16 Other motoring offences includes: Causing danger by interfering with a vehicle, road or traffic equipment, Using or causing others to use a mobile phone whilst driving, Careless driving offences (excl. mobile phone offences), Failing to stop or provide information after accident, Theft of a motor vehicle / aggravated vehicle taking, Work record and employment offences, Fraud, forgery etc. associated with vehicle or driver records, Defective vehicle parts, Vehicle test offences, Miscellaneous (other) motoring offences. 17 The Home Office publishes data on police action in relation to motoring offences including fixed penalty notices (FPNs) for speeding: https://www.gov.uk/government/collections/police-powers-and-procedures-england-and-wales Fixed penalty notices are available as out of court disposals where the speeding offence is not serious enough to warrant a criminal court proceeding and where the offender does not contest being issued with the FPN. The number of FPNs (when excluding those which were cancelled) fell by less than 1% between 2015 and 2016.

28
92,000 in 2017) and ‘Vehicle insurance offences’ (a 5% increase; from 156,000 to 164,000, the highest total over the last decade). In 2017, the number of the most serious motoring offences, causing death or injury, was the highest in a decade (900 prosecutions and 780 convictions), however their proportion among all motoring offence is still very small (0.1%). Prosecutions for ‘Causing death by dangerous driving’ saw the first decrease since 2013 falling slightly from 229 defendants prosecuted in 2016 to 225 in 2017. ‘Causing death by careless or inconsiderate driving’18 saw a slight increase, from 215 defendants prosecuted in 2016 to 237 in 2017. Prosecutions for ‘Causing serious injury by dangerous driving’ has increased every year since the offence was introduced in 201219, with an 18% increase in the most recent year (from 330 in 2016 to 389 in 2017). Other driving offences for causing injury saw few prosecutions. Sentencing trends for motoring offences have remained broadly stable The overall custody rate for motoring offences remained stable at 1% in 2017, although the vast majority of offenders sentenced for ‘Causing death by dangerous driving’ and ‘Causing death by careless driving under influence of drink or drugs’ received immediate custody (both offences had a custody rate of 91%). Where an offender was sentenced to immediate custody in 2017, the average custodial sentence length was 8.2 months, increasing from 7.7 months in 2016. The use of fines as the main sentence for motoring offences remained stable at 94% of offenders sentenced. This has been the case since 2014, although there has been an increase of 5 percentage points over the last decade. The total number of offenders directly disqualified from driving decreased 8% in the latest year; from 63,000 in 2016 to 58,000. The total number of offenders endorsed without direct disqualification (i.e. receiving points on their licence only), decreased by 2%, from 356,000 in 2016 to 348,000 in 2017.
18 The offence of ‘Causing death by careless or inconsiderate driving’ was introduced by the Road Traffic Act 1988 S.2B with commencement on 18th August 2008. 19 The offence of ‘Causing serious injury by dangerous driving’, introduced by the 2012 Legal Aid, Sentencing and Punishment of Offenders (LASPO) Act, was designed to create a specific offence of causing serious injury by dangerous driving to supplement the existing offences of dangerous driving and causing death by dangerous driving.

29
7. Offending Histories
Whilst the overall number of offenders convicted for an indictable offence has decreased, offenders with long criminal careers now account for over a third of the offending population, and the proportion of first time offenders has risen for the third year.
As highlighted in table Q3.2a, the number of offenders convicted for an indictable offence has been decreasing year on year since 2010, falling by 35%. Over the same period the proportion who are first time offenders and those with a long criminal career(20) has increased. In 2017 over a third (36%) of the offending population had a long criminal career; an increase of 8 percentage points since 2010. Similarly, the proportion of first time offenders increased for the third year, with a 2 percentage point rise since 2010.
Figure 7.1: Offenders convicted for indictable offences by previous criminal history,
2007 to 2017 (Source: Table A7.2)
0%
5%
10%
15%
20%
25%
30%
35%
40%
45%
2007 2008 2009 2010 2011 2012 2013 2014 2015 2016 2017
Pro
po
rtio
n o
f o
ffen
ders
co
nvic
ted
Year
15 or morepreviousconvictions/cautions
1-6previousconvictions/cautions
7-14previousconvictions/cautions
0 previousconvictions/cautions
Recent police recorded crime figures published by the ONS(21) showed a 25% increase in the number of weapons possession offences recorded in 2017 when compared with 2016, and over the same period the number of first time offenders convicted for this offence type has also increased (11%). In 2017 the number of juvenile and adult first time offenders convicted of a weapons possession offence was at its highest level since 2007 (836 and 1,614 offences respectively) with the number of juvenile first time offenders more than doubled and for adults increased by 59%. A 20% increase in the number of violence against the person offences recorded by the police between 2016 and 2017 was reported in the recent police recorded crime figures. In 2017 there was also an increase in the number of offenders with a long criminal career convicted of this offence type; year on year increases have been seen since 2007, with the number of offenders now almost twice as high (a 91% since 2007).
20 Offenders with a long criminal career are those with 15 or more previous cautions or convictions. 21https://www.ons.gov.uk/peoplepopulationandcommunity/crimeandjustice/bulletins/crimeinenglandandwales/yearendingdecember2017

30
Further information
National Statistics status
National Statistics status means that official statistics meet the highest standards of
trustworthiness, quality and public value.
All official statistics should comply with all aspects of the Code of Practice for Official
Statistics. They are awarded National Statistics status following an assessment by the
Authority’s regulatory arm. The Authority considers whether the statistics meet the highest
standards of Code compliance, including the value they add to public decisions and debate.
It is the Ministry of Justice’s responsibility to maintain compliance with the standards
expected for National Statistics. If we become concerned about whether these statistics are
still meeting the appropriate standards, we will discuss any concerns with the Authority
promptly. National Statistics status can be removed at any point when the
highest standards are not maintained, and reinstated when standards are
restored.
Contact
Press enquiries should be directed to the Ministry of Justice press office:
Tel: 020 3334 3536
Email: [email protected]
Other enquiries about these statistics should be directed to the Justice Statistics Analytical
Services division of the Ministry of Justice:
Damon Wingfield, Head of Criminal Justice Statistics
Ministry of Justice, 7th Floor, 102 Petty France, London, SW1H 9AJ
Email: [email protected]
Next update: 16 August 2018
URL: https://www.gov.uk/government/statistics/criminal-justice-system-statistics-quarterly-
december-2017
© Crown copyright
Produced by the Ministry of Justice
Alternative formats are available on request from [email protected]