Public Transport in Melbourne’s Eastern Region - Full Report
54
Public Transport in Melbourne’s Eastern Region - Full Report - Eastern Transport Coalition 18 July 2007 P10325 Australian Research Group Pty Ltd ABN 67 101 442 808 ACN 101 442 808 Level 4, 100 Collins Street Level 9, 155 George Street Melbourne 3000 Sydney 2000 Ph: +61 3 9662-3220 Ph: +61 2 8213 3081 Fax: +61 3 9654 4756 Fax: +61 2 9252 6677 Email: [email protected]
Transcript of Public Transport in Melbourne’s Eastern Region - Full Report
Public Transport in Melbourne’s Eastern Region - Full Report - Eastern Transport Coalition
18 July 2007
P10325
Australian Research Group Pty Ltd
ABN 67 101 442 808 ACN 101 442 808
Level 4, 100 Collins Street Level 9, 155 George Street Melbourne 3000 Sydney 2000 Ph: +61 3 9662-3220 Ph: +61 2 8213 3081 Fax: +61 3 9654 4756 Fax: +61 2 9252 6677
Email: [email protected]

CONTENTS
1. Executive Summary........................................................................................................ 3 1.1 Overview ................................................................................................................ 3 1.2 Electorate by Electorate Headlines........................................................................ 6
2. Introduction & Methodology.......................................................................................... 7 2.1 Background ............................................................................................................ 7 2.2 Survey methodology .............................................................................................. 7 2.3 Studied Electorates ................................................................................................ 8 2.4 Sample Size ........................................................................................................... 8 2.5 Structure of This Report ......................................................................................... 9
3. Key Findings ................................................................................................................. 10 3.1 Use of Public Transport........................................................................................ 10 3.2 Traffic and Roads................................................................................................. 14 3.3 Quality of Services ............................................................................................... 17 3.4 Effect of a lack of public transport........................................................................ 22 3.5 Link to Climate Change........................................................................................ 26 3.6 Responsibility ....................................................................................................... 29 3.7 Funding Solutions ................................................................................................ 32 3.8 Expectations of public transport provision ........................................................... 34 3.9 Voting Intentions .................................................................................................. 37 3.10 Importance of transport as an election issue ....................................................... 39
4. Questionnaire................................................................................................................ 41
10325 ETC Public Transport Report v09 (18.07.07).doc Page 2 © 2007 The Australian Research Group
1. Executive Summary
1.1 Overview
In May 2007, in order to understand the transport needs of residents of Melbourne’s Eastern suburbs, the Eastern Transport Coalition commissioned the Australian Research Group (ARG) to conduct research into attitudes towards public transport in the Eastern region. The research took place in May. The study involved 1000 online interviews across six electorates in Melbourne’s East: Aston, Bruce, Chisholm, Deakin, La Trobe and Menzies. These electorates were selected because they fall within the area covered by the ETC member councils and for their political significance. The study explored attitudes and perceptions towards public transport in the area, barriers to greater usage and preferences for funding solutions.
(i) Use of public transport
More than two thirds of respondents travelled to work by car (71%) with while only 15% said they used public transport. An overwhelming majority of respondents (87%) travelled to non-work activities by car. In general, public transport use was low and infrequent with more than 70% of those surveyed saying that they used public transport once a month or less. La Trobe respondents were least likely to use public transport – only 16% used it once a week or more. Chisholm reported the most frequent use with 40% reporting that they used it at least once a week.
(ii) Traffic and roads
Most respondents reported high levels of congestion with the lowest incidence in Chisholm, which correspondingly had greatest access to transport services. Almost half of respondents said they experienced frequent problems accessing major roads during peak times. Respondents were asked who they thought should fix congestion problems – well over two thirds of respondents said that the State and Federal Governments should work together to solve the issue.
(iii) Quality of services
Access to bus services was almost universal across the region but some electorates such as Menzies and Aston had quite poor access to train services and most electorates had very minimal access to trams. Opinions of the three services varied across the electorates. Chisholm was the most positive and correspondingly had the highest level of access. Over half of respondents with access to trains said their overall opinion of the service was average or poor.
10325 ETC Public Transport Report v09 (18.07.07).doc Page 3 © 2007 The Australian Research Group

(iv) Effect of a lack of public transport
Respondents who had indicated that they did not have a positive opinion public transport were asked whether they felt that the lack of public transport infrastructure or the poor quality of existing infrastructure had a direct impact on either themselves or their families – over half or respondents said it did in both cases. When asked what those effects were; congestion, increased fuel costs and increased travel time were all seen as significant negative consequences.
(v) Link to climate change
An overwhelming proportion of respondents said they wanted to take steps to reduce their impact on the environment and close to 70% of respondents said that public transport was a practical way for them to achieve this. A sizeable number of respondents said that the lack or poor quality of public transport infrastructure had an impact on their ability to protect the environment.
(vi) Responsibility
Respondents were informed that the Federal Government provides funding for major roads but does not contribute to public transport infrastructure – 62% did not find this acceptable. This result in conjunction with the earlier sentiments expressed regarding fixing congestion problems indicates that there is broad support for ETC’s goal of encouraging the Federal Government to invest in major public transport infrastructure.
(vii) Funding solutions
More than three quarters of respondents (76%) believed the State and Federal Governments should share the cost for all necessary public transport infrastructure, reinforcing that there is very strong support for cooperation between the two levels of government on this issue. It was also found that most respondents thought governments should adequately fund public transport for the sake of the environment (91%), for economic reasons (92%) and to make life easier for families (93%).
(viii) Expectation of public transport provision
Two thirds of respondents (67%) surveyed said that governments were not giving sufficient priority to provision of good public transport infrastructure in their local area. Most respondents indicated that they would consider using public transport more often if the speed, quality and reliability were improved. These results indicate that while there is inadequate provision of public transport infrastructure there is willingness for people to adjust their travel habits if the services are improved.
(ix) Voting intentions
The findings here are roughly in line with the results of the last national Newspoll (conducted 15-19 June) indicating that the respondents in this survey are broadly representative of the wider electorate. This survey showed Labor with 45% of the primary vote leading the Coalition on 40% and the Greens polling 8%. The two party preferred result had Labor at 54% ahead of the Coalition on 46%.
10325 ETC Public Transport Report v09 (18.07.07).doc Page 4 © 2007 The Australian Research Group
(x) Importance of public transport as an election issue
Respondents were asked whether public transport infrastructure would be a factor in deciding whom they would vote for at the next Federal election - more than four out of five respondents (83%) said that the issue of public transport infrastructure would be a consideration. This suggests that public transport is a high profile issue in this region and that people are concerned enough about it to create an impact at the ballot box.
10325 ETC Public Transport Report v09 (18.07.07).doc Page 5 © 2007 The Australian Research Group
1.2 Electorate by Electorate Headlines
(i) Aston
Electorate with the lowest opinion of public transport. Second lowest level of train access. Highest levels of congestion and most frequent problems accessing major roads at peak times. Electorate most likely to believe the state and Federal Governments should cooperate to fix congestion problems. Most likely to find the lack of Federal Government funding for public transport infrastructure unacceptable. Most likely to feel the governments are not giving sufficient priority to public transport infrastructure.
(ii) Bruce
Electorate among the most likely to experience problems accessing major roads in peak times. Second highest level of public transport usage and second most likely to believe that governments should cooperate to fix these problems. Most likely to say that the lack or poor quality of public transport infrastructure had a direct effect on them.
(iii) Chisholm
Highest rate of public transport use and the only electorate with significant access to all three modes of public transport. Lowest levels of congestion and the most likely to say that public transport is a practical way to reduce environmental impact. Highest overall opinion of trains, trams and buses.
(iv) Deakin
Electorate experiencing the most trouble obtaining a seat on trains. Had the lowest opinion of the speed of the tram services. Deakin was the least affected by poor or lack of public transport. Among the least likely to say public transport was a practical way to reduce personal environmental impact.
(v) La Trobe
Lowest use of public transport for travel to work and non-work activities and equal lowest overall opinion of public transport. Among the most unhappy with the speed, timetable and reliability of the train services. Most unlikely to see public transport as a practical way for them to reduce their impact on the environment. Among the most inclined to feel that governments are not giving sufficient priority to public transport infrastructure.
(vi) Menzies
Lowest level of access to train services and second lowest level of access to tram services. Most unhappy with the speed of the journey on trains. Lowest opinion of tram services. Most families affected by poor or lack of public transport. Among the most likely to say they would use public transport more often if the quality and reliability was improved.
10325 ETC Public Transport Report v09 (18.07.07).doc Page 6 © 2007 The Australian Research Group

2. Introduction & Methodology
2.1 Background
The Eastern Transport Coalition (ETC) comprises the Cities of Greater Dandenong, Knox, Manningham, Maroondah, Monash, Whitehorse and the Shire of Yarra Ranges and represents nearly 1 million residents. ETC advocates for sustainable and integrated transport services in the Eastern region of Melbourne which focus on the travel needs of the community and reduce the level of car dependency. The outer eastern region of Melbourne has good public transport access in some locations and very poor access, particularly to rail and trams in other areas. While the Federal Government has made significant contributions to improving road infrastructure in the region, funding for public transport infrastructure has been largely overlooked. ETC is aiming to lobby the Federal Government to invest in major public transport projects in order to relieve some of the burden on the region’s road infrastructure and improve sustainability. ETC has indicated an interest in examining the links between the following issues:
- Public transport infrastructure - Traffic congestion - Petrol costs - Climate change - Voting intentions
With the current level of concern about climate change and in the face of rising petrol costs and increasing traffic congestion along the region’s major arterial roads, public transport seems to provide the most obvious solution to improving both the sustainability and accessibility of the Eastern suburbs. Against this background ETC is looking to lobby the Federal Government to provide funding support for major public transport projects in the East. A number of the most critical areas fall within Government-held marginal seats providing an opportunity to generate significant pressure for the campaign. Areas that this study will explore include –
- Current usage of public transport - Attitudes towards public transport - Attitudes towards climate change - Attitudes towards government responsibility and funding - Voting intentions
2.2 Survey methodology
Interviews were conducted online through our panel partner, Research Now. Research Now manages international online data collection across 24 proprietary, research-only online panels in Australasia, Europe, and North America using only respondents who have opted to receive invitations to participate in market research. A range of quality control measures are implemented to ensure that responses received are considered and genuine. For example:
10325 ETC Public Transport Report v09 (18.07.07).doc Page 7 © 2007 The Australian Research Group

- Email invitations are only sent to respondents who have registered to participate in market research;
- Responses are closely monitored to ensure no one is simply clicking the same response or pattern of responses;
- Minimum time thresholds proactively eliminate responses that appear to be the result of fast, careless answering;
- Contact information is checked against panel integrity databases to avoid sending multiple invitations to the same respondent.
- Email addresses, domains and IP's that are known to have provided inaccurate data are blocked.
Invitations were sent to a sample of respondents drawn in each electorate according to a nationally representative distribution. All respondents were incentivised for participation. The sample was drawn to reflect the population distribution of the area in question. Quotas were applied by gender, age and electorate and data were weighted to ensure representativeness.
2.3 Studied Electorates
The ETC public transport survey was conducted in the following 6 electorates -
Electorate Electoral Status1 Population2
Aston Liberal 13.2% 129,450 Bruce Labor 3.5% 129,162 Chisholm Labor 2.7% 131,540 Deakin Liberal 5.0% 120,642 La Trobe Liberal 5.9% 132,800 Menzies Liberal 10.7% 121,096
These electorates were selected because they fall within the area covered by the ETC member councils. While there are several other electorates such as Hotham and Isaacs, which fall partly within the ETC region a judgement was made that neither covered sufficient area to warrant inclusion in the study. A number of the electorates chosen are also key marginal seats that will be politically significant in the upcoming federal election. The electorate of Casey, while within the area of the ETC was omitted due to its status as a safe seat.
2.4 Sample Size
The measure of the accuracy of a survey is presented by the margin of error. This value expresses the amount of the random variation underlying a survey's results. A margin of error is usually prepared at the 95% confidence level – this means that 19 out of every 20 surveys will be within the stated ‘margin of error’. The margin of error on a sample of 1000 is ±3.1%. This means that if the survey finds that 50% of the population use trams then there is a 95% chance that the ‘true’ value is between 53.1% and 46.9%.
1 2004 election results from www.unsw.adfa.edu.au/hass/staff/Pendulum.pdf 2 Population statistics from www.abs.gov.au/census
10325 ETC Public Transport Report v09 (18.07.07).doc Page 8 © 2007 The Australian Research Group

2.5 Structure of This Report
This report is divided into ten broad topic areas. These are –
- Use of public transport - Traffic and roads - Quality of services - Effect of a lack of public transport - Link to climate change - Responsibility - Funding solutions - Expectation of public transport provision - Voting intentions - Importance of public transport as an election issue
This report endeavours to present data in the most logical and understandable way possible. Sometimes this involves analysis of data by individual electorates, at others it makes more sense to dissect by transport method, voting intention or to simply aggregate data.
10325 ETC Public Transport Report v09 (18.07.07).doc Page 9 © 2007 The Australian Research Group

3. Key Findings
3.1 Use of Public Transport
Q4. What is your main form of transport for getting to and from your place of work?
a. Transport to Work
% of respondents
Car - as driver70%
Public transport15%
Car - as passenger3%
Not applicable12%
Base = All respondents
KEY FINDINGS:
• More than two in every three respondents travel to work by car (71%) with 68% driving themselves and a further 3% travelling as passengers.
• Only 15% say they use public transport as their primary form of transport to work. • Chisholm had the highest rate of public transport use (24%) followed by Bruce
(19%). • La Trobe had the lowest level of public transport use with only 5% saying it was
their main way of getting to work. • Greens voters (28%) were more than twice as likely as Coalition voters (11%) to use
public transport to get to work. NOTE: These figures are consistent with ABS Census data.
10325 ETC Public Transport Report v09 (18.07.07).doc Page 10 © 2007 The Australian Research Group
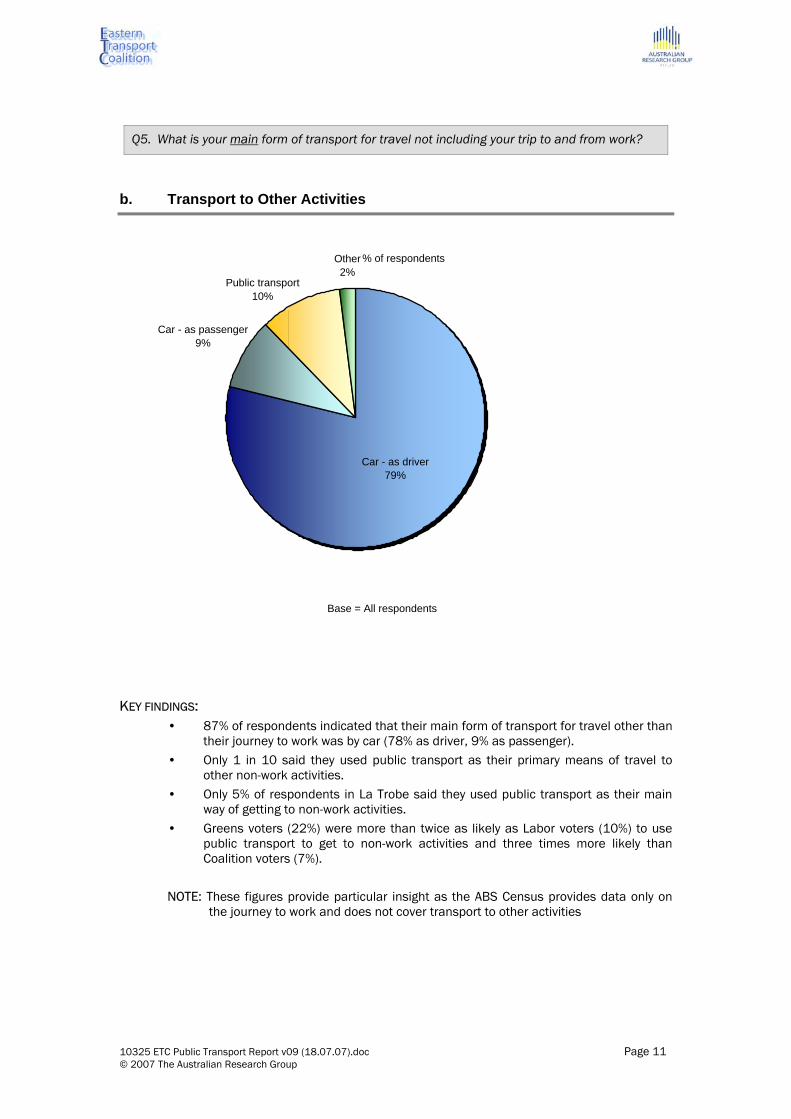
Q5. What is your main form of transport for travel not including your trip to and from work?
b. Transport to Other Activities
EY FINDINGS: ts indicated that their main form of transport for travel other than
• ans of travel to
• La Trobe said they used public transport as their main
• twice as likely as Labor voters (10%) to use
OTE: These figures provide particular insight as the ABS Census provides data only on
% of respondents
Car - as driver79%
Other2%
Public transport10%
Car - as passenger9%
Base = All respondents
K
• 87% of respondentheir journey to work was by car (78% as driver, 9% as passenger). Only 1 in 10 said they used public transport as their primary meother non-work activities. Only 5% of respondents inway of getting to non-work activities. Greens voters (22%) were more thanpublic transport to get to non-work activities and three times more likely than Coalition voters (7%).
Nthe journey to work and does not cover transport to other activities
10325 ETC Public Transport Report v09 (18.07.07).doc Page 11 © 2007 The Australian Research Group
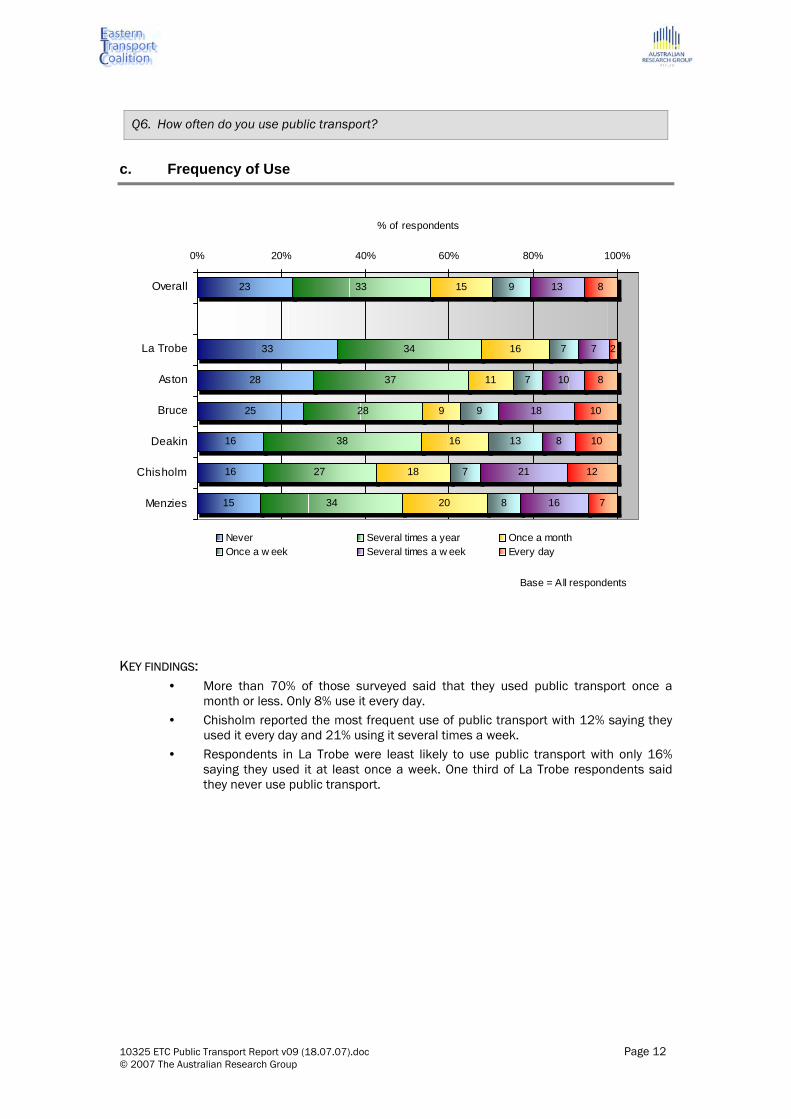
Q6. How often do you use public transport?
c. Frequency of Use
23
33
28
25
16
16
15
33
34
37
28
38
27
34
15
16
11
9
16
18
20
9
7
7
9
13
7
8
13
7
10
18
8
21
16
8
2
8
10
10
12
7
0% 20% 40% 60% 80% 100%
Overall
La Trobe
Aston
Bruce
Deakin
Chisholm
Menzies
% of respondents
Never Several times a year Once a monthOnce a w eek Several times a w eek Every day
Base = All respondents
KEY FINDINGS:
• More than 70% of those surveyed said that they used public transport once a month or less. Only 8% use it every day.
• Chisholm reported the most frequent use of public transport with 12% saying they used it every day and 21% using it several times a week.
• Respondents in La Trobe were least likely to use public transport with only 16% saying they used it at least once a week. One third of La Trobe respondents said they never use public transport.
10325 ETC Public Transport Report v09 (18.07.07).doc Page 12 © 2007 The Australian Research Group

Q7. How would you describe your level of knowledge about public transport facilities in your area?
d. Knowledge of Public Transport
9
8
9
9
14
8
5
27
36
31
29
21
23
18
40
35
42
42
36
42
43
13
12
11
10
16
13
19
11
8
7
10
14
14
15
0% 20% 40% 60% 80% 100%
Overall
Chisholm
Deakin
Bruce
Menzies
Aston
La Trobe
% of respondents
Very high High Average Low Very low
Base = All respondents
KEY FINDINGS:
• Almost two thirds (64%) of respondents described their level of knowledge about public transport in their area as average or below. Only 9% described it as very high.
• As expected, those who used public transport to get to work were much more likely to say their level of knowledge was either high (49%) or very high (24%).
10325 ETC Public Transport Report v09 (18.07.07).doc Page 13 © 2007 The Australian Research Group
3.2 Traffic and Roads
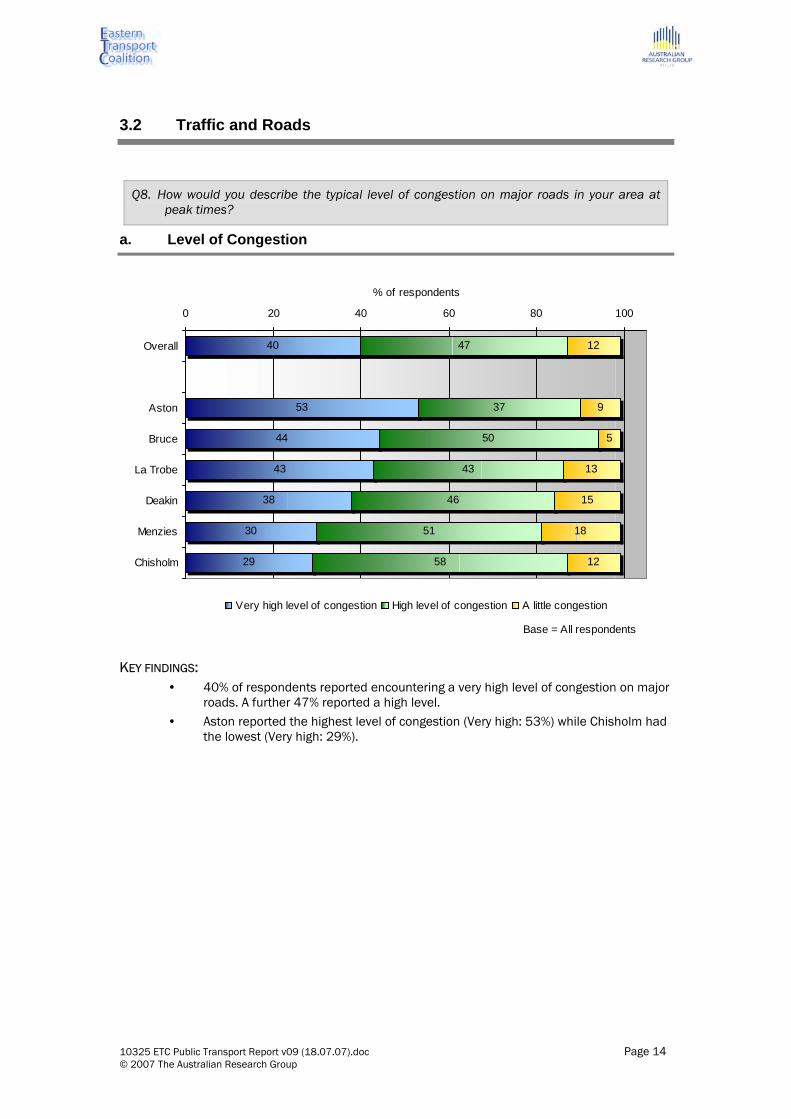
Q8. How would you describe the typical level of congestion on major roads in your area at peak times?
a. Level of Congestion
40
53
44
43
38
30
29
47
37
50
43
46
51
58
12
9
5
13
15
18
12
0 20 40 60 80 100
Overall
Aston
Bruce
La Trobe
Deakin
Menzies
Chisholm
% of respondents
Very high level of congestion High level of congestion A little congestion
Base = All respondents
KEY FINDINGS:
• 40% of respondents reported encountering a very high level of congestion on major roads. A further 47% reported a high level.
• Aston reported the highest level of congestion (Very high: 53%) while Chisholm had the lowest (Very high: 29%).
10325 ETC Public Transport Report v09 (18.07.07).doc Page 14 © 2007 The Australian Research Group
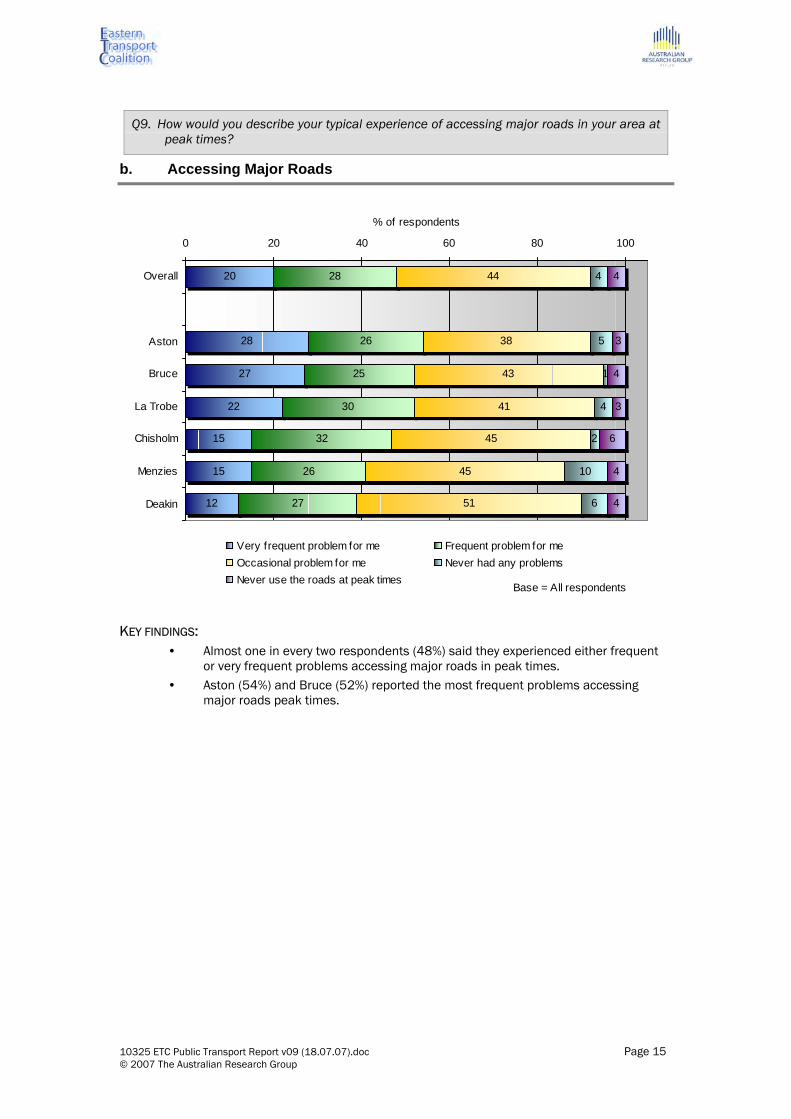
Q9. How would you describe your typical experience of accessing major roads in your area at peak times?
b. Accessing Major Roads
20
28
27
22
15
15
12
28
26
25
30
32
26
27
44
38
43
41
45
45
51
4
5
1
4
2
10
6
4
3
4
3
6
4
4
0 20 40 60 80 100
Overall
Aston
Bruce
La Trobe
Chisholm
Menzies
Deakin
% of respondents
Very frequent problem for me Frequent problem for meOccasional problem for me Never had any problemsNever use the roads at peak times
Base = All respondents
KEY FINDINGS:
• Almost one in every two respondents (48%) said they experienced either frequent or very frequent problems accessing major roads in peak times.
• Aston (54%) and Bruce (52%) reported the most frequent problems accessing major roads peak times.
10325 ETC Public Transport Report v09 (18.07.07).doc Page 15 © 2007 The Australian Research Group

Q10. Who do you believe should fix the problems of traffic congestion on major roads in your area?
c. Fix Road Problems
70
74
62
85
69
27
23
37
14
27
4
4
2
1
1
0% 20% 40% 60% 80% 100%
Overall
Labor
Coalition
Green
Other
% of respondents
Federal and State Governments State Government Federal Government
Base = All respondents
KEY FINDINGS:
• 70% of respondents believe the State and Federal Governments should work together to fix congestion problems on major roads.
• 74% of Labor voters believe that the State and Federal Governments should share the responsibility as did 62% of Coalition voters.
• 81% of respondents in Aston believe the governments should cooperate, followed by Bruce (76%) and La Trobe (68%).
10325 ETC Public Transport Report v09 (18.07.07).doc Page 16 © 2007 The Australian Research Group
3.3 Quality of Services
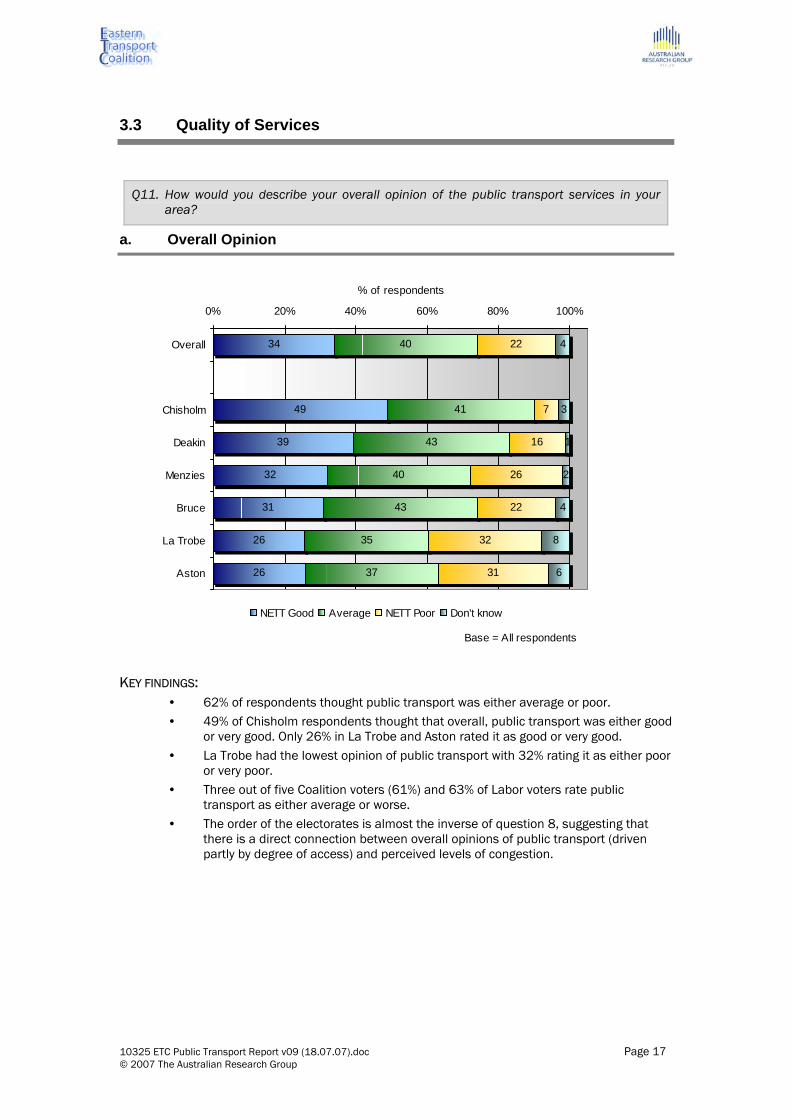
Q11. How would you describe your overall opinion of the public transport services in your area?
a. Overall Opinion
34
49
39
32
31
26
26
40
41
43
40
43
35
37
22
7
16
26
22
32
31
4
3
1
2
4
8
6
0% 20% 40% 60% 80% 100%
Overall
Chisholm
Deakin
Menzies
Bruce
La Trobe
Aston
% of respondents
NETT Good Average NETT Poor Don't know
Base = All respondents
KEY FINDINGS:
• 62% of respondents thought public transport was either average or poor. • 49% of Chisholm respondents thought that overall, public transport was either good
or very good. Only 26% in La Trobe and Aston rated it as good or very good. • La Trobe had the lowest opinion of public transport with 32% rating it as either poor
or very poor. • Three out of five Coalition voters (61%) and 63% of Labor voters rate public
transport as either average or worse. • The order of the electorates is almost the inverse of question 8, suggesting that
there is a direct connection between overall opinions of public transport (driven partly by degree of access) and perceived levels of congestion.
10325 ETC Public Transport Report v09 (18.07.07).doc Page 17 © 2007 The Australian Research Group

Q12. Which of the following services operate in your area?
b. Services Operate in My Area
29
100
8
88
99
5
41
100
17
95
99
29
92
100
50
91
99
9
0 20 40 60 80 100
Trains
Buses
Trams
% of respondents
Menzies La Trobe Aston Deakin Chisholm Bruce
Base = All respondents
KEY FINDINGS:
• Chisholm has the best access to the three forms of public transport with 100% coverage for buses, 92% for trains and 50% for trams.
• Three of the six electorates reported 100% bus coverage with the other half recording 99% access.
• Menzies (29%) and Aston (41%) had much lower rates of train operation than the other electorates which all rated above 88%.
• Chisholm was the only electorate to report significant access to tram services (50%) followed by Deakin (29%) and the other areas at less than 20%.
10325 ETC Public Transport Report v09 (18.07.07).doc Page 18 © 2007 The Australian Research Group
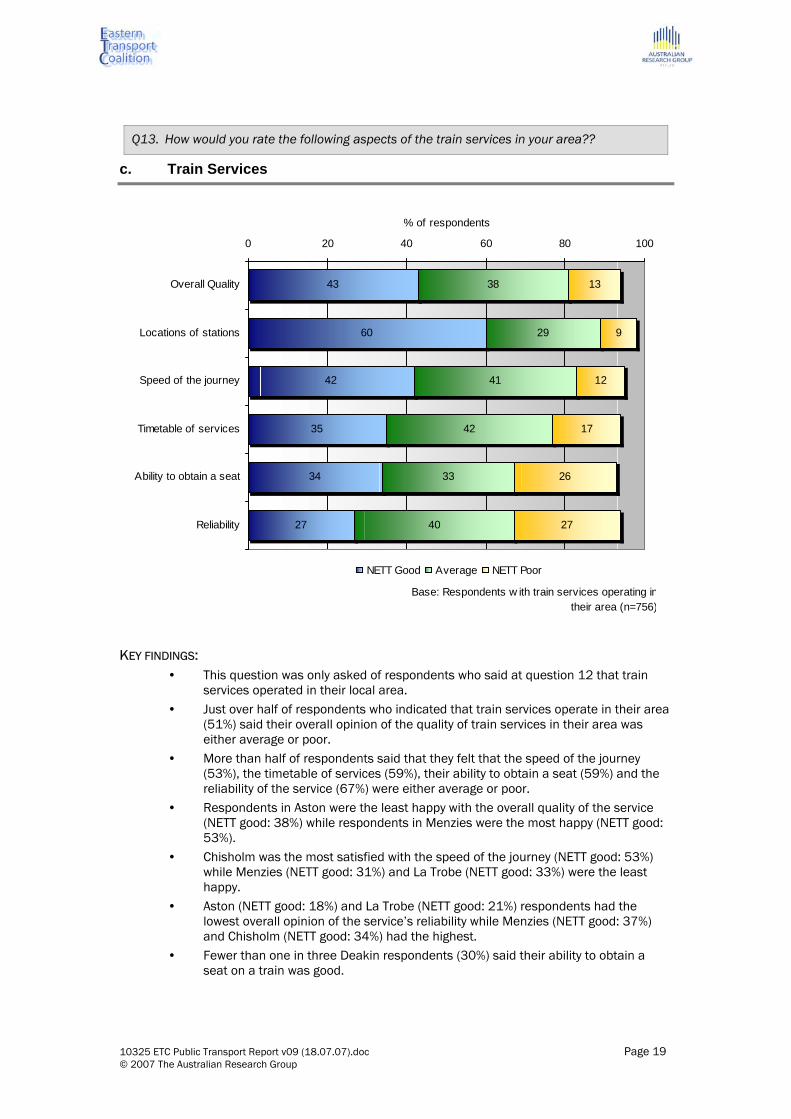
Q13. How would you rate the following aspects of the train services in your area??
c. Train Services
43
60
42
35
34
27
38
29
41
42
33
40
13
9
12
17
26
27
0 20 40 60 80 1
Overall Quality
Locations of stations
Speed of the journey
Timetable of services
Ability to obtain a seat
Reliability
% of respondents
00
NETT Good Average NETT Poor
Base: Respondents w ith train services operating intheir area (n=756)
KEY FINDINGS:
• This question was only asked of respondents who said at question 12 that train services operated in their local area.
• Just over half of respondents who indicated that train services operate in their area (51%) said their overall opinion of the quality of train services in their area was either average or poor.
• More than half of respondents said that they felt that the speed of the journey (53%), the timetable of services (59%), their ability to obtain a seat (59%) and the reliability of the service (67%) were either average or poor.
• Respondents in Aston were the least happy with the overall quality of the service (NETT good: 38%) while respondents in Menzies were the most happy (NETT good: 53%).
• Chisholm was the most satisfied with the speed of the journey (NETT good: 53%) while Menzies (NETT good: 31%) and La Trobe (NETT good: 33%) were the least happy.
• Aston (NETT good: 18%) and La Trobe (NETT good: 21%) respondents had the lowest overall opinion of the service’s reliability while Menzies (NETT good: 37%) and Chisholm (NETT good: 34%) had the highest.
• Fewer than one in three Deakin respondents (30%) said their ability to obtain a seat on a train was good.
10325 ETC Public Transport Report v09 (18.07.07).doc Page 19 © 2007 The Australian Research Group
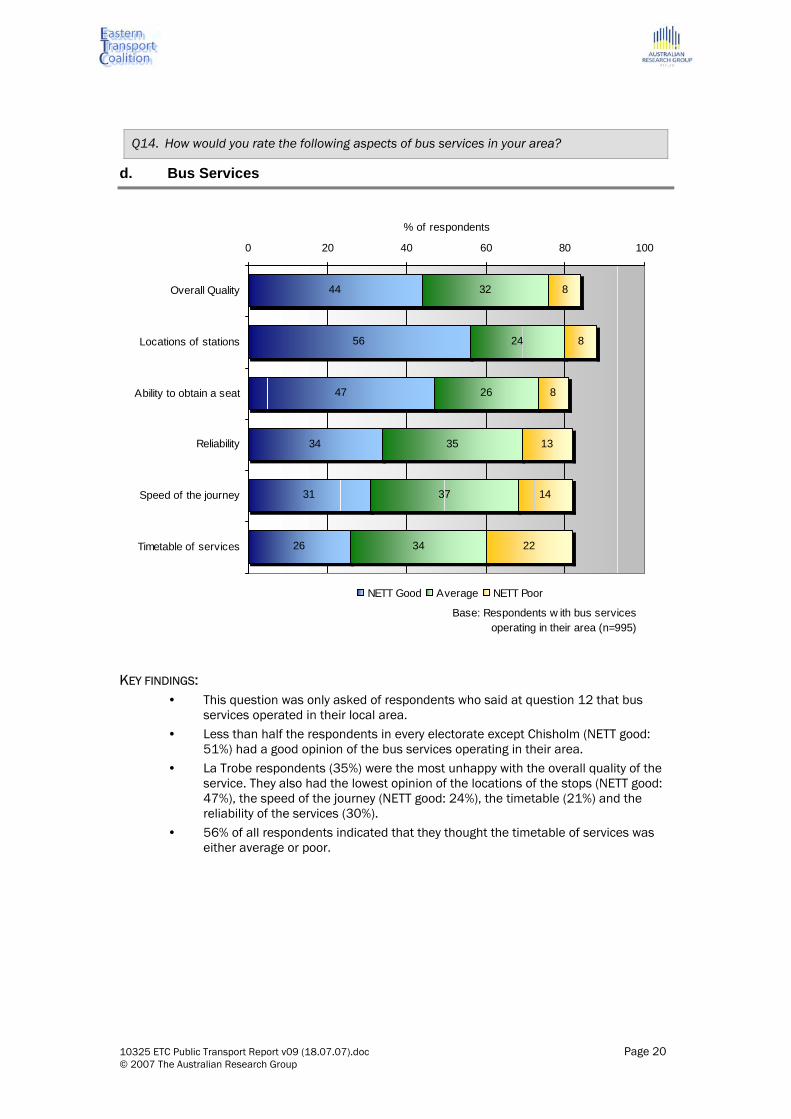
Q14. How would you rate the following aspects of bus services in your area?
d. Bus Services
44
56
47
34
31
26
32
24
26
35
37
34
8
8
8
13
14
22
0 20 40 60 80 1
Overall Quality
Locations of stations
Ability to obtain a seat
Reliability
Speed of the journey
Timetable of services
% of respondents
00
NETT Good Average NETT Poor
Base: Respondents w ith bus servicesoperating in their area (n=995)
KEY FINDINGS:
• This question was only asked of respondents who said at question 12 that bus services operated in their local area.
• Less than half the respondents in every electorate except Chisholm (NETT good: 51%) had a good opinion of the bus services operating in their area.
• La Trobe respondents (35%) were the most unhappy with the overall quality of the service. They also had the lowest opinion of the locations of the stops (NETT good: 47%), the speed of the journey (NETT good: 24%), the timetable (21%) and the reliability of the services (30%).
• 56% of all respondents indicated that they thought the timetable of services was either average or poor.
10325 ETC Public Transport Report v09 (18.07.07).doc Page 20 © 2007 The Australian Research Group
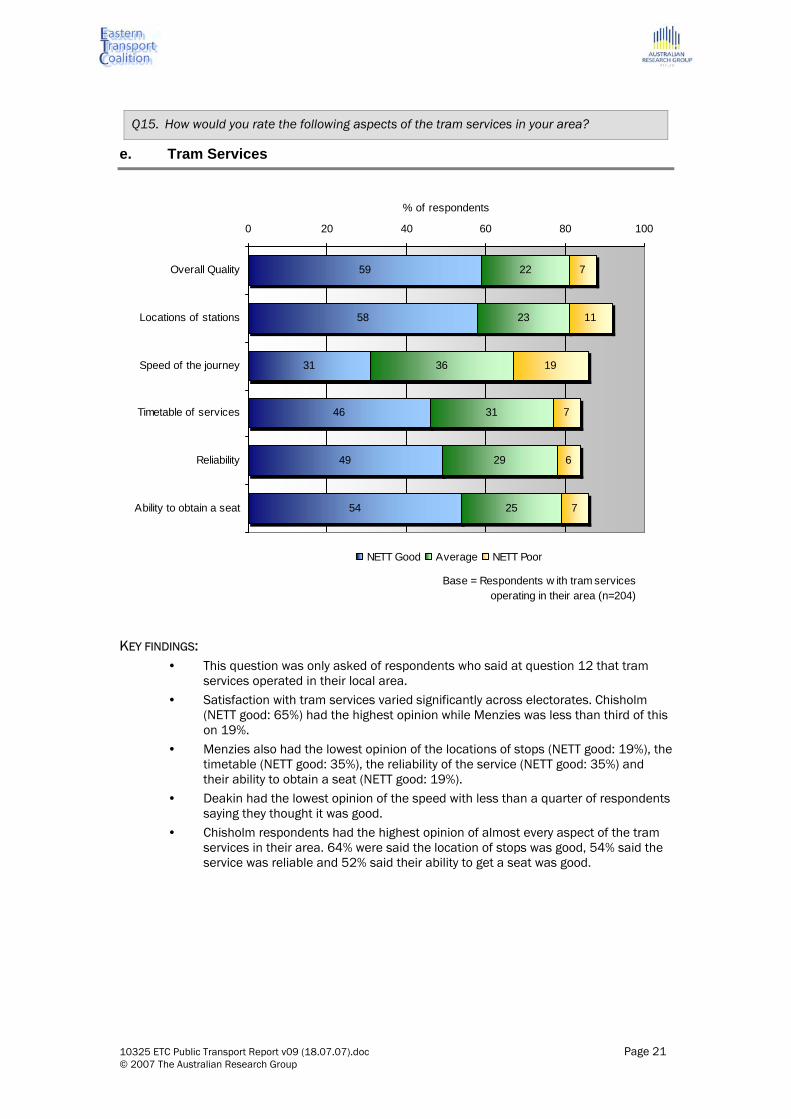
Q15. How would you rate the following aspects of the tram services in your area?
e. Tram Services
59
58
31
46
49
54
22
23
36
31
29
25
7
11
19
7
6
7
0 20 40 60 80 100
Overall Quality
Locations of stations
Speed of the journey
Timetable of services
Reliability
Ability to obtain a seat
% of respondents
NETT Good Average NETT Poor
Base = Respondents w ith tram services operating in their area (n=204)
KEY FINDINGS:
• This question was only asked of respondents who said at question 12 that tram services operated in their local area.
• Satisfaction with tram services varied significantly across electorates. Chisholm (NETT good: 65%) had the highest opinion while Menzies was less than third of this on 19%.
• Menzies also had the lowest opinion of the locations of stops (NETT good: 19%), the timetable (NETT good: 35%), the reliability of the service (NETT good: 35%) and their ability to obtain a seat (NETT good: 19%).
• Deakin had the lowest opinion of the speed with less than a quarter of respondents saying they thought it was good.
• Chisholm respondents had the highest opinion of almost every aspect of the tram services in their area. 64% were said the location of stops was good, 54% said the service was reliable and 52% said their ability to get a seat was good.
10325 ETC Public Transport Report v09 (18.07.07).doc Page 21 © 2007 The Australian Research Group
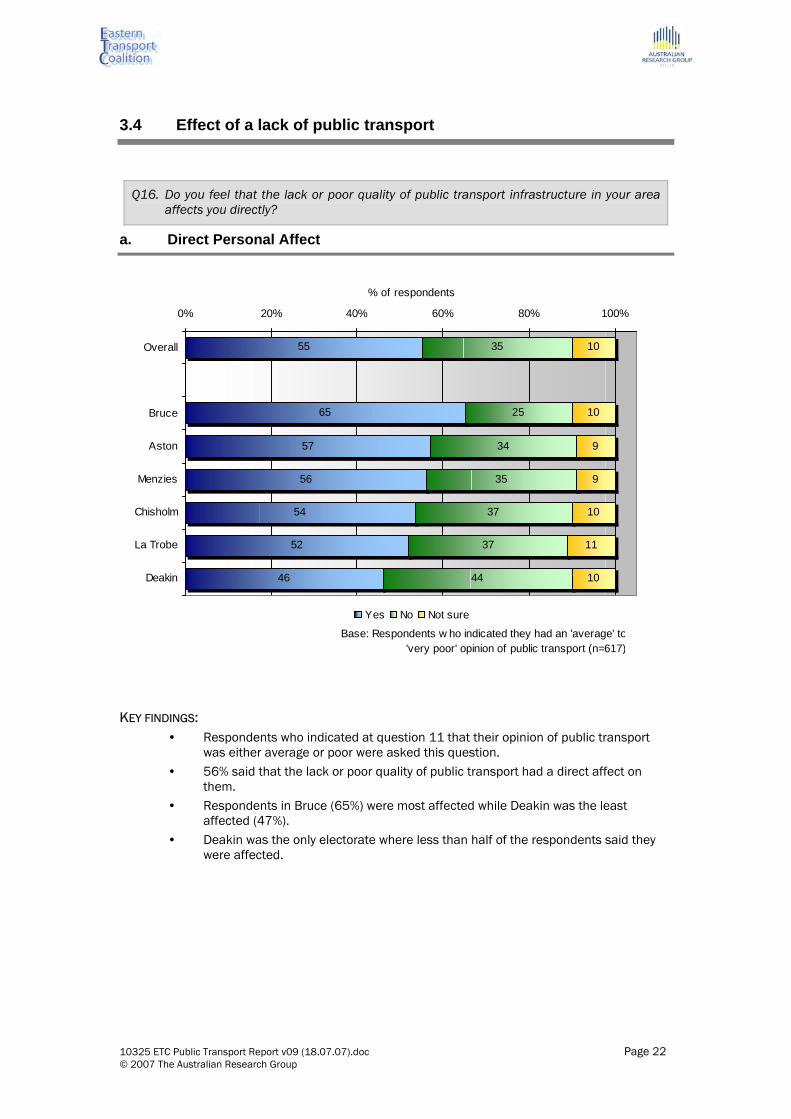
3.4 Effect of a lack of public transport
Q16. Do you feel that the lack or poor quality of public transport infrastructure in your area affects you directly?
a. Direct Personal Affect
55
65
57
56
54
52
46
35
25
34
35
37
37
44
10
10
9
9
10
11
10
0% 20% 40% 60% 80% 100%
Overall
Bruce
Aston
Menzies
Chisholm
La Trobe
Deakin
% of respondents
Yes No Not sure
Base: Respondents w ho indicated they had an 'average' to'very poor' opinion of public transport (n=617)
KEY FINDINGS:
• Respondents who indicated at question 11 that their opinion of public transport was either average or poor were asked this question.
• 56% said that the lack or poor quality of public transport had a direct affect on them.
• Respondents in Bruce (65%) were most affected while Deakin was the least affected (47%).
• Deakin was the only electorate where less than half of the respondents said they were affected.
10325 ETC Public Transport Report v09 (18.07.07).doc Page 22 © 2007 The Australian Research Group
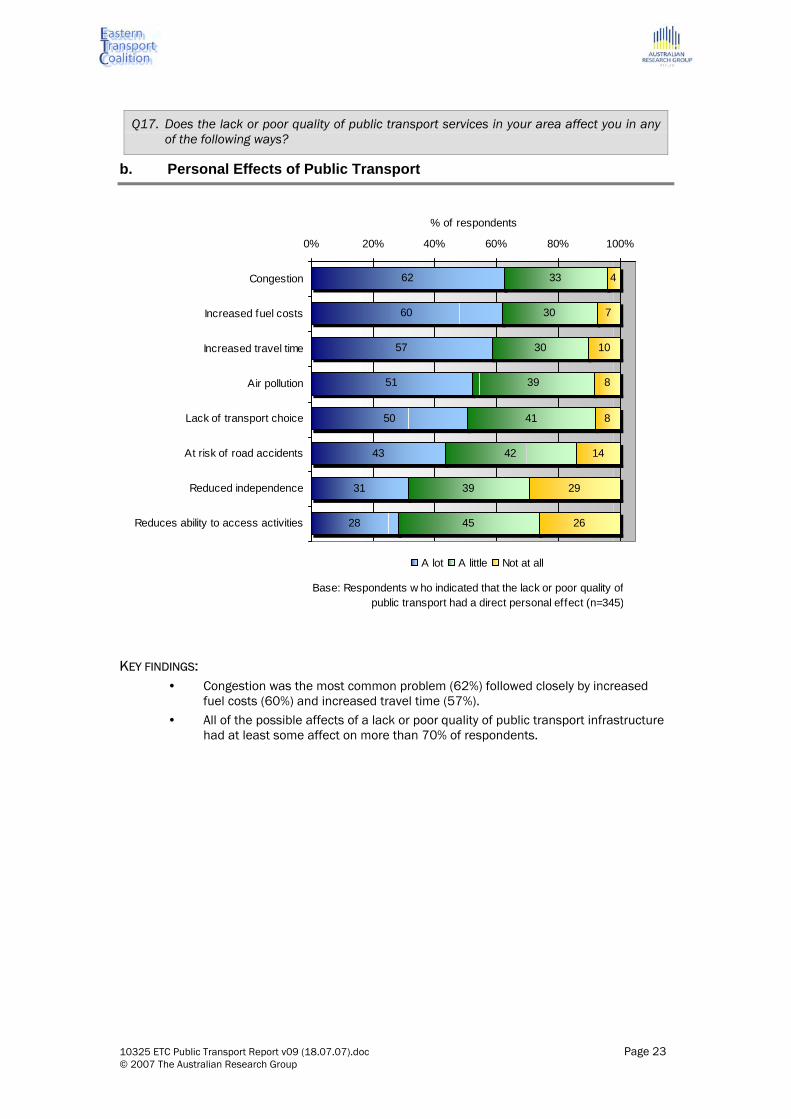
Q17. Does the lack or poor quality of public transport services in your area affect you in any of the following ways?
b. Personal Effects of Public Transport
62
60
57
51
50
43
31
28
33
30
30
39
41
42
39
45
4
7
10
8
8
14
29
26
0% 20% 40% 60% 80% 100%
Congestion
Increased fuel costs
Increased travel time
Air pollution
Lack of transport choice
At risk of road accidents
Reduced independence
Reduces ability to access activities
% of respondents
A lot A little Not at all
Base: Respondents w ho indicated that the lack or poor quality ofpublic transport had a direct personal effect (n=345)
KEY FINDINGS:
• Congestion was the most common problem (62%) followed closely by increased fuel costs (60%) and increased travel time (57%).
• All of the possible affects of a lack or poor quality of public transport infrastructure had at least some affect on more than 70% of respondents.
10325 ETC Public Transport Report v09 (18.07.07).doc Page 23 © 2007 The Australian Research Group

Q18. Does the lack or poor quality of public transport services in your area affect your family directly or not?
c. Direct Family Affect
54
61
60
57
54
50
43
35
30
33
32
36
33
47
11
9
7
11
10
17
10
0% 20% 40% 60% 80% 100%
Overall
Menzies
Aston
Chisholm
La Trobe
Bruce
Deakin
% of respondents
Yes No Not sure
Base: Respondents w ho indicated they had an 'average' to'very poor' opinion of public transport (n=617)
KEY FINDINGS:
• Respondents who indicated at question 11 that their opinion of public transport was either average or poor were asked this question.
• 54% of respondents said the lack or poor quality of public transport infrastructure had a direct affect on their family.
• Families in Menzies were most affected (61%) while those in Deakin were least affected (43%).
• Again, Deakin was the only electorate where less than 50% of respondents said their families were affected.
10325 ETC Public Transport Report v09 (18.07.07).doc Page 24 © 2007 The Australian Research Group

Q19. Does the lack or poor quality of public transport infrastructure in your area affect your family in any of the following ways?
d. Family Affects of Public Transport
67
65
65
52
48
48
46
44
40
28
29
28
39
38
30
39
41
46
5
5
5
8
11
20
13
13
13
0% 20% 40% 60% 80% 100%
Increased fuel costs
Congestion
Increades travel time
Lack of transport choice
Air pollution
Concern for young drivers
At risk of road accidents
Reduced independence
Reduces ability to access activities
% of respondents
A lot A little Not at all
Base: Respondents w ho indicated that the lack or poor quality ofpublic transport had a direct effect on their family (n=335)
KEY FINDINGS:
• Increased fuel costs were the most often cited problem (67%), followed by congestion (65%) and increased travel time (65%).
• All of the possible affects of a lack or poor quality of public transport infrastructure on families had at least some affect on more than 75% of respondents.
10325 ETC Public Transport Report v09 (18.07.07).doc Page 25 © 2007 The Australian Research Group
3.5 Link to Climate Change
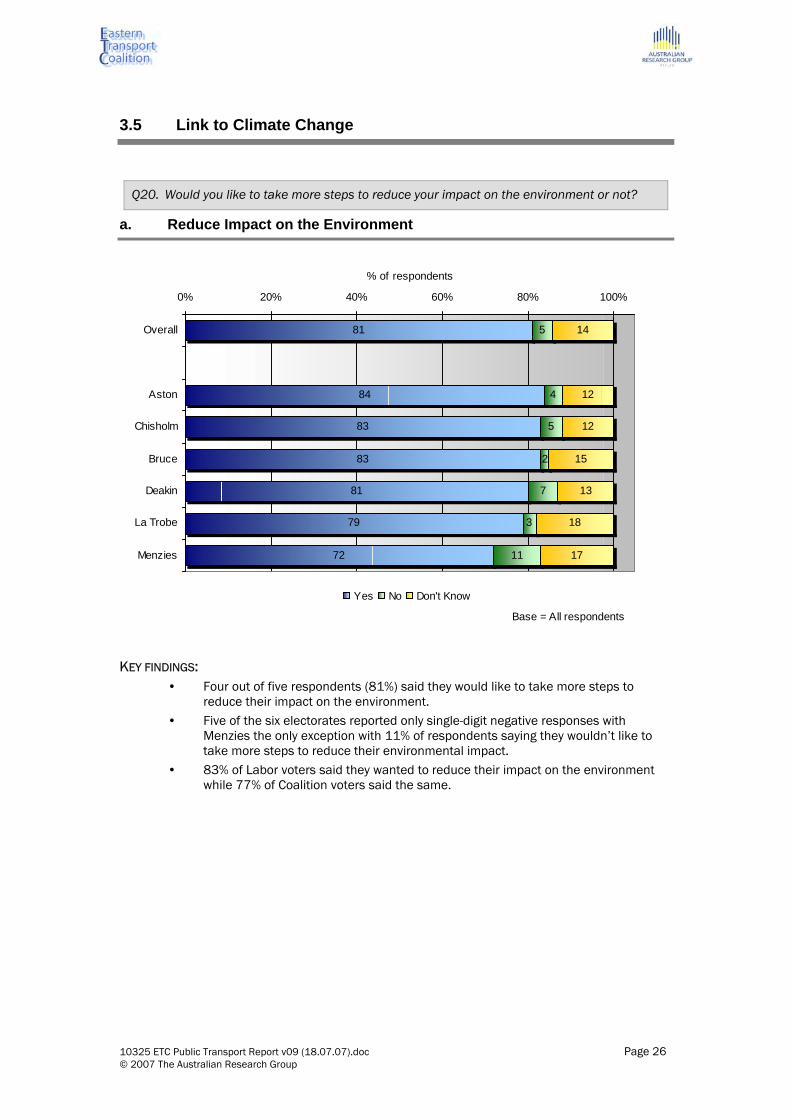
Q20. Would you like to take more steps to reduce your impact on the environment or not?
a. Reduce Impact on the Environment
81
84
83
83
81
79
72
5
4
5
2
7
3
11
14
12
12
15
13
18
17
0% 20% 40% 60% 80% 100%
Overall
Aston
Chisholm
Bruce
Deakin
La Trobe
Menzies
% of respondents
Yes No Don't Know
Base = All respondents
KEY FINDINGS:
• Four out of five respondents (81%) said they would like to take more steps to reduce their impact on the environment.
• Five of the six electorates reported only single-digit negative responses with Menzies the only exception with 11% of respondents saying they wouldn’t like to take more steps to reduce their environmental impact.
• 83% of Labor voters said they wanted to reduce their impact on the environment while 77% of Coalition voters said the same.
10325 ETC Public Transport Report v09 (18.07.07).doc Page 26 © 2007 The Australian Research Group
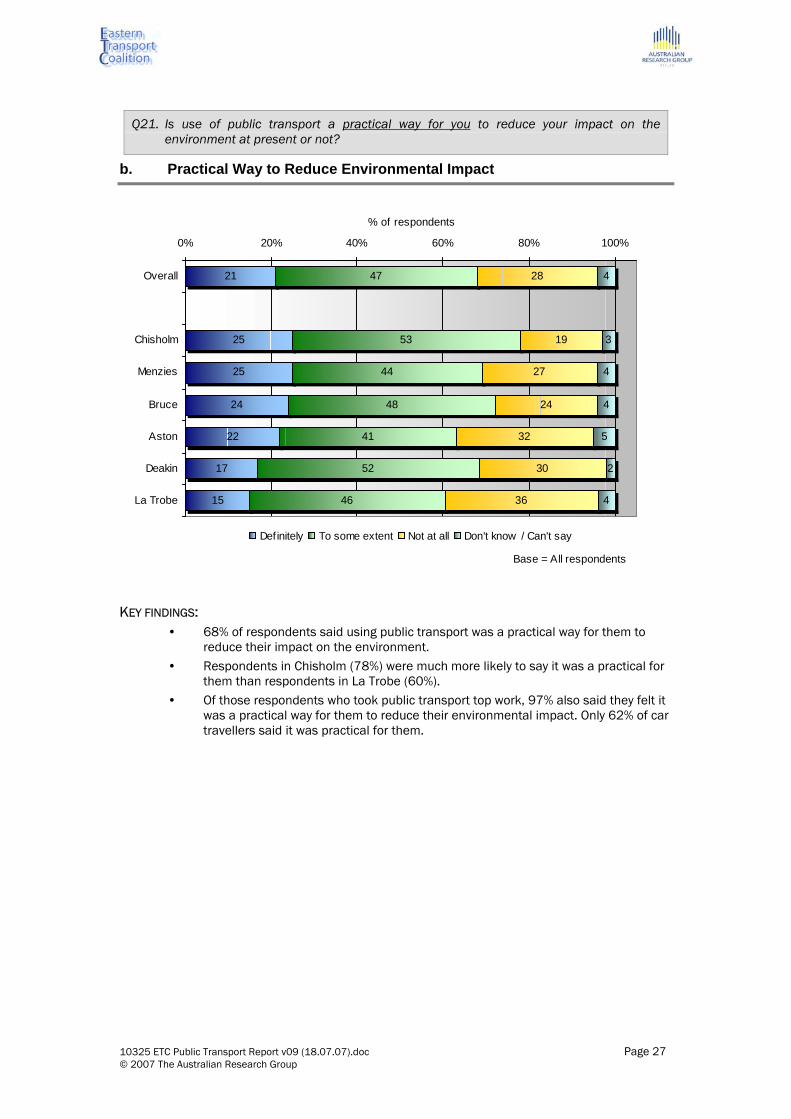
Q21. Is use of public transport a practical way for you to reduce your impact on the environment at present or not?
b. Practical Way to Reduce Environmental Impact
21
25
25
24
22
17
15
47
53
44
48
41
52
46
28
19
27
24
32
30
36
4
3
4
4
5
2
4
0% 20% 40% 60% 80% 100%
Overall
Chisholm
Menzies
Bruce
Aston
Deakin
La Trobe
% of respondents
Definitely To some extent Not at all Don't know / Can't say
Base = All respondents
KEY FINDINGS:
• 68% of respondents said using public transport was a practical way for them to reduce their impact on the environment.
• Respondents in Chisholm (78%) were much more likely to say it was a practical for them than respondents in La Trobe (60%).
• Of those respondents who took public transport top work, 97% also said they felt it was a practical way for them to reduce their environmental impact. Only 62% of car travellers said it was practical for them.
10325 ETC Public Transport Report v09 (18.07.07).doc Page 27 © 2007 The Australian Research Group

Q22. Does the lack or poor quality of public transport infrastructure in your area have any impact on your ability to do the best you can to protect the environment?
c. Ability to Protect the Environment
25
29
27
27
26
25
18
48
41
49
39
51
48
58
19
22
18
22
16
15
20
8
8
6
12
7
13
4
0% 20% 40% 60% 80% 100%
Overall
Aston
La Trobe
Menzies
Bruce
Chisholm
Deakin
% of respondents
Definitely To some extent Not at all Don't know
Base: Respondents w ho indicated they had an 'average' to'very poor' opinion of public transport (n=617)
KEY FINDINGS:
• Of those respondents who indicated that their opinion of public transport was average or lower, 45% said that the lack or poor quality of public transport had an impact on their ability to protect the environment.
10325 ETC Public Transport Report v09 (18.07.07).doc Page 28 © 2007 The Australian Research Group

3.6 Responsibility
Q23. Who do you believe has primary responsibility for running public transport?
a. Responsibility for Running Public Transport
70
75
74
72
69
68
64
9
8
6
13
10
5
14
13
10
16
8
14
20
9
8
7
4
7
8
7
13
0% 20% 40% 60% 80% 100%
Overall
Aston
La Trobe
Menzies
Deakin
Chisholm
Bruce
% of respondents
The State Government The Federal Government Private operators Don't know
Base = All respondents
KEY FINDINGS:
• 70% of respondents thought that the State Government had primary responsibility for running public transport. 9% said the Federal Government and 8% didn’t know. Only 13% chose private operators.
10325 ETC Public Transport Report v09 (18.07.07).doc Page 29 © 2007 The Australian Research Group
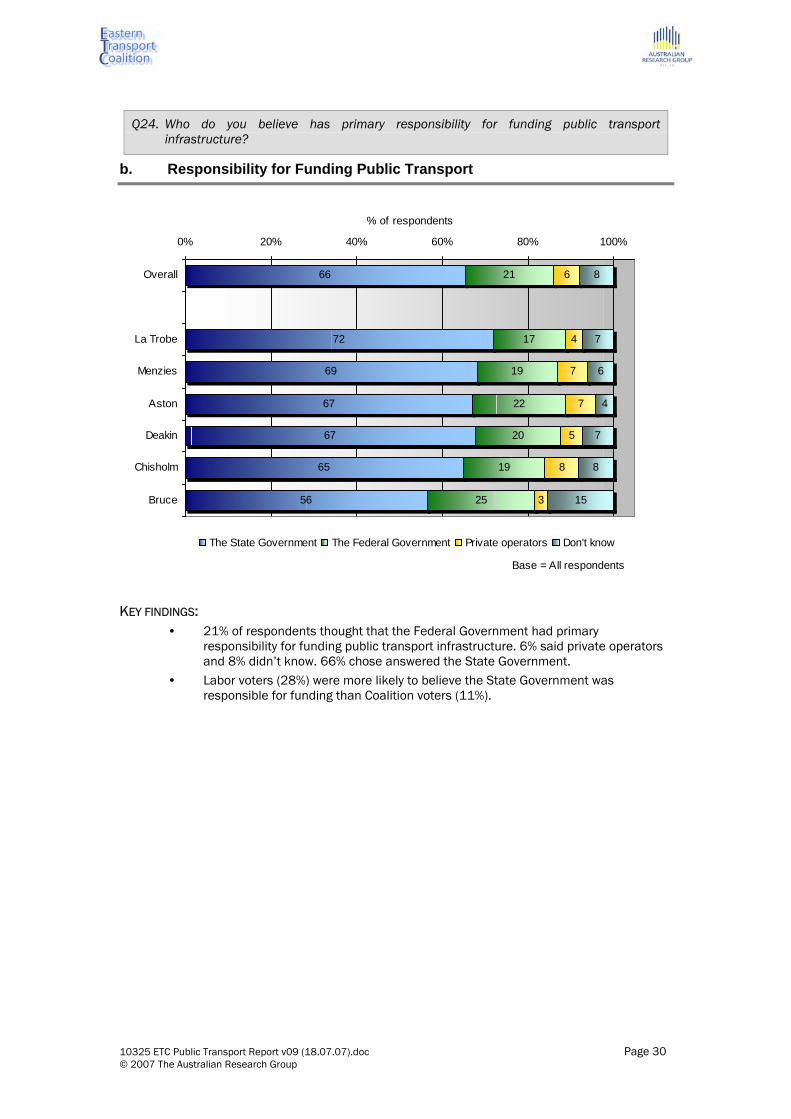
Q24. Who do you believe has primary responsibility for funding public transport infrastructure?
b. Responsibility for Funding Public Transport
66
72
69
67
67
65
56
21
17
19
22
20
19
25
6
4
7
7
5
8
3
8
7
6
4
7
8
15
0% 20% 40% 60% 80% 100%
Overall
La Trobe
Menzies
Aston
Deakin
Chisholm
Bruce
% of respondents
The State Government The Federal Government Private operators Don't know
Base = All respondents
KEY FINDINGS:
• 21% of respondents thought that the Federal Government had primary responsibility for funding public transport infrastructure. 6% said private operators and 8% didn’t know. 66% chose answered the State Government.
• Labor voters (28%) were more likely to believe the State Government was responsible for funding than Coalition voters (11%).
10325 ETC Public Transport Report v09 (18.07.07).doc Page 30 © 2007 The Australian Research Group

Q25. The Federal Government directly provides millions of dollars in funding for some major roads in cities, but does not contribute any such funds for suburban public transport infrastructure. Is this acceptable to you or not?
c. Federal Funding of Roads
62
70
64
62
62
57
56
26
20
24
27
23
32
30
12
10
11
11
15
10
14
0% 20% 40% 60% 80% 100%
Overall
Aston
Bruce
Deakin
La Trobe
Chisholm
Menzies
% of respondents
No Yes Don't knowBase = All respondents
KEY FINDINGS:
• 62% of respondents said it was not acceptable that the Federal Government provided funding for major roads but not for public transport infrastructure.
• 70% of Aston respondents said the situation was unacceptable. • Labor voters (72%) were much more likely to find the situation unacceptable than
Coalition voters (49%).
10325 ETC Public Transport Report v09 (18.07.07).doc Page 31 © 2007 The Australian Research Group

3.7 Funding Solutions
Q26. How do you feel about the following proposed funding solutions for public transport infrastructure in outer Melbourne?
a. Funding Solutions
76
79
78
78
76
72
72
18
15
18
17
17
22
22
6
7
4
5
7
5
6
0% 20% 40% 60% 80% 100%
Overall
Chisholm
La Trobe
Aston
Bruce
Deakin
Menzies
% of respondents
The State and Federal Governments The State Government The Federal Government
Base = All respondents
KEY FINDINGS:
• More than three quarters of respondents (76%) believed the State and Federal Governments should share the cost for all necessary public transport infrastructure.
• Labor voters (84%) were more likely to think the State and Federal Governments should share costs than Coalition voters.
10325 ETC Public Transport Report v09 (18.07.07).doc Page 32 © 2007 The Australian Research Group
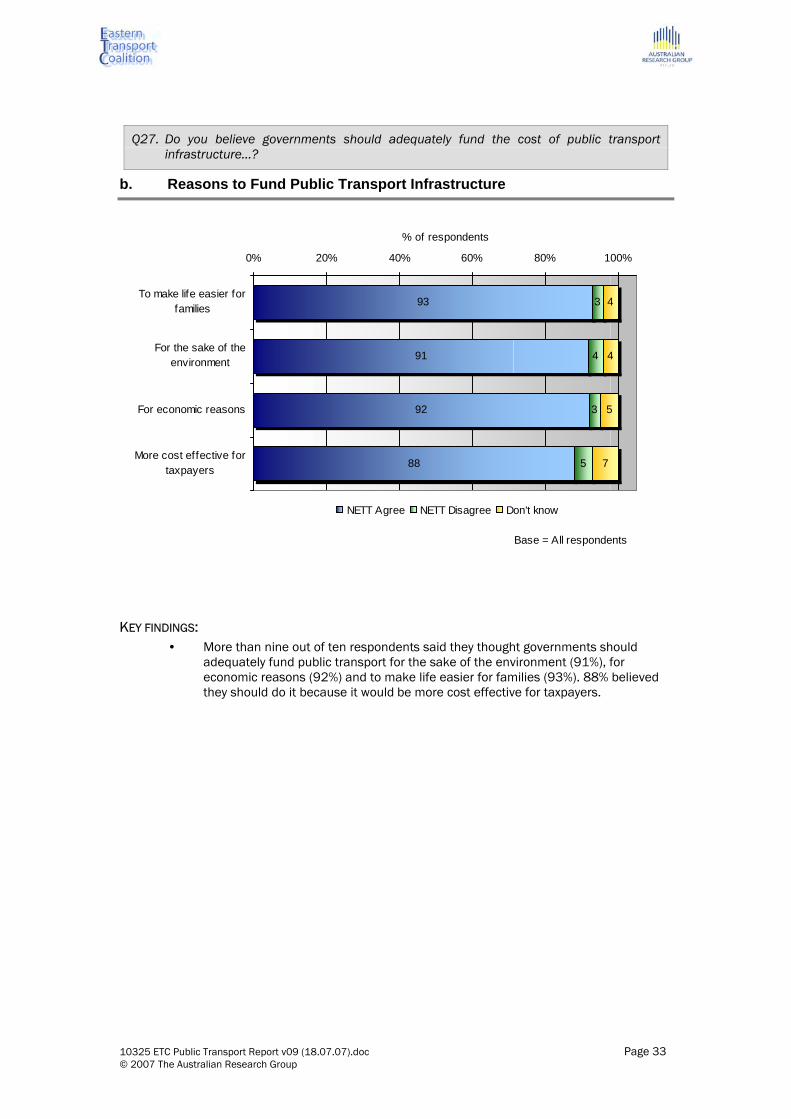
Q27. Do you believe governments should adequately fund the cost of public transport infrastructure…?
b. Reasons to Fund Public Transport Infrastructure
93
91
92
88
3
4
3
5
4
4
5
7
0% 20% 40% 60% 80% 100%
To make life easier forfamilies
For the sake of theenvironment
For economic reasons
More cost effective fortaxpayers
% of respondents
NETT Agree NETT Disagree Don't know
Base = All respondents
KEY FINDINGS:
• More than nine out of ten respondents said they thought governments should adequately fund public transport for the sake of the environment (91%), for economic reasons (92%) and to make life easier for families (93%). 88% believed they should do it because it would be more cost effective for taxpayers.
10325 ETC Public Transport Report v09 (18.07.07).doc Page 33 © 2007 The Australian Research Group

3.8 Expectations of public transport provision
Q28. Do you believe governments are giving sufficient priority to provision of good public transport infrastructure in your local area or not?
a. Sufficient Priority
14
22
15
14
13
12
9
67
57
63
68
67
74
71
19
21
22
18
21
13
20
0% 20% 40% 60% 80% 100%
Overall
Chisholm
Bruce
Menzies
Deakin
Aston
La Trobe
% of respondents
Yes No Don't KnowBase = All respondents
KEY FINDINGS:
• Two thirds of respondents (67%) surveyed said that governments were not giving sufficient priority to provision of good public transport infrastructure in their local area.
• Respondents in Aston (74%) and La Trobe (71%) were most inclined to feel this way with Chisholm (57%), the only electorate with significant access to all three primary forms of public transport, the least likely.
10325 ETC Public Transport Report v09 (18.07.07).doc Page 34 © 2007 The Australian Research Group

Q29. If the quality and reliability of public transport close to your home was improved through new infrastructure, would you consider using it more often or not?
b. Quality and Reliability
62
67
64
64
61
60
55
11
12
15
14
10
9
8
19
14
10
14
17
25
28
9
7
10
9
11
6
9
0% 20% 40% 60% 80% 100%
Overall
Bruce
Menzies
Aston
La Trobe
Chisholm
Deakin
% of respondents
Yes No I already use it as much as I need to Don't know
Base = All respondents
KEY FINDINGS:
• 62% of respondents indicated that they would consider using public transport more often if the quality and reliability of public transport infrastructure was improved.
• 69% of respondents aged 18-29 said they would consider using it more often under those circumstances.
• Less than 20% of respondents said they already used public transport as much as they needed to, indicating that there is significant potential for increased usage.
• 61% of respondents who travel to work by car indicated that they would be willing to consider public transport and 67% of those who take public transport to work said they would also consider using it more often.
10325 ETC Public Transport Report v09 (18.07.07).doc Page 35 © 2007 The Australian Research Group

Q30. If it was much quicker for you to get to work or other activities on public transport would you consider using public transport at least some of the time or not?
c. Quicker Journey
73
76
76
75
73
71
69
8
8
5
12
13
5
9
13
12
10
10
8
18
18
5
5
8
3
6
5
4
0% 20% 40% 60% 80% 100%
Overall
Bruce
La Trobe
Menzies
Aston
Deakin
Chisholm
% of respondents
Yes No I already use it as much as I need to Don't know
Base = All respondents
KEY FINDINGS:
• 73% of respondents said they would consider increasing their use of public transport if it was much quicker for them to get to work and other activities.
• 78% of respondents aged 18-29 said they would consider it compared with 70% of those aged 50 or older.
• 76% of respondents who travel to work by car indicated that they would be willing to consider public transport and if the journey was much quicker.
10325 ETC Public Transport Report v09 (18.07.07).doc Page 36 © 2007 The Australian Research Group

3.9 Voting Intentions
Q31. If a Federal election for the House of Representatives were held today, which party would receive your first preference vote?
a. Primary Vote
45
52
46
46
42
41
41
40
36
39
32
51
45
43
7
3
7
12
4
9
7
8
10
8
9
3
6
9
0% 20% 40% 60% 80% 100%
Overall
Bruce
Aston
Chisholm
Menzies
Deakin
La Trobe
% of respondents
Labor Party Coalition The Greens Other
Base = Respondents w ho selecteda party (n=892)
NOTE: These figures exclude respondents who said they didn’t know who would receive
their first preference vote.
10325 ETC Public Transport Report v09 (18.07.07).doc Page 37 © 2007 The Australian Research Group

Q32. At a Federal election you are required to vote for all candidates in your electorate in order of preference. Will you give a higher preference to the Labor Party candidate or the Liberal/National Party candidate?
b. Two Party Preferred
54
62
59
56
50
49
46
46
38
41
44
50
51
54
0% 20% 40% 60% 80% 100%
Overall
Chisholm
Bruce
Aston
La Trobe
Deakin
Menzies
% of respondents
Labor Party Coalition
Base = Respondents w ho selecteda party (n=855)
NOTE: These figures exclude respondents who said they didn’t know who would receive
their first two party preferred vote.
10325 ETC Public Transport Report v09 (18.07.07).doc Page 38 © 2007 The Australian Research Group

3.10 Importance of transport as an election issue
Q33. When thinking about how you will vote at the next Federal election, which will be the most important to you?
a. Voting Influence
56
61
59
56
55
55
52
26
22
25
28
28
24
31
12
12
6
11
14
12
14
5
6
9
4
3
8
3
0% 20% 40% 60% 80% 100%
Overall
Chisholm
Menzies
Deakin
Aston
Bruce
La Trobe
% of respondents
The parties' position on national issuesHow I feel about the leaders of the major parties
The parties' position on issues specif ic to my local areaHow I feel about my local candidate
Base = All respondents
KEY FINDINGS:
• Unsurprisingly the majority of respondents in every electorate said that the parties’ position on national issues would be the most important factor in deciding their vote, followed by how they felt about the leaders of the major parties.
10325 ETC Public Transport Report v09 (18.07.07).doc Page 39 © 2007 The Australian Research Group

Q34. How important will the issue of public transport infrastructure be in deciding how you will vote?
b. Public Transport as an Election Issue
14
16
16
14
14
14
9
42
44
33
49
46
33
42
27
25
34
20
25
26
31
0 20 40 60 80
Overall
Chisholm
Deakin
Bruce
Aston
Menzies
La Trobe
% of respondents
100
Very important - Major considerationSomew hat Important - Some considerationOf small importance - Small amount of consideration
Base = All respondents
KEY FINDINGS:
• More than four out of five respondents (83%) said that the issue of public transport infrastructure would be of importance when deciding who they would vote for in the next Federal election.
• Almost 90% of Labor voters and 80% of Coalition voters said they would consider public transport infrastructure when deciding on their vote.
• 90% of respondents aged 18-29 said they would consider the issue.
10325 ETC Public Transport Report v09 (18.07.07).doc Page 40 © 2007 The Australian Research Group

4. Questionnaire
1. Demographics
Qu 1. Please indicate your gender
Single Response
Male Female
Qu 2. Please indicate your age
Single Response
Route
17 years or younger CLOSE
18-29
30-39
40-49
50 years or older
Qu 3. What is your postcode?
Single Response
10325 ETC Public Transport Report v09 (18.07.07).doc Page 41 © 2007 The Australian Research Group
2. Use of public transport
a. Use and awareness
Qu 4. What is your main form of transport for getting to and from your place of work?
Single Response
Car – as driver Car – as passenger Public transport Bicycle Motorbike Other Not applicable
Qu 5. What is your main form of transport for travel not including your trip to and from work?
Single Response
Car – as driver Car – as passenger Public transport Bicycle Motorbike Other
Qu 6. How often do you use public transport?
Single Response
Route
Every day
Several times a week
Once a week
Once a month
Several times a year
Never
10325 ETC Public Transport Report v09 (18.07.07).doc Page 42 © 2007 The Australian Research Group
Qu 7. How would you describe your level of knowledge about public transport
facilities in your area?
Single Response
Very low: I really don’t know much Low: I know a little bit Average: I know something High: I know a lot Very high: I know quite a lot
10325 ETC Public Transport Report v09 (18.07.07).doc Page 43 © 2007 The Australian Research Group

3. Traffic and roads
a. Scale of traffic problems
Qu 8. How would you describe the typical level of congestion on major roads in your area at peak times?
Choose only one
A very high level of congestion A high level of congestion A little congestion No congestion Don’t know
Qu 9. How would you describe your typical experience of accessing major roads in your area at peak times?
Choose only one
I’ve never had any problems It has been an occasional problem for me It has been a frequent problem for me It has been a very frequent problem for me I never use the roads at peak times Don’t know
b. Responsibility for road problems
Qu 10. Who do you believe should fix the problems of traffic congestion on major roads in your area?
[ROTATE]
Choose only one
The State Government should fix the problems The Federal Government should fix the problems Federal and State Governments should work together to fix the problems
10325 ETC Public Transport Report v09 (18.07.07).doc Page 44 © 2007 The Australian Research Group
4. Quality of services
Qu 11. How would you describe your overall opinion of the public transport services
in your area?
Single Response Route Very good SKIP Qu 16-19 & 22
Good SKIP Qu 16-19 & 22
Average
Poor
Very poor
Don’t know SKIP Qu 16-19 & 22
Qu 12. Which of the following services operate in your area?
Operate in my Area
Do NOT operate in my area
Route
Trains IF NO SKIP Qu 13
Trams IF NO SKIP Qu 14
Buses IF NO SKIP Qu 15
a. Rail services
Qu 13. How would you rate the following aspects of the train services in your area?
Very good Good Average Poor Very poor Don’t
know
Overall quality The location of the station(s) The speed of the journey The timetable of services Reliability Ability to obtain a seat
b. Bus services
Qu 14. How would you rate the following aspects of the bus services in your area?
Very good Good Average Poor Very poor Don’t
know
Overall quality The location of the stops The speed of the journey The timetable of services Reliability Ability to obtain a seat
10325 ETC Public Transport Report v09 (18.07.07).doc Page 45 © 2007 The Australian Research Group

c. Tram services
Qu 15. How would you rate the following aspects of the tram services in your area?
Very good Good Average Poor Very poor Don’t
know
Overall quality The location of the stops The speed of the journey The timetable of services Reliability Ability to obtain a seat
10325 ETC Public Transport Report v09 (18.07.07).doc Page 46 © 2007 The Australian Research Group
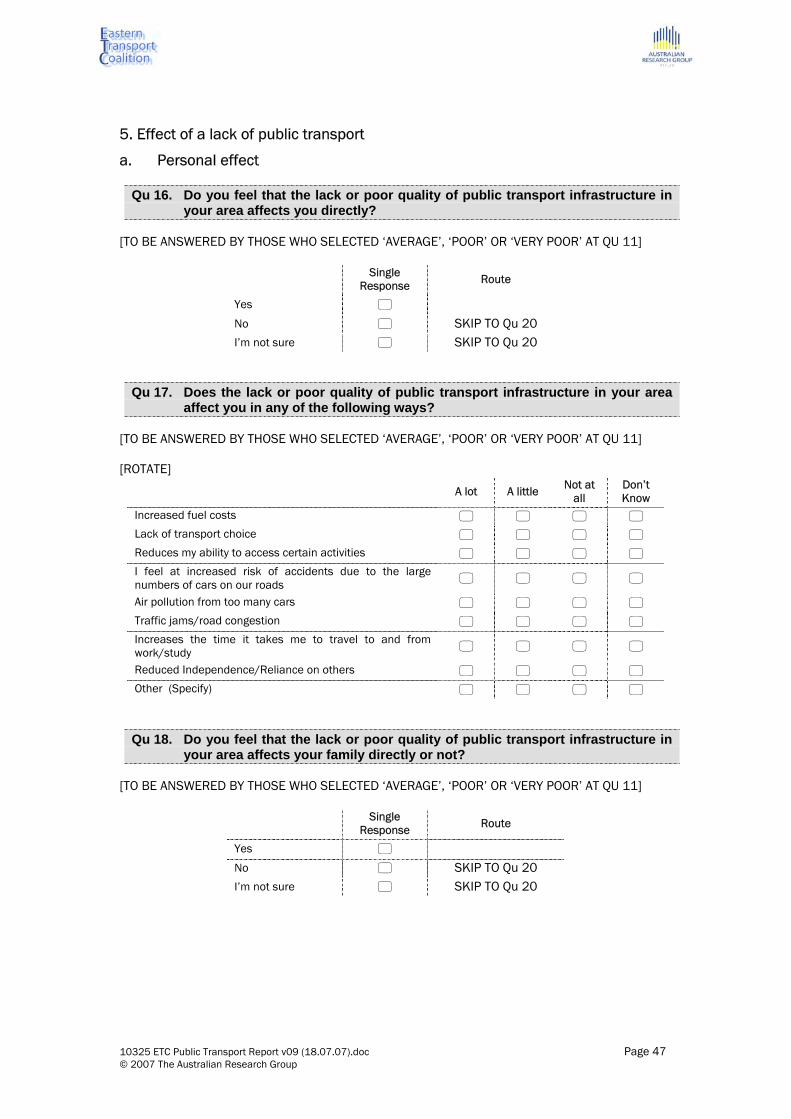
5. Effect of a lack of public transport
a. Personal effect
Qu 16. Do you feel that the lack or poor quality of public transport infrastructure in your area affects you directly?
[TO BE ANSWERED BY THOSE WHO SELECTED ‘AVERAGE’, ‘POOR’ OR ‘VERY POOR’ AT QU 11]
Single Response Route
Yes No SKIP TO Qu 20I’m not sure SKIP TO Qu 20
Qu 17. Does the lack or poor quality of public transport infrastructure in your area affect you in any of the following ways?
[TO BE ANSWERED BY THOSE WHO SELECTED ‘AVERAGE’, ‘POOR’ OR ‘VERY POOR’ AT QU 11] [ROTATE]
A lot A little Not at all
Don’t Know
Increased fuel costs Lack of transport choice Reduces my ability to access certain activities I feel at increased risk of accidents due to the large numbers of cars on our roads
Air pollution from too many cars Traffic jams/road congestion Increases the time it takes me to travel to and from work/study
Reduced Independence/Reliance on others Other (Specify)
Qu 18. Do you feel that the lack or poor quality of public transport infrastructure in your area affects your family directly or not?
[TO BE ANSWERED BY THOSE WHO SELECTED ‘AVERAGE’, ‘POOR’ OR ‘VERY POOR’ AT QU 11]
Single Response Route
Yes No SKIP TO Qu 20I’m not sure SKIP TO Qu 20
10325 ETC Public Transport Report v09 (18.07.07).doc Page 47 © 2007 The Australian Research Group
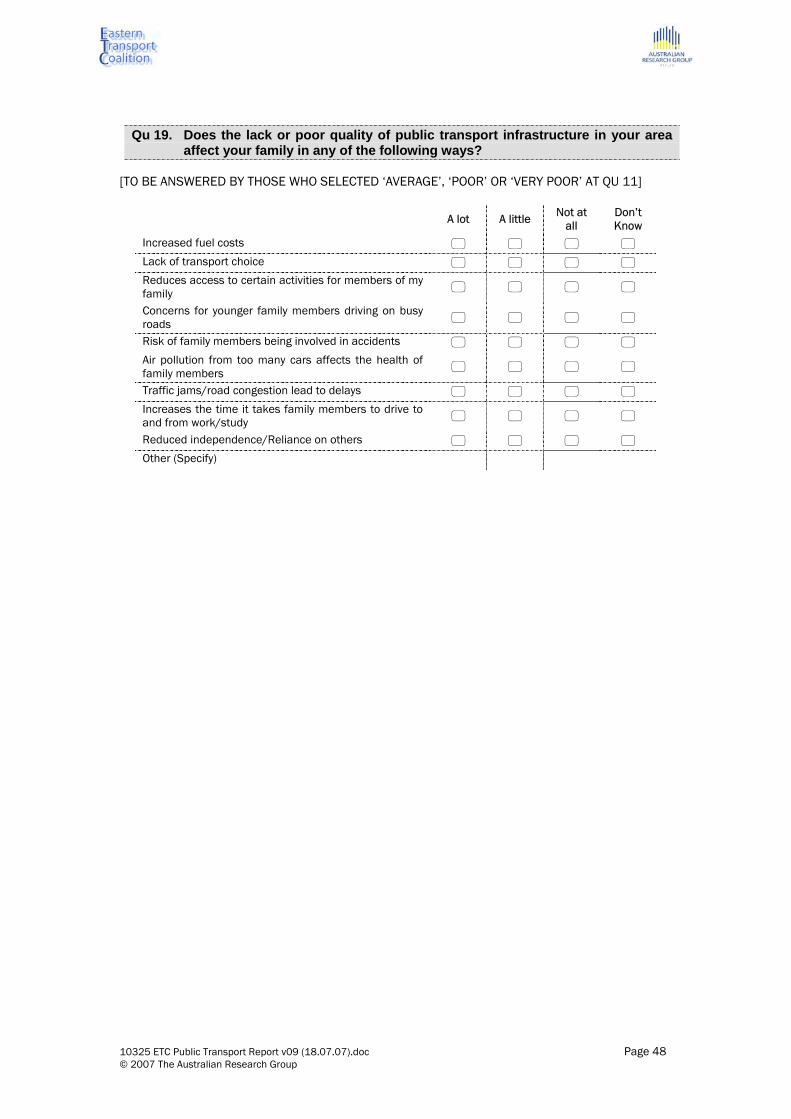
Qu 19. Does the lack or poor quality of public transport infrastructure in your area affect your family in any of the following ways?
[TO BE ANSWERED BY THOSE WHO SELECTED ‘AVERAGE’, ‘POOR’ OR ‘VERY POOR’ AT QU 11]
A lot A little Not at all
Don’t Know
Increased fuel costs Lack of transport choice Reduces access to certain activities for members of my family
Concerns for younger family members driving on busy roads
Risk of family members being involved in accidents Air pollution from too many cars affects the health of family members
Traffic jams/road congestion lead to delays Increases the time it takes family members to drive to and from work/study
Reduced independence/Reliance on others Other (Specify)
10325 ETC Public Transport Report v09 (18.07.07).doc Page 48 © 2007 The Australian Research Group

6. Link to climate change
a. Concerns about reducing emissions
Qu 20. Would you like to take more steps to reduce your impact on the environment or not?
Single Response
Yes No Don’t know/ Can’t say
Qu 21. Is use of public transport a practical way for you to reduce your impact on the environment at present or not?
Single Response
Definitely To some extent Not at all Don’t know/ Can’t say
Qu 22. Does the lack or poor quality of public transport infrastructure in your area have any impact on your ability to do the best you can to protect the environment or not?
[TO BE ANSWERED BY THOSE WHO SELECTED ‘AVERAGE’, ‘POOR’ OR ‘VERY POOR’ AT QU 11]
Single Response
Definitely To some extent Not at all Don’t know/ Can’t say
10325 ETC Public Transport Report v09 (18.07.07).doc Page 49 © 2007 The Australian Research Group
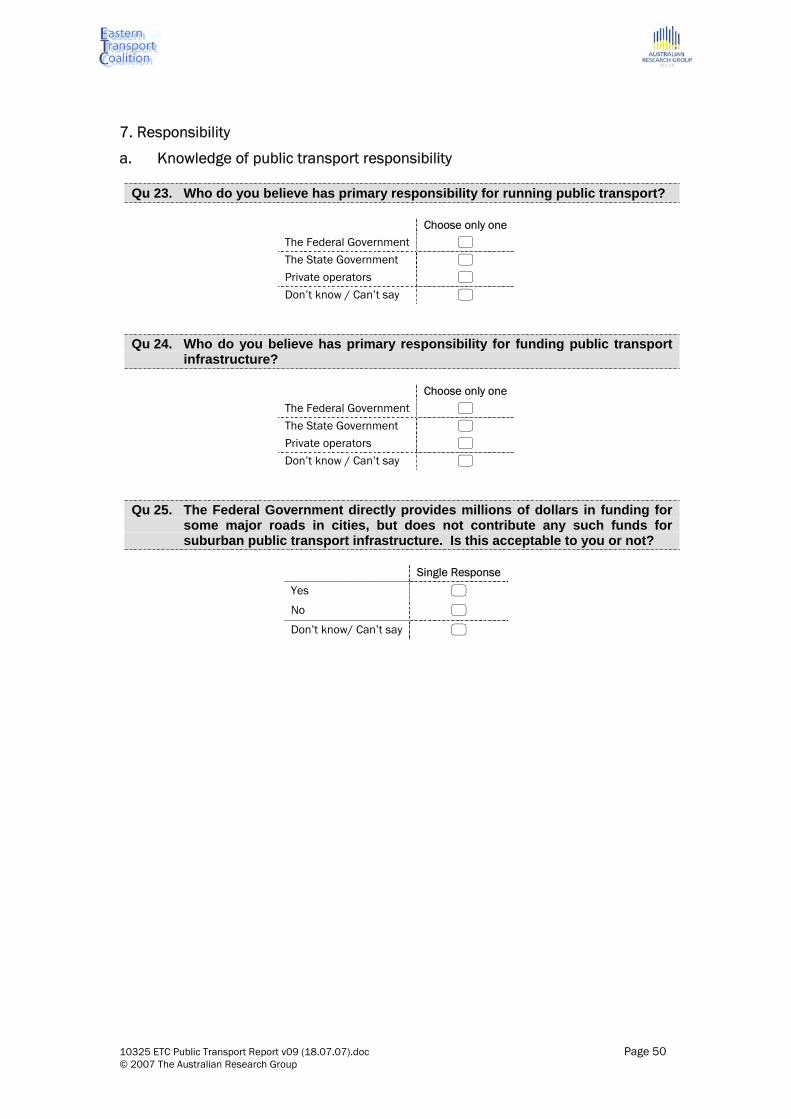
7. Responsibility
a. Knowledge of public transport responsibility
Qu 23. Who do you believe has primary responsibility for running public transport?
Choose only one The Federal Government The State Government Private operators Don’t know / Can’t say
Qu 24. Who do you believe has primary responsibility for funding public transport infrastructure?
Choose only one
The Federal Government The State Government Private operators Don’t know / Can’t say
Qu 25. The Federal Government directly provides millions of dollars in funding for some major roads in cities, but does not contribute any such funds for suburban public transport infrastructure. Is this acceptable to you or not?
Single Response
Yes No Don’t know/ Can’t say
10325 ETC Public Transport Report v09 (18.07.07).doc Page 50 © 2007 The Australian Research Group

8. Funding solutions
Qu 26. How do you feel about the following proposed funding solutions for public
transport infrastructure in outer Melbourne? [ROTATE]
Choose only one
Route
The State Government should pay for all necessary public transport infrastructure
The Federal Government should fund all necessary public transport infrastructure
The State and Federal Governments should share the cost for large-scale public transport infrastructure SKIP TO Qu 28
Qu 27. Do you believe governments should adequately fund the cost of public transport infrastructure…
[ROTATE]
Strongly Agree Agree Disagree Strongly
Disagree Don’t know
For the sake of the environment For economic reasons To make life easier for families Because it would be more cost effective for taxpayers
10325 ETC Public Transport Report v09 (18.07.07).doc Page 51 © 2007 The Australian Research Group
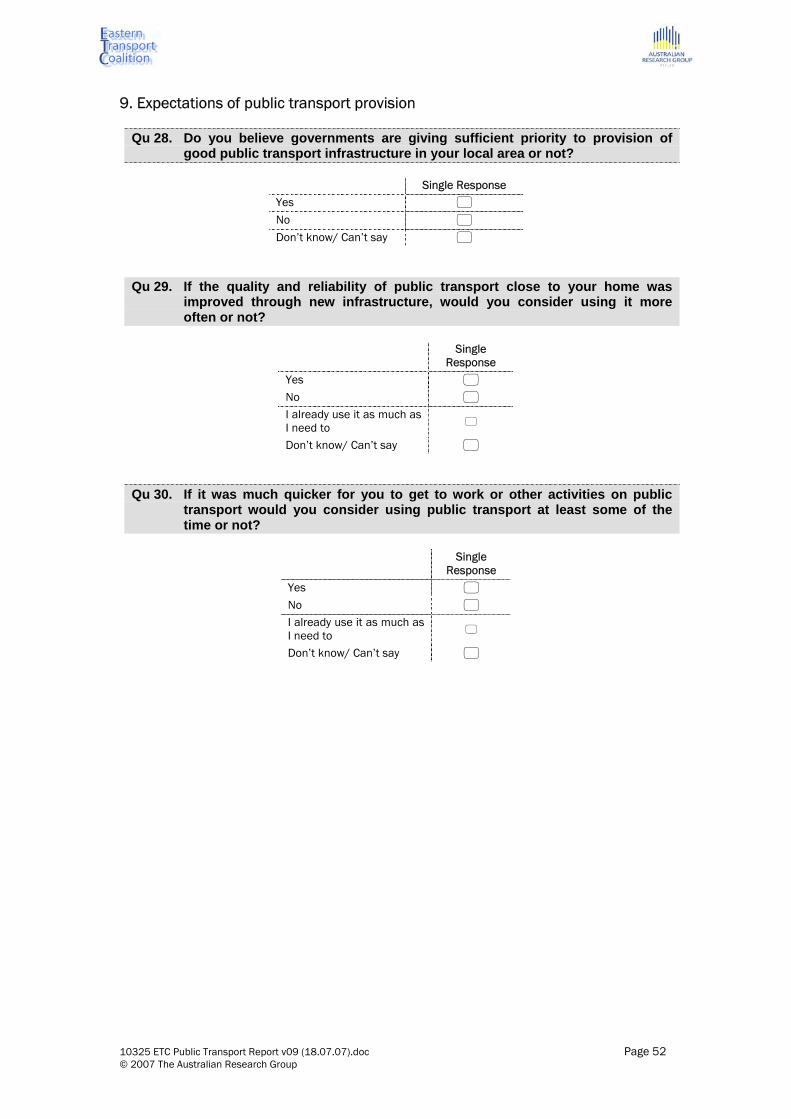
9. Expectations of public transport provision
Qu 28. Do you believe governments are giving sufficient priority to provision of good public transport infrastructure in your local area or not?
Single Response
Yes No Don’t know/ Can’t say
Qu 29. If the quality and reliability of public transport close to your home was improved through new infrastructure, would you consider using it more often or not?
Single Response
Yes No I already use it as much as I need to
Don’t know/ Can’t say
Qu 30. If it was much quicker for you to get to work or other activities on public transport would you consider using public transport at least some of the time or not?
Single Response
Yes No I already use it as much as I need to
Don’t know/ Can’t say
10325 ETC Public Transport Report v09 (18.07.07).doc Page 52 © 2007 The Australian Research Group

10. Voting intentions
Qu 31. If a Federal election for the House of Representatives were held today, which
party would receive your first preference vote?
[ROTATE TOP TWO]
Select One Route
1 Labor Party End
2 Liberal Party End
3 The Nationals End
4 The Greens Qu 33
5 Family First Party Qu 33
6 Australian Democrats Qu 33
7 An independent candidate Qu 33
8 Some other party Qu 33
9 Don’t know Qu 32
Qu 32. Which of these parties are you leaning towards?
[ROTATE TOP TWO]
Select One Route
1 Labor Party End
2 Liberal Party End
3 The Nationals End
4 The Greens Qu 33
5 Family First Party Qu 33
6 Australian Democrats Qu 33
7 An independent candidate Qu 33
8 Some other party Qu 33
9 Don’t know End
Qu 33. At a Federal Election you are required to vote for all candidates in your electorate in order of preference. Will you give a higher preference to the Labor Party candidate or the Liberal/National Party candidate?
[ROTATE TOP TWO]
Select One
1 Labor Party 2 Liberal/ National Party 3 Don’t know
10325 ETC Public Transport Report v09 (18.07.07).doc Page 53 © 2007 The Australian Research Group
11. Importance of transport as a voting issue
Qu 34. When thinking about how you will vote at the next Federal election, which will be the most important to you?
Single Response
How I feel about the leaders of the major parties How I feel about my local candidate The parties’ position on national issues The parties’ position on issues specific to my local area
Qu 35. How important will the issue of public transport infrastructure be in deciding how you will vote?
Single Response
Very important – I will give it major consideration Somewhat Important – I will give it some consideration Of small importance – I will give it a small amount of consideration
Of no importance – it is not relevant to how I will vote Don’t know
10325 ETC Public Transport Report v09 (18.07.07).doc Page 54 © 2007 The Australian Research Group