Public Subsidies for Private Schooling: A Comparative...
28
Journal of Comparative Policy Analysis: Research and Practice 4: 189–216, 2002 c 2002 Kluwer Academic Publishers. Printed in The Netherlands. Public Subsidies for Private Schooling: A Comparative Analysis of Argentina and Chile PATRICK J. MCEWAN [email protected] Wellesley College, Department of Economics, Wellesley, MA 02481 Key words: Argentina, Chile, private schools, vouchers, education Abstract Argentina and Chile have long-standing policies that award public subsidies to private schools. This article compares the academic outcomes of seventh- and eighth-graders in public and pri- vate schools in each country. Three types of private schools are analyzed: Catholic schools that are subsidized by the government, nonreligious schools that are subsidized, and private schools that receive no subsidies. Ultimately, the analyses suggest a mixed portrait of private school effec- tiveness, in which Catholic schools have the most consistent links to achievement. Nonreligious subsidized schools in Chile, often operated by for-profit corporations, produce outcomes no dif- ferent from public schools. Introduction A common claim is that public schools are inefficient, whether in developed or developing countries (e.g., Hanushek, 1995, 1997). These conclusions are not without controversy (Fuller and Clarke, 1994; Kremer, 1995; Greenwald et al., 1996), but they have reinvigorated a long-standing debate on private alterna- tives to public schooling. Milton Friedman (1955) was among the first to ar- gue that parents should receive tuition coupons, or vouchers, to attend private schools rather than neighborhood public schools. Throughout the 1990s, there were renewed calls for vouchers, typically accompanied by a strong critique of public schools (e.g., Chubb and Moe, 1990; West, 1997; Hoxby, 1998; Peterson and Hassel, 1998). These voucher proposals vary widely in their scope and design (see Levin, 1991, for a summary). However, they rest on a common sup- position: that private schools are relatively more effective than public schools, by virtue of producing greater amounts of desirable outcomes. Before pursuing these policies, it is reasonable to inquire whether their as- sumptions find empirical support. 1 This article provides empirical evidence from Argentina and Chile. It attempts to determine whether a given school type— public or private—is relatively more effective at producing outcomes among similar kinds of students. Argentina and Chile provide interesting contexts in which to examine the relative effectiveness of private schools, in part because
Transcript of Public Subsidies for Private Schooling: A Comparative...
Journal of Comparative Policy Analysis: Research and Practice 4: 189–216, 2002c© 2002 Kluwer Academic Publishers. Printed in The Netherlands.
Public Subsidies for Private Schooling:A Comparative Analysis of Argentina and Chile
PATRICK J. MCEWAN [email protected] College, Department of Economics, Wellesley, MA 02481
Key words: Argentina, Chile, private schools, vouchers, education
Abstract
Argentina and Chile have long-standing policies that award public subsidies to private schools.This article compares the academic outcomes of seventh- and eighth-graders in public and pri-vate schools in each country. Three types of private schools are analyzed: Catholic schools thatare subsidized by the government, nonreligious schools that are subsidized, and private schoolsthat receive no subsidies. Ultimately, the analyses suggest a mixed portrait of private school effec-tiveness, in which Catholic schools have the most consistent links to achievement. Nonreligioussubsidized schools in Chile, often operated by for-profit corporations, produce outcomes no dif-ferent from public schools.
Introduction
A common claim is that public schools are inefficient, whether in developed ordeveloping countries (e.g., Hanushek, 1995, 1997). These conclusions are notwithout controversy (Fuller and Clarke, 1994; Kremer, 1995; Greenwald et al.,1996), but they have reinvigorated a long-standing debate on private alterna-tives to public schooling. Milton Friedman (1955) was among the first to ar-gue that parents should receive tuition coupons, or vouchers, to attend privateschools rather than neighborhood public schools. Throughout the 1990s, therewere renewed calls for vouchers, typically accompanied by a strong critique ofpublic schools (e.g., Chubb and Moe, 1990; West, 1997; Hoxby, 1998; Petersonand Hassel, 1998). These voucher proposals vary widely in their scope anddesign (see Levin, 1991, for a summary). However, they rest on a common sup-position: that private schools are relatively more effective than public schools,by virtue of producing greater amounts of desirable outcomes.
Before pursuing these policies, it is reasonable to inquire whether their as-sumptions find empirical support.1 This article provides empirical evidence fromArgentina and Chile. It attempts to determine whether a given school type—public or private—is relatively more effective at producing outcomes amongsimilar kinds of students. Argentina and Chile provide interesting contexts inwhich to examine the relative effectiveness of private schools, in part because

190 MCEWAN
both countries allocate extensive public subsidies to private schools.2 InArgentina, the government funds the salaries of many teachers and principalsin private schools. In Chile, the funding is directly tied to student enrollments,and school budgets are immediately penalized when students leave a privateschool. In many ways, the Chilean plan is similar to Friedman’s seminal voucherproposal.
In each country, the private sector currently holds a significant share of theeducational market. In Argentina, 21% of primary school children attend privateschools, while in Chile that percentage is doubled. Within each country, there istremendous heterogeneity in the management and financing of private schools.Schools operated by the Catholic Church command an impressive portion ofthe market in each country, although nonreligious providers are an especiallyimportant segment in Chile.
In this article, I use 1997 data from Argentina and Chile to compare the aca-demic outcomes of seventh- and eighth-graders in public and private schools.Three types of private schools are analyzed: Catholic schools that are subsi-dized by the government, nonreligious schools that are subsidized, and privateschools that receive no subsidies. Ultimately, the analyses suggest a mixedportrait of private school effectiveness, in which Catholic schools have the mostconsistent links to achievement. Subsidized private schools operated by non-religious organizations in Chile, often for-profit corporations, produce outcomesno different from public schools.
To develop the analysis, the article first describes the institutional frameworkof private schooling in each country. Then the empirical strategy is outlinedthat will be used to compare student outcomes, as well as the data that areemployed. Next, the main empirical results are described, followed by an ex-ploration of several explanations for the most consistent patterns. The articleends with a summary and conclusion.
Private schooling in Argentina and Chile
This section describes the institutional framework of private schooling inArgentina and Chile, focusing on the mechanisms for public finance of privateschooling and the current market share of private schools in each country. Itthen highlights key differences between the two systems.
Argentina
Institutional framework. At least since the late 1940s, Argentina’s govern-ment has provided financial subsidies for the payment of teacher salaries inprivate schools.3 A pair of 1958 laws, however, laid the foundations for thecurrent system of private school finance. A teacher statute guaranteed that pri-vate school teachers would enjoy salaries similar to their counterparts in publicschools. A second law established that private schools charging tuition could

PUBLIC SUBSIDIES FOR PRIVATE SCHOOLING 191
receive subsidies covering up to 80% of teacher and principal salaries. Privateschools that did not charge tuition could receive up to 100% of salaries.
In subsequent decades, the system was fine-tuned but not dramatically al-tered. In 1964, for example, a law established the notion of Planta OrganicaFuncional. Among other impositions, it established minimum class sizes for sub-sidized private schools. Its purpose was to curb incentives for private schoolsto inflate their staff beyond reasonable limits.4 In addition, the law establisheda sliding scale for wage subsidies. As before, full subsidies were provided to“free’’ private schools (although small fees were occasionally allowed). Otherprivate schools were awarded between 30% and 80%, depending on criteriasuch as the tuition charged by private schools, the socioeconomic condition ofstudents, and the educational “needs’’ in the community.5
On the face of it, the criteria used to allocate private school subsidies areobjective. For example, private schools in less favorable socioeconomic con-ditions are supposed to receive a higher proportion of subsidies. Nevertheless,Morduchowicz et al. (1999) highlight the difficulty in translating these goals intoobjective and well-targeted subsidies. They argue that, in the best of cases,the subsidy is guided by the good judgment of the local authority. In the worstof cases, the subsidy may be arbitrary. In several case studies, the authorshighlight a range of inconsistencies. In some schools, the number of subsi-dized personnel exceeds the maximum allowed by law (the Planta OrganicaFuncional). In others, subsidies are larger than would be permitted by a strictapplication of the law.
Private school market share. At the beginning of Argentina’s efforts to sub-sidize private schooling in the late 1940s, roughly 8% of primary students at-tended a private school. This period marked the beginning of steady growthover the next 50 years (Morduchowicz et al., 1999). By 1998, 21% of primarystudents attended a private school (see Table 1). Of these, roughly 63% (or 13%of total primary enrollments) attended a private school managed by the CatholicChurch. The rest attended nonreligious private schools (or perhaps a small mi-nority of other religious schools, although no data are available to substantiatethis).
In 1998, 45% of private students attended schools where teacher salarieswere fully subsidized by the government. Another 28% attended schools whereteacher salaries were partially subsidized. The remaining portion, 27%, attend-ed unsubsidized private schools. There are, regrettably, no data on how subsi-dies are distributed across either Catholic or nonreligious private schools.6
Chile
Institutional framework. At the time of the military coup d’etat in 1973,Chile’s education system was one of the most developed in Latin America.A dirigiste Ministry of Education assumed exclusive responsibility for

192 MCEWAN
Table 1. Private school enrollments in Argentina andChile (primary grades).
Private enrollments,primary grades (%)
Argentina, 1998
Public 78.9
Catholic 13.3
Nonreligious 7.8
Total 100
Chile, 1996
Public 58.5
Catholic subsidized 10.3
Protestant subsidized 1.5
Nonreligious subsidized 21.4
Private nonsubsidized 8.3
Total 100
Sources: Morduchowicz et al. (1999, Tables 3 and 4);McEwan and Carnoy (2000, Table 2).
administering and financing the entire public school system. There were,however, important numbers of private schools, about half of these managed bythe Catholic Church (Espinola, 1993). Following a long tradition of public sup-port of private education, many received subsidies from the central governmentthat covered roughly 30% of costs in 1980 (Larranaga, 1995).
In 1980 the military government initiated a sweeping reform. It first transferredresponsibility for public school management from the Ministry of Education tolocal municipalities. At the same time, it altered how public and most privateschools were financed. The Ministry of Education began disbursing monthlypayments to municipalities based on a fixed subsidy—or voucher, as it is com-monly interpreted—multiplied by the number of students enrolled in publicschools.7 Private schools received equivalent per-student payments if they didnot charge tuition (although private schools could—and many did—choose notto accept government subsidies or regulations). Thus, payments to public andprivate schools began fluctuating in direct proportion to student enrollments.The law established a base subsidy, which varies according the level of educa-tion and the location of the school.8
The military ceded power to a democratic government in 1990. The essentialform and function of Chile’s system of school finance were maintained. At thesame time, new policies and programs were grafted onto the existing system.The national government focused its new policies on improving the quality ofprimary schools through direct investment, often with aid from internationaldevelopment institutions.9

PUBLIC SUBSIDIES FOR PRIVATE SCHOOLING 193
Perhaps the greatest shift in private school finance occurred in 1993, withfinanciamento compartido or “shared financing.” Prior to the law, publiclyfunded schools were not allowed to charge tuition (though many still foundcreative ways to circumvent this, such as fees for Parent Centers, akin toParent-Teacher Associations in the United States). The law allowed all privatesubsidized schools—both elementary and secondary—and public secondaryschools to charge limited tuition. Voucher payments were to be reduced on asliding scale that favored charging at least some tuition.10
Private school market share. Chile’s 1980 reform sparked a massive re-distribution of enrollments across private and public schools (see Table 1 forrecent enrollments). Between 1981 and 1996, enrollments in private subsidizedschools expanded from 15% to around 33% of the total, most of these gains atthe expense of public school enrollments. Within this category, however, thereis a great deal of heterogeneity. Currently, about two thirds of private subsidizedenrollments (or 21% of total primary enrollments) are in nonreligious schools.The other subsidized private schools are managed by the Catholic Church or asmall minority of Protestant churches.
With the advent of “shared financing” in 1993, many subsidized schoolsopted to receive lower subsidies in exchange for the right to charge tuition.By 1996, 33% of nonreligious subsidized schools and 55% of Catholic subsi-dized schools chose to accept diminished subsidies.11
Throughout the last two decades, a fairly steady percentage of primarystudents—currently about 8%—has enrolled in private schools that do not ac-cept subsidies and that charge hefty tuition.
Argentina and Chile compared
The Argentina and Chilean governments provide extensive subsidies to privateschools. And in each case, their policies appear to have catalyzed substan-tial growth in private enrollments.12 Yet each country followed a very differentpath to this growth. Before proceeding with the empirical analysis, it is worthemphasizing two notable differences.
First, the structure of the funding mechanisms is substantially different.Argentina directly funds the salaries of private school teachers and principals, ora portion thereof, while Chile funds a per-student subsidy. Chile’s policy allowsprivate schools greater latitude in choosing how to allocate resources, becausethe student subsidies may fund personnel or other investments. Consequently,Chilean law may provide greater autonomy to private schools. If the argumentsof voucher proponents like Chubb and Moe (1990) are correct, this autonomyshould encourage more effective organizations and perhaps improve the effec-tiveness of subsidized private schools in the Chilean context. The subsequentempirical analyses will suggest that this is not necessarily the case.
Funding mechanisms may affect incentives in other respects. When privatesubsidized schools lose students in Chile, their budgets are immediately

194 MCEWAN
penalized. This outcome, in turn, may provide immediate incentives to compete.In Argentina, the response may be less immediate. In fact, the case studies ofMorduchowicz et al. (1999) imply that the response of private school subsidiesto lost enrollments may be sluggish, if any response occurs at all, because someprivate schools have maintained teaching staffs above the “optimal” suggestedby law. In such cases, lost students would not necessarily imply the need toreduce personnel and sacrifice subsidies.
Second, nonreligious subsidized schools in Chile have a substantially largermarket share than their counterparts in Argentina (even though both countrieshave similar enrollments in Catholic subsidized schools). Many of the Chileanschools are operated by for-profit corporations and were created in direct re-sponse to the 1980 reform. In this respect, Chile appears to be qualitativelydifferent from Argentina.
There are a number of possible explanations for the greater dynamism ofnonreligious subsidized schools in Chile. The most likely explanation is to befound on the supply side of the market, including the relatively more generoussubsidies given to private schools, in tandem with fewer constraints placed onwages and personnel decisions in Chilean private schools. In this context, theprivate school marketplace in Chile was simply more attractive to profit-drivenentrepreneurs.
Three categories of private schooling
This article will analyze three categories of private schooling in each country:(1) Catholic subsidized, (2) nonreligious subsidized, and (3) nonsubsidized pri-vate schools. The first category includes all schools managed by the CatholicChurch that receive at least partial subsidies (including, for example, Argentineschools that receive only a portion of teacher salaries, or Chilean schools thatparticipate in “shared financing”). The second category includes any subsidizedschools that are operated by nonreligious organizations, ranging from the for-profit corporations that are prevalent in Chile to non-profit foundations. The finalcategory includes any private school that does not receive subsidies. In bothcountries, this category includes a mix of religious and nonreligious schools.
Empirical strategy and data
This section outlines the empirical strategy that is used to compare student out-comes in public and private schools. It then describes the data from Argentinaand Chile that are used to implement the strategy.
Empirical strategy
The goal is to determine whether a given school type—public or private—is rel-atively more effective than another at producing academic outcomes among

PUBLIC SUBSIDIES FOR PRIVATE SCHOOLING 195
similar kinds of students. Ideally, one might conduct an experiment wheregroups of students are randomly assigned to a private school “treatment” anda public school “control.”13 After a specified period, each group’s outcomescould be compared to assess whether one school type is more effective thananother. Inferences are sound because randomization ensures that the groupsof students are fundamentally similar, except for the type of school attended.
Yet students are not randomly assigned across school types in eitherArgentina or Chile. Families make decisions about where to send their chil-dren based on their preferences and constraints. And schools have substantiallatitude to select the students who are admitted, presuming that applicants out-number the available spaces. Thus, a simple comparison of outcomes acrossschool types will tend to confuse the dual effects of schools and their hetero-geneous student bodies.
The usual solution of researchers has been to employ statistical methods thatcompare public and private achievement while controlling for a wide variety ofstudent and family characteristics, such as their socioeconomic status. Follow-ing this strategy, I posit that academic achievement in each country is producedby a combination of school and family inputs:
Oi j = Pjβ1 + Xi jβ2 + εi j . (1)
Using ordinary least squares, the outcome (Oi j ) of student i in school j is re-gressed on two vectors of variables.14 Pj includes four dummy variables indi-cating school type: Catholic subsidized, nonreligious subsidized, and nonsub-sidized private schools (relative to the omitted category of public schools). Xi j
includes a series of controls for the socioeconomic status of students, families,and their school peer groups. Unmeasured variables are captured in an errorterm, εi j .
The goal is to obtain unbiased estimates of β1, the marginal effect of privateschools relative to the public alternative, ceteris paribus. Whether the estimatesare, in fact, unbiased will depend on the completeness of the control variables.For example, if family determinants of outcomes are omitted—and correlatedwith the likelihood of attending a given school type—then one risks confoundingthe effects of families and schools. This possibility is explored at greater lengthin the presentation of the results.
The prior specification omits school and teacher variables that may be corre-lated with achievement and school type. In doing so, it yields an overall effectthat is essentially a “black box.” Owing to limited data on school and teacherresources, the empirical analysis cannot go much further. However, later in thisarticle, I shall present various explanations for what lies within the “black box.”
Data from Argentina
To implement the empirical strategy in Argentina, I use 1997 data from the Sis-tema Nacional de Evaluacion de la Calidad. The data were obtained through

196 MCEWAN
a national sample of seventh-graders that was both stratified and clustered.Within each of the 25 jurisdicciones in Argentina (comparable to states), threestrata were defined: urban public, urban private, and rural. Then, within strata,individual classrooms were selected at random and every student in the class-room was surveyed. The complex sample design implies that students do nothave equal probabilities of being selected for the sample. Thus, the observa-tions of each student should receive different weights. Nonetheless, sampleweights were unavailable in the data, and the empirical analyses of this articlealways use unweighted data.
In addition to assessments of academic achievement in Spanish and math-ematics, each student responded to a background survey.15 In the originalsample, there were observations for 37,573 students. Roughly 23% of the obser-vations were excluded due to missing data on the dependent and independentvariables, leaving a final sample of 28,860.
Data from Chile
In Chile, I use the 1997 Sistema de Medicion de Calidad de la Educacion, ap-plied to eighth-graders. The Chilean data were taken from a national census,in contrast to the Argentine sample. With the exception of some students inisolated rural schools, occupying a small percentage of enrollments, all eighth-graders participated in Spanish and mathematics assessments. Moreover, theirparents responded to an additional survey that provides the independent vari-ables used in the analysis. The original data files include records for 234,819students. Of these, roughly 32% were dropped due to missing data on depen-dent and independent variables, yielding a final sample of 160,283.16
Dependent variables
In each data set, I define three dependent variables that constitute the mea-sures of student outcomes: SPANISH, MATH, and REPEAT. The first two arecontinuous measures of academic achievement. While originally expressed asthe number of items correct, each variable was standardized to a mean of 0 anda standard deviation of 1. Thus, differences in the mean achievement of publicand private students in each country can be interpreted as percentages of astandard deviation.17 This interpretation will prove helpful in comparing resultsacross countries.
In contrast, REPEAT is a dichotomous measure, equal to 1 if a student has re-peated at least one grade and 0 if a student has not repeated any grades. Graderepetition is ubiquitous in Latin American schools and results in enormous coststo the educational system, since students occupy school and teacher resourcesthat could be devoted to other students. The present article will assess whetherattendance at a private school lowers the probability that a student will repeata grade.

PUBLIC SUBSIDIES FOR PRIVATE SCHOOLING 197
When analyzing dichotomous dependent variables such as REPEAT, acommon empirical strategy is the use of maximum likelihood techniques suchas probit regression. Instead, I have simply applied ordinary least squares re-gression, equivalent to a linear probability model. The simpler method allowsthe coefficient estimates to be directly interpreted as marginal probabilities,without distorting any of the main conclusions.18
Independent variables
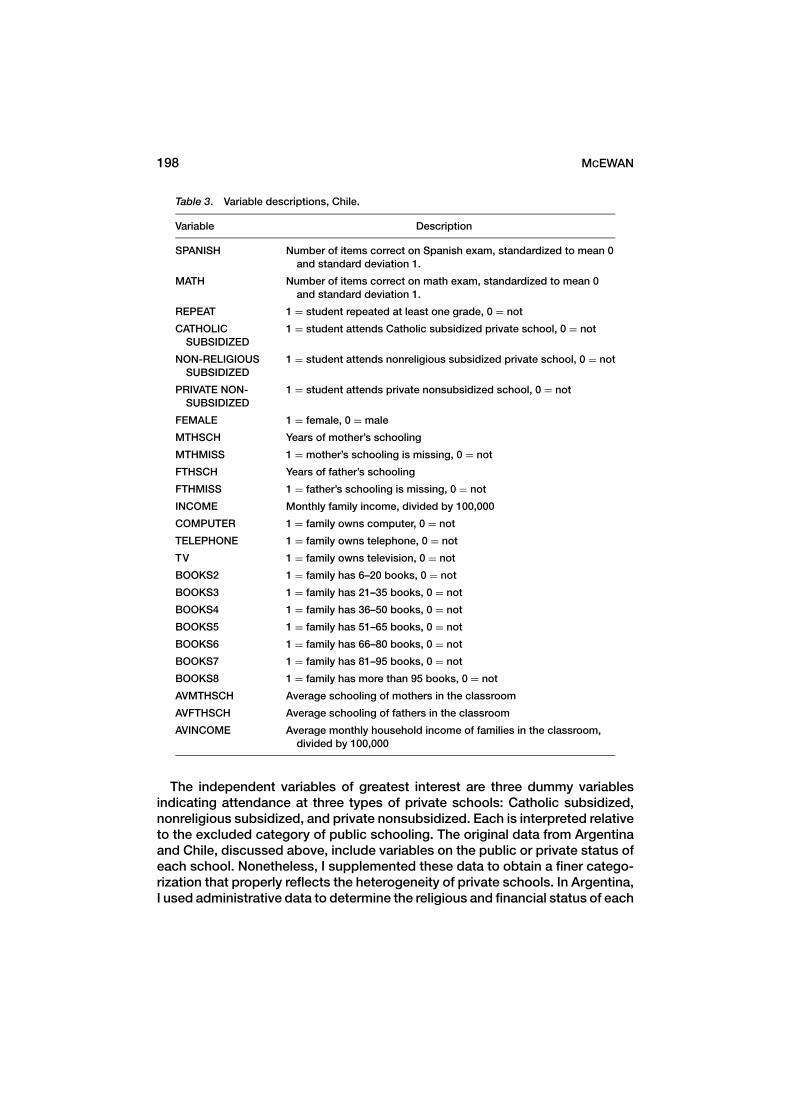
For each country, I constructed a comparable set of independent variables. Indoing so, I was guided by previous literature on educational production func-tions (e.g., Fuller and Clarke, 1994), in addition to the constraints imposed bythe Argentine and Chilean data. Tables 2 and 3 provide complete definitions ofthe independent variables.
Table 2. Variable descriptions, Argentina.
Variable Description
SPANISH Number of items correct on Spanish exam, standardized to mean 0 andstandard deviation 1.
MATH Number of items correct on math exam, standardized to mean 0 andstandard deviation 1.
REPEAT 1 = student repeated at least one grade, 0 = not
CATHOLIC 1 = student attends Catholic subsidized private school, 0 = notSUBSIDIZED
NON-RELIGIOUS 1 = student attends nonreligious subsidized private school, 0 = notSUBSIDIZED
PRIVATE NON- 1 = student attends private nonsubsidized school, 0 = notSUBSIDIZED
FEMALE 1 = female, 0 = male
MTHSCH Years of mother’s schooling
MTHMISS 1 = mother’s schooling is missing, 0 = not
FTHSCH Years of father’s schooling
FTHMISS 1 = father’s schooling is missing, 0 = not
COMPUTER 1 = family owns computer, 0 = not
TELEPHONE 1 = family owns telephone, 0 = not
TV 1 = family owns television, 0 = not
BOOKS2 1 = family has 1–9 books, 0 = not
BOOKS3 1 = family has 10–50 books, 0 = not
BOOKS4 1 = family has 51–100 books, 0 = not
BOOKS5 1 = family has more than 100 books, 0 = not
AVMTHSCH Average schooling of mothers in the classroom
AVFTHSCH Average schooling of fathers in the classroom
198 MCEWAN
Table 3. Variable descriptions, Chile.
Variable Description
SPANISH Number of items correct on Spanish exam, standardized to mean 0and standard deviation 1.
MATH Number of items correct on math exam, standardized to mean 0and standard deviation 1.
REPEAT 1 = student repeated at least one grade, 0 = not
CATHOLIC 1 = student attends Catholic subsidized private school, 0 = notSUBSIDIZED
NON-RELIGIOUS 1 = student attends nonreligious subsidized private school, 0 = notSUBSIDIZED
PRIVATE NON- 1 = student attends private nonsubsidized school, 0 = notSUBSIDIZED
FEMALE 1 = female, 0 = male
MTHSCH Years of mother’s schooling
MTHMISS 1 = mother’s schooling is missing, 0 = not
FTHSCH Years of father’s schooling
FTHMISS 1 = father’s schooling is missing, 0 = not
INCOME Monthly family income, divided by 100,000
COMPUTER 1 = family owns computer, 0 = not
TELEPHONE 1 = family owns telephone, 0 = not
TV 1 = family owns television, 0 = not
BOOKS2 1 = family has 6–20 books, 0 = not
BOOKS3 1 = family has 21–35 books, 0 = not
BOOKS4 1 = family has 36–50 books, 0 = not
BOOKS5 1 = family has 51–65 books, 0 = not
BOOKS6 1 = family has 66–80 books, 0 = not
BOOKS7 1 = family has 81–95 books, 0 = not
BOOKS8 1 = family has more than 95 books, 0 = not
AVMTHSCH Average schooling of mothers in the classroom
AVFTHSCH Average schooling of fathers in the classroom
AVINCOME Average monthly household income of families in the classroom,divided by 100,000
The independent variables of greatest interest are three dummy variablesindicating attendance at three types of private schools: Catholic subsidized,nonreligious subsidized, and private nonsubsidized. Each is interpreted relativeto the excluded category of public schooling. The original data from Argentinaand Chile, discussed above, include variables on the public or private status ofeach school. Nonetheless, I supplemented these data to obtain a finer catego-rization that properly reflects the heterogeneity of private schools. In Argentina,I used administrative data to determine the religious and financial status of each

PUBLIC SUBSIDIES FOR PRIVATE SCHOOLING 199
private school. In Chile, I used administrative data in concert with the officialschool directory of the Catholic Church (Barahona and Cabre, 1996).
Numerous variables measure the student’s background, socioeconomic sta-tus, and the quality of the home environment. These variables include the stu-dent’s gender, years of parental schooling, and the number of books in the home,the latter expressed as a series of dummy variables. I also include dummy vari-ables to indicate the presence of a television, telephone, and computer. In part,these variables may reflect features of the educational environment in the home,but they also proxy family income and wealth.
Using the somewhat richer Chilean data, I constructed two additional mea-sures of student and family background: a dummy variable indicating whetherthe student’s mother identifies herself as indigenous (or Native American), and acontinuous measure of family income. Lastly, I constructed measures of studentpeer-group characteristics by averaging individual characteristics—includingparental schooling and income—over all the students in a given classroom.
In the interpretation of the results, I shall avoid attaching a causal explanationto the independent variables that measure home environments and socioeco-nomic status. Within this empirical framework, one would be hard pressed todetermine whether, in fact, computers “cause” achievement to rise or whethertheir ownership proxies unobserved family wealth. Even so, this uncertainty isno great impediment to the immediate purpose of this study. These variablesserve as general proxies for socioeconomic status, and their inclusion is in-tended to ameliorate bias in comparisons of public and private achievement (tothe extent that is possible with nonexperimental data).
While control variables are similar in both countries, one caveat should beemphasized. The Argentine data on family background were drawn from a stu-dent survey and the Chilean data from a parent survey. For some variables (e.g.,student gender) there is little reason for concern. However, one might expectthat other variables, especially measures of parental education, would be moreprone to measurement error in the Argentine student survey.
Descriptive statistics
Tables 4 and 5 report the means and standard deviations for the dependent andindependent variables, in the full sample and disaggregated by school type. Acursory examination suggests wide gulfs in achievement and repetition ratesacross public and private schools when raw differences are uncorrected for thebackground of families and students. In the next section, I shall review thesedifferences in greater detail.
The means of independent variables suggest that gaps in outcomes maynot be entirely due to differences among schools. In general, private studentshave higher levels of socioeconomic status than public students. The widestgap exists between private nonsubsidized students and public students. Forexample, mothers of public students have, on average, around nine years of

200 MCEWAN
Table 4. Variable means and standard deviations, Argentina.
Type of school
Entire CATHOLIC NON-RELIGIOUS NON-sample PUBLIC SUBSIDIZED SUBSIDIZED SUBSIDIZED
SPANISH 0.00 −0.08 0.50 0.81 0.76(1.00) (0.98) (0.95) (0.90) (0.92)
MATH 0.00 −0.08 0.45 0.91 0.73(1.00) (0.98) (0.99) (0.97) (0.98)
REPEAT 0.23 0.25 0.08 0.08 0.06
CATHOLIC 0.10 — — — —SUBSIDIZED
NON-RELIGIOUS 0.01 — — — —SUBSIDIZED
NON-SUBSIDIZED 0.01 — — — —
FEMALE 0.51 0.51 0.52 0.45 0.44
MTHSCH 9.38 9.05 11.37 11.69 13.61(4.31) (4.25) (4.02) (3.92) (3.49)
MTHMISS 0.05 0.05 0.03 0.01 0.00
FTHSCH 9.46 9.13 11.59 11.49 13.22(4.38) (4.33) (3.99) (4.12) (3.71)
FTHMISS 0.05 0.06 0.03 0.03 0.03
COMPUTER 0.18 0.15 0.36 0.45 0.65
TELEPHONE 0.52 0.48 0.79 0.86 0.89
TV 0.94 0.94 0.98 0.98 0.99
BOOKS2 0.25 0.27 0.10 0.07 0.05
BOOKS3 0.37 0.37 0.33 0.32 0.21
BOOKS4 0.17 0.16 0.27 0.21 0.27
BOOKS5 0.15 0.13 0.28 0.38 0.45
AVMTHSCH 9.79 9.49 11.64 11.90 13.65(2.08) (1.89) (1.89) (2.51) (2.33)
AVFTHSCH 9.92 9.61 11.90 11.91 13.58(2.14) (1.96) (1.85) (2.41) (2.15)
N 28,860 25,217 2,860 366 417
Note: Standard deviations are not reported for dummy variables.
education in both countries. In nonsubsidized schools, the average mother’sschooling rises to around 13 years. In Argentina and Chile, between 6% and 15%of public-student families own computers, rising to 64%–65% in nonsubsidizedprivate schools. The gaps in socioeconomic status are less pronounced, butstill evident, between public and private subsidized schools.
To further examine correlations between the independent variables and theprobability of attending a private school, Tables 6 and 7 present the results

PUBLIC SUBSIDIES FOR PRIVATE SCHOOLING 201
Table 5. Variable means and standard deviations, Chile.
Type of school
Entire CATHOLIC NON-RELIGIOUS NON-sample PUBLIC SUBSIDIZED SUBSIDIZED SUBSIDIZED
SPANISH 0.00 −0.21 0.40 0.01 0.83(1.00) (0.98) (0.86) (0.98) (0.72)
MATH 0.00 −0.20 0.39 −0.05 0.91(1.00) (0.95) (0.91) (0.97) (0.82)
REPEAT 0.24 0.29 0.14 0.23 0.11
CATHOLIC 0.12 — — — —SUBSIDIZED
NON-RELIGIOUS 0.20 — — — —SUBSIDIZED
NON-SUBSIDIZED 0.09 — — — —
FEMALE 0.52 0.51 0.61 0.50 0.50
INDIGENOUS 0.05 0.06 0.03 0.05 0.01
MTHSCH 9.59 8.49 10.94 9.89 14.26(3.96) (3.64) (3.50) (3.59) (3.13)
MTHMISS 0.02 0.02 0.01 0.02 0.01
FTHSCH 9.88 8.69 11.18 10.23 15.17(4.35) (3.98) (3.88) (3.87) (3.55)
FTHMISS 0.03 0.03 0.02 0.03 0.02
INCOME 2.98 1.78 3.02 2.67 11.43(4.00) (1.98) (2.90) (2.73) (6.58)
COMPUTER 0.13 0.06 0.15 0.12 0.64
TELEPHONE 0.56 0.43 0.70 0.69 0.96
TV 0.90 0.87 0.96 0.94 0.99
BOOKS2 0.25 0.32 0.17 0.21 0.03
BOOKS3 0.15 0.15 0.15 0.16 0.06
BOOKS4 0.12 0.11 0.14 0.14 0.10
BOOKS5 0.07 0.06 0.09 0.08 0.08
BOOKS6 0.05 0.04 0.08 0.07 0.08
BOOKS7 0.03 0.03 0.05 0.04 0.06
BOOKS8 0.21 0.13 0.27 0.23 0.58
AVMTHSCH 9.70 8.60 11.04 10.02 14.41(2.42) (1.71) (1.69) (1.85) (1.29)
AVFTHSCH 10.12 8.93 11.37 10.47 15.41(2.66) (1.90) (1.82) (1.94) (1.51)
AVINCOME 2.98 1.78 3.01 2.68 11.42(3.19) (0.83) (1.42) (1.57) (4.42)
N 160,983 94,633 19,512 32,331 14,507
Note: Standard deviations are not reported for dummy variables.

202 MCEWAN
Table 6. Correlates of private school choice, Argentina.
CATHOLIC NON-RELIGIOUSSUBSIDIZED SUBSIDIZED NON-SUBSIDIZED
FEMALE 0.007 −0.001 −0.001(0.008) (0.001) (0.001)
MTHSCH 0.003a 0.0004 0.001a
(0.001) (0.0003) (0.0002)
MTHMISS 0.023 −0.002 0.002(0.012) (0.005) (0.004)
FTHSCH 0.004a −0.000002 0.0005a
(0.001) (0.0002) (0.0002)
FTHMISS 0.019 −0.002 0.005(0.012) (0.006) (0.002)
COMPUTER 0.022a 0.005a 0.006a
(0.005) (0.002) (0.002)
TELEPHONE 0.051a 0.009a 0.004a
(0.007) (0.003) (0.001)
TV 0.028b 0.0005 −0.001(0.014) (0.003) (0.003)
BOOKS2 0.018 −0.0002 −0.004b
(0.013) (0.008) (0.002)
BOOKS3 0.053a 0.005 −0.003(0.015) (0.008) (0.002)
BOOKS4 0.077a 0.005 −0.001(0.016) (0.008) (0.002)
BOOKS5 0.079a 0.010 0.001(0.016) (0.008) (0.002)
CONSTANT −0.348a −0.049a −0.039a
(0.030) (0.013) (0.009)
Log-likelihood −11,913
N 28,860
Note: The table presents marginal effects of a multinomial logit regression, calculated at thesample means. Effects are interpreted relative to the category of public schooling. Huber–White standard errors, adjusted for clustering of students within schools, are in parentheses.aStatistically significant at 1%.bStatistically significant at 5%.
of multinomial logit regressions for each country. The regressions provide aconvenient means of assessing whether higher levels of a specific variable—holding other variables constant—increase the probability that a student at-tends a particular type of private school, relative to the public alternative. In atypical multinomial logit, the magnitudes of the coefficient estimates are diffi-cult to interpret because the model is nonlinear. Hence, Tables 6 and 7 present

PUBLIC SUBSIDIES FOR PRIVATE SCHOOLING 203
Table 7. Correlates of private school choice, Chile.
CATHOLIC NON-RELIGIOUSSUBSIDIZED SUBSIDIZED NON-SUBSIDIZED
FEMALE 0.047a −0.014b 0.0003(0.008) (0.007) (0.001)
INDIGENOUS −0.030a 0.042a −0.014a
(0.009) (0.011) (0.003)
MTHSCH 0.010a 0.002b 0.002a
(0.001) (0.001) (0.0002)
MTHMISS 0.076a 0.009 0.028a
(0.011) (0.012) (0.003)
FTHSCH 0.005a 0.002a 0.002a
(0.001) (0.001) (0.0002)
FTHMISS 0.031a 0.023b 0.023a
(0.009) (0.010) (0.003)
INCOME 0.004a 0.008a 0.004a
(0.001) (0.002) (0.0004)
COMPUTER 0.013a 0.006 0.012a
(0.005) (0.007) (0.002)
TELEPHONE 0.024a 0.112a 0.017a
(0.006) (0.009) (0.002)
TV 0.027a 0.012 0.006a
(0.007) (0.008) (0.002)
BOOKS2 0.032a 0.028a 0.006b
(0.006) (0.006) (0.003)
BOOKS3 0.062a 0.057a 0.013a
(0.008) (0.008) (0.003)
BOOKS4 0.069a 0.073a 0.017a
(0.008) (0.009) (0.003)
BOOKS5 0.081a 0.083a 0.018a
(0.009) (0.010) (0.003)
BOOKS6 0.083a 0.081a 0.019a
(0.009) (0.010) (0.003)
BOOKS7 0.090a 0.076a 0.020a
(0.010) (0.011) (0.004)
BOOKS8 0.081a 0.080a 0.019a
(0.009) (0.010) (0.004)
CONSTANT −0.415a −0.303a −0.129a
(0.021) (0.018) (0.012)
Log-likelihood −142,843
N 160,983
Note: The table presents marginal effects of a multinomial logit regression, calculated at thesample means. Effects are interpreted relative to the category of public schooling. Huber–White standard errors, adjusted for clustering of students within schools, are in parentheses.aStatistically significant at 1%.bStatistically significant at 5%.

204 MCEWAN
marginal effects evaluated at the sample means of each country, as well as thecorresponding standard errors.
In the Argentine sample, ownership of a computer or telephone has a sta-tistically significant link to attendance at all three types of private schools. Asmentioned above, these variables may serve as proxies for family income andwealth. Parental schooling is correlated with attendance at Catholic subsidizedand nonsubsidized private schools. Despite their statistical significance, themagnitudes of the marginal effects are not particularly large. In Chile, mostmeasures of socioeconomic status have statistically significant links to theprobability of attending a private school, including parental schooling, income,ownership of various articles, and books in the home. Moreover, the magnitudesof the Chilean effects are typically larger. The pattern of correlations implies thatsubstantial caution is warranted when making simple comparisons of outcomesacross public and private schools. Such comparisons will bundle together theeffects of schools and their heterogeneous students on outcomes.
Regrettably, the prior analyses are unsuited for making strong inferencesabout whether specific variables have “caused” students and families to chooseprivate schools. In the case of mother’s education, for example, it is possiblethat greater schooling allows parents to better interpret information on privateschooling options. Alternatively, more schooling may increase parental “prefer-ences” for private schooling. In either case, more parental schooling increasesthe demand for private schooling.
Yet there are also supply explanations. Private schools may be more inclinedto locate in neighborhoods where parents are highly educated, perhaps be-cause schools perceive their children as less costly to educate. Alternatively,private schools may explicitly select children with more educated parents fromapplicants to the school. Both sets of explanations, demand-side and supply-side, are consistent with positive correlations between parental schooling andprivate school attendance.
Empirical results
Raw differences in outcomes
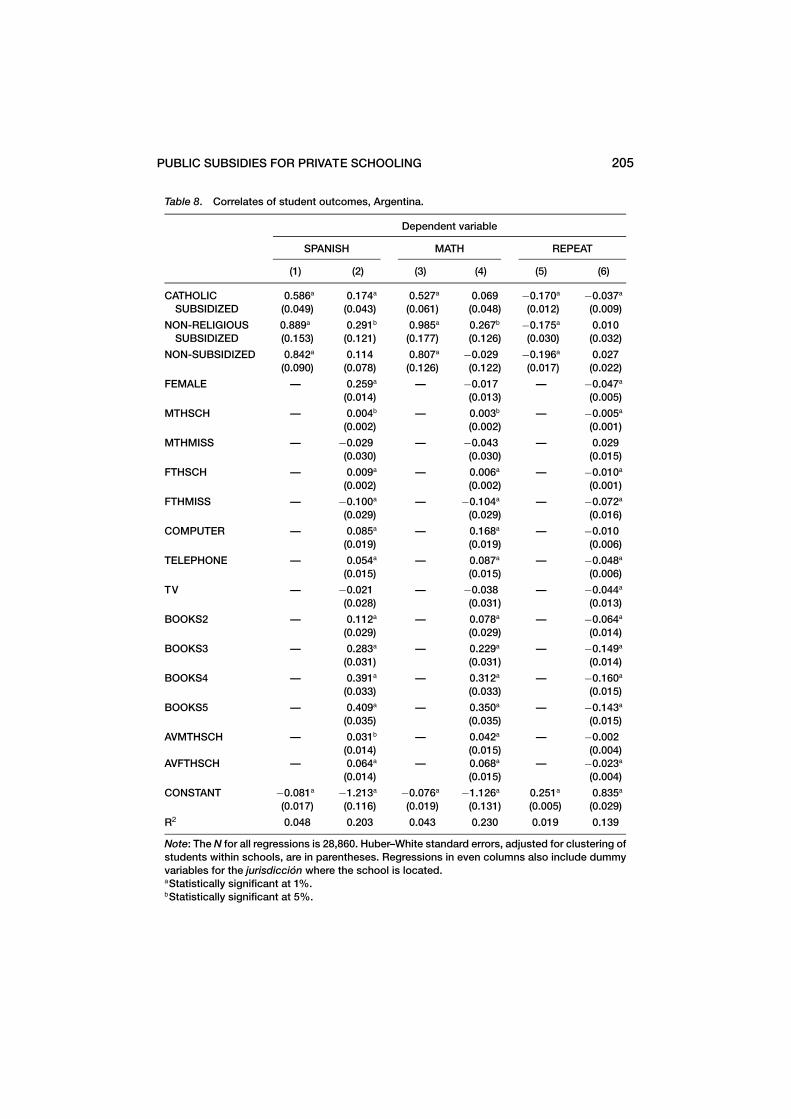
The odd-numbered columns of Tables 8 and 9 report coefficient estimates forprivate school dummy variables, absent controls for other independent vari-ables. Thus, coefficients provide estimates of the raw difference in outcomesbetween each school type and the public alternative. The Spanish and math-ematics achievement of Catholic subsidized students in both countries is, onaverage, 0.5–0.6 standard deviations higher than public students. The gap iseven larger—0.8–1 standard deviations—between private nonsubsidized andpublic students. There is less consistency across countries for nonreligioussubsidized schools. In Chile, the raw difference in achievement is considerablysmaller than in Argentina.
PUBLIC SUBSIDIES FOR PRIVATE SCHOOLING 205
Table 8. Correlates of student outcomes, Argentina.
Dependent variable
SPANISH MATH REPEAT
(1) (2) (3) (4) (5) (6)
CATHOLIC 0.586a 0.174a 0.527a 0.069 −0.170a −0.037a
SUBSIDIZED (0.049) (0.043) (0.061) (0.048) (0.012) (0.009)
NON-RELIGIOUS 0.889a 0.291b 0.985a 0.267b −0.175a 0.010SUBSIDIZED (0.153) (0.121) (0.177) (0.126) (0.030) (0.032)
NON-SUBSIDIZED 0.842a 0.114 0.807a −0.029 −0.196a 0.027(0.090) (0.078) (0.126) (0.122) (0.017) (0.022)
FEMALE — 0.259a — −0.017 — −0.047a
(0.014) (0.013) (0.005)
MTHSCH — 0.004b — 0.003b — −0.005a
(0.002) (0.002) (0.001)
MTHMISS — −0.029 — −0.043 — 0.029(0.030) (0.030) (0.015)
FTHSCH — 0.009a — 0.006a — −0.010a
(0.002) (0.002) (0.001)
FTHMISS — −0.100a — −0.104a — −0.072a
(0.029) (0.029) (0.016)
COMPUTER — 0.085a — 0.168a — −0.010(0.019) (0.019) (0.006)
TELEPHONE — 0.054a — 0.087a — −0.048a
(0.015) (0.015) (0.006)
TV — −0.021 — −0.038 — −0.044a
(0.028) (0.031) (0.013)
BOOKS2 — 0.112a — 0.078a — −0.064a
(0.029) (0.029) (0.014)
BOOKS3 — 0.283a — 0.229a — −0.149a
(0.031) (0.031) (0.014)
BOOKS4 — 0.391a — 0.312a — −0.160a
(0.033) (0.033) (0.015)
BOOKS5 — 0.409a — 0.350a — −0.143a
(0.035) (0.035) (0.015)
AVMTHSCH — 0.031b — 0.042a — −0.002(0.014) (0.015) (0.004)
AVFTHSCH — 0.064a — 0.068a — −0.023a
(0.014) (0.015) (0.004)
CONSTANT −0.081a −1.213a −0.076a −1.126a 0.251a 0.835a
(0.017) (0.116) (0.019) (0.131) (0.005) (0.029)
R2 0.048 0.203 0.043 0.230 0.019 0.139
Note: The N for all regressions is 28,860. Huber–White standard errors, adjusted for clustering ofstudents within schools, are in parentheses. Regressions in even columns also include dummyvariables for the jurisdiccion where the school is located.aStatistically significant at 1%.bStatistically significant at 5%.

206 MCEWAN
Table 9. Correlates of student outcomes, Chile.
Dependent variable
SPANISH MATH REPEAT
(1) (2) (3) (4) (5) (6)
CATHOLIC 0.611a 0.147a 0.589a 0.192a −0.147a −0.053a
SUBSIDIZED (0.027) (0.023) (0.033) (0.034) (0.006) (0.006)
NON-RELIGIOUS 0.217a −0.011 0.145a −0.035 −0.051a −0.002SUBSIDIZED (0.025) (0.021) (0.030) (0.030) (0.007) (0.006)
NON-SUBSIDIZED 1.037a 0.046 1.105a 0.033 −0.173a 0.013(0.021) (0.050) (0.028) (0.074) (0.006) (0.012)
FEMALE — 0.193a — −0.035a — −0.054a
(0.008) (0.012) (0.003)
INDIGENOUS — −0.119a — −0.079a — 0.021a
(0.013) (0.013) (0.006)
MTHSCH — 0.023a — 0.018a — −0.012a
(0.001) (0.001) (0.000)
MTHMISS — 0.091a — 0.053a — −0.018(0.020) (0.020) (0.011)
FTHSCH — 0.012a — 0.009a — −0.004a
(0.001) (0.001) (0.000)
FTHMISS — 0.033b — −0.025 — 0.007(0.016) (0.016) (0.008)
INCOME — −0.007a — −0.004a — 0.005a
(0.001) (0.001) (0.000)
COMPUTER — 0.030a — 0.057a — −0.010a
(0.009) (0.010) (0.003)
TELEPHONE — −0.020a — −0.026a — 0.008a
(0.007) (0.007) (0.003)
TV — 0.034a — −0.032a — −0.009(0.010) (0.010) (0.005)
BOOKS2 — 0.134a — 0.091a — −0.047a
(0.009) (0.009) (0.004)
BOOKS3 — 0.226a — 0.153a — −0.072a
(0.010) (0.011) (0.005)
BOOKS4 — 0.284a — 0.203a — −0.083a
(0.011) (0.011) (0.005)
BOOKS5 — 0.332a — 0.252a — −0.091a
(0.012) (0.012) (0.006)
BOOKS6 — 0.340a — 0.240a — −0.098a
(0.013) (0.014) (0.006)
BOOKS7 — 0.379a — 0.284a — −0.109a
(0.014) (0.016) (0.007)
(Continued on next page.)

PUBLIC SUBSIDIES FOR PRIVATE SCHOOLING 207
Table 9. (Continued).
Dependent variable
Spanish Math Repeat
(1) (2) (3) (4) (5) (6)
BOOKS8 — 0.417a — 0.344a — −0.102a
(0.011) (0.011) (0.005)
AVMTHSCH — 0.115a — 0.135a — −0.033a
(0.011) (0.015) (0.004)
AVFTHSCH — 0.005 — −0.024b — 0.018a
(0.009) (0.012) (0.003)
AVINCOME — 0.001 — 0.024a — −0.003a
(0.004) (0.006) (0.001)
CONSTANT −0.211a −1.945a −0.200a −1.631a 0.286a 0.638a
(0.014) (0.039) (0.016) (0.053) (0.003) (0.012)
R2 0.107 0.238 0.116 0.221 0.021 0.065
Note: The N for all regressions is 160,983. Huber–White standard errors, adjusted for clusteringof students within schools, are in parentheses. Regressions in even columns also include dummyvariables for the region where the school is located.aStatistically significant at 1%.bStatistically significant at 5%.
In Argentina, attending a private school is associated with a lower probabilityof repeating a grade, by 0.17–0.20. These magnitudes are similar in Chile, withthe exception once again of students in nonreligious subsidized schools, whoare only 0.05 less likely to repeat a grade.
Coefficients on control variables
The even-numbered columns present coefficient estimates from regressionsthat control for a full range of independent variables. Before evaluating howthese controls alter the private school coefficients, let us consider several othercoefficient estimates. There is a pronounced gender gap in Spanish achieve-ment, favoring girls, that is surprisingly consistent across countries: 0.26 inArgentina and 0.19 in Chile. Girls also have a lower probability of repeating agrade, by 0.05. The gender gap is reversed in mathematics achievement, thoughconsiderably smaller in magnitude.
In general, the various measures of socioeconomic status have their pre-dicted effects on outcomes. Increasing parental schooling, for example, is as-sociated with higher achievement and a lower probability of grade repetition.In both countries, the number of books in the home is a strong predictor ofstudent outcomes, though its causal significance is unclear. Also striking is theimportance of peer-group characteristics in the determination of outcomes. Allelse equal, individual achievement rises tends to rise when classmates havehighly educated parents.

208 MCEWAN
Coefficients on private school variables
The coefficients on private school dummy variables are substantially modifiedonce other variables are held constant. Three main conclusions emerge from theregressions in Tables 8 and 9. First, the results are fairly consistent in suggestingthat Catholic subsidized schools in both countries lead to modest improvementin outcomes, relative to public schools. In Argentina, the coefficient on Catholicschools is 0.17 for SPANISH, though statistically insignificant for MATH. Catholicschool attendance lowers the probability of grade repetition by 0.04. In Chile,the results are strikingly consistent. The SPANISH and MATH coefficients are0.15 and 0.19, respectively, while Catholic school attendance lowers the prob-ability of grade repetition by 0.05.
Second, there are sharply varying patterns of results for nonreligious sub-sidized schools. In Chile, none of the coefficients is statistically different fromzero (these results are consistent with the prior empirical research cited above).In Argentina, these schools have positive and statistically significant effects ofalmost 0.3 standard deviations, but no effects on grade repetition.
Third, none of the coefficients on nonsubsidized private schools is statisti-cally significant, in either country. This finding suggests that the entirety of dif-ferences in outcomes is due to differences in the socioeconomic background ofstudents. It should be noted, however, that the Chilean findings are not entirelyconsistent with prior research. Using earlier SIMCE data, McEwan and Carnoy(2000) find large and statistically significant effects. However, they used datathat were aggregated to the school level, with less detailed controls for socioe-conomic status. Thus, their results may reflect unmeasured characteristics ofstudents. McEwan (2001), using the same data as the present article, find pos-itive and statistically significant effects. McEwan’s paper estimated separateequations for public and private schools and used the coefficient estimates topredict achievement of a typical student in each school. Thus, the Chilean re-sults, at least for nonsubsidized schools, are sensitive to the empirical method.
The discussion in later sections will focus on interpreting the pattern of re-sults for subsidized schools, whether Catholic or nonreligious.19 From a policystandpoint, the effects of nonsubsidized private schools are less informative.In Chile, for example, this category of schooling has maintained a quite steadyshare of enrollments during the reform process. Indeed, any further expansion ofprivate schooling that is spurred by government subsidies must occur throughthe subsidized categories of schooling.
Evidence of selection bias
It is possible that estimates of private school coefficients are biased by the ex-clusion of family or student variables, typically referred to as selection bias.20
Bias exists if unobserved variables are correlated with both student outcomesand with the likelihood that students attend a private school. In Chile, at least,

PUBLIC SUBSIDIES FOR PRIVATE SCHOOLING 209
there is some evidence in the direction of bias. Parry’s (1996) random surveyshows that 15% of public and 63% of private voucher schools in Santiago useone of several methods to select students for admission, including entranceexams, interviews, and minimum grade requirements. Similarly, Gauri’s (1998)random survey of Santiago households shows that 18% of public school stu-dents took an exam in order to enroll in their present school. For private voucherand private nonvoucher schools, the figures were 37% and 82%, respectively.Thus, private schools are more likely to exercise selectivity in their admissionspolicies.
If private schools select their students based on characteristics that are unob-served to researchers but still correlated positively with achievement, as seemslikely, then estimates of private school coefficients are probably biased up-wards. Parry (1996) includes a variable measuring school selection—positivelycorrelated with a private school dummy—in achievement regressions similarto ours. The selection variable’s coefficient is strongly positive, while the co-efficient on a private school dummy is statistically insignificant. Although theact of selection does not directly increase student performance, it may proxyunobserved characteristics of students who attend schools that select.
In a separate paper, the 1997 data from Chile were used to compare publicand private achievement, specifically focusing on corrections for selection bias(McEwan, 2001). The analysis produced no evidence that selection bias favorspublic schools.21 Thus, the available evidence is suggestive that the estimatesof private school coefficients in the present article, at least for Chile, are anupper bound to private school effects.
Discussion
This section will focus on two puzzles. First, what can explain the pattern of posi-tive results for Catholic subsidized schools across countries? Second, what canexplain the inconsistent pattern of results for nonreligious subsidized schoolsacross countries, especially the Chilean results that indicate no differences?
Catholic subsidized schools
In both countries, the evidence suggests that Catholic schools have fairly con-sistent, though modest, effects on outcomes. The following paragraphs exploreseveral explanations for these results. In the absence of more comprehensiveresearch, however, the explanations are best considered hypotheses.
First, Catholic schools may use more resources than public schools. In priorresearch on Chile, McEwan and Carnoy (2000) present data suggesting thatCatholic schools are more costly than public schools. In part, this is becausethey obtain private resources, from parents and the Church, over and abovethe revenues from government subsidies.22 If these resources are used to raiseacademic achievement, then the observed differences in achievement between

210 MCEWAN
private and public school achievement are simply resource based. There is noevidence concerning the resources used in Argentine Catholic schools.
Second, Catholic schools may use a different allocation of resources thanpublic schools, perhaps emphasizing a more effective set of school policies. Inthe U.S., for example, Catholic secondary schools may promote a more chal-lenging climate than public schools by emphasizing a common academic corefor all students (Witte, 1992, 1996).23 In general, however, there is little evidenceon patterns of resource allocation within Catholic schools in Argentina or Chileand on how these compare to public schools.
Third, Catholic schools may have unique objectives and missions, rooted intheir religious orientation. In their work on U.S. Catholic schools, Bryk et al.(1993) refer to this as a distinctive “communal organization.” Compared to theirpublic counterparts, U.S. Catholic schools provide more opportunities for face-to-face interactions among adults and students and give teachers greater re-sponsibility for working with students outside the classroom. Moreover, theypromote “a set of shared beliefs about what students should learn, about propernorms of instruction, and about how people should relate to one another” (Bryket al., 1993, p. 299). There is little evidence on the organizational structure ofCatholic schools in Argentina and Chile. If Catholic schools do possess a moreeffective organization, then the consistent effects observed in each country arenot contingent upon private status as much as Catholic status.
Fourth, private schools may permit a more decentralized and autonomousorganization that allows for greater effectiveness than public schools (Chubband Moe, 1990). In contrast, public schools may suffer from an overly rigid andbureaucratic structure that leaves little room for innovation and stifles effec-tiveness. According to this view, Catholic school effectiveness stems mainlyfrom operating in the private sector—and the autonomy it brings—rather thanthe unique organizational features of religious schooling. To some extent, thisview is at odds with two pieces of evidence from Argentina and Chile. First, itcannot explain why the results should differ across Catholic and nonreligiousschools within Chile, particularly when each type of school is subject to a sim-ilar set of regulations. These regulations presumably allow a similar degree ofautonomy to each school type, implying that they should be relatively similar intheir effectiveness. However, this is not the case. Second, it cannot explain whyCatholic schools are similarly effective in both Argentina and Chile. As notedabove, Catholic subsidized schools in Argentina operate within a more rigid setof regulations than those in Chile, providing less autonomy. Hence, this viewwould predict that Argentine Catholic schools would be less effective than theirChilean counterparts, which is not observed in the data.
Nonreligious subsidized schools
The results for nonreligious subsidized schools differ substantially acrosscountries. In Argentina, there are moderate effects on achievement, but not

PUBLIC SUBSIDIES FOR PRIVATE SCHOOLING 211
in Chile. There are two potential explanations for this pattern of results. Thefirst explanation lies in differences between the nonsubsidized private schoolsin each country, while the second lies in differences between the students whoattend these schools.
As observed above, the market share of nonreligious subsidized schools inChile is notably larger in Chile than in Argentina. In large part, the growth in mar-ket share in Chile was precipitated by the emergence of for-profit schools afterthe 1980 reform. In other research, McEwan and Carnoy (2000) suggest that non-religious schools—dominated by for-profit operations in Chile—are more likelyto engage in cost-cutting behavior than public or even other private schools.For example, they offer less instruction time than other private schools andare more likely to employ part-time and moonlighting teachers. While perhapscutting costs, these resource allocation decisions may lower the effectivenessof these schools if instructional time and teacher characteristics are relatedto achievement. A similar pattern of effectiveness may not be observed inArgentina because nonreligious private schools are less bent on maximizingprofits (and may include other outcomes, such as student achievement, in theirobjective functions). These hypotheses are mostly speculative, however, giventhe lack of data about school operations in each country.
While the objectives of nonreligious schools may be different across Argentinaand Chile, it is also the case that these schools enroll different kinds of students.In Chile, the socioeconomic status of students in nonreligious private schools ishigher than that of public students, but the difference is not as large as that ofArgentina (see Tables 4 and 5). Given the massive expansion of nonreligiousschools in Chile, this outcome is perhaps unsurprising. As Chilean privateschools expanded, they dipped further into public school enrollments, often at-tracting an increasingly disadvantaged group of students (that is, nonetheless,more advantaged than students who remain in public schools). It is possiblethat these students are simply more difficult to educate, or require additionalresources to endow with a given set of educational outcomes. Chilean law,however, does not systematically adjust the level of subsidy for student traits,at least within municipalities. At the margin, the effectiveness of Chilean privateschools may have declined (or fallen to parity with public schools) becausethese schools began educating a more challenging and diverse group of stu-dents, but without more resources. If this explanation holds, then a similar pat-tern of declining effectiveness should be observed in Argentina as nonreligiousschools expand their share of enrollments.
Conclusions
There is tremendous interest in the potential impact of large-scale voucherplans. Nonetheless, there is little empirical evidence that can be used to makestrong predictions about the effect of policies (McEwan, 2000). While there isa vast body of research comparing outcomes in public and Catholic schools

212 MCEWAN
in the U.S., the latter are typically unsubsidized. Hence, they may provide poorindications of the relative effectiveness of private schools that would arise undera voucher plan or another large-scale attempt to subsidize private schools.
The governments of Argentina and Chile did, in fact, use public subsidies toencourage private enrollments, although each country structured their policiesdifferently. Argentina subsidized the salaries of personnel in private schools,while Chile subsidized the level of student enrollments in private schools. As-sessing the relative effectiveness of private and public schools in these coun-tries may assist in judging the impact of their policies, while providing cluesabout the potential impact of policies in other countries.
The results are mixed and provide few unambiguous answers about the ef-fects of subsidies. In both countries, Catholic subsidized schools are somewhatmore effective than public schools in producing student outcomes, althoughthese results are probably an upper bound to the true effects. There are severalpotential explanations for these effects. At least in part, they may be due to theunique missions, policies, and resources that are characteristic of the Catholicsector (although empirical research to substantiate this is sparse). The effectsmay be less attributable to the “private” status of Catholic schools, if only be-cause other types of private schools do not consistently duplicate their results,even when endowed with similar resources.
In Chile, unlike Argentina, there are few differences in outcomes between pub-lic and nonreligious subsidized schools. The diminished effectiveness of nonre-ligious private schools in Chile may be due to their different objectives—placinggreater emphasis on securing a margin of profit—or their different students.Any country that substantially expands its private sector by providing exten-sive subsidies must recognize that new private schools will emerge with a rangeof objectives. Moreover, expanding private schools will enroll a wider range ofstudents that may require different technologies or resources to educate.
Acknowledgments
I am indebted to several individuals for their comments or assistance in ob-taining data, including Luis Benveniste, Martin Carnoy, Gustavo Cosse, CristinCox, Henry Levin, Alejandro Morduchowicz, Paula Razquin, Diana Rhoten, andLucrecia Tulic. This research was supported by a Spencer Fellowship for Re-search Related to Education, the Inter-American Development Bank, and a FordFoundation grant to Martin Carnoy. These individuals and institutions are notresponsible for the conclusions of this article.
Notes
1. In the U.S., there is a substantial body of empirical evidence that tests this assertion by com-paring the relative effectiveness of public and private schools in producing outcomes such asachievement and attainment (for reviews of this literature, see Levin, 1998; McEwan, 2000). The

PUBLIC SUBSIDIES FOR PRIVATE SCHOOLING 213
evidence on the comparative costs—necessary to compare efficiency—is substantially weaker.In developing countries, there is also a burgeoning literature, partially reviewed by Riddell(1993). There are more recent studies on Chile (McEwan and Carnoy, 2000; McEwan, 2001),India (Kingdon, 1996; Bashir, 1997), Indonesia (Bedi and Garg, 2000), and Vietnam (Glewwe andPatrinos, 1999).
2. The countries are similar in other respects. In 1997, UNESCO and the Latin American Ministriesof Education implemented a cross-national survey of academic achievement in the third andfourth grades. On average, Argentine students scored somewhat higher than Chilean studentsin language and mathematics, but the differences were never more than 20% of a standarddeviation (Willms and Somers, in press). In contrast, Cuban students scored more than 1.5standard deviations higher than each country.
3. The following discussion of private schooling in Argentina is drawn from the comprehensivework of Morduchowicz et al. (1999).
4. As Morduchowicz et al. (1999) observe, the law essentially prescribed a technology of educa-tional production for private schools. This provides an ironic counterpoint to current debatesover vouchers and private schooling, which frequently emphasize the autonomy of privateschools as their key strength (Chubb and Moe, 1990). Yet public subsidies often bring addi-tional regulation that limits autonomy, as the Argentine case exemplifies.
5. In a sweeping 1991 law, the Argentine government transferred all public educational servicesto the provinces (roughly 10 years after Chile’s massive decentralization). At the same time, itdecentralized legal responsibility for the administration of private school subsidies. In the lastnine years, however, there remain substantial similarities in each of the provincial laws, giventheir base in the 1991 law and prior experience.
6. Further below, the reader will notice that empirical analyses of student outcomes do establishwhich Catholic and nonreligious schools receive subsidies. Nonetheless, these data cannotbe used to calculate the proportion of students that attend each school type. This is becausethe Argentine sample design was complex, requiring sampling weights for each observation toaccount for their unequal probabilities of selection into the sample. However, sampling weightswere not available.
7. Strictly speaking, the “voucher” is not a coupon given to individual families and then turned overto schools. Rather, it is a direct subsidy to school supply (and is referred to as a subvencionin the Chilean vernacular). Though the physical mechanism of payment is different, the twopolicies may yield similar results in practice by directly linking school revenues to the numberof enrolled students.
8. Chilean law specifies a factor by which the base subsidy is adjusted for students at every gradelevel. Furthermore, selected municipalities receive “zone assignments” to compensate for highpoverty or isolation. It should be noted, however, that adjustments are largely ad hoc and maynot reflect true variation in educational costs. Since 1987, rural schools within municipalitieshave received upward adjustments. See Parry (1997) for further details.
9. See Cox (1997) for additional details on the post-1990 reforms.10. Discounts to vouchers are applied progressively. If the tuition charge is less than half the level
of the current voucher level, no discount is applied. Tuition charges between one half and onevoucher incur a 10% deduction. Charges between one and two vouchers incur a 20% deduction.Cox (1997) provides additional details. Ninety-three percent of schools that opted to participatein shared financing in 1994 had either a 0% or a 10% deduction (Aedo, 1996).
11. Author’s calculations with data from the Ministry of Education.12. Further research would be required to convincingly rule out other potential explanations for
private school growth, and thus establish a causal link. Nonetheless, it is telling that privateschool growth was sustained in both countries during the 1980s, even while family incomes(and demand for private education) declined.
13. In fact, several randomized experiments have been conducted in the U.S. cities of Dayton,New York, and Washington (e.g., Peterson, et al., 1999). See McEwan (2000) for a review of theresults.

214 MCEWAN
14. Because of the clustering of students within schools, a straightforward application of ordinaryleast squares regression would tend to underestimate the standard errors. Thus, all regressionspresent Huber–White standard errors that are adjusted for the clustering of students withinschools.
15. Surveys were also given to teachers and principals, but these data were unavailable.16. These exclusions include the small number of students, numbering around 1%, that attend
private schools managed by an array of Protestant or nondenominational churches.17. There is no unambiguous definition of what constitutes a small or large difference. In a standard
“bell” curve, one standard deviation above and below the mean contains about 68% of the totalobservations. Two standard deviations above and below the mean contain roughly 95%. Thus,if an individual begins with a test score that is extremely low (relative to most individuals), anincrease of four standard deviations would allow her to leapfrog the vast majority of individuals.Of course, magnitudes are rarely, if ever, this large. In this study, and most others, effects areusually some fraction of a standard deviation.
18. Probit estimates and their corresponding marginal effects were calculated for comparison andwere not substantially different.
19. As a previous section noted, the Chilean sample excludes a small number of students whoattend subsidized Protestant schools, largely because the Argentine data do not allow suchschools to be readily identified (and a comparable category to be constructed). For someevidence on the effectiveness of these schools, see McEwan and Carnoy (2001) and McEwan(2001).
20. See Goldberger and Cain (1982) or Murnane et al. (1985) for general discussions.21. As an exclusion restriction, the paper assumed that the density of private schools in a student’s
municipality is correlated with the likelihood of choosing a private school but is not correlatedwith achievement. The paper reports empirical evidence to bolster this assumption.
22. It should be noted, however, that public schools can also receive additional revenues from theirmunicipalities.
23. Other authors document that Catholic students take more academic courses than public stu-dents and are more likely to participate in academic rather than vocational tracks (Colemanet al., 1982; Coleman and Hoffer, 1987; Bryk et al., 1993; Gamoran, 1996). Bryk et al. (1993) ar-gue that Catholic high schools directly encourage all students to pursue a common academiccore, regardless of background or college plans.
References
Aedo, Cristian. (1996). “Calidad de la Educacion y Elementos de Mercado.” Educacion en Chile: Undesafio de calidad. Santiago: ENERSIS.
Barahona, Alfredo and Agustin Cabre (eds.). (1996). Guia de la Iglesia en Chile, 1996–1998. Santiago:Ediciones Mundo.
Bashir, Sajitha. (1997). “The Cost Effectiveness of Public and Private Schools: Knowledge Gaps,New Research Methodologies, and an Application in India.” In Christopher Colclough (ed.), Mar-ketizing Education and Health in Developing Countries: Miracle or Mirage? Oxford: ClarendonPress.
Bedi, Arjun S. and Ashish Garg. (2000). “The Effectiveness of Private Versus Public Schools: TheCase of Indonesia.” Journal of Development Economics 61, 463–494.
Bryk, Anthony S., Valerie E. Lee, and Peter B. Holland. (1993). Catholic Schools and the CommonGood. Cambridge, MA: Harvard University Press.
Chubb, John E. and Terry M. Moe. (1990). Politics, Markets, and America’s Schools. Washington,DC: The Brookings Institution.
Coleman, James S. and Thomas Hoffer. (1987). Public and Private High Schools: The Impact ofCommunities. New York: Basic Books.

PUBLIC SUBSIDIES FOR PRIVATE SCHOOLING 215
Coleman, James S., Thomas Hoffer, and Sally Kilgore. (1982). High School Achievement: Public,Catholic, and Private Schools Compared. New York: Basic Books.
Cox, Cristian. (1997). “La reforma de la Educacion Chilena: Contexto, Contenidos, Implementacion.”Santiago: Programa de Promocion de la Reforma Educativa en America Latina (PREAL).
Espinola, Viola. (1993). The Educational Reform of the Military Regime in Chile: The System’s Re-sponse to Competition, Choice, and Market Relations. Ph.D. dissertation, University of Wales.
Friedman, Milton. (1955). “The Role of Government in Education.” In Robert A. Solo (ed.), Economicsand the Public Interest. New Brunswick, NJ: Rutgers University Press.
Fuller, Bruce and Prema Clarke. (1994). “Raising Schools Effects while Ignoring Culture?” Reviewof Educational Research 64, 119–157.
Gamoran, Adam. (1996). “Student Achievement in Public Magnet, Public Comprehensive, and Pri-vate City High Schools.” Educational Evaluation and Policy Analysis 18, 1–18.
Gauri, Varun. (1998). School Choice in Chile: Two Decades of Educational Reform. Pittsburgh:University of Pittsburgh Press.
Glewwe, Paul and Harry Anthony Patrinos. (1999). “The Role of the Private Sector in Education inVietnam: Evidence from the Vietnam Living Standards Survey.” World Development 27, 887–902.
Goldberger, A.S. and G.C. Cain. (1982). “The Causal Analysis of Cognitive Outcomes in the Coleman,Hoffer and Kilgore Report.” Sociology of Education 55, 103–122.
Greenwald, Rob, Larry V. Hedges, and Richard D. Laine. (1996). “The Effect of School Resourceson Student Achievement.” Review of Educational Research 66, 361–396.
Hanushek, Eric A. (1995). “Interpreting Recent Research on Schooling in Developing Countries.”World Bank Research Observer 10, 227–246.
Hanushek, Eric A. (1997). “Assessing the Effect of School Resources on Student Performance: AnUpdate.” Educational Evaluation and Policy Analysis 19, 141–164.
Hoxby, Caroline M. (1998). “What do America’s ‘Traditional’ Forms of School Choice Teach Us aboutSchool Choice Reforms?” Federal Reserve Bank of New York Economic Policy Review 4, 47–59.
Kingdon, Geeta. (1996). “The Quality and Efficiency of Private and Public Education: A Case-Studyof Urban India.” Oxford Bulletin of Economics and Statistics 58, 57–82.
Kremer, Michael R. (1995). “Research on Schooling: What We Know and What We Don’t: A Com-ment.” World Bank Research Observer 10, 247–254.
Larranaga, Osvaldo. (1995). “Descentralizacion de la Educacion en Chile: Una Evaluacion Econom-ica.” Estudios Publicos, 243–286.
Levin, Henry M. (1991). “The Economics of Educational Choice.” Economics of Education Review10, 137–158.
Levin, Henry M. (1998). “Educational Vouchers: Effectiveness, Choice, and Costs.” Journal of PolicyAnalysis and Management 17, 373–391.
McEwan, Patrick J. (2000). “The potential Impact of Large-Scale Voucher Programs.” Review ofEducational Research 70, 103–149.
McEwan, Patrick J. (2001). “The Effectiveness of Public, Catholic, and Non-Religious Private School-ing in Chile’s Voucher System.” Education Economics 9, 103–128.
McEwan, Patrick J. and Martin Carnoy. (2000). “The Effectiveness and Efficiency of Private Schoolsin Chile’s Voucher System.” Educational Evaluation and Policy Analysis 22, 213–239.
Morduchowicz, Alejandro, Atilio Marcon, Gustavo Iglesias, Myrian Andrada, Javier Perez, VictoriaCampan, and Luisa Duro. (1999). La Educacion Privada en la Argentina: Historia, Regulaciones yAsignacion de Recursos Publicos, Buenos Aires, unpublished manuscript.
Murnane, Richard J., Stuart Newstead, and Randall J. Olsen. (1985). “Comparing Public and PrivateSchools: The Puzzling Role of Selection Bias.” Journal of Business and Economic Statistics 3,23–35.
Parry, Taryn Rounds. (1996). “Will Pursuit of Higher Quality Sacrifice Equal Opportunity in Educa-tion? An Analysis of the Education Voucher System in Santiago.” Social Science Quarterly 77,821–841.
Parry, Taryn Rounds. (1997). “Achieving Balance in Decentralization: A Case Study of EducationDecentralization in Chile.” World Development 25, 211–225.

216 MCEWAN
Peterson, Paul E. and Bryan C. Hassel (eds.). (1998). Learning from School Choice. Washington,DC: Brookings Institution Press.
Peterson, Paul E., David E. Myers, William G. Howell, and Daniel P. Mayer. (1999). “The Effects ofSchool Choice in New York City.” In Susan E. Mayer and Paul E. Peterson (eds.), Earning andLearning: How Schools Matter. Washington, DC, and New York: Brookings Institution Press andRussell Sage Foundation.
Riddell, Abby R. (1993). “The Evidence on Public/Private Educational Trade-offs in DevelopingCountries.” International Journal of Educational Development 13, 373–386.
West, Edwin G. (1997). “Education Vouchers in Principle and Practice: A Survey.” The World BankResearch Observer 12, 83–103.
Willms, J. Douglas and Marie-Andre Somers. (In press). “Family, Classroom, and School Effects onChildren’s Educational Outcomes in Latin America.” School Effectiveness and Improvement.
Witte, John F. (1992). “Private School Versus Public School Achievement: Are There Findings thatShould Affect the Educational Choice Debate?” Economics of Education Review 11, 371–394.
Witte, John F. (1996). “School Choice and Student Performance.” In Helen F. Ladd (ed.), HoldingSchools Accountable: Performance-Based Reform in Education. Washington, DC: The BrookingsInstitution.
Patrick J. McEwan is an Assistant Professor of Economics at Wellesley College.