Public Service Enterprise Group€¦ · 26/02/2020 · PSEG continuing due diligence and...
34
Public Service Enterprise Group PSEG Earnings Conference Call 4 th Quarter & Full Year 2019 February 26, 2020
Transcript of Public Service Enterprise Group€¦ · 26/02/2020 · PSEG continuing due diligence and...

Public Service Enterprise Group
PSEG Earnings Conference Call4th Quarter & Full Year 2019
February 26, 2020

Certain of the matters discussed in this presentation about our and our subsidiaries’ future performance, including, without limitation, future revenues, earnings, strategies, prospects, consequences and all other statements that are not purely historical constitute “forward-looking statements” within the meaning of the Private Securities Litigation Reform Act of 1995. Such forward-looking statements are subject to risks and uncertainties, which could cause actual results to differ materially from those anticipated. Such statements are based on management’s beliefs as well as assumptions made by and information currently available to management. When used herein, the words “anticipate,” “intend,” “estimate,” “believe,” “expect,” “plan,” “should,” “hypothetical,” “potential,” “forecast,” “project,” variations of such words and similar expressions are intended to identify forward-looking statements. Factors that may cause actual results to differ are often presented with the forward-looking statements themselves. Other factors that could cause actual results to differ materially from those contemplated in any forward-looking statements made by us herein are discussed in filings we make with the United States Securities and Exchange Commission (SEC), including our Annual Report on Form 10-K and subsequent reports on Form 10-Q and Form 8-K. These factors include, but are not limited to:
• fluctuations in wholesale power and natural gas markets, including the potential impacts on the economic viability of our generation units;• our ability to obtain adequate fuel supply;• market risks impacting the operation of our generating stations;• increases in competition in wholesale energy and capacity markets;• changes in technology related to energy generation, distribution and consumption and customer usage patterns;• economic downturns;• third-party credit risk relating to our sale of generation output and purchase of fuel;• adverse performance of our nuclear decommissioning and defined benefit plan trust fund investments and changes in funding requirements;• the impact of changes in state and federal legislation and regulations on our business, including PSE&G’s ability to recover costs and earn returns on authorized investments;• PSE&G’s proposed investment programs may not be fully approved by regulators and its capital investment may be lower than planned;• the impact on our New Jersey nuclear plants if such plants are not awarded Zero Emission Certificates (ZEC) in future periods, there is an adverse change in the amount of future ZEC
payments, the ZEC program is overturned or modified through legal proceedings or if adverse changes are made to the capacity market construct;• adverse changes in energy industry laws, policies and regulations, including market structures and transmission planning;• the impact of state and federal actions aimed at combating climate change on our natural gas assets;• risks associated with our ownership and operation of nuclear facilities, including regulatory risks, such as compliance with the Atomic Energy Act and trade control, environmental and
other regulations, as well as financial, environmental and health and safety risks;• changes in federal and state environmental regulations and enforcement;• delays in receipt of, or an inability to receive, necessary licenses and permits;• the impact of any future rate proceedings;• adverse outcomes of any legal, regulatory or other proceeding, settlement, investigation or claim applicable to us and/or the energy industry;• changes in tax laws and regulations;• the impact of our holding company structure on our ability to meet our corporate funding needs, service debt and pay dividends;• lack of growth or slower growth in the number of customers or changes in customer demand;• any inability of PSEG Power to meet its commitments under forward sale obligations;• reliance on transmission facilities that we do not own or control and the impact on our ability to maintain adequate transmission capacity;• any inability to successfully develop, obtain regulatory approval for, or construct generation, transmission and distribution projects;• any equipment failures, accidents, severe weather events or other incidents that impact our ability to provide safe and reliable service to our customers;• our inability to exercise control over the operations of generation facilities in which we do not maintain a controlling interest;• any inability to recover the carrying amount of our long-lived assets and leveraged leases;• any inability to maintain sufficient liquidity;• any inability to realize anticipated tax benefits or retain tax credits;• challenges associated with recruitment and/or retention of key executives and a qualified workforce;• the impact of our covenants in our debt instruments on our operations; and• the impact of acts of terrorism, cybersecurity attacks or intrusions.
All of the forward-looking statements made in this presentation are qualified by these cautionary statements and we cannot assure you that the results or developments anticipated by management will be realized or even if realized, will have the expected consequences to, or effects on, us or our business, prospects, financial condition, results of operations orcash flows. Readers are cautioned not to place undue reliance on these forward-looking statements in making any investment decision. Forward-looking statements made in this presentation apply only as of the date of this presentation. While we may elect to update forward-looking statements from time to time, we specifically disclaim any obligation to do so, even in light of new information or future events, unless otherwise required by applicable securities laws.
The forward-looking statements contained in this presentation are intended to qualify for the safe harbor provisions of Section 27A of the Securities Act of 1933, as amended, and Section 21E of the Securities Exchange Act of 1934, as amended.
Forward-Looking Statements
2

PSEG presents Operating Earnings and Adjusted Earnings Before Interest, Taxes, Depreciation and Amortization (EBITDA) in addition to its Net Income reported in accordance with accounting principles generally accepted in the United States (GAAP). Operating Earnings and Adjusted EBITDA are non-GAAP financial measures that differ from Net Income. Non-GAAP Operating Earnings exclude the impact of returns (losses) associated with the Nuclear Decommissioning Trust (NDT), Mark-to-Market (MTM) accounting and material one-time items. Non-GAAP Adjusted EBITDA excludes the same items as our non-GAAP Operating Earnings measure as well as income tax expense, interest expense and depreciation and amortization. The last two slides in this presentation (Slides A and B) include a list of items excluded from Net Income/(Loss) to reconcile to non-GAAP Operating Earnings and non-GAAP Adjusted EBITDA with a reference to those slides included on each of the slides where the non-GAAP information appears.
Management uses non-GAAP Operating Earnings in its internal analysis, and in communications with investors and analysts, as a consistent measure for comparing PSEG’s financial performance to previous financial results. Management believes non-GAAP Adjusted EBITDA is useful to investors and other users of our financial statements in evaluating operating performance because it provides them with an additional tool to compare business performance across companies and across periods. Management also believes that non-GAAP Adjusted EBITDA is widely used by investors to measure operating performance without regard to items such as income tax expense, interest expense and depreciation and amortization, which can vary substantially from company to company depending upon, among other things, the book value of assets, capital structure and whether assets were constructed or acquired. Non-GAAP Adjusted EBITDA also allows investors and other users to assess the underlying financial performance of our fleet before management’s decision to deploy capital. The presentation of non-GAAP Operating Earnings and non-GAAP Adjusted EBITDA is intended to complement, and should not be considered an alternative to, the presentation of Net Income/(Loss), which is an indicator of financial performance determined in accordance with GAAP. In addition, non-GAAP Operating Earnings and non-GAAP Adjusted EBITDA as presented in this release may not be comparable to similarly titled measures used by other companies.
Due to the forward looking nature of non-GAAP Operating Earnings and non-GAAP Adjusted EBITDA guidance, PSEG is unable to reconcile these non-GAAP financial measures to the most directly comparable GAAP financial measure. Management is unable to project certain reconciling items, in particular MTM and NDT gains (losses), for future periods due to market volatility.
GAAP Disclaimer
These materials and other financial releases can be found on the PSEG website at https://investor.pseg.com. From time to time, PSEG, PSE&G and PSEG Power release important information via postings on their corporate website at https://investor.pseg.com. Investors and other interested parties are encouraged to visit the corporate website to review new postings. The “Email Alerts” link at https://investor.pseg.com may be used to enroll to receive automatic email alerts regarding new postings.
3

PSEG 2019 Q4 and Full Year Review
Ralph IzzoChairman, President and Chief Executive Officer

PSEG Q4 and Full Year 2019 Fourth Quarter and Full Year Highlights Net Income per share of $0.86 in Q4 2019 vs. $0.39 in Q4 2018;
Full year Net Income per share of $3.33 in 2019 vs. $2.83 in 2018
Non-GAAP Operating Earnings* per share of $0.64 in Q4 2019 vs. $0.56 in Q4 2018; Full year, non-GAAP Operating Earnings* per share of $3.28 in 2019 vs. $3.12 in 2018
PSE&G results benefited from ongoing investment in utility infrastructure and rate relief
PSEG Power results impacted by lower capacity revenues partly offset by Zero Emission Certificate (ZEC) revenues and cost control
Operational Excellence
PSE&G named most reliable electric utility in the Mid-Atlantic region for the 18th year in a row
Disciplined Capital Investment PSEG invested $3.1 billion in 2019: $2.7 billion at PSE&G covering completion of both Energy Strong (ES)
and Gas System Modernization Program (GSMP), and beginning of the second phase of both programs
NJ Board of Public Utilities (NJBPU) approved extension of the Clean Energy Future (CEF) – Energy Efficiency (EE) procedural schedule through September 2020 and the extension of several existing programs in the amount of $111 million
NJBPU lifted statewide moratorium on Advanced Metering Infrastructure (AMI)
NJBPU Staff proposed procedural schedules for $600 million CEF – Energy Cloud (EC/AMI), $300 million CEF – Electric Vehicles (EV), and $100 million CEF – Energy Storage (ES)
*See Slides A and B for Items excluded from Net Income/(Loss) to reconcile to Operating Earnings (non-GAAP).5
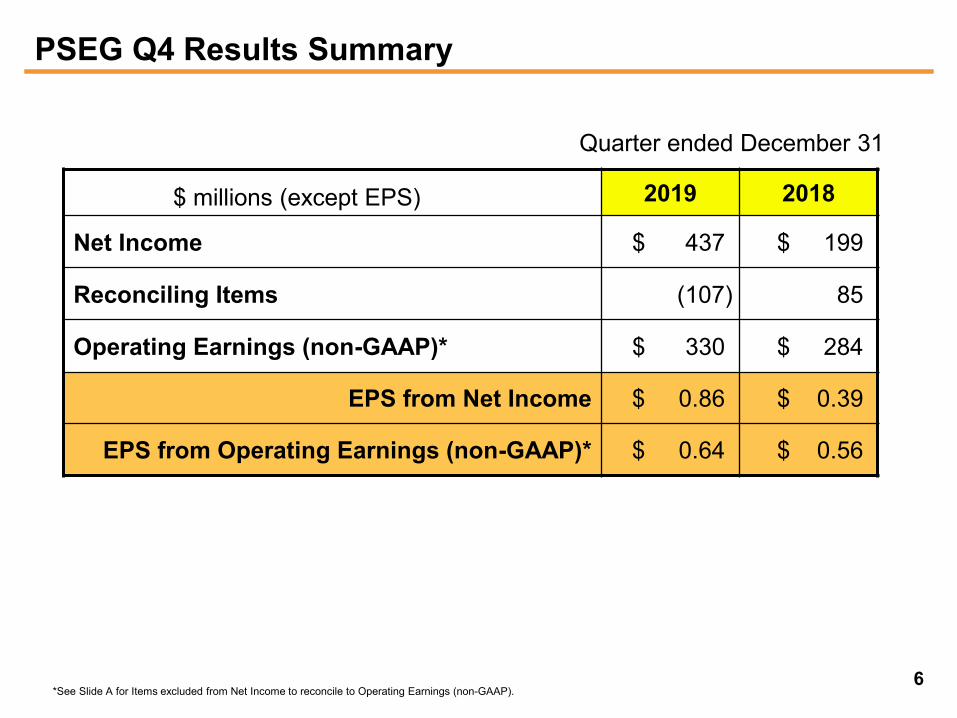
PSEG Q4 Results Summary
Quarter ended December 31
$ millions (except EPS) 2019 2018
Net Income $ 437 $ 199
Reconciling Items (107) 85
Operating Earnings (non-GAAP)* $ 330 $ 284
EPS from Net Income $ 0.86 $ 0.39
EPS from Operating Earnings (non-GAAP)* $ 0.64 $ 0.56
*See Slide A for Items excluded from Net Income to reconcile to Operating Earnings (non-GAAP).6

PSEG Full Year Results
Twelve Months ended December 31
$ millions (except EPS) 2019 2018
Net Income $ 1,693 $ 1,438
Reconciling Items (27) 144
Operating Earnings (non-GAAP)* $ 1,666 $ 1,582
EPS from Net Income $ 3.33 $ 2.83
EPS from Operating Earnings (non-GAAP)* $ 3.28 $ 3.12
*See Slide A for Items excluded from Net Income to reconcile to Operating Earnings (non-GAAP).7

PSEG - Regulatory and Policy ObjectivesPSEG’s Priorities Aligned with New Jersey’s Clean Energy Agenda NJBPU approved agreement to extend CEF-EE procedural schedule to the end of September 2020 to
complete its review; investment in existing programs extended in the interim by $111 million BPU staff proposed schedules for the consideration of CEF–EC (AMI), EV and ES: Procedural
schedules have been proposed for $1 billion of investments NJBPU finalized the Energy Master Plan in January 2020 PSEG continuing due diligence and negotiations toward a Joint Venture agreement to
potentially acquire a 25% equity interest in Ørsted’s 1,100 MW Ocean Wind project
PSEG Powering Progress In line with PSEG Power’s goal to reduce CO2 emissions 80% by 2046 from 2005 levels, Keystone/
Conemaugh sale creates path to complete exit of coal units from PSEG Power fleet by mid-2021 One of the lowest carbon emissions intensity rates of the nation’s largest power producers, according to
the report, “Benchmarking Air Emissions of the 100 Largest Electric Power Producers in the United States,” released by M.J. Bradley & Associates
PSE&G Gas System Modernization Programs reduced annual methane emissions by approximately 40,000 metric tons of CO2 equivalent during 2019
PSEG named to Dow Jones Sustainability Index – North America for the 12th consecutive year
FERC/PJM/Wholesale Market Reforms Pending PJM compliance filing to FERC Capacity Order expected March 18th
Fast start pricing proceeding currently held in abeyance by FERC to allow PJM to address dispatchand pricing misalignment concerns via its stakeholder process 8
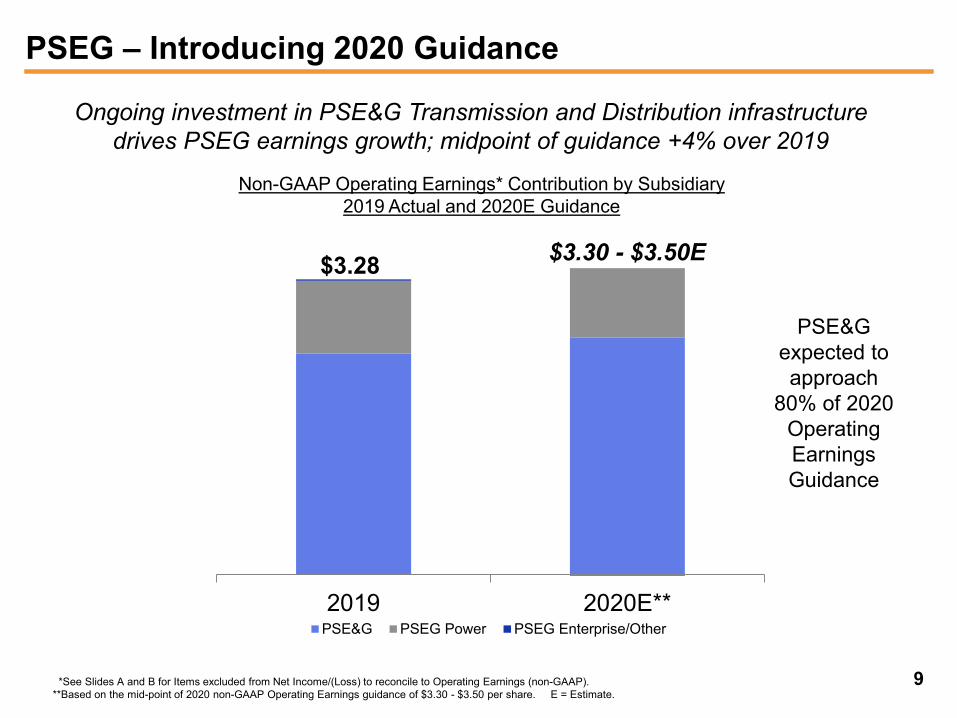
Ongoing investment in PSE&G Transmission and Distribution infrastructure drives PSEG earnings growth; midpoint of guidance +4% over 2019
Non-GAAP Operating Earnings* Contribution by Subsidiary2019 Actual and 2020E Guidance
*See Slides A and B for Items excluded from Net Income/(Loss) to reconcile to Operating Earnings (non-GAAP).**Based on the mid-point of 2020 non-GAAP Operating Earnings guidance of $3.30 - $3.50 per share. E = Estimate.
2019 2020E**PSE&G PSEG Power PSEG Enterprise/Other
$3.28 $3.30 - $3.50E
PSE&G expected to approach
80% of 2020 Operating Earnings Guidance
PSEG – Introducing 2020 Guidance
9
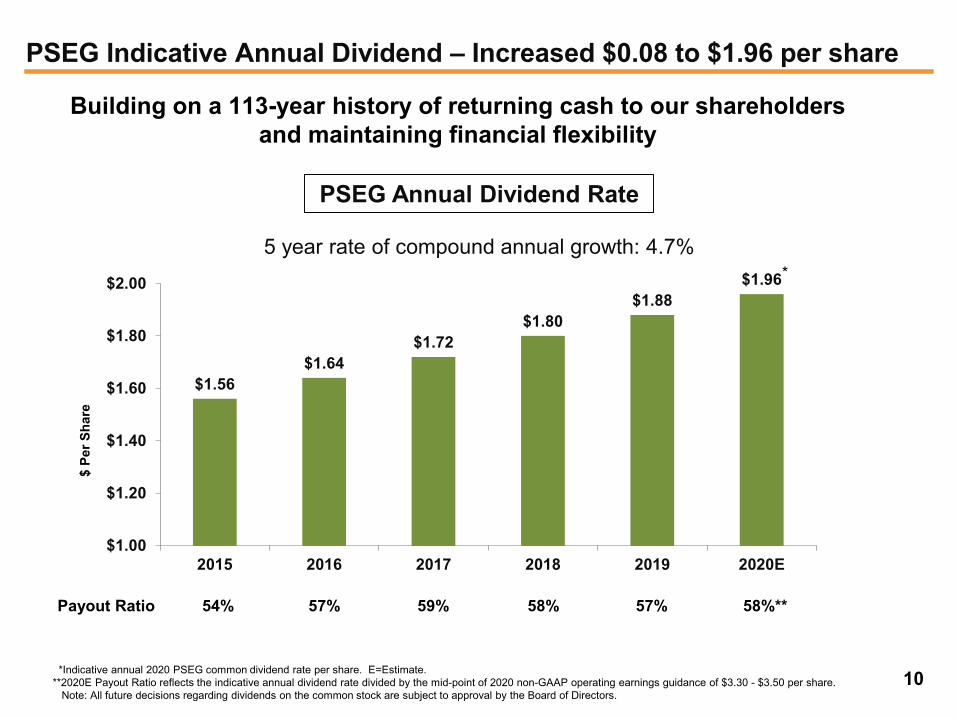
$1.56$1.64
$1.72$1.80
$1.88$1.96
$1.00
$1.20
$1.40
$1.60
$1.80
$2.00
2015 2016 2017 2018 2019 2020E
PSEG Indicative Annual Dividend – Increased $0.08 to $1.96 per share$
Per S
hare
Payout Ratio 54% 57% 59% 58% 57% 58%**
Building on a 113-year history of returning cash to our shareholders and maintaining financial flexibility
PSEG Annual Dividend Rate
5 year rate of compound annual growth: 4.7%
10
*
*Indicative annual 2020 PSEG common dividend rate per share. E=Estimate.**2020E Payout Ratio reflects the indicative annual dividend rate divided by the mid-point of 2020 non-GAAP operating earnings guidance of $3.30 - $3.50 per share.
Note: All future decisions regarding dividends on the common stock are subject to approval by the Board of Directors.

PSEG 2019 Q4 Operating Company Review
Dan CreggEVP and Chief Financial Officer

PSEG – Q4 Results by Subsidiary
Net Income / (Loss) 2019 2018 Change
PSE&G $ 0.54 $ 0.47 $ 0.07
PSEG Power $ 0.32 $ (0.07) $ 0.39
PSEG Enterprise/Other $ -. $ (0.01) $ 0.01
Total PSEG $ 0.86 $ 0.39 $ 0.47
Non-GAAP Operating Earnings* 2019 2018 Change
PSE&G $ 0.54 $ 0.47 $ 0.07
PSEG Power $ 0.10 $ 0.11 $ (0.01)
PSEG Enterprise/Other $ -. $ (0.02) $ 0.02
Total PSEG* $ 0.64 $ 0.56 $ 0.08
*See Slides A and B for Items excluded from Net Income/(Loss) to reconcile to Operating Earnings (non-GAAP) for PSEG, PSEG Power and PSEG Enterprise/Other.
PSEG Q4 EPS Summary – Quarter ended December 31
12
$0.39
$0.56
$0.64
$0.86
0.07 (0.01) 0.02
$0.00
$0.15
$0.30
$0.45
$0.60
$0.75
$0.90
Q4 2018Net Income
Q4 2018OperatingEarnings
(non-GAAP)*
PSE&G PSEG Power PSEGEnterprise/
Other
Q4 2019OperatingEarnings
(non-GAAP)*
Q4 2019Net Income
$ / s
hare
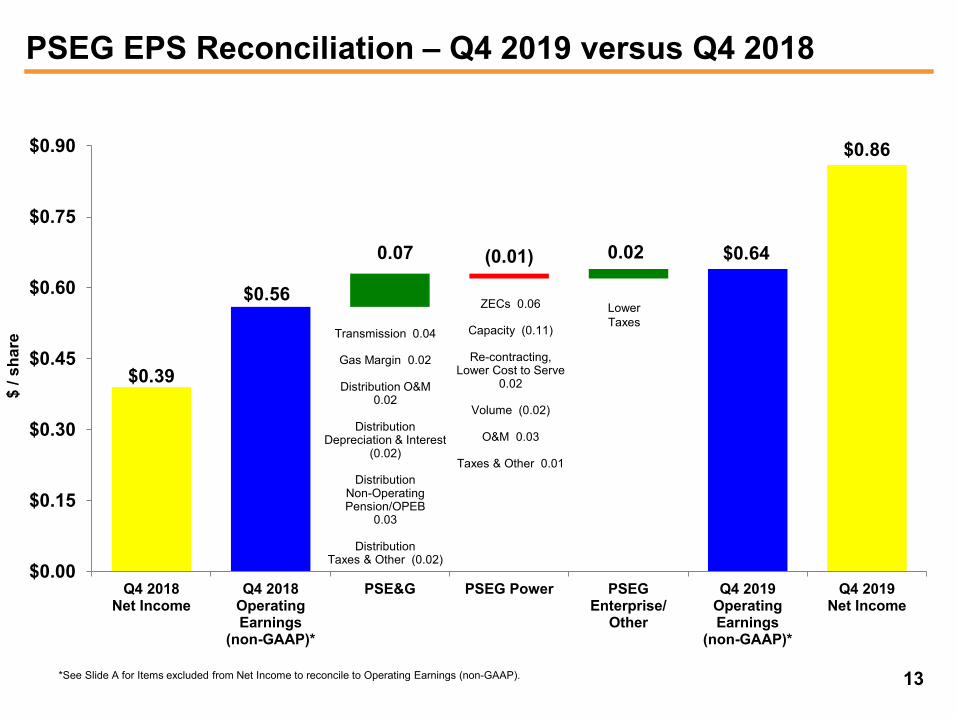
PSEG EPS Reconciliation – Q4 2019 versus Q4 2018
ZECs 0.06
Capacity (0.11)
Re-contracting, Lower Cost to Serve
0.02
Volume (0.02)
O&M 0.03
Taxes & Other 0.01
Transmission 0.04
Gas Margin 0.02
Distribution O&M 0.02
Distribution Depreciation & Interest
(0.02)
Distribution Non-Operating Pension/OPEB
0.03
Distribution Taxes & Other (0.02)
LowerTaxes
*See Slide A for Items excluded from Net Income to reconcile to Operating Earnings (non-GAAP). 13

PSEG – Full Year Results by Subsidiary
Net Income/(Loss) 2019 2018 Change
PSE&G $ 2.46 $ 2.10 $ 0.36
PSEG Power $ 0.93 $ 0.72 $ 0.21
PSEG Enterprise/Other $ (0.06) $ 0.01 $ (0.07)
Total PSEG $ 3.33 $ 2.83 $ 0.50
Non-GAAP Operating Earnings* 2019 2018 Change
PSE&G $ 2.46 $ 2.10 $ 0.36
PSEG Power $ 0.81 $ 0.99 $ (0.18)
PSEG Enterprise/Other $ 0.01 $ 0.03 $ (0.02)
Total PSEG* $ 3.28 $ 3.12 $ 0.16
*See Slides A and B for Items excluded from Net Income/(Loss) to reconcile to Operating Earnings (non-GAAP) for PSEG, PSEG Power and PSEG Enterprise/Other.
PSEG Full Year EPS Summary – Twelve Months ended December 31
14

$2.83
$3.12$3.28 $3.33
0.36 (0.18)(0.02)
$0.00
$0.50
$1.00
$1.50
$2.00
$2.50
$3.00
$3.50
FY 2018Net Income
FY 2018OperatingEarnings
(non-GAAP)*
PSE&G PSEG Power PSEGEnterprise/
Other
FY 2019OperatingEarnings
(non-GAAP)*
FY 2019Net Income
$ / s
hare
PSEG EPS Reconciliation – FY 2019 versus FY 2018
ZECs 0.18
Capacity (0.17)
Re-contracting, Lower Cost to Serve (0.09)
Volume (0.01)
Gas Operations (0.04)
O&M 0.04
Depreciation (0.04)
Interest Expense (0.05)
Transmission 0.17
Gas Margin 0.16
Electric Margin 0.04
Weather (0.02)
Distribution O&M 0.03
Distribution Depreciation & Interest
(0.08)
Distribution Non-Operating Pension/OPEB
0.08
Distribution Taxes & Other (0.02)
Interest Expense partially offset by
Lower Taxes
*See Slide A for Items excluded from Net Income to reconcile to Operating Earnings (non-GAAP). 15

PSE&G 2019 Q4 Review
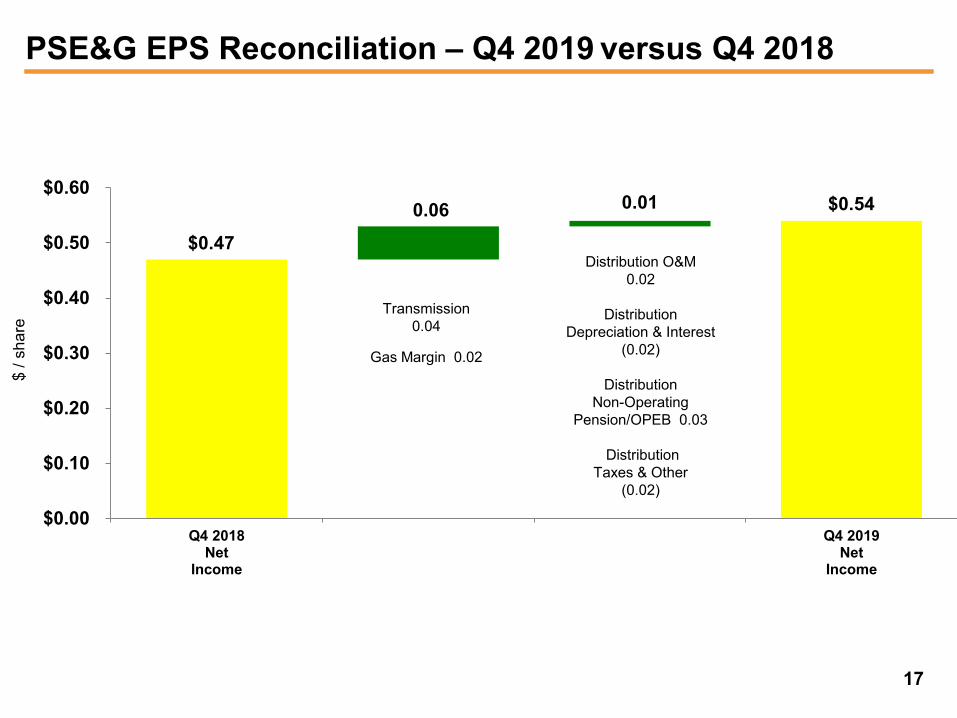
$0.47
$0.540.06 0.01
$0.00
$0.10
$0.20
$0.30
$0.40
$0.50
$0.60
Q4 2018Net
Income
Q4 2019Net
Income
$ / s
hare
PSE&G EPS Reconciliation – Q4 2019 versus Q4 2018
Transmission 0.04
Gas Margin 0.02
Distribution O&M 0.02
Distribution Depreciation & Interest
(0.02)
Distribution Non-Operating
Pension/OPEB 0.03
DistributionTaxes & Other
(0.02)
17
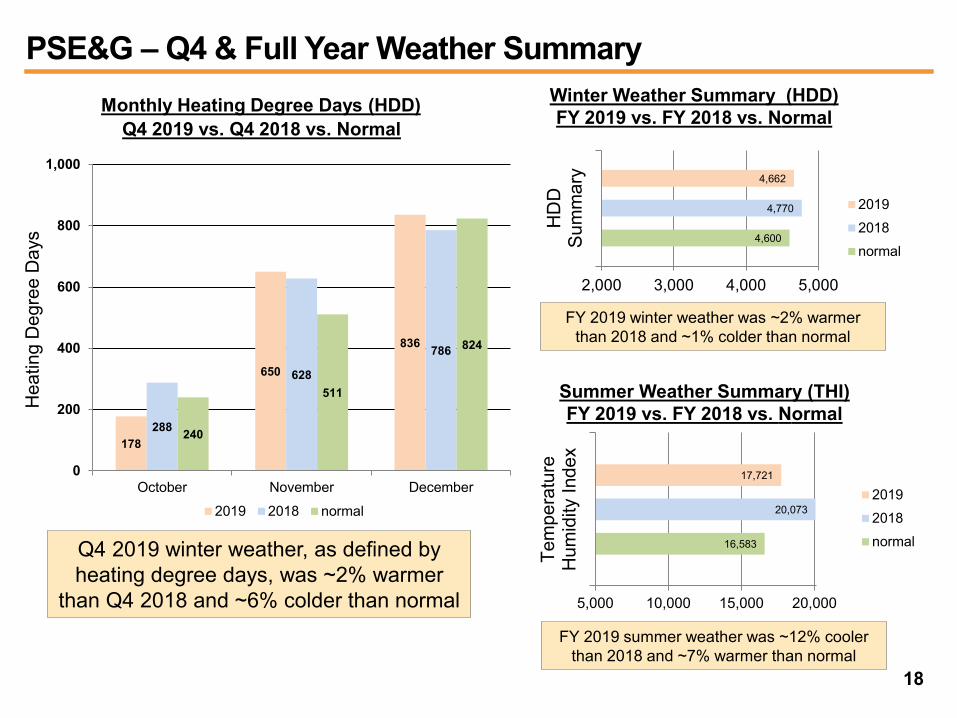
178
650
836
288
628
786
240
511
824
0
200
400
600
800
1,000
October November December2019 2018 normal
PSE&G – Q4 & Full Year Weather Summary
Q4 2019 vs. Q4 2018 vs. NormalMonthly Heating Degree Days (HDD)
Q4 2019 winter weather, as defined by heating degree days, was ~2% warmer
than Q4 2018 and ~6% colder than normal
Hea
ting
Deg
ree
Day
s 4,600
4,770
4,662
2,000 3,000 4,000 5,000
HD
DSu
mm
ary
20192018normal
Winter Weather Summary (HDD)FY 2019 vs. FY 2018 vs. Normal
16,583
20,073
17,721
5,000 10,000 15,000 20,000
Tem
pera
ture
Hum
idity
Inde
x
20192018normal
Summer Weather Summary (THI)FY 2019 vs. FY 2018 vs. Normal
FY 2019 winter weather was ~2% warmer than 2018 and ~1% colder than normal
FY 2019 summer weather was ~12% cooler than 2018 and ~7% warmer than normal
18

0
500
1,000
1,500
2,000
2,500
3,000
3,500
2020E 2021E 2022E 2023E 2024E
Transmission Electric Distribution Gas Distribution Clean Energy
PSE&G’s capital program of $11.5 billion to $15 billion focused on reliability, resiliency, grid modernization and clean energy investments
CEF: EE, EC,EV & ES
PSE&G Capital Spending2020E – 2024E
($ M
illion
s)
Includes AFUDC Debt. Green hashed portion of the chart represents CEF filings to reflect a one year delay in discussions; no change to total filing position.Purple hashed portion of the chart represents the identified IIP Extension programs (GSMP III and ES III) E = Estimate.
~90% of investment receiving contemporaneous or near-contemporaneous
regulatory treatment
IdentifiedInfrastructure
Investment Program (IIP) Extensions
(ES III & GSMP III)
19
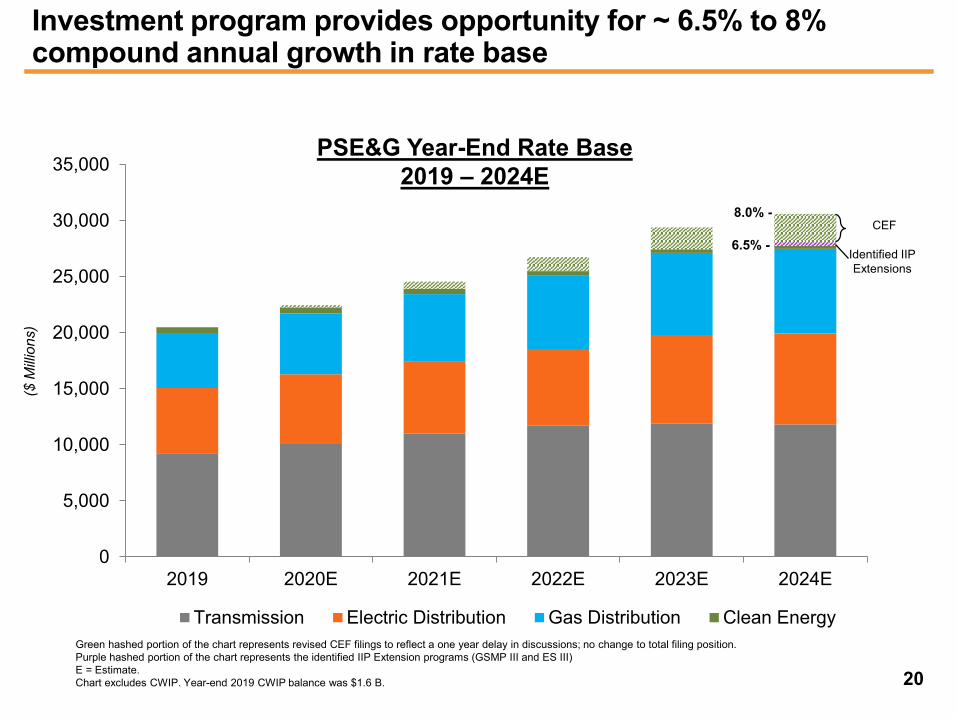
0
5,000
10,000
15,000
20,000
25,000
30,000
35,000
2019 2020E 2021E 2022E 2023E 2024E
Transmission Electric Distribution Gas Distribution Clean Energy
8.0% -
($ M
illion
s)
Green hashed portion of the chart represents revised CEF filings to reflect a one year delay in discussions; no change to total filing position.Purple hashed portion of the chart represents the identified IIP Extension programs (GSMP III and ES III) E = Estimate. Chart excludes CWIP. Year-end 2019 CWIP balance was $1.6 B.
CEF
PSE&G Year-End Rate Base 2019 – 2024E
Investment program provides opportunity for ~ 6.5% to 8% compound annual growth in rate base
6.5% -Identified IIP Extensions
20
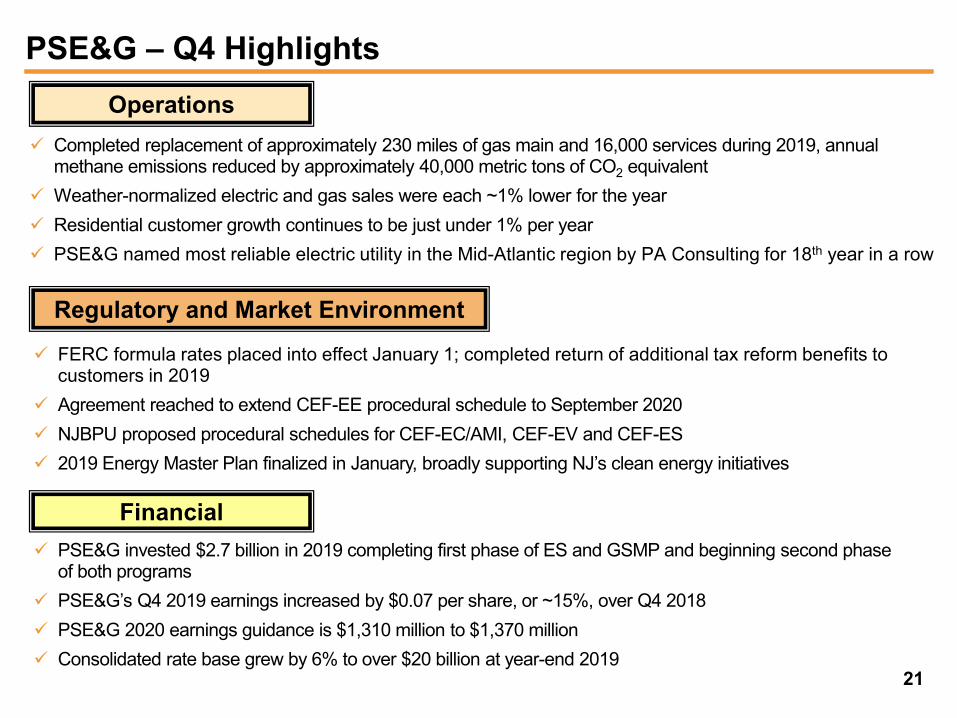
PSE&G – Q4 Highlights
FERC formula rates placed into effect January 1; completed return of additional tax reform benefits to customers in 2019
Agreement reached to extend CEF-EE procedural schedule to September 2020 NJBPU proposed procedural schedules for CEF-EC/AMI, CEF-EV and CEF-ES 2019 Energy Master Plan finalized in January, broadly supporting NJ’s clean energy initiatives
Operations
Regulatory and Market Environment
PSE&G invested $2.7 billion in 2019 completing first phase of ES and GSMP and beginning second phaseof both programs
PSE&G’s Q4 2019 earnings increased by $0.07 per share, or ~15%, over Q4 2018 PSE&G 2020 earnings guidance is $1,310 million to $1,370 million Consolidated rate base grew by 6% to over $20 billion at year-end 2019
Financial
Completed replacement of approximately 230 miles of gas main and 16,000 services during 2019, annual methane emissions reduced by approximately 40,000 metric tons of CO2 equivalent
Weather-normalized electric and gas sales were each ~1% lower for the year Residential customer growth continues to be just under 1% per year PSE&G named most reliable electric utility in the Mid-Atlantic region by PA Consulting for 18th year in a row
21

PSEG Power 2019 Q4 Review
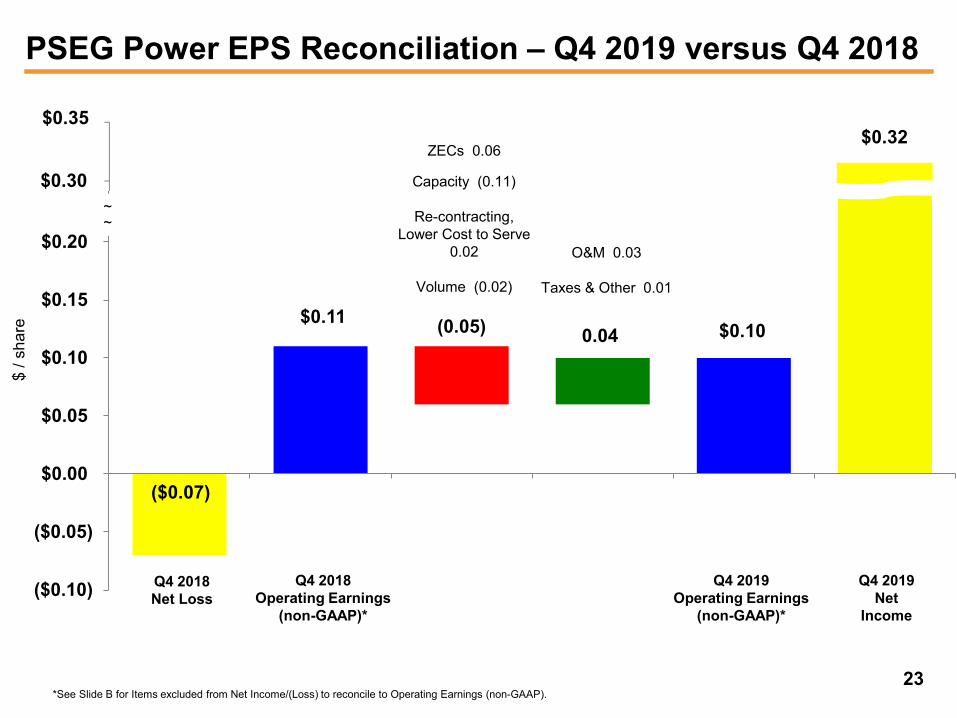
PSEG Power EPS Reconciliation – Q4 2019 versus Q4 2018
($0.07)
$0.11$0.10(0.05) 0.04
($0.10)
($0.05)
$0.00
$0.05
$0.10
$0.15
$0.20
$0.25~~
Q4 2018 Net Loss
Q4 2018 Operating Earnings
(non-GAAP)*
Q4 2019 Net
Income
Q4 2019 Operating Earnings
(non-GAAP)*
ZECs 0.06
Capacity (0.11)
Re-contracting, Lower Cost to Serve
0.02
Volume (0.02)
O&M 0.03
Taxes & Other 0.01
*See Slide B for Items excluded from Net Income/(Loss) to reconcile to Operating Earnings (non-GAAP).
$/ s
hare
$0.35
$0.30
$0.32
23
7,487 7,016
1,436
5,300
6,335
0
2,500
5,000
7,500
10,000
12,500
15,000
2018 2019
(6)
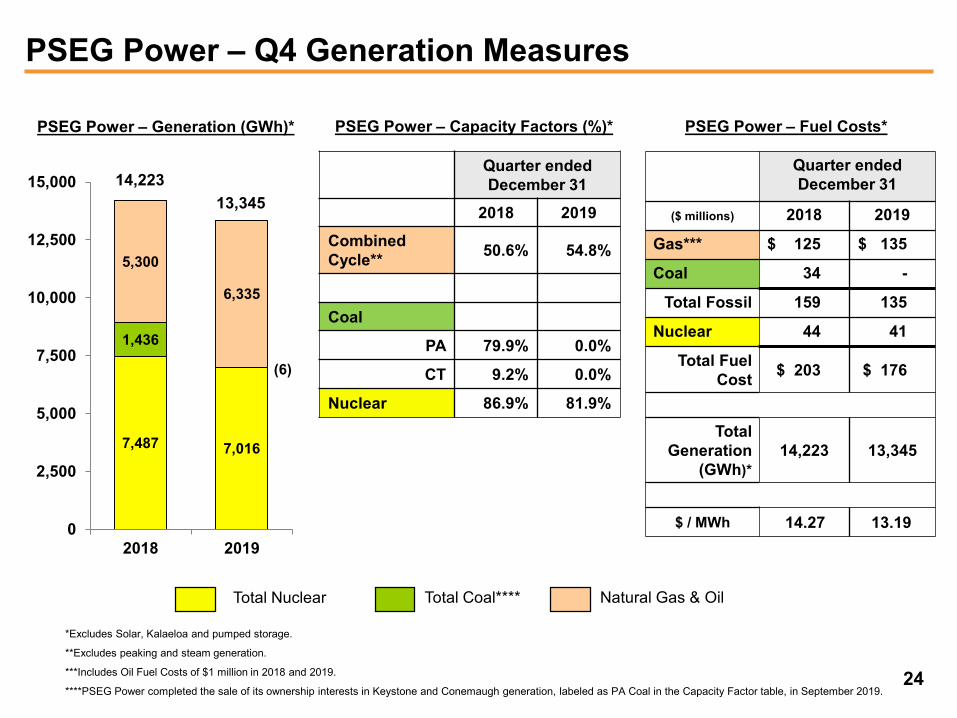
PSEG Power – Q4 Generation Measures
Total Nuclear Total Coal**** Natural Gas & Oil
*Excludes Solar, Kalaeloa and pumped storage.
**Excludes peaking and steam generation.
***Includes Oil Fuel Costs of $1 million in 2018 and 2019.
****PSEG Power completed the sale of its ownership interests in Keystone and Conemaugh generation, labeled as PA Coal in the Capacity Factor table, in September 2019.
PSEG Power – Generation (GWh)*
14,22313,345
PSEG Power – Capacity Factors (%)*
Quarter endedDecember 31
($ millions) 2018 2019
Gas*** $ 125 $ 135
Coal 34 -
Total Fossil 159 135
Nuclear 44 41
Total Fuel Cost $ 203 $ 176
Total Generation
(GWh)*14,223 13,345
$ / MWh 14.27 13.19
PSEG Power – Fuel Costs*
Quarter ended December 31
2018 2019CombinedCycle** 50.6% 54.8%
Coal
PA 79.9% 0.0%
CT 9.2% 0.0%
Nuclear 86.9% 81.9%
24

31,231 30,156
5,7433,861
18,889 22,839
0
10,000
20,000
30,000
40,000
50,000
60,000
2018 2019
Twelve Months ended December 31
2018 2019CombinedCycle** 52.0% 52.2%
Coal
PA 80.1% 75.4%
CT 9.9% 1.6%
Nuclear 91.4% 88.7%
PSEG Power – Full Year Generation Measures
Total Nuclear Total Coal**** Natural Gas & Oil
*Excludes Solar, Kalaeloa and pumped storage.
**Excludes peaking and steam generation.
***Includes Oil Fuel Costs of $29 million and $5 million in 2018 and 2019, respectively.
****PSEG Power completed the sale of its ownership interests in Keystone and Conemaugh generation, labeled as PA Coal in the Capacity Factor table, in September 2019.
PSEG Power – Generation (GWh)*
55,863 56,856
PSEG Power – Capacity Factors (%)*
Twelve Months ended December 31
($ millions) 2018 2019
Gas*** $ 450 $ 531
Coal 140 78
Total Fossil 590 609
Nuclear 187 178
Total Fuel Cost $ 777 $ 787
Total Generation
(GWh)*55,863 56,856
$ / MWh 13.91 13.84
PSEG Power – Fuel Costs*
25
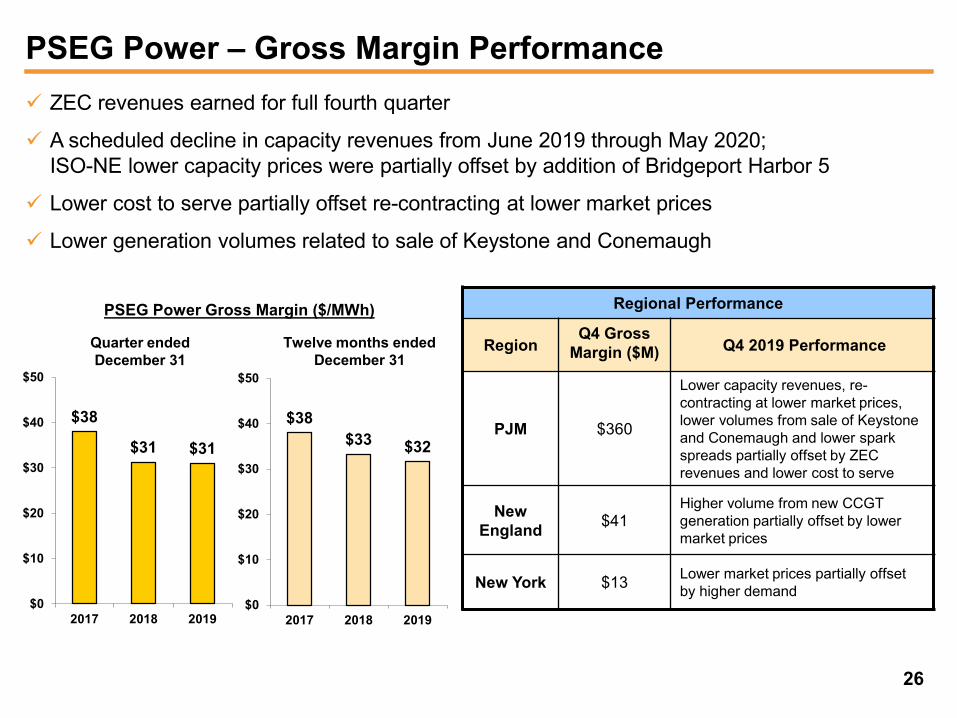
PSEG Power – Gross Margin Performance ZEC revenues earned for full fourth quarter
A scheduled decline in capacity revenues from June 2019 through May 2020; ISO-NE lower capacity prices were partially offset by addition of Bridgeport Harbor 5
Lower cost to serve partially offset re-contracting at lower market prices
Lower generation volumes related to sale of Keystone and Conemaugh
Regional Performance
Region Q4 Gross
Margin ($M) Q4 2019 Performance
PJM $360
Lower capacity revenues, re-contracting at lower market prices, lower volumes from sale of Keystone and Conemaugh and lower spark spreads partially offset by ZEC revenues and lower cost to serve
New England $41
Higher volume from new CCGT generation partially offset by lower market prices
New York $13 Lower market prices partially offset by higher demand
PSEG Power Gross Margin ($/MWh)
$38
$31 $31
$0
$10
$20
$30
$40
$50
2017 2018 2019
Quarter ended December 31
$38$33 $32
$0
$10
$20
$30
$40
$50
2017 2018 2019
Twelve months ended December 31
26
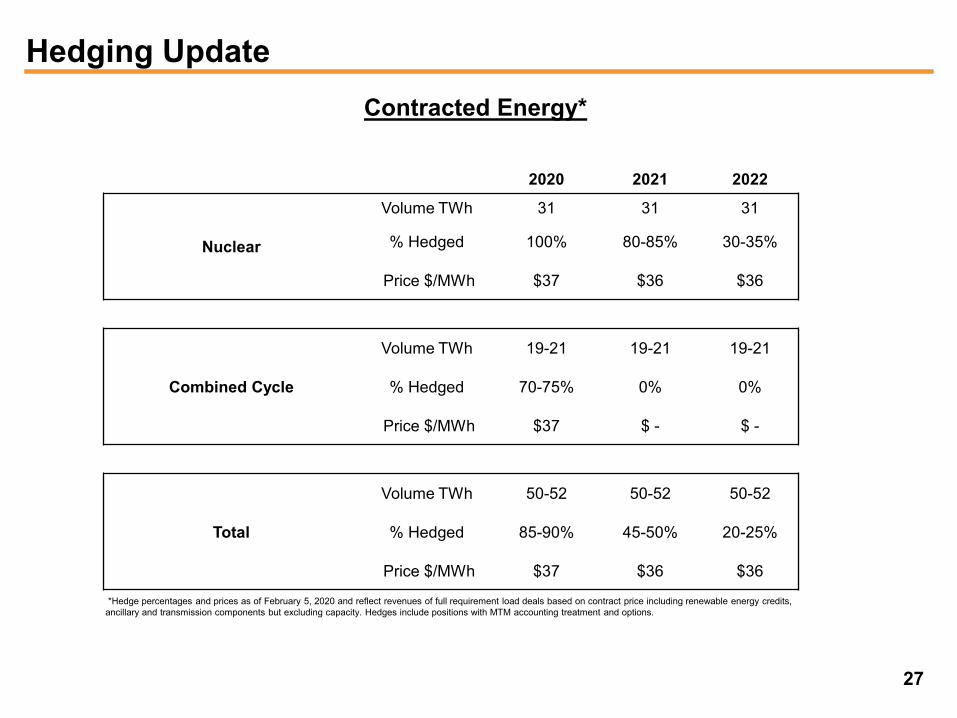
Hedging Update Contracted Energy*
*Hedge percentages and prices as of February 5, 2020 and reflect revenues of full requirement load deals based on contract price including renewable energy credits, ancillary and transmission components but excluding capacity. Hedges include positions with MTM accounting treatment and options.
27
2020 2021 2022
Nuclear
Volume TWh 31 31 31
% Hedged 100% 80-85% 30-35%
Price $/MWh $37 $36 $36
Combined Cycle
Volume TWh 19-21 19-21 19-21
% Hedged 70-75% 0% 0%
Price $/MWh $37 $ - $ -
Total
Volume TWh 50-52 50-52 50-52
% Hedged 85-90% 45-50% 20-25%
Price $/MWh $37 $36 $36
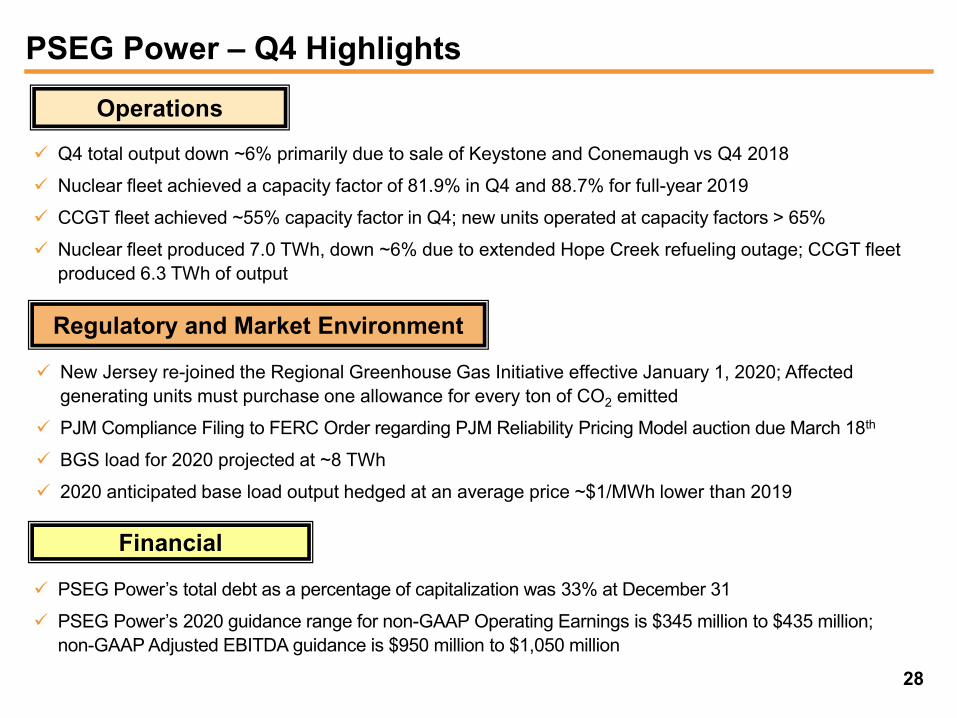
PSEG Power – Q4 Highlights
Q4 total output down ~6% primarily due to sale of Keystone and Conemaugh vs Q4 2018
Nuclear fleet achieved a capacity factor of 81.9% in Q4 and 88.7% for full-year 2019
CCGT fleet achieved ~55% capacity factor in Q4; new units operated at capacity factors > 65%
Nuclear fleet produced 7.0 TWh, down ~6% due to extended Hope Creek refueling outage; CCGT fleetproduced 6.3 TWh of output
Operations
Regulatory and Market Environment
Financial
New Jersey re-joined the Regional Greenhouse Gas Initiative effective January 1, 2020; Affectedgenerating units must purchase one allowance for every ton of CO2 emitted
PJM Compliance Filing to FERC Order regarding PJM Reliability Pricing Model auction due March 18th
BGS load for 2020 projected at ~8 TWh
2020 anticipated base load output hedged at an average price ~$1/MWh lower than 2019
PSEG Power’s total debt as a percentage of capitalization was 33% at December 31
PSEG Power’s 2020 guidance range for non-GAAP Operating Earnings is $345 million to $435 million;non-GAAP Adjusted EBITDA guidance is $950 million to $1,050 million
28

PSEG
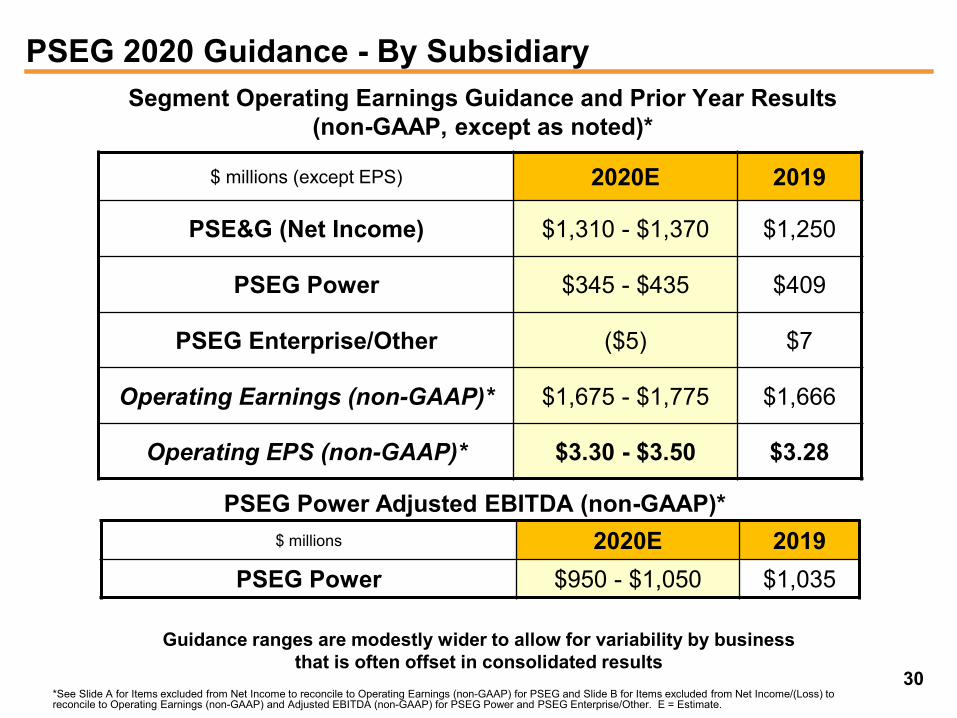
PSEG 2020 Guidance - By Subsidiary
$ millions (except EPS) 2020E 2019
PSE&G (Net Income) $1,310 - $1,370 $1,250
PSEG Power $345 - $435 $409
PSEG Enterprise/Other ($5) $7
Operating Earnings (non-GAAP)* $1,675 - $1,775 $1,666
Operating EPS (non-GAAP)* $3.30 - $3.50 $3.28
Segment Operating Earnings Guidance and Prior Year Results(non-GAAP, except as noted)*
$ millions 2020E 2019PSEG Power $950 - $1,050 $1,035
PSEG Power Adjusted EBITDA (non-GAAP)*
*See Slide A for Items excluded from Net Income to reconcile to Operating Earnings (non-GAAP) for PSEG and Slide B for Items excluded from Net Income/(Loss) toreconcile to Operating Earnings (non-GAAP) and Adjusted EBITDA (non-GAAP) for PSEG Power and PSEG Enterprise/Other. E = Estimate.
30
Guidance ranges are modestly wider to allow for variability by business that is often offset in consolidated results

PSEG Financial Highlights
Initiating 2020 non-GAAP Operating Earnings guidance of $3.30 - $3.50 per share, up ~4%over 2019 mid-point of guidance
Business mix anticipates PSE&G contribution approaches 80% of Operating Earnings in 2020
PSEG’s 5-year capital spending forecast of $12 - $16 billion, with over 90% directed at PSE&G,expected to produce ~6.5% - 8% compound annual growth in rate base over 2020 - 2024
Hope Creek and Salem 1 and Salem 2 earn full year of ZECs in 2020
Increased 2020 indicative annual common dividend by $0.08 to $1.96 per share
Financial position remains strong: PSEG continues to be a net beneficiary from tax reform
Cash from PSEG Power and increasing cash from operations at PSE&G fund2020 - 2024 capital spending program and support opportunity for dividend growthwithout the need to issue equity
Debt as a percentage of capitalization was 52% at December 31
PSEG credit measures remain strong
31

PSEG Liquidity as of December 31, 2019
Expiration Total AvailableCompany Facility Date Facility Usage Liquidity
($ Millions)
PSE&G 5-year Credit Facility Mar-23 $600 (A) $379 $221
PSEG Money PoolPSEG / PSEG Power 5-year Credit Facilities (PSEG) Mar-23 $1,500 (B) $796 $704
5-year Credit Facilities (PSEG Power) Mar-23 $1,900 (C) $40 $1,8603-year LC Facilities (PSEG Power) Sep-21 $200 $121 $79
Total Money Pool $3,600 $957 $2,643
Total $4,200 $1,336 $2,864
(A) PSE&G facility will be reduced by $4 million in March 2022. $50
(B) PSEG facilities will be reduced by $9 million in March 2022. PSE&G ST Investment $0
(C) PSEG Power facilities will be reduced by $12 million in March 2022. Total Liquidity Available $2,914
PSEG Money Pool ST Investment
32
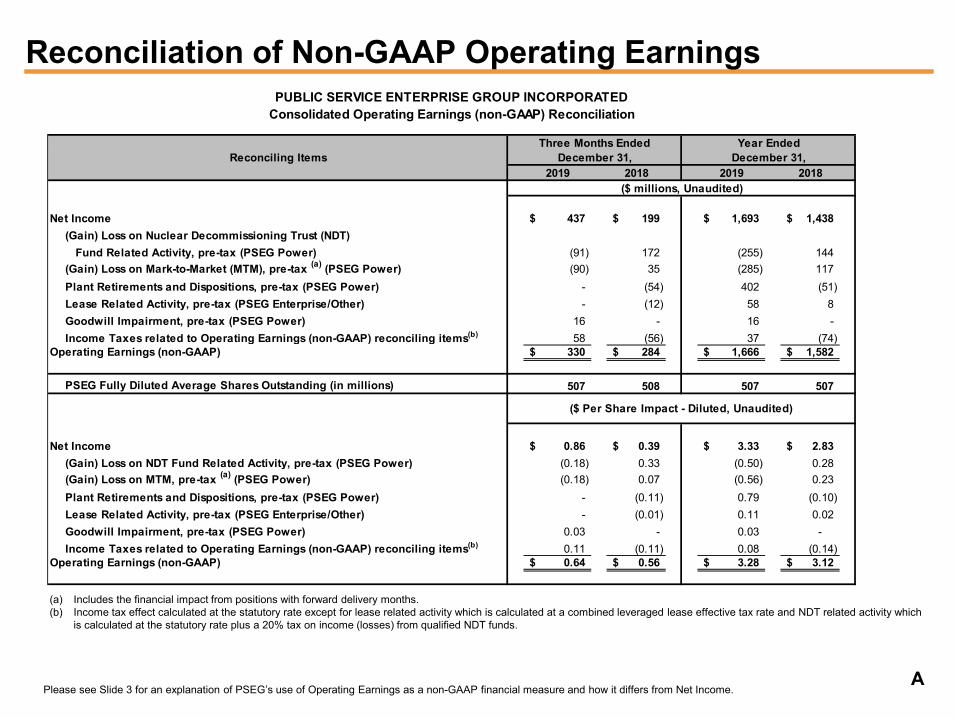
Reconciliation of Non-GAAP Operating Earnings
Please see Slide 3 for an explanation of PSEG’s use of Operating Earnings as a non-GAAP financial measure and how it differs from Net Income.
(a) Includes the financial impact from positions with forward delivery months.(b) Income tax effect calculated at the statutory rate except for lease related activity which is calculated at a combined leveraged lease effective tax rate and NDT related activity which
is calculated at the statutory rate plus a 20% tax on income (losses) from qualified NDT funds.
2019 2018 2019 2018
Net Income 437$ 199$ 1,693$ 1,438$ (Gain) Loss on Nuclear Decommissioning Trust (NDT)
Fund Related Activity, pre-tax (PSEG Power) (91) 172 (255) 144 (Gain) Loss on Mark-to-Market (MTM), pre-tax (a) (PSEG Power) (90) 35 (285) 117 Plant Retirements and Dispositions, pre-tax (PSEG Power) - (54) 402 (51) Lease Related Activity, pre-tax (PSEG Enterprise/Other) - (12) 58 8 Goodwill Impairment, pre-tax (PSEG Power) 16 - 16 - Income Taxes related to Operating Earnings (non-GAAP) reconciling items(b) 58 (56) 37 (74)
Operating Earnings (non-GAAP) 330$ 284$ 1,666$ 1,582$
PSEG Fully Diluted Average Shares Outstanding (in millions) 507 508 507 507
Net Income 0.86$ 0.39$ 3.33$ 2.83$ (Gain) Loss on NDT Fund Related Activity, pre-tax (PSEG Power) (0.18) 0.33 (0.50) 0.28 (Gain) Loss on MTM, pre-tax (a) (PSEG Power) (0.18) 0.07 (0.56) 0.23 Plant Retirements and Dispositions, pre-tax (PSEG Power) - (0.11) 0.79 (0.10) Lease Related Activity, pre-tax (PSEG Enterprise/Other) - (0.01) 0.11 0.02 Goodwill Impairment, pre-tax (PSEG Power) 0.03 - 0.03 - Income Taxes related to Operating Earnings (non-GAAP) reconciling items(b) 0.11 (0.11) 0.08 (0.14)
Operating Earnings (non-GAAP) 0.64$ 0.56$ 3.28$ 3.12$
December 31,Year Ended
December 31,
PUBLIC SERVICE ENTERPRISE GROUP INCORPORATEDConsolidated Operating Earnings (non-GAAP) Reconciliation
Three Months EndedReconciling Items
($ millions, Unaudited)
($ Per Share Impact - Diluted, Unaudited)
A
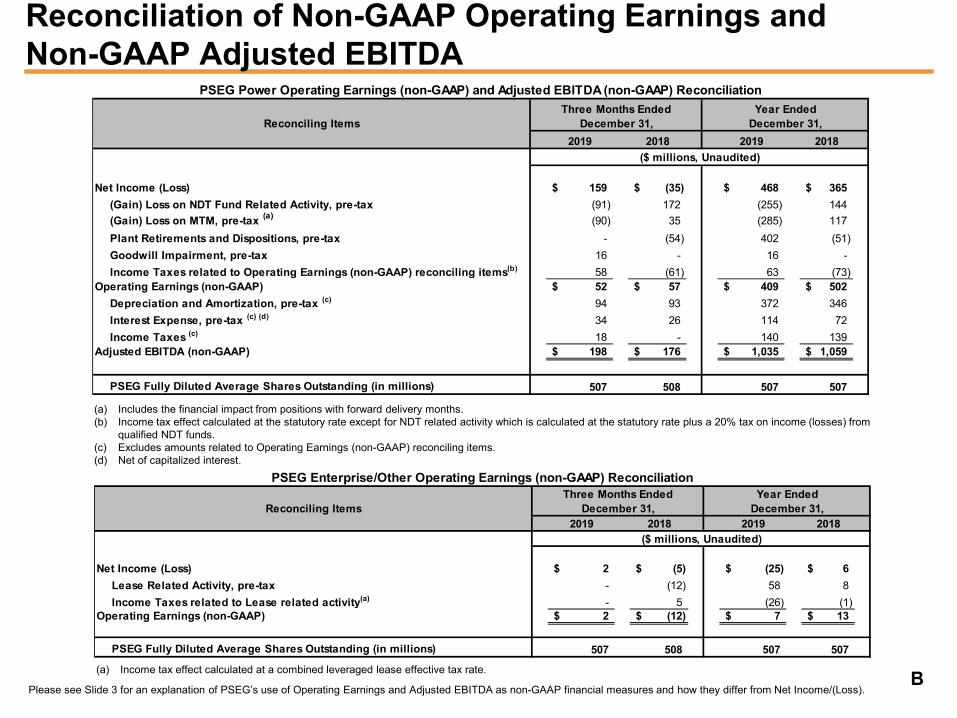
Reconciliation of Non-GAAP Operating Earnings and Non-GAAP Adjusted EBITDA
Please see Slide 3 for an explanation of PSEG’s use of Operating Earnings and Adjusted EBITDA as non-GAAP financial measures and how they differ from Net Income/(Loss).
(a) Income tax effect calculated at a combined leveraged lease effective tax rate.
2019 2018 2019 2018
Net Income (Loss) 159$ (35)$ 468$ 365$ (Gain) Loss on NDT Fund Related Activity, pre-tax (91) 172 (255) 144 (Gain) Loss on MTM, pre-tax (a) (90) 35 (285) 117 Plant Retirements and Dispositions, pre-tax - (54) 402 (51) Goodwill Impairment, pre-tax 16 - 16 - Income Taxes related to Operating Earnings (non-GAAP) reconciling items(b) 58 (61) 63 (73)
Operating Earnings (non-GAAP) 52$ 57$ 409$ 502$ Depreciation and Amortization, pre-tax (c) 94 93 372 346 Interest Expense, pre-tax (c) (d) 34 26 114 72 Income Taxes (c) 18 - 140 139
Adjusted EBITDA (non-GAAP) 198$ 176$ 1,035$ 1,059$
PSEG Fully Diluted Average Shares Outstanding (in millions) 507 508 507 507
PSEG Power Operating Earnings (non-GAAP) and Adjusted EBITDA (non-GAAP) ReconciliationThree Months Ended Year Ended
December 31,Reconciling Items December 31,
($ millions, Unaudited)
(a) Includes the financial impact from positions with forward delivery months.(b) Income tax effect calculated at the statutory rate except for NDT related activity which is calculated at the statutory rate plus a 20% tax on income (losses) from
qualified NDT funds.(c) Excludes amounts related to Operating Earnings (non-GAAP) reconciling items.(d) Net of capitalized interest.
2019 2018 2019 2018
Net Income (Loss) 2$ (5)$ (25)$ 6$ Lease Related Activity, pre-tax - (12) 58 8 Income Taxes related to Lease related activity(a) - 5 (26) (1)
Operating Earnings (non-GAAP) 2$ (12)$ 7$ 13$
PSEG Fully Diluted Average Shares Outstanding (in millions) 507 508 507 507
December 31, December 31,
($ millions, Unaudited)
PSEG Enterprise/Other Operating Earnings (non-GAAP) Reconciliation
Reconciling ItemsThree Months Ended Year Ended
B