Public Sector Reform in Norway: Views and Experiences...
61
Public Sector Reform in Norway: Views and Experiences from Senior Executives Country Report as part of the COCOPS Research Project Per Lægreid Åsta Dyrnes Nordø Lise H. Rykkja May 2013 Coordination for Cohesion in the Public Sector of the Future (COCOPS): www.cocops.eu
Transcript of Public Sector Reform in Norway: Views and Experiences...

Public Sector Reform in Norway:
Views and Experiences from Senior Executives
Country Report as part of the COCOPS Research Project
Per Lægreid
Åsta Dyrnes Nordø
Lise H. Rykkja
May 2013
Coordination for Cohesion in the Public Sector of the Future (COCOPS): www.cocops.eu
COCOPS Work Package 3, Country Report Norway – May 2013 Page 2
About COCOPS
The COCOPS project (Coordinating for Cohesion in the Public Sector of the Future) seeks to
comparatively and quantitatively assess the impact of New Public Management-style reforms in
European countries, drawing on a team of European public administration scholars from 11
universities in 10 countries. It analyses the impact of reforms in public management and public
services that address citizens’ service needs and social cohesion in Europe. Evaluating the extent and
consequences of NPM’s alleged fragmenting tendencies and the resulting need for coordination is a
key part of assessing these impacts. It is funded under the European Union’s 7th Framework
Programme as a Small or Medium-Scale Focused Research Project (2011-2014).
About the Authors
Per Lægreid is professor at the Department of Administration and Organization Theory, University of
Bergen
Åsta Dyrnes Nordø is a research assistant at Stein Rokkan Centre for Social Research, Bergen
Lise Hellebø Rykkja is a Post doc Fellow at the Department of Administration and Organization
Theory, university of Bergen.
The research leading to these results has received funding from the European Union’s Seventh
Framework Programme under grant agreement No. 266887 (Project COCOPS), Socio-economic
Sciences & Humanities. The Norwegian team also want to thank Department of Administration and
Organization Theory, University of Bergen for financial support.
ISSN 2211-2006

COCOPS Work Package 3, Country Report Norway – May 2013 Page 3
Contents 1. Introduction ................................................................................................................................. 4
2. Context and Status Quo of Public Administration Reform in Norway ......................................... 8
3. Data and Method ....................................................................................................................... 12
4. Values and Attitudes of Public Sector Executives ...................................................................... 20
5. Characteristics of the Public Administration Work Context ...................................................... 24
6. Relevance of NPM and post NPM Reforms ............................................................................... 29
7. Impact of the Fiscal Crisis on Public Administration .................................................................. 37
8. Impact of Public Administration Reform ................................................................................... 40
9. Findings from the Employment and Health sectors .................................................................. 45
10. Conclusion .................................................................................................................................. 51
List of Figures ......................................................................................................................................... 56
References ............................................................................................................................................. 57
COCOPS Work Package 3, Country Report Norway – May 2013 Page 4
1. Introduction1 Coordinating for Cohesion in the Public Sector of the Future (COCOPS), as one of the largest
comparative public management research projects in Europe, intends to provide a comprehensive
picture of the challenges facing the public sector in European countries and to systematically explore
the impact of New Public Management (NPM)-style reforms in Europe. The project brings together
public administration scholars from eleven universities in ten countries2 and is funded as part of the
European Union’s 7th Framework Programme between January 2011 and June 2014.3 The research is
comparative and evidence-based, drawing on both existing data and innovative new quantitative and
qualitative data collection, at both national and policy sector levels. A cornerstone of the project is
the COCOPS Executive Survey on Public Sector Reform in Europe: an original, large-scale survey of
public sector top executives in ten European countries, exploring executives’ opinions and
experiences with regards to public sector reforms in general government, as well as more particularly
in the health and employment policy sectors.
Scholars within the public administration discipline have long underlined the need for more
quantitative and rigorous comparative research, going beyond single-country and single-organization
approaches (see Derlien, 1992; Fitzpatrick et al., 2011; Pollitt, 2011; Raadschelders and Lee, 2011).
Moreover, few research initiatives have explored in depth the transformation of public
administrations as triggered by NPM reform discourses in a systematic comparative form (Van de
Walle and Hammerschmid, 2011). Responding to such concerns, this survey offers systematic
evidence regarding the dynamics of public administration reform in Europe, with the goal to create
an encompassing and systematic picture of public administration after more than two decades of
NPM reforms.
From a theoretical perspective the survey builds on the perception of three major reform paradigms
(New Public Management, Public Governance and the Neo-Weberian State) as described by Pollitt
and Bouckaert (2011). Focusing on top executives, it follows pioneering elite studies such as those of
Aberbach, Putnam and Rockman (see Putnam 1976, Aberbach et al., 1981, and Aberbach and
Rockman, 2006), which lay the foundation for many other both national and cross-national executive
surveys (e.g. Mayntz and Derlien, 1988; Christensen and Laegreid, 2007; Bertelli et al., 2007; Trondal,
2010; Bauer et al., 2009; COBRA survey; UDITE survey).
Methodologically it also draws inspiration from cross-national population surveys such as the
European Social Science Survey, European Values Survey, the International Social Survey Program; as
well as from experiences with cross-national surveys such as those of the Survey Research Centre at
the University of Michigan (2010).
As set out by the project's terms of reference the goal of this large-scale survey is to analyse national
administrations (both ministries and agencies) in the participating countries and also to take a closer
look at the policy fields employment and health. The survey aims to explore public sector executives´
1
This introduction is based on Hammeschmid, Görnitz, Oprisor and Stimac (2013), and is standardized for all
WP3 COCOPS country reports. 2
Erasmus University Rotterdam, Hertie School of Governance Berlin, University of Bergen, Bocconi University, University of Cantabria, Cardiff University, CNRS Paris, Corvinus University Budapest, University of Exeter, KU Leuven, Tallinn University of Technology 3 More information on the project is available at www.cocops.eu

COCOPS Work Package 3, Country Report Norway – May 2013 Page 5
perceptions, experiences and opinions with regards to their work context and administrative
reforms, but also on other factors such as values and identities and the impact of the fiscal crisis. The
core survey implemented in all participating countries consists of 31 questions structured in four
parts (I) General information; (II) Management and Work Practice of Your Organization; (III) Public
Sector Reform and the Fiscal Crisis; (IV) Attitudes, Preferences and Personal Information. The survey
is a result of the joint work of all the national research teams within the COCOPS project and under
the leadership of a team of researchers at the Hertie School of Governance in Berlin. In addition,
further universities from other European countries were included as strategic partners to replicate
the survey in these countries.4
Three essential challenges connected to the design of the questionnaire and the survey methodology
had to be handled by the research team: a sample design that would allow systematic comparative
analyses; an access strategy to produce (statistically sufficient) high response rates; and a
questionnaire design and translation that would assure conceptual equivalence between all
countries. As a general principle, the survey team opted for a balanced and pragmatic approach with
a view on a maximum of quality and comparability, while still allowing for sufficient flexibility within
each country’s context. A core questionnaire developed by the survey team in English was translated
into country-specific versions by the respective national research teams and – if assumed helpful –
optional questions were added. With regards to the population definition, the research team
targeted a group with relevant experience to assess overall developments and trends both on an
organizational and policy field level. In general, top executives are viewed as such informants
regarding the state of administration, given their privileged vantage point (Walker and Enticott,
2004), but also, with the blurring of the classical boundaries between politicians and civil servants
(Aberbach et al., 1981), due to their own role in policy-making and their influence on the choice and
implementation of reforms (Christensen and Lægreid, 1999; Ridder et al., 2006). A major critique
raised against elite surveys however (see in particular Enticott et al., 2008) is that they usually focus
on a limited selection of individuals at the top of the organization. As these individuals are relatively
disconnected from processes at lower levels in the organizations, and also due to issues of
desirability, such an approach is bound to provide a biased image of the respective organization(s).
These are important points to take into consideration when interpreting the results.
In order to avoid random sampling and issues of representativeness, the COCOPS executive survey is
based on a full census of all central government ministries and agencies. It covers all high level public
sector executives who in their respective positions can be expected to be involved in public
administration reform processes. A core set of binding sample principles, based on a detailed
mapping of national administrative structures, was followed by all teams in all central government
areas and especially in the case of employment and health. Deviations were only allowed if precise
equivalence could not be established due to the specificity of administrative structures. Local
government and service delivery levels were excluded for the purpose of this survey. Generally,
within all central government ministries and subordinated agencies the two top-administrative levels
were addressed; in some cases invitations were also sent to executives on the third level if, due to
their policy relevance, this was deemed appropriate. State-owned enterprises and audit courts were
not included due to their different task repertoire. In the fields of employment and health, as special
4 The Vienna University of Economics and Business for Austria, the Kaunas University of Technology for Lithuania, the Technical University of Lisbon for Portugal, Copenhagen Business School, the Belgrade Fund for Political Excellence for Serbia and the University of Bern for Switzerland
COCOPS Work Package 3, Country Report Norway – May 2013 Page 6
focus areas, regional and state government ministries and agencies were also included if relevant –
without addressing however direct service delivery levels (e.g. hospitals, job centers).
Moreover, the survey explicitly covers different units of analysis (see Pollitt 2011: 121, on units of
analysis in comparative public administration research) to allow for multi-level analyses: policy field,
organization and individual experiences of the respondent. These are explored through the
(self)perceptions of public sector executives, acknowledged in research as the closest channel into
objective processes and developments within public organizations and, at least in the absence of
stringent limitations, as reliable predictors of administrative behaviour (see Aberbach et al., 1981;
Bauer et al., 2009).
The survey was implemented online, with standardized webpages being built in the national
language(s) for each country. Flexibility was allowed, and even recommended, in the data collection
strategies used by national teams, due to major differences in administrative cultures between the
countries. A major emphasis was put on a thorough data cleaning and harmonization at the end of
the survey, to make sure that final results were comparable across countries and that any deviations
allowed during the implementation process were explained and controlled.5
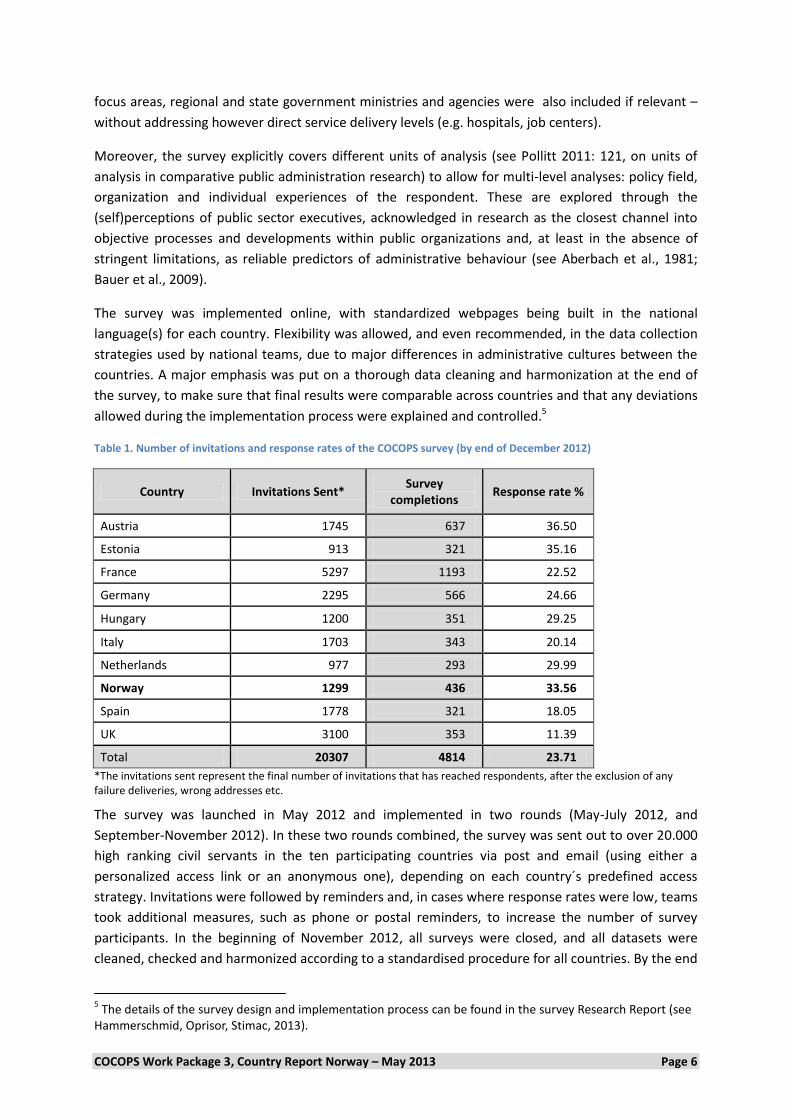
Table 1. Number of invitations and response rates of the COCOPS survey (by end of December 2012)
Country Invitations Sent* Survey
completions Response rate %
Austria 1745 637 36.50
Estonia 913 321 35.16
France 5297 1193 22.52
Germany 2295 566 24.66
Hungary 1200 351 29.25
Italy 1703 343 20.14
Netherlands 977 293 29.99
Norway 1299 436 33.56
Spain 1778 321 18.05
UK 3100 353 11.39
Total 20307 4814 23.71
*The invitations sent represent the final number of invitations that has reached respondents, after the exclusion of any failure deliveries, wrong addresses etc.
The survey was launched in May 2012 and implemented in two rounds (May-July 2012, and
September-November 2012). In these two rounds combined, the survey was sent out to over 20.000
high ranking civil servants in the ten participating countries via post and email (using either a
personalized access link or an anonymous one), depending on each country´s predefined access
strategy. Invitations were followed by reminders and, in cases where response rates were low, teams
took additional measures, such as phone or postal reminders, to increase the number of survey
participants. In the beginning of November 2012, all surveys were closed, and all datasets were
cleaned, checked and harmonized according to a standardised procedure for all countries. By the end
5 The details of the survey design and implementation process can be found in the survey Research Report (see
Hammerschmid, Oprisor, Stimac, 2013).
COCOPS Work Package 3, Country Report Norway – May 2013 Page 7
of 2012 there were 4814 valid answers available from ten participating countries and an overall
response rate of 23.7% (for details see Table 1). These answers are the basis for the respective
country reports. The data in both the national and the integrated datasets are subject to strict
anonymity regulations, to protect individual respondents, whereas aggregate data will be published
according to a set of rules commonly agreed upon by the research teams involved.
The current country report summarizes the findings for Norway along with some first comparisons
with the aggregate results from all of the ten validated surveys in Austria, Estonia, France, Germany,
Hungary, Italy, Netherlands, Norway, Spain and UK. A more systematic comparative report based on
these country reports will follow in summer 2013.

COCOPS Work Package 3, Country Report Norway – May 2013 Page 8
2. Context and Status Quo of Public Administration Reform in
Norway Norway is a small, multiparty parliamentary state. In a comparative perspective, it has a strong democratic tradition and relatively strong collectivistic and egalitarian values, is consensus-oriented and has well-developed corporatist arrangements with integrated participation in policy making from interest organizations. Civil service unions are pretty strong. The regime’s performance, support for democracy and the level of trust in public institutions are generally higher than in most other countries (Norris 1999, Christensen and Lægreid 2005), as is the general level of trust in society (Rothstein and Stolle 2003). The economic situation is good and the financial crisis in Europe has not had a great impact on Norway. The public sector in Norway is large, due mainly to a large, universal welfare state, and there is a relatively high level of mutual trust among public-sector organizations. Privatization reforms have been reluctant, but some critical infrastructure, such as telecommunication, has been partly privatized. Norway is a unitary state with a combination of political and administrative decentralization. The central government in Norway is characterized by strong sector ministries and relatively weak supra-ministries with coordination responsibilities across ministerial areas (Christensen 2003). The relationships between parliament, ministers and agencies are based on the principle of ministerial responsibility, meaning that the minister is responsible to the parliament for all activities within his or her policy areas in the ministry, as well as in subordinate bodies (Christensen and Lægreid 2002). Norway has a long tradition of central government agencies being responsible mainly for professional, regulatory and technical issues. There are 17 ministries and 62 central agencies in Norway. We also have 19 counties with both a delegated state authority to the Prefect and a regionally elected body (the county municipality). Adding to this many state agencies have their own regional bodies. The principle of local self-government is also rather strong. There are elected bodies at both local and regional level, which are expected to make and implement their own local policy without too much interference from central government but also to implement policy decided at the central level. The delivery of the most important welfare services is delegated to the 429 municipalities. Added to this, there are also government bodies at both local and regional level that are responsible for implementing central government policy. Norway has been a reluctant New Public Management (NPM) reformer (Olsen 1996). This is attributable to a combination of several factors. Historically, Norway’s political-administrative culture has been rather collectively oriented, attaching great importance to Rechtsstaat values and quality, and rather less to the individualism and efficiency, which have been prominent features of modern reforms (Christensen 2003). In recent decades, the pressure on Norway to engage in public reform has been rather low, reflecting a healthy economic situation and a well-functioning public apparatus. In addition, nearly three decades of minority governments up to 2005 have not created favorable reform conditions. Taken together, these factors produce a context that is not conducive to a strong public management reform path.
Even though Norway has been a reluctant NPM reformer, it has been influenced by international reform waves (Christensen and Lægreid 1998). In the mid-1980s Norway introduced two reform programs that reflected a NPM rhetoric, and the 1990s brought gradual reforms in the central government apparatus (Christensen and Lægreid 2001). The non-socialist parties pushed for public
COCOPS Work Package 3, Country Report Norway – May 2013 Page 9
reform rather early in the 1980s, although not very aggressively. Meanwhile, the Labour Party moved to the right on questions of administrative policy, accepting a gradual NPM course. The OECD increasingly put pressure on Norway to adopt more radical reforms from the 1990s. Eventually, this led to regulatory reform. Political polarization over public management reform has increased over the last 5–10 years, starting with some active moves towards reform by the Conservative-Centre government that was in office from 2001 to 2005.The Red-Green government that succeeded it is currently trying to amend or reverse some of the NPM measures installed.
Historically, Norway is a homogeneous society with many shared norms and values and a low level of conflict. These characteristics are reflected in the political-administrative system (Christensen and Peters 1999). The cabinet in Norway has comparatively strong collegial features, meeting frequently, favouring consensus and working as a team (Christensen and Lægreid 2002). Politicians and central civil servants share important norms and values, and trust one another. The Parliament also has a strong inclination towards consensus and collective decisions, and its relationship with the executive has traditionally been good and built on trust. Most citizens trust both central political and administrative institutions, and individual political and administrative actors. Furthermore, the system is traditionally characterized more by “meta-rules,” strong norm-building and socializing institutions than by detailed formal rules and incentive systems (Christensen and Peters 1999).
The Ministry of Government Administration has been responsible for the development of the various governments’ modernization and renewal programs (Lægreid and Roness 2003), starting with the Modernization Program of the Willoch government (1986) and the Renewal Program of the Brundtland government (1987), and followed by a White Paper on administrative and personnel policy (1992), the Jagland government’s “The Norwegian House” (1996), the program on a “Simplified Norway” of the Bondevik I government (1999), the Stoltenberg I government’s program for innovation in the public sector (2000), the program of the Bondevik II government labelled “From words to action” (2002), and the program “Renewal of the Public Sector” of the Stoltenberg II government (2005). These reform programs represent a loose collection of on-going reform measures and new reform ideas more than a consistent, coordinated and unified strategic plan for changing the administrative apparatus. They have, however, played an important symbolic role and have affected the public discourse on administrative policy and public-sector reforms. Generally, there has been a rather strong consensus on administrative policy, and only minor differences in the reform programs from one government to the next. The issue of privatization is an exception and tends to follow the ideological cleavage between the Right and the Left in Norwegian politics.
The Norwegian policy style, characterized by compromises, has largely produced reform programs that are focused on maintenance, modernization and efficiency measures aimed at retaining a big public sector rather than marketization, privatization and downsizing the state (see Pollitt and Bouckaert 2011, Wright 1994).The reforms have normally been implemented by strong sectoral ministries and not by the Ministry of Government Administration, however. Typical examples are the Budget Reform (implemented by the Ministry of Finance), the Hospital Reform (implemented by the Ministry of Health), the Welfare Administration Reform (Ministry of Labour and Social Inclusion), The Police Reforms (Ministry of Justice), the reform of food control (Ministry of Health and Ministry of Agriculture) and the Quality Reform for universities and higher education (Ministry of Education and Research). Thus, sector-based central government has carried out sector-oriented reforms (Lægreid, Roness and Rolland 2013), producing structured pluralism rather than uniformity and universality.
A process of internal structural devolution started in the 1980s. This was brought about partly by an intention of making administrative rules and regulations more flexible. Ordinary agencies were given more autonomy in personnel and financial matters and to some extent in substantial policy issues as well. One important feature of internal structural devolution in the central administrative apparatus has been the gradual autonomization of ordinary agencies over the last decade or so. This has consisted chiefly of internal delegation of authority to agencies, accompanied by a more formalized
COCOPS Work Package 3, Country Report Norway – May 2013 Page 10
performance-assessment regime. Another feature has been the autonomization of regulatory agencies. A second element has been external structural devolution – comprising the establishment of new, autonomous state-owned companies (SOCs) or the reorganization of public enterprises into such companies. Until 1992, major public domains like the railways, telecommunications, the power supply, postal services, forestry, grain sales, public broadcasting, road construction and airport administration were organized as central agencies or more integrated government-administrated enterprises. Since then, the commercial parts of these enterprises have been corporatized, i.e. established as various types of SOCs, while the regulatory parts have retained their agency form. There has, however, not been a linear and steady growth towards more agencification and corporatization (Lægreid, Roness and Rolland 2013). In addition to the structural reform measures, Management by Objectives and results (MBOR), made mandatory from 1990 (Lægreid, Roness and Rubecksen 2006a), increased market orientation and contracting-out; increased managerial autonomy and the use of leadership contracts, service declarations, and the introduction of one-stop shops exemplifies other initiatives. Summing up, since the 1980s the centralized state model in Norway has been challenged, primarily through structural devolution. The gradual creation of more independent agencies and state-owned companies meant that subordinate organizational units were moved further away from political executive leaders (Christensen and Lægreid 2003). In the period 2001–2005 the Centre-Conservative government adopted some ideas from the neo-liberalist doctrine and implemented them in regulatory, health and education reforms. By focusing on performance management, single-purpose-organizations and structural devolution,
the reforms have reinforced vertical coordination, but tend to ignore the problems of horizontal
coordination (Fimreite and Lægreid 2005). Horizontal coordination represents a pressing problem in
the Norwegian political-administrative system, but has not been emphasised in the reforms of the
past decades. Still, the challenges from wicked transboundary problems have recently been put
higher on the reform agenda. This can be exemplified by the reform of the welfare administration
and in recent renewed attention to cross-boundary internal security issues.
The Centre-Conservative government in power from 2001 to 2005 had a rather typical neo-liberal
agenda, and pursued reforms that had a hybrid character and some important post-NPM features
(Christensen and Lægreid 2010). One example is the hospital reform, which combined centralization,
thus potentially increasing central political control, with devolution (Lægreid, Opedal and Stigen
2005). The reform was decided by the labour minority government in 2001 but was implemented by
the Centre-Right minority government in 2002. It transferred the ownership of hospitals from the
counties to central government and transformed the hospitals from public administration units into
health enterprises. Another example is the merging of the central administrative sectors of
employment and national insurance administration into a new agency for work and welfare, which
collaborates through partnership agreements with the social services run by local authorities in local
one-stop shops (Christensen, Fimreite and Lægreid 2007). The reform was decided in 2005 and
implemented through 2012, and represents the largest administrative reform ever carried through in
Norway. A third example is the Quality Reform in university and higher educations in 2003 (Bleiklie
2009). The reform introduced a new incentive based and output oriented funding system, a new
system of accreditation and quality assurance, a new study program, and a new system for
leadership and institutional steering inspired by New Public Management. A fourth example is the

COCOPS Work Package 3, Country Report Norway – May 2013 Page 11
attempt to strengthen control of the central immigration administration, which had gained
institutional autonomy following its reorganization in 2001 (Christensen and Lægreid 2009b).
The current Red-Green coalition won the 2005 elections on an anti-NPM ticket and was re-elected in
2009. The current Red-Green government emphasizes the participation of employees, a feature
atypical of the NPM-reforms implemented under the previous, Centre-Conservative government. The
current government also tends to stress collective features and societal solutions, voices support for
a large public sector, and is sceptical towards competitive tendering, out-sourcing and privatization.
Instead, it advocates the renewal and development of the public sector, though just how this is to be
done is not very clearly defined. The Red-Green government also emphasizes the more classical post-
NPM features of coordination and a holistic perspective. It is rather sceptical about structural
devolution and pays more attention to ICT and digitalization. In a White Paper from 2009 titled “An
Administration for Democracy and Community”, the government’s main aim in its administrative
policy is to combine political control, broad participation and an efficient use of resources (St. meld.
19 (2008-2009)). This indicates a reform break more than a new reform wave. The white paper
presents a hybrid and multidimensional model combining core elements of NPM with partnerships,
community, participation and collaboration (Christensen and Lægreid 2011a).
Hence, the current government has rebalanced some NPM features by introducing several small
changes. The work and welfare reform was initiated by the former government, but implemented by
the current government (Christensen, Fimreite and Lægreid 2007). Some privatization, cut-back
management and competitive tendering has been stopped. This is the case in the organization of the
railways infrastructure. Also, the law on private schools has been changed, making it less easy to
establish and get public support for private schools. The government has established a new
ownership policy for state-owned enterprises, saying no to options programs for directors and trying
to control them more. Finally, the government is now trying to control the immigration
administration more. These examples demonstrate a move away from structural devolution and
towards a strengthening of the centre.
A conclusion is that the current government is ridden with tensions between the two reform waves
of NPM and post-NPM. Many of the changes made gradually over the years, like structural
devolution, are not easy to reverse. Furthermore, there is disagreement within the coalition about
what approach to take to reforms. Thus, the policy has in practice consisted more of rebalancing
than transforming the NPM features introduced in the public sector (Christensen, Lie and Lægreid
2007). The reform processes can be characterised as layering processes, combining old public
administration, new public management and whole-of-government reforms, resulting in more
complex and hybrid organizational forms (Christensen and Lægreid 2011b).

COCOPS Work Package 3, Country Report Norway – May 2013 Page 12
3. Data and Method
3.1 Sampling and Access Strategy and Survey Implementation The Norwegian COCOPS survey was conducted by a team of researchers at the University of Bergen,
Department of Administration and Organization Theory. According to the chosen sampling strategy,
respondents from the top three administrative levels within the 17 Norwegian ministries were
included for the central government policy area. At the upper level this included 18 Secretary
Generals.6 At the second level all Director Generals were included (121), and at the third level all
Heads of Department (about 500).
At the agency level, all agencies listed as central administrative bodies were included (62 bodies).
Previous research shows that agencies and other bodies at arm’s length from political authorities are
defined and identified differently across countries (Verhoest, van Thiel, Bouckaert and Lægreid
2012). In our case, a minimum definition was used, meaning that only state agencies outside the
ministries were included, while state-owned companies and government foundations were not. In
our case, state agencies are characterized as semi-autonomous organizations without legal
independence but with some managerial autonomy (van Thiel 2012). At agency level, respondents
from the top two administrative levels were included.
The employment sector included respondents from the top two administrative levels with the
Norwegian Labour and Welfare administration (NAV) at central level. The sample also included all
respondents from the top administrative level within 19 County units of NAV (NAV Fylke) and
directors of NAV Special Units. Local NAV offices responsible for service delivery at the local level
were not included.
The health sector included respondents from the top two administrative levels in central
government. Here, an exception to the rule of only including state agencies was implemented and
respondents from the top two levels of four regional health enterprises in Norway were included in
order to get a balance of respondents from both the employment and the health sector. Also, 19
County medical officers were included. Service delivery at lower level (i.e. individual hospitals and
the municipality level) was not included.
Based on previous positive experience and considering limited time and resources, an access strategy
based solely on e-mail invitations was chosen. Respondents were sent an invitation by e-mail with a
link to the electronic web survey. A PDF version of the questionnaire was also available on the survey
webpage with an option to return the questionnaire by post. In the end, no postal questionnaires
were returned.
In order to check for any problems of errors, a survey pilot was sent to 10 individual respondents
with a background from public administration and research April 17, 2012. The original e-mail
invitations to participate were then distributed on June 7, 2012. Two reminders were sent within the
next weeks, the first June 18, 2012 and the second June 22, 2012.
The first round of e-mail invitations revealed a technical access problem for the respondents working
within the NAV administration. Due to internal firewalls, respondents from NAV could not enter the
6 State Secretaries are politically appointed and were therefore not included.
COCOPS Work Package 3, Country Report Norway – May 2013 Page 13
survey from their work computers. In order to solve this, both practically and technically, it was
decided to resend the questionnaire to respondents from NAV after the summer and after the
technical barriers had been removed. This was done on September 24, 2012, with two reminders in
the weeks following (October 2 and October 10, 2012).
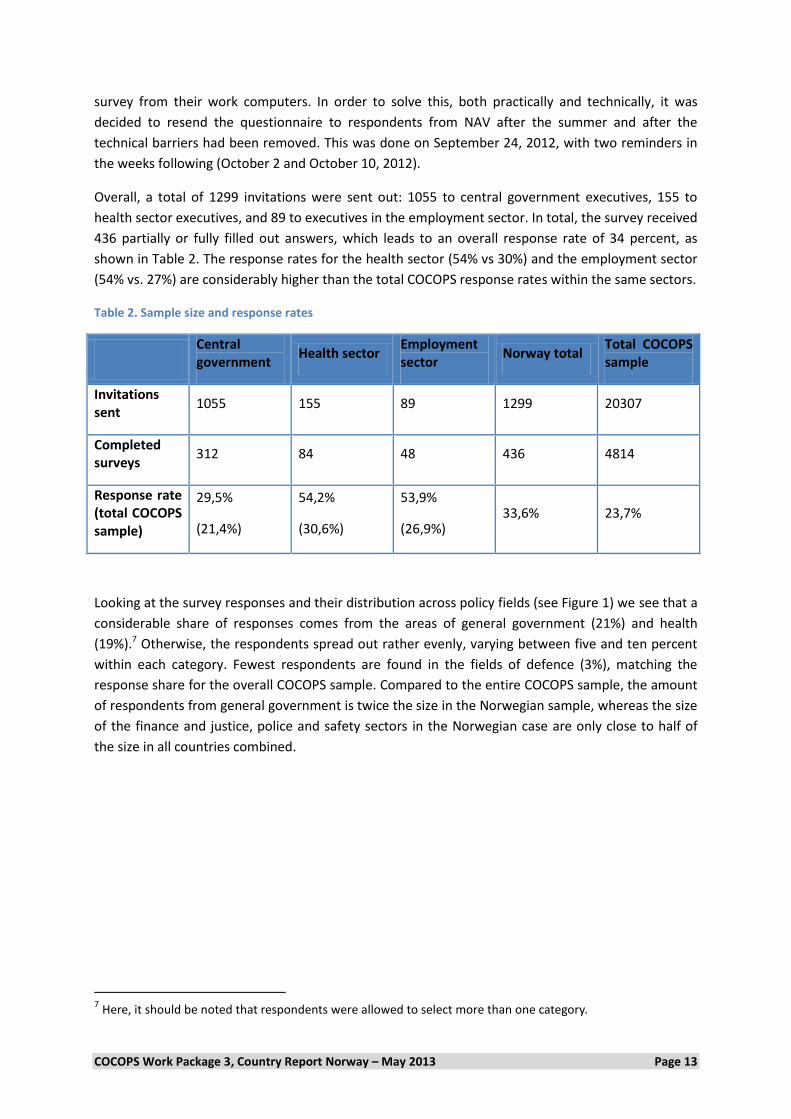
Overall, a total of 1299 invitations were sent out: 1055 to central government executives, 155 to
health sector executives, and 89 to executives in the employment sector. In total, the survey received
436 partially or fully filled out answers, which leads to an overall response rate of 34 percent, as
shown in Table 2. The response rates for the health sector (54% vs 30%) and the employment sector
(54% vs. 27%) are considerably higher than the total COCOPS response rates within the same sectors.
Table 2. Sample size and response rates
Central government
Health sector Employment sector
Norway total Total COCOPS sample
Invitations sent
1055 155 89 1299 20307
Completed surveys
312 84 48 436 4814
Response rate (total COCOPS sample)
29,5%
(21,4%)
54,2%
(30,6%)
53,9%
(26,9%) 33,6% 23,7%
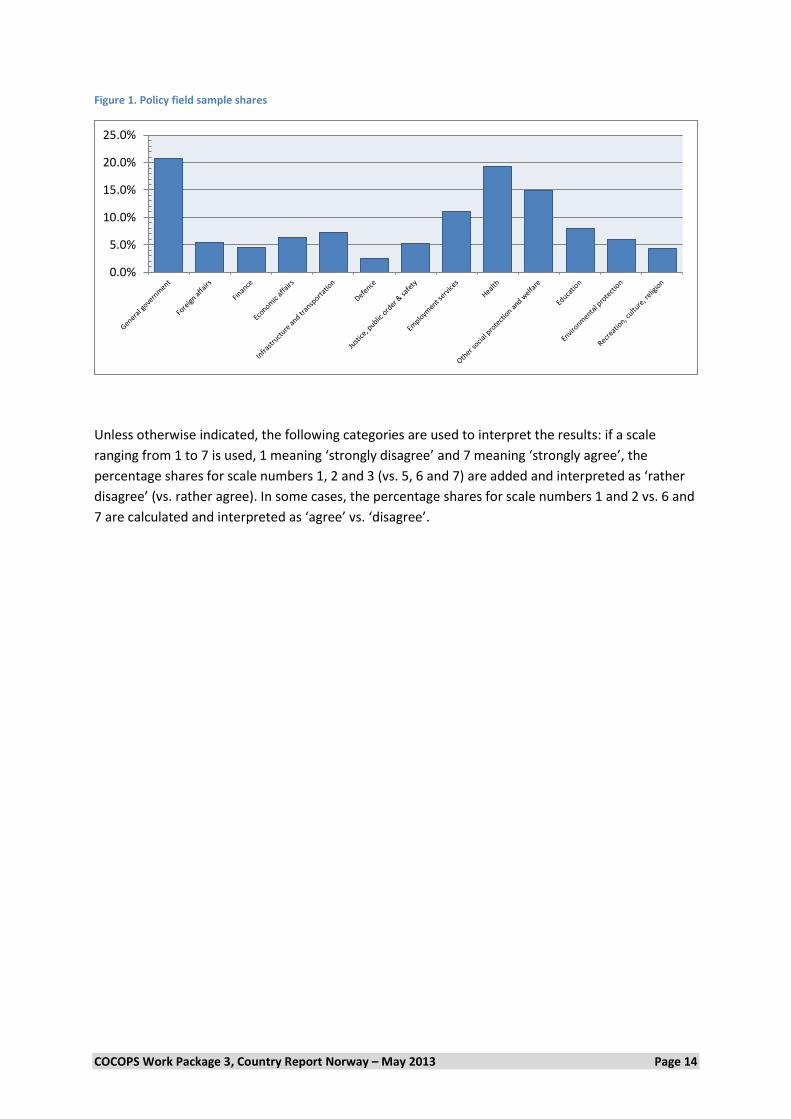
Looking at the survey responses and their distribution across policy fields (see Figure 1) we see that a
considerable share of responses comes from the areas of general government (21%) and health
(19%).7 Otherwise, the respondents spread out rather evenly, varying between five and ten percent
within each category. Fewest respondents are found in the fields of defence (3%), matching the
response share for the overall COCOPS sample. Compared to the entire COCOPS sample, the amount
of respondents from general government is twice the size in the Norwegian sample, whereas the size
of the finance and justice, police and safety sectors in the Norwegian case are only close to half of
the size in all countries combined.
7 Here, it should be noted that respondents were allowed to select more than one category.
COCOPS Work Package 3, Country Report Norway – May 2013 Page 14
Figure 1. Policy field sample shares
Unless otherwise indicated, the following categories are used to interpret the results: if a scale
ranging from 1 to 7 is used, 1 meaning ‘strongly disagree’ and 7 meaning ‘strongly agree’, the
percentage shares for scale numbers 1, 2 and 3 (vs. 5, 6 and 7) are added and interpreted as ‘rather
disagree’ (vs. rather agree). In some cases, the percentage shares for scale numbers 1 and 2 vs. 6 and
7 are calculated and interpreted as ‘agree’ vs. ‘disagree’.
0.0%
5.0%
10.0%
15.0%
20.0%
25.0%
COCOPS Work Package 3, Country Report Norway – May 2013 Page 15
3.2 Organizational Context of Respondents
Before exploring respondents’ opinions and attitudes towards their role and work in public
administration it is important to establish some of the key contextual features that set the
organizational and personal background of the respondents as described in chapters 4 to 8.
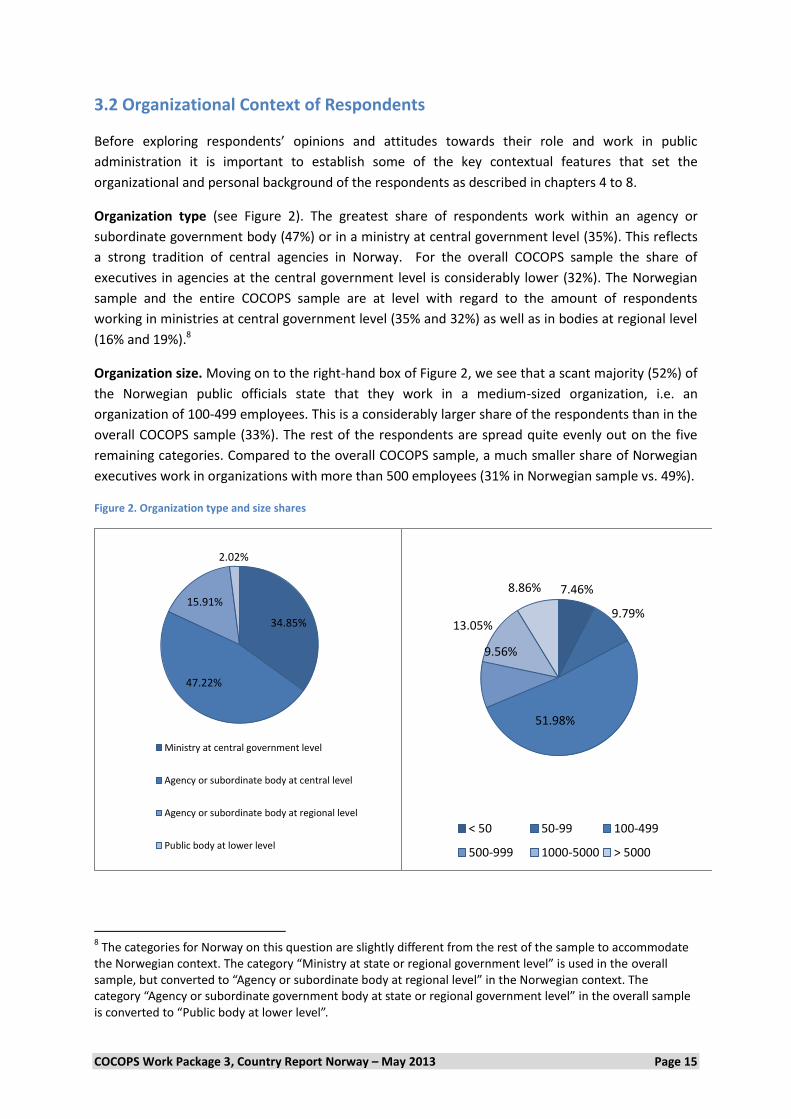
Organization type (see Figure 2). The greatest share of respondents work within an agency or
subordinate government body (47%) or in a ministry at central government level (35%). This reflects
a strong tradition of central agencies in Norway. For the overall COCOPS sample the share of
executives in agencies at the central government level is considerably lower (32%). The Norwegian
sample and the entire COCOPS sample are at level with regard to the amount of respondents
working in ministries at central government level (35% and 32%) as well as in bodies at regional level
(16% and 19%).8
Organization size. Moving on to the right-hand box of Figure 2, we see that a scant majority (52%) of
the Norwegian public officials state that they work in a medium-sized organization, i.e. an
organization of 100-499 employees. This is a considerably larger share of the respondents than in the
overall COCOPS sample (33%). The rest of the respondents are spread quite evenly out on the five
remaining categories. Compared to the overall COCOPS sample, a much smaller share of Norwegian
executives work in organizations with more than 500 employees (31% in Norwegian sample vs. 49%).
Figure 2. Organization type and size shares
8 The categories for Norway on this question are slightly different from the rest of the sample to accommodate
the Norwegian context. The category “Ministry at state or regional government level” is used in the overall sample, but converted to “Agency or subordinate body at regional level” in the Norwegian context. The category “Agency or subordinate government body at state or regional government level” in the overall sample is converted to “Public body at lower level”.
34.85%
47.22%
15.91%
2.02%
Ministry at central government level
Agency or subordinate body at central level
Agency or subordinate body at regional level
Public body at lower level
7.46%
9.79%
51.98%
9.56%
13.05%
8.86%
< 50 50-99 100-499
500-999 1000-5000 > 5000
COCOPS Work Package 3, Country Report Norway – May 2013 Page 16
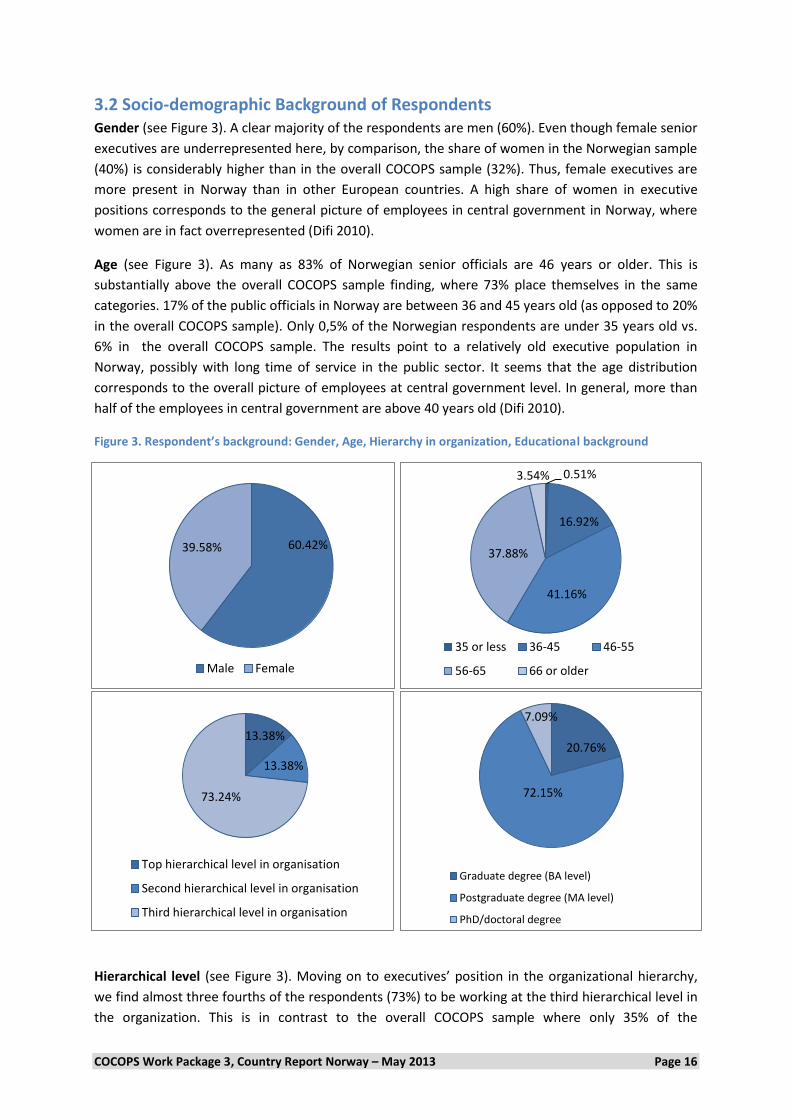
3.2 Socio-demographic Background of Respondents Gender (see Figure 3). A clear majority of the respondents are men (60%). Even though female senior
executives are underrepresented here, by comparison, the share of women in the Norwegian sample
(40%) is considerably higher than in the overall COCOPS sample (32%). Thus, female executives are
more present in Norway than in other European countries. A high share of women in executive
positions corresponds to the general picture of employees in central government in Norway, where
women are in fact overrepresented (Difi 2010).
Age (see Figure 3). As many as 83% of Norwegian senior officials are 46 years or older. This is
substantially above the overall COCOPS sample finding, where 73% place themselves in the same
categories. 17% of the public officials in Norway are between 36 and 45 years old (as opposed to 20%
in the overall COCOPS sample). Only 0,5% of the Norwegian respondents are under 35 years old vs.
6% in the overall COCOPS sample. The results point to a relatively old executive population in
Norway, possibly with long time of service in the public sector. It seems that the age distribution
corresponds to the overall picture of employees at central government level. In general, more than
half of the employees in central government are above 40 years old (Difi 2010).
Figure 3. Respondent’s background: Gender, Age, Hierarchy in organization, Educational background
Hierarchical level (see Figure 3). Moving on to executives’ position in the organizational hierarchy,
we find almost three fourths of the respondents (73%) to be working at the third hierarchical level in
the organization. This is in contrast to the overall COCOPS sample where only 35% of the
60.42% 39.58%
Male Female
0.51%
16.92%
41.16%
37.88%
3.54%
35 or less 36-45 46-55
56-65 66 or older
13.38%
13.38%
73.24%
Top hierarchical level in organisation
Second hierarchical level in organisation
Third hierarchical level in organisation
20.76%
72.15%
7.09%
Graduate degree (BA level)
Postgraduate degree (MA level)
PhD/doctoral degree
COCOPS Work Package 3, Country Report Norway – May 2013 Page 17
respondents state that they work at the third hierarchical level. One explanation can be that there
are differences between the original population of respondents from the countries included. In order
to reach a sufficiently high number of executives, and in the interest of reaching an acceptable
response rate, the population of respondents from the third hierarchical level in Norway was higher
than from the other countries included in the survey. From the bigger share of lower standing
executives in the Norwegian case, it follows that there is also a big discrepancy between the
Norwegian sample and the overall sample with regards to both amount of respondents in second
hierarchical level (13% vs. 40%) and top hierarchical level (13% vs. 24%) in organizations. Thus,
executives from the uppermost hierarchical level are not very prominent in the Norwegian case.
Education (see Figure 3). With regard to educational background, we see that a clear majority of all
respondents (72%) have a university degree at Master level, which is slightly higher than the same
share in the overall COCOPS sample (69%). However, the share of respondents with a doctoral
degree in Norway shows only half of the shares for the overall sample (7% vs. 16%), and there are
more senior officials with a Bachelor degree in Norway than the case is for all COCOPS countries
together (21% vs. 16% in the overall sample). This indicates that even though Norwegian senior
executives are clearly well educated, the executives in the other COCOPS-countries are even more
highly skilled.
Following up on public officials’ education, an overview of disciplinary fields of education9 (see
Figure 4) show that among Norwegian senior officials, business/management/economics (30%) is the
subject where most have their highest qualifications. Many of the respondents also state that they
have either political science/public administration (20%) or other social sciences and humanities
(21%) as their main educational field. The legal profession, which is the most frequent education for
the entire COCOPS sample (28%), is only the main field of education for 13% of the Norwegian
executives. Thus, whereas senior executives in the overall sample have a background in law or
business/economics, Norwegian bureaucracy is dominated by economists and social scientists. The
legal profession is, however, stronger represented among executives at the ministerial level
(Christensen and Lægreid 2009c).
9 Here, it should be noted that respondents could select more than one answer.

COCOPS Work Package 3, Country Report Norway – May 2013 Page 18
Figure 4. Educational fields (respondents could check more than one field)
With regard to question of tenure of office (see Figure 5), the results might mirror some of the key
characteristics for the Norwegian public administration, such as life-long careers in the civil service
and seniority-based promotion. More than half of the respondents (54%) have worked in the public
sector for more than twenty years. This is slightly below the overall sample result (58%). Also, only
3% of senior officials have a public sector experience of less than five years (vs. 14% in the overall
COCOPS sample). The general low mobility within the sector is indicated by a share of 46% of
Norwegian executives who have been working in the current organization for more than 10 years,
and 19% who have been in the same position for more than 10 years, reflecting a similar overall
pattern in the sample.
Looking more closely at senior officials’ experience outside the public sector, we see that a relatively
high share of the public sector executives has at least some private sector experience. Only 18% state
that they have no previous private sector work experience (lower than in the overall COCOPS sample
(27%), and 33% say they have 5 years’ work experience or more in the private sector (vs. 19% in the
overall sample.
Figure 5. Tenure of respondents
0%5%
10%15%20%25%30%35%
Law Business/management/
economics
Political science/public
administration
Other socialsciences andhumanities
Medical science Natural sciencesand engineering
0% 10% 20% 30% 40% 50% 60% 70% 80% 90% 100%
…in the public sector
…in your current organisation
…in your current position
…in the private sector
None Less than 1 year 1- 5 years 5-10 years 10-20 years More than 20 years
COCOPS Work Package 3, Country Report Norway – May 2013 Page 19
Summing up, compared to the general European picture the Norwegian executives in this survey are
to a greater extent located in central government agencies. A smaller share work in large
organizations and a larger group come from the third hierarchical level compared to the survey
results from the other European countries. There are relatively more women among the Norwegian
executives and the average age is pretty high. In this survey, Norwegian executives are dominated by
economists and social scientists, and the legal profession has a weaker position than in the general
sample. Similar to the rest of the sample, Norwegian executives predominantly follow a public sector
career.
COCOPS Work Package 3, Country Report Norway – May 2013 Page 20
4. Values and Attitudes of Public Sector Executives
The following section will present some data on how public sector executives in Norway perceive
their role as executives, their motivation and social values and preferences.
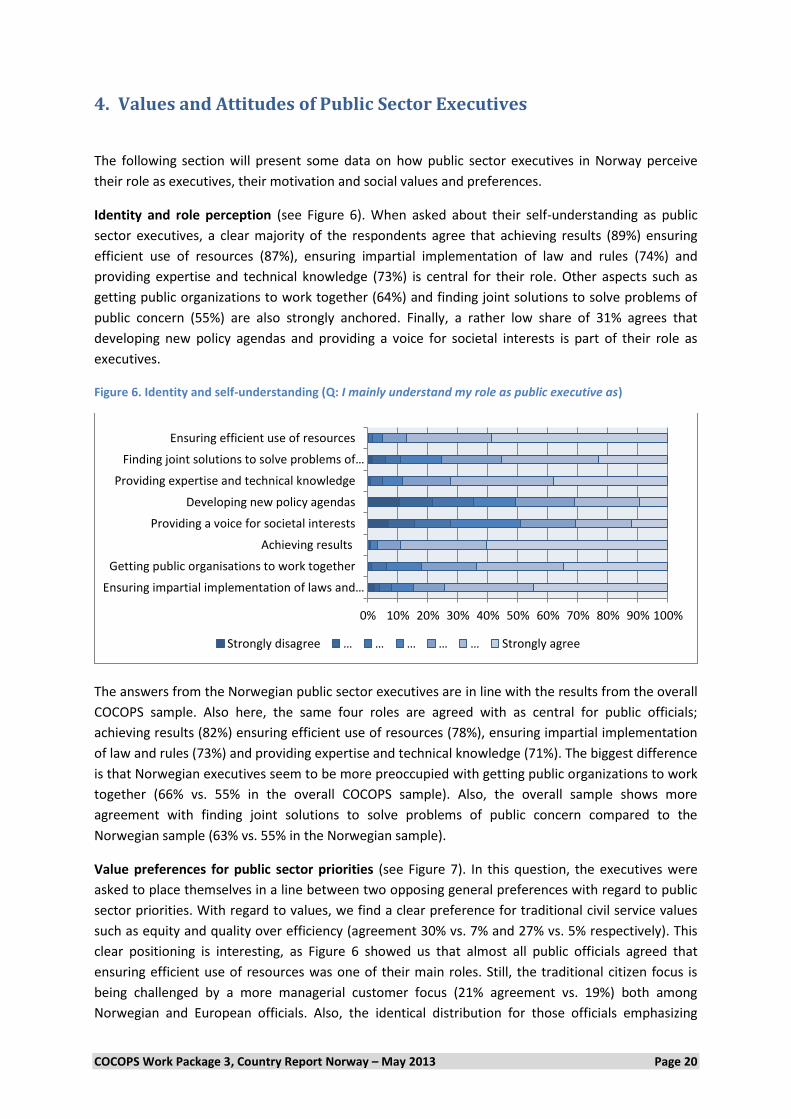
Identity and role perception (see Figure 6). When asked about their self-understanding as public
sector executives, a clear majority of the respondents agree that achieving results (89%) ensuring
efficient use of resources (87%), ensuring impartial implementation of law and rules (74%) and
providing expertise and technical knowledge (73%) is central for their role. Other aspects such as
getting public organizations to work together (64%) and finding joint solutions to solve problems of
public concern (55%) are also strongly anchored. Finally, a rather low share of 31% agrees that
developing new policy agendas and providing a voice for societal interests is part of their role as
executives.
Figure 6. Identity and self-understanding (Q: I mainly understand my role as public executive as)
The answers from the Norwegian public sector executives are in line with the results from the overall
COCOPS sample. Also here, the same four roles are agreed with as central for public officials;
achieving results (82%) ensuring efficient use of resources (78%), ensuring impartial implementation
of law and rules (73%) and providing expertise and technical knowledge (71%). The biggest difference
is that Norwegian executives seem to be more preoccupied with getting public organizations to work
together (66% vs. 55% in the overall COCOPS sample). Also, the overall sample shows more
agreement with finding joint solutions to solve problems of public concern compared to the
Norwegian sample (63% vs. 55% in the Norwegian sample).
Value preferences for public sector priorities (see Figure 7). In this question, the executives were
asked to place themselves in a line between two opposing general preferences with regard to public
sector priorities. With regard to values, we find a clear preference for traditional civil service values
such as equity and quality over efficiency (agreement 30% vs. 7% and 27% vs. 5% respectively). This
clear positioning is interesting, as Figure 6 showed us that almost all public officials agreed that
ensuring efficient use of resources was one of their main roles. Still, the traditional citizen focus is
being challenged by a more managerial customer focus (21% agreement vs. 19%) both among
Norwegian and European officials. Also, the identical distribution for those officials emphasizing
0% 10% 20% 30% 40% 50% 60% 70% 80% 90% 100%
Ensuring impartial implementation of laws and…
Getting public organisations to work together
Achieving results
Providing a voice for societal interests
Developing new policy agendas
Providing expertise and technical knowledge
Finding joint solutions to solve problems of…
Ensuring efficient use of resources
Strongly disagree … … … … … Strongly agree

COCOPS Work Package 3, Country Report Norway – May 2013 Page 21
achieving results and those preoccupied with following the rules (38% rather agree and rather
disagree) might indicate a turn among senior executives with regard to the focus on efficiency.
Furthermore, the strong support for tax financed public services as opposed to user charges (37%
agreement vs. 5%), should not be a surprise, as our welfare state is organized around tax financing.
We also see a strong support in favour of state provision, as opposed to market provision (38% vs.
5%). Thus, the traditional bureaucratic understanding of the state seems to stand tall, although we
see an increasing focus on efficiency, and a turn towards more customer-orientation.
Figure 7. Priorities as public servants (Q: Public services often need to balance different priorities. Where would you place your own position?)
Comparing the Norwegian sample with the results for the overall COCOPS sample , we find that
Norwegian officials represent a more traditional bureaucratic understanding of the state compared
to all officials partaking in the COCOPS survey. All in all, Norwegian public officials seem to be less
preoccupied with efficiency measures and customer-orientation than the case is in the rest of the
COCOPS-countries.
Motivation (see Figure 8). When Norwegian officials were asked to evaluate what motivates their
job, close to everyone agreed that interesting work (95% agreement) was important. There is also a
high level of agreement on the importance of being able to make decisions (76%) and doing
something that is useful to society (73%). Most officials were less preoccupied with status (15% agree
that it is important), followed by good opportunities for promotion (26%) and job security (31%).
With regard to flexible working hours (41% agreement), opportunities to help other people (41%)
and high income (31%), officials seem to think that this is important, but not the most defining issues
for their motivation. One should however keep in mind that these results are relative sizes, and that,
all in all, the majority of officials see most of these aspects as important in their everyday work.
0% 10% 20% 30% 40% 50% 60% 70% 80% 90% 100%
Quality - Efficiency
Equity - Efficiency
Following rules - Achieving results
Customer focus - Citizen orientation
State provision - Market provision
Tax financed services - User charges / fees

COCOPS Work Package 3, Country Report Norway – May 2013 Page 22
Figure 8. Motivation (Q: How important do you personally think it is in a job to have)
Comparing the findings for the entire sample, we see that all executives in the survey agree that,
interesting work, room to make decisions and doing something useful to society are the most
important motivations. Still, the overall sample shows that executives find good opportunities for
promotion (45% vs. 26% sees this as important), job security (43 vs. 28%) and status (24% vs. 15%) to
be more important than what was the case among Norwegian officials.
Social value preferences (see Figure 9). In a last value oriented question officials were asked about
their attitudes towards different aspects of life. We see that more than 77% of the Norwegian
officials place themselves in opposition to the statement that they avoid doing anything that might
upset the status quo. Also, all of the respondents place themselves at the positive side of the
spectrum with regard to the two statements: I make decisions and move on (82% agree) and I like
taking responsibility for making decisions (89% agree). Thus, Norwegian public officials consider
themselves to be rather progressive and vigorous. Still, only 19% of executives agree that they like
taking risks, and 67% of the respondents agree that success depends on ability rather than luck.
Furthermore, rather few officials agree that being successful is important to them (20%). Also, public
officials show a high degree of general trust, with 59% agreeing that most people can be trusted.
Last, a majority of the executives (58%) also agree that being creative and thinking up new ideas is
important to them.
0% 10% 20% 30% 40% 50% 60% 70% 80% 90% 100%
Interesting work
High income
Opportunities to help other people
Job security
Room to make decisions
Good opportunities for promotion
Doing something that is useful to society
Flexible working hours
Status
Not important at all … … … … … Very important

COCOPS Work Package 3, Country Report Norway – May 2013 Page 23
Figure 9. Social value preferences (Q: Please indicate how far you agree or disagree with the following statements)
A comparative perspective reveals that the European officials also perceive themselves as forward-
looking and responsible, with a clear majority agreeing that they make decisions and move on. They
also like taking responsibility for decisions. What is more, the same disagreement to the statement
that they do not want to upset the status quo, is present. Still, we see that European officials are
more risk prone (26% vs. 19%) and less trustful (42% vs. 59%) than their Norwegian counterparts.
Also, European executives seem more ambitious, focusing more on the importance of being
successful (39% vs. 20% in Norwegian sample). A smaller share agrees that success depends on ability
instead of luck (52% vs. 67% in Norwegian sample).
Summing up, the Norwegian executives in line with their European colleagues have multiple roles
focusing on performance, efficiency, impartiality, professionalism as well as finding joint solutions.
With regard to values we find a clear preference for traditional civil service values, such as equity and
quality over efficiency. In line with the Norwegian welfare state tradition we also find preferences for
tax financing as opposed to user charges and to state provision as opposed to market provision.
Taken together, Norwegian executives seem to be less preoccupied with efficiency measures and
customer-orientation than executives in other countries. The Norwegian executives are less
motivated by status, job security and promotions than their European colleagues, but agree that the
most important motive is to have interesting work, to be able to make decisions and to do something
that is useful for society. Norwegian executives are as the rest of the sample, forward-looking,
responsible and progressive, but they are less risk prone, less creative, less ambitious and more
trustful than executives in other countries.
0% 10% 20% 30% 40% 50% 60% 70% 80% 90% 100%
I believe that success depends on ability rather…
I like taking responsibility for making decisions
I make decisions and move on
Being creative and thinking up new ideas are…
I avoid doing anything that might upset the…
Being successful is very important to me
I like to take risks
I believe that most people can be trusted
Strongly disagree … … … … … Strongly agree Prefer not to answer

COCOPS Work Package 3, Country Report Norway – May 2013 Page 24
5. Characteristics of the Public Administration Work Context
This chapter analyses how Norwegian top civil servants perceive their work context and evaluates to
what extent the results indicate that management practices can be transferred successfully to Public
Administration.
When asked about goal ambiguity and measurability in their work context (see Figure 10),
Norwegian public sector executives appear to be rather sceptical about the possibility to observe and
measure their organization’s activities: 35% of the respondents agree that their activities can be
observed and measured easily while 37% disagree. This gives an impression that many officials do
not view their organizations as transparent. Nevertheless, the remaining replies indicate low levels of
goal ambiguity: More than 80% agree that their organization has a high number of goals, that the
organization’s goals are communicated to all staff, and that their goals are clearly stated.
Figure 10. Goal ambiguity and measurability (Q: To what extent do the following statements apply to your organization?) (n=428-434).
Norwegian executives are in line with the overall COCOPS sample with regard to the evaluation of
how easy it is to observe and measure their activities, representing 35% compared to 36%,
respectively. Thus, a limited openness around activities seems to be a characteristic of public
organizations in all partaking countries. On the other hand, the lower share of European colleagues
reporting that they have a rather high number of goals, show that Norwegian officials work in a more
goal oriented environment (65% in the overall COCOPS sample state that they have a rather high
number of goals, compared to 81% in Norway). When it comes to perception of stating and
communicating of goals, public executives from the Norwegian sample are more positive than the
rest. 85% in Norway and 78% in the rest of the survey perceive that goals are clearly stated, and 86%
of Norwegian officials state that goals are communicated to all while 73% in the overall sample say
the same.
Management autonomy (see Figure 10) is another variable asking further about the transferability of
management practices to the public sector. Norwegian officials feel they have a considerable degree
of autonomy with regard to policy implementation (83% rather agree), as well as hiring staff (80%
0% 10% 20% 30% 40% 50% 60% 70% 80% 90% 100%
Our goals are clearly stated
Our goals are communicated to all staff
We have a high number of goals
It is easy to observe and measure our activities
Strongly disagree … … … … … Strongly agree

COCOPS Work Package 3, Country Report Norway – May 2013 Page 25
rather agree). Also, close to half of the respondents rather agree that they have autonomy for
changes in the structure of their organization (49%), for promoting staff (50%) and for budget
allocations (51%). At the other end of the spectrum, 52% of Norwegian officials state that they have
rather low autonomy when contracting out services is considered. Also, 40% of executives confirm a
rather low autonomy with regard to policy choice and design. With regard to the last statements,
dismissing or removing staff, the respondents spread out quite evenly across the values, with
approximately 20 % placing themselves in the middle either/or option. All in all, the understanding
here is that public officials experience a rather high degree of autonomy in their everyday work
which is very much in line with previous findings (Lægreid et al. 2006b, 2012). This might reflect a
high level of mutual trust between ministries and agencies in Norway (Christensen and Lægreid
2008a).
Figure 11. Degree of management autonomy (Q: In my position, I have the following degree of autonomy with regard to) (n=425-435)
Compared to international experiences, Norwegian executives perceive a greater degree of
autonomy in almost all respects. This is especially the case for hiring staff (where 80% of Norwegian
respondents perceive a rather high degree of autonomy, compared to only 41% of the overall
sample), and for policy implementation (where 83% of Norwegian rather agree that they experience
high autonomy, compared to 62% in the international sample). Also, a higher share of Norwegian
executives reports a rather high autonomy in promoting staff (50% vs. 38% in the overall COCOPS
sample). Norwegian senior officials feel slightly less autonomous than their European counterparts
only with respect to policy choice and design (28% of Norwegian officials and 40% of overall
respondents feel a rather high degree of autonomy). Still, for both groups of officials, a rather low
degree of autonomy is the pattern here.
Interaction frequency (Figure 12) gives an overview of how often Norwegian public officials interact
with different institutions. The first thing one notices is that public officials are in closest contact with
the actors within their own organization – 93% interact daily with their direct staff, and 84% of
Norwegian executives interact at least weekly with their administrative superiors and higher
administrative levels and administrative units within their organization (budget, personnel, IT etc.),
respectively. Also, for subordinate agencies and bodies, most respondents keep contact at a weekly
basis, or more often (52%), whereas contact with their responsible minister is less frequent (32%
have at least monthly contact). Among the outside actors, contact with officials in other departments
0% 10% 20% 30% 40% 50% 60% 70% 80% 90% 100%
Budget allocations
Contracting out services
Promoting staff
Hiring staff
Dismissing or removing staff
Changes in the structure of my organisation
Policy choice and design
Policy implementation
Very low autonomy … … … … … Very high autonomy

COCOPS Work Package 3, Country Report Norway – May 2013 Page 26
is the only interaction that seems to be rather extensive. Here, 75% of the respondents state that
they are in contact with other departments outside their own at least on a monthly basis. Interaction
frequency with trade union representatives and media is medium (68% and 62% interact at least
monthly with these actors). For audit organizations and private sector companies, the interaction
mostly happens on a yearly basis or less frequently (71% and 56%, respectively). Also, looking closer
at interactions with other politicians, as well as local/regional government, two thirds of the officials
state that they are in contact with them yearly or less frequently. The low level of contact with
responsible minister and other politicians should be seen in relation to fact that the majority of
respondents work at the third hierarchical level in the bureaucracy. This indicates that public officials
work rather independently from politicians. The lowest levels of interaction is found with the
international institutions (such as IMF, OECD, ILO) and EU institutions, with 67% and 64%
respectively, stating that they have never or rarely been in contact with these units.
Figure 12. Interaction frequency (Q: Please indicate how frequently you typically interact with the following actors or bodies) (n=398-423)
A comparative perspective reveals that the public sector tends to be fragmented also in other
countries. In the overall COCOPS sample, public service executives similarly interact most often with
actors within their organization. A notable difference is that the Norwegian executives have a closer
contact with administrative units within their organization than what is the case for the whole
sample (86% are in contact at least weekly, compared to 72% in the overall sample). This might
reflect the fact that many of the respondents are managers at the third hierarchical level. Another
interesting finding is that Norwegian officials hold much closer contact with media (64% holds at
least monthly contact, compared to 39% in the entire COCOPS sample) and, maybe less surprising,
with trade union representatives (66% holds at least monthly contact, compared to 42%). Executives
from the Norwegian sample have somewhat less contact with local/regional government (31% have
at least monthly contact compared to 48%) and private sector companies (44% have at least monthly
contact compared to 55%). Last, we find that with regard to contact with the international level as
well as with other politicians – including own responsible minister, contact is just as rare for the
entire sample as is the case for the Norwegian sub-sample.
0% 10% 20% 30% 40% 50% 60% 70% 80% 90% 100%
My responsible Minister
Other politicians
My administrative superiors and higher administrative levels
My direct staff
Subordinate agencies and bodies
Administrative units within my organisation such as budget,…
Audit organisations, inspectorates and regulatory bodies
Other government departments outside my own organisation
Local/regional government
Private sector companies
Trade union representatives
European Union institutions
International bodies (e.g. IMF, OECD, ILO)
Media
Never Rarely Yearly Monthly Weekly Daily

COCOPS Work Package 3, Country Report Norway – May 2013 Page 27
In contrast to interaction frequency, coordination quality (see Figure 13) is a more in-depth measure
of fragmentation in public administration. It is interesting to see that close to 20% of the Norwegian
executives state that they cannot assess the collaboration with national and local/regional bodies
and national and supra-national bodies/international organizations. This probably reflects that many
of the executives have internally directed roles and tasks, and little experience with different types of
coordination (Christensen and Lægreid 2008b). Among those who answered these questions, the
collaboration is considered best within national government bodies within the same policy area (58%
considered collaboration as rather good). For the four remaining variables – government bodies and
private and voluntary stakeholders, national and supra-national bodies, national and local/regional
government bodies and national government bodies from different policy areas, the distribution
across the scale is rather similar: the short side of 30% argue that collaboration between bodies
within their own policy field is more or less poor, whereas around 20% are neutral, and around 30%
think collaboration is more or less good. The overall picture tells us that coordination is not
considered to be particularly good, and this experience seems to be strongest in relation to bodies
from different policy areas.
Figure 13. Coordination quality (Q: How would you characterize collaboration in your own policy field between) (n=344-408)
Despite the mixed experience with coordination with the different institutions, Norwegian public
sector executives assess coordination quality more favourably than their international colleagues;
this applies especially to the collaboration between national government bodies within the same
policy area (58% of Norwegian respondents evaluate this as rather good, compared to only 49% of
the entire COCOPS sample). Yet, the international sample evaluates collaboration with government
bodies and private and voluntary sector stakeholders as better (48% rather good vs. 35 in Norwegian
sample). The same is the case for collaboration with national and local/regional government bodies
(40% rather good vs. 29% in Norwegian sample).
Moving on to Figure 14 and the question of degree of politicization, 63% of the respondents rather
disagree that politicians interfere in routine activities in their organization. Furthermore, we see that
there is rather strong agreement that politicians respect the technical expertise of senior executives
(72%). To the statement that politicians interfere with senior-level appointments, the respondents
spread out equally along the scale. Thus, Norwegian executives seem to operate rather freely in their
everyday work. It is also interesting to see that 44% of officials have chosen the neutral option to the
0% 10% 20% 30% 40% 50% 60% 70% 80% 90% 100%
National government bodies within the samepolicy area
National government bodies from different policyareas
National and local/regional government bodies
National and supra-national bodies/internationalorganisations
Government bodies and private and voluntarysector stakeholders
Very poor … … … … … Very good Cannot assess
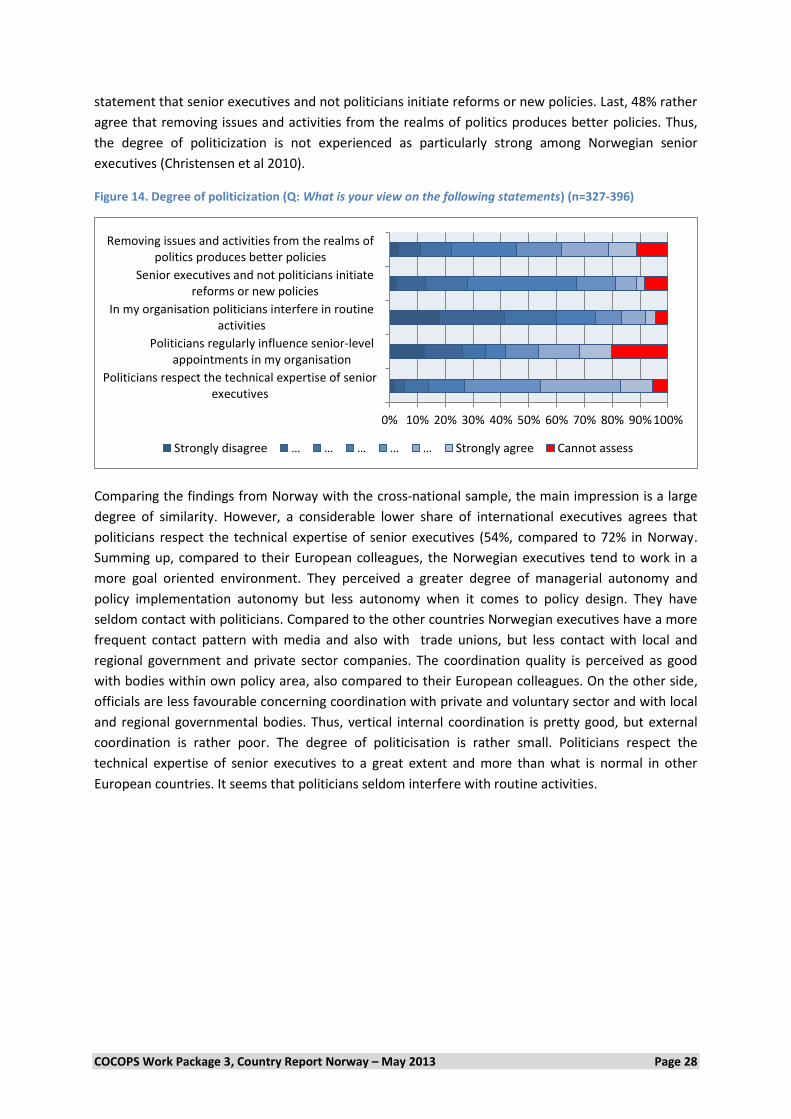
COCOPS Work Package 3, Country Report Norway – May 2013 Page 28
statement that senior executives and not politicians initiate reforms or new policies. Last, 48% rather
agree that removing issues and activities from the realms of politics produces better policies. Thus,
the degree of politicization is not experienced as particularly strong among Norwegian senior
executives (Christensen et al 2010).
Figure 14. Degree of politicization (Q: What is your view on the following statements) (n=327-396)
Comparing the findings from Norway with the cross-national sample, the main impression is a large
degree of similarity. However, a considerable lower share of international executives agrees that
politicians respect the technical expertise of senior executives (54%, compared to 72% in Norway.
Summing up, compared to their European colleagues, the Norwegian executives tend to work in a
more goal oriented environment. They perceived a greater degree of managerial autonomy and
policy implementation autonomy but less autonomy when it comes to policy design. They have
seldom contact with politicians. Compared to the other countries Norwegian executives have a more
frequent contact pattern with media and also with trade unions, but less contact with local and
regional government and private sector companies. The coordination quality is perceived as good
with bodies within own policy area, also compared to their European colleagues. On the other side,
officials are less favourable concerning coordination with private and voluntary sector and with local
and regional governmental bodies. Thus, vertical internal coordination is pretty good, but external
coordination is rather poor. The degree of politicisation is rather small. Politicians respect the
technical expertise of senior executives to a great extent and more than what is normal in other
European countries. It seems that politicians seldom interfere with routine activities.
0% 10% 20% 30% 40% 50% 60% 70% 80% 90%100%
Politicians respect the technical expertise of seniorexecutives
Politicians regularly influence senior-levelappointments in my organisation
In my organisation politicians interfere in routineactivities
Senior executives and not politicians initiatereforms or new policies
Removing issues and activities from the realms ofpolitics produces better policies
Strongly disagree … … … … … Strongly agree Cannot assess

COCOPS Work Package 3, Country Report Norway – May 2013 Page 29
6. Relevance of NPM and post NPM Reforms
This chapter provides information on public sector executives’ perception of the implementation of
NPM and post NPM reforms which are characterized by a stronger emphasis on coordination and
networked forms of governance. The respondents have been asked to assess the type and character
of reform trends in their policy field (6.1), their organization (6.2) and in their own work (6.3).
6.1 Policy field level Moving on to focus on reform trends, Figure 15 below shows that transparency and open
government and digital or e-government within public administration are seen as the most
important recent reform trends in the Norwegian bureaucracy (84% list these as important to a
rather big extent). Also, more than 70 % of the officials state that reforms focusing on outcomes and
results are important to a rather big extent. The same goes for collaboration and cooperation among
different public sector actors. Furthermore, there are signs of reform through internal bureaucracy
reduction, flexible employment, treatment of service users as customers (65%/56%/61% list these as
important to a rather large extent) and lastly, within external partnership and strategic alliances (46%
to a rather large extent). On the other side of the scale, reform is seen as the least important within
the fields of privatization (78% experience this rather rarely), followed by extending state provision
into new areas, contracting out and public sector downsizing (48%/62%/58% place themselves on the
non-reform side of the scale). Even more, for creation of autonomous agencies or corporatization
and mergers of government organizations, the share saying that reforms are not that important
(50%/40%) outdo the share stating that reform are important to a large extent (30%/36%). For
citizen participation methods/initiatives, the officials spread out evenly across the scale. Thus, we
find evidence that certain reforms are taking place, but that the most pronounced NPM-types of
reform, such as privatization and contracting out are only deemed important to a limited extent.

COCOPS Work Package 3, Country Report Norway – May 2013 Page 30
Figure 15. Importance of reform trends (Q: How important are the following reform trends in your policy area?) (n=394-402)
The results for all COCOPS countries clearly show that some radical public sector reforms have been
more extensively implemented in the other European countries compared to Norway. The most
remarkable difference is the giant gap in implementation of public sector downsizing, where 70% in
the entire sample state that this is taking place to a rather large extent, while only 25% among
Norwegian officials say the same. Furthermore, public sector executives in other countries more
frequently experience implementation of mergers of government organizations (49% vs. 36%) and
contracting out (34% vs. 26%). Yet, for treatment of service users as customers, external partnerships
and strategic alliances creation of autonomous agencies or corporatization and extending state
provision into new areas the experiences in Norway and the overall sample are quite similar. At the
same time, transparency and open government as well as flexible employment has been more
frequently implemented in Norwegian public administration than elsewhere (84% vs. 60% and 56%
vs. 46%, respectively). Nevertheless, the differences are smaller when it comes to evaluation of
collaboration and cooperation among different public sector actors focusing on outcomes and results
(70% vs. 66%), and internal bureaucracy reduction/cutting red tape. Also, for privatization both the
Norwegian sub-sample and the entire COCOPS sample agree that this happens rather rarely. When it
comes to e-government, the Norwegian executives assess this as more important compared to their
European colleagues (84% in Norway deem this largely important, vs. 68% in the overall sample).
This is in line with the current government’s focus on digital government which is announced by the
Prime Minister to be the next major government reform (Digitalizing Public Services 2012). Thus, it
seems that although reform trends have been visible in both samples, the ones most common in the
Norwegian case are judged less demanding and less extensive than by European colleagues.
Dynamics of public sector reform (Figure 16) illustrate how public sector executives evaluate the
reforms that have been implemented. The respondents were asked to indicate their views on
different dynamics of public sector reforms on a 1-10 scale. With regard to the overall assessment of
the success of public administration reforms in Norway, the responses are rather difficult to
0% 10% 20% 30% 40% 50% 60% 70% 80% 90% 100%
Public sector downsizing
Citizen participation methods/initiatives
Creation of autonomous agencies or corporatization
Contracting out
Focusing on outcomes and results
Extending state provision into new areas
Treatment of service users as customers
Collaboration and cooperation among different public…
Internal bureaucracy reduction / cutting red tape
Flexible employment
Privatisation
Digital or e-government
External partnerships and strategic alliances
Mergers of government organisations
Transparency and open government
Not at all … … … … … To a large extent
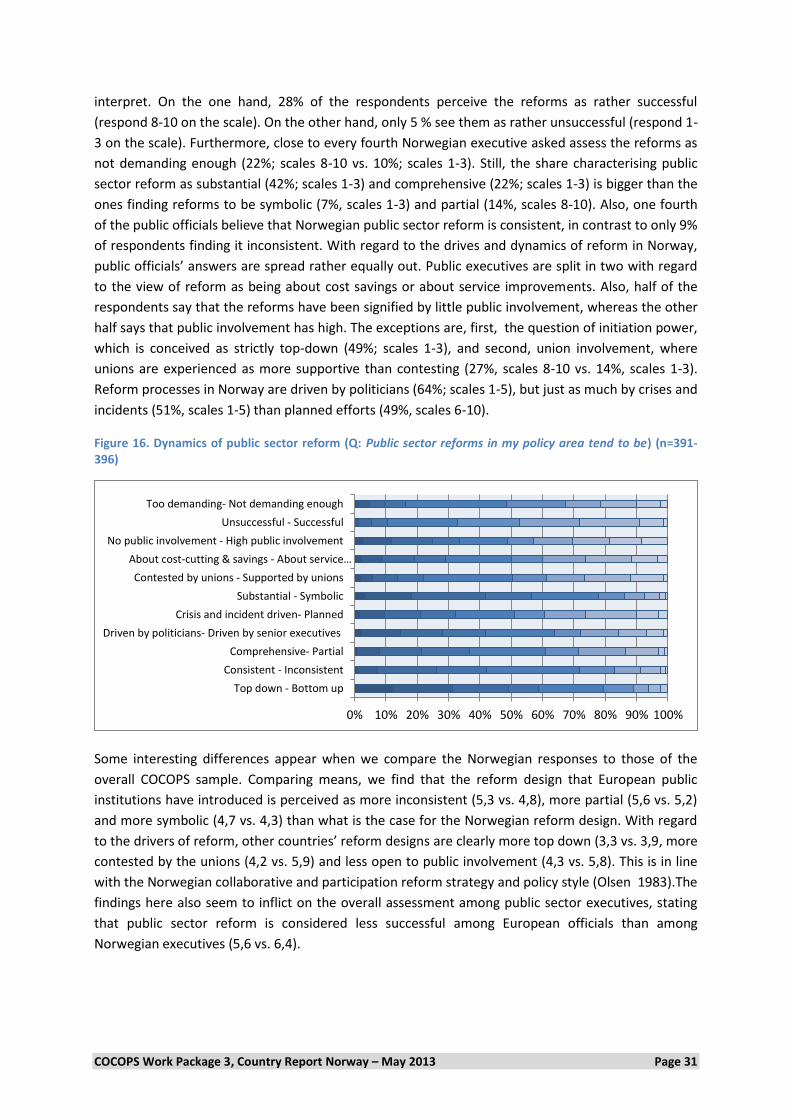
COCOPS Work Package 3, Country Report Norway – May 2013 Page 31
interpret. On the one hand, 28% of the respondents perceive the reforms as rather successful
(respond 8-10 on the scale). On the other hand, only 5 % see them as rather unsuccessful (respond 1-
3 on the scale). Furthermore, close to every fourth Norwegian executive asked assess the reforms as
not demanding enough (22%; scales 8-10 vs. 10%; scales 1-3). Still, the share characterising public
sector reform as substantial (42%; scales 1-3) and comprehensive (22%; scales 1-3) is bigger than the
ones finding reforms to be symbolic (7%, scales 1-3) and partial (14%, scales 8-10). Also, one fourth
of the public officials believe that Norwegian public sector reform is consistent, in contrast to only 9%
of respondents finding it inconsistent. With regard to the drives and dynamics of reform in Norway,
public officials’ answers are spread rather equally out. Public executives are split in two with regard
to the view of reform as being about cost savings or about service improvements. Also, half of the
respondents say that the reforms have been signified by little public involvement, whereas the other
half says that public involvement has high. The exceptions are, first, the question of initiation power,
which is conceived as strictly top-down (49%; scales 1-3), and second, union involvement, where
unions are experienced as more supportive than contesting (27%, scales 8-10 vs. 14%, scales 1-3).
Reform processes in Norway are driven by politicians (64%; scales 1-5), but just as much by crises and
incidents (51%, scales 1-5) than planned efforts (49%, scales 6-10).
Figure 16. Dynamics of public sector reform (Q: Public sector reforms in my policy area tend to be) (n=391-396)
Some interesting differences appear when we compare the Norwegian responses to those of the
overall COCOPS sample. Comparing means, we find that the reform design that European public
institutions have introduced is perceived as more inconsistent (5,3 vs. 4,8), more partial (5,6 vs. 5,2)
and more symbolic (4,7 vs. 4,3) than what is the case for the Norwegian reform design. With regard
to the drivers of reform, other countries’ reform designs are clearly more top down (3,3 vs. 3,9, more
contested by the unions (4,2 vs. 5,9) and less open to public involvement (4,3 vs. 5,8). This is in line
with the Norwegian collaborative and participation reform strategy and policy style (Olsen 1983).The
findings here also seem to inflict on the overall assessment among public sector executives, stating
that public sector reform is considered less successful among European officials than among
Norwegian executives (5,6 vs. 6,4).
0% 10% 20% 30% 40% 50% 60% 70% 80% 90% 100%
Top down - Bottom up
Consistent - Inconsistent
Comprehensive- Partial
Driven by politicians- Driven by senior executives
Crisis and incident driven- Planned
Substantial - Symbolic
Contested by unions - Supported by unions
About cost-cutting & savings - About service…
No public involvement - High public involvement
Unsuccessful - Successful
Too demanding- Not demanding enough
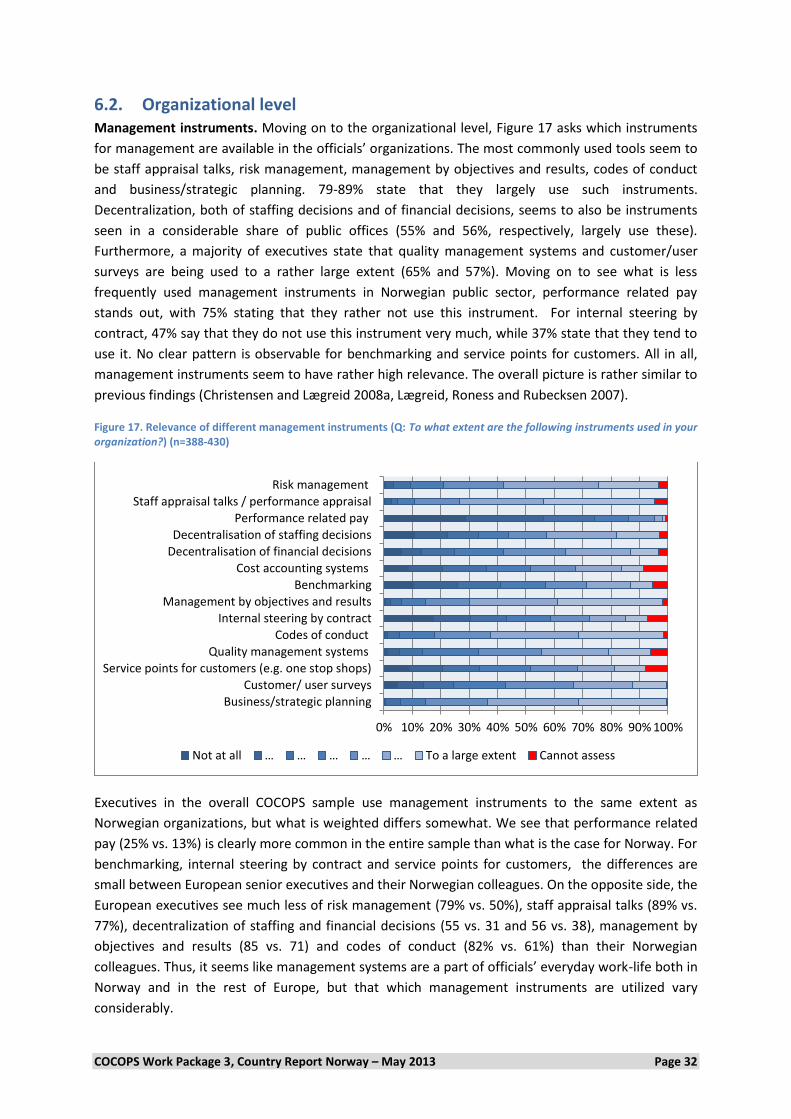
COCOPS Work Package 3, Country Report Norway – May 2013 Page 32
6.2. Organizational level Management instruments. Moving on to the organizational level, Figure 17 asks which instruments
for management are available in the officials’ organizations. The most commonly used tools seem to
be staff appraisal talks, risk management, management by objectives and results, codes of conduct
and business/strategic planning. 79-89% state that they largely use such instruments.
Decentralization, both of staffing decisions and of financial decisions, seems to also be instruments
seen in a considerable share of public offices (55% and 56%, respectively, largely use these).
Furthermore, a majority of executives state that quality management systems and customer/user
surveys are being used to a rather large extent (65% and 57%). Moving on to see what is less
frequently used management instruments in Norwegian public sector, performance related pay
stands out, with 75% stating that they rather not use this instrument. For internal steering by
contract, 47% say that they do not use this instrument very much, while 37% state that they tend to
use it. No clear pattern is observable for benchmarking and service points for customers. All in all,
management instruments seem to have rather high relevance. The overall picture is rather similar to
previous findings (Christensen and Lægreid 2008a, Lægreid, Roness and Rubecksen 2007).
Figure 17. Relevance of different management instruments (Q: To what extent are the following instruments used in your organization?) (n=388-430)
Executives in the overall COCOPS sample use management instruments to the same extent as
Norwegian organizations, but what is weighted differs somewhat. We see that performance related
pay (25% vs. 13%) is clearly more common in the entire sample than what is the case for Norway. For
benchmarking, internal steering by contract and service points for customers, the differences are
small between European senior executives and their Norwegian colleagues. On the opposite side, the
European executives see much less of risk management (79% vs. 50%), staff appraisal talks (89% vs.
77%), decentralization of staffing and financial decisions (55 vs. 31 and 56 vs. 38), management by
objectives and results (85 vs. 71) and codes of conduct (82% vs. 61%) than their Norwegian
colleagues. Thus, it seems like management systems are a part of officials’ everyday work-life both in
Norway and in the rest of Europe, but that which management instruments are utilized vary
considerably.
0% 10% 20% 30% 40% 50% 60% 70% 80% 90% 100%
Business/strategic planning
Customer/ user surveys
Service points for customers (e.g. one stop shops)
Quality management systems
Codes of conduct
Internal steering by contract
Management by objectives and results
Benchmarking
Cost accounting systems
Decentralisation of financial decisions
Decentralisation of staffing decisions
Performance related pay
Staff appraisal talks / performance appraisal
Risk management
Not at all … … … … … To a large extent Cannot assess

COCOPS Work Package 3, Country Report Norway – May 2013 Page 33
Relevance of performance management (see Figure 18). For Norwegian officials, the general picture
is that public officials’ organizations experience little monitoring by indicators from the politicians
(59% state that this is rather not used). What is more, neither sanctions for not achieving goals nor
rewards for achieving goals are a part of the conditions that they work under (74% and 71%
respectively say that such management is rather not used). This is in line with previous findings
(Lægreid, Roness and Rubecksen 2006a). Lastly, the figure shows that what Norwegian executives do
experience is measurement of outputs and outcomes (62% rather agree that this is used), whereas
measurement of input and processes is only used to a more limited extent (31% rather agree that
this is used).
Figure 18. Relevance of performance management (Q: To what extent do the following statements apply to your organization?) (423-433)
The results for the overall sample are quite similar with regard to the seldom use of sanctions for not
achieving goals. Rewards are a bit more common in the rest of Europe, and this also goes for rewards
for achieving goals (62% seldom in Europe vs. 71% in Norway). Still, the overall sample tells us that it
is more common for politicians to use indicators to monitor their performance in Europe than in
Norway (37% rather agree vs. 27% in Norway). Also, Norwegian senior officials are more used to
outputs and outcomes being measured than their European colleagues (62% vs. 51% in the entire
COCOPS sample).
In Figure 19, officials are asked how they work to find coordination solutions to problems with
cooperating organizations. When experiencing coordination problems with other organizations,
Norwegian public officials are most likely to either refer the issue upwards in the hierarchy (55%
rather agree) or set up a cross-cutting work/project group (53% rather agree) (This is in line with a
long tradition for the use of cross-cutting collegial bodies in the Norwegian ministries (Christensen et
al. 2012). Also, the short side of 40% tend to refer the issue to political actors and bodies and consult
relevant experts to resolve coordination problems. On the opposite side of the scale, respondents
indicate that setting up special purpose bodies or consulting civil society organizations or interest
groups is not something that is common in the Norwegian bureaucracy (76% and 71%, respectively,
rather disagree). The last two variables, deciding on a lead organization and setting up a cross-cutting
policy arrangement, are also not used very much (60% and 55%, respectively, rather disagree). Thus,
it seems that Norwegian public officials utilize a limited number of instruments when coordination
problem issues arise in their organizations.
0% 10% 20% 30% 40% 50% 60% 70% 80% 90%100%
We mainly measure inputs and processes
We mainly measure outputs and outcomes
We are rewarded for achieving our goals
We face clear sanctions for not achieving our goals
Politicians use indicators to monitor ourperformance
Strongly disagree … … … … … Strongly agree

COCOPS Work Package 3, Country Report Norway – May 2013 Page 34
Figure 19. Coordination solutions (Q: To resolve coordination problems when working with other organizations, we typically) (n=398-412)
When comparing the results with the overall sample, the pattern that emerges is quite similar to the
one found for Norway. Still, referring the issue upwards in the hierarchy is an even more preferred
strategy for the international officials (67% rather agree), whereas setting up a special purpose body
is the least used strategy (66% rather disagree, compared to 76% among Norwegian officials).
Otherwise, substantial differences are only found for deciding on one lead organization. This is more
common in the international sample than in the Norwegian sample (32% rather agree that this is
typical, compared to 21% in Norway).
0% 10% 20% 30% 40% 50% 60% 70% 80% 90%100%
Refer the issue upwards in the hierarchy
Refer the issue to political actors and bodies
Set up special purpose bodies (more permanent)
Set up a cross-cutting work/project group (ad hoc,…
Set up a cross-cutting policy arrangement or programme
Decide on one lead organisation
Consult civil society organisations or interest groups
Consult relevant experts (e.g. scientists or consultants)
Strongly disagree … … … … … Strongly agree
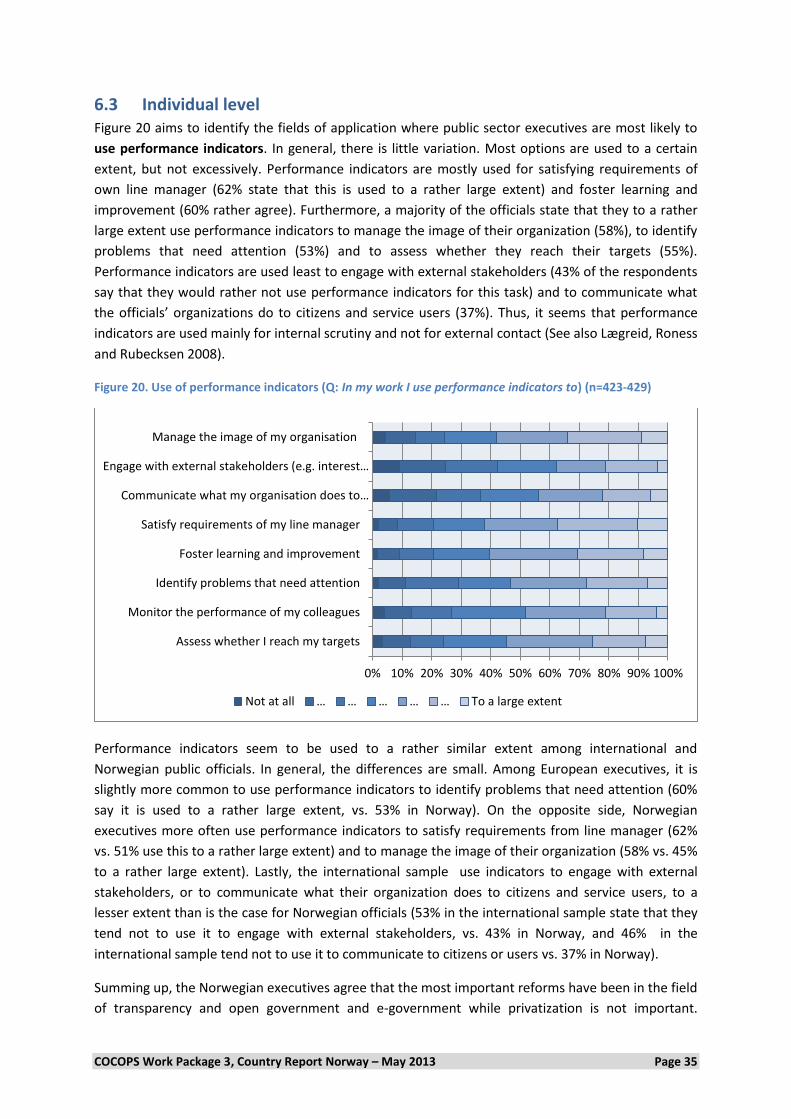
COCOPS Work Package 3, Country Report Norway – May 2013 Page 35
6.3 Individual level Figure 20 aims to identify the fields of application where public sector executives are most likely to
use performance indicators. In general, there is little variation. Most options are used to a certain
extent, but not excessively. Performance indicators are mostly used for satisfying requirements of
own line manager (62% state that this is used to a rather large extent) and foster learning and
improvement (60% rather agree). Furthermore, a majority of the officials state that they to a rather
large extent use performance indicators to manage the image of their organization (58%), to identify
problems that need attention (53%) and to assess whether they reach their targets (55%).
Performance indicators are used least to engage with external stakeholders (43% of the respondents
say that they would rather not use performance indicators for this task) and to communicate what
the officials’ organizations do to citizens and service users (37%). Thus, it seems that performance
indicators are used mainly for internal scrutiny and not for external contact (See also Lægreid, Roness
and Rubecksen 2008).
Figure 20. Use of performance indicators (Q: In my work I use performance indicators to) (n=423-429)
Performance indicators seem to be used to a rather similar extent among international and
Norwegian public officials. In general, the differences are small. Among European executives, it is
slightly more common to use performance indicators to identify problems that need attention (60%
say it is used to a rather large extent, vs. 53% in Norway). On the opposite side, Norwegian
executives more often use performance indicators to satisfy requirements from line manager (62%
vs. 51% use this to a rather large extent) and to manage the image of their organization (58% vs. 45%
to a rather large extent). Lastly, the international sample use indicators to engage with external
stakeholders, or to communicate what their organization does to citizens and service users, to a
lesser extent than is the case for Norwegian officials (53% in the international sample state that they
tend not to use it to engage with external stakeholders, vs. 43% in Norway, and 46% in the
international sample tend not to use it to communicate to citizens or users vs. 37% in Norway).
Summing up, the Norwegian executives agree that the most important reforms have been in the field
of transparency and open government and e-government while privatization is not important.
0% 10% 20% 30% 40% 50% 60% 70% 80% 90% 100%
Assess whether I reach my targets
Monitor the performance of my colleagues
Identify problems that need attention
Foster learning and improvement
Satisfy requirements of my line manager
Communicate what my organisation does to…
Engage with external stakeholders (e.g. interest…
Manage the image of my organisation
Not at all … … … … … To a large extent
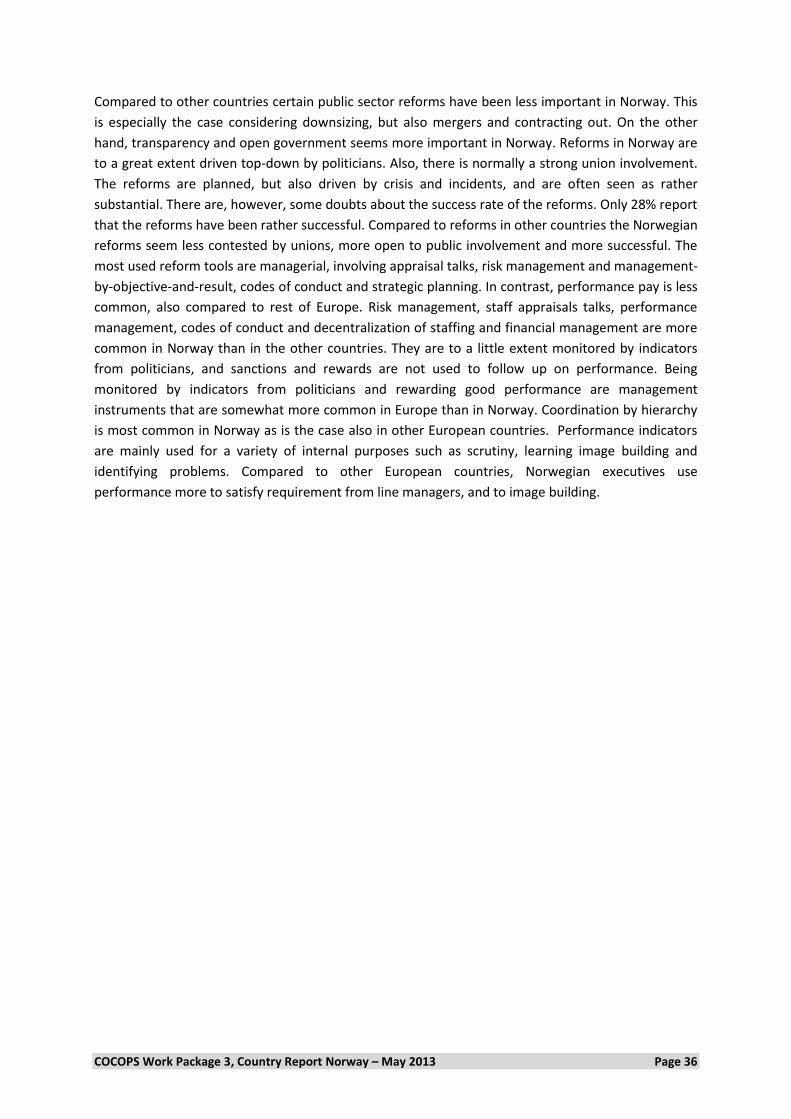
COCOPS Work Package 3, Country Report Norway – May 2013 Page 36
Compared to other countries certain public sector reforms have been less important in Norway. This
is especially the case considering downsizing, but also mergers and contracting out. On the other
hand, transparency and open government seems more important in Norway. Reforms in Norway are
to a great extent driven top-down by politicians. Also, there is normally a strong union involvement.
The reforms are planned, but also driven by crisis and incidents, and are often seen as rather
substantial. There are, however, some doubts about the success rate of the reforms. Only 28% report
that the reforms have been rather successful. Compared to reforms in other countries the Norwegian
reforms seem less contested by unions, more open to public involvement and more successful. The
most used reform tools are managerial, involving appraisal talks, risk management and management-
by-objective-and-result, codes of conduct and strategic planning. In contrast, performance pay is less
common, also compared to rest of Europe. Risk management, staff appraisals talks, performance
management, codes of conduct and decentralization of staffing and financial management are more
common in Norway than in the other countries. They are to a little extent monitored by indicators
from politicians, and sanctions and rewards are not used to follow up on performance. Being
monitored by indicators from politicians and rewarding good performance are management
instruments that are somewhat more common in Europe than in Norway. Coordination by hierarchy
is most common in Norway as is the case also in other European countries. Performance indicators
are mainly used for a variety of internal purposes such as scrutiny, learning image building and
identifying problems. Compared to other European countries, Norwegian executives use
performance more to satisfy requirement from line managers, and to image building.

COCOPS Work Package 3, Country Report Norway – May 2013 Page 37
7. Impact of the Fiscal Crisis on Public Administration
Norway is among the countries that have been the least affected by the global financial crisis and has
not faced a fiscal crisis similar to the one seen in many other European countries. In many European
countries the governments’ deficits and accumulated debts have been excessive, resulting in
consolidation of budgets and cutback management. According to a government appointed financial
crisis commission the situation for Norway is probably due to a combination of luck, skill and caution
(NOU 2011:1).
A mission from the International Monetary Fund (IMF 2012) concluded that the economic policies
implemented by the Norwegian Government have been effective in counteracting the financial crisis.
Following a comparatively mild recession in 2008-09, the economy has grown steadily for the last
years, and unemployment has stabilized at a low level. Economic recovery has been assisted by an
appropriately supportive policy environment, including fiscal stimulus. IMF concluded that the
Norwegian economy has weathered the global financial crisis remarkably well. The OECD’s Economic
Survey of Norway 2012 concludes that Norway continues to benefit from its well managed
petroleum wealth and sound macroeconomic policies, achieving levels of well-being and social
cohesion that have remained high by international standards.
The crisis shows that the real economy of countries with solid state finances, like Norway, is less
severely affected. Norway is in a favourable position and the fiscal rule provides a good framework
for tightening the stance when the economic cycles turns. The Centre-Left majority government
which came to power in 2005 was re-elected in 2009 partly due to its domestic handling of the global
financial crisis.
The conclusion is that Norwegian public sector has not faced any kind of fiscal crisis, cut-back
management or significant cost-cutting measures as a result of the global financial crisis. The global
financial crisis in the public sector has not affected the public sector in Norway to any great extent
and thus there is not an emerging coordination challenge that can be linked to the financial crisis. In
Norway there were no major changes in public management due to the financial crisis. The crisis was
mainly handled by professional experts in the Ministry of Finance assisted by the Central Bank and
the Financial Supervisory Authority.
Broader cutback measures. Norway and the Norwegian state’s protection against the fiscal crisis is
evident in Figure 21. 54% of the officials respond that no approach was required to realize savings in
response to the fiscal crisis. Among the other options, that all register different measures that can
been taken in their organization to realize savings, 24% says that targeted cuts according to priorities
has been implemented, whereas proportional cuts across-the-board over all areas and productivity
and efficiency savings both have been utilized as approach in the work places of roughly 10% of the
Norwegian officials.

COCOPS Work Package 3, Country Report Norway – May 2013 Page 38
Figure 21. Overall saving strategy (Q: In response to the fiscal crisis how would you describe the broader approach to realizing savings in your policy area?)
Compared to the international sample, it becomes clear just how protected the Norwegian senior
officials have been from savings in the public sphere elsewhere in Europe. Only 10% of European
colleagues (as opposed to 54% of Norwegian executives) has been in a work place where no
approach was required in response to the fiscal crisis. Almost twice as many executives have
experienced targeted cuts according to priorities (41% vs.24%) compared to Norway. For another
31% of the respondents, proportional cuts across-the-board over all areas has been the chosen
approach in their organizations, whereas productivity and efficiency savings has been the strategy
striking 19% of executives in the international sample. These numbers clearly state that the rest of
Europe has been much harder struck by the economic crisis than what the situation has been in
Norway.
Specified cutback measures (see Figure 22). Given the special place that Norway has been during the
financial crisis, it should not come as a surprise that many of the cutback measures mentioned in
Figure 22 has only to a very limited extent been used in public organizations in this period. We see
that there is close to complete absence in the use of pay cuts (96% not) pay freezes (88%) and
increased fees and user charges for users (81%) as response to the financial crisis. Also with regard to
downsizing back office functions (74%), reducing front line presence (70%) and staff layoffs (68%) the
amount of Norwegian senior executives stating that such measures is not used, is overwhelming. The
only two measures where “only” half of the Norwegian officials have registered that they have not
seen such cutback measures is for postponing or cancelling new programs (51% not) and cuts to
existing programs (52% not). Moving on to the measures that have been somewhat used among
those who have initiated cutback measures, we see that hiring freezes (14% to a certain extent) and
postponing or cancelling new programmes (12% to a certain extent) have been used to a certain
extent, whereas cuts to existing programmes have been introduced to at least a lesser extent for 20%
of the Norwegian officials.
10.88%
11.66%
23.58%
53.89%
Proportional cuts across-the-board over all areas
Productivity and efficiencysavings
Targeted cuts according topriorities
None / no approach required

COCOPS Work Package 3, Country Report Norway – May 2013 Page 39
Figure 22. Cutback measures at organizational level (Q: In response to the fiscal crisis, to what extent has your organization applied the following cutback measures?)
The results for the overall, cross-national sample look very different. The most common cutback
measure that has rather been used among European senior executives is hiring freezes (60%),
followed by pay freezes (43%), postponing or cancelling new programmes (36%), downsizing back
office functions (34%) and cuts to existing programmes (33%). Where Norwegian officials have
experienced introduction of cutback measures, they too have utilized hiring freezes the most, which
must be said to be a rather soft cutback measure among the listed alternatives. Still, the results show
such tremendous differences making it hard to properly compare Norway with the rest of the
COCOPS sample in this respect.
Summing up, Norwegian public sector is to a little degree affected by the financial crisis. While only
10 % of the European executives are in a policy area without any need for response to the financial
crisis this is the case for the majority of Norwegians. Pay cuts, pay freezes and increased user fees are
almost absent. Downsizing and lay-offs are also much less common than in the other countries.
0% 10% 20% 30% 40% 50% 60% 70% 80% 90% 100%
Staff layoffs
Hiring freezes
Pay cuts
Pay freezes
Cuts to existing programmes
Postponing or cancelling new programmes
Downsizing back office functions
Reducing front line presence
Increased fees and user charges for users
Not at all … … … … … To a large extent
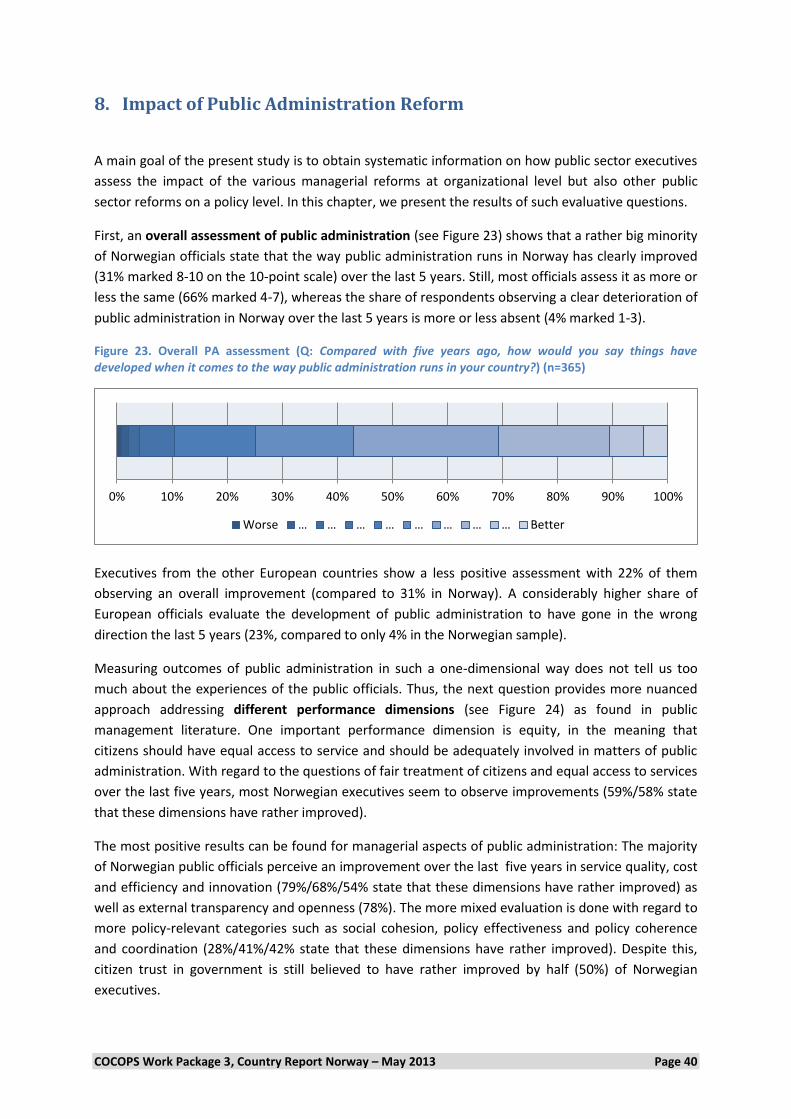
COCOPS Work Package 3, Country Report Norway – May 2013 Page 40
8. Impact of Public Administration Reform
A main goal of the present study is to obtain systematic information on how public sector executives
assess the impact of the various managerial reforms at organizational level but also other public
sector reforms on a policy level. In this chapter, we present the results of such evaluative questions.
First, an overall assessment of public administration (see Figure 23) shows that a rather big minority
of Norwegian officials state that the way public administration runs in Norway has clearly improved
(31% marked 8-10 on the 10-point scale) over the last 5 years. Still, most officials assess it as more or
less the same (66% marked 4-7), whereas the share of respondents observing a clear deterioration of
public administration in Norway over the last 5 years is more or less absent (4% marked 1-3).
Figure 23. Overall PA assessment (Q: Compared with five years ago, how would you say things have developed when it comes to the way public administration runs in your country?) (n=365)
Executives from the other European countries show a less positive assessment with 22% of them
observing an overall improvement (compared to 31% in Norway). A considerably higher share of
European officials evaluate the development of public administration to have gone in the wrong
direction the last 5 years (23%, compared to only 4% in the Norwegian sample).
Measuring outcomes of public administration in such a one-dimensional way does not tell us too
much about the experiences of the public officials. Thus, the next question provides more nuanced
approach addressing different performance dimensions (see Figure 24) as found in public
management literature. One important performance dimension is equity, in the meaning that
citizens should have equal access to service and should be adequately involved in matters of public
administration. With regard to the questions of fair treatment of citizens and equal access to services
over the last five years, most Norwegian executives seem to observe improvements (59%/58% state
that these dimensions have rather improved).
The most positive results can be found for managerial aspects of public administration: The majority
of Norwegian public officials perceive an improvement over the last five years in service quality, cost
and efficiency and innovation (79%/68%/54% state that these dimensions have rather improved) as
well as external transparency and openness (78%). The more mixed evaluation is done with regard to
more policy-relevant categories such as social cohesion, policy effectiveness and policy coherence
and coordination (28%/41%/42% state that these dimensions have rather improved). Despite this,
citizen trust in government is still believed to have rather improved by half (50%) of Norwegian
executives.
0% 10% 20% 30% 40% 50% 60% 70% 80% 90% 100%
Worse … … … … … … … … Better

COCOPS Work Package 3, Country Report Norway – May 2013 Page 41
With regard to the remaining aspects ethical behaviour among public officials, staff motivation and
attitudes towards work, and attractiveness of the public sector as an employer, these are also
evaluated to have rather improved during the last 5 years (59%/57%/55%) according to a small
majority of officials. Regarding the last performance dimension, internal bureaucracy
reduction/cutting red tape, a minority (41%) rate this to have rather improved during this time
period. Here, a rather big share also evaluates this dimension to have rather deteriorated (23%) the
last five years. This feedback is however the exception in the Norwegian data. Thus, deterioration is
not felt to be a problem for the internal administrative factors in Norwegian Public Administration.
Figure 24. Different performance dimensions (Q: Thinking about your policy area over the last five years how would you rate the way public administration has performed on the following dimensions?) (n=380-391)
When compared to the entire, cross-national sample, it becomes clear that Norwegian officials on
the whole have a remarkably more positive view of public administration performance than their
European colleagues. Only innovation is perceived slightly more positively in the entire sample. The
biggest discrepancies are found with regard to service quality (61% rather improved, compared to
79% in Norway), external transparency and openness (35% rather improved, compared to 78% in
Norway) and citizen trust in government (22% rather improved, compared to 50% in Norway).
Common for both, however, is their relative ranking of social cohesion as the one of the dimensions
where deterioration is most clearly experienced. Whereas 42% of all public officials agree that social
cohesion has rather deteriorated, the equivalent for the Norwegian executives is 19%.
Central to the overall COCOPS project is also the question of whether NPM reforms have a negative
impact on social cohesion. Although we cannot say anything about changes given the cross-sectional
form of the survey, the Norwegian sample shows that officials here have a high degree of social
capital and trust (see Figure 25). The statement that people in my organization is trustworthy is the
variable receiving most support in Figure 25, with 93% rather agreeing. Only for the variables people
in my organization view themselves as partners in charting the organization’s direction and people in
0% 10% 20% 30% 40% 50% 60% 70% 80% 90% 100%
Cost and efficiency
Service quality
Innovation
Policy effectiveness
Policy coherence and coordination
External transparency and openness
Citizen participation and involvement
Social cohesion
Internal bureaucracy reduction / cutting red tape
Ethical behaviour among public officials
Equal access to services
Fair treatment of citizens
Staff motivation and attitudes towards work
Attractiveness of the public sector as an employer
Citizen trust in government
Deteriorated significantly … … … … … Improved significantly

COCOPS Work Package 3, Country Report Norway – May 2013 Page 42
my organization enthusiastically pursue collective goals and mission, do more than 10 % of the
officials asked rather disagree. For the remaining variables Norwegian public officials agree that
people in their organization share the same ambitions and visions for the organization (83% rather
agree), have a strong team spirit (83%), have confidence in one another (83%), willingly share
information with one another (83%), share and accept constructive criticisms without making it
personal (72%) and engage in open and honest communication with one another (85%).
Figure 25. Social capital and trust (Q: People in my organization) (n=407-412)
The cross-national sample tells us that Norwegian officials stand out as more trustful and with higher
degrees of social capital than what is the case for their European colleagues. The two samples place
the different variables more or less in the same order with regard to how strongly they agree; both
are most supportive of the statement that people in their organization are trustworthy (80 rather
agrees in overall sample vs. 93% in Norway), and both are least supportive of the statement that
colleagues view themselves as partners in charting the organization’s direction (25% rather disagrees
and 49% rather agrees in overall COCOPS sample vs. 12% rather disagrees and 69% rather agrees in
Norway). Still, Norwegian officials agree with 10 to 25 percentage points above their European
colleagues on all variables. Thus, this confirms the picture painted by previous international surveys
of Norwegians as a population with exceptional high levels of social capital and trust (Christensen
and Lægreid 2005)..
Job satisfaction (Figure 26). Norwegian public officials also seem to show a high degree of
satisfaction with their organization. 73% of Norwegian officials agree that they would recommend
their workplace as a good place to work, and a clear majority also agrees with the following
statements: I feel valued for the work I do (66%) and I get a sense of satisfaction from my work
(80%). Also, 48% of the officials disagree with the statement that they regularly feel overloaded or
unable to cope, and only 10% agrees with this description.
0% 10% 20% 30% 40% 50% 60% 70% 80% 90% 100%
Engage in open and honest communication with oneanother
Share and accept constructive criticisms without makingit personal
Willingly share information with one another
Have confidence in one another
Have a strong team spirit
Are trustworthy
Share the same ambitions and vision for theorganisation
Enthusiastically pursue collective goals and mission
View themselves as partners in charting the organisation’s direction
Strongly disagree … … … … … Strongly agree
COCOPS Work Package 3, Country Report Norway – May 2013 Page 43
Figure 26. Job satisfaction (Q: When thinking about my work and the organization I work for) (n=409-412)
Job satisfaction among the European COCOPS sample is also high, but continuing along the same
lines as the previous figures in this section, Norwegian officials score even higher. 63% agree that
they get a satisfaction from their work (vs. 80%), whereas roughly 50% agree that they feel valued for
the job they do and that they would recommend their organization as a good place to work (vs. 66%
and 73%, respectively). Nevertheless, the Norwegian sub-sample and the entire sample are similar
with regard to the degree to with they regularly feel overloaded o5unable to cope.
A further related question assesses the executives’ organizational commitment For Norway Table 27
tells us that most public officials disagree that it was better when people stayed in one organization
for their entire career (75%, only 1% agree). Furthermore, they are quite spread out with regard to
the question of whether they were taught to believe in the value of remaining loyal to the
organization (32% disagree while 23% agree). We also observe that only 19% agrees, and 39% right-
out disagrees that it would be hard to leave the organization right now, even if they wanted to. To
the question of whether they would be happy to spend the rest of their career with the organization
they are currently in, 38% of Norwegian officials agree that they would. Lastly, we see that
Norwegian officials only to a limited extent look upon the organizations’ problems as their own (18%
agree with the statement, whereas 25% disagree). In overall the organizational commitment in
Norway appears not to be that strong, and probably lower than expected, given the high tenure and
lack of career mobility (see Figure 5). Even so, this might partly be explained by the fact that two
thirds of public officials in the Norwegian sample work at the third hierarchical level of the
organization, and consequently do not feel that their organization depends on them to the same
degree as top-level officials.
0% 10% 20% 30% 40% 50% 60% 70% 80% 90% 100%
I get a sense of satisfaction from my work
I feel valued for the work I do
I regularly feel overloaded or unable to cope
I would recommend it as a good place to work
Strongly disagree … … … … … Strongly agree
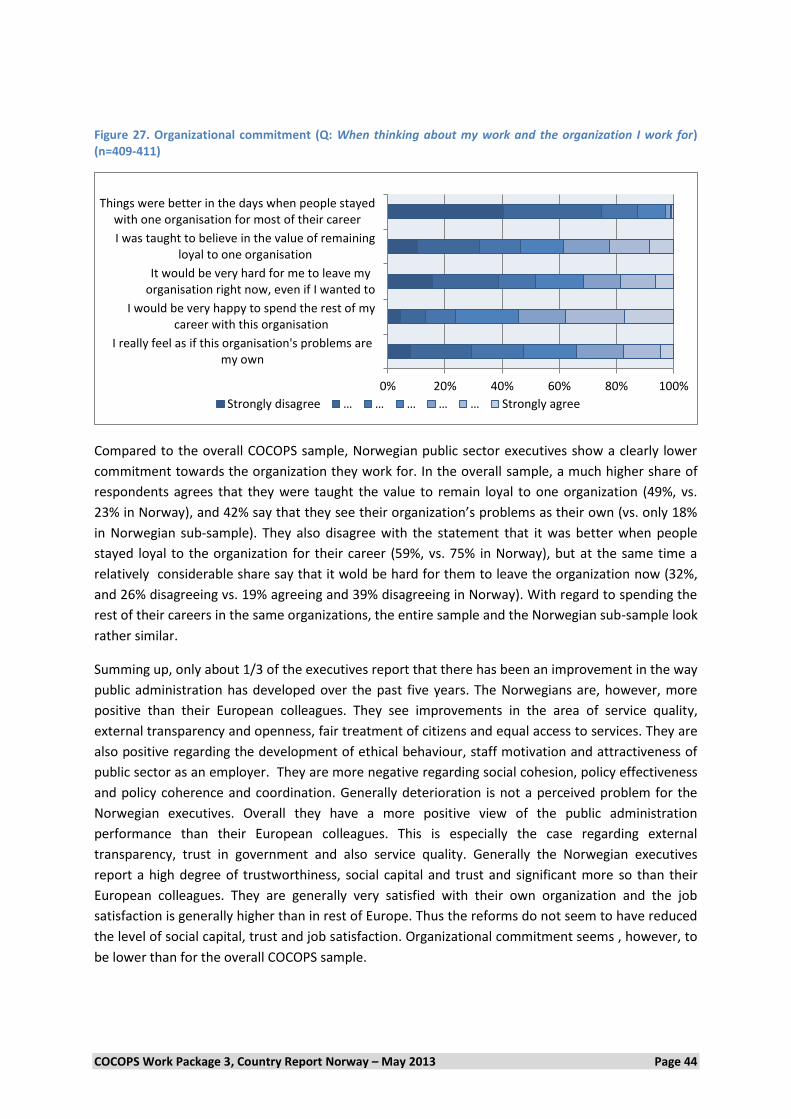
COCOPS Work Package 3, Country Report Norway – May 2013 Page 44
Figure 27. Organizational commitment (Q: When thinking about my work and the organization I work for) (n=409-411)
Compared to the overall COCOPS sample, Norwegian public sector executives show a clearly lower
commitment towards the organization they work for. In the overall sample, a much higher share of
respondents agrees that they were taught the value to remain loyal to one organization (49%, vs.
23% in Norway), and 42% say that they see their organization’s problems as their own (vs. only 18%
in Norwegian sub-sample). They also disagree with the statement that it was better when people
stayed loyal to the organization for their career (59%, vs. 75% in Norway), but at the same time a
relatively considerable share say that it wold be hard for them to leave the organization now (32%,
and 26% disagreeing vs. 19% agreeing and 39% disagreeing in Norway). With regard to spending the
rest of their careers in the same organizations, the entire sample and the Norwegian sub-sample look
rather similar.
Summing up, only about 1/3 of the executives report that there has been an improvement in the way
public administration has developed over the past five years. The Norwegians are, however, more
positive than their European colleagues. They see improvements in the area of service quality,
external transparency and openness, fair treatment of citizens and equal access to services. They are
also positive regarding the development of ethical behaviour, staff motivation and attractiveness of
public sector as an employer. They are more negative regarding social cohesion, policy effectiveness
and policy coherence and coordination. Generally deterioration is not a perceived problem for the
Norwegian executives. Overall they have a more positive view of the public administration
performance than their European colleagues. This is especially the case regarding external
transparency, trust in government and also service quality. Generally the Norwegian executives
report a high degree of trustworthiness, social capital and trust and significant more so than their
European colleagues. They are generally very satisfied with their own organization and the job
satisfaction is generally higher than in rest of Europe. Thus the reforms do not seem to have reduced
the level of social capital, trust and job satisfaction. Organizational commitment seems , however, to
be lower than for the overall COCOPS sample.
0% 20% 40% 60% 80% 100%
I really feel as if this organisation's problems aremy own
I would be very happy to spend the rest of mycareer with this organisation
It would be very hard for me to leave myorganisation right now, even if I wanted to
I was taught to believe in the value of remainingloyal to one organisation
Things were better in the days when people stayedwith one organisation for most of their career
Strongly disagree … … … … … Strongly agree

COCOPS Work Package 3, Country Report Norway – May 2013 Page 45
9. Findings from the Employment and Health sectors
9.1 The employment sector10 During the 1980s and 1990s clients and civil servants in the welfare administration in Norway
became increasingly critical of the fragmentation of service delivery, which was seen as especially
problematic for the multiservice clients who had to visit many different public offices to claim their
benefits. These actors put pressure on the Parliament to initiate changes in the structure of the
welfare administration, but were unsuccessful in their efforts until 2001 when a strong enough
coalition was formed to ask the government to come up with a unified solution for the welfare
administration (Christensen, Fimreite and Lægreid 2007). The minority coalition government was
reluctant to accept this demand and sent a report back to the Parliament saying that they did not
support the idea of a unified service. A majority in the Parliament was dissatisfied with this answer
and replied that the government must deliver a more holistic service. This resulted in the
government deciding to establish a public committee of experts to look into the matter. Their
conclusion was that the basic fragmented structure was sound, but that the unemployment and
social services should collaborate more closely at the local level.
The minister for the welfare administration who came to office in 2004 headed a ministry that for the
first time had responsibility for all the relevant welfare services. Realizing that it was politically
impossible to come back to the Parliament with yet another fragmented solution, he proposed a
compromise that entailed a partial merger. The main goals of the compromise were to get more
people off benefits and into work, to offer a more user-friendly and coordinated service and to be
more efficient.
The administrative welfare reform was primarily a structural reform, consisting of two crucial
elements. The first entailed a merger of the agencies for employment and the national pensions
system, creating a new welfare agency (NAV) on all levels (Christensen, Fimreite and Lægreid 2007).
The second element entailed the establishment of a local partnership between this new agency and
the social services at the local level run by the municipalities (Fimreite and Lægreid 2009). The idea
was to locate all services in one place and reduce the number of tasks involved to a minimum. Two
aspects of this solution are worth mentioning. One is that it was politically impossible to propose a
completely unified welfare administration, because that would have implied that it should be run
either by central or by local government, which was not politically feasible. The second aspect is that
the legally enshrined mandatory partnership required the support of the local authorities and their
central organization, and one way to do this was to allow a dual local management in the welfare
offices, making it easier for both actor groups to be represented and also allowing the municipalities
to offer more services in local offices, over and above the minimum required. This might be seen as
the central state increasing its influence and interfering in local self-government, but it could also be
interpreted as local government getting central government to finance more local services.
After the Parliament approved the reform in 2005, an interim period of one year followed during
which the old organizations continued to run as usual while the new internal structures were being
discussed and decided on. The new welfare administration officially began operating in 2006. It was
10 This discussion is based on Byrkjeflot, Christensen and Lægreid (2012).
COCOPS Work Package 3, Country Report Norway – May 2013 Page 46
based on a central partnership agreement between the government and the central organization for
the municipalities followed by local agreements between the new NAV agency and all the
municipalities. The process of establishing local welfare offices in all municipalities took four more
years to finish.
In 2008 the reformed system underwent two significant reorganizations (Christensen and Lægreid
2012). One was the establishment of six regional pension offices, while the other entailed the
establishment of county-based administrative back offices. This involved shifting quite a few
personnel resources from the local level up to the regional level. The main arguments for this were
that regional units provided an opportunity to increase the quality of casework. What this meant in
practice was increasing competence and introducing more standardization, equal treatment and
efficiency with respect to different benefits, while at the same time giving local offices the
opportunity to focus on their two main tasks: providing information and guidance for their clients
and helping the clients to get work. Central political and administrative actors, both in the ministry
and in the welfare agency, saw this reorganization of the reform as a major precondition for fulfilling
the aims of the original welfare reform. The paradox, however, was that the reorganization
potentially undermined the original main reform idea of strong welfare offices in each municipality.
The Norwegian data does not include too many respondents in the employment sector; only 48 of
the 436 respondents have registered that they belong to this sector. Given the small amount of cases
we here base our analyses on, the conclusions should be carefully drawn. Because of the small
sample, we use mean values to analyse differences between the Employment sub-sample and the
other sectors. In the following we focus our attention to four broader thematic areas: executives’
values and attitudes, work context, the experiences relevance of NPM reforms and the experiences
impact of public sector reform.
Values and attitudes
In the Employment sector executives have a very similar self-understanding and identity pattern to
their colleagues in other policy fields. The only difference is that they prefer tax financed services
over user charges (the mean for employment here is 2,5 compared to one of 3,3 for the rest of the
sample). Employment sector officials also have a rather similar motivation to their colleagues in
other policy fields, two exceptions being that opportunities to help other people is a stronger
motivation for them (mean of 5,7 compared to 5,0 in the remaining policy areas), and that they are
slightly more preoccupied with having high income (5,3 compared to 4,5 for the other policy fields).
Work context
Executives in the employment sector perceive their goals as less ambiguous than their colleagues in
other sectors. They agree to a larger extent that their goals are communicated to all staff (6,3 vs. 5,5
in the other sectors), that their goals are clearly stated (6,1 vs. 5,5), and that they have a high
number of goals (6,0 vs. 5,4)..
Interaction frequency in the employment sector rather contrasts the findings from the rest of the
policy sectors. Concerning the most prominent differences we find that officials in the employment
sector interact more frequently with trade unions (here a mean value of 4,3 is observed, compared
to a value of 3,6 for the remaining sample). On the other hand, employment sector executives are
less frequently in contact with their responsible ministers (2,2 vs. 2,8 in the other policy fields). Also,
contact EU institutions (1,7 vs. 2,4) is less frequent in the employment sector than in other sectors.

COCOPS Work Package 3, Country Report Norway – May 2013 Page 47
Coordination quality is also generally perceived as quite similar in the employment sub-sample and
the remaining policy groups. The clearest differences are found in that employment executives are
more satisfied with coordination with local/regional government bodies (4,5 compared to 3,9 in the
rest of the sample) clearly less satisfied with the coordination with supra-national bodies (3,6
compared to 4,2 in the other policy fields. Lastly, senior officials in the employment sector perceive a
rather similar degree of politicization as the other policy fields.
Relevance of NPM reforms
Almost all NPM reform trends are more relevant in the employment sector when compared to the
rest of the sample. In particular, mergers of government organization are more common (a mean of
4,6 in the sub-sample for employment, one of 3,7 in the rest of the sample). Also, the employment
sector executives perceive citizen participation methods as significantly more relevant (the mean
value is 4,6 for employment, and 3,8 for the other sectors). The same is true for outcome and result
orientation (5,7 vs. 5,0). Nevertheless, for the policy reforms contracting out, flexible employment
and privatization, reform is more present within the other policy fields compared to the employment
sector.
Employment sector executives also assess the dynamics of reform in their policy field in more
complimentary terms. In particular, they describe the reforms as containing much higher public
involvement (a mean value of 7,0 in the employment sector, compared to a much lower value of 5,5
for the other sectors) and being about service improvement (6,7 vs. 5,6). They also to a bigger degree
than their colleagues in other sector state that reforms have been planned (6,2 vs. 5,6), and less
contested by unions (6,6 vs. 5,8).
Management instruments are less used in the Norwegian employment sector than within the other
sectors. This is especially the case for use of codes of conduct (a mean value of 5,7 in the sub-sample
for employment, one of 4,1 for the remaining sample), benchmarking (4,8 vs. 3,8) and service points
for customers (5,0 vs. 4,0). In general, performance management is considered as more relevant in
the employment sector than in other policy fields: there is considerably more likely to measure
outputs and outcome (5,6 vs. 4,6). Also with regard to the use of performance indicators, the general
pattern is that this is more common in the employment sector, both at organizational and individual
levels. The use of coordinating measures is perceived in a rather similar way for the employment
sector and the other sectors grouped.
Regarding the assessment of different performance dimensions, the executives in the employment
sector give a slightly more positive evaluation of the performance dimensions. This is most marked
for equal access to services (5,4 vs 4,7).
Summing up, the executives in the employment sector have a similar self-understanding and identity
pattern as their colleagues in other policy fields. They perceive their goals as less ambiguous
compared to other policy areas. They interact more frequently with civil service unions and local and
regional government. They are also more satisfied with the coordination with local and regional
bodies than the rest of the sample. They report more than others that politicians interfere in routine
activities. The emergence of mergers and citizen’s participation is more common in this area, as is
public involvement in the reform processes. Improvement is more up front and the reforms are less
contested by unions. Service codes of conduct and benchmarking are less used than in the whole

COCOPS Work Package 3, Country Report Norway – May 2013 Page 48
sample, while performance management is more relevant. The executives in the employment sector
are overall positive to the reform.
9.2 The health sector11 Historically, municipalities and various local actors were in charge of the development of health
institutions in Norway. As a consequence the hospital system was fragmented, resulting in large
differences among regions in access to healthcare. In the 1970s the counties were to take
responsibility for the development of hospitals. By the 1990s, the counties came under increasing fire
because of long waiting lists for patient treatment, a lack of economic control and failed attempts at
achieving a more equal regional distribution of medical services (Byrkjeflot and Neby 2008; Hagen
1998).
In hindsight the county regime that existed between 1970 and 2002 seems quite unstable. The
conflicts between professions, districts, administrators and politicians, and local and central health
authorities were recurrent, and various terms such as “rematch” and “blame-game” were used to
describe the situation (Byrkjeflot and Grønlie 2005). The question of responsibility was raised several
times by government, but with not much success. Other important reform acts were implemented,
however, primarily among them activity-based funding of somatic hospitals in 1997 and a patient
rights legislation including the right to «free hospital choice» in 2001 (Ot.prp. nr. 12 (1998–99). These
reforms made it even more difficult for the counties to take responsibility for the hospitals, since
patients could go elsewhere at the same time as the central government now provided more than
70% of the funding for these institutions (Hagen and Kaarbøe 2006:331).
A process that led up to the transfer of responsibility for the Norwegian hospitals from counties to
the central government started in 2000. The decision to reform the hospitals was passed in the
parliament in 2001. Thus, the reform act was prepared and implemented at a very fast pace
(Herfindal 2004). One of the most important justifications for the reform was to give the hospitals
“more clearly defined roles and responsibilities”. Rather than be an integral part of the public
administration, they were now to be organized as enterprises with their own responsibilities as
employers and for use of capital and finances, with the restriction that they may not go into
voluntary liquidation.
New management principles were introduced for the hospitals based on a decentralized enterprise
model, originally with five regional enterprises, 33 local health enterprises which integrates 81
former hospital units (Stigen 2005:38). Currently there are 4 regional enterprises and 24 local health
enterprises. The local enterprises are owned by the regional enterprises and are responsible for
patient treatment, research, education of health personnel and patients. Several health care
directorates and agencies were also reorganized in the same period, but these processes were
initiated and implemented more or less independent of the hospital reform (Stigen 2005).
On the one hand, the minister of health assumed full responsibility for conditions in the health
sector and a new department of ownership was established; on the other, the enterprises were given
enhanced local autonomy with their own executive boards and general managers with powers of
authority to set priorities and manage the regional and local health enterprises. The reform involved
11
The following discussion on reform trends in the Norwegian health sector is based on Byrkjeflot, Christensen
and Lægreid (2012).

COCOPS Work Package 3, Country Report Norway – May 2013 Page 49
an escalation of overall central government ownership responsibilities and control, simultaneously
representing a decentralized, but also more unitary and hierarchical system of management.
Adding to the Hospital reform there is also an on-going reform called the Coordination Reform
(St.meld. 47 (2008-2009). The Coordination Reform is focusing on the relationship between the
primary health care with a municipal responsibility and the specialist health care with government
owned health enterprises responsibility. The goal is for the patients to receive the proper treatment
– at the right place and right time. A binding system of agreements between municipalities and
health authorities has been launched and financial incentives and municipal co-financing of patient
treatment has been introduced.
The analysis for the health sector – albeit based on a rather small sample of 84 respondents – yields
the following results. We use mean values to compare the Health sub-sample with the other policy
fields in the Norwegian sample. Also here, we focus our attention to the following four thematic
areas: executives’ values and attitudes, work context, the experiences relevance of NPM reforms and
the experiences impact of public sector reform.
Values and attitudes
Executives working in the health sector have a very similar self-understanding and similar identity
patterns like their colleagues in other policy fields; the only difference here is that developing new
policy agendas is less important to them (the mean for the health sector is 3,7, compared to 4,4 for
the other sectors. The results concerning the priorities they have as civil servants in general are
rather similar. One interesting difference is that health sector employees give more weight to tax
financed services as opposed to user charges/fees (the mean for them is 2,8, the one for the other
sector is 3,3). Health sector executives have a rather similar motivation like their colleagues in other
policy fields. The exception is that the opportunity to help others is a stronger motivation to
executives in the health sector than what is common for the other sectors (5,5, compared to 5,0 for
the rest of the sample).
Work context
In general, executives working in the Health sector do not differ significantly from the rest of the
sample. Also with regard to management autonomy do the executives in the Health sector look
rather similar the remaining sample. For interaction frequency, the results are rather similar to the
overall sample, besides that employees in the health sector interact less frequently with their
responsible minister (here a mean value of 2,2 is observed, compared to a value of 2,8 for the other
sectors). Also for contact with international bodies (mean value of 1,8, compared to 2,3 in the rest of
the sample) is contact less frequent in the health sector. Coordination quality, however, is perceived
as less well for the Health sector than for the rest of the Norwegian sample. With regard to the issue
of politicization, senior executives in the health sector look identical to their colleagues in the other
sectors in the Norwegian sample.
Relevance of NPM reforms
Almost all NPM reform trends are more relevant in the health sector if compared to the other
sectors. In particular, more citizen participation occurs (a mean of 4,3 in the sub-sample for health,
one of 3,8 for the rest of the Norwegian sample). Also, the health sector executives perceive more
relevance of mergers of government organizations (a mean value of 4,2 in the subsample for health,
one of 3,7 for the other sectors) as well as treating service users as customers (5,1 vs. 4,5).
COCOPS Work Package 3, Country Report Norway – May 2013 Page 50
Health sector executives also assess the dynamics of reform in their policy field somewhat different
than the other sectors do altogether. In particular, they describe the reforms as containing a higher
degree of public involvement (a mean value of 6,5 in the health sector, compared to a much lower
value of 5,6 in the remaining sample). Furthermore, they consider the reforms as more top-down
(3,4 vs. 4,0) and more driven by politicians (4,5 vs. 5,1) than their colleagues in the other sectors.
Management instruments are just as much used in the Norwegian health sector as in the other
sectors. Performance related pay (2,1 vs. 2,6) is less used management instruments in the health
sector than in the other sectors. The relevance of performance management is also the same both
for the sub-sample of health executives and for their colleagues in other sectors. The only substantial
difference found signifies that politicians are more likely to use indicators to monitor the
performance of Health executives than is the case in other sectors (3,9 vs. 3,1). In general, use of
performance indicators seems to be more relevant in the health sector than in the other policy fields.
Impact of public administration reform
With regards to the overall assessment of the public administration reform, the health sector does
not differ significantly from the rest of the sample. As concerns the more nuanced assessment of
different performance dimensions, the executives in the health sector give a rather similar evaluation
of the performance dimensions. Also with regards to job satisfaction is the Health sub-sample and
the other sectors close to identical. However, executives here feel substantially more valued for the
work they do than is the case for the executives in the remaining sectors (3,4 vs. 2,9). The results for
social trust and capital are almost identical with the results from the rest of the Norwegian sample.
Organizational commitments seem to be slightly lower in the health sector, although no substantial
differences are found between the Health sub-sample and the remaining Norwegian sample.
Summing up, over all the executives in the health sector does not differ significantly from the rest of
the sample. They have a rather similar self-understanding, identity patterns and work context. They
experience a higher degree of public involvement in reforms that also tend to be more driven by
politicians. The politicians also tend to use performance indicators more frequently tot o monitor the
performance in the health sector.

COCOPS Work Package 3, Country Report Norway – May 2013 Page 51
10. Conclusion
Norway is a small country with a comparatively large public sector. Around one third of the total
labour force is publicly employed. Structurally, it is a unitary but decentralized state where local
government takes care of many functions. There is a strong tension between the principle of
ministerial responsibility with strong specialization by sector, and the principle of local self-
government with specialization by territory. The financial situation in Norway is good and living
standards are relatively high. Central and local government influence the everyday life of citizens
through generous welfare state institutions and programmes. Public administration generally enjoys
a high level of public trust, and there is a relatively high level of mutual trust among public sector
organizations. Norms of impartiality and professionalism have been strong and the level of
corruption has been low.
Public sector reforms, later framed as NPM-reforms, were launched from the mid-1980s but did not
get any pace until the mid-1990s. Together with other Scandinavian countries, Norway has been
characterized more as a modernizer than a marketizer, following managerial and user-
responsiveness strategies rather than competition, marketization and incentivization strategies (Foss
Hansen 2011, Pollitt and Bouckaert 2011). The NPM-reforms in the Norwegian civil service gained
momentum from the mid-1990s and onwards, and were implemented in a rather pragmatic manner.
The modernization process in Norway has been characterized by participation and consultation with
stakeholders, and legitimization and accountability (see Pollitt, van Thiel and Homburg 2007). Thus,
Norway has been influenced by international reform waves, but these have largely been filtered and
adapted to the existing politico-administrative culture and structure. The general Norwegian
policymaking style is characterized by consensus based on common interests and “revolution in slow
motion” (Bezes, Fimreite, Lidec, Lægreid 2013; Olsen 1988). Norway has also been characterized as a
“reluctant reformer” (Olsen 1996) but the reforms peaked from 2000 until 2005. Recently the
reforms have taken on a more “post-NPM flavour”.
Sector-specific hierarchical coordination within ministerial areas from central state to local level is
quite strong, but balanced by a relatively strong coordination within the county (regional) and
municipality level. The rather hesitant reform approach is attributable to a collectivistic oriented
political-administrative culture with an emphasis on traditional Rechtstaat values and quality rather
than individualism and efficiency. The NPM reforms in Norway have largely been characterized by
structural devolution where agencies has gained more autonomy both structurally, managerially and
policy-wise, accompanied by a more formalized performance-assessment regime and the
establishment of new, autonomous state-owned companies. In addition, Management by Objectives
and Results has been a central reform measure. In municipalities and also in state owned companies
there has also been contracting out and increased marked competition.
The results of the COCOPS executive survey confirm that Norway is characterized by similar, but also
some important different reform trends and attitudes towards these reforms compared to other
European countries. The survey provides interesting new insights into characteristics of the public
sector executives, their work environment, and their attitudes and thoughts about central reforms
and management instruments. Norway retains some of its traditional elements, but there are also
findings that suggest new developments.
COCOPS Work Package 3, Country Report Norway – May 2013 Page 52
The Norwegian sample confirms that Norway in general is characterized by a high share of women
participating in the workforce at all levels. Although the majority still is male, compared to the other
COCOPS countries, a higher share of women is employed at the top executive levels. The survey
further confirms a common picture of life-long careers in the civil service and seniority-based
promotion. In general, the Norwegian executives are highly educated. While the overall sample show
that the European bureaucracies tend to be dominated by executives with a background in law or
business/economics, the Norwegian executives are generally economists or social scientists.
Executives in the Norwegian sample are highly motivated by their work, finding it interesting,
important and useful to society. They are to a lesser extent than their European colleagues
motivated by opportunities for promotion, job security and status. They perceive themselves as
forward-looking and responsible, but seem less risk-prone than others. As in the other countries
included, achieving results, ensuring efficient use of resources and the impartial implementation of
law and rules, and providing expertise and technical knowledge are dominant values. Interestingly,
Norwegian executives seem more preoccupied with getting public organizations to work together
than others. The sample also confirms a tendency towards compromise and consensual decision
decision-making, whereas executives in the Norwegian sample are more prone to search for joint
solutions to solve problems. The Norwegian sample further shows a clear preference for traditional
civil service values such as equity and quality over efficiency. However, when achieving results are set
up against following rules, the respondents are prone to both, it seems. Compared to the overall
results, Norwegian executives represent a more traditional bureaucratic approach to the state. At
the same time, a more traditional citizen focus is being challenged by an increasingly important
managerial customer focus.
The executive’s perception of their work context is a major focus in this report. In contrast to some
of the other COCOPS countries (Germany for instance), goal ambiguity is rather low in the Norwegian
sample. Norwegian respondents work in a highly goal-oriented environment, and a larger majority
agree that their organization has a high number of goals. The goals are, according to the Norwegian
respondents generally clearly stated and communicated. At the same time, scepticism towards
measurability of these goals is plain. All in all, the Norwegian executives are rather autonomous
when it comes to their everyday work, also compared to their European colleagues. They have a
considerable degree of autonomy in policy implementation, when it comes to hiring and promoting
staff, changing their own organization, and budget allocations, but lesser so when it comes to policy
choice and design, and contracting out services. This confirms previous findings indicating a high level
of mutual trust between different levels within central government and between ministries and
agencies (Christensen and Lægreid 2008b). It gives a picture of Norwegian executives’ orientation
towards more traditional civil service values and possibly a stronger emphasis on a separation of
policy-making and administration.
In terms of interaction, executives in Norway reveal a much more frequent contact with the media
compared to their European counterparts. This also goes for their contact with trade unions – a
factor that is maybe less surprising giving the consulting policy style in Norway. On the other hand,
Norwegian executives are to a lesser degree in contact with local and regional government and
private sector companies. This indicates a clear division of responsibilities between state affairs and
local government affairs, and between the state and the private sector. With regard to contact with
politicians and the international level , contact is rather rare, and similar to what is the case for the
COCOPS Work Package 3, Country Report Norway – May 2013 Page 53
overall European sample. The Norwegian executives find it rather difficult to evaluate coordination
quality. Coordination quality is generally higher within national government bodies in the same
policy area. Overall, coordination is assessed as rather poor, and mostly so between bodies in
different policy areas (horizontal coordination). Norwegian executives evaluate coordination quality
between national government bodies within the same policy area as better than their European
colleagues, while coordination quality between government bodies and private or voluntary sector
stakeholders is seen as worse.
Overall, the degree of politicization seems low within the Norwegian central government. Most
agree that politicians tend not to interfere, and respect the more technical expertise of senior
executives. Interestingly, the executives are rather neutral when asked who initiates reforms and
new policies. This might indicate that they see that senior executives have an important role in policy
formation and initiations alongside politicians – but can also indicate that it is sometimes difficult to
tell where the reform ideas and new policies come from. Compared to the overall sample, executives
in Norway experience, and also seem to favour a lower level of politicization and a greater separation
between policy-making and administration.
A key goal of the present study is to obtain systematic knowledge of how public sector executives
assess the impact and relevance of NPM reforms and other recent public sector reform trends.
Although the Norwegian executives can hardly be said to see the reforms as successful, they
acknowledge that the reforms have had a considerable impact and are rather positive towards
further reforms. A majority think that the reforms have been consistent, but not demanding enough.
The reforms are perceived to be largely top-down and driven by politicians, but also by crises and
incidents just as often as being planned. In terms of instruments, transparency and open government
and digital (e-) government have made the most impact, alongside an emphasis on outcomes and
results, and collaboration and cooperation among different public sector actors. Reform is least
present with regard to privatization, contracting out and public sector downsizing. This last feature is
in rather stark contrast to the other European countries, where public sector downsizing has been a
much more dominant reform trend. The reforms introduced in the other European countries are
perceived as more inconsistent, partial and symbolic compared to Norway. Other countries’ reforms
are clearly more top-down and politician driven, more contested by unions and also less open to
public involvement. This confirms the picture of Norway as being more collaborative and
participatory when it comes to reform strategy and policy style (Olsen 1988). It supports the claim of
a Nordic variant of a Neo Weberian reform model emphasizing participation and consultation (Pollitt,
van Thiel and Homburg 2007).
On the organizational level, the most common management instruments are staff appraisal tasks,
risk management, management by objectives and results, codes of conduct and strategic planning.
Also, decentralization of decisions, quality management and customer/user surveys are seen to a
considerable extent. Internal steering by contracts is evident to some extent. Performance related
payment, on the other hand, is rather uncommon. No clear pattern is evident when it comes to
benchmarking and the use of service points for customers. Once again, the evaluation pattern among
the Norwegian executives differs somewhat from the overall European sample. Management
instruments are used to the same extent, but in a different mix. Performance related pay is much
more common in the European sample, while risk management, staff appraisal, management by
objectives and results and codes of conduct are more common in Norway.
COCOPS Work Package 3, Country Report Norway – May 2013 Page 54
When asked about their use of performance indicators on an individual level, most instruments were
used to a certain degree and with little variation according to motivation. In general, there were also
small differences between the Norwegian and the rest of the sample when assessing the motivation
behind the use of performance indicators. Performance indicators are used for a variety of internal
purposes such as scrutiny, learning image building and identifying problems. Compared to other
European countries, Norwegian executives seem to use performance more to satisfy requirement
from line managers and for image-building.
On the whole, Norwegian executives have a remarkably more positive view of public administration
performance compared to their European peers. The level of social capital and trust among the
executives is rather high, and they are generally satisfied with their work and working environment.
All in all, they are also quite positive towards the development of public administration over the last
years. Most think that the quality of public administration remains more or less the same as before,
but a larger share thinks that it has improved rather than deteriorated over the last five years.
Interestingly, a considerably higher share of European executives state that the development has
gone in the wrong direction. Most Norwegian executives find improvements with regards to
questions of fair treatment and equal access to services. Furthermore, citizens’ trust in government
and general ethical behaviour among public officials are seen to improve. The most positive results
concern service quality, cost and efficiency, and innovation. Policy-relevant indicators such as social
cohesion, policy effectiveness and policy coherence and coordination are on the other hand more
ambiguously interpreted.
One possible explanation for the rather positive attitude towards the public administration and its
development is that the Norwegian public sector has to a very little degree been affected by the
financial crisis. The majority of respondents from Norway state that no approach was needed in
response to the fiscal crisis, while only 10 % of the European executives say the same. Pay cuts, pay
freezes and increased user fees are almost absent. Downsizing and lay-offs are also much less
common than in the other countries.
In addition to central government, the COCOPS survey targeted the health and employment sectors
more specifically. In Norway, both sectors have undergone quite large changes over the last years.
The welfare and employment administration has been reformed to create a more holistic service
integrating employment services, pensions and welfare benefits at both central and local level. The
health sector has also been reformed, creating regional health enterprises and new arrangements
through a comprehensive “Collaboration reform”.
The executives in the employment and health sector have a similar self-understanding and identity
pattern as their colleagues in other policy fields. However, the executives in the employment sector
perceive their goals as somewhat less ambiguous compared to other policy areas. They interact more
frequently with civil service unions and local and regional government, and tend to be more satisfied
with the coordination with local and regional bodies. The policy field also seems more politicized,
whereas the respondents here more than others report that politicians interfere in routine activities.
Also, citizens’ participation and public involvement in the reform processes is more common.
Improvement is also more up front. The reforms are less contested by unions. Service codes of
conduct and benchmarking is less used compared to the whole sample, while performance
management is more relevant here. The executives in both sectors are overall positive to the reform.

COCOPS Work Package 3, Country Report Norway – May 2013 Page 55
Overall, the executives in the health sector do not differ significantly from the rest of the sample.
They have a rather similar self-understanding, identity patterns and work context. Nevertheless,
health sector employees give more weight to tax financed services as opposed to user charges/fees.
Also, equity (as opposed to efficiency) is slightly more important for them. Finally, achieving results is
more important than following rules. As is the case for the employment sector, the health sector also
seems more politicized and controlled by politicians. The respondents here experience a higher
degree of public involvement in reforms, and report that they tend to be more driven by politicians.
The politicians also tend to use performance indicators more frequently to monitor the performance
in the health sector.
The conclusion is that the Norwegian reform landscape is a mixture of Old Public Administration,
New Public Management and post-NPM. Rather than one reform replacing previous reforms we see
that new reforms are supplementing and complementing old reforms. It is a layering process going
on producing a more hybrid and complex public administrative system. We face an interesting
combination of robustness and flexibility in the central government apparatus. 2/3 of the executives
report that they see no big changes over the past 5 years in the way public administration is run,
indicating that the reforms cannot be seen as an unconditional success.
The traditional bureaucracy has, however, been modernized and according to the administrative
executive the reforms have over all moved the public administration in a positive direction towards
a more efficiency oriented, performance focused and citizen-friendly administrative apparatus.
Service quality and transparency has improved according to the administrative executives. The
reforms do not seem to have reduced the level of trust and job satisfaction and the executives have
an overall positive view of public administration performance. This rather positive assessment as
perceived by the top bureaucrats can be understood as a combination of an absence of economic
crisis combined with a strong confidence in an active and large public sector. This combined with
coalition and minority governments (up to 2005) and a traditional administrative culture
incompatible with many NPM elements might explain why Norway has been a rather reluctant NPM
reformer and chosen an incremental path. This seems to be a reform strategy with many positive
impacts according to the top civil servants.
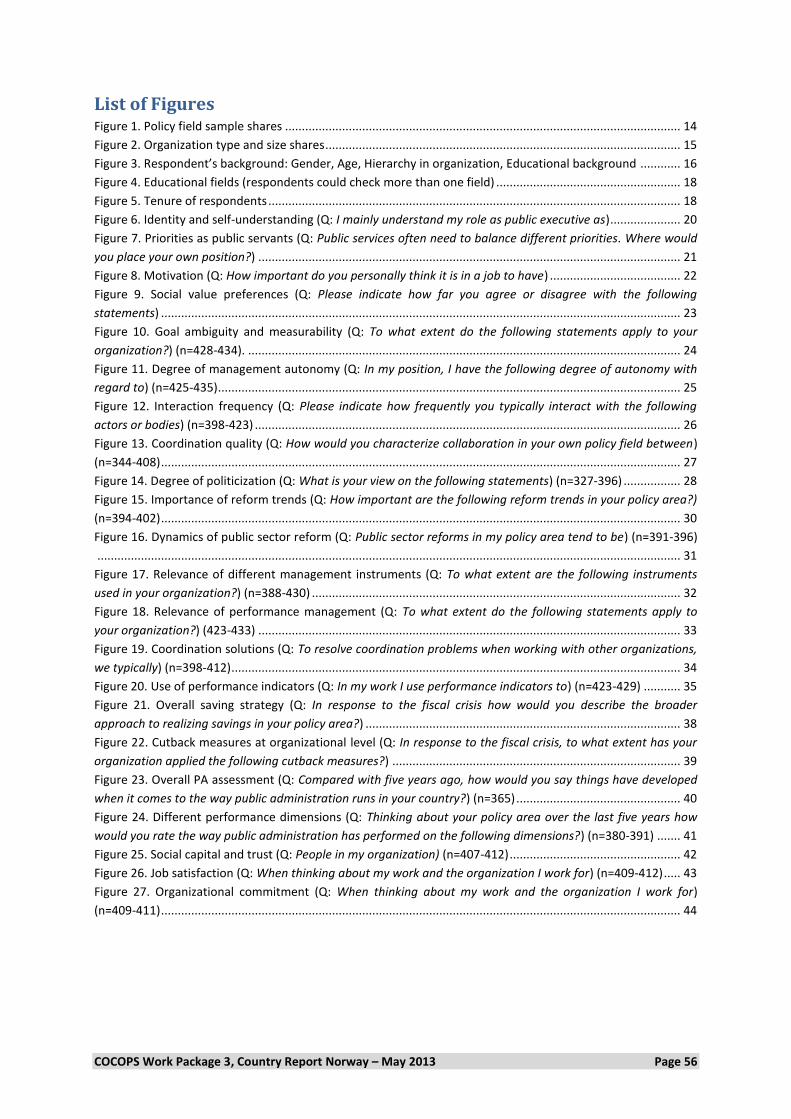
COCOPS Work Package 3, Country Report Norway – May 2013 Page 56
List of Figures Figure 1. Policy field sample shares ...................................................................................................................... 14
Figure 2. Organization type and size shares .......................................................................................................... 15
Figure 3. Respondent’s background: Gender, Age, Hierarchy in organization, Educational background ............ 16
Figure 4. Educational fields (respondents could check more than one field) ....................................................... 18
Figure 5. Tenure of respondents ........................................................................................................................... 18
Figure 6. Identity and self-understanding (Q: I mainly understand my role as public executive as) ..................... 20
Figure 7. Priorities as public servants (Q: Public services often need to balance different priorities. Where would
you place your own position?) .............................................................................................................................. 21
Figure 8. Motivation (Q: How important do you personally think it is in a job to have) ....................................... 22
Figure 9. Social value preferences (Q: Please indicate how far you agree or disagree with the following
statements) ........................................................................................................................................................... 23
Figure 10. Goal ambiguity and measurability (Q: To what extent do the following statements apply to your
organization?) (n=428-434). ................................................................................................................................. 24
Figure 11. Degree of management autonomy (Q: In my position, I have the following degree of autonomy with
regard to) (n=425-435) .......................................................................................................................................... 25
Figure 12. Interaction frequency (Q: Please indicate how frequently you typically interact with the following
actors or bodies) (n=398-423) ............................................................................................................................... 26
Figure 13. Coordination quality (Q: How would you characterize collaboration in your own policy field between)
(n=344-408) ........................................................................................................................................................... 27
Figure 14. Degree of politicization (Q: What is your view on the following statements) (n=327-396) ................. 28
Figure 15. Importance of reform trends (Q: How important are the following reform trends in your policy area?)
(n=394-402) ........................................................................................................................................................... 30
Figure 16. Dynamics of public sector reform (Q: Public sector reforms in my policy area tend to be) (n=391-396)
.............................................................................................................................................................................. 31
Figure 17. Relevance of different management instruments (Q: To what extent are the following instruments
used in your organization?) (n=388-430) .............................................................................................................. 32
Figure 18. Relevance of performance management (Q: To what extent do the following statements apply to
your organization?) (423-433) .............................................................................................................................. 33
Figure 19. Coordination solutions (Q: To resolve coordination problems when working with other organizations,
we typically) (n=398-412) ...................................................................................................................................... 34
Figure 20. Use of performance indicators (Q: In my work I use performance indicators to) (n=423-429) ........... 35
Figure 21. Overall saving strategy (Q: In response to the fiscal crisis how would you describe the broader
approach to realizing savings in your policy area?) .............................................................................................. 38
Figure 22. Cutback measures at organizational level (Q: In response to the fiscal crisis, to what extent has your
organization applied the following cutback measures?) ...................................................................................... 39
Figure 23. Overall PA assessment (Q: Compared with five years ago, how would you say things have developed
when it comes to the way public administration runs in your country?) (n=365) ................................................. 40
Figure 24. Different performance dimensions (Q: Thinking about your policy area over the last five years how
would you rate the way public administration has performed on the following dimensions?) (n=380-391) ....... 41
Figure 25. Social capital and trust (Q: People in my organization) (n=407-412) ................................................... 42
Figure 26. Job satisfaction (Q: When thinking about my work and the organization I work for) (n=409-412) ..... 43
Figure 27. Organizational commitment (Q: When thinking about my work and the organization I work for)
(n=409-411) ........................................................................................................................................................... 44

COCOPS Work Package 3, Country Report Norway – May 2013 Page 57
References Aberbach, J. D., R. D. Putnam and B. A. Rockman (1981). Bureaucrats and Politicians in Western Democracies. Cambridge/ Massachusetts/London: Harvard University Press.
Aberbach, J. D and B. A. Rockman (2006). The Past and Future of Political-Administrative Relations: Research from “Bureaucrats and Politicians” to “In the Web of Politics” and Beyond'. International Journal of Public Administration, 29(12):977-995.
Bauer, M., R. Dehouse, L. Hooghe, H. Kassim, J. Peterson and A. Thompson, (2009). The European Commission of the 21st Century: Views from the Inside. The EU-Consent Network: Last accessed 01.12.2012 at http://www.pol.ed.ac.uk/eu_consent/commission_survey
Bertelli, A., A. Lewis, and D. Nixon (2007). Survey on the Future of the Government Service Survey on the Future of Government Service. Last accessed 09.12.2012 http://www.princeton.edu/sfgs/
Bezes, P., A. L. Fimreite, P. Lidec, and P. Lægreid (2013). Understanding Organizational Reforms in the Modern State: Specialization and Integration in Norway and France. Governance 26 (1): 147-175.
Bleiklie, I. (2009). Norway as a Higher Education Policy maker: From tortoise to Eager beaver?. In C. Paradeise, E. Reale, In Bleiklie and E. Ferlie, eds. University Governance: Western European Comparative Perspective. Doerdrecht: Springer.
Byrkjeflot, H., T. Christensen and P. Lægreid (2012). Changing accountability relations in welfare state reforms. Lessons from Norway. Report 2-2012. Bergen: Stein Rokkan Centre for Social Studies.
Byrkjeflot, H. and T. Grønlie (2005). Det regionale helseforetaket – mellom velferdslokalisme og sentralstatlig styring?»The regional health enterprise – between welfare localism and central government steering)i Helse-Norge i støpeskjeen – søkelys på sykehusreformen. Bergen: Fagbokforlaget.
Byrkjeflot, H. and S. Neby (2008). The decentralized path challenged? Nordic healthcare reforms in comparison. Journal of Health Organization and Management. 22(4): 331-349
Christensen, D.A., T. Christensen, P. Lægreid and T. Midtbø (2012). “Cross-Border Coordination activities in Central Government Administration – combining organizational conditions and Individual features”. Public Organization Review, 12 (4): 367-382.
Christensen, T. (2003). Narrative of Norwegian Governance: Elaborating the Strong State,”Public Administration ,81(1):163-190.
Christensen, T., M. Egeberg, H.O. Larsen, P. Lægreid and P.G. Roness (2010). Forvaltning og politikk (Administration and politics). Second edition. Oslo: Universitetsforlaget.
Christensen, T., A. L. Fimreite and P. Lægreid (2007). Reform of Employment and Welfare Administration – the Challenge of Coordinating Diverse Public Organizations, International Review of Administrative Science, 73 (3) (September): 389-408.
Christensen, T., A. Lie and P. Lægreid (2007). Still Fragmented or Reassertion of the Centre? In T.Christensen and P.Lægreid (eds.), Transcending New Public Management. Aldershot: Ashgate.
Christensen, T. and P. Lægreid (1998). Administrative Reform Policy: The Case of Norway, International Review of Administrative Sciences, 64: 457-475.
Christensen, T. and P. Lægreid (1999). New Public Management: Design, Resistance, or Transformation? A Study of How Modern Reforms Are Received in a Civil Service System. Public Productivity & Management Review, 23(2):169-193.

COCOPS Work Package 3, Country Report Norway – May 2013 Page 58
Christensen, T. and P. Lægreid (2001). New Public Management - Undermining Political Control?. In T. Christensen and P. Lægreid (eds.), New Public Management. The Transformation of Ideas and Practice. Aldershot: Ashgate, 93-120.
Christensen, T. and P. Lægreid (2002). Reformer og lederskap. Omstilling i den utøvende makt. (Reforms and leadership. Change in the Executive). Oslo: Universitetsforlaget.
Christensen, T. and P. Lægreid (2003). Coping with Complex Leadership Roles: The Problematic Redefinition of Government-Owned Enterprises, Public Administration, 81(4):803-831.
Christensen, T. and P. Lægreid (2005). Trust in Government – the relative importance of service satisfaction, political factors and demography. Public Performance & Management Review, 28 (4): 487-511.
Christensen, T. and P. Lægreid (2008a). NPM and beyond – structure, culture and democracy. International Review of Administrative Sciences, 74(1):7-23.
Christensen, T. and P. Lægreid (2008b). The Challenge of Coordination in Central government organizations: The Norwegian case, Public Organization Review, 8(2):97-116.
Christensen, T. and P. Lægreid (2009a). Public Management Reform in Norway – Reluctance and Tensions. In Goldfinch and J. Wallis (eds.) International Handbook of Public Management Reform. Cheltenham: Edward Elgar, pp 300-316.
Christensen, T. and P. Lægreid (2009b). Organizing Immigration Policy – The Unstable Balance between Political Control and Agency Autonomy. Policy and Politics 37 (2): 161-177.
Christensen, T. and P. Lægreid (2009c). Living in the past? Change and continuity in the Norwegian Civil service. Public Administration Review, 69(5):951-961.
Christensen, T. and P. Lægreid (2010). Increased complexity in public organizations – the challenges of combining NPM and Post-NPM features. In P. Lægreid and K. Verhoest, eds. Governance of Public Sector Organizations. Proliferation, autonomy and performance. London: Palgrave Macmillan.
Christensen, T. and P. Lægreid (2011a). Democracy and administrative policy: contrasting elements of New Public Management (NPM) and post-NPM. European Political Science Review 3(1): 125–146.
Christensen, T. and P. Lægreid (2011b). Complexity and hybrid public administration - Theoretical and empirical challenges, Public Organization Review, 11(4):407-423.
Christensen, T. and P. Lægreid (2012). Competing principles of agency organization – the reorganization of a reform, International Review of Administrative Science, 78 (4): 579-596. Christensen, T. and B. G. Peters (1999). Structure, Culture and Governance: A Comparative Analysis of Norway and the United States. Lanham, Maryland: Rowman & Littlefield.
Derlien, H.U. (1992). Observations on the State of Comparative Administration Research in Europe - More Comparable than Comparative. Governance: An International Journal of Policy, 5: 279-311.
Difi (2010). Medarbeiderundersøkelsen i staten (State employee survey). Report 2010:5. Oslo: Difi.
Digitizing Public Services. Norwegian E-government Program. Oslo: Ministry of Government administration 2012.

COCOPS Work Package 3, Country Report Norway – May 2013 Page 59
Enticott, G., G. A. Boyne and R. M. Walker (2008). The Use of Multiple Informants in Public
Administration Research: Data Aggregation Using Organizational Echelons. Journal of Public
Administration and Research Theory, 19:229-53
Fimreite A.L. and P. Lægreid (2005). Statlig samordning, spesialisering og kommunalt selvstyre
(Central governmental coordination, specialization and local self governance). In NOU 2005: 6
Samspill og tillit. Om staten og lokaldemokratiet, Appendix 4, pp 175-192.
Fimreite, A.L. and P. Lægreid (2009). Reorganization of the Welfare State Administration:
Partnerships, networks and accountability . Public Management Review, 11 (3): 281-297.
Fitzpatrick, J., M. Goggin, T. Heikkila, D. Klingner, J. Machado and C. Martell (2011). A New Look at
Comparative Public Administration: Trends in Research and an Agenda for the Future. Public
Administration Review, 71(6): 821-830.
Foss Hansen, H. (2011). NPM in Scandinavia. In T. Christensen and P. Lægreid, eds. The Ashgate
ResearchCompanion to New Public Management. Aldershot: Ashgate.
Hagen, T.P. (1998). Staten, fylkeskommunane og sjukehusa: Trekantdrama utan ende? (The state,
regional authorities and the hospitals: Triangular love drama with no end in sight?), in H.Baldersheim,
H. (ed). Kan fylkeskommunen fornyast? (Can the County Council be Renewed?)Oslo: Det Norske
Samlaget pp. 155–75.
Hagen, T. P. and O.M. Kaarbøe (2006). The Norwegian hospital reform of 2002: Central government takes over ownership of public hospitals. Health Policy 76(3): 320- 333.
Hammerschmid, G., Görnitz, A., Oprisor, A., Stimac, V. (2013). Public Sector Reform in Germany:
Views and Experiences from Senior Executives. Country Report as part of the COCOPS Research
Project. Available at www.cocops.eu.
Hammerschmid, G., Oprisor, A., Stimac, V. (2013). COCOPS Executive Survey on Public Sector Reform
in Europe. Research Report. Available at www.cocops.eu.
Herfindal, S. (2004). ”Veien frem til sykehusreformen – En studie av beslutningsprosessen bak lov om helseforetak (The road to hospital reform – a study of the decision-making process behind the law of health enterprises). ATM – Skriftserie 2-008 http://www.polis.no/Publikasjonsserien/ATM-serie%202-2008_SH.pdf.
IMF (2012). IMF Executive Board Concludes 2011 Article IV Consultation with Norway. Last accessed 14.03.2013 at http://www.imf.org/external/np/sec/pn/2012/pn1209.htm
Lægreid, P., S. Opedal and I. Stigen (2005). The Norwegian Hospital Reform - balancing political control and enterprise autonomy, Journal of Health Politics, Policy and Law 30 (6): 1035-1072.
Lægreid, P. and P.G. Roness (2003). Administrative Reform Programmes and Institutional Response in Norwegian Central Government. In J. J. Hesse, C. Hood and B. G. Peters (eds.), Paradoxes in Public Sector Reform. Berlin: Duncker & Humblot.
Lægreid, P. P.G. Roness and V.W. Rolland (2010). The structural anatomy of the Norwegian state: Increased Specialization or a pendulum shift. In P. Lægreid and K. Verhoest, eds. Governance of Public Sector Organizations. Proliferation, autonomy and performance. London: Palgrave Macmillan.
COCOPS Work Package 3, Country Report Norway – May 2013 Page 60
Lægreid, P. , P.G. Roness and V.W. Rolland (2013). Agencification and Corporatization in Norway. 1947-2011. International Journal of Public Administration (Forthcoming).
Lægreid, P., P.G. Roness and K. Rubecksen (2006a). Performance Management in Practice – The Norwegian Way, Financial Accountability and Management, 22 (3): 251-270
Lægreid, P., P.G. Roness and K. Rubecksen (2006b). Autonomy and control in the Norwegian civil service. Does agency type matter?. In T. Christensen and P. Lægreid, eds. Autonomy and regulation. Coping with agencies in the modern state. Cheltenham: Edward Elgar.
Lægreid, P., P.G. Roness and K. Rubecksen (2007). Modern Management Tools in State agencies: The Case of Norway. International Public Management Journal, 10 (4): 387-41.
Lægreid, P., P.G. Roness and K. Rubecksen (2008). Performance Information and Performance Steering. In S. van der Walle and W. van Dooren (eds.) Utilizing Public Sector Performance Information. Basingstoke: Palgrave Macmillan.
Lægreid, P., P.G. Roness and K. Rubecksen (2012). Norway. In K. Verhoest, S. Van Theil, G. Bouckaert and P. Lægreid, eds. Government Agencies. Practices and lessons form 30 countries. London: Palgrave Macmillan.
Mayntz, R. and H. U. Derlien (1988). Comparative Elite Study II: Einstellungen der politisch-administrativen Elite des Bundes 1987. Universität Bamberg.
Norris, P. (1999). Critical citizens. Oxford: Oxford University Press.
NOU 2011:1. Bedre rustet mot finanskriser. Finanskriseutvalgets utredning (Better prepared for financial crises. The Financial Crisis Commission’s report. Oslo: Ministry of Finance.
Olsen, J. P. (1983). Still peaceful coexistence and revolution in slow motion?. In J. P. Olsen, ed. Organized Democracy. Oslo: Universitetsforlaget.
Olsen, J. P. (1996). Norway: Slow Learner - or Another Triumph of the Tortoise? In J. P. Olsen and B. G. Peters (eds.), Lessons from Experience. Oslo: Scandinavian University Press.
Ot. prp. nr. 12 (1998–99). «Lov om pasientrettigheter (pasientrettighetsloven)» (Patients’ Rights Act).
Pollitt, C., and G. Bouckaert (2011). Public Management Reform: A Comparative Analysis - New Public Management, Governance, and the Neo-Weberian State. Oxford University Press
Pollitt, C., S. van Thiel and V. Homburg (eds.) (2007). New Public Management in Europe. London: PalgraveMacmillan. Putnam R.D. (1976). The Comparative Study of Political Elites. Englewood Cliffs, N.J.: Prentice-Hall
Raadschelders J. C. N. and K.-H. Lee (2011). Trends in the Study of Public Administration: Empirical and Qualitative Observations from Public Administration Review, 2000–2009. Public Administration Review. 71(1):19-33.
Ridder, H.-G., H.-J. Bruns and F. Spier (2006). Managing Implementation Processes: The role of public managers in the implementation of accrual accounting – evidence from six case studies in Germany. IPublic Management Review, 8 (1):87-118.
Rothstein, B. and D. Stolle (2003). Introduction: Social Capital in Scandinavia. Scandinavian Political Studies, 26 (1):1-26.

COCOPS Work Package 3, Country Report Norway – May 2013 Page 61
Stigen, I. (2005). Eierskap, organisering og ledelse (Ownership, organization and management). In Opedal, S. og I. M. Stigen (eds.) Helse-Norge i støpeskjeen. Søkelys på sykehusreformen. Bergen: Fagbokforlaget
St.meld. 19 (2008-2009). Ei forvaltning for Demokrati og Fellesskap (An Administration for Democracy and Community). Oslo: Ministry of Government Administration.
St.meld. 47 (2008-2009). The Coordination Reform. Oslo: Ministry of Health.
Trondal, J. (2010). An Emergent European Executive Order. Oxford: Oxford University Press.
Verhoest, K., S. van Thiel, G. Bouckaert and P. Lægreid (eds.) (2012). Government Agencies. Practices and Lessons from 30 Countries. Houndmills, Basingstoke: Palgrave Macmillan.
Van Thiel, S. (2012). Comparing Agencies Across Countries, in Verhoest et al. (eds.) Government Agencies. Practices and Lessons from 30 Countries. Houndmills, Basingstoke: Palgrave Macmillan.
Walker, R. M. and G. Enticott (2004). Exploring variations in management reform values and actions: An empirical analysis. Journal of Public Administration, Research and Theory, 14:417–34.
Wright, V. (1994). Reshaping the state. The implications for public administration, West European Politics, 17, 102-137.