Public Sector Wage Policy and Labor Market Equilibrium: A ...
Upload
larissa-mollickCategory
view
214download
0
Public Sector Economics
Tax Incidence
Private Sector Response to Public Redistribution
• price changes– partial equilibrium– general equilibrium
• migration
• altruism
• insurance markets

Outline of Topics• partial equilibrium
– excise tax theory• elastic agents bear less• principle of comprehensive cost
– cigarette tax incidence
• general equilibrium theory• capital tax incidence• incidence of taxes and spending by
– income group– cohort social security
• paternalism

q
pindustry cost curve
industry demand
B/C = depends only on dp/dt
Tax on Demanders
pre-tax price
*q
after-tax price
no-tax price
A
B D
B+D = borne by demanders
F
CE
C+E = borne by suppliers
D+E = dwc
B+C = government revenue

Partial Equilibrium Model• general results
– “elastic agents bear less”– doesn’t matter whether the tax is levied on the
buyer or seller
• special results– only supply and demand elasticities matter– only suppliers and demanders in the taxed market
are affected– both suppliers and demanders are harmed by the tax
Incidence in the “Long Run”• “long run” = capital can adjust
• if capital is elastically supplied in the long run, than capital will not bear the burden of taxes
• theories of the supply of capital– international trade– economic growth theories

Descriptions of Policy Incidence
• dimensions of government redistribution– income classes– age/year of birth– factor ownership– occupation
• instruments of redistribution– taxes– spending– regulation
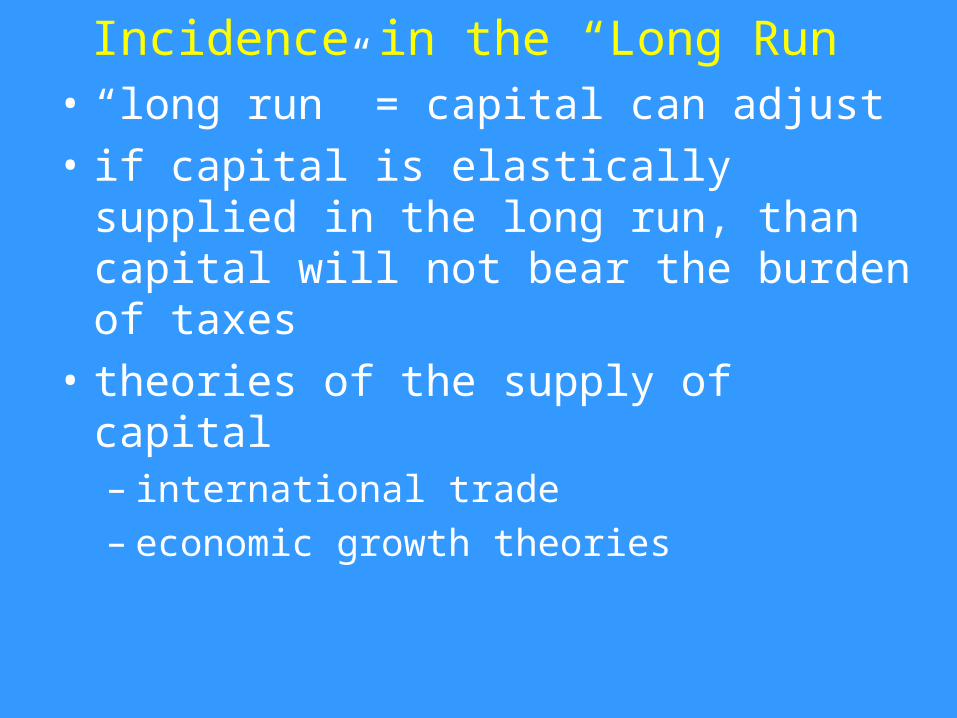
Pechman’s Study of Tax Incidence• people distinguished only by their annual income• statutory incidence only
– savings and work are fixed– consumption patterns are fixed, and do not vary by income class– variety of assumptions regarding incidence of corporate income,
property, and payroll taxes• IIT: 100% on payer• sales and excise: 100% on consumers• payroll tax: 75-100% on workers• property tax: 100% on landholders and/or capital owners• corporate income: variety
• MERGE files– start with CPS– for filing population, use Form 1040 income information for
“similar” families in the IRS database– CPS necessary because it is a random sample
• benchmark: proportional income tax

Pechman’s Study of Tax Incidence: Results
• no significant difference from flat tax, except at very top and bottom
• results for top and bottom are mild, and vary across incidence models
• transfers– appear very progressive in Pechman– but Social Security is a big part of transfers, and is
not so progressive w.r.t. lifetime income
Regressive Taxes in Western Europe
• Western European countries – known for their generous welfare states
– Sometimes known for progressive income taxes
• However, income tax is not the only tax especially in Western Europe
• Other taxes– payroll taxes, sales taxes, excise taxes, property taxes
– often are regressive
• Western European taxes are more regressive because they are less income-tax intensive

0
5
10
15
20
25
30
35
First Second Third Fourth Fifth Sixth Seventh Eighth Ninth Tenth
Sta
cked
Per
cen
tage
of
Inco
me
Income Distribution Decile (poorest to richest)
Who Pays the Taxes, All Tax Types, 2005
TOTAL = stacked sumfederal personal income taxes (negative for deciles 1-4)all taxes except federal PIT

0
10
20
30
40
50
60
First Second Third Fourth Fifth Sixth Seventh Eighth Ninth Tenth
Per
cen
tage
of
Inco
me
Income Distribution Decile (poorest to richest)
Who Pays the Taxes, All Tax Types, 2005
France
U.S.

Table 4.5. Alternative measures of progressivity of taxes in selected OECD countries, mid-2000s
1. Share of taxes of richest decile
2. Share of market income of richest decile
3. Ratio of shares for richest decile (1/2)
Australia 36.8 28.6 1.29
Austria 28.5 26.1 1.10
Belgium 25.4 27.1 0.94
Canada 35.8 29.3 1.22
Czech Republic 34.3 29.4 1.17
Denmark 26.2 25.7 1.02
Finland 32.3 26.9 1.20
France 28.0 25.5 1.10
Germany 31.2 29.2 1.07
Iceland 21.6 24.0 0.90
Ireland 39.1 30.9 1.26
Italy 42.2 35.8 1.18
Japan 28.5 28.1 1.01
Korea 27.4 23.4 1.17
Luxembourg 30.3 26.4 1.15
Netherlands 35.2 27.5 1.28
New Zealand 35.9 30.3 1.19
Norway 27.4 28.9 0.95
Poland 28.3 33.9 0.84
Slovak Republic 32.0 28.0 1.14
Sweden 26.7 26.6 1.00
Switzerland 20.9 23.5 0.89
United Kingdom 38.6 32.3 1.20
United States 45.1 33.5 1.35
OECD-24 31.6 28.4 1.11
B. Percentage share of richest decile
Calculating the Income Incidence of Social Security
• annual cross-sections show the “poor” receive most of the SS expenditures, but do not pay much of taxes– eg., Musgrave et al (1974, Table 6)– generational accounting = focus on age-dimension rather
than income dimension– stratify by both income and year of birth
• what is the lifetime relation between income and years spent in school?
• payroll tax caps• some portion of benefits may be paid from general
revenue. Is the general tax system progressive?• payroll tax rates across occupations

Calculating the Income Incidence of Social Security (cont’d)
• special treatment of government employees– do they tend to be rich or poor?– is the supply of government employees competitive?
• benefit receipt often requires knowledge of eligibility and/or infrastructure– not the same with tax payments– is knowledge correlated with lifetime income?
• differential valuation of benefits• legislative exclusions
– minorities. eg., Jamaica, Rhodesia, South Africa– nonunion members– agriculture– trend is toward eliminating exclusions

Calculating the Income Incidence of Social Security (cont’d)
• progressivity of the annual benefit formula• SS OASDI paid as a life annuity
– more life –> more benefits received– what is the relation between lifetime income and mortality?
• health benefits paid as reimbursement for medical procedures, etc.– more life –> more benefits received– when alive, more visits to doctor/hospital –> more benefits
received– what is the relation between visits and lifetime income?
• years-of-participation rules for eligibility; SI incidence• SS crowds out other (more progressive?) public
programs

Generational Accounting
• date of birth accounts– each cohort’s NPV of taxes - transfers, forward from birth– for a self-financed transfer program with negligible admin costs,
sum to PV zero across cohorts (including unborn and deceased cohorts in the sum)
– more generally• cohort sum to PV of (past & present) gov. purchases• what is the incidence of these purchases?
– can be expressed as:• $ per cohort member• $ per NPV of taxes (Kotlikoff critique)• IRR
• remaining lifetime accounts (Kotlikoff)– each cohort’s NPV of taxes & benefits, forward from today– sum across cohorts to debt value + PV of future purchases– based entirely on estimates of future tax & transfer rules

IRR as a measure of Generational Incidence
helpfult isn'but ),%25 ( raises
%505.0,1
to
00.1,1
adds solution"dilution "
)best , (2nd %500.3,2
%606.1,1
00.1,1
olden payment whnet tax s'cohort
youngen payment whnet tax s'cohort
10
10
10
10
10
1
0
IRR
IRRTT
IRRTT
NPVIRRIRRTT
IRRTT
IRRTT
iT
iT
ii
ii
ii
ii
ii
i
i

Magic Trick 1: Combine SS with Magic Trick 1: Combine SS with Profitable Government EnterpriseProfitable Government Enterprise
SSA (NPV = 0)
Profitable Enterprise(NPV > 0)

Magic Trick 1: Combine SS with Magic Trick 1: Combine SS with Profitable Government EnterpriseProfitable Government Enterprise
SSA (NPV = 0)
Profitable Enterprise(NPV > 0)

“REFORMED”
SSA that can spend more than it taxes
Magic Trick 1: Combine SS with Magic Trick 1: Combine SS with Profitable Government EnterpriseProfitable Government Enterprise

Generational Accounts Feature Present Values
0,accountbirth of date
account lifetime remaining s'
purchases government year
life oflength scohort' rate,interest
transfersofnet taxesyear s'cohort
0,
,)(
0
000
ii
riD
ssii
rti
D
issii
sir
tit
rt
tt
rt
t
t
Dtiit
rt
tt
rt
t
t
Dtiit
rt
t
it
VeTeV
TeTei
bgeTe
geTe
tg
Dr
tiT

Generational Accounting – Some Results
• large redistribution in the age dimension– from postwar generations to prewar generations (eg., Leimer)
– from unborn generations to current generations (Kotlikoff)
– old age public pensions are the main mechanism
– education spending hardly reverses this
– current laws in most, but not all, countries (among those studied) imply redistribution from unborn generations
• other (obvious) results– cutting OASDI benefits hurts older generations
– raising the sales tax to finance constant OASDI benefits hurts younger generations less than raising the payroll tax
– unavoidable legacy

Social Security Reforms• unavoidable legacy: since older cohorts, younger
cohorts must do poorly• unless
– NPV’s do not sum to zero– ie, combine Social Security with a profitable government
enterprise
• viable government enterprises?– buying stocks and selling bonds– reducing tax distortions has positive NPV– charging for immigration
• what is the connection between the government enterprise and SS? Would the enterprise be profitable without SS?
• example: letting SS earn the pretax return = reducing capital taxes

Distortions and Redistribution• are distortions a necessary but unintended byproduct of
redistribution?– standard public finance view– but why are “strings attached” to the transfers?– can this apply to “universal” participation programs?
• is redistribution a necessary but unintended byproduct of distortion?– paternalism– correcting market failures– producer interests– tax incidence is very different
• distinguishing these models– compare magnitude of distortions with magnitude of redistribution– look at take-up rates– are distortions in the direction of luxury or inferior goods?– is the statutory incidence against the poor?– what determines the markets for intervention?

Three Versions of Paternalism• consumption-based paternalism
– literal consumption externality/merit good/impure altruism
• information-based paternalism– arises from pure altruism– disagreement about the probability of various contingencies
– but is force necessary? Why not communicate the information?
• strategically-induced paternalism– arises from pure altruism, and the timing of decisions– e.g., Samaritan’s Dilemma, parents relying on their children for
elderly support– unfunded mandate enhances efficiency, while helping the
Samaritan at the expense of the beneficiary

Strategically-Induced Paternalism• consumption over time: c1 and c2
– superscripts r, p still indicate rich poor
• second stage– rich make voluntary transfer to the poor
– poor consume the sum of their savings and this transfer
– no government at this stage
– savings from previous period denoted mr and mp
– second stage decision rules are:
– assume: the rich are altruistic enough, and/or poor are poor enough
–> positive and equal partial derivatives of c2p(mp,mr) in the interval (0,1)
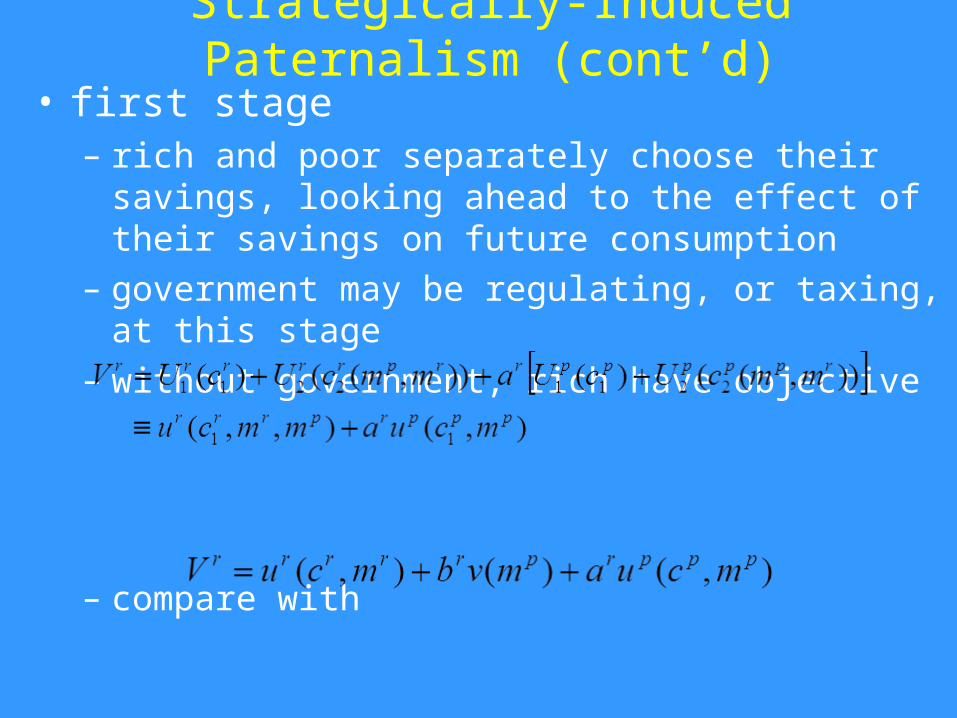
Strategically-Induced Paternalism (cont’d)
• first stage– rich and poor separately choose their savings, looking ahead
to the effect of their savings on future consumption
– government may be regulating, or taxing, at this stage
– without government, rich have objective
– compare with

Differential Valuation• if paternalism is operative, differential valuation is
necessarily an exercise in extrapolation• “structural” approach
– build a numerical model of demand– choose utility parameters (or demand elasticities)– calculate compensating variation or consumer surplus
• prices from secondary markets– resale of in-kind transfers. but is the existence of a resale
market consistent with paternalism?– hedonics. also applicable when differential valuation derives
from the public production function (eg., public housing)
– contingent valuation