Public Private Partnerships In Municipal Solid Waste ...
82
Public Private Partnerships in Municipal Solid Waste Management Potential and Strategies
Transcript of Public Private Partnerships In Municipal Solid Waste ...

`
Public Private Partnerships in
Municipal Solid Waste Management
Potential and Strategies

2 | P P P s i n M u n i c i p a l S o l i d W a s t e M a n a g e m e n t i n I n d i a

3 | P P P s i n M u n i c i p a l S o l i d W a s t e M a n a g e m e n t i n I n d i a
© All Rights Reserved, Athena Infonomics
The information contained in this report prepared by Athena Infonomics India Pvt. Ltd. is furnished
for information purposes only. While every effort has been made to ensure the accuracy of
information presented in the report, Athena Infonomics India Pvt. Ltd. makes no representations or
warranties regarding the accuracy or completeness of such information and expressly disclaims any
liabilities based on such information or on omissions there from. The material presented in the
report can be used in academic or professional work with appropriate citation.

4 | P P P s i n M u n i c i p a l S o l i d W a s t e M a n a g e m e n t i n I n d i a
This report has been prepared with support from the British High Commission,
through its Prosperity Fund, India Programme

5 | P P P s i n M u n i c i p a l S o l i d W a s t e M a n a g e m e n t i n I n d i a
CONTENTS
Acknowledgements ........................................................................................................... 8
Methodology ..................................................................................................................... 9
Abbreviations .................................................................................................................. 10
Preface ............................................................................................................................12
Executive Summary ......................................................................................................... 14
Defining Municipal Solid Waste………………………………………………………………………………19
I.1 MSW — Quantity & Characteristics…………………………………………………………………..19
I.3 Institutional Framework for MSW Management …………………………………………………23
I.4 MSW Management — Partnerships by ULBs………………………………………………………24
Current State and Gaps ..................................................................................................... 32
II.1 Existing Performance Standards……………………………………………………………………….32
II.2 Factors Contributing to Poor Service Delivery……………………………………………………..35
Private Sector Participation in SWM………………………………………………………………………..41
III.1 Need for Private Sector Participation………………………………………………………………..41
III.2 Potential for Private Sector Participation…………………………………………………………..45
III.3 Strategies for Private Sector Participation…………………………………………………………50
III.4 Public-Private Partnership Models: Issues and Lessons………………………………………..60
Conclusion and future measures ......................................................................................... 77
Appendix I ....................................................................................................................... 78
References ...................................................................................................................... 80

6 | P P P s i n M u n i c i p a l S o l i d W a s t e M a n a g e m e n t i n I n d i a
LIST OF FIGURES
Figure 1.1: Total and Per Capita Waste Generation ................................................. 19
Figure 1.2: Per Capita Waste Generation (2011): A Few Select Countries ................. 20
Figure 1.3: MSW Characteristics (1996 and 2005) ................................................... 21
Figure 1.4: MSW Value Chain ............................................................................... 22
Figure 1.5: Institutional Framework for MSW Management .................................... 24
Figure 1.6: Stakeholder Map of Integrated SWM Project at Guwahati ..................... 27
Figure 1.7: Community-Based For-Profit Decentralized SWM Systems .................... 29
Figure 2.1: Status of MSW Management — Class IA, IB & IC Cities .......................... 34
Figure 2.2: Backlogs of Service Level Benchmarks ................................................. 35
Figure 3.1: MSW Generation: Past, Current & Futu re (MTD) .................................... 41
Figure 3.2: Future Land Requirement for Landfill in India ...................................... 42
Figure 3.3: Combined Budgetary Transactions — Centre & State (` Crores) ............. 43
Figure 3.4: SWM Projects at State Level undertaken as Public Private Partnerships . 46
Figure 3.5: Investment Requirement in SWM in India -2031 (` Crores) ...................... 47
Figure 3.6: Sharing of Project Cost: JnNURM Funded SWM Projects ....................... 48
Figure 3.7: State-wise Investments underway through JnNURM .............................. 49
Figure 3.8: MSW Management Services Market: Revenue Forecast (2008 -09) .......... 50
Figure 3.9: MSW Management Services Market –Revenue Breakup Value Chain Wise 50
Figure 3.10: Financial Equilibrium Trap of ULBs .................................................... 54
Figure 3.11: Structure of the PPP model in Tirupur ................................................. 61
Figure 3.12: Value Chain for Processing and Disposal of Waste ............................... 64
Figure 3.13: Value Chain for Collection and Transportation of Waste ...................... 65
Figure 3.14: Stakeholder Model of a Reverse Integrated Solid Waste Management
Project .............................................................................................................. 66
Figure 3.15: Timeline ISWM in Hyderabad ............................................................. 69
Figure 3.16: Stakeholder Map of MSW Management in Hyderabad .......................... 70
Figure 3.17: Sharing of Solid Waste in Hyderabad .................................................. 72
Figure 3.18: Stakeholder Mapping of Timarpur-Okhla Integrated Waste Management
Project .............................................................................................................. 74

7 | P P P s i n M u n i c i p a l S o l i d W a s t e M a n a g e m e n t i n I n d i a
LIST OF EXHIBITS
Exhibit 1.1: Forms of Partnership by ULBs for MSWM ............................................ 26
Exhibit 2.1: MSWM Service Level Benchmarks and Average ULB Performance ......... 33
Exhibit 3.1: Pre and Post Private Sector Participation in SWM in a few Cities/Towns 44
Exhibit 3.2: Major Determinants of Financial and Operational Model of MSWM ........ 51
Exhibit 3.3: Daily Waste Generation in Class I Cities in India ................................... 52
Exhibit 3.4: Waste Generation in Cities in India ..................................................... 52
Exhibit 3.5: Availability of Central and State Gra nts .............................................. 52
Exhibit 3.6: Strategy for large cities (Population > 1 million) .................................. 55
Exhibit 3.7: Strategy for Small Cities (Population < 1 million) ................................. 55
Exhibit 3.8: Availability of Land in Indian Cities .................................................... 56
Exhibit 3.9: Composition of Waste in India ........................................................... 57
Exhibit 3.10: Centralized vs. Decentralized Solid Waste Management S ystems ........ 68
Exhibit 3.11: Increasing Scope of PPPs in Hyderabad…………………………………………….68
LIST OF BOXES
Box 1.1: Salient Features of MSW (Management & Handling) Rules, 2000 ................ 23
Box 1.2: Waste Concerns Integrated Resource Recovery Centre .............................. 30
Box 2.1: Solid Waste Management in Berhampur (Odisha) ..................................... 35
Box 2.2: Solid Waste Management in Nashik (Mah arashtra) ................................... 37
Box 2.3: Waste to Energy Plant – Municipal Corporation of Delhi ........................... 40
Box 3.1: India’s Experience with Composting ........................................................ 57
Box 3.2: Level of Citizens/Community Participation .............................................. 59

8 | P P P s i n M u n i c i p a l S o l i d W a s t e M a n a g e m e n t i n I n d i a
ACKNOWLEDGEMENTS
This report would not have been possible without the co-operation of various experts and
practitioners of Public Private Partnerships in Municipal Solid Waste Management in India. Their
willingness to share their experiences and insights has helped us ground this report in practical
insights.
We would like to thank Mr. Satya Adamala, Executive Assistant to the CEO, Ramky Enviro
Engineers Limited; Mr. A. N. Satish Chandra, Vice Presidents (Projects), IVRCL; Mr. K. H. K. Prasad,
Chief Operating Officer – Water & Environmental Projects Division, IVRCL and Mr. Yogesh Rattan,
Senior Executive of Business Development, A2Z Infrastructure Ltd. for providing valuable
information for preparing the case studies.
We also thank all the participants at the ‘Workshop on Public Private Partnerships in Municipal Solid
Waste Management’, held in Chennai on 26th March, 2012. Mr. G. Dattatri, former Chief Urban
Planner, Chennai Metropolitan Development Authority (CMDA), Dr. Ashwin Mahalingam, Assistant
Professor, IIT Madras; Mr. T. Vijay Anand, Asst. General Secretary, ExNORA International; Mr. R.
Sarto, CEO, Integrated Waste Management & Urban Services Company, (IWMUST); Mr. Narendra
Babu, Managing Director, Venner Organic Fertilizer (P) Limited.; Mr. K.S. Ramachandran, CEO,
Popular Carbonic Pvt. Ltd.; Dr. Sultan Ahmed Ismail, Head – Department of Biotechnology, The
New College; Ms. Naina Shah, Independent Environmental Services Expert, Mr. Swaminathan
Krishnamoorthy, Associate Director, Climate Change and Sustainable Services, Ernst & Young Ltd.;
Mr. Narasimhan Santhanam, Director, Energy Alternatives India; Mr. Amalan, Independent Solid
Waste Management Consultant.
We thank our advisors, Dr. S. Narayan, former Finance Secretary, Government of India; Mr.
Devasahayam (IAS Retd.); Ms. Revathy Ashok, CEO and Founder Iris Consulting; and Mr. G.
Dattatri, for their guidance.
We thank Mr. A.S. Bhal, Economic Advisor, Ministry of Urban Development, Government of India
and Mr. S Krishnan, Expenditure Secretary, Department of Finance, State Government of Tamil
Nadu for their inputs on key aspects pertaining to the policy and implementation of urban
infrastructure programs. We also thank the British High Commission for their financial support for
undertaking this study. In particular we thank Ms. Aarti Kapoor, Programme Manager, British High
Commission, New Delhi for her constant encouragement during the project.

9 | P P P s i n M u n i c i p a l S o l i d W a s t e M a n a g e m e n t i n I n d i a
METHODOLOGY
The methodology adopted to assess Municipal Solid Waste Management (SWM) practices in the
urban sector constitutes a well-balanced mix of theory and practice. The theory underlying the key
conclusions/findings was developed by undertaking an extensive review of extant literature. In
addition to the inferences drawn from secondary research, insights were gathered from
practitioners of Public Private Partnerships in Solid Waste Management, through a number of
primary interviews and focused group discussions. Here four solid waste management projects
undertaken via the PPP mode were chosen and the issues faced by stakeholders in each of the
chosen cases were documented and lessons were drawn.
A workshop on “Potential and Strategies for Public Private Partnerships in the Municipal Solid
Waste Management Sector” was organized on 26th March, 2012 in Chennai, to discuss the issues
and challenges faced by stakeholders in adopting PPPs. The workshop brought together a
distinguished group of professionals comprising of private waste management companies,
academics, environmental organizations and citizen representatives. A quick perusal of PPP
practices in MSW and inferences gathered from our primary and secondary research, display the
presence of two broad contending PPP approaches in the SWM sector namely centralized
(technology driven) and decentralized (community driven) models. The specific pre-requisites and
conditions that support one system/practice over the other has been analyzed in greater detail in
the report and the merits and the demerits of centralized waste management approaches vis-a-vis
decentralized community based waste management practices and their potential to co-exist in
varying urban contexts has been explored.

10 | P P P s i n M u n i c i p a l S o l i d W a s t e M a n a g e m e n t i n I n d i a
ABBREVIATIONS
3R Reduce, Reuse, Recycle
ADB Asian Development Bank
AUDA Ahmedabad Urban Development Authority
BBMP Bruhat Bengaluru Mahanagara Palike
BOO Build Own Operate
BOOT Build Own Operate Transfer
BOT Build Operate Transfer
BMC Berhampur Municipal Corporation
CAGR Compounded Annual Growth Rate
C/N Carbon-Nitrogen Ratio
C&T Collection & Transportation
CDP City Development Plan
CDM Clean Development Mechanism
CPCB Central Pollution Control Board
CPHEEO Central Public Health Engineering and Environmental Organization
CPP Community Public Private Participation
DDA Delhi Development Authority
DEA Department of Economic Affairs
EOI Expression of Interest
GDP Gross Domestic Product
GHMC Greater Hyderabad Municipal Corporation
GMMC Greater Mumbai Municipal Corporation
GOAP Government of Andhra Pradesh
GOTN Government of Tamil Nadu
HPEC High Powered Expert Committee
HUDA Hyderabad Urban Development Authority
IEC Information, Education, Communication
ISWM Integrated Solid Waste Management
INCAP Infrastructure Corporation of Andhra Pradesh
J&K Jammu & Kashmir
JnNURM Jawahar Lal Nehru National Urban Renewal Mission
JUIL Jindal Urban Infrastructure Limited
Kcal Kilo Calorie
Kg Kilogram
KIIT Kalinga Institute of Information Technology
KMC Kanpur Municipal Corporation
Kwh Kilowatt Hour
LOI Letter of Intent
MA&UD Municipal Administration and Urban Development
M&H Management and Handling
MCD Municipal Corporation of Delhi
MDG Millennium Development Goals

11 | P P P s i n M u n i c i p a l S o l i d W a s t e M a n a g e m e n t i n I n d i a
MOEF Ministry of Environment & Forest
MoU Memorandum of Understanding
MOUD Ministry of Urban Development
MSW Municipal Solid Waste
MSWM Municipal Solid Waste Management
MTD Metric Tonnes per Day
MT Million Tonnes
NA Not Available
NDMC New Delhi Municipal Corporation
NGOs Non-Governmental Organization
NIMBY Not in My Backyard Syndrome
NOC No Objection Certificate
O&M Operations and Maintenance/Management
PIL Public Interest Litigation
PMC Pune Municipal Corporation
PPP Public Private Partnerships
PSP Private Sector Participation
RDF Refuse Derived Fuel
REEL Ramky Enviro Engineering Ltd.
RMC Rajkot municipal Corporation
RRC Resource recovery Centers
RWAs Resident Welfare Associations
SHGs Self-Help Groups
SPCBs State Pollution Control Boards
SWaCHS Solid Waste Collection and Handling
SWM Solid Waste Management
TOWMPCL Timarpur Okhla Waste Management Project
TNPCB Tamil Nadu Pollution Control Board
TMC Tirupur Municipal Corporation
TNUDF Tamil Nadu Urban Development Fund
TPD Tonnes per Day
UDHR United Nations Declaration of Human Rights
UIDSSMT Urban Infrastructure Development Scheme for Small and Medium Towns
ULBs Urban Local Bodies
UNDP United Nations Development Programme
UNICEF United Nations International Children’s Education Fund
UNESC United Nations Economic and Social Council
VNV Vijayanagara Nagarika Vedike
WtE Waste to Energy

12 | P P P s i n M u n i c i p a l S o l i d W a s t e M a n a g e m e n t i n I n d i a
PREFACE
This report is part of a broader research exercise that aims to provide implementation guidelines
and policy recommendations for catalyzing Public-Private Partnerships (PPPs) in the social sectors
viz., urban water supply, municipal solid waste management and skill development.
This report attempts to describe the status of municipal waste management (MSW) system in India,
highlight key issues & challenges faced by various stakeholders in the MSW management space and
gauge the potential for private sector participation in managing and delivering Municipal Solid
Waste. The report also describes strategies that can be pursued by ULBs while planning for
management of municipal solid waste. Other forms of waste like hazardous waste and e-waste etc.
are not included in the scope of this report.
The rest of the report is structured as follows:
Chapter I describes the definition and related concepts of MSW – waste quantity and characteristic
in India, maps the institutional framework for management of municipal waste in the country and
discusses the existing waste management practices.
In Chapter II, the current status of MSW management and the associated factors for poor service
delivery has been discussed for each segment of the MSW value-chain.
Chapter III gauges the potential for public private partnerships (PPPs) in municipal waste
management sector and discusses the strategic framework to enhance PPPs for improving
efficiency and leveraging private capital wherever required
Finally Chapter IV concludes with next steps and the way forward.

13 | P P P s i n M u n i c i p a l S o l i d W a s t e M a n a g e m e n t i n I n d i a
Public Private Partnerships in Solid Waste Management Potential and Strategies
Ankit Kumar Chatri
Arslan Aziz
Public Policy Team, Athena Infonomics
May, 2012

14 | P P P s i n M u n i c i p a l S o l i d W a s t e M a n a g e m e n t i n I n d i a
EXECUTIVE SUMMARY
BACKGROUND
Waste is a major health hazard that
undermines people’s right to a safe life.1 All
forms of waste — municipal, bio-medical, e-
waste, or industrial, if not treated and
disposed carefully are a threat to the health
of people as well as the environment.
Anaerobic degradation of waste at landfill
sites produces methane — a greenhouse gas
that is 20 times more harmful than carbon
dioxide. Filth and garbage on streets facilitate
spread of diseases like malaria, plague;
making a significant dent on a country’s
prospects of achieving the Millennium
Development Goals (MDG).2
With waste generation rates set to more than
double over the next twenty years in low and
middle income countries, the costs of
managing the waste is also expected to
witness a steep rise, with cost increases being
most severe in low income countries (more
than 5-fold increases) followed by middle
income countries (more than 4-fold
increases).
Observations made from secondary research
also show that developing nations lag behind
1 India is a party to United Nation’s Universal Declaration of Human Rights (UDHR) which states that everyone has a right to life, liberty and security of person. Rights that relate specifically to the ability to live in good health are embedded in the declaration. See, Introduction: Safety as a Human Right in ‘People’s Right to Safety’ Health & Human Rights, Mohan D., (2003). 2 India has the highest incidence of TB in the world accounting for 20% of the total cases and the incidence of malaria being 1.51%. Source: MDG - Status of India Report 2010, MOSPI, GOI.
the developed countries when it comes to the
efficient delivery of waste management
services, despite the magnitude of
expenditure remaining similar /comparable.3
This can be traced back to the differences in
waste management practices observed
across low, middle and high income
countries. Low-income countries continue to
spend most of their SWM budgets on waste
collection, with only a fraction going toward
disposal. In developing and transitional
countries, while large investments are being
made to improve the delivery of solid waste
management services, lack of sufficient
emphasis on reduction and segregation at
source, insufficient allocation of funds for
processing and disposal, poor accountability
owing to weak regulatory frameworks,
presence of a large informal sector and
unregulated markets for recyclables, have led
to sub optimal utilization of capacities and
poor service delivery systems.
On the contrary during the last two decades,
high-income countries have taken up
recycling as an integral part of their waste
(and resource) management systems, and
have invested heavily in both physical
infrastructures and communication strategies
to improve their processing and disposal
capabilities. This has proven to be an efficient
3 MacFarlane in his study on expenditure pattern on urban waste management by ULBs in major cities of the world found that cities in both developing and industrialized countries did v not spend more than 0.5 % of the per capita GDP. Please refer to ‘What a Waste: Solid Waste Management in Asia,’ World Bank (1999), for further details.

15 | P P P s i n M u n i c i p a l S o l i d W a s t e M a n a g e m e n t i n I n d i a
alternative to expensive landfills, incineration
and other treatment and disposal options.
MUNICIPAL SOLID WASTE
MANAGEMENT IN INDIA – CURRENT
STATUS
In India, the responsibility of waste
management lies with Urban Local Bodies
(ULBs) due to the public and local nature of
the service.
Since MSW is inextricably linked to
urbanization and economic development, the
nature and constitution of MSW in India
differs greatly, when compared to MSW in
other high-income countries. 4 The
composition of MSW at generation sources
and collection points in India is observed to
mainly consist of a large organic fraction (40–
60%), ash and fine earth (30–40%), paper (3–
6%) and plastic, glass and metals (each less
than 1%).5
However, with most cities/towns urbanizing
rapidly there has been a marked shift in the
quantities and quality of waste generated
across the country, in turn contributing to a
rising deficit between the demand for MSW
services and the current capacities among
ULBs to service the same.
In India, segregation and storage of MSW at
source is lacking and the decomposable and
non-decomposable wastes are often disposed
off at a common communal dustbin/disposal
centre. The collection efficiencies are also
4 Please refer to (Gupta et al., 1998; Shannigrahi et al., 1997; Jalan and Srivastava, 1995) for further details
seen to be poor, at around 70% in most Indian
cities and continue to be predominantly
manual in nature.6 Transfer stations are rarely
used and the same vehicle that collects refuse
from the individual communal bins is also
responsible for taking it to the processing or
the disposal site. Collection and
transportation activities constitute
approximately 80–95% of the total budget of
MSWM; hence, it forms a key component in
determining the economics of the entire
MSWM system. On the contrary, disposal and
treatment of waste is an underinvested area
and open, uncontrolled and poorly managed
landfills are a common feature across most
Indian cities and town.7
INSTITUTIONAL INITIATIVES
The overarching framework for management
of MSW in the urban areas was created by the
Ministry of Environment & Forest in 2000
with the enactment of MSW (Management &
Handling) Rules, 2000 under the Environment
Protection Act, 1986 that entrusted the ULBs
with the responsibility of managing MSW.
5 For details, please see, http://www.unc.edu/courses/2009spring/envr/890/002/readings/SolidWasteIndiaReview2008.pdf 6 A key trend in collection of MSW that is unique to low to middle income countries like India is the presence of a large informal sector that plays an active role in collection. The rag pickers work day and night to collect the recyclable materials from the streets, bins and disposal sites for their livelihood, thereby significantly reducing the role of the Government in recovering secondary materials form the waste. 7 A recent pilot study by Ministry of Urban Development to assess the performance of the ULBs relative to certain benchmarks in select cities and towns in the country showed that only 8 % of the total MSW generated actually underwent scientific disposal.
16 | P P P s i n M u n i c i p a l S o l i d W a s t e M a n a g e m e n t i n I n d i a
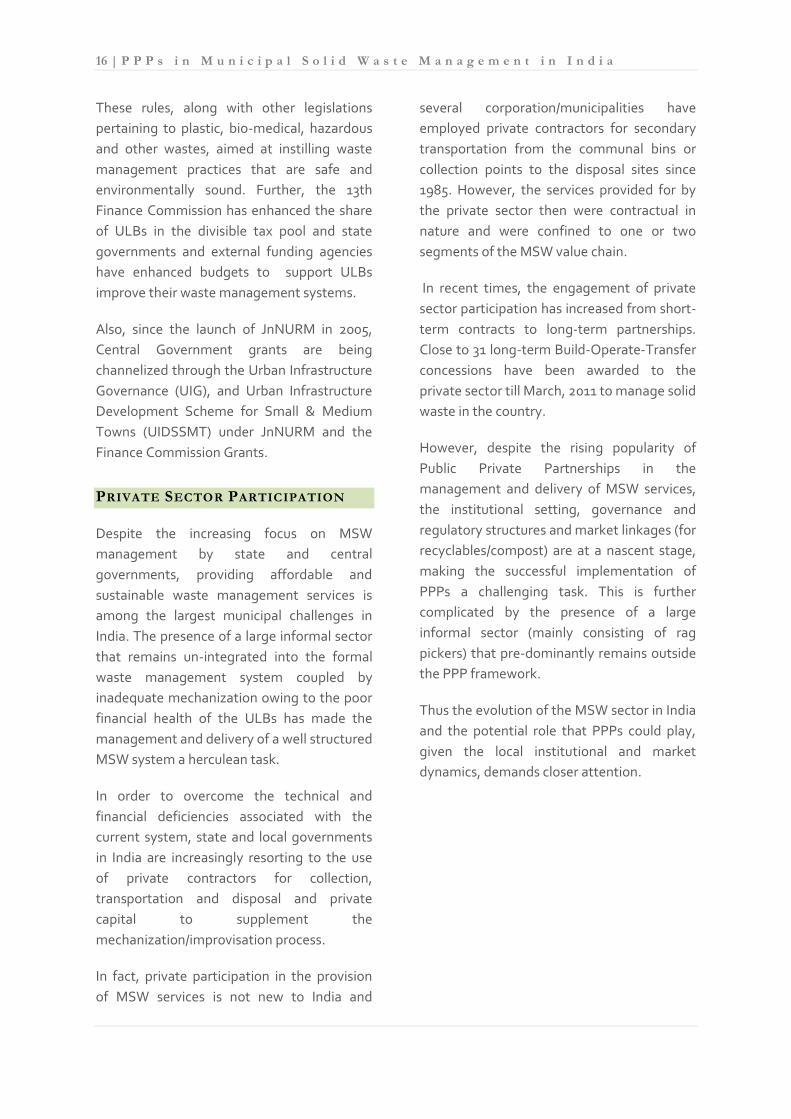
These rules, along with other legislations
pertaining to plastic, bio-medical, hazardous
and other wastes, aimed at instilling waste
management practices that are safe and
environmentally sound. Further, the 13th
Finance Commission has enhanced the share
of ULBs in the divisible tax pool and state
governments and external funding agencies
have enhanced budgets to support ULBs
improve their waste management systems.
Also, since the launch of JnNURM in 2005,
Central Government grants are being
channelized through the Urban Infrastructure
Governance (UIG), and Urban Infrastructure
Development Scheme for Small & Medium
Towns (UIDSSMT) under JnNURM and the
Finance Commission Grants.
PRIVATE SECTOR PARTICIPATION
Despite the increasing focus on MSW
management by state and central
governments, providing affordable and
sustainable waste management services is
among the largest municipal challenges in
India. The presence of a large informal sector
that remains un-integrated into the formal
waste management system coupled by
inadequate mechanization owing to the poor
financial health of the ULBs has made the
management and delivery of a well structured
MSW system a herculean task.
In order to overcome the technical and
financial deficiencies associated with the
current system, state and local governments
in India are increasingly resorting to the use
of private contractors for collection,
transportation and disposal and private
capital to supplement the
mechanization/improvisation process.
In fact, private participation in the provision
of MSW services is not new to India and
several corporation/municipalities have
employed private contractors for secondary
transportation from the communal bins or
collection points to the disposal sites since
1985. However, the services provided for by
the private sector then were contractual in
nature and were confined to one or two
segments of the MSW value chain.
In recent times, the engagement of private
sector participation has increased from short-
term contracts to long-term partnerships.
Close to 31 long-term Build-Operate-Transfer
concessions have been awarded to the
private sector till March, 2011 to manage solid
waste in the country.
However, despite the rising popularity of
Public Private Partnerships in the
management and delivery of MSW services,
the institutional setting, governance and
regulatory structures and market linkages (for
recyclables/compost) are at a nascent stage,
making the successful implementation of
PPPs a challenging task. This is further
complicated by the presence of a large
informal sector (mainly consisting of rag
pickers) that pre-dominantly remains outside
the PPP framework.
Thus the evolution of the MSW sector in India
and the potential role that PPPs could play,
given the local institutional and market
dynamics, demands closer attention.

17 | P P P s i n M u n i c i p a l S o l i d W a s t e M a n a g e m e n t i n I n d i a
STRATEGIC FRAMEWORK
A quick perusal of the various PPP practices in
waste management in India display the
presence of two broad contending
approaches namely centralized (technology
driven) and decentralized (community based)
systems of waste management.8 At one end
of the spectrum, private players are engaged
for either a segment or the entire value chain
of solid waste management for handling of
bulk waste with little or no community
participation, while at the other end there are
cases where Self-Help Groups (SHGs) or
Resident-Welfare Associations (RWAs)
partner with ULBs to manage waste in their
own localities with or without assistance from
other private entities. The choice of a
decentralized model vis-à-vis a centralized
system of management depends on location
(size, density), economic and socio-political-
cultural aspects of cities/towns.
The quantity of waste generated, availability
of external funds, current financial and
human resource capacity and the potential
internal resource generation capacity of the
ULBs differ as per city size. For instance, the
per capita waste generation in large cities is
greater than that produced in relatively
8 A centralized waste management system involves management of bulk waste by one or two entities. The processing of waste is done at a centralized facility and involves application of modern technologies like pellatization, mechanical composting, etc. A decentralized waste management system envisages management of waste within the vicinity of waste generation i.e., a ward or zone and involves community participation in all segments of the MSW value chain namely, collection & transportation, processing and disposal of waste. We elaborate the concepts in detail later in chapter I.
smaller cities and town but the ULBs in the
latter category are eligible for a greater
percentage of central government assistance
in terms of overall project cost. On the
contrary, large ULBs conventionally have
higher potential to generate tax and non-tax
revenue to become financially self-sufficient
to management waste in the long-run.
Therefore, these factors should be considered
by the ULBs to determine the waste
management model for the city or the town.
The operational model of the MSW
Management project can be centralized or
decentralized waste management system
depending upon the profile of the locality in
terms of composition of waste, availability of
land for processing waste, market linkages,
health risks and extent of informalization of
the waste management system.
Centralized PPP models are suitable for urban
areas where significant economies of scale
are possible and the composition of waste
allows for greater extraction of value from the
waste through technological solutions.
Health hazards due to inefficient waste
disposal and non-availability of land in close
proximity of localities are other two
important factors to be considered while
choosing a centralized waste management
system. Depending upon the maturity of the
private sector to manage different segments
of the MSW value chain, the ULBs can partner
with waste management companies.
Decentralized PPP models are appropriate if
the organic composition of waste is high, land
for composting is available at appropriate
locations, market for compost is accessible,
risk for poor self-governance is low and
possibility of integrating informal health
workers into the system is high. This allows
PPPs at the unit level where micro-
entrepreneurs can work with the ULBs to

18 | P P P s i n M u n i c i p a l S o l i d W a s t e M a n a g e m e n t i n I n d i a
produce compost or other value added
products from the waste and the ULBs either
on its own or through a bigger private partner
manages the collection of refuse and
maintenance of landfill sites.
With adequate planning and inclusive
stakeholder consultation it is even possible
for both the centralized and decentralized
waste management systems to co-exist. Thus
the need of the hour is to think out of the box
and diligently explore suitable mechanisms to
address the issue of poor municipal waste
management in the country.

Chapter I
DEFINING MUNICIPAL SOLID WASTE
Municipal Solid Waste (MSW) in India includes commercial and residential wastes generated in
municipal or notified areas in either solid or semi-solid form excluding industrial hazardous wastes
but including treated bio-medical wastes.9 Management of MSW consists of seven important steps,
namely — segregation and storage of waste at source, primary collection, street sweeping,
secondary storage, transportation, treatment & recycling and finally disposal of waste. The scope of
this report is confined to municipal waste and excludes other forms of wastes like e-wastes,
untreated bio-medical wastes and industrial wastes.
I.1 MSW — QUANTITY & CHARACTERISTICS
India generates over 1,15,000 metric tons of municipal waste per day. Fig. 1.1 displays the waste
generated in Class I cities in India.10 It also shows the per capita waste generation in these cities.
Class IA and IB alone account for over 40% of the total waste generated in the country.11 The per
capita waste generation is highest in Class IA cities followed by Class IB and IC cities.
Figure 1.1: Total and Per Capita Waste Generation
Source: Estimated from ‘Status of Water Supply, Source: HPEC Report, GOI (2011) Sanitation and SWM in Urban India,’ Statistical Volume III, SWM 1999, NIUA (2005).
9 Please refer to MSW (Management & Handling) Rules, Ministry of Environment & Forest, GOI (2000). 10 Cities with population over 5 million are classified as Class IA; cities with population between 1 and 5 million as Class IB; and cities with population between 0.1 and 1 million persons as Class IC. Source: High Powered Expert Committee Report, GOI (2011). 11 The waste generated by six megacities is almost equal to the waste generated by 228 Class IC cities.
38790
33618
38959
0
5,000
10,000
15,000
20,000
25,000
30,000
35,000
40,000
45,000
Class IA Class IB Class IC
Waste Generation in 2011
608
425
304
0
100
200
300
400
500
600
700
Class IA Class IB Class IC
Per Capita Waste Generation (Grams per day)

20 | P P P s i n M u n i c i p a l S o l i d W a s t e M a n a g e m e n t i n I n d i a
India’s per capita waste generation is relatively low
compared to other developed nations. An average
Indian generates 0.3 to 0.6 kg of waste per day whereas
an average American generates 2 kg of waste per day.12
In Hong Kong, the situation is even grimmer as the per
capita waste generation is 5.07 kg per person per day.
Fig. 1.2 shows the per capita waste generation in select
developed and developing countries of the world. One
reason for the low level of waste generation in India is that much of the recyclable items are sold to
the recycling units at the household level itself through a network of kabadiwalas.13 India has a good
waste recycling system and the informal sector plays a significant role in it. For example, in Pune 22
% of the total waste generated in the city is recovered by the informal sector.14
Figure 1.2: Per Capita Waste Generation (2011): A Few Select Countries
Source: Compiled from various sources
The nature of the waste generated in Indian cities is also different from those of the industrialized,
high income countries. Studies have found a direct negative relationship between a country’s
income level and the quantity of bio-degradable waste in the total waste generated. Compared to
countries in the high income group, waste generated in India has a higher share of bio-degradable
and inert items. However, the composition of municipal waste is India has seen a marked change
over the last two decades, as is evident from Fig. 1.3. The proportion of non-bio-degradable
12Please refer to ‘What a Waste: Solid Waste Management in Asia,’ World Bank (1999), for further details. 13 Informal workers engaged in buying of waste from households and other commercial establishments e.g.,
hotels, shops, etc are colloquially referred to as ‘kabadiwalas’ in India.
14 Please refer to “The Economics of the Informal Sector in Solid Waste Management,” CWG (2011), for
further information on the role played by the informal sector in waste management in 6 cities across the
world.
0.7
0.7
0.8
1.21
1.3
1.4
1.4
1.9
0 0.5 1 1.5 2
India
Philippines
China
UK
Australia
Brazil
Netherlands
USA
Per Capita Waste Generation - Global Scenario
Kg per capita
“Studies have indicated that for every Indian
` 1,000 increase in income the solid waste
generation increases by one kilogram per
month” – Visvanathan et al., (2003)

21 | P P P s i n M u n i c i p a l S o l i d W a s t e M a n a g e m e n t i n I n d i a
material, metals, glass and plastic has increased significantly. Inert items that comprised around
45% of the total wastes in 1996 reduced to 25% by 2005. Changing lifestyles, increased industrial
and construction activity combined with increasing levels of income has resulted in the changing
composition of waste over the years.
Figure 1.3: MSW Characteristics (1996 and 2005)
Source: Based on data available in ‘Improving Solid Waste Management in India,’ D. Zhu, et al., (2008)
I.2 MSW Value Chain
The MSW value chain conventionally consists of three broad aspects, namely, collection &
transportation (C&T), processing and finally, disposal of wastes. A holistic approach to waste
management includes efforts to reduce the quantity of waste generated at all points i.e., waste
reduction at source to reduction at disposal. The C&T system includes door-to-door collection of
segregated waste from households followed by transportation to waste processing plants in covered
vehicles. The processing of waste involves the application of appropriate technology, depending
upon the quantity and quality of wastes, so as to reduce the overall quantity of waste reaching the
landfill sites and to derive value from the wastes to the extent possible.15 Lastly, the refuse from the
processing plant is collected from the waste processing plants and disposed in scientifically
engineered landfills. Every segment of MSW management entails cost and hence there is a need to
manage all three segments of the MSW value chain in the most efficient manner. The cost nodes of
the MSW chain are depicted in Fig. 1.4 provided below.
15 Several technological alternatives have been available in recent times like incineration, pellatization, bio-methanation that allow conversion of waste in to useful products like electricity that have commercially saleable value.
Metal 0.49 %
Glass 0.6 % Others
7 % Rags 0 %
Paper 4 %
Plastic 1 %
Inerts 45 %
Bio degradab
les
42 %
MSW Characteristics (1996)
Metal 1 %
Glass 1 %
Others 4 %
Rags 4 %
Paper 8 %
Plastic 9 %
Inerts 25 %
Biodegradables 48 %
MSW Characteristics (2005)

22 | P P P s i n M u n i c i p a l S o l i d W a s t e M a n a g e m e n t i n I n d i a
Figure 1.4: MSW Value Chain
In India, the state of MSW however deviates from the above prescribed process. In India,
segregation and storage of MSW at source is lacking and the decomposable and non-decomposable
wastes are often disposed off at common communal dustbin/disposal centre. The collection
efficiencies are also seen to be poor, at around 70% in most Indian cities and continue to be
predominantly manual in nature.16 Transfer stations are rarely used and the same vehicle that
collects refuse form the individual communal bins is also responsible for taking it to the processing
or the disposal site. Collection and transportation activities constitute approximately 80–95% of the
total budget of MSWM; hence, it forms a key component in determining the economics of the
entire MSWM system. On the contrary, disposal and treatment of waste is an underinvested area
and open, uncontrolled and poorly managed landfills are a common feature across most Indian
cities and town.17
16 A key trend in collection of MSW that is unique to low to middle income countries like India is the presence of a large informal sector that plays an active role in collection. The rag pickers work day and night to collect the recyclable materials from the streets, bins and disposal sites for their livelihood, thereby significantly reducing scope of recovering secondary materials form the waste. 17 A recent pilot study by Ministry of Urban Development to assess the performance of the ULBs relative to
certain benchmarks in select cities and towns in the country showed that only 8% of the total MSW generated
actually underwent scientific disposal.

23 | P P P s i n M u n i c i p a l S o l i d W a s t e M a n a g e m e n t i n I n d i a
I.3 INSTITUTIONAL FRAMEWORK FOR MSW MANAGEMENT
The overarching framework for management of MSW in the urban areas was created by the
Ministry of Environment & Forest in 2000 with the enactment of MSW (Management & Handling)
Rules, 2000 under the Environment Protection Act, 1986 that entrusted the ULBs with the
responsibility of managing MSW. Box 1.1 summarizes the key features of the MSW rules. These
rules, along with other legislations pertaining to plastic, bio-medical, hazardous and other wastes,
aimed at instilling waste management practices that are safe and environmentally sound. Fig. 1.5
presents an overview of the institutional framework that governs MSW practice in the country. The
Ministry of Urban Development (MoUD) issues policy guidelines from time to time and administers
the ‘Sub-Mission for Urban Infrastructure and Governance,” which has MSW as one of its thrust
areas. Pollution control boards at the central and state level monitor the compliance with service
delivery benchmarks as set by MoUD.
Box 1.1: Salient Features of MSW (Management & Handling) Rules, 2000
Municipal Solid Waste (MSW) includes commercial and residential wastes generated in municipal or
notified areas in either solid or semi-solid form excluding industrial hazardous wastes but including
treated bio-medical wastes.
Prohibition on littering of MSW in cities, town, notified urban areas.
Bio-Medical and Industrial waste not to be mixed with MSW.
Responsibility of waste generators to avoid littering and ensure delivery of waste in accordance with the
collection and segregation notified by municipal authorities
Municipal Corporations shall undertake awareness campaigns for source segregation of MSW.
Prohibition on manual handling of wastes.
The storage facilities set up by municipal authorities shall be daily attended for clearing of wastes.
Municipal authorities shall adopt suitable technology or combination of such technologies to make use of
wastes so as to minimize burden on landfill. (Compositing, incineration, etc.)
Land filling shall be restricted to non-biodegradable, inert waste and other waste that are not suitable
either for recycling or for biological processing.
The municipal authority shall undertake phased programme to ensure community participation in waste
segregation.
The MSW Rules have set responsibilities for ULBs, State governments and Central & State pollution
control boards for different aspects of MSW management. While the rules make ULBs responsible
for their implementation and for any infrastructure development relating to collection, storage,
segregation, transportation, processing and disposal of municipal solid wastes, they entrust waste
generators with the responsibility to avoid littering. The ULBs are required to organize awareness
programs for segregation of wastes and promotion of recycling or reuse of segregated materials.
The municipal authorities need to undertake a phased program to ensure community participation
in waste segregation. For this purpose, regular meetings at quarterly intervals are arranged by the
municipal authorities with representatives of local Resident Welfare Associations and Non-
Governmental Organizations. In areas falling under the jurisdiction of development authorities e.g.,
Delhi Development Authority (DDA), Hyderabad Urban Development Authority (HUDA), it is the
responsibility of such development authorities to identify landfill sites and hand them over to the

24 | P P P s i n M u n i c i p a l S o l i d W a s t e M a n a g e m e n t i n I n d i a
concerned municipal authority for development, operation and maintenance. Elsewhere, this
responsibility rests with the concerned municipal authority.
Figure 1.5: Institutional Framework for MSW Management
Source: Athena Research
The State Board or the Committee is mandated to monitor the compliance of the standards
regarding ground water, ambient air, leachate quality and the compost quality including
incineration standards.18 The responsibility of Central Pollution Control Board (CPCB) is to co-
ordinate with the State Pollution Control Boards (SPCBs), and Committees with particular reference
to implementation, review standards and guidelines and compile data.
I.4 MSW MANAGEMENT — PARTNERSHIPS BY ULBS
Though the MSW Rules make the ULBs responsible for management of wastes, ULBs have
partnered with private waste management companies, NGOs and RWAs for various segments of
the MSW value chain due to various capacity constraints. In order to comply with the MSW Rules
18 Incineration is a thermal combustion process that involves burning of organic substances contained in waste materials.
25 | P P P s i n M u n i c i p a l S o l i d W a s t e M a n a g e m e n t i n I n d i a
and overcome capacity constraints at the local level, some states have come up with centralized
waste management systems at the city level or regional level. Centralized waste management
systems at the city level are being practiced in Guwahati, Hyderabad and Chennai, among others.
Regional level MSW management facilities have come up in Tamil Nadu and Gujarat. 19
Various forms of engagement among the ULB, private sector and community have been observed
at different places in the country. Exhibit 1.1 lists the various forms of partnerships undertaken by
ULBs with other stakeholders for the management of MSW in India. Broadly, four kinds of
engagement by ULBs can be observed in the management of MSW in India. Firstly, there are ULBs
that manage the wastes on their own. Cities like Jabalpur, Bokaro and Tiruchirapalli, among others,
fall into this category. It might be the case that these cities engage private contractors for some
services like street sweeping but they collect, transport and dispose waste themselves. Secondly,
there are cities like Hyderabad and Rajkot which have partnered with the private sector for
processing of waste. In Rajkot, the collection and transportation of waste is managed by the local
municipal corporation. In Hyderabad, the local authority initially entered into concession
agreements with three private sector companies for only processing of waste. Lately, a separate
contract was awarded to a private concessionaire for collection & transportation of waste for the
entire city and processing of the remaining waste. Thirdly, municipal corporations of Chennai,
Namakkal and Trivandrum, among others, have engaged SHGs and NGOs for (decentralized)
management of waste. There are also cases such as the Guwahati Municipal Corporation, where
ULB partners with both the private sector and the community of informal waste workers to design
and implement an integrated (centralized) solid waste management model.
Lastly, in some cities, the local community has come forward to manage the waste in their own
areas or nearby vicinities. In such cases, the ULBs give permission to RWAs, SHGs or NGOs to
undertake waste management activities. In other cases, the ULBs actively supports community
participation in management of wastes by providing financial support to the community based on
the area served or quantity of waste managed. For instance, the ‘Advanced Locality Management’
scheme has been launched by Brihan Mumbai Municipal Corporation. Under the scheme, members
of the locality participating in the scheme are provided subsidies and technical help to construct
composting facilities.
19 A ‘Regional MSW Facility’ means a waste management facility or system of any kind (whether in relation to collection, transportation, treatment or disposal of MSW or a combination of any or all of them), which collects, manages or receives or disposes (as the case may be) MSW from more than one Authority. For further details, please refer to ‘Municipal Solid Waste Management on a Regional Basis-Guidance Note, MOUD, GOI (2011).
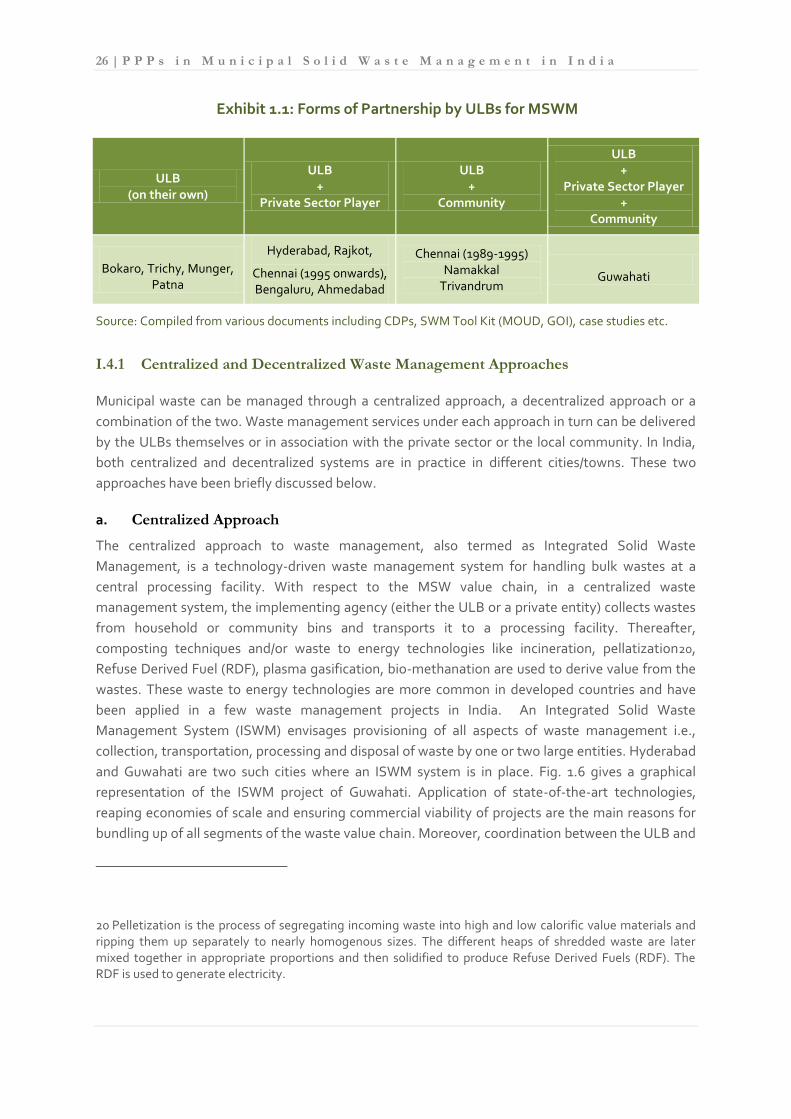
26 | P P P s i n M u n i c i p a l S o l i d W a s t e M a n a g e m e n t i n I n d i a
Exhibit 1.1: Forms of Partnership by ULBs for MSWM
ULB (on their own)
ULB +
Private Sector Player
ULB +
Community
ULB +
Private Sector Player +
Community
Bokaro, Trichy, Munger, Patna
Hyderabad, Rajkot,
Chennai (1995 onwards), Bengaluru, Ahmedabad
Chennai (1989-1995) Namakkal
Trivandrum Guwahati
Source: Compiled from various documents including CDPs, SWM Tool Kit (MOUD, GOI), case studies etc.
I.4.1 Centralized and Decentralized Waste Management Approaches
Municipal waste can be managed through a centralized approach, a decentralized approach or a
combination of the two. Waste management services under each approach in turn can be delivered
by the ULBs themselves or in association with the private sector or the local community. In India,
both centralized and decentralized systems are in practice in different cities/towns. These two
approaches have been briefly discussed below.
a. Centralized Approach
The centralized approach to waste management, also termed as Integrated Solid Waste
Management, is a technology-driven waste management system for handling bulk wastes at a
central processing facility. With respect to the MSW value chain, in a centralized waste
management system, the implementing agency (either the ULB or a private entity) collects wastes
from household or community bins and transports it to a processing facility. Thereafter,
composting techniques and/or waste to energy technologies like incineration, pellatization20,
Refuse Derived Fuel (RDF), plasma gasification, bio-methanation are used to derive value from the
wastes. These waste to energy technologies are more common in developed countries and have
been applied in a few waste management projects in India. An Integrated Solid Waste
Management System (ISWM) envisages provisioning of all aspects of waste management i.e.,
collection, transportation, processing and disposal of waste by one or two large entities. Hyderabad
and Guwahati are two such cities where an ISWM system is in place. Fig. 1.6 gives a graphical
representation of the ISWM project of Guwahati. Application of state-of-the-art technologies,
reaping economies of scale and ensuring commercial viability of projects are the main reasons for
bundling up of all segments of the waste value chain. Moreover, coordination between the ULB and
20 Pelletization is the process of segregating incoming waste into high and low calorific value materials and ripping them up separately to nearly homogenous sizes. The different heaps of shredded waste are later mixed together in appropriate proportions and then solidified to produce Refuse Derived Fuels (RDF). The RDF is used to generate electricity.
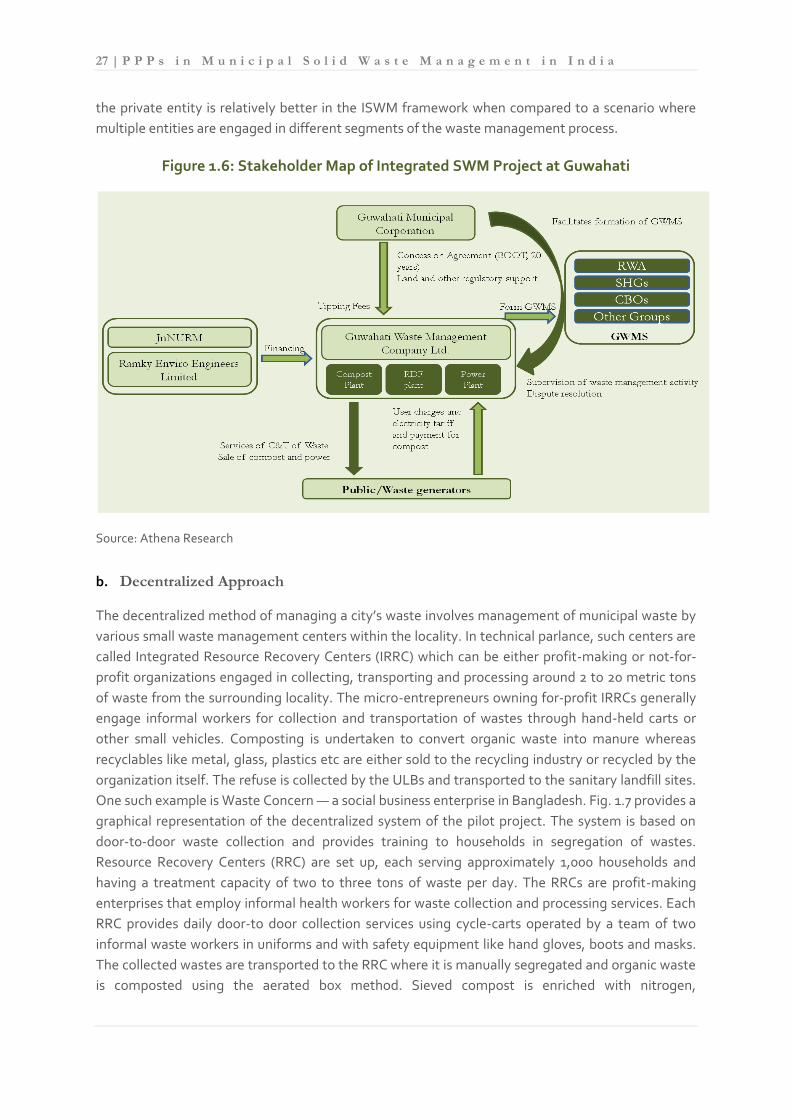
27 | P P P s i n M u n i c i p a l S o l i d W a s t e M a n a g e m e n t i n I n d i a
the private entity is relatively better in the ISWM framework when compared to a scenario where
multiple entities are engaged in different segments of the waste management process.
Figure 1.6: Stakeholder Map of Integrated SWM Project at Guwahati
Source: Athena Research
b. Decentralized Approach
The decentralized method of managing a city’s waste involves management of municipal waste by
various small waste management centers within the locality. In technical parlance, such centers are
called Integrated Resource Recovery Centers (IRRC) which can be either profit-making or not-for-
profit organizations engaged in collecting, transporting and processing around 2 to 20 metric tons
of waste from the surrounding locality. The micro-entrepreneurs owning for-profit IRRCs generally
engage informal workers for collection and transportation of wastes through hand-held carts or
other small vehicles. Composting is undertaken to convert organic waste into manure whereas
recyclables like metal, glass, plastics etc are either sold to the recycling industry or recycled by the
organization itself. The refuse is collected by the ULBs and transported to the sanitary landfill sites.
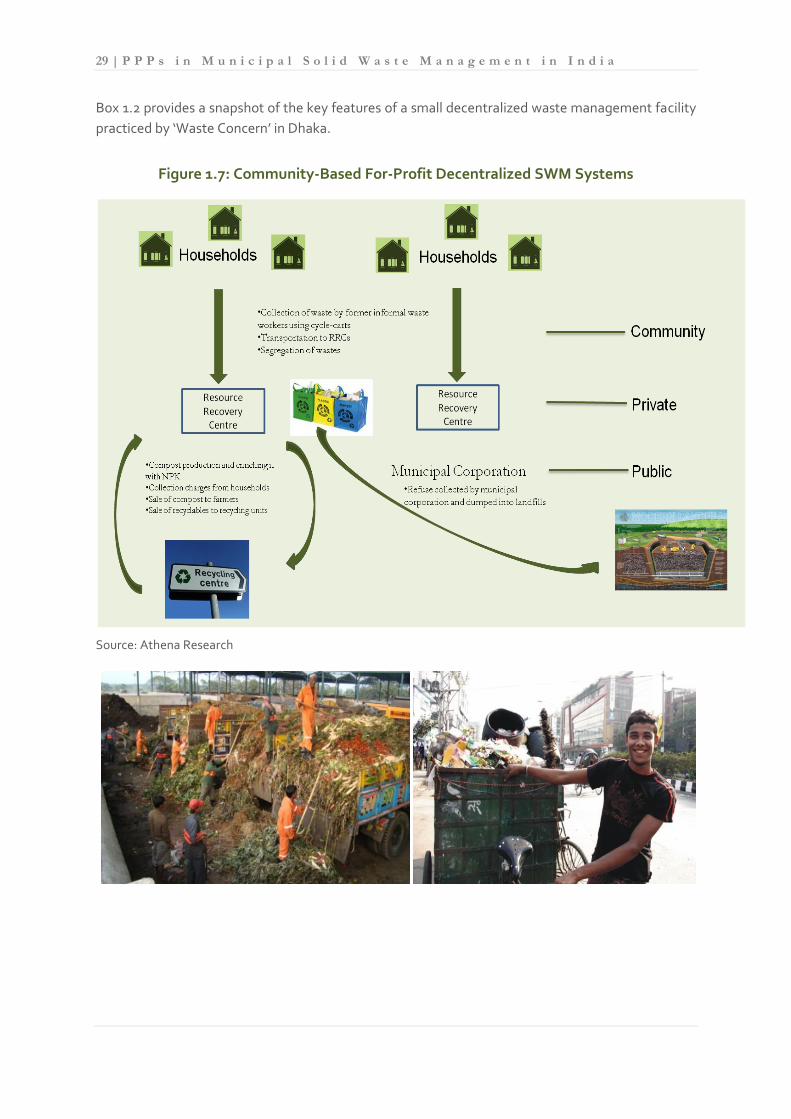
One such example is Waste Concern — a social business enterprise in Bangladesh. Fig. 1.7 provides a
graphical representation of the decentralized system of the pilot project. The system is based on
door-to-door waste collection and provides training to households in segregation of wastes.
Resource Recovery Centers (RRC) are set up, each serving approximately 1,000 households and
having a treatment capacity of two to three tons of waste per day. The RRCs are profit-making
enterprises that employ informal health workers for waste collection and processing services. Each
RRC provides daily door-to door collection services using cycle-carts operated by a team of two
informal waste workers in uniforms and with safety equipment like hand gloves, boots and masks.
The collected wastes are transported to the RRC where it is manually segregated and organic waste
is composted using the aerated box method. Sieved compost is enriched with nitrogen,

28 | P P P s i n M u n i c i p a l S o l i d W a s t e M a n a g e m e n t i n I n d i a
phosphorous and potassium to make organic manure. The organic waste comprises around 80% of
the total waste. The recyclables, which form about 15%, are sold to recycling units while the refuse
constituting 5% is collected by the municipal corporation every two or three weeks and dumped in
landfills.
There are also Indian examples of successful decentralized waste management systems which
manage wastes in a manner that is environmentally safe and economically viable. Chennai,
Bengaluru and Saharanpur are few cities which have experimented with the decentralized systems
in the country. Chennai had a decentralized waste collection and transportation system as early as
1989 where EXNORA International ─ a non-governmental organization (NGO), set up small waste
management units in different areas of the cities managed by the community. EXNORA
International roped in the informal waste workers for primary collection and transportation of waste
from households to the waste bins provided in street corners by the Corporation of Chennai (CoC)
The community contributed a nominal amount towards the service rendered which along with
revenue from sale of recyclables covered the operational expenditure (salary of the workers and
other administrative expenses) of the project. The CoC supported the initiative by transporting the
refuse from the street bins to the dump sites.
Another novel initiative is observed in Saharanpur City located in north-western Uttar Pradesh
where municipal solid waste is being managed by a joint initiative of a large corporate house – ITC
Ltd, an NGO – Muskan Jyoti Samiti, the local municipal corporation and the district administration
in one area of the city. The NGO is engaged in the door-to-door collection, transportation and
processing of waste. It has set up a small composting unit in the locality for converting organic
waste into manure. The operational expenditure of the initiative is covered by sale of recyclables,
manure and collection of user charges from the waste generators.
Recently, a ward in Bengaluru has initiated the process to undertake decentralized solid waste
management by utilizing the JNNURM’s Community Participation Fund (CDF). Vijayanagara
Nagarikara Vedike (VNV) ─ the implementing agency of the project has been working in association
with the Health Department of Bruhat Bengalore Mahanagara Palike (BBMP) on and the local
community since the project planning and conceptualization phase. 21 The scope of the work
includes road sweeping, collection, segregation, transportation and disposal (through bio-
mechanical composting) of the waste. The BBMP would be responsible for transportation of the
waste and would provide technical and financial support. It would also assist in conflict resolution
and operational problems, if any along with involvement in awareness initiatives. The responsibility
of the citizens includes setting up and management of the compost unit. The VNV’s role would be
primarily initiating community awareness programmes, project identification & report preparation,
organization of training programmes for persons from the community for O&M of the composting
units, marketing of compost and disposal of waste, among others.
21 Vijayanagara Nagarikara Vedike is a Federation of the Resident Welfare Association and other institutions
engaged in citizen welfare activities in different wards of Vijayanagara, Bengaluru.
29 | P P P s i n M u n i c i p a l S o l i d W a s t e M a n a g e m e n t i n I n d i a
Box 1.2 provides a snapshot of the key features of a small decentralized waste management facility
practiced by ‘Waste Concern’ in Dhaka.
Figure 1.7: Community-Based For-Profit Decentralized SWM Systems
Source: Athena Research

30 | P P P s i n M u n i c i p a l S o l i d W a s t e M a n a g e m e n t i n I n d i a
Exhibit 1.2: Centralized & Decentralized Waste Management Systems at a Glance
Source: Athena Research; Compiled from various sources
Box 1.2: Waste Concerns Integrated Resource Recovery Centre
Waste Collection: 2 Metric Tonnes per day
Human Resource Requirement:
6 workers, 2 van drivers, 4 waste collectors and 1 plant manager
Compost Production: 500 Kg (25 % of the total waste collected)
Compost Price: 2.5-5 Tk* per Kg (Tk 7-8 per kg after enrichment)
Total Fixed Costs: Tk 5,08,200
O&M Costs: Tk 2,09,000
User Charges levied: 10-15 Tk per month per household
Land Used: 0.0022 Sq. Km
Note: The financial figures are at 2002 price level
Source: Community Based Decentralized Composting: Experience of Waste Concern in Dhaka, Urban Management Innovation. * Tk denotes Taka (Currency of Bangladesh)
Salient Features
The integrated and the decentralized waste management systems have their own advantages and
disadvantages and cannot be uniformly applied to ULBs of all sizes and locations. Both the waste
Centralized Waste Management System Decentralized Waste Management System
Pros Suitable for high income countries/cities
Reduces manual handling of waste
Waste can be used for producing compost and energy
Promotes source segregation
Effective monitoring by community
Allows integrations of informal waste workers
Applicable in cities with strong social factors
Savings in transport cost and landfill requirements.
Cons Not suitable for waste with high organic waste content
It is not cost effective
Does not allow integration of informal waste workers
Does not address the issue of manual handling of waste.
Requires space for each resource recovery centre in vicinity of households.
Generation of electricity not feasible

31 | P P P s i n M u n i c i p a l S o l i d W a s t e M a n a g e m e n t i n I n d i a
management mechanisms – centralized and decentralized – when deployed in circumstances suited
to the particular mechanism, can result in efficient solid waste management. Neither has been
shown to be superior to the other on all parameters in all conditions, and hence, the question that
needs to be answered is under which conditions should a centralized model of waste management
be adopted, and when to adopt the decentralized model.
An attempt has been made in Exhibit 1.2 to list the salient features of both the approaches so as to
indicate the appropriateness of each. The choice of a particular approach depends on several
factors like financial and human resource capacity of the concerned ULB, socio-economic-cultural
profile of city/town, status of service delivery, quantity and quality of waste generated, availability
of land, among others. In the next chapter, we discuss some key parameters that should be
considered while choosing a particular approach to waste management.

32 | P P P s i n M u n i c i p a l S o l i d W a s t e M a n a g e m e n t i n I n d i a
Chapter II
CURRENT STATE AND GAPS
II.1 EXISTING PERFORMANCE STANDARDS
Proper management of waste has been a critical aspect in urban areas, especially in mega cities
which are major centers of waste generation. Irregular collection or non-collection, transportation
in open vehicles, and environmentally unsafe methods of processing & disposal of waste are
common features of a large number of urban areas across the country. While steps for improving
service delivery were initiated as early as 1963 with the Zakaria Committee setting service norms
and standards in urban services, poor implementation of the committee’s recommendations, owing
to the presence of weak enforcement mechanisms has led to the poor management and delivery of
MSW services in Indian cities. The public and the government were jolted into recognizing the
deteriorating quality of waste management services by the Surat Plague disaster in 1994. After the
Surat disaster, ‘Clean India’ campaigns highlighting the pitiable conditions of hygiene and waste
management in cities and towns were made by social activists in 1994 and 1995, covering 30 cities
and 60 towns. Subsequently, a Public Interest Litigation (PIL) was filed in the Supreme Court of
India, Almitra H. Patel Vs. Union of India (1996), seeking adoption of hygienic waste management
practices by the ULBs.
The Supreme Court of India formed an Expert Committee in 1999 to provide recommendations for
improving waste management practices in Class I cities. Subsequently, the Ministry of Environment
& Forest introduced the MSW (Management & Handling) Rules in 2000, incorporating key
recommendations of the Supreme Court appointed ‘Expert Committee’. The MSW rules contained
several remarkable features, e.g., door-to-door collection, segregation of waste at source and
scientific disposal of waste, among others. Further, the Supreme Court of India set 2003 as the
target year for compliance with the rules set by the ULBs. Prior to the announcement of MSW
(M&H) Rules, 2000 there were hardly any standards to measure the quality of MSW management
services provided by the local bodies. In the absence of any law regarding the management of
municipal solid waste, the ULBs were not compelled to provide regular door to door collection of
waste or for its scientific disposal.
Another important landmark in the MSW space was the setting up of ‘Service Benchmarks’ in Urban
Services by MOUD in 2008. Exhibit 2.1 lists the various benchmarks to be achieved by the ULBs.
II.1.1 Performance of ULBs – MSW Management
A glance at the existing situation of service delivery standards across the ULBs points to the poor
performance of almost all cities and towns in India. Despite several policy interventions e.g.,
announcement of MSW (Management & Handling) Rules, setting up of service benchmarks,
provision of central and state government grants through JnNURM under UIG/UIDSSMT etc, the
outcomes have been largely unsatisfactory barring a few cities.

33 | P P P s i n M u n i c i p a l S o l i d W a s t e M a n a g e m e n t i n I n d i a
The MOUD undertook a pilot study in 2009 to assess the performance of 28 select ULBs
representing different tiers of cities across different states. The study found that none of the ULBs
performed at par with the service level benchmarks. 22 The exhibit below summarizes the
performance of the surveyed ULBs and highlights the poor service delivery in terms of C&T, poor
segregation efficiency and unscientific disposal of wastes.
Exhibit 2.1: MSWM Service Level Benchmarks and Average ULB Performance
S/N Performance Indicator Service Level Benchmark (in percent)
Current Average Performance (in percent)
1 Household Coverage 100 47.7
2 Collection Efficiency 100 75.3
3 MSW Segregation 100 19.5
4 MSW Recovery 100 31.73
5 Scientific Disposal; 100 8.0
6 Cost Recovery 100 17.3
7 User Charges Collection Efficiency 90 31.4
8 Complaint Redressal 80 89.1
Source: Service Level Benchmarking Data book: Improving Service Outcomes 2008 – 09, Ministry of Urban
Development, Government of India.
Legend
Target met
Target missed by 0-25 %
Target missed by 26-50 %
Target missed by 51-75 %
Target missed by over 75 %
22 The 28 cities/towns included in the pilot study cover 3 Class IA, 6 Class IB and 14 Class IC cities as per the new classification of cities mentioned in the HPEC Report, MOUD, GOI (2011). The remaining 5 cities belong to Class II/III/IV+ cities/towns.

34 | P P P s i n M u n i c i p a l S o l i d W a s t e M a n a g e m e n t i n I n d i a
Classifying the performance of the ULBs according to the city size (Class IA, IB and IC) shows that
performance on parameters such as waste segregation and scientific disposal of municipal waste is
extremely poor irrespective of the city size. Cost recovery is relatively better in Class IB cities like
Indore, Surat and Ahmedabad. Scientific disposal of waste is absent in Class IB and IC cities and it is
practiced only in 2 of the Class IA cities sampled. Household coverage is around 50% in all the three
categories.
Fig. 2.1 provides a comparative analysis of the sample of Class IA, IB and Class IC cities on all the
eight parameters.
Figure 2.1: Status of MSW Management — Class IA, IB & IC Cities
Source: Based 0n data available in Urban Finance, Vol. 13(1), NIUA (2010)
The performance of the remaining urban cities which are not covered in the sample is even more
dismal. The report by the High Powered Expert Committee (HPEC) on urban infrastructure23 states
that 100% Class III and IV+ cities have a significant backlog in C&T; between 88% and 93% of the
Class I and Class II cities have backlogs in processing of waste while 100% of all Indian cities and
towns have backlogs in terms of scientific disposal.24 Fig. 2.2 displays the service level backlogs of
the ULBs in terms of three broad aspects of the MSW value chain — Collection & Transportation,
Processing and Scientific Disposal.
23 Please see, HPEC Report, GOI (2011) for further details. 24 Service Backlog refers to services that should have been provided by the ULBs but were not and therefore need to be provided now.
100 100 100
80
100 100
90
80
0
20
40
60
80
100
HH Coverage Collection Efficiency
MSW Segregation
MSW Recovery
Scientific Disposal
Cost Recovery
User Charges Collection Efficiency
Complaint Redressal
Class IA Class IB Class IC Benchmark
In Percent

35 | P P P s i n M u n i c i p a l S o l i d W a s t e M a n a g e m e n t i n I n d i a
Figure 2.2: Backlogs of Service Level Benchmarks
Source: Based on data available in HPEC Report, MOUD, GOI (2011)
II.2 FACTORS CONTRIBUTING TO POOR SERVICE DELIVERY
ULBs’ lack of commitment, poor financial health, untrained or inadequately trained work force and
lack of equipment are the main reasons for the incomplete coverage and unscientific processing &
disposal of waste in Indian cities and towns. However, with an increasing urban population, and a
changing socio-economic demographic profile, there is growing pressure on the ULBs to deliver
quality services to its citizens. This requires increasing the capacity of the ULBs for better
management of MSW in their localities. Different segments of the MSW value chain are beset by
different set of problems that render management of MSW ineffective, inadequate and inefficient.
Box 2.1: Solid Waste Management in Berhampur (Odisha)
Sources: ‘Town Level Background Paper on Berhampur Town (Odisha) for The Urban India Reforms Facility,’
KIIT (2011).
13
48 41 41
65 75
88 94 93 93
100 100 100 100 100 100 100 100
0
20
40
60
80
100
Class IA Class IB Class IC Class II Class III Class IV+
C&T Processing Scientific Disposal
In Percent
Solid waste management service in Berhampur, a Class I Town in Odisha is poor relative to
the desired levels. A pilot study on the status of SWM service in 28 cities and towns found
that the household coverage and collection efficiency of waste in Berhampur was 2.6% and
81.2%, respectively against benchmark levels of 100 percent for each service. Lack of human
resource and equipment capacity in the Berhampur Municipal Corporation (BMC) is possibly
one of the main reasons for the poor performance in these two aspects of service delivery.
BMC has a total sanctioned strength of 840 staff of which 253 positions are lying vacant.
Further, the Corporation is burdened with the payment of loans and gratuity to its retired
staff. Waste is disposed in open dumping grounds as well as open channels thereby creating
chokage and stagnation problems.a Door to door collection is absent and waste collection is
not practiced on a daily basis. BMC is substantially dependent on government funds and
grants (around 44%) and receipts from rates and taxes form about only 6% of the total
receipts. The city does not levy any user charge for MSW service.

36 | P P P s i n M u n i c i p a l S o l i d W a s t e M a n a g e m e n t i n I n d i a
Inadequate collaboration by the ULBs, with all the stakeholders, namely, households, rag-pickers,
non-governmental organizations, private waste management companies, households,
environmentalists and local leaders, in devising possible solutions to the waste menace of the
respective localities is an important factor that hinders the application of a concerted effort for
MSW management. Lack of awareness about the importance of good SWM practices especially
about waste segregation and the absence of any clear mandate that fixes the responsibility of waste
segregation on waste generators result in mixing of all kinds of wastes by people.
Further, most ULBs depend on central and state government grants for funds that are often
inadequate, as the bulk of funds are absorbed by administrative expenses. Inadequate financial
resources from the ULB’s internal sources, inadequate and untrained staff, obsolete or insufficient
equipment and lack of sufficient motivation to provide quality and timely services to people make
the delivery of reliable and affordable waste management services all the more complex. The
resource gap for the Operations and Maintenance (O&M) of municipal services alone was estimated
to be around ` 32,143 crore for the period 2005-10.25 In this section we describe the various factors
affecting performance across the value chain of solid waste management.
25 Please refer to “Norms and Standards of Municipal Basic Services in India,” M. P. Mathur et al. NIUA (2007).

37 | P P P s i n M u n i c i p a l S o l i d W a s t e M a n a g e m e n t i n I n d i a
Box 2.2: Solid Waste Management in Nashik (Maharashtra)
The Report card of the Nashik Municipal Corporation (NMC) in terms of the service level
benchmarks is better relative to other ULBs. Household coverage and collection efficiency of NMC
are 86.9 and 87 percent respectively while the extent of MSW segregation and recovery were
found to be 34.5 percent and 100 percent respectively in the pilot study by Ministry of Urban
Development in 2009. The network of ‘Ghanta Gadis’, as the garbage collection tractors are called
colloquially, in the area have resulted in significant improvement in the level of service post MSW
rules enforcement. The city has 124 tipper trucks each manned with one driver and 2 garbage
collectors. Though the practice of source segregation is not widely practiced, the garbage
collectors in the ghanta gadis segregate the non-biodegradable waste. NMC has constructed a 300
TPD compost plant and also disposes refuse in sanitary landfill sites. Around `52.3 crore has been
allocated for provisioning of MSW services in the city.
Sources: City CDP of Nashik Municipal Corporation under JnNURM, NMC (2010). Nashik city Development Plan: Appraisal Report, JnNURM.
II.2.1 Factors contributing to Poor Waste Segregation System
Lack of public awareness about the need for waste segregation
Creating awareness about the importance of proper waste management is an area that has not
received adequate attention from policy makers. The principle of 3R’s – Reduce, Reuse and Recycle
is rarely practiced at the individual household or commercial establishment level. Citizens are not
aware of the merits of waste segregation and scientific disposal of wastes. Even when citizens know
that waste should be segregated into bio-degradable and non-biodegradable components, they do
not practice it as they are not informed of the social and economic repercussions associated with
the mixing of organic and in-organic waste with hazardous biomedical and electronic waste.
Information, Education and Communication (IEC) campaigns highlighting the criticality of MSW
management have not been undertaken at the required scale by ULBs.

38 | P P P s i n M u n i c i p a l S o l i d W a s t e M a n a g e m e n t i n I n d i a
Lack of accountability for waste segregation
The MSW (Management & Handling) Rules, 2000 does not fix the responsibility of waste
segregation on the waste generators. However, the Committee on ‘National Sustainable Habitat
Standards for Municipal Solid Waste Management’ has recommended fixing the responsibility on
premise occupiers for temporary storage of segregated waste. The Committee has also
recommended penalizing municipal corporations for non-compliance with MSW Rules. Adopting a
‘Carrot and Stick’ approach can ensure that the waste generator segregates waste. Providing rebate
on property tax or other taxes collected by ULBs to incentivize segregation of wastes while levying
penalties or non-collection of waste from individuals/establishments that do not supply segregated
waste can be practiced by the ULBs. These features are likely to be incorporated in the amendment
to the MSW Rules, 2000 that is under contemplation by the central government in consultation with
state governments and ULBs.
II.2.2 Factors contributing to Poor Collection & Transportation (C&T) System
Unplanned and variable city features
A large number of cities and towns in India have developed in an unplanned way. The width of roads
and lanes vary significantly within and among cities. Therefore, C&T systems require meticulous
planning to ensure successful execution. The different urban profiles of cities and towns call for
different systems for C&T. However, most of the ULBs practice a uniform C&T system for an entire
city/town, as a result of which inaccessible and marginal areas are not covered.

39 | P P P s i n M u n i c i p a l S o l i d W a s t e M a n a g e m e n t i n I n d i a
Inadequate equipment and inappropriate technology
Inadequate vehicles and equipments at the disposal of ULBs, primarily due to lack of financial
resources, is often cited as a reason for poor service delivery. Faulty designs for waste C&T system
such as inappropriate size and placement of garbage bins, transfer stations, etc. has aggravated the
problem of overflowing waste and insufficient removal of waste from sites. The waste characteristic
in India is different from that of industrial countries as it contains a high proportion of bio-
degradable wastes that increase waste density. Hence, vehicles that operate with low-density
waste in industrial countries are not suitable or reliable for Indian conditions. The vehicles for
transportation of waste should be adapted to suit Indian conditions pertaining to waste density,
lane width, etc.
Inefficient and untrained staff
Inefficiency, rather than inadequacy, of the existing staff results in poor coverage of MSW
management services. For instance, Delhi has five health workers per 1,000 persons, more than
double the prescribed CPHEEO norm of 2 health workers per 1,000 persons, but its household
collection efficiency is only 4.2%.26 There is a need to increase the efficiency of the health workers in
order to improve the collection system of the ULBs.
Non-integration of informal workers
Informal workers e.g., rag-pickers, waste collecting communities, etc. play a vital role in the
collection, transportation & disposal of waste and compensate, to some extent, the inadequacy of
the services provided by ULBs. Failure to integrate these workers in the MSW management
mainstream contributes to poor service delivery. The waste pickers often rummage waste bins and
cause waste to scatter around the bins. Items like plastic, metals and glass collected by waste
pickers reduces the potential value of waste and also makes production of energy from waste
unfeasible as plastic is an important ingredient of refuse-derived fuel used for generating electricity.
These factors play a decisive role if a ULB decides to set up an integrated waste management plant
for extracting value from waste as key waste elements like plastic and metals are siphoned by the
informal waste workers.
I.2.3 Factors contributing to Poor Processing & Disposal (P&D) System
Insufficient fund allocation to processing and disposal
Open dumping of waste is the easiest way to dispose waste. Before the MSW (Management &
Handling) Rules, 2000 were in force, ULBs were under no pressure to adopt scientific disposal
practices. However, despite the introduction of the MSW rules, the practice of ‘open dumping’ is
still rampant in the country, with only a handful of ULBs having sanitary landfill facilities in place.
The problems encountered in the C&T segment of MSW management are reflected in the P&D
segment as well. Collection of un-segregated waste from source makes extraction of value costly or
26 See, Urban Finance, Vol. 13(1), NIUA (2010) for further details.

40 | P P P s i n M u n i c i p a l S o l i d W a s t e M a n a g e m e n t i n I n d i a
economically unfeasible in most cases. The Supreme Court Committee on Municipal solid waste in
1999 noted that around 70-75% of the total expenditure on waste is spent on street sweeping; 20-
25% on collection and only 0-5% on disposal of wastes by the ULBs.
Unproven technologies
Controversies in the scientific and environmental arena for some waste management technologies
e.g., incineration, plasma gasification, have made ULBs apprehensive about going ahead with such
technologies.27 Some of the ULBs, for instance, the Municipal Corporation of Delhi experimented
with scientific methods to process and dispose waste but encountered problems due to various
reasons. Please refer to Box 2.3 for an illustration. Further, wastes to energy/compost plants require
the availability of a minimum waste quantity of specified composition and nature for the smooth
operation of the plants, which is usually not available.
Box 2.3: Waste to Energy Plant – Municipal Corporation of Delhi
The Municipal Corporation of Delhi (MCD) established a 3.75 MW waste-to-energy (wte) plant with
assistance from Government of Denmark in 1987 to address the twin problems of waste disposal and
electricity shortage faced by the city. The capacity of the plant was 300 TPD of solid waste and was
set up at a cost of ` 25 crore by Volund Miljotecknik A/S of Denmark that also supplied the
incineration technology. The plant started operation on a pilot basis but was shut down three years
later due to the poor quality of unscreened or unsegregated incoming waste as the plant was design
for screened waste. Subsequently a screening plant was set up with a capacity of 100 TPD but still
the waste was not adequate to operate the plant.
Source: Failure of Timarpur, Case Study, NSWA (2010).28
27 Please refer to ‘Garbology: Difference Engine: Talking Trash,’ The Economist, 27th April, 2012 for further
details.
28 Based on information available at http://www.nswai.com/images/case_studies/4.pdf; accessed on 21st
January, 2012.

41 | P P P s i n M u n i c i p a l S o l i d W a s t e M a n a g e m e n t i n I n d i a
Chapter III
PRIVATE SECTOR PARTICIPATION IN SWM
In recent times, private sector participation has become an important mechanism to improve
provisioning of infrastructure services worldwide. In India, several public private partnerships have
been undertaken in commercial infrastructure sectors at the central, state and even local levels for
overcoming capacity constraints in government bodies and for leveraging private finance and
achieving efficiency.
III.1 NEED FOR PRIVATE SECTOR PARTICIPATION
India’s annual waste generation is projected to increase to approximately 260 MT by 2047 from the
present 42 MT.29 Fig. 3.1 displays the anticipated waste quantities for Class I cities for the next two
decades. There is an imminent need to address the service backlog (Fig. 2.2) as waste generation in
India will increase manifold in the coming years with increasing population, industrial activity,
income levels and urbanization. Class IA, IB and IC Cities will continue to account for the bulk of the
waste generated in the country. Therefore, waste management and handling capacity in these
cities must be enhanced.
Figure 3.1: MSW Generation: Past, Current & Future (MTD)
Source: Athena Research
29 Please refer to “Successful Innovations in SWM Systems: Examples from Five Local Bodies in Tamil Nadu,”
GOTN & UNICEF (2010) for further details.
0
20,000
40,000
60,000
80,000
1,00,000
1,20,000
2001 2011 2021 2031
Class IA Class IB Class IC

42 | P P P s i n M u n i c i p a l S o l i d W a s t e M a n a g e m e n t i n I n d i a
The land required for disposing waste is also set to increase in response to the increase in waste
generation. Fig. 3.2 shows that the land requirement for landfills has increased by 75% in a span of
just 3 years from 2007 to 2010 and is further estimated to increase by 285% by 2030 if prudent waste
management practices are not adopted at the earliest.
While there is scope for reducing the land required for landfills by adopting suitable waste
processing technologies like composting, pellatization, and bio-methanation, application of
technologies other than composting requires stringent implementation and monitoring
mechanisms and the choice of such techniques should be made keeping economic and
environmental costs, if any, in consideration.
Figure 3.2: Future Land Requirement for Landfill in India
Source: Estimation of Municipal Solid Waste Generation and Landfill area in Asian Developing Countries, Khajuria et al., Journal of Environmental Biology (2010).
The urban local bodies in India are not able to manage the increasing quantity of waste generated in
urban cities even though they spend a substantial chunk of their budget on waste management. A
United Nations Development Program (UNDP) survey, which covered 151 mayors of cities from
around the world in 1997 found that insufficient solid waste disposal is the second most serious
problems that city dwellers face after unemployment. Private sector initiatives and community
participation have resulted in improved waste management services in several developed and
developing countries and presents India n ULBs with an alternative to expensive or inefficient public
delivery of MSW services.
The rationale for bringing in private sector participation in this sector is primarily to leverage private
sector efficiency, expertise and technology rather than finance, as several government schemes are
in place for providing funds to ULBs, although with certain conditions. If the private sector provides
higher standards of waste management service at the same cost or provides equivalent service at a
lower cost compared to the local administration, then private sector participation should be
considered. The private sector has access to a wide range of technological alternatives that can be
22.374
39.154
151.025
0
20
40
60
80
100
120
140
160
2007 2010 2030
Land Required for Landfill
Sq. Km

43 | P P P s i n M u n i c i p a l S o l i d W a s t e M a n a g e m e n t i n I n d i a
used for the processing of waste. Asnani (2005), mentions that ULBs in India spend somewhere
around 10-50% of their total expenditure on waste management services.30 Hence the issue is not
always the paucity of funds, but a lack of a professional approach to deliver services efficiently and
in a cost-effective and reliable manner. Fig. 3.3 shows the total expenditure made by the
government on the provision of Medical & Public Health and Water Supply & Sanitation and Urban
Development services from 2001 to 2011. Expenditure on waste management services is included
partly under both the accounts. Even though total expenditure on public health and urban
development increased temporally, the service levels remained at dismal levels.
Figure 3.3: Combined Budgetary Transactions — Centre & State (` Crores)
Source: Based on Data available in ‘Indian Public Finance Statistics,’ DEA, GOI (2011)
There are instances where private sector participation has brought in cost reduction in MSW service
delivery. Exhibit 3.1 compares the solid waste management sector before and after private sector
participation. Due to non-availability of data on the pre and post-PPP experience of all ULBs
indulging in PPPs, a comparative analysis of only 11 cities is presented here even though cities like
Delhi, Hyderabad and Chennai among others, had some form of private sector participation earlier.
In India, significant cost reduction were observed in the case of Jamnagar and Sriganganagar after
they sought private sector participation whereas Anantapur and Nellore witnessed an increase in
cost of provisioning MSW services after they contracted sweeping services to private contractors.
However due to the lack of any information on service levels provided to citizens of the
30 In Jabalpur, SWM is the single largest expenditure head in the municipal fund accounting for over 60% of
the revenue expenditure. See http://www.jmcjabalpur.org/city_development_plan_section_6.jsp, for further
details.
3,816 7,532
32,392 35,451
24,360
33,772
76,300 82,213
0
15,000
30,000
45,000
60,000
75,000
90,000
2001 2005 2010 2011
Urban Development Medical & Public Health & Water & Sanitation
In ` Crores

44 | P P P s i n M u n i c i p a l S o l i d W a s t e M a n a g e m e n t i n I n d i a
aforementioned ULBs, it is difficult to comment on the success or failure of involving the private
sector in MSW service delivery.
Exhibit 3.1: Pre and Post Private Sector Participation in SWM in a few Cities/Towns
City/Town Year Cost Before PSP
` ‘000 Cost After PSP
` ‘000 Value Chain
Anantapur 1997 11500 14500 Sweeping
Rajendra Nagar 1997 20 85 Sweeping & Collection
Qutubullapur 1997 2000 4200 Sweeping
Nellore 1998 23843 27812 Sweeping
Jamnagar 1987 8000 2200 Primary Collection
Sriganganagar 1994 700 350 Sweeping
Jabalpur 1998 1164 770 Sweeping
Kapra 1999 4640 2908 Sweeping
Kamptee 1999 25 18 Commercial
Manmad 1999 300 147 Transportation
Virar 1999 4500 3500 Sweeping & Collection
Source: Compiled from ‘Status of Water Supply, Sanitation and Solid Waste Management in Urban India,’ Statistical Volume III, SWM 1999, NIUA (2005).
With the laying down of performance standards for MSW service delivery, it is now possible to
gauge the extent of improvement in efficiency and cost-effectiveness of MSW management
consequent to private sector involvement in various segments of the MSW value chain. Such an
environment has facilitated a spurt in long-term partnerships with the private sector for initiating
door-to-door collection, setting up of waste processing facilities and scientifically engineered
landfills. The number of projects with private sector participation has been increasing over the years
and the country is well-poised to engage with the private sector partnerships to deliver MSW
services.

45 | P P P s i n M u n i c i p a l S o l i d W a s t e M a n a g e m e n t i n I n d i a
III.2 POTENTIAL FOR PRIVATE SECTOR PARTICIPATION
At present, a handful of cities have ventured into public-private participation in an attempt to
overhaul their waste management systems. The partnerships range from engagements for
collection & transportation, processing & disposal of waste and for construction and/or
management of sanitary landfills. Some ULBs, depending upon their need, have partnered only for
C&T segments, some for processing and disposal, and a few only for the disposal of waste. The
concept of Integrated Solid Waste Management, being relatively new in the country, has been
adopted only by a few cities. The concern for efficient and safe disposal of waste has been growing
in recent times as citizens are more aware of the need for and the importance of good waste
management systems. The ULBs are under tremendous pressure to adopt good waste
management practices and PPPs are seen as a possible option given that several ULBs lack the
capacity and technical expertise to manage the growing waste quantities in their areas.
The government has attempted to address the lack of funds at the disposal of ULBs by launching
the UIG and UIDSSMT schemes under the JnNURM. These schemes provide grants to the ULBs so
as to aid their efforts to improve and augment the provisioning of civic amenities. However, the
ULBs availing the grant under the schemes are required to undertake a set of reforms within a
specified period. For instance, municipal corporations (nagar nigams) are required to reform rent
control acts, rationalize stamp duty, migrate to double entry accrual-based accounting system and
achieve 100 per cent cost recovery in solid waste and water supply services. Appendix I lists the 17
key reform parameters to be undertaken by ULBs and summarizes the achievement until 2010.
These reformatory measures are expected to create a conducive environment for improved delivery
of MSW services and enhance the scope for Public Private Partnerships.
III.2.1 Potential in terms of number of ULBs
India has over 5,000 cities and towns classified broadly as urban areas. The number of metropolitan
cities with population of over 1 million increased from 37 in 2001 to 50 in 2011 and is expected to
increase to 87 by 2031. With increasing urbanization and correspondingly high levels of waste
quantity that would be generated, the potential for PPPs is tremendous.
A quick perusal of the performance of states across select reform parameter show that Andhra
Pradesh and Maharashtra (having undertaken 16 reform measures) lead the group, while Gujarat
and West Bengal have completed 14 reformatory measures. Karnataka, Kerala and Tamil Nadu
have undertaken 12 reformatory measures each whereas states like Jharkhand, Arunachal Pradesh
and Uttrakhand have undertaken only three reforms each.31 Fig. 3.4 depicts the number of long-
term projects undertaken by the ULBs in a few states. Karnataka, Rajasthan and Tamil Nadu lead in
terms of the number of long-term PPP projects undertaken by their ULBs. The type of PPP includes
31 Please refer to Appendix I for details.

46 | P P P s i n M u n i c i p a l S o l i d W a s t e M a n a g e m e n t i n I n d i a
BOT (toll), BOT (annuity) as well as DBFOT. 31 PPP projects worth around ` 2,600 crore are at
different stages of implementation.32
Figure 3.4: SWM Projects at State Level undertaken as Public Private Partnerships
Source: Compiled from Status of PPP Projects in India, PPP India Database, DEA, (2011)
Among the major states, Tamil Nadu and Karnataka have partnered with the private sector for four
and seven long term projects, respectively. The effect of sound SWM practices is apparent from
these states as they are among the leading states in terms of urbanization. Maharashtra and
Gujarat have only one long-term project each but are states with great potential for PPPs in the
MSW management sector and also display a good track record in PPPs in the commercial
infrastructure sector.
III.2.2 Potential Investment in MSW Management Services
A recent study pegged the total capital expenditure required by Indian cities over the next 20 years
at $12 trillion - roughly $134 per capita per annum.33 The annual per capita capital expenditure on
solid waste management services is stated to be $15. With a population of over 1.2 billion people,
the total capital expenditure even at $15 per capita annually translates into a huge investment
requirement. The High Powered Expert Committee (HPEC) on the infrastructure sector calls for
increasing investment in urban infrastructure from 0.7% of the GDP in 2011-12 to 1.1% of the GDP
by 2031. In addition, the 13thFinance Commission has already recommended the release of ` 23,111
crore to ULBs for the period 2010-15.
32 The list is not exhaustive as PPP India database on solid waste management does not provide information on O&M contracts though several PPPs in O&M are underway in this sector. 33 Please see, “MGI: India’s urban awakening: Building inclusive cities, sustaining economic growth,” (2010).
1
1
1
1
2
3
3
3
4
5
7
0 2 4 6 8
Assam
Chandigarh
Gujarat
Maharashtra
West Bengal
Andhra Pradesh
Delhi
Uttrakhand
Tamil Nadu
Rajasthan
Karnataka
NUMBER OF PROJECTS

47 | P P P s i n M u n i c i p a l S o l i d W a s t e M a n a g e m e n t i n I n d i a
The HPEC has recommended expanding the JnNURM in the future and increasing the reach of the
mission to all cities and towns of the country. The mission would be re-christened the New
Improved JnNURM (NIJnNURM) and it recommends investing 0.25% of the GDP annually on urban
infrastructure. One of the recommendations of the HPEC with reference to financing of urban
infrastructure is the provision for the creation of a special window for projects that would be
financed or executed via PPP route or by leveraging private sources of funding. Fig. 3.5 provides a
glance at the quantum of investment required in creation of solid waste management infrastructure
in the Indian states.
Figure 3.5: Investment Requirement in SWM in India-2031 (` Crores)34
Source: Athena Research
It can be seen that the southern and western states of India would require relatively larger
investment compared to states in the central and north-western region due to high levels of
urbanization. West Bengal and Maharashtra require substantial investment primarily due to high
population levels as well as population density. Of the three segments of the MSW management
value chain, treatment of waste would require most of the investment. There is a potential for
leveraging private sector participation to enhance efficiency in the entire waste management
system.
34 The research is based on per capita investment requirement projection made by the HPEC (2011) and covers
only the Class IA & IB cities.

48 | P P P s i n M u n i c i p a l S o l i d W a s t e M a n a g e m e n t i n I n d i a
With a growing emphasis on recovering O&M expenditure through their own means, ULBs are in
the process of levying user charges on the waste generators. Several such examples exist, including
Trivandrum and Guwahati. Such an endeavor would reduce the dependency of ULBs on external
funds and grant, make ULBs financially self-sufficient and enhance sustainability of MSW projects.
Several ULBs have utilized funds available through JnNURM for setting up solid waste management
projects. Fig. 3.6 shows the total value of SWM projects underway through JnNURM. Here, it can be
seen that the share of the central government and state/ULB is more or less equal. However, central
share is higher for individual projects in cities that are classified as Class II and below.
Figure 3.6: Sharing of Project Cost: JnNURM Funded SWM Projects
Source: Status of Implementation of JnNURM Projects, JnNURM (2012).
Fig. 3.7 shows the total investment made in the solid waste management sector at the state levels.
No regional concentration of SWM projects can be observed from Fig.3.7.
Maharashtra, Tamil Nadu and Uttar Pradesh lead the list with high level of investments. States like
Rajasthan, Assam and Madhya Pradesh are high potential states as large sections of the population
still not covered by proper MSW management systems. AP and Karnataka, which are among the
leading states in PPPs in commercial infrastructure, also have huge potential for such partnerships
in the SWM sector as these states are not only progressive but are also undergoing high rates of
urbanization.
2060
1039 1021
0
50
100
150
200
250
Total Project Cost Central Share State + ULB
Fig
ure
s in
` T
ho
usa
nd
Cro
res

49 | P P P s i n M u n i c i p a l S o l i d W a s t e M a n a g e m e n t i n I n d i a
Figure 3.7: State-wise Investments underway through JnNURM
Source: Status of Implementation of JnNURM Projects, JnNURM (2012).
Fig. 3.8 and Fig. 3.9 show the expected growth and the breakup, value chain wise, of the MSW
management services market. Buoyed by active private sector participation, the sector is expected
to grow on average at a CAGR of around 22.4% for the period 2008-13.35 Further, the collection and
transportation segment of the value chain has the highest potential with a market share of 79%
followed by recycling and processing & disposal. In an evolving PPP market like India, initial
experiments in collection & transportation segments can pave the way for integrated MSW
management services as the market matures with time.
35 Source: Frost and Sullivan (2008).
0 50 100 150 200 250 300 350 400
Arunachal Pradesh Rajasthan
HP Karnataka
Assam MP
Bihar Puduchery
Uttrakhand Haryana
Punjab AP
Kerala Jharkhand
Gujarat WB UP TN
Maharashtra
Total Project Cost (Rs. Crores)

50 | P P P s i n M u n i c i p a l S o l i d W a s t e M a n a g e m e n t i n I n d i a
Figure 3.8: MSW Management Services Market: Revenue Forecast (2008-09)
Source: Frost & Sullivan (2009)
Figure 3.9: MSW Management Services Market – Revenue Breakup Value Chain Wise
Source: Frost & Sullivan (2009)
III.3 STRATEGIES FOR PRIVATE SECTOR PARTICIPATION
In this section, the process of selecting a suitable solid waste management model has been
described.
III.3.1 Selection of the Appropriate Solid Waste Management Model
Selection of the appropriate operating and financial model is an essential first step to improving
solid waste management services in a city. This, however, does not receive adequate attention in
many cases. In this section, we discuss the parameters that should be considered while deciding the
financial and operational models for a solid waste management system. Next, based on the
parameters, we describe which financial structure, and which operational model, would be best
7 8.5
11 13.5
16
20
0
5
10
15
20
25
2008 2009 2010 2011 2012 2013
In `
Hundre
d C
rore
s
Collection &
Transportation 79%
Treatment & Disposal
6%
Recycling 15%

51 | P P P s i n M u n i c i p a l S o l i d W a s t e M a n a g e m e n t i n I n d i a
suited for a given city. The choice of an appropriate waste management strategy would involve the
evaluation of the following basic parameters:
Exhibit 3.2: Major Determinants of Financial and Operational Model of MSWM
Determinants of Financial Model (Capital and Operational Expenditure/Income)
Determinants of Operational Model
(Centralized or Decentralized Waste Management System)
i. Quantity of waste generated ii. Central and State funds availability
iii. Internal resource generation by the urban local bodies
iv. Financial and Human Resource Capacity
i. Availability of land ii. Composition of waste
iii. Market linkages iv. Extent of Informal Workers engaged in
Collection of Waste v. Health risk
The overall quantity of waste generation, ULB’s internal resource generation potential, financial
health of ULBs and the availability of funds from higher tiers of the government influence the
selection of the financial model of the waste management system.
The choice of a centralized or decentralized waste management system is constrained by the
availability of vacant land, composition of waste, market linkage for resources produced from
waste, if any, health risk and the extent to which informal workers are engaged in the collection of
waste. We elaborate each of these aspects briefly in the following pages.
III.3.2 Financial Model
The selection of the appropriate source of funds to meet capital and operational expenditure
associated with the setting up of a solid waste management system depends on the following
factors:
Waste Quantity
The quantity of waste generation and the characteristics of waste generated in a city or town is an
important factor for adopting a particular system to manage the wastes. A city with large quantities
of waste generation requires a robust collection and transportation system with an adequate fleet
of high capacity transportation vehicles. Thus, a centralized approach might be more appropriate in
these cases. Class IA cities in India currently generate 2,400 MT to 7,000 MT of waste daily and it is
expected to increase to 3,700 – 9,000 MT daily by 2031. The waste generation in Class IB and IC
cities is relatively lower than that of the Class IA cities as observed in Exhibit 3.3 provided below.
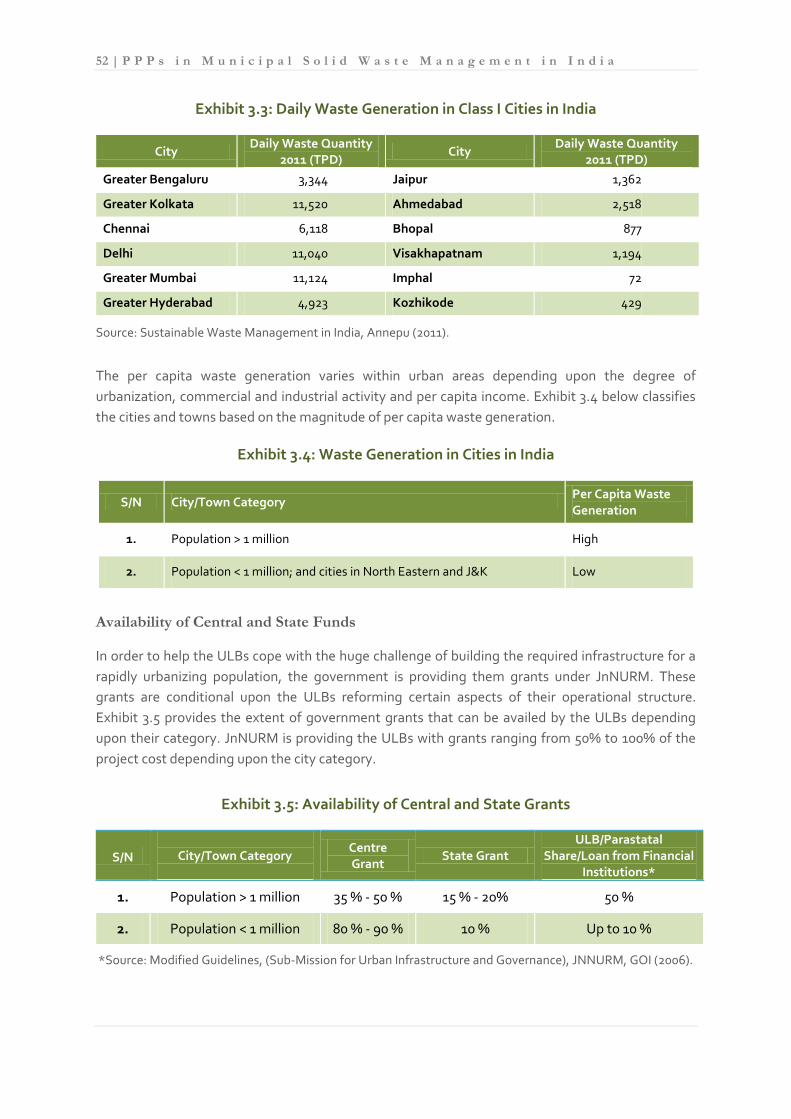
52 | P P P s i n M u n i c i p a l S o l i d W a s t e M a n a g e m e n t i n I n d i a
Exhibit 3.3: Daily Waste Generation in Class I Cities in India
City Daily Waste Quantity
2011 (TPD) City
Daily Waste Quantity 2011 (TPD)
Greater Bengaluru 3,344 Jaipur 1,362
Greater Kolkata 11,520 Ahmedabad 2,518
Chennai 6,118 Bhopal 877
Delhi 11,040 Visakhapatnam 1,194
Greater Mumbai 11,124 Imphal 72
Greater Hyderabad 4,923 Kozhikode 429
Source: Sustainable Waste Management in India, Annepu (2011).
The per capita waste generation varies within urban areas depending upon the degree of
urbanization, commercial and industrial activity and per capita income. Exhibit 3.4 below classifies
the cities and towns based on the magnitude of per capita waste generation.
Exhibit 3.4: Waste Generation in Cities in India
S/N City/Town Category Per Capita Waste Generation
1. Population > 1 million High
2. Population < 1 million; and cities in North Eastern and J&K Low
Availability of Central and State Funds
In order to help the ULBs cope with the huge challenge of building the required infrastructure for a
rapidly urbanizing population, the government is providing them grants under JnNURM. These
grants are conditional upon the ULBs reforming certain aspects of their operational structure.
Exhibit 3.5 provides the extent of government grants that can be availed by the ULBs depending
upon their category. JnNURM is providing the ULBs with grants ranging from 50% to 100% of the
project cost depending upon the city category.
Exhibit 3.5: Availability of Central and State Grants
S/N
City/Town Category
Centre Grant
State Grant ULB/Parastatal
Share/Loan from Financial Institutions*
1. Population > 1 million 35 % - 50 % 15 % - 20% 50 %
2. Population < 1 million 80 % - 90 % 10 % Up to 10 %
*Source: Modified Guidelines, (Sub-Mission for Urban Infrastructure and Governance), JNNURM, GOI (2006).

53 | P P P s i n M u n i c i p a l S o l i d W a s t e M a n a g e m e n t i n I n d i a
Financial health of the ULBs
The availability of funds for the ULBs is a major factor that determines the standard of service
delivery provided to the citizens. Engaging one or two private entities for a centralized system
would involve substantial capital outlay (in absolute terms) on equipment and other infrastructure
and require the balance-sheet of the ULBs to be sound. Payment of tipping fee to the
concessionaire for collection and transportation of waste or incurring the said cost on their own if
the private sector has been engaged only for treatment of wastes forms a significant portion of the
revenue expenditure of the ULBs. On the contrary, the decentralized approaches to waste
management in India have worked primarily on their own with little support from the ULBs.
Provision of vacant/unused premises and authorization for MSW services to RWA or community for
processing of waste have been two major forms of support provided by the ULBs. However, in
certain cases, for example in Mumbai, the ULB provides monetary compensation to the community
for management of wastes based on certain parameters.
A financially rich urban local body is better positioned to explore various alternatives that can be
exercised for improving the current waste management service in the city or town. It has more
degrees of freedom to use the available resource to build its own capacity in terms of skilled human
resource, better equipment, state-of-the-art technology, and use of ICT in monitoring of waste
management activity. Alternatively, it may leverage managerial and technical efficiency of
experienced private waste management companies and devote itself to the task of monitoring the
delivery of the service. It can practice centralized or decentralized waste management considering
the quantity, quality of waste generation and other factors as necessary. A poorly equipped ULB is
mostly dependent on government grants for improving the management of waste and has to abide
by the conditions, if any, associated with the utilization of grants. Hence, it has fewer avenues for
exercising different alternatives vis-à-vis rich ULBs.
Internal Resource Generation Capacity of Urban Local Bodies
Most of the ULBs in India find themselves in a ‘financial equilibrium’ trap which is the result of the
interaction of several financial and non-financial forces. This is illustrated in Figure 3.10.

54 | P P P s i n M u n i c i p a l S o l i d W a s t e M a n a g e m e n t i n I n d i a
Figure 3.10: Financial Equilibrium Trap of ULBs
Source: Analysis of Finances of Urban Local Bodies in India: A Cross-sectional Study, Nallathiga (2009).
The poor service standards often result in low use of municipal services. The non-payment of taxes
and user charges by the public makes a significant dent on the revenue collection of the ULBs,
which in turn restrains the ULB from making new investments in infrastructure creation for
enhancement of service delivery. At present, the adverse financial position of the ULBs is mainly
because of non-collection of taxes e.g., property tax, and also due to the presence of sub-optimal
tax collection mechanisms. Once the ULBs reform their accounting and tax structure, their internal
resource generation capacity will ensure their self-sustenance.
Selection of the Financial Model
The first two parameters, namely, quantity of waste generated and availability of central and state
funds for solid waste management, are largely dependent on the size of the city. Therefore, the
other two parameters, ULB’s internal resource generation capacity and its financial health,
determine the appropriate source of funds for capital and operational expenditure.
For large cities, with a population greater than a million inhabitants, the quantity of waste
generated is generally high and the central and state grants cover only up to 50% of the cost of the
project. For such large cities, if the financial health of the ULB is good, then all the capital
expenditure can be met through the ULB’s financial resources. In case of poor financial health, some
portion of the capital expenditure might need to be financed by the private sector.

55 | P P P s i n M u n i c i p a l S o l i d W a s t e M a n a g e m e n t i n I n d i a
Cost recovery of operating expenses would depend on the paying capacity of the users, as well as
the ULB’s ability to monitor generation, bill accurately and collect dues. If both the paying capacity
of the users and the ULB’s collection efficiency are high, full cost recovery through user charges
should be attempted. In case either of the two is low or weak, partial cost recovery must be
attempted, with the shortfall being financed through government grants or external grants. A
model of cross-subsidization, e.g., where water is supplied to industry that pays higher rates than
domestic consumers, can also be implemented. These options are summarized in Exhibit 3.6.
Exhibit 3.6: Strategy for large cities (Population > 1 million)
Good Financial Health of ULBs Poor Financial Health of ULBs
High internal
resource generation
capacity
CapEx: Central/ state grants + ULB CapEx: Central/ state grants + ULB + Private sector
OpEx: Full cost recovery through
user charges
OpEx: Full cost recovery through user
charges
Low internal resource
generation capacity
CapEx: Central/ state grants + ULB CapEx: Central/ state grants + ULB + Private sector
OpEx: ULB with partial cost
recovery user charges
OpEx: ULB with partial cost recovery through
user charges
CapEx: Capital Expenditure; OpEx: Operational Expenditure
For smaller cities, with a population less than one million, there is relatively lower waste generation,
both in per capita terms as well as in absolute terms. Additionally, the central and state grant
allocations for provisioning of solid waste management systems are relatively high. In such a
scenario, most of the capital expenditure can be met entirely from the central and state grants,
while operational expenses can be recovered from users of high paying capacity in order to meet
the gap between grants and requirements. These options are summarized in Exhibit 3.7.
Exhibit 3.7: Strategy for Small Cities (Population < 1 million)
Good financial health of ULB Poor financial health of ULB
High internal resource
generation capacity CapEx: Central/state grants + ULB CapEx: Central/state grants
OpEx: Full cost recovery through user charges
OpEx: Full cost recovery through user charges
Low internal resource
generation capacity CapEx: Central/state grants + ULB CapEx: Central/state grants
OpEx: ULB with partial cost recovery through user charges
OpEx: ULB with partial cost recovery through user charges
Source: Athena Research
III.3.3 Operational Model
Selection of a centralized or decentralized model of solid waste management is dependent on the
following factors, as discussed below.

56 | P P P s i n M u n i c i p a l S o l i d W a s t e M a n a g e m e n t i n I n d i a
i. Availability of Land
With such an enormous quantity of waste being generated on a daily basis, a centralized or regional
facility may be helpful since land for setting up multiple waste processing plants may not be
available, particularly in cities like Mumbai, where land is not only scarce but also has a very high
opportunity cost. Smaller cities and towns may be better positioned to have decentralized waste
management systems since the quantity of waste generation is relatively low and the availability of
land is not as problematic as it is in large cities. It may also be possible to transport waste in smaller
capacity vehicles like hand-driven carts or tricycles.
Exhibit 3.8: Availability of Land in Indian Cities
S/N City/Town Category Land Availability
1. Class I Cities Low
2. Other Small Cities and Towns High
There is a paucity of space for decentralized waste management systems at multiple locations in
large cities. If Waste Concern’s decentralized model is taken as a benchmark, then in order to
manage the entire waste generated in the megacities, waste processing plants of 1,000 sq. m each
would be required at 1,500 to 3,000 locations.36 However, the difference between the land
requirement for centralized and decentralized waste management plants is not significant. For
instance, the integrated solid waste management project at Guwahati has been allotted 1,60,536
sq. m of land for processing 300 MT of waste. If the same quantity of waste were to be processed by
setting up 150 facilities with a 2 MT capacity, 1,50,000 sq. m of land would be required. However the
‘Not in My Backyard Syndrome’ may hinder the provision of so many locations for waste
management systems. A city may explore the decentralized system on a pilot basis to assess the
response of the citizens to such systems.
ii. Waste Composition
The proportion of bio-degradable waste is high in the overall quantity of waste that is generated in
Indian cities and towns. The proportion of compostables ranges between 50% and 57% in Indian
cities and towns. Exhibit 3.9 displays the average waste composition region-wise. Composting is
therefore a good alternative for treatment of wastes. Refer Box 3.1 below. Both centralized and
decentralized systems can be applied to produce compost. Further, the calorific value of wastes in
India lies between 1,523 Kcal/kg to 2,341 Kcal/kg, which is higher than the minimum calorific value
required for deriving energy from wastes.
36 Waste Concern 2 MT plant requires 1,000 sq. m of land for setting up the waste management centre.

57 | P P P s i n M u n i c i p a l S o l i d W a s t e M a n a g e m e n t i n I n d i a
Exhibit 3.9: Composition of Waste in India
Region Compostables
(In Percent)
Recyclables
(in Percent)
Inert
(In percent)
Calorific Value
(Kcal/Kg)
Metros 50.89 16.28 32.82 1523
Other Cities 51.91 19.23 28.86 2084
East India 50.41 21.44 28.15 2341
North India 52.38 16.78 30.85 1623
South India 53.41 17.02 29.57 1827
West India 50.41 21.44 28.15 2341
Overall Urban India 51.3 17.48 31.21 1751
Source: Sustainable waste Management in India, Annepu (2011).
Box 3.1: India’s Experience with Composting
In India, composting has been practiced since ancient times to turn agricultural wastes into organic
manure. During 1975-80, ten mechanical compost plants were set at various parts of the country
with the twin objectives of producing manure for agricultural use and reducing the quantity of
waste reaching the dumpsites.
Central Public Health Engineering & Environmental Organization (CPHEEO) has stated that MSW in
urban centers in India has a favorable Carbon-Nitrogen (C/N) ratio of around 30 and is conformable
to composting. However, it cautioned that composting should not be seen as a commercial venture
but should be considered as a processing method and the sale price should be fixed accordingly.
The MSW Rules 2000 also sees composting as the preferred method to process municipal wastes.
The Planning Commission in the Tenth Five Year Plan stated that traditional technologies like
recycling of organic waste have been found to be useful and relevant.
However, since the compost plants operate at a constant rate, fluctuations in provision of waste
inputs to the plant, makes the project vulnerable. The commercial viability of the project is
threatened further as demand for compost is seasonal..
Source: ‘Composting’ Chapter 14, accessed from localbodies.up.nic.in
iii. Linkages – Backward & Forward
Value in waste is the most important reason for private sector participation in this sector. Waste is
often said to be a misplaced resource. Application of traditional as well as innovative technologies
has made production of several goods from waste possible. Electricity, manure, bricks, bio-
methanation and other recycled products from plastic, metals, etc can be produced through the
application of suitable technologies. The proceeds from their sale determine the commercial
viability of the waste management projects. However, the lack of backward and forward linkages in

58 | P P P s i n M u n i c i p a l S o l i d W a s t e M a n a g e m e n t i n I n d i a
the form of availability of the right quality and quantity of waste and a market for the goods
produced from waste have restrained scaling up of waste management projects. It is therefore
important to understand the market for each output produced and choose the right output mix for
mitigating the revenue risks in future. Waste-to-energy projects are not fit for decentralized
systems due to feasibility issues.
iv. Extent of Informal Workers engaged in Collection of Waste
The City Development Plans (CDPs) prepared by the ULBs should also include an assessment of the
valorization of waste by informal workers engaged in the collection of recyclables. This would help
in estimating the actual quantity of waste generated in the city/town and the extent of recycling
activity supported by the informal health workers. It may not be feasible for ULBs in cities with a
large number of workers engaged in rag-picking.
v. Health Risk
Decentralized waste processing plants situated in local areas may pose health risks if the facility is
not built and operated according to pre-defined standards. The risk would be high if the waste
processing facility is unattended or if the waste treatment is not scientific. In case of accidents or in
the event of a natural calamity, the danger of leakage of leachate or other harmful liquids is a
serious concern due to the proximity of residents to the waste processing facilities.
Selection of the Operating Model
Selection of the right operating model is driven by cost implications. While the area of land required
per ton of waste disposal does not vary significantly between centralized and decentralized models,
the availability of such land for decentralized systems in large, dense cities is likely to be low. Even if
land is available, its cost is likely to be prohibitive within large cities. Thus, if the cost of land,
including the opportunity cost, is included in the capital expenditure required for the decentralized
model, it is likely to be higher than the capital expenditure required for centralized systems,
especially due to the economies of scale that are possible in the latter. The willingness of the
community to actively participate in the management of waste in their surroundings is also an
important factor that influences the choice of the operational model.

59 | P P P s i n M u n i c i p a l S o l i d W a s t e M a n a g e m e n t i n I n d i a
Box 3.2: Level of Citizens/Community Participation
Participation by the citizens and the community is another important aspect that should be
considered while deliberating on the operational model. A community which is adequately
informed and aware not only helps in proper segregation of waste at source but also in reduction of
waste at source. Several examples of active citizens and community participation are in practice in
different cities. For instance, RWAs in Chennai with the help of Exnora, an NGO, initiated waste
management services in their localities as early as 1990s.
The decentralized system is applicable for both for-profit and not-for profit organizations but
requires a high degree of commitment from the community in waste management as their
participation is crucial for all segments of the MSW management. The MSW Rules 2000 does not
stipulate management of waste by the citizens themselves. In some cities citizens and informal
waste workers have come forward to manage municipal wastes in their localities. For instance,
RWA manage wastes in some areas in Mumbai with support of the Greater Mumbai Municipal
Corporation (GMMC). In Pune, the Pune Municipal Corporation (PMC) is financially supporting Solid
Waste Collection and Handling (SWaCH), a co-operative formed by waste pickers in 2007. The
organization provides door-to-door garbage collection services across the city. PMC committed to
support the operations of the co-operative for five years since inception. PMC provides
management and equipment support and bears infrastructure and some welfare costs during the
start-up phase whereas the co-operative in this incubation period explores revenue sources and
becomes a self-sustainable entity by the end of the period.
However, the sustenance of community based systems can be endangered with a change in
commitment of the local administration consequent of a change in government. Further, once the
concerned ULB starts levying and collecting conservancy charges on waste generators, it is unlikely
that all users of the community waste management services would be willing to pay the user
charges/conservancy charges twice. Hence, it is crucial to take note of the institutional framework
governing the waste sector before adopting a particular approach.
The operational expenditure in decentralized systems is generally low due to the use of non-
motorized vehicles like hand-held carts or tri-cycles employing informal workers for C&T of wastes.
Use of high density waste transportation vehicles to cover greater distance between the waste
processing facility and the collection centers involve higher operational expenditure. Exhibit 3.10
summarizes the typical cost differences for the two systems, though the actual tradeoffs can only
be assessed on a project-to-project basis, with detailed data.
The selection of a suitable operation model is thus driven by a number of factors, briefly
summarized below in exhibit 3.10.

60 | P P P s i n M u n i c i p a l S o l i d W a s t e M a n a g e m e n t i n I n d i a
Exhibit 3.10: Centralized vs. Decentralized Solid Waste Management Systems
Type Suitable when:
Decentralized Land sites for composting are available
Large number of informal workers in existing waste management system (rag-pickers)
High degree of organic content in waste
Risk of poor self-governance is low
Markets for compost are accessible
Possible to manage health risks adequately
Centralized Significant economies of scale are possible
Health hazard of inefficient disposal is high
Composition of waste allows high value extraction through use of technology, for e.g., waste-to-energy plants
Land is not available close to the community for decentralized model
III.4 PUBLIC-PRIVATE PARTNERSHIP MODELS: ISSUES AND LESSONS
This section presents a few case studies of PPPs in the MSW sector and attempts to capture
the key issues faced by stakeholders. The case studies prepared include Solid Waste
Management Projects in Tirupur, Kanpur, Hyderabad and Timarpur.
A. The Tirupur Solid Waste Management
Introduction
During 1990s, the Tirupur Municipal Corporation (TMC) started facing difficulties in managing the
municipal waste generated in the area due to the increasing quantity of solid waste generation. The
total waste produced by the town can be broadly categorized into three types: bio-degradable,
non–biodegradable and recyclable. The Tamil Nadu Urban Development Fund (TNUDF) suggested
that TMC should develop a composting plant on a PPP basis to treat the biodegradable waste. In
1999, IVR Infrastructures and Projects Ltd. was selected through a competitive bidding process to
finance, construct and operate the plant on a Build-Own-Operate-Transfer (BOOT) mode for a
period of 20 years.
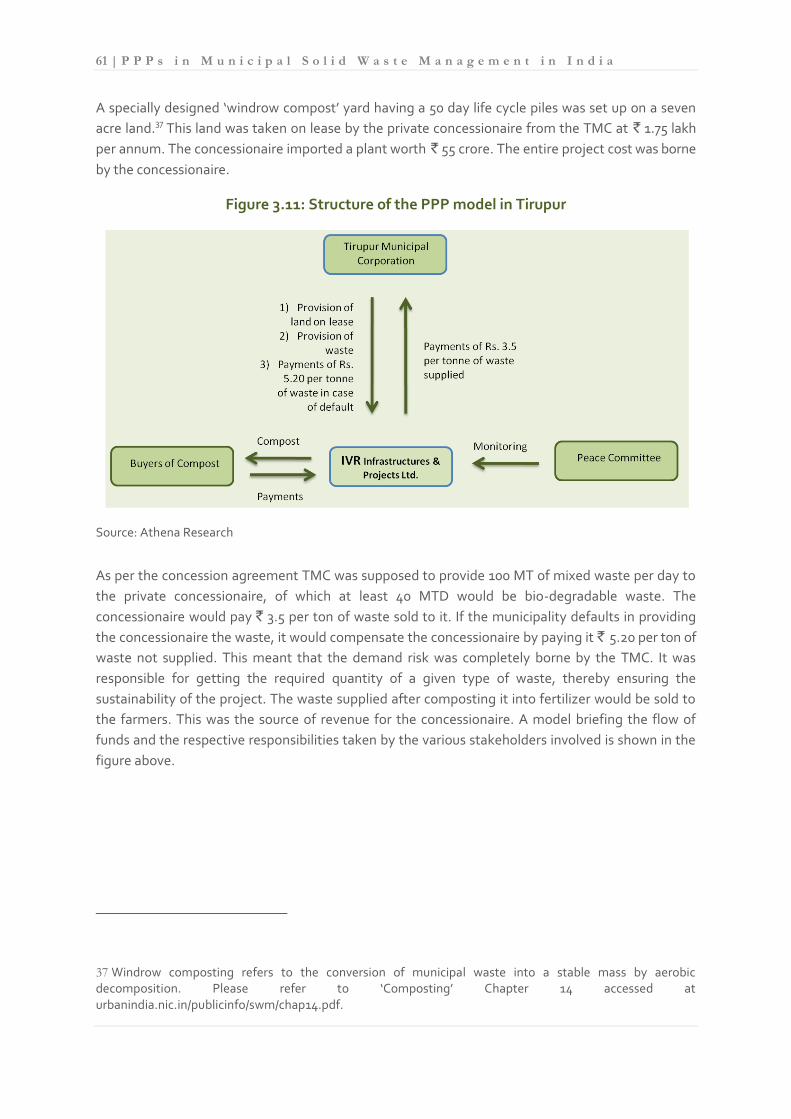
61 | P P P s i n M u n i c i p a l S o l i d W a s t e M a n a g e m e n t i n I n d i a
A specially designed ‘windrow compost’ yard having a 50 day life cycle piles was set up on a seven
acre land.37 This land was taken on lease by the private concessionaire from the TMC at ` 1.75 lakh
per annum. The concessionaire imported a plant worth ` 55 crore. The entire project cost was borne
by the concessionaire.
Figure 3.11: Structure of the PPP model in Tirupur
Source: Athena Research
As per the concession agreement TMC was supposed to provide 100 MT of mixed waste per day to
the private concessionaire, of which at least 40 MTD would be bio-degradable waste. The
concessionaire would pay ` 3.5 per ton of waste sold to it. If the municipality defaults in providing
the concessionaire the waste, it would compensate the concessionaire by paying it ` 5.20 per ton of
waste not supplied. This meant that the demand risk was completely borne by the TMC. It was
responsible for getting the required quantity of a given type of waste, thereby ensuring the
sustainability of the project. The waste supplied after composting it into fertilizer would be sold to
the farmers. This was the source of revenue for the concessionaire. A model briefing the flow of
funds and the respective responsibilities taken by the various stakeholders involved is shown in the
figure above.
37 Windrow composting refers to the conversion of municipal waste into a stable mass by aerobic decomposition. Please refer to ‘Composting’ Chapter 14 accessed at urbanindia.nic.in/publicinfo/swm/chap14.pdf.

62 | P P P s i n M u n i c i p a l S o l i d W a s t e M a n a g e m e n t i n I n d i a
Issues faced and lessons learnt
Formation of peace committee
The construction of the plant was completed in 2000. The concessionaire faced problems from the
villagers who refused to allow its operation by threatening the workers at the plant. The
concessionaire had to seek help from the municipality, which engaged a local NGO to convince the
villagers about the importance of the plant and its use for waste management. A “Peace
Committee” comprising of the village elders was formed to monitor the plant and ensure that there
was no foul odor in nearby areas due to the processing of waste.
Change in Compliance (Implementation of MSW Rules, 2000)
While the compost plant was being designed and constructed, the Ministry of Environment and
Forests, Government of India released the Municipal Solid Waste (Managing & Handling) Rules in
September 2000. The Urban Local Bodies (ULBs) are responsible for the implementation of the
rules, for infrastructure development for collection, storage, processing and disposal and operating
the solid waste management system. The ULB may contract out its role of provision of
infrastructure and operation to a service provider. The state pollution control board would be in
charge of monitoring compliance to the rules. Accordingly, Tamil Nadu Pollution Control Board
(TNPCB), set up in 1982 was given the role for ensuring compliance with MSW Rules 2000. TNPCB
had to be consented for the following purposes. First was the suitability of the land for establishing
a processing facility or a sanitary landfill. Second, allow operation only if the facility met the existing
standards of pollution control.
After the construction of the processing plant was completed in Tirupur, the private concessionaire
approached TNPCB to get its consent for operations. TNPCB refused to give its consent because
the processing plant did not comply with the MSW Rules. In particular, the solid waste would be
sent for processing into the composting plant without segregation. MSW Rules mandated that the
segregation of waste should be taken place at the source of generation and suitable technology
should be available to recycle each kind of waste. Both, TNUDF and the private concessionaire
pleaded TNPCB to excuse this project from following the MSW Rules as the concession agreement
was signed before the rules came into place. TNPCB refused and instead asked the ULB to ensure
segregation of waste at the source and only supply bio-degradable waste to the concessionaire. It
further insisted that the concession agreement should be re-written to include the provision of at
least 40 MTD of biodegradable waste by the TMC, since this was the amount of waste to be treated
in the compost yard of the total 100 MT of waste supplied. The objective of this measure was to
reduce the quantity of municipal waste brought to the landfill site, and thereby reduce the high
capital cost involved in developing a landfill site. This meant that the TMC could no longer supply
100 MT of mixed waste to the concessionaire. The concessionaire refused to accept this demand
and asked for 100 MTD of biodegradable waste as mentioned in the original agreement. This issue
was solved after the TMC conducted a number of campaigns to create awareness about the
segregation of the waste. This also allowed the rag-pickers to continue earning their livelihood by
collecting un-segregated waste, segregating recyclables and selling them.

63 | P P P s i n M u n i c i p a l S o l i d W a s t e M a n a g e m e n t i n I n d i a
Current Status
At present, the population of Tirupur (including floating population) generates 450 MT of waste per
day. Of this, 100 MT is bio-degradable waste, 340 MT is non-bio-degradable and 10 MT is recyclable.
TMC supplies 40 MT of bio-degradable waste to the private concessionaire, which will be increased
by initiating privatization of collection and transportation of wastes in the town, aided by awareness
campaigns.
B. The Kanpur Solid Waste Management
The need for a PPP in solid waste management of Kanpur
The waste generated by the residential households and commercial establishments in Kanpur
largely consists of organic waste, followed by waste from construction. The Kanpur City
Development Plan prepared under the JnNURM mentions that bio-degradable waste is 56% of the
total municipal waste. Prior to the engagement of a private player, the municipal corporation was
responsible for collection of the waste and its disposal. There was no mechanism for segregation of
waste and there was no waste processing plant. Considering the waste management scenario in the
city, Kanpur decided to adopt a PPP framework to manage its MSW. Two concessionaires were
selected for managing MSW in Kanpur. A private developer (Concessionaire 1, henceforth) was
responsible for collection and transportation of waste. Another private developer, A2Z Pvt. Ltd.
(Concessionaire 2, henceforth) was selected for processing and disposal of waste.
Processing and Disposal of Waste
In June 2008, a concession agreement was signed between KMC and Concessionaire 2 for
processing municipal waste in Kanpur on a BOT basis with a concession period of 30 years. This
project of ` 65 crore received a capital grant from JnNURM. The operations expenditure was to be
met by the private operator by levying tipping fees.
At this time, Concessionaire 1 was already selected which was responsible for collection of waste
from the households and commercial estates and transport it to the processing plant; operated by
Concessionaire 2. The waste transported to the processing unit (around 1,500 tons a day) would be

64 | P P P s i n M u n i c i p a l S o l i d W a s t e M a n a g e m e n t i n I n d i a
segregated and converted into refuse-derived fuel (RDF), compost or bricks. The value chain
describing the activities undertaken by A2Z Private Limited is shown below.
Figure 3.12: Value Chain for Processing and Disposal of Waste
Source: Athena Research
Collection and Transportation of Waste
Concessionaire 1 responsible for collection and transportation was incentivized only by the tipping
fee paid to it by the KMC, based on the quantity of the waste collected. Hence, the concessionaire 1
understood its responsibility as moving garbage to the processing plant rather than providing raw
material to concessionaire 2, which would be used to process to generate revenue.

65 | P P P s i n M u n i c i p a l S o l i d W a s t e M a n a g e m e n t i n I n d i a
After the commencement of operations of the processing plant by Concessionaire 2, it was realized
that the waste transported by Concessionaire 1 to the unit did not hold enough calorific value to be
converted into RDF, compost or bricks. This increased the financial risk of Concessionaire 2 as it was
not being able to generate revenue from selling the processed products to cover its operations and
maintenance costs. Considering this situation, KMC terminated the contract of collection and
transportation of waste with Concessionaire 1. Later, it entered into another contract with A2Z
Private Limited (Concessionaire 3, henceforth) to undertake the responsibility of collection and
transportation of waste on a BOT basis for a period of 30 years. The value chain that summarizes
the role of A2Z Private Limited is given below.
Figure 3.13: Value Chain for Collection and Transportation of Waste
Source: Athena Research

66 | P P P s i n M u n i c i p a l S o l i d W a s t e M a n a g e m e n t i n I n d i a
Reverse Integrated Solid Waste Management
A2Z Private Limited is now responsible for both the aspects of MSW management; collection and
transportation and processing and disposal. This process of first being responsible only for
processing and disposal and later for collection and transportation as well is called the ‘Reverse
Integrated Solid Waste Management’ Project. The stakeholder model of Integrated MSW in Kanpur
is shown below.
The project has made provisions for penalties incurred by the concessionaire and the municipal
corporation in case of default for not transporting the stipulated quantity of waste to the processing
facility as per the agreement. Concessionaire 1 also collects user charges from the waste generators
on behalf of the municipal corporation. Efficiency in collection of user charges is based on a given
percentage of the total amount of user charges billable on a monthly basis (1st Year – 30%, 2nd
Year – 40%, 3rd Year – 50%). If the Concessionaire 1 defaults, the tipping fee paid by the ULB is
reduced by the amount of the shortfall. Further, if Concessionaire 1 collects more user fees than
required, the extra amount collected in that particular month is added to the tipping fee paid. If this
takes place on a cumulative basis, then an incentive is given to the concessionaire (which is
calculated on an annual basis). 38
Figure 3.14: Stakeholder Model of a Reverse Integrated Solid Waste Management Project
Source: Athena Research
38 The incentive is 20% of the total amount collected reduced by the amount to be collected.

67 | P P P s i n M u n i c i p a l S o l i d W a s t e M a n a g e m e n t i n I n d i a
Lessons
Having separate concessionaires for ‘collection and transportation’ and ‘processing and
disposal’ may not be a sustainable project
Prior to the Reverse Integrated Solid Waste Management project, the ‘collection and
transportation’ concessionaire did not realize the economic value of the waste it was collecting and
transporting it to the concessionaire who had to recycle/process it. The concession agreement for
collection and transportation of waste provides an incentive to the private developer only in the
form of a tipping fee paid based on the quantity of waste collected. This issue made it challenging
for the concessionaire responsible for processing and disposal to mitigate its operational and
financial risk, as converting waste into revenue generating products. Hence, when the MSW
management is decentralized with private sector participation for each segment of value chain,
then the model may not be sustainable unless the tipping fee paid to the concessionaire responsible
for collection and transportation is based on both the quantity and quality of waste. KMC resolved
this issue by using a PPP model whereby all segments of the value chain of solid waste
management are handled by a single entity.
Involvement of community
The issue of rag-pickers making a living out of the waste was solved by the private developer
training them in collecting waste and retaining them. Before the KMC decided to handover MSW
management in Kanpur to private developers, the collection and disposal of waste was carried out
by rag-pickers. The rag – pickers would generate income for their livelihood by the sales of
recyclable waste that they collect. This was an issue in Kanpur, as contracting out collection of
waste to a private developer meant taking away the rag-pickers’ source of income. A2Z Private Ltd.,
instead of hiring new workers for their project, chose to retain the rag pickers. The rag – pickers
were trained for using various tools of collecting waste and were paid a monthly income for doing
the job.
C. The Hyderabad Integrated Solid Waste Management
The need for PPP in Integrated Solid Waste Management of Hyderabad
The Greater Hyderabad Municipal Corporation (GHMC) in 2007 estimated that the city would
generate nearly 3,800 tons of waste per day. Before 2007, the storage of waste at the source of
generation and its segregation was limited to a few parts of the city. This was usually done when a
huge heap of waste was accumulated at some location or when there were complaints from the
public demanding its clearance. Only about 10-15% of the households disposed it in the nearby
community points. There were no means of quantifying the efficiency and monitoring of the
garbage clearance mechanism. However, GHMC had already privatized large proportions of the
solid waste management in the city ─ 75% of the total area of the city was privatized for street
sweeping and collection & transportation in the form of service contracts. Also, the corporation had
already entered into two MoUs with private concessionaires for conversion of waste to energy. Each
concessionaire was provided with 700 metric tons of waste, thereby privatizing as well as treating
only 37% of the total waste generated.

68 | P P P s i n M u n i c i p a l S o l i d W a s t e M a n a g e m e n t i n I n d i a
Exhibit 3.11: Increasing Scope of PPPs in Hyderabad Y
ea
r
2008 onwards
Integrated Solid Waste Management of 3,800 TPD generated by the city
2000-06
75 % of the work contracted out. Another 700 TPD supplied to RDF Projects Ltd. for WtE
1997-99
60 % of the work contracted out. 700 TPD supplied to Selco for WtE
1996-97
27 areas covering 40,000 population
Road Sweeping
Collection & Transportation
Processing O&M of Transfer
Stations Waste
Disposal
Aspects of Solid Waste Management
Source: Athena Research
In order to meet the compliance rates of MSW (Management & Handling) Rules, 2000 and to
implement the “Clean Hyderabad 2006-07 Program”; the GHMC decided to adopt an integrated
solid waste management system under the PPP mode.
Structure of the PPP Model
The Infrastructure Corporation of Andhra Pradesh (INCAP) provided the consultancy services for
project structuring, bid processing, financial analysis and selection of the concessionaire for the
Hyderabad Integrated Solid Waste Management Project (ISWM). The entire time line of the bidding
process has been shown in Fig. 3.15. 22 EoIs were received, of which six were shortlisted. Two
different concessionaires submitted financial bids of ` 1,431 and ` 1,680 per ton of waste. Since the
lowest tipping fee was the bid criteria, Ramky Enviro Engineers Limited (REEL) whose bid was `
1,431 per ton of waste was awarded the project.
Increasing Scope of PPPs

69 | P P P s i n M u n i c i p a l S o l i d W a s t e M a n a g e m e n t i n I n d i a
Figure 3.15: Timeline ISWM in Hyderabad
Source: Athena Research
The Greater Hyderabad Municipal Corporation (GHMC) and REEL entered into an agreement for
integrated solid waste management in Hyderabad in February 2009. The project was to be carried
out on a DBFOT basis for 30 years. The scope of the project included:
Door to door collection of waste
Collection of waste from storage points
Transportation of waste to a transfer station
Construction, operations and maintenance of transfer station
Secondary transportation of waste from the transfer station to a processing facility
Construction, operation and maintenance of the processing facility
Disposal of waste by means of scientific landfill
Construction, operations and maintenance of the landfill
Capping of existing dump sites
The total project cost was ` 434.91 crore and was eligible for a grant from the State Government
and the Central Government under the JnNURM scheme, with a share of 15% and 35% of the total
project cost, respectively. In the event of being unable to obtain the grant, GHMC was responsible

70 | P P P s i n M u n i c i p a l S o l i d W a s t e M a n a g e m e n t i n I n d i a
for making a provision of grant equivalent to 50% of the total project cost, thereby covering the
share of Government of India and Government of Andhra Pradesh. The arrangements for the
remaining 50% of the project investments were to be made by the private concessionaire itself. The
other obligations of GHMC include the provision of road connectivity to the transfer stations, the
treatment & disposal facilities, and the handover of all existing infrastructure such as dustbins,
landfills, vehicles, etc. to the concessionaire. The GHMC was also responsible for provision of power
connections to the transfer stations and treatment and disposal sites. However, the arrangements
of the distribution network, usage charges, water supply and power back up facilities were to be
made by the concessionaire. A brief stake holder model describing the flow of funds and other
resources in this project is given below.
Figure 3.16: Stakeholder Map of MSW Management in Hyderabad
Source: Athena Research
The project allowed the collection and transportation of garbage by the private developer on a trial
basis, starting with the east and the west zone of the city. After reviewing the performance in six
months, the developer may be asked to carry out the activities for the municipal solid waste
generated by the twin cities (Hyderabad and Secunderabad), which would be approximately 4,000
metric tons. According to the agreement, REEL had to commence the collection and transportation
facilities within six months of being awarded the project and establish the processing facilities in
two years. Despite the agreement being awarded in 2008, the project implementation was kept in
abeyance for over a year due to objections raised by the municipal workers. The municipal workers
argued that once the private developer would take the responsibility of collection and

71 | P P P s i n M u n i c i p a l S o l i d W a s t e M a n a g e m e n t i n I n d i a
transportation of waste, their role would be restricted to sweeping of roads. However, after
consultations with the labour union leaders and the municipal of administration and urban
development, a memo was signed and the project was commenced.
REEL paid ` 3 crore as project development fee and submitted bank guarantee of ` 18 crore
towards the performance guarantee. GHMC appointed Environment Protection Training &
Research Institute (EPTRI) as the independent consultant for the project to monitor the
performance of the firm for 25 years, plus another 15 years of monitoring the landfills after closure.
The concession agreement stated that of the 3,800 metric tons of waste collected by REEL, 700 MT
would be given to each of the firms – SELCO and RDF Power Generation Limited for processing,
and the remaining amount would go to back to REEL.
Lessons
Financing support by the state
A financing issue was faced during the project implementation phase. Government of India refused
to contribute its share of 35% of the project cost, amounting to ` 152 crore by claiming that the
state had already exhausted its investments of seven years under the JnNURM. To resolve this
problem, the state government agreed to bail out GHMC by bearing that part of the project cost
which was to be provided by the GOI.
Commitment by the government
In July 2009, there was a strike by the GHMC employee unions arguing that the private
concessionaire would limit their role in Hyderabad MSW Management for works such as street
sweeping and not for the actual collection and transportation of waste. However, the Municipal
Administration and Urban Development (MA&UD) released a memo to begin pre-construction
works after having consultations with the heads of the labour union. It is essential for the
government to intervene when such obstructions by the municipal employees cause delays in
project development.
Role of independent engineer
It was during the initial stages of the collection and transportation of the waste, when the
Environment Protection Training & Research Institute (EPTRI) sent a letter to the GHMC
commissioner saying that the collection, transportation, treatment and disposal of the waste
should be taken up simultaneously as per the agreement. It also said that the payment of the
tipping fee should only come into effect when the treatment and disposal facility is constructed and
is under operation. In this regard, REEL’s argument was that the Tipping Fee of ` 1,431 per ton, to
be paid by the GHMC is for three components – 40% of it for collection & transportation, 20% for
transfer to processing stations (dumping yards) and the remaining 40% for treatment and disposal
of waste. Hence, until operations of treatment of waste begin, REEL should be paid only 60% of the

72 | P P P s i n M u n i c i p a l S o l i d W a s t e M a n a g e m e n t i n I n d i a
tipping fee. This indicates the importance of the role of an independent engineer, to monitor the
implementation of the project as per the concession agreement.
Lack of clarity in the concession agreements of the municipal corporation with multiple private players for MSW management
Initially, of the 3,800 metric tons collected by REEL and given to the GHMC, about 2,400 MT would
be given back for power generation. Despite the fact that the concession agreement stated that
GHMC would not enter into any agreement with other power generating companies, GHMC did
enter into an agreement with Venkateshwara Power Ltd. to supply 700 MT of waste. REEL objected
to this agreement, but the MA&UD argued that the agreement with Venkateshwara Power Ltd. was
signed before the one with REEL for ISWM project. Recently, RDF Power Generation Ltd.
demanded 200 MT extra from the GHMC. GHMC could not refuse to supply since it had to pay the
remaining ` 5.45 crore for 26% of the equity share in its agreement with RDF Power Generation
Limited. Currently, RDF Power Generation Limited is supplied 900 MT which it uses for power
generation, further sold to Tata Power Trading Company for ` 3.6 per unit. The rest of the power
generation companies are supplied 700 MT each and the rest of the waste collected is supplied to
REEL for its power plant set up at Jawaharnagar. Thus, the lack of clarity amongst various
concessions of the GHMC with other waste processing private developers, lead to the reduction of
waste available to REEL for processing from 2400 MT to 1500 MT. This would increase the revenue
risk of REEL.
Figure 3.17: Sharing of Solid Waste in Hyderabad
Source: Athena Research

73 | P P P s i n M u n i c i p a l S o l i d W a s t e M a n a g e m e n t i n I n d i a
D. The Timarpur-Okhla Solid Waste Management Project
Introduction
This project was initiated in 2007 when Municipal Corporation of Delhi
(MCD) and the New Delhi Municipal Corporation (NDMC) decided to implement a ‘16 MW Waste to
Energy Project’ on BOOT basis by setting up an integrated municipal waste processing facility at
Okhla and Timarpur in New Delhi.39 The project was an outcome of the continued difficulties faced
by the ULBs of Delhi in disposing/treating solid waste. Around 2050 tons of waste (one-third of the
total municipal waste generated in Delhi) was targeted to be processed to generate over 16 MW of
green electricity. The project cost was estimated at ` 175 crore (later escalated to ` 200 crore40)
with a construction period of two years.41
The project attracted 30 private players initially of which six submitted their bids. Four bidders
qualified on technical parameters and finally Jindal Urban Infrastructure Limited was selected based
on the lowest tariff for electricity generated from the project. The company had quoted ` 2.49 per
kwh for the first year and a leveled tariff of ` 2.83 per kwh.
39 MCD and NDMC are two separate ULBs in Delhi with separate jurisdictional areas.
40 This escalation was primarily due to increase in capacity of power plant from 16 MW to 20 MW. 41Please refer to ‘Timarpur-Okhla Solid Wate Manangement Project’ document retrieved at http://ilfswasteexchange.com/html/TOWMCPL.pdf and ‘Hon’ble CM of Delhi Smt. Sheila Dikshit lays the foundation stone for the Jindal Ecopolis Timarpur-Okhla Municipal Solid Waste Management Project’ retrieved at http://www.towmcl.com/Pressrelease_Details.aspx?MKey=18&NKey=8, for different in project cost.

74 | P P P s i n M u n i c i p a l S o l i d W a s t e M a n a g e m e n t i n I n d i a
Some Notable Features:
The project is the first and largest integrated waste management project ever being set up in the
country, aiming for a sustainable solution (Zero Waste Concept) taking MSW through an
environmentally friendly process to generate clean and renewable energy from MSW.
The project is CDM is registered with United Nations Framework Convention on Climate Change
(UNFCCC) for earning carbon credits. The plant is expected to annually lead to emission
reductions of 266,066 metric tonnes of carbon dioxide equivalent per annum.42
The project achieved financial closure within 4 months from award of Letter of Intent (LOI).
The project demonstrated high level of preparedness as technical studies, statutory approvals,
regulatory approvals, contractual framework, project appraisals, etc. and tying up all linkages,
was undertaken before the bidding process was initiated.
The project did not require grants from the government for meeting its capital or operational
expenditure.
Figure 3.18: Stakeholder Mapping of Timarpur-Okhla Integrated Waste Management Project
Source: Athena Research
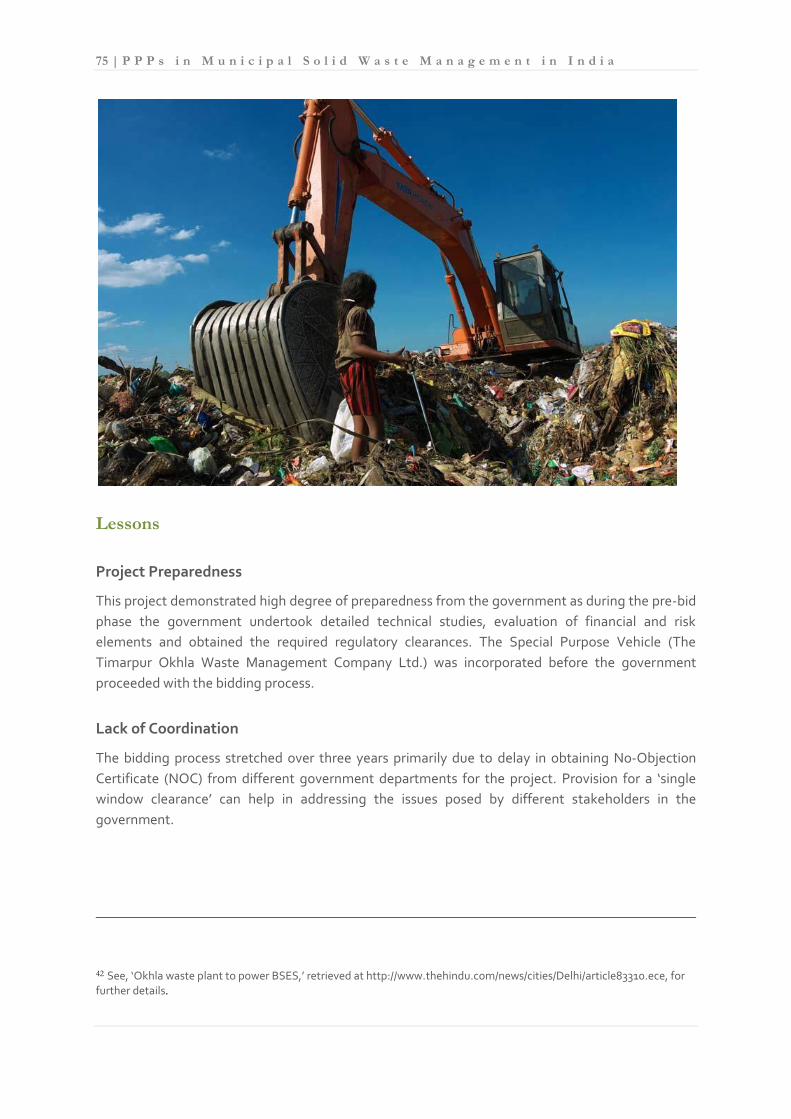
75 | P P P s i n M u n i c i p a l S o l i d W a s t e M a n a g e m e n t i n I n d i a
Lessons
Project Preparedness
This project demonstrated high degree of preparedness from the government as during the pre-bid
phase the government undertook detailed technical studies, evaluation of financial and risk
elements and obtained the required regulatory clearances. The Special Purpose Vehicle (The
Timarpur Okhla Waste Management Company Ltd.) was incorporated before the government
proceeded with the bidding process.
Lack of Coordination
The bidding process stretched over three years primarily due to delay in obtaining No-Objection
Certificate (NOC) from different government departments for the project. Provision for a ‘single
window clearance’ can help in addressing the issues posed by different stakeholders in the
government.
42 See, ‘Okhla waste plant to power BSES,’ retrieved at http://www.thehindu.com/news/cities/Delhi/article83310.ece, for further details.

76 | P P P s i n M u n i c i p a l S o l i d W a s t e M a n a g e m e n t i n I n d i a
Choice of Technology
The project allowed the private sector consortium the flexibility to choose the technology for
processing of waste. The consortium found RDF appropriate given the high organic composition of
the city’s waste. The choice of the technology was made after assessing it at alternative locations.
Running pilots before applying a technology at a larger level could entails significant resource
savings
Stakeholder Consultation
The project is located in close proximity of human settlements. This resulted in protests by different
stakeholders, including residents and NGOs. The government conducted public hearings in
association with different stakeholders to address the concerns of the residents. It is important that
the location of MSW processing sites be chosen after proper planning and far away from human
settlements. In case of severe location constraints, a well designed Information, Education and
Communication (IEC) system is a must to get stakeholder buy-in.
77 | P P P s i n M u n i c i p a l S o l i d W a s t e M a n a g e m e n t i n I n d i a
Chapter IV
CONCLUSION AND FUTURE MEASURES
Management of solid waste has been a major challenge for the local governments. Lack of
concerted effort to create awareness about good waste management practice and failure of the
ULBs to provide this important municipal service to the public are primarily responsible for
development of a poor waste management system in the country. The severity of the issue has
increased due to rapid urbanization coupled with rising income levels that could increase the
problem of waste management manifold in the near future. By creating the required infrastructure
for environmentally sustainable and cost-effective collection & transportation system, recycling,
processing & scientific disposal, it is possible to reduce the quantity of refuse reaching landfills and
also extract value from the waste.
With India undertaking adequate measures to address the financial constrains of the ULBs through
JnNURM and 13th Finance Commission grants it is important that the ULBs build capacity to
appropriately allocate the funds and manage waste in an environmentally sound and cost-effective
manner. This would Adequate planning and adopting waste management solutions that suits the
socio-economic and geographical profile of the urban areas is particularly important. Lack of data is
a major constraint towards this end. The government and other stakeholders need to come
together to address the data gap in terms of waste quantity, composition among other aspects that
would allow for informed decision making.
The private sector has been assisting the ULBs to improve the management of waste in some
segments of the MSW management. In some instances private sector participation has been able to
enhance cost efficiency of delivery of the MSW management services. There is a need to take the
public private partnerships to the next phase where such partnerships are based on a mature
rationale. The emphasis of PPPs should be to leverage the private sector efficiency so as to
ameliorate the ways in which waste is managed by the ULBs.
The next stage of this project will involve developing recommendations for the stakeholders based
on the extensive research undertaken during this exercise. To support the ULBs in their solid waste
management strategies, capacity building exercises on the choice of financial and operational
model would be conducted in a few select ULBs in the states of Tamil Nadu, Karnataka, Andhra
Pradesh and Madhya Pradesh.

78 | P P P s i n M u n i c i p a l S o l i d W a s t e M a n a g e m e n t i n I n d i a
APPENDIX I
Exhibit I.1 Performance of State with respect to JnNURM Reforms
S
/
N
JnNURM
Reforms
A
P
A
R
P
A
S
M
B
R
C
G
D
L
G
O
A
G
J
H
R
N
H
P
J
&
K
J
R
D
M
P
R
M
Z
M
M
P
M
A
H
A
N
L
O
D
A
P
N
B
P
D
Y
R
S
S
K
M
K
N
K
K
L
T
N
T
R
P
U
K
U
P
W
B
1
74th CAA
(Transfer
of 12
Schedule
Functions
)
√
√ √
√
√ √
√ √ √ √
√
2
74th CAA
(Constitut
ion of
DPC)
√ √ √ √ √
√ √ √ √
√ √
√ √
√ √ √ √
√ √
3
74th CAA
(Constitut
ion of
MPC)
√
√
√
√
√
√
4
Transfer
of City
Planning
Function
√
√
√
√ √ √
√ √
√
√ √ √ √
√
5
Transfer
of Water
Supply &
Sanitation
√
√ √ √
√ √ √
√ √
√ √
√ √ √
√ √
6
Reform in
Rent
Control
√ √ √
√ √
√
√
√ √
7
Stamp
Duty
Rationaliz
ation to 5
Per
Cent
√
√ √
√
√
√
√ √
√
8 Repeal of
ULCRA √ √ √ √ √ √ √ √ √ √ √
√ √ √ √ √ √ √
√ √ √ √ √ √ √ √
9
Enactmen
t of
Communi
ty
Participati
on Law
√
√ √
√ √
√ √
√
√
√
√ √
1
0
Enactmen
t of Public
Disclosur
e Law
√ √ √ √
√
√ √ √
√
√ √
√
√
√ √ √ √
√ √
1
1
E-
Governan
ce Set UP
√
√
√
√
√
√
√ √
1
2
Migration
to Double
Entry
Accrual-
based
Accountin
g
√
√
√
√ √
√ √
√
√ √ √ √ √ √ √
1
3
Number
of Cities
with
Coverage
of
Properties
> 85 Per
Cent
√
√
√
√
√
√ √ √
√ √
1
4
Number
of Cities
with
Property
Tax
Collection
>90 Per
Cent
√
√
√
√ √
√ √

79 | P P P s i n M u n i c i p a l S o l i d W a s t e M a n a g e m e n t i n I n d i a
1
5
100 Per
Cent of
O&M
Cost
Recovery
in Water
Supply
√
√
√
1
6
100 Per
Cent Cost
Recovery
in Solid
Waste
√
√ √ √
√
√
√ √ √ √
√
√
√ √
1
7
Internal
Earmarki
ng of
Funds for
Services
to Urban
Poor
√
√ √ √
√
√
√
√ √ √ √ √ √ √
√ √ √ √ √ √ √
Number
of PPP
Projects
3
1
3
1
1
5
7
4
3
2
Number
of
Reform
Measures
1
6 3 7 8 8 2 3
1
4 6 7 1 1 5 2
1
0
1
6 4
1
0 6 2 9 2
1
2
1
2
1
2
1
1 3
1
2
1
4

80 | P P P s i n M u n i c i p a l S o l i d W a s t e M a n a g e m e n t i n I n d i a
REFERENCES
Annepu, R. K. (2012). Sustainable Solid Waste Management in India. Master of Science Thesis in Earth Resource
Engineering, Earth Engineering Centre, Columbia University, (2012). Accessed from
http://www.seas.columbia.edu/earth/wtert/sofos/Sustainable%20Solid%20Waste%20Management%20in%20Indi
a_Final.pdf
Enayetullah, I., and A.H. Md M. Sinha (2002). Community Based Decentralized Composting: Experience of Waste
Concern in Dhaka. Urban Management Innovation, Case Study #3. All India Institute of Local Self Government,
New Delhi.
Esakku, S., Swaminathan, A., Karthikeyan, O.P., Kurian, J., and K. Palanivelu (2007). Municipal Solid Waste
Management in Chennai City, India. Eleventh International Waste Management and Landfill Symposium, S.
Margherita di Pula, Cagliari, Italy; 1 - 5 October 2007. CISA, Environmental Sanitary Engineering Centre, Italy.
ICRA Management Consulting Services Limited (2011).Toolkit for Public Private Partnership Frameworks in
Municipal Solid Waste Management, Volume I – Overview and Process. Ministry of Urban Development,
Government of India.
ICRA Management Consulting Services Limited (2011). Toolkit for Public Private Partnership Frameworks in
Municipal Solid Waste Management, Volume II–Case Studies of PPP Projects. Government of India.
ICRA Management Consulting Services Limited (2011). Toolkit for Public Private Partnership Frameworks in
Municipal Solid Waste Management, Volume III – Model PPP Templates and Documents. Ministry of Urban
Development,Government of India.
ICRA Management Consulting Services Limited (2011).Toolkit for Public Private Partnership Frameworks in
Municipal Solid Waste Management, Volume IV –, Baseline Status of MSWM in Select Satellite Towns. Ministry of
Urban Development,Government of India.
Jain, G.V., Mahadevia, D., and C. N. Ray (2005). Urban Governance for Sanitary Waste Management Services in
Jabalpur. Working Paper No.26, School of Planning, CEPT , Ahmedabad.
Kanpur Municipal Corporation (2010). Concession Agreement for the Collection and Transportation of MSW for
Kanpur Municipal Corporation. Accessed from
http://kmc.up.nic.in/PDF_Files/others/A2Z%20Agreement%20Copy.pdf
Khajuria, A., Yamatoto, Y., and T. Morioka (2010). Estimation of municipal Solid Waste Generation and Landfill
Area in Asian Developing Country. Journal of Environmental Biology, 31(5), pp. 649-654.
Kumar, S., Bhattacharyya, J.K, Vaidya, A.N., Chakraborty, T., Devotta, S., and A.B. Akolkar (2009). Asessment of
Status of Municipal Solid Waste Management in Metro Cities, State Capitals, Class I Cities, and Class II Towns in
India: An Insight. Waste Management, 29, pp. 883-895.
Mahalingam, A. (2010). Urban PPP Case Studies: Tamil Nadu. TNUDF, Government of Tamil Nadu.
Mohan, D (2002). People’s Right to Safety. Health and Human Rights, 6 (2), pp.161-167.
Ministry of Environment & Forests (2000). Municipal Solid Waste Management (Management & Handling) Rules,
2000. Government of India.
Ministry of Environment & Forests (2011). Report of the Committee set up to frame National Sustainable Habitat
Standards for the Municipal Solid Waste Management. Government of India.
Ministry of Urban Development (2006). Modified JnNURM Guidelines – UIG. Government of India.

81 | P P P s i n M u n i c i p a l S o l i d W a s t e M a n a g e m e n t i n I n d i a
Ministry of Urban Development (2006). Guidelines for Preparation of Detailed Project Reports and Selection of
Technologies for Processing and Disposal of Municipal Solid Waste Using 12th Finance Commission Grants.
Government of India.
Ministry of Urban Development (2006). Report of the Working Group on Urban Development (excluding Urban
Transport), Urban Water Supply and Sanitation (including Low Cost Sanitation, Sewerage & Solid Waste
Management) and Urban Environment for the Eleventh Five Year Plan (2007-2012). Government of India.
Ministry of Urban Development (2008). Handbook on Service Level Benchmarking. Government of India.
Ministry of Urban Development (2010). Improving Service Outcomes 2008-09: Service Level Benchmarking
Databook. Government of India.
Ministry of Urban Development(2011). Municipal Solid Waste Management on a Regional Basis - Guidance Note.
Government of India.
Ministry of Urban Development (2011). Report on Indian Urban Infrastructure and Services. High Powered Expert
Committee. Government of India.
National Institute of Urban Affairs (2010). Benchmark for Efficient Services. Quarterly Newsletter, 13(1). Accessed
from http://www.niua.org/Publications/newsletter/UF_ENG_JAN-MAR10.pdf
Rathi, S. (2007). Optimization Model for Integrated Municipal Solid Waste Management in Mumbai. Environment
and Development Economics, 12, pp. 105-121.
Sarkar, Papiya (2003). Solid Waste Management In Delhi – A Social Vulnerability Study. In Martin J. Bunch, V.
Madha Suresh and T. Vasantha Kumaran, eds., Proceedings of the Third International Conference on Environment
and Health, Chennai, India, 15-17 December, 2003. Chennai: Department of Geography, University of Madras and
Faculty of Environmental Studies, York University. Pages 451 – 464.
The World Bank (1999). What a Waste: Solid Waste Management in Asia. Urban Development Sector Unit, East
Asia and Pacific Region, World Bank Group, Washington DC.
UNICEF (2010). Successful Innovations in Solid Waste Management Systems: examples from Five Local Bodies in
Tamil Nadu. Government of Tamil Nadu, India.
Urban Management Centre (NA). Integrated Waste Processing Plant on PPP
(Build Operate Own) Process: Rajkot Municipal Corporation. Accessed from
http://www.pas.org.in/Portal/document/ResourcesFiles/GoodPracticeDocs/Integrated%20Waste%20Processing
%20Plant.pdf
USEPA (2010). Municipal Solid Waste Generation, Recycling and Disposal in the United States: Facts and Figures
for 2010. Environment Protection Agency, US government.
Vishwanath, C., and J. Trankler (2003). Municipal Solid Waste Management in Asia: A Comparative Analysis.
Environmental Engineering & Management, Asian Institute of Technology.

82 | P P P s i n M u n i c i p a l S o l i d W a s t e M a n a g e m e n t i n I n d i a
Athena Infonomics India Pvt. Ltd. 6th Floor, B Block, Mena Kampala Arcade Sir Theagaraya Road, T. Nagar, Chennai – 600017 Ph: +91 44 42327112/13, 28152778 Fax: +91 44 28152778 www.athenainfonomics.in