Real-Time Visualization To Increase Efficiency ... - McKesson

Public Policy and Real Energy Efficiency
Assessing the effects of Federal policies on energy consumption and the environment
October 2005
American Gas Foundation 400 North Capitol St., NW, Suite 450
Washington, DC 20001 202-824-7270
www.gasfoundation.org

PUBLIC POLICY AND REAL ENERGY EFFICIENCY Assessing the effects of Federal policies on energy consumption and
the environment
Prepared for the American Gas Foundation by:
GARD
Analytics
Energy, Economic and Environmental Researchy
1028 Busse Highway Park Ridge, Illinois 60068-1802
Copyright © 2005 by the American Gas Foundation
DISCLAIMER
Legal Notice: This report was prepared for the American Gas Foundation by GARD Analytics to provide an independent study to assess the effects of Federal energy efficiency statutes, programs, and policies on energy consumption and the environment. Neither the American Gas Foundation, GARD Analytics, nor any person acting on their behalf:
a. Makes any warranty or representation, express or implied with respect to the
accuracy, completeness, or usefulness of the information contained in this report, or that the use of any information, apparatus, method, or process disclosed in this report may not infringe privately-owned rights,
b. Assumes any liability, with respect to the use of, damages resulting from the use
of, any information, method, or process disclosed in this report, or
c. Recommends or endorses any of the conclusions, methods or processes analyzed herein. Use of this publication is voluntary and should be taken after an independent review of the applicable facts and circumstances.
American Gas Foundation
Founded in 1989, the American Gas Foundation is a 501(c)(3) organization that focuses on being an independent source of information research and programs on energy and environmental issues that affect public policy, with a particular emphasis on natural gas. For more information, please visit the website at www.gasfoundation.org or contact Gary Gardner, Executive Director, at 202-824-7270 or [email protected].
GARD Analytics GARD Analytics, Inc. provides contract research, development and application engineering services to a broad mix of institutional, governmental, and corporate clients in the energy and environmental sectors. GARD Analytics was founded in December 1995 as a result of a reorganization of ElectroCom GARD Ltd., an R&D subsidiary of ElectroCom Automation. GARD Analytics is located in Park Ridge, Illinois near Chicago's O'Hare Airport in a facility that includes offices and laboratory workspace. A residential testing facility is available for equipment testing and thermal and indoor air quality experiments. For more information, please check out the website www.gard.com.

TABLE OF CONTENTS Section Page
Executive Summary ......................................................................................................................... i
1 Introduction............................................................................................................................ 1 1.1 Purpose ...................................................................................................................................... 1 1.2 Background ............................................................................................................................... 1 1.3 Efficiency and Emissions Impact .............................................................................................. 2 1.4 Description of Terms................................................................................................................. 4
2 Federal Energy Efficiency Policies, Programs and Standards............................................... 7 2.1 Comparative Advantages of Site Energy, Real Energy and Energy Cost Based Measurement
Systems...................................................................................................................................... 7 2.2 Advantages/Disadvantages of Energy Cost as a Proxy for Real Energy Efficiency............... 10 2.3 Candidate Policies, Programs and Standards Benefiting from Real Energy Efficiency
Evaluation................................................................................................................................ 13
3 Potential Energy/Emissions Reductions due to the Adoption of Real Energy Efficiency Policies................................................................................................................................. 40 3.1 Energy Savings and Emissions Models................................................................................... 40 3.2 Savings & Emissions Analysis................................................................................................ 41
4 Potential Market Shifts due to the Adoption of Real Energy Efficiency Policies ............... 68 4.1 Potential Market Shifts from the Adoption of Real Energy Policies....................................... 68
5 Potential Barriers to Real Energy Efficiency Policies ......................................................... 80 5.1 Political Barriers...................................................................................................................... 80 5.2 Legal Barriers .......................................................................................................................... 81 5.3 Market Barriers........................................................................................................................ 82 5.4 Technical Barriers ................................................................................................................... 85 5.5 Economic Barriers................................................................................................................... 93
6 Conclusions.......................................................................................................................... 94 6.1 Candidate Programs and Policies ............................................................................................ 94
7 References.......................................................................................................................... 100
APPENDICES
Appendix A Analysis Methodology & Detailed Results Appendix B Chronology of Federal Energy Efficiency Programs and Policies Appendix C Residential Housing Energy Consumption and Greenhouse Gas Emissions Appendix D Residential Appliance Energy Consumption and Greenhouse Gas Emissions Appendix E Commercial Appliance Energy Consumption and Greenhouse Gas Emissions Appendix F Vehicle Energy Consumption and Greenhouse Gas Emissions Appendix G New Energy Efficient Home Credit Cost Premiums The appendices are published in a separate volume. Copies are available by visiting the Foundation website at www.gasfoundation.org or by contacting Kelly Batte at [email protected] ( 202-824-7026).

EXECUTIVE SUMMARY
Attention is often focused on U.S. energy consumption and its long-term impact on the economic and environmental health of the nation. Many policy initiatives have been directed toward conservation of energy in our homes, appliances, buildings, factories, and vehicles. However, most of these measures target reductions in energy demand at the point of use without specifically addressing overall efficiency or relative emissions that result from the processes required to provide energy to the customer.
Energy efficiency measures the amount of energy consumed in a process relative to the output derived from that process. Three methods of measuring energy efficiency are examined in this report:
• Site Energy examines only those impacts that occur at the site of the customer’s energy use. For example, an electric water heater efficiency rating is approximately 93% on a site basis, indicating that almost all of the energy delivered to the appliance actually heats water and only about 7% of the energy is lost or wasted.
• Real Energy (also known as source, primary, and full fuel-cycle) examines all the impacts of consumer energy use, including those impacts from obtaining, processing, generating, and delivering energy. These processes result in additional energy use\loss and environmental impacts. For example, the electric water heater cited above may be 93% efficient at the site, but a more complete examination of the full fuel-cycle impacts reveals that its real energy efficiency is only 25%. This difference is due to the inclusion of energy lost or consumed in processes required to convert fossil fuel to electricity and to deliver that electricity to customers.
• Energy Cost focuses on the amount paid by the consumer for using energy. This approach is founded on the premise that higher consumer costs can be equated with lower efficiency and, conversely, lower consumer cost can be equated with higher efficiency.
PURPOSE OF THIS REPORT
In an effort to assess the effects of Federal energy efficiency statutes, programs, and policies on energy consumption and the environment, this report:
• Reviews the treatment of energy efficiency in current and proposed energy policies
• Analyzes the reasonableness of using Energy Cost as a surrogate for energy efficiency
• Estimates the potential benefits of using the Real Energy (site plus all upstream energy consumption) approach for selected energy policies
• Estimates market share distortions for end-use equipment from policies based on Site Energy efficiency and potential market shifts from utilizing the Real Energy approach for these policies
• Identifies barriers to implementation of the Real Energy efficiency approach
• Selects candidate programs that would benefit from the Real Energy approach
i

MAJOR FINDINGS
Real Energy analysis is the best method for measuring energy efficiency and the impacts of energy consumption on the environment. While Energy Cost analysis at times can be an acceptable alternative, regional pricing variations and non-cost based utility pricing structures impair the accuracy of this approach.
Most federal energy efficiency policies use Site Energy as their criteria. As a result, many federal energy efficiency policies actually encourage the use of less efficient applications. Not only does this result in higher total energy consumption, it increases total pollution. The activities associated with providing energy to the customer, particularly electricity generation and transportation, often emit substantial amounts of CO2 and other gasses associated with global warming.
Modifying a number of current and proposed efficiency policies that utilize Site Energy criteria to incorporate a Real Energy efficiency approach could cause market shifts away from less overall efficient technologies. This is particularly true if policies promoted more efficient electric and gas technologies compared to electric resistance applications. At a minimum, these energy policies could utilize a combination of the approaches, similar to the Federal Energy Management Program (FEMP) policy for analyzing government energy efficiency projects. FEMP requires government agencies to choose the lowest life cycle cost option while reducing Site Energy use per square foot, and any increases in site energy use can be offset by decreases in Real Energy use.
Numerous barriers impede federal policy use of Real Energy efficiency standards. Political and legal barriers pose the greatest challenges to changing the policies. Market and technical barriers could be more easily overcome with sufficient education and resources.
COMPARISON OF ENERGY EFFICIENCY MEASUREMENT OPTIONS
While easy to use and understand, Site Energy analysis is often misleading as it ignores impacts that occur before energy is delivered to the customer. These upstream activities include a variety of processes. In order for a customer to use energy, fuels must be extracted, processed, transported to central sites, often converted to alternate forms of energy , and delivered to the customer. Energy is consumed\lost and environmental impacts are realized at each of these points.
Using Energy Cost as an efficiency surrogate captures some of the impacts that are ignored in the site analysis. Each of the processes along the energy chain entails costs, which are included in the ultimate price to the consumer. While the Energy Cost approach is superior to simple Site Energy analysis, the Energy Cost method has deficiencies. First, cost may not account for all environmental impacts of energy use. Consumer costs reflect only the cost of pollution that is actually controlled, but not the societal costs of uncontrolled pollution. Second, most energy pricing structures do not reflect the true cost of providing energy to the consumer, particularly for seasonal and time of day fluctuations, thus sending imprecise signals to the customer.
ii

The Real Energy approach, while less simple, provides the most accurate ranking of energy consumption impacts. The analyst must obtain data and perform calculations for determining the impacts from all the processes involved in providing energy to the customer. The results provide the most comprehensive analysis of energy resource use and impact on the environment of the three options.
The figure below illustrates the real energy efficiency difference between electricity and natural gas1, from the point of production up to, but not including, the efficiency of the appliance.
Real Energy EfficiencyTotal Energy Required to Deliver 50 MMBtu to a Customer
Natural GasElectricity Generated
From Fossil Fuels
185 MMBtuSource Energy
56 MMBtuSource Energy
73% of Energy Is Lost 10% of Energy Is Lost
Energy losses occur through extraction, processing, generation, and delivery of energy in its final form.Source: Based on data fro m A Comparison of Carbon Dioxide Emissions Attributable to New Natural Gas
and All-Electric Homes, American Gas Association, October 31, 1990.
50 MMBtu 50 MMBtu
Further, the relative advantages of the Site Energy, Real Energy, and Energy Cost approaches are outlined as follows:
Advantages of Energy Efficiency Measurement Systems
Site Energy Real Energy Energy Cost
Historical precedence More complete picture of energy resource use
Influences consumer actions
Easily understood Accounts for regional fuel mix and price variations
Easily understood & measured for simple pricing structures
Easily measured Best measurement of societal impacts (e.g., pollution)
May be a reasonable substitute for real energy analysis
___________________________________________________
1 While this report may refer to natural gas in previous case studies and analyses, it should be noted that the use of propane in these examples should result in very similar conclusions regarding real energy efficiency and environmental impacts.
iii

Examining three residential space-heating options – electric resistance furnace, electric heat pump, and a gas furnace – the table below further illustrates the differences in the approaches. Based on a Site Energy analysis, the electric options are 26% to 151% more efficient than the gas furnace. Using an Energy Cost basis, the electric heat pump has a 2% advantage over the gas furnace and a 27% advantage over the resistance furnace. However, employing a Real Energy efficiency basis, the gas furnace uses 4% to 52% less overall energy than the electric options. Further, whereas the Site Energy analysis implies that the electric options are “cleaner” than the gas option, the Real Energy efficiency analysis shows that the gas option actually results in far fewer emissions.
A Comparison of Energy Efficiency Approaches for Residential Space Heating
Energy Use (MMBtu/yr) Total Emissions (lbs/yr) Space Heating Technology
Site Energy Real Energy Site Energy Real Energy
Annual Energy Cost
Electric Resistance Furnace 50.5 139.1 0 20,345 $1,362
Electric Heat Pump 25.3 70.3 0 10,253 $989
Natural Gas Furnace 63.5 67.2 7,001 7,409 $1,013
Data Source: Savings and emissions analysis of the New Energy Efficient Home Credit. Electric technologies reflect impact of power plant energy consumption (coal, nuclear, hydro, natural gas, etc.) based on the fuel mix of the area analyzed. Refer to Section 3.2.1 for more details.
FEDERAL ENERGY EFFICIENCY POLICIES ANALYSIS
Federal energy efficiency policies primarily use Site Energy when determining efficiency. This is particularly true for those policies that have a significant impact on energy use (e.g., appliance standards). The Energy Cost approach is used to a lesser extent, mainly for tax credits and building envelope efficiency. Very few federal energy policies include Real Energy as a part of their evaluation process, such as building efficiency ratings and federal facility projects. In some instances, energy policies require that more than one method be used -- for example, the FEMP requirement on federal building efficiency uses Energy Cost and Site Energy as the primary criteria, but Real Energy efficiency gains can be used to offset increases in Site Energy use in the selection process. Even when analyses at least address the implications that arise from a Real Energy approach, the programs do not always prioritize or undertake activities to maximize Real Energy efficiency.
POTENTIAL BENEFITS FROM USING REAL ENERGY EFFICIENCY IN FEDERAL POLICIES
Based on analyses of selected policies, the Real Energy approach could promote more efficient technologies over less efficient options.. Most energy policies, such as proposed efficiency tax credits and the National Appliance Energy Conservation Act (NAECA), are intended to be “technology/fuel neutral” – that is, they do not seek to promote one fuel or technology system over another; however, because of the use of a misleading measurement using Site Energy, actually biases decisions in favor of inefficient
iv

fuel uses. Real Energy analysis shows that significant national efficiency and environmental benefits could be obtained from these programs by encouraging more overall efficient technologies.
The Site Energy approach has caused market shifts away from more energy efficient technologies, thus increasing relative energy use, consumer costs, and emissions. Examples of such policies include:
• The Department of Energy increased the minimum efficiency of commercial gas water heaters in both 1994 and 2002, while relaxing the standards for electric resistance applications in 1999. These higher standards caused gas water heaters to increase in price, particularly in relation to electric resistance units. Since the late 1990’s, electric resistance water heaters have gained market share at the expense of the more efficient (on a Real Energy efficiency basis) gas units. Thus, these standards have contributed to increased energy consumption, higher consumer costs, and higher levels of pollution.
• The American Society of Heating, Refrigerating and Air-Conditioning Engineers (ASHRAE) proposed a building energy envelope guideline in 1996 that differentiated between buildings using electric resistance technologies and other technologies. This dual envelope standard was then supplemented by a blended envelope standard that did not differentiate among technologies. A report by Optima Consulting Services (Optima 1997) concluded that the blended envelope approach increased overall Real Energy consumption by 5% and increased overall Energy Costs by 10% relative to the dual-envelope approach.
POTENTIAL BARRIERS TO IMPLEMENTATION OF REAL ENERGY EFFICIENCY STANDARDS
Political and legal barriers pose the greatest impediments to improving energy efficiency policies. Examples include:
• Current federal law (42 USC 6291(4)) defines energy use as, “…the quantity of energy directly consumed by a consumer product at point of use…” This statute would have to be amended in order for most government policies to utilize a Real Energy efficiency approach.
• The federal government has adopted a “fuel neutral” approach that discourages inter-fuel comparisons in many efficiency rulemakings. This approach can promote inefficient technologies that were originally supported by Site Energy analysis.
• Many stakeholders (utilities, environmental and efficiency proponents, appliance manufacturers, legislators and regulators, builders, and consumers) influence energy policy. The goals of these stakeholders often conflict, intentionally or unintentionally, with Real Energy efficiency.
• Stakeholders who assert that particular energy policies and regulations are discriminatory often resort to legal actions to halt or alter such policies. Even when the policies are upheld, those legal actions can significantly delay implementation.
v

Market and technical barriers also impede the promotion of energy efficiency. Examples include:
• Builders that make appliance decisions for new construction generally favor lower equipment costs options. These low first-cost options also tend to be less attractive from an energy efficiency perspective.
• Energy consumers and policy makers are generally poorly educated with respect to the options and impacts related to energy efficiency decisions.
PROGRAMS AND POLICIES THAT WOULD BENEFIT FROM A REAL ENERGY APPROACH
While recent energy efficiency tax incentives focus on improving efficiency within a particular heating and cooling system, incentives to switch from less efficient electric resistance technologies would offer greater potential benefits. Policies based on Real Energy efficiency would encourage homeowners to switch from electric resistance appliances to heat pumps or efficient fossil fuel technologies, thereby reducing overall energy consumption and pollution.
ASHRAE developed the Advanced Energy Design Guide, with the goal of reducing office building Site Energy consumption by 30%. However, the guide results in only a 25% reduction in overall energy use and a reduction of only 10% in overall pollution because the guide does not target energy savings from electric furnaces and boilers. The design guides miss a significant potential efficiency gain by not promoting more efficient fossil fuel and heat pump technologies.
The Department of Energy and the Federal Trade Commission regulate the new appliance labels that estimate an appliance’s Site Energy use and Energy Cost. This EnergyGuide label also compares the product’s Site Energy use to similar models. The EnergyGuide program examines each fuel type separately. Labels based on the Real Energy efficiency concept would allow consumers to better compare appliances using differing fuels and technologies in terms of overall energy consumption and environmental impact.
Weighting factors have been introduced in recent legislation for dual-fuel and alternative fuel vehicles to account for the societal benefits of reducing our dependence on foreign energy supplies. However, these weighting factors do not take full fuel-cycle issues fully into account. For example, there have been numerous studies that call into question the full fuel cycle efficiency of ethanol-derived fuels. In terms of energy output compared with energy input for ethanol production, a recent study (Pimentel 2005) found that ethanol requires anywhere from 29% to 57% more fossil energy than the fuel produced depending on the feedstock used. FEDERAL POLICY RECOGNITION OF IMPORTANCE OF REAL ENERGY APPROACH
The Energy Policy Act of 2005 (EPACT 2005), which was passed by Congress in July 2005 and signed into law by President George W. Bush on August 8, 2005 includes a provision (Section 1802) that requires the Secretary of the Department of Energy to contract the National Academy of Sciences (NAS) to "examine whether the goals of energy efficiency standards are best served by measurement of energy consumed, and efficiency improvements, at the actual site of energy consumption, or through the full fuel cycle, beginning at the source of energy production." Since the objective of this American Gas Foundation (AGF) study closely coincides with the expressed objectives in EPACT2005, it is envisioned that this AGF study can serve as a strong “foundation” for NAS in the development of their study by providing an independent, comprehensive overview of the energy efficiency measurement and policy issues.
vi

PUBLIC POLICY AND REAL ENERGY EFFICIENCY
1 INTRODUCTION
1.1 Purpose
The purpose of this report is to create a comprehensive and accurate assessment of the effects of energy policy on energy consumption, based on a solid understanding of energy efficiency throughout the full fuel cycle (i.e., all energy used or lost along the energy cycle of energy production, processing, transportation and consumption). These impacts must be considered in addition to the impacts of energy consuming equipment in order to make meaningful comparisons and valid policy decisions.
1.2 Background
In the aftermath of the 1973 oil embargo and significant increases in energy costs, much attention was directed to the escalating growth of the consumption of energy in the United States and its long-term impact on the economic and environmental health of the country.
Early policy initiatives were directed at the conservation of energy within the nation’s buildings and vehicular fleets. The Energy Policy and Conservation Act of 1975 established a wide range of energy conservation programs, including fuel-economy standards for passenger cars, appliance labeling and standards programs, and energy conservation programs for federal buildings. These initiatives targeted energy consumed by the end user with little attention paid to the actual natural resources consumed. For example, the Energy Conservation Standards for New Buildings Act of 1976 was developed using only on-site efficiencies and building boundary fuel and energy conversions. Similarly, the Energy Policy Conservation Act enacted into law by Congress in 1975 established Corporate Average Fuel Economy (CAFE) standards for passenger cars and light trucks with the goal of doubling new car fuel economy by model year 1985.
These measures targeted reductions in energy demand without specifically addressing the supply-side of the equation. Even though the impetus behind early congressional action was a reduction in the country’s dependence on foreign oil, which at the time accounted for a quarter of total energy consumption, many early policy initiatives didn’t specifically target energy supply. Partially as a result of this failure, energy imports now account for over 30% of total energy consumption (Figure 1.1).
However, it was soon recognized that energy shortages do not originate at the building boundary or the gas pump, but are rather related to the importation and refinement of imported oil and the rate of domestic oil and gas production. Using site-based building or vehicle energy performance standards could not alone accomplish the objectives of policy makers. Building energy performance standards (BEPS) were developed which included the application of resource utilization factors to reflect energy consumption starting at the energy source rather than the building boundary. Likewise, in the vehicular sector, tax incentives were established to encourage the use of biomass-derived alcohols.
1

Current and proposed initiatives utilize energy cost as a proxy for real energy usage. For example, during the current version of American Society of Heating, Refrigerating and Air-conditioning Engineers (ASHRAE) Standard 90.1 economics were used as the basis for informing the professional judgment of the project committee in setting the criteria.
The Energy Policy Act of 2005 signed into law on August 8, 2005 includes a tax credit to builders of energy efficient homes. Qualification for the credit is based on energy consumption savings measured in terms of average annual energy costs to the homeowner.
Figure 1.1 – Total Energy Flow in Quadrillion Btu (EIA/Annual Energy Review 2003)
1.3 Efficiency and Emissions Impact
There are known inefficiencies in converting energy resources into usable energy at a building, appliance or vehicle. In the case of coal, petroleum and natural gas, these include extraction, processing and transportation. Since fossil fuels together account for almost 70% of the feedstock used to generate electricity, these losses reduce the efficiency of electricity production. Conversion losses at the power generating plant and transmission and distribution losses between the power plant and the end user reduce the effective efficiency even further (Figure 1.2). Once energy losses and consumption from the extraction, processing, transportation, conversion, storage, and delivery processes are considered, overall losses for oil, propane, and natural gas are about 10%, whereas losses for electricity are about 70%.
2
In addition to efficiency implications, proper measurement of energy use allows for better understanding of overall environmental impacts from energy use. Fossil fuels consumption results in emission of known, harmful pollutants. Since the overall emissions associated with energy use vary by fuel type and by process, it is critical to acknowledge the emissions that result from the full fuel cycle.
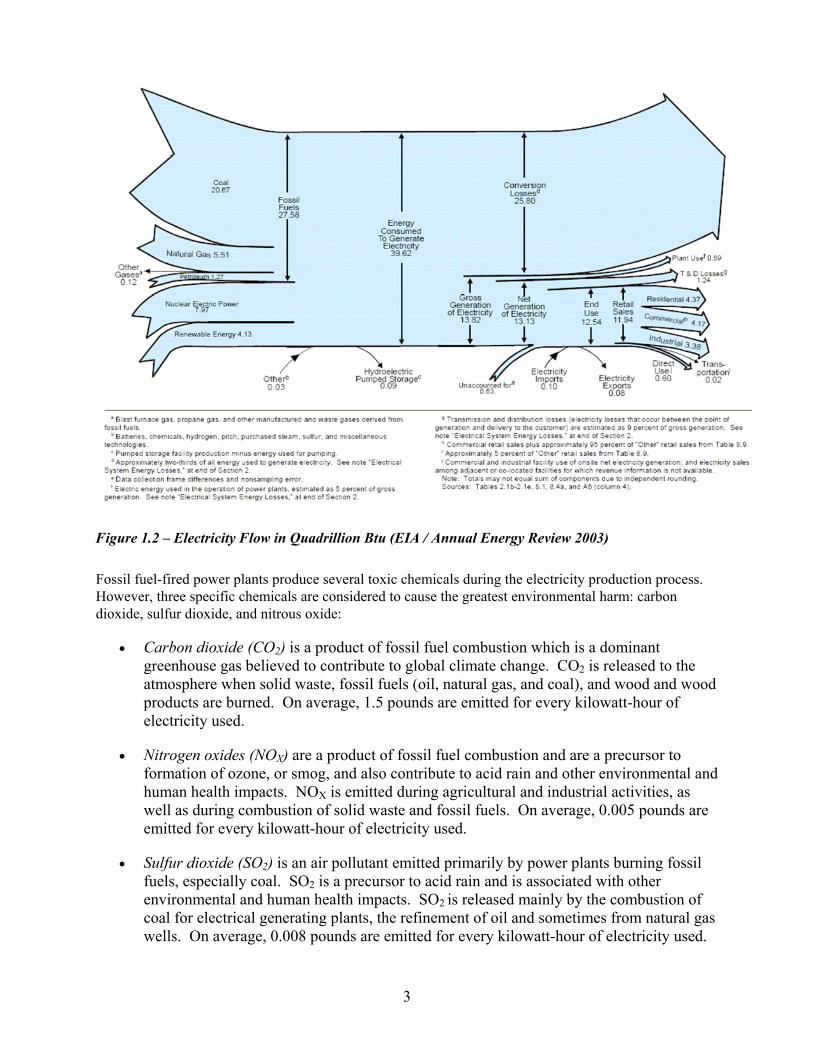
Figure 1.2 – Electricity Flow in Quadrillion Btu (EIA / Annual Energy Review 2003)
Fossil fuel-fired power plants produce several toxic chemicals during the electricity production process. However, three specific chemicals are considered to cause the greatest environmental harm: carbon dioxide, sulfur dioxide, and nitrous oxide:
• Carbon dioxide (CO2) is a product of fossil fuel combustion which is a dominant greenhouse gas believed to contribute to global climate change. CO2 is released to the atmosphere when solid waste, fossil fuels (oil, natural gas, and coal), and wood and wood products are burned. On average, 1.5 pounds are emitted for every kilowatt-hour of electricity used.
• Nitrogen oxides (NOX) are a product of fossil fuel combustion and are a precursor to formation of ozone, or smog, and also contribute to acid rain and other environmental and human health impacts. NOX is emitted during agricultural and industrial activities, as well as during combustion of solid waste and fossil fuels. On average, 0.005 pounds are emitted for every kilowatt-hour of electricity used.
• Sulfur dioxide (SO2) is an air pollutant emitted primarily by power plants burning fossil fuels, especially coal. SO2 is a precursor to acid rain and is associated with other environmental and human health impacts. SO2 is released mainly by the combustion of coal for electrical generating plants, the refinement of oil and sometimes from natural gas wells. On average, 0.008 pounds are emitted for every kilowatt-hour of electricity used.
3

4
Carbon dioxide and nitrous oxide are two of the principal greenhouse gases. While some of the emissions occur naturally in the atmosphere, most result from human activities. Fossil fuels burned to run cars and trucks, heat homes and businesses, and power factories are responsible for about 98% of U.S. carbon dioxide emissions and 18% of nitrous oxide emissions. Although not a greenhouse gas, sulfur dioxide along with nitrogen oxide is a principal source of acid rain. Although there are natural sources of sulfur oxides and nitrogen oxides, humans are the cause of 90% of sulfur emissions in eastern North America. Total carbon dioxide, sulfur dioxide and nitrous oxide emissions, expressed as pounds per year, are computed for the space heating and cooling systems for each alternative analyzed in this study.
1.4 Description of Terms
There is some confusion as to the exact definition of the terms site energy and real energy, especially the latter. The U.S. Department of Energy‘s Energy Information Administration (EIA) supplies the following definitions:
• Site Energy Consumption: The Btu value of energy at the point it enters the home, building, or establishment, sometimes referred to as "delivered" energy.
• Primary Energy Consumption: Primary energy consumption is the amount of site consumption, plus losses that occur in the generation, transmission, and distribution of energy.
Since primary energy consumption includes losses that occur in the generation, transmission, and distribution of energy as sell as the energy consumed to extract, process and transport energy, it is often referred to more descriptively as source energy or source-based energy. Recently, the terms fuel-cycle or full-fuel cycle and real energy have come into common usage, especially in the transportation sector with basically the same meaning. According to a recent study published by the Center for Transportation Research at Argonne National Laboratory (Wang 1999), the fuel cycle for a given transportation fuel includes the following processes: energy feedstock production; feedstock transportation and storage; fuel production; fuel transportation, storage and distribution; and vehicle operations that involve fuel combustion or other chemical conversions. In the context of federal energy efficiency statutory and voluntary programs and policies, all of these terms can effectively be used interchangeably. However, for the sake of simplicity and consistency, the term "real energy" will be used exclusively throughout the remainder of this report.

PROPANE AND REAL ENERGY EFFICIENCY
Propane gas (also known as liquefied petroleum gas – or LPG) is similar to natural gas. It is a versatile fuel that is used for heating homes, heating water, cooking, drying clothes, fueling gas fireplaces and as an alternative fuel for vehicles. According to the EIA, residential and commercial use of propane accounts for 43% of all propane used in the United States, excluding propane gas grills. Of the 107 million households in the United States, 9.4 million depend on propane for one use or another and 54% of these households rely on propane for their primary heating fuel. In 2002, almost 20 billion gallons of propane were sold in the United States as reported by the American Petroleum Institute.
Propane comes from two sources – natural gas processing and crude oil refining.
• It can be transported through pipelines to large customers and distributors, while deliveries to most commercial and residential customers are by truck. Propane is also transported in rail cars.
• It is typically transported and stored as a liquid but burned as a gas. It is a heavier hydrocarbon than natural gas, and thus it has a higher heating value, approximately 2500 Btu per cubic foot compared to about 1000 Btu per cubic foot of natural gas.
• Propane is a relatively clean source of energy, with combustion emissions very similar to those of natural gas.
• Propane appliances achieve the same end-use appliance efficiencies as natural gas – in fact, the minimum appliance efficiency values established by DOE is the same for both fuels.
Another important similarity propane shares with natural gas is full-fuel cycle efficiency. Overall losses for natural gas extraction, processing, transmission and delivery processes are approximately 10% while similar losses for propane are approximately 11% when transportation, storage and distribution losses are included.
While this report may refer to natural gas in previous case studies and analyses, it should be noted that the use of propane in these examples should result in very similar conclusions regarding real energy efficiency and environmental impacts.
5

6
2 NOTE TO READERS
Energy Policy Act of 2005 -- Much of the analyses in this report were performed prior to the July 2005 passage of the Energy Policy Act of 2005. In selected instances, these calculations and examples used provisions that changed slightly from the legislation as it was originally proposed. In particular, this report includes analyses of the home energy efficiency tax credits, the final version of which is different from the provisions assumed in the calculations shown in this report in the following ways:
• A tax credit of $2,000 is available for either site-built or manufactured homes that achieve a 50% reduction in annual heating and cooling costs relative to a reference home with 1/5 of reduction coming from envelope improvements.
• A tax credit of $1,000 is available for manufactured homes that achieve a 30% reduction in annual heating and cooling costs relative to a reference home with 1/3 of reduction coming from envelope improvements.
• The reference home must meet the requirements of the International Energy Conservation Code (IECC) 2003, while the calculations in this report use IECC 2000 as the baseline.
A review of the changes in those provisions concludes that the overall findings of this report, based on those credits as proposed during the development of the energy bill, would not significantly change based on the provisions in the final legislation.

2 FEDERAL ENERGY EFFICIENCY POLICIES, PROGRAMS AND STANDARDS
As discussed in Section 1, national energy policies and programs have historically used site energy consumption as the metric for evaluating the energy efficiency. Several current and proposed initiatives utilize energy cost as the metric, often under the assumption that it is a suitable proxy for real energy usage. This section follows up on these key issues by addressing the following topics:
• Comparative advantages of site and real energy based measurement systems
• Comparative analysis of energy efficiency metrics
• Suitability of energy cost as a proxy for real energy efficiency
• Energy programs that might benefit by switching to a real energy efficiency metric
2.1 Comparative Advantages of Site Energy, Real Energy and Energy Cost Based Measurement Systems
2.1.1 Introduction
The U.S. Department of Energy (DOE) has long recognized that energy consumption at the point of use is not equivalent to “source” energy use, and, consequently, reductions at the point of use do not necessarily lead to proportional reductions in actual natural resource usage or environmentally harmful emissions. DOE, however, along with many other entities in the federal government has historically preferred to focus on point of usage energy consumption because, prior to widespread computer use, they found it an easier calculation (Table 2.1).
In the intervening years, however, much research has been performed to ascertain appropriate real energy values for all commonly used feedstocks, and calculating full fuel energy use for all of our natural resources is simple and straightforward.
According to data posted on the EIA website (http://www.eia.doe.gov):
• Gas delivers over twice the amount of equivalent energy to consumers as does electricity
• The overall efficiency of gas is over 2.6 times that of electricity
• The direct use of gas is accomplished with far fewer environmental impacts and less than 22% of the expenses ($47 billion versus $218 billion) attributable to electricity
Despite these attributes, the direct use of gas has been stagnant in the residential and commercial sectors since the mid ‘70’s while electrical usage has increased substantially. One reason for this is that federal energy efficiency policies are based upon improving energy efficiency as measured at the point of usage rather than considering the full fuel cycle of energy and natural resources. Current energy policy focuses on the importance of natural gas as a fuel for generating electricity. However, in most cases, this is neither the most efficient nor environmentally benign use of natural gas. (AGCC 2001)
7
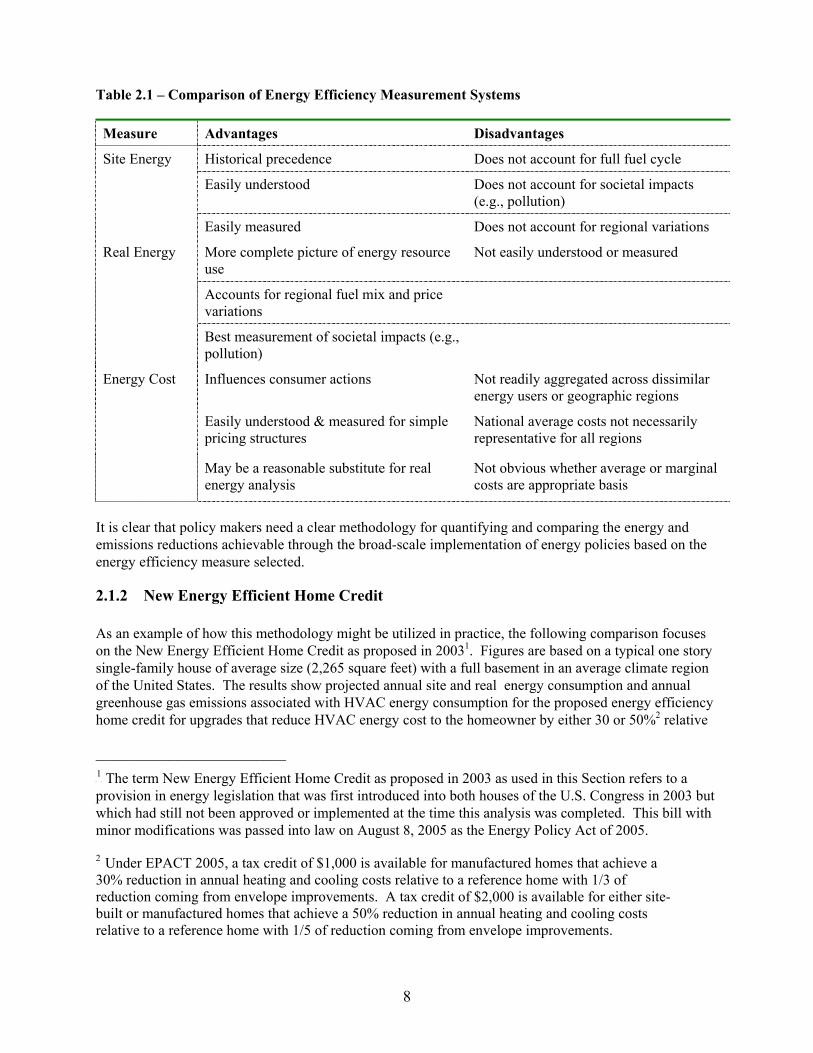
Table 2.1 – Comparison of Energy Efficiency Measurement Systems
Measure Advantages Disadvantages
Historical precedence Does not account for full fuel cycle
Easily understood Does not account for societal impacts (e.g., pollution)
Site Energy
Easily measured Does not account for regional variations
More complete picture of energy resource use
Not easily understood or measured
Accounts for regional fuel mix and price variations
Real Energy
Best measurement of societal impacts (e.g., pollution)
Influences consumer actions Not readily aggregated across dissimilar energy users or geographic regions
Easily understood & measured for simple pricing structures
National average costs not necessarily representative for all regions
Energy Cost
May be a reasonable substitute for real energy analysis
Not obvious whether average or marginal costs are appropriate basis
It is clear that policy makers need a clear methodology for quantifying and comparing the energy and emissions reductions achievable through the broad-scale implementation of energy policies based on the energy efficiency measure selected.
2.1.2 New Energy Efficient Home Credit
As an example of how this methodology might be utilized in practice, the following comparison focuses on the New Energy Efficient Home Credit as proposed in 20031. Figures are based on a typical one story single-family house of average size (2,265 square feet) with a full basement in an average climate region of the United States. The results show projected annual site and real energy consumption and annual greenhouse gas emissions associated with HVAC energy consumption for the proposed energy efficiency home credit for upgrades that reduce HVAC energy cost to the homeowner by either 30 or 50%2 relative
__________________________
P
1P The term New Energy Efficient Home Credit as proposed in 2003 as used in this Section refers to a
provision in energy legislation that was first introduced into both houses of the U.S. Congress in 2003 but which had still not been approved or implemented at the time this analysis was completed. This bill with minor modifications was passed into law on August 8, 2005 as the Energy Policy Act of 2005.
2 Under EPACT 2005, a tax credit of $1,000 is available for manufactured homes that achieve a 30% reduction in annual heating and cooling costs relative to a reference home with 1/3 of reduction coming from envelope improvements. A tax credit of $2,000 is available for either site-built or manufactured homes that achieve a 50% reduction in annual heating and cooling costs relative to a reference home with 1/5 of reduction coming from envelope improvements.
8
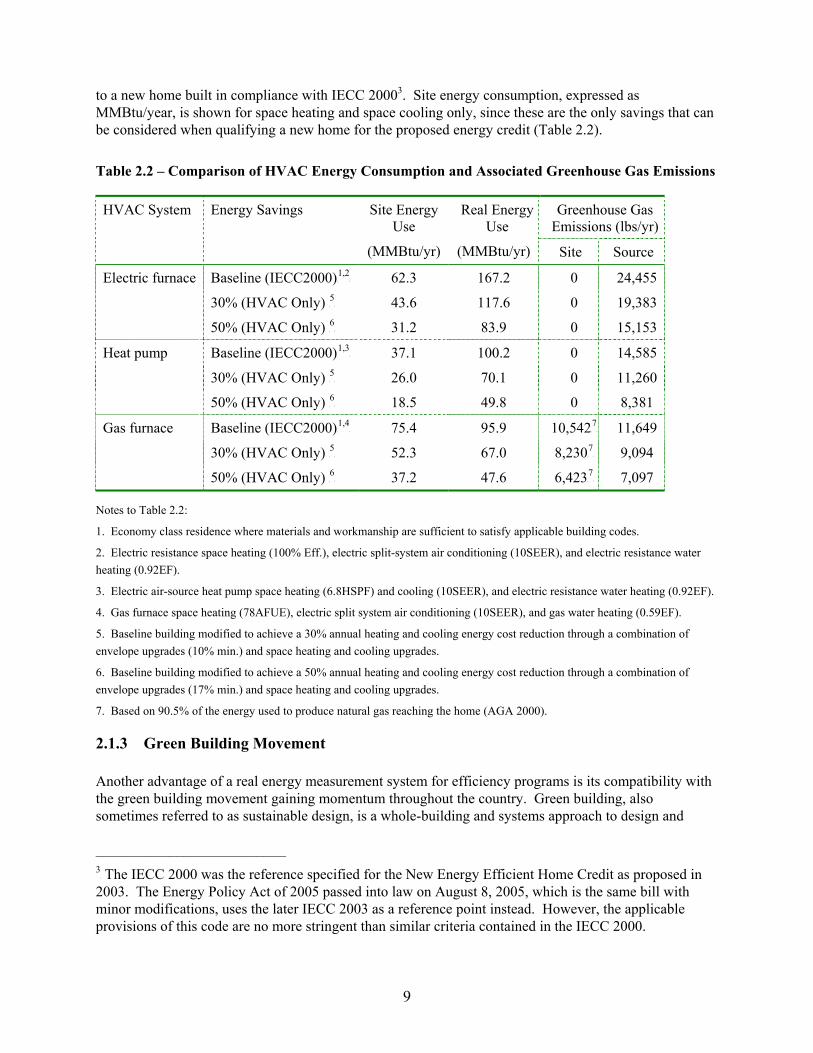
to a new home built in compliance with IECC 20003. Site energy consumption, expressed as MMBtu/year, is shown for space heating and space cooling only, since these are the only savings that can be considered when qualifying a new home for the proposed energy credit (Table 2.2).
Table 2.2 – Comparison of HVAC Energy Consumption and Associated Greenhouse Gas Emissions
Greenhouse Gas Emissions (lbs/yr)
HVAC System Energy Savings Site Energy Use
(MMBtu/yr)
Real Energy Use
(MMBtu/yr) Site Source
Electric furnace Baseline (IECC2000)P
1,2P 62.3 167.2 0 24,455
30% (HVAC Only) P
5P 43.6 117.6 0 19,383
50% (HVAC Only) P
6P 31.2 83.9 0 15,153
Heat pump Baseline (IECC2000)P
1,3P 37.1 100.2 0 14,585
30% (HVAC Only) P
5P 26.0 70.1 0 11,260
50% (HVAC Only) P
6P 18.5 49.8 0 8,381
Gas furnace Baseline (IECC2000)P
1,4P 75.4 95.9 10,542P
7P 11,649
30% (HVAC Only) P
5P 52.3 67.0 8,230P
7P 9,094
50% (HVAC Only) P
6P 37.2 47.6 6,423P
7P 7,097
Notes to Table 2.2:
1. Economy class residence where materials and workmanship are sufficient to satisfy applicable building codes.
2. Electric resistance space heating (100% Eff.), electric split-system air conditioning (10SEER), and electric resistance water heating (0.92EF).
3. Electric air-source heat pump space heating (6.8HSPF) and cooling (10SEER), and electric resistance water heating (0.92EF).
4. Gas furnace space heating (78AFUE), electric split system air conditioning (10SEER), and gas water heating (0.59EF).
5. Baseline building modified to achieve a 30% annual heating and cooling energy cost reduction through a combination of envelope upgrades (10% min.) and space heating and cooling upgrades.
6. Baseline building modified to achieve a 50% annual heating and cooling energy cost reduction through a combination of envelope upgrades (17% min.) and space heating and cooling upgrades.
7. Based on 90.5% of the energy used to produce natural gas reaching the home (AGA 2000).
2.1.3 Green Building Movement
Another advantage of a real energy measurement system for efficiency programs is its compatibility with the green building movement gaining momentum throughout the country. Green building, also sometimes referred to as sustainable design, is a whole-building and systems approach to design and
__________________________ 3
2 The IECC 2000 was the reference specified for the New Energy Efficient Home Credit as proposed in 2003. The Energy Policy Act of 2005 passed into law on August 8, 2005, which is the same bill with minor modifications, uses the later IECC 2003 as a reference point instead. However, the applicable provisions of this code are no more stringent than similar criteria contained in the IECC 2000.
9

construction that employs building techniques that minimize environmental impacts and reduce the energy consumption of buildings while contributing to the health and productivity of its occupants. This includes such issues as building siting, materials selection, energy efficiency, water conservation and waste water control, construction waste management, indoor air quality and ozone depletion.
Green building is gaining wider acceptance as cities and states, including Michigan, Washington and Arizona, adopt the guidelines designed to produce buildings that are more energy efficient and environmentally sensitive. These states and cities now require or encourage government-financed construction to follow the Leadership in Energy and Environmental Design (LEED) program, a set of building guidelines administered by the nonprofit U.S. Green Building Council. The federal government's General Services Administration, landlord to most federal agencies, also applies the program to its new buildings. Since LEED was launched in 2000, more than 200 buildings have been certified and 1,800 more have signed up. Guidelines are created though negotiations among interest groups, including real-estate companies, architects, environmental activists, material manufacturers and the government. (WSJ 2005)
2.2 Advantages/Disadvantages of Energy Cost as a Proxy for Real Energy Efficiency
2.2.1 Introduction
In recent years, both DOE and ASHRAE have been using energy cost as a proxy for real energy. It seems that this may be appropriate when evaluating national level policy initiatives using national average fuel costs over an annual time frame. However, it is not certain whether this relationship will hold true over a prolonged period of time given the uncertainties of power deregulation, new power generation mixes and transportation capacity constraints. In addition, special regional rate structures employed by many utilities (e.g., high fixed costs, declining block and price caps) can further skew the energy cost – real energy equilibrium.) While these factors vary greatly based on season/time of day, most electric utilities do not have pricing structures that reflect these variations.
Higher fixed charges with lower usage (unit) charges have been advanced recently by several utilities. This rate design is attractive to utilities because it creates a larger assured revenue stream and reduces the risk of lower revenues when lower usage occurs for whatever reason. The downside is twofold: the design fails to reflect the long-term marginal costs of providing the product, and it removes the price signal to customers to consume electricity and gas efficiently. Moreover, it raises bills for low-volume consumers (i.e., those who consume less than the average) and lowers bills for high-usage customers, including those with high air conditioning usage, who are helping to drive high-cost system peaks. A utility’s interest in avoiding risks of revenue loss due to greater use of efficiency is much better addressed through revenue/sales decoupling. (RAP 2005)
In 2005, Green Mountain Power (GMP) proposed rates for commercial and industrial customers that provided incentives particularly to reduce peak-demand through a capacity charge. With these rates GMP was focusing more on incentives to lower peak demand rather than lowering overall consumption of energy. The rates included a demand charge for both on-peak and off-peak periods, which has the effect of creating lower incentives for lowering on-peak demand than a rate that would have a higher on-peak demand charge and no off-peak demand charge. Furthermore, the on-peak energy charge proposed has a declining block structure, i.e. energy charges are lower for all KWh consumed in excess of a certain threshold. Declining block rates in general create an incentive for increased rather than decreased energy use. It is possible that GMP’s objective with the decreasing block rate was to encourage customers to develop a flatter load profile. (CLF 2004)
10

Between the summers of 1999 and 2000, ratepayers in the service territory of San Diego Gas and Electric (SDG&E) were subject to substantial retail rate fluctuation. Electricity customers were billed at a rate based upon the average wholesale cost of power for the month in which they consumed it. Weekly wholesale price averages increased more than four-fold during this time span, leading to a doubling of most customers’ rates. When rates doubled in 2000, consumers appear to have reacted more to recent past bills than to current price information. By summer’s end, consumption fell 6% while lagging price increases. Around September 1, 2000, state legislators responded to mounting public pressure over these rate increases. They mandated a retail rate freeze that was retroactive to June of 2000. However, even months after the utility restored low historic rates customers continued curtailing demand. (Bushnell 2004)
2.2.2 Comparative Analysis of Site Energy, Real Energy and Energy Cost
An analysis performed under contract to the American Gas Association (AGA) in June 2003 quantified the impact of the l New Energy Efficient Home Credit as proposed in 2003 on energy costs, site energy consumption, real energy consumption and greenhouse gas emissions for typical new housing construction throughout the United States. This Credit stipulated that energy consumption reductions must be fuel neutral, i.e., a qualifying home with electric space heating must be compared to a baseline home that is also heated electrically.
Table 2.3 – Comparative Analysis of Energy Cost, Site Energy Consumption and Real Energy Consumption
Energy Cost Site Energy Real Energy HVAC System Energy Savings
($/yr) (% svgs) (MMBtu/yr) (% svgs) (MMBtu/yr) (% svgs)
Electric furnace Base (IECC2000) 1668 --- 62.3 --- 167.2 ---
30% (HVAC only) 1167 30 43.6 30 117.6 30
50% (HVAC only) 835 50 31.2 50 83.9 50
Heat pump Base (IECC2000) 989 --- 37.1 --- 100.2 ---
30% (HVAC only) 692 30 26.0 30 70.1 30
50% (HVAC only) 494 50 18.5 30 49.8 50
Gas furnace Base (IECC2000) 1013 --- 75.4 --- 95.9 ---
30% (HVAC only) 709 30 52.3 31 67.0 30
50% (HVAC only) 507 50 37.2 51 47.6 50
Note: Figures are based on a typical one story single-family house of average size (2,265 square feet) with a full basement in an average climate region of the United States.
For a typical one story single-family house with electric resistance furnace or air-source heat pump space heating system, the percentage reduction in annual energy cost is roughly equivalent to the percentage reduction in site-and real energy consumption. However, for homes with natural gas-fired space heating systems, the reduction in site energy consumption is about 1% more than the associated annual real energy consumption reduction or energy cost savings (Table 2.3).
11

2.2.3 Impact of Location on Energy Cost – Real Energy Efficiency Equilibrium
The impact of geographic location on the energy cost – real energy equilibrium became apparent during this analysis. To better understand the impact of measuring energy conservation as a reduction in annual energy costs rather than as a reduction in energy consumption we first ascertained what mix of HVAC only upgrades and combination envelope and HVAC upgrades would be required to achieve a 30% reduction in annual site energy consumption (MMBtu/yr). In addition to site energy consumption reduction, real energy consumption and energy cost reductions were also computed.
The simulation models were generated using the REM/Rate (v11.0) software package available from Architectural Energy Corporation. This software meets the procedures and methods for calculating energy and cost savings in regulations specified in the New Energy Efficient Home Credit. The base building used in the model was a typical one-story single-family detached residence with a full basement constructed to meet the IECC 2000 energy code. The requirements for insulation and fenestration standards are differentiated in the code based on climatic region. To capture this variation in the analysis, energy consumption was simulated in each of the ten DOE climate regions in the United States. Within each region, at least one city was selected that represents the largest housing market in that part of the country. In order to determine the heating and cooling energy consumption and cost, climate information was input for each location analyzed. A library of weather data for all major U.S. cities is included in REM/Rate. Annual energy costs for each location analyzed were obtained from EIA. Costs for both electricity and natural gas are average statewide costs for the most recent year for which data was available at the time the analysis was performed.
Results were computed for three space heating systems, electric resistance furnace, electric air source heat pump, and natural gas furnace. The electric resistance furnace and natural gas furnace were both coupled with an electric split-system air conditioner, while the air-source heat pump was equipped with an electric resistance auxiliary heater. The aggregated results for the ten cities are summarized in Table 2.4.
Table 2.4 – Ratio of Energy Cost Reduction to Site- or Source-Energy Consumption Reduction
System Type Upgrade Cost/Energy Ratio
Min. Med. Max.
Electric Furnace 30% HVAC 1.00 1.00 1.00
10% Env./20% HVAC 1.00 1.99 1.00
Heat Pump 30% HVAC 0.90 1.00 1.00
10% Env./20% HVAC 1.00 1.00 1.00
NG Furnace 30% HVAC 0.89 0.96 1.08
10% Env./20% HVAC 0.77 0.90 1.11
The results suggest that energy costs are an excellent proxy for site or real energy for homes with simple electrical loads (i.e., electric resistance space heating/DX cooling), regardless of location. However, the energy cost /energy consumption relationship became somewhat marginal with more complex electrical loads (i.e., air-source heat pump) and natural gas space heating. Although, on average, there was parity between energy cost reductions and both site- and source-energy consumption reduction, energy cost
12

reductions underestimated energy consumption reductions by as much as 10% in some locations while overstating energy consumption reductions by as much as 11% in others.
These results point to three problems with the use of energy costs as a proxy for both site and real energy. First, the ability of energy cost reductions to reflect associated energy consumption reductions can be influenced by the type of space heating and cooling systems under consideration – and is far from fuel neutral - reveals a flaw in the overall approach. Second, the fact that some areas of the U. S. may have advantages for natural gas and others advantages for electricity reveals a flaw in the overall approach - regional discrimination between fuels. Third, and potentially the largest issue, a policy based on energy cost reduction would have more value in some areas of the country than others suggests that the energy credit would be more beneficial for some constituents than others.
2.2.4 Impact of Rate Structure on Energy Cost – Real Energy Efficiency Equilibrium
While a DOE study (RAND 1999) suggests that energy cost is a reasonable proxy for real energy, it must be remembered that they are evaluating average annual energy costs while energy policy initiatives often target peaking or seasonal loads such as space cooling. Using average energy costs in these instances reflects neither the true financial cost of operating such equipment or, by extension, the types of power plants and fuels used to generate the electricity.
An example of the impact of energy cost structures on the energy cost – real energy equilibrium was revealed in an analysis conducted by GARD Analytics for the American Gas Cooling Center. The Resource Energy Efficiency and Emissions Model (REEEM) containing monthly data for electric power plants owned by the 52 largest U.S. utilities and used a total fuel cycle analysis to evaluate the seasonal marginal energy efficiency and emissions per unit of delivered electricity by generating plant class for a given utility. The conclusion from that analysis was that the marginal energy efficiency and emissions varied greatly by application depending on the time of year and time of day during which most energy was consumed.
For example, for space cooling electricity, all of the utilities had resource energy efficiencies lower than the commonly used value of 33% and CO2 emissions higher than the U.S. national average. For NOX and SO2 emissions, some were higher and some were lower, again illustrating how important it is to calculate the seasonal marginal values for specific end uses rather than using national annual averages or traditional rules of thumb. Small seasonal variations in efficiency are typical of most utilities in the database. Base and intermediate plants operate with similar efficiency throughout the year. Peak units vary more, but they generate only a small amount of power, so their impact is small. Emission factors show more seasonal variation due to changes in fuel mix, such as switching between gas and fuel oil. (AGCC 1994)
2.3 Candidate Policies, Programs and Standards Benefiting from Real Energy Efficiency Evaluation
While some of the current or proposed federal statutory and voluntary energy efficiency programs and policies already use real energy for evaluating compliance with energy efficiency reductions, others either use site energy or energy costs for compliance evaluation. Federal energy efficiency policies and programs affecting non-residential buildings, residential buildings, appliances and vehicles which use either site energy or energy costs for evaluating compliance, are summarized on the pages that follow.
13

2.3.1 Federal Energy Efficiency Policies
A comprehensive listing of federal energy efficiency policies are summarized in Appendix A. The greatest impact from switching to a real energy criteria are those policies which currently use site energy as the criteria by which energy efficiency is determined since energy cost is a reasonable proxy for real energy for some applications and/or some regions of the country. The policies that meet that criterion are summarized in Table 2.5. They include the Energy Policy and Conservation Act of 1975, the National Appliance Energy Conservation Act of 1987 (NAECA), Executive Order 12003, the National Highway Traffic Safety Administration (NHTSA), and the Energy Policy Act of 2005 (EPACT 2005). Each of these programs is discussed in more detail below.
2.3.1.1 Energy Policy and Conservation Act of 1975
Appliances
The Energy Policy and Conservation Act (EPCA) prescribes energy conservation standards for certain major household appliances, and requires the DOE to administer an energy conservation program for these products. These standards, referred to in the aggregate as the Energy Conservation Program for Consumer Products (10 CFR 430), establishes regulations for the implementation, including the development of test procedures and the establishment of minimum efficiency standards for residential appliances and commercial equipment. The program defines energy use as follows:
The term ''energy use'' means the quantity of energy directly consumed by a consumer product at point of use, determined in accordance with test procedures under Section 6293 of this title. (42 USC 6291 (4))
Table 2.5 – Federal Energy Efficiency Policies
Title of Legislation/Policy Application Criteria
Energy Policy and Conservation Act of 1975 Non-residential buildings, appliances and light-duty vehicles
Site energy where specified
Executive Order 12003 (1977) Federal buildings and light-duty vehicles Site energy
National Appliance Energy Conservation Act of 1987 (NAECA)
Appliances Site energy
Energy Policy Act of 1992 Residential and non-residential buildings, appliances and light duty vehicles
Site energy
Executive Order 13123 (1999) Federal buildings Site/real energy
National Highway Traffic Safety Administration (NHTSA) Rulemaking (2003)
Light-duty vehicles Site energy
Energy Policy Act of 2005 (EPACT 2005) Residential and non-residential buildings and appliances
Site energy & energy cost
14

Vehicles
The Energy Policy and Conservation Act of 1975 established Corporate Average Fuel Economy (CAFE) standards for passenger cars and light trucks. The stated near-term goal was to double new car fuel economy by model year 1985. Passenger cars and light trucks with a gross vehicle weight rating (GVWR) of 8,500 lbs. or less manufactured for sale in the United States must meet these standards. The CAFE standards are applied on a fleet-wide basis for each manufacturer. As of May 2003, the fuel economy ratings for a manufacturer's entire line of passenger cars must average at least 27.5 mpg for the manufacturer to comply with the standard. For light trucks (including vans and sport utility vehicles), which make up the majority of new vehicles sales, the standard is 20.7 mpg. Manufacturers earn "credits" for exceeding CAFE standards, and these credits can be used to offset fuel economy shortfalls in the three previous and/or three subsequent model years. The CAFE standards are effectively a site-base energy policy as only the efficiency of the onboard power plant is directly addressed.
CAFE has special standards for alternative and dual fuel vehicles. These will increase the manufacturer's rating which make hybrids a good deal for everyone because it offsets those low-economy, high-profit trucks and SUVs. Alternative fuel vehicles use something other than gasoline or diesel, which includes natural gas, hydrogen, propane, ethanol, bio-diesel etc. The CAFE standard for these is determined by dividing the fuel economy in equivalent miles per gallon of fuel (gasoline or diesel) by 0.15. Thus a 15 mpg alternative fuel vehicle would be rated as 100 mpg. Dual-fuel vehicles use the alternative fuel and/or gasoline or diesel interchangeably. The rating for those is the average of the fuel economy on gasoline or diesel and the fuel economy on the alternative fuel vehicle divided by 0.15. For example, this calculation procedure turns a dual fuel vehicle that averages 25 mpg on gasoline or diesel with the above 100 mpg alternative fuel to attain the 40 mpg value for CAFE purposes. For 1993-2004, the maximum CAFE increase for dual fuel vehicles in a manufacturer’s passenger car or light truck fleet is 1.2 mpg.
2.3.1.2 Executive Order 12003
This executive order relating to energy policy and conservation, issued in 1977, promulgated rules which increased the minimum statutory requirement for fleet average fuel economy for fiscal year 1978 by 2 miles per gallon, for fiscal year 1979 by 3 miles per gallon, and for fiscal years 1980 and after by 4 miles per gallon.
2.3.1.3 National Appliance Energy Conservation Act of 1987 (NAECA)
During the 1970’s and 1980’s state appliance efficiency standards were introduced in a number of states beginning with California and followed by Florida, New York, Connecticut, and Massachusetts. Manufacturers serve a national market, and variation in state regulations complicates product planning and marketing. By 1986, the proliferation of varying state standards convinced appliance manufacturers to seek uniform national standards. Manufacturers and energy efficiency advocates then directly negotiated what became NAECA. NAECA was adopted by the U.S. Congress with virtually no opposition and was signed into law by President Reagan in 1987. The standards established minimum energy efficiency requirements for twelve types of residential appliances sold in the United States. NAECA also contains requirements and deadlines for updating the initial standards through rulemakings conducted by DOE using criteria included in the law.
The first significant national appliance standards, for refrigerators, freezers, water heaters and room air conditioners, took effect under NAECA in 1990 and were updated effective 1993. The minimum requirements for water heaters are given in energy factors, which is a delivered efficiency figure defined by the DOE test procedure Uniform Test Method for Measuring the Energy Consumption of Water
15

Heaters (Table 2.6). It is calculated from data taken for a specific pattern of hot water use during a 24-hour hot water usage test. The higher the energy factor, the lower the energy consumption. Energy factor is not the same as water heating efficiency; it is defined only for the specific set of conditions in the test procedure. The actual efficiency of a water heater varies greatly with the amount of hot water used, inlet water temperature, hot water delivery temperature, and other operating conditions. For commercially available storage water heaters, the energy factor is generally higher for units with smaller tanks, however it varies substantially depending on design and construction details. For typical electric storage water heaters, energy factors range from 0.77 to 0.95, with a typical value of about 0.86. For gas storage water heaters, energy factors range from 0.43 to 0.86, with 0.54 a typical value. For gas units, recovery efficiency ranges from 75% to 94%. Electric units have recovery efficiencies of essentially 100%.
Table 2.6 – NAECA Water Heater Minimum Requirements
Product class Energy factor as of January 1, 1990
Energy factor as of April 15, 1991
Energy factor as of January 20, 2004
Gas-fired Water Heater
0.62 x (.0019 × Rated Storage Volume in
gallons).
0.62 x (.0019 × Rated Storage Volume in
gallons).
0.67 x (0.0019 × Rated Storage Volume in
gallons).
Oil-fired Water Heater
0.59 x (.0019 × Rated Storage Volume in
gallons).
0.59 x (.0019 × rated Storage Volume in
gallons).
0.59 x (0.0019 × Rated Storage Volume in
gallons).
Electric Water Heater
0.95 x (0.00132 × Rated Storage Volume in
gallons).
0.93 x (0.00132 × Rated Storage Volume in
gallons).
0.97 x (0.00132 × Rated Storage Volume in
gallons).
Tabletop Water Heater
0.95 x (0.00132 × Rated Storage Volume in
gallons).
0.93 x (0.00132 × Rated Storage Volume in
gallons).
0.93 x (0.00132 × Rated Storage Volume in
gallons).
Instantaneous Gas-fire Water Heater
0.62 x (0.0019 × Rated Storage Volume in
gallons).
0.62 x (0.0019 × Rated Storage Volume in
gallons).
0.62 x (0.0019 × Rated Storage Volume in
gallons).
Instantaneous Electric Water Heater
0.95 x (0.00132 × Rated Storage Volume in
gallons).
0.93 x (0.00132 × Rated Storage Volume in
gallons).
0.93 x (0.00132 × Rated Storage Volume in
gallons).
Table 2.7 lists minimum energy factors set by NAECA for various system types and tank volumes. Also included are the maximum values in each category for all models listed in the October 1997 edition of the GAMA directory. Heat pump water heaters are much more efficient than both gas-fired and electric resistance water heaters. Values of EF for various residential HPWH models range from 2.0 to 2.5. Because energy factors defined under the DOE test procedure consider tank heat loss, they are substantially lower than energy factors defined by the 1983 GAMA procedure, which did not consider tank loss.
Residential furnaces include models with energy input less than 225,000 Btu/h, and that use a single-phase electric supply. Minimum efficiency levels were established by NAECA effective 1992. The energy-efficiency metric for residential models is Annual Fuel Utilization Efficiency (AFUE) with a minimum requirement of 78 AFUE specified.
16

Table 2.7 – Water Heater NAECA Minimum and Best Available Energy Factors
Electric Resistance Gas and LP Oil Nominal Volume (gal) Min Max Min Max Min Max
20 0.904 0.94 0.582 0.61 0.552 na
30 0.890 0.95 0.563 0.63 0.533 0.62
40 0.877 0.95 0.544 0.70 P
aP 0.514 na
50 0.864 0.95 0.525 0.86 P
bP 0.495 0.55
65 0.844 0.92 0.497 0.54 0.467 na
80 0.824 0.94 0.468 na 0.438 na
100 0.798 0.94 0.430 0.48 0.400 na
120 0.772 0.86 0.392 na 0.362 na
a. Discontinued model; highest current model is 0.66. b. Typical values are much lower.
Residential boilers include models with energy input less than 300,000 Btu/h, and that use a single-phase electric supply. Minimum efficiency levels were established by NAECA effective 1992. The energy-efficiency metric for residential models is AFUE with a minimum requirement of 80 AFUE specified.
2.3.1.4 Energy Policy Act of 1992
Residential Buildings
The Energy Policy Act of 1992 (EPACT 1992) required the creation of voluntary guidelines that may be used by State and local governments, utilities, builders, real estate agents, lenders, agencies in mortgage markets, and others, to enable and encourage the assignment of energy efficiency ratings to residential buildings.
Non-residential Buildings
Required each State to certify within two years of enactment that it has reviewed and updated the provisions of its commercial building code regarding energy efficiency within two years. Certification was required to include a demonstration that the State's code provisions meet or exceed the requirements of ASHRAE Standard 90.1-1989. Whenever the provisions of ASHRAE Standard 90.1-1989 (or any successor standard) regarding energy efficiency in commercial buildings are revised, the Secretary of Energy is required to determine whether such a revision will improve energy efficiency in commercial buildings. If the Secretary makes an affirmative determination each State has two years to certify that it has reviewed and updated the provisions of its commercial building code regarding energy efficiency in accordance with the revised standard for which the determination was made. Following the release of ASHRAE Standard 90.1-1999 the Secretary determined that the standard would improve energy efficiency. However, following the release of ASHRAE Standard 90.1-2001 the Secretary determined that the standard would not produce meaningful energy savings. The latest revision, ASHRAE Standard 90.1-2004, is currently under review by DOE.
17
EPAct does not specify the basis on which improvements in energy efficiency are to be determined. After its review of ASHRAE Standard 90.1-1999 the Secretary made the following affirmative determination published in The Federal Register on July 15, 2002:
Our quantitative analysis shows, nationally, new building efficiency should improve by about six percent, looking at real energy, and by about four percent, when considering site energy.
This is certainly not conclusive evidence that EPACT 1992 is a source-based policy. Rather it is evidence that the revised standard had less stringent envelope insulation requirements than the predecessor standard (ASHRAE Standard 90.1-1989) resulting in increased space heating energy requirements. Since natural gas is the most prevalent fuel used for commercial space heating, natural gas consumption did not decrease at the same rate as electric energy consumption. This accounts for a real energy reduction greater than site energy. A GRI analysis actually indicated that natural gas consumption would increase as a result of the adoption of ASHRAE Standard 90.1-1999 by the States. (GRI 2000)
It is anticipated that the latest revision, ASHRAE Standard 90.1-2004 will show both site and real energy savings, primarily as a result of greater stringency in building lighting requirements.
EPACT 1992 further requires each federal agency to apply energy conservation measures to, and improve the design for the construction of, its federal buildings so that the energy consumption per gross square foot of its federal buildings in use during the fiscal year 1995 is at least 10% less than the energy consumption per gross square foot of its federal buildings in use during the fiscal year 1985 and so that the energy consumption per gross square foot of its federal buildings in use during the fiscal year 2000 is at least 20% less than the energy consumption per gross square foot of its federal buildings in use during fiscal year 1985.
Appliances
EPACT 1992 established efficiency requirements that corresponded to the levels in ASHRAE Standard 90.1 as in effect on October 24, 1992.
Non-residential water heaters include models with energy input equal to or greater than 225,000 Btu/h. The energy-efficiency metrics for commercial models include thermal efficiency and standby loss. Thermal efficiency measures the amount of heat transferred to the water. Standby loss reflects the ability of the storage tank to keep the energy in the heated water during periods of non-use. Minimum criteria established by the legislation include the following:
• Gas storage and instantaneous: 80% thermal efficiency Q/800 + 110(V) ½ Btu/h standby loss
• Electric storage: 0.3+27/v% per hour standby loss
• Oil storage: 78% thermal efficiency; Q/800 + 110 (V) ½ Btu/h standby loss
• Oil instantaneous: 80% thermal efficiency
Non-residential heat pumps include models with heating and/or cooling output capacities equal to or greater than 65,000 Btu/h and that use a single-phase electric supply, and all models that require a three-phase electric supply. The energy efficiency metrics for non-residential models are Energy Efficiency Ratio (EER) for the cooling mode and Coefficient of Performance (COP) for the heating mode. Minimum efficiency levels for this equipment established by EPACT 1992 are:
18
Cooling Mode
• Unitary/applied heat pump, air-cooled, 65 to 135 kBtu/h: 8.90 EER
• Unitary/applied heat pump, air-cooled, 135 to 240 kBtu/hl: 8.50 EER
• Unitary/applied heat pump, water-source, < 17 kBtu/h: 11.20 EER
• Unitary/applied heat pump, water-source, 17 to 135 kBtu/h: 12.00 EER
• Unitary/applied heat pump, water-source, 135 to 240 kBtu/h: 9.60 EER
Heating Mode
• Unitary/applied heat pump, air-cooled, 65 to 135 kBtu/h: 3.00 COP
• Unitary/applied heat pump, air-cooled, 135 to 240 kBtu/h: 2.90 COP
• Unitary/applied heat pump, water-source, <135 kBtu/h: 4.20 COP
• Unitary/applied heat pump, water-source, 135 to 240 kBtu/h: 2.90 COP
Non-residential furnaces include models with energy input equal to or greater than 225,000 Btu/h that use a single-phase electric supply, and all models that require a three-phase electric supply. The energy-efficiency metric for non-residential models is Combustion Efficiency (CE). Combustion efficiency for commercial furnaces and boilers is a basic “100% -flue loss” measurement under steady state operation. Minimum efficiency levels for this equipment established by EPACT 1992 are:
• Gas Furnace: 80% combustion efficiency
• Oil Furnace: 81% combustion efficiency
Non-residential boilers include models with energy input equal to or greater than 300,000 Btu/h that use a single-phase electric supply, and all models that require a three-phase electric supply. The energy-efficiency metric for non-residential models is Combustion Efficiency (CE). Minimum efficiency levels for this equipment established by EPACT 1992 are:
• Gas Boiler: 80% combustion efficiency
• Oil Boiler: 83% combustion efficiency
Vehicles
EPACT 1992 accelerated the use of alternative fuels in the transportation sector. Fleets that own, operate, lease or control at least 50 light-duty vehicles (8,500 lbs. or less) in the United States are covered. Of the fleet vehicles, 20 or more must be operating primarily within any affected area. The vehicles must also be centrally fueled or capable of being centrally fueled. A fleet must meet all three requirements to be “covered” by EPAct. Municipal and private fleets are currently being considered for mandates and an advance notice of proposed rulemaking (ANOPR) was issued in April of 1998.
EPACT 1992 also extended gasohol excise tax exemption to blends containing less than 10% (7.7 and 5.7%) alcohol. To encourage the use of alternatives to petroleum-based transportation fuels, set guidelines and established incentives for (1) purchasing clean-fuel vehicles for federal, state, and private fleets and (2) arranging refueling facilities for these fleets.
19

2.3.1.5 Executive Order 13123
Executive Order 13123, titled Greening the Government Through Efficient Energy Management was issued by President Clinton in 1999 superseding Executive Order 12902. It requires all agencies [of the federal government] to reduce energy consumption per gross square foot of its facilities by 30% by 2005 and 35% by 2010 relative to 1985 levels. Agencies are required to strive to reduce total energy use and associated greenhouse gas and other air emissions, as measured at the source. To that end, agencies are required to undertake life-cycle cost-effective projects in which real energy decreases, even if site energy use increases. Agencies are allowed to apply the source savings toward their energy reduction goals if site energy increases.
2.3.1.6 National Highway Traffic Safety Administration (NHTSA) Rulemaking
In April of 2003 NHTSA establishing the average fuel economy standards for light trucks that will be manufactured in the 2005-2007 model years (MYs). The standards for all light trucks manufactured is set at 21.0 mpg for MY 2005, 21.6 mpg for MY 2006, and 22.2 mpg for MY 2007. In December of 2003 NHTSA issued a Notice of Proposed Rulemaking seeking comments on possible enhancements to the CAFE program that will further the move toward more fuel efficient vehicles while maintaining vehicle safety and the well being of the motor vehicle industry. NHTSA is looking to improve the structure of the CAFE program within existing legislative authority.
2.3.1.7 National Fuel Savings and Security Act of 2002
The National Fuel Savings and Security Act (NFSSA) of 2002 prescribes more stringent average fuel economy standards for passenger automobiles and light trucks manufactured by a manufacturer in each model year beginning with MY2005 in order to achieve a combined average fuel economy standard for passenger automobiles and light trucks for MY2013 of at least 35 miles per gallon. The legislation also specifies intermediate fuel economy standards of 33.2 miles per gallon for MY2010 passenger automobiles and 26.3 miles per gallon for MY2010 light trucks.
2.3.1.8 Energy Policy Act of 2005
The Energy Policy Act of 2005 (EPACT 2005), passed into law on August 8, 2005, sets forth an energy research and development program, including: energy efficiency; renewable energy; oil and gas; coal; Indian energy; nuclear matters and security; vehicles and motor fuels, including ethanol; hydrogen; electricity; and energy tax incentives.
Residential Buildings
EPACT 2005 amends the Internal Revenue Code of 1986 to promote energy conservation through tax credits and/or deductions for the construction of energy-efficient buildings, including new single-family residences. For example, the energy act contains the following conservation and energy efficiency provision (Title XIII, Subtitle C):
• Provides a credit for the construction of new energy efficient homes (Sec. 1332)
• Provides a credit for any energy efficient building envelope component which meets the prescriptive criteria of IECC 2000 and energy efficient building property, including high efficiency HVAC and service water heating equipment (Sec. 1333) and
• Provides a credit for the purchase of qualified energy efficiency improvements for existing homes (Sec. 1335)
20
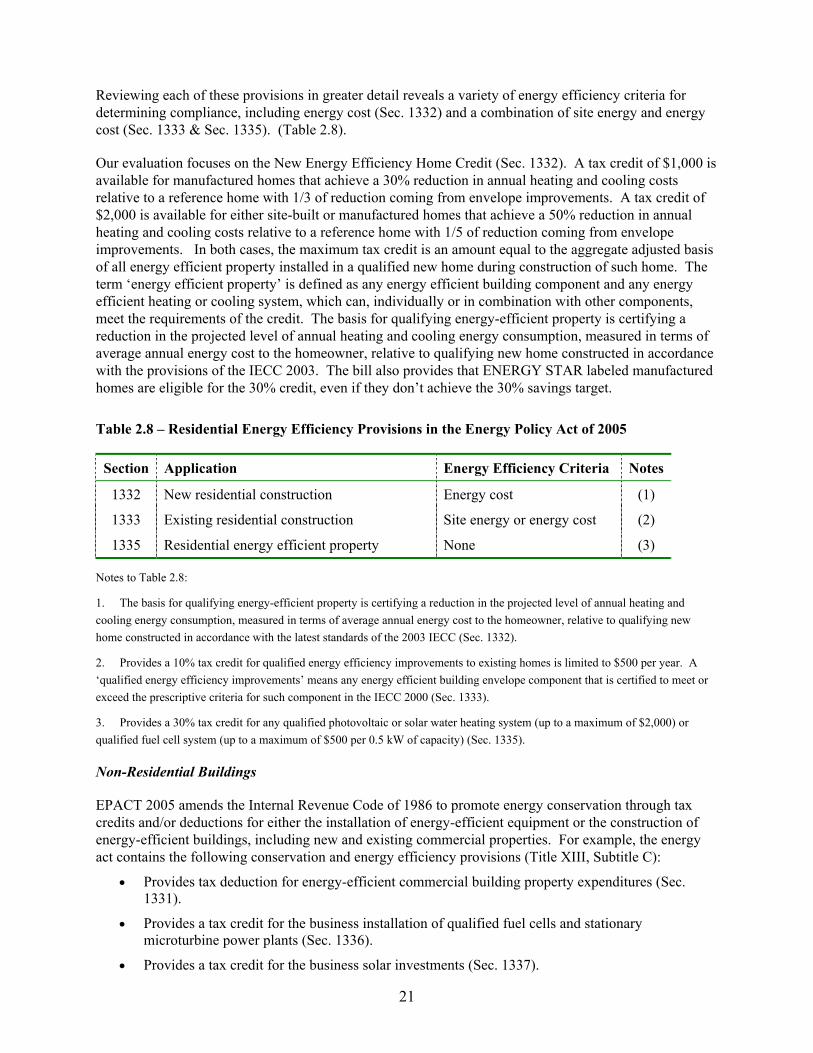
Reviewing each of these provisions in greater detail reveals a variety of energy efficiency criteria for determining compliance, including energy cost (Sec. 1332) and a combination of site energy and energy cost (Sec. 1333 & Sec. 1335). (Table 2.8).
Our evaluation focuses on the New Energy Efficiency Home Credit (Sec. 1332). A tax credit of $1,000 is available for manufactured homes that achieve a 30% reduction in annual heating and cooling costs relative to a reference home with 1/3 of reduction coming from envelope improvements. A tax credit of $2,000 is available for either site-built or manufactured homes that achieve a 50% reduction in annual heating and cooling costs relative to a reference home with 1/5 of reduction coming from envelope improvements. In both cases, the maximum tax credit is an amount equal to the aggregate adjusted basis of all energy efficient property installed in a qualified new home during construction of such home. The term ‘energy efficient property’ is defined as any energy efficient building component and any energy efficient heating or cooling system, which can, individually or in combination with other components, meet the requirements of the credit. The basis for qualifying energy-efficient property is certifying a reduction in the projected level of annual heating and cooling energy consumption, measured in terms of average annual energy cost to the homeowner, relative to qualifying new home constructed in accordance with the provisions of the IECC 2003. The bill also provides that ENERGY STAR labeled manufactured homes are eligible for the 30% credit, even if they don’t achieve the 30% savings target.
Table 2.8 – Residential Energy Efficiency Provisions in the Energy Policy Act of 2005
Section Application Energy Efficiency Criteria Notes
1332 New residential construction Energy cost (1)
1333 Existing residential construction Site energy or energy cost (2)
1335 Residential energy efficient property None (3)
Notes to Table 2.8:
1. The basis for qualifying energy-efficient property is certifying a reduction in the projected level of annual heating and cooling energy consumption, measured in terms of average annual energy cost to the homeowner, relative to qualifying new home constructed in accordance with the latest standards of the 2003 IECC (Sec. 1332).
2. Provides a 10% tax credit for qualified energy efficiency improvements to existing homes is limited to $500 per year. A ‘qualified energy efficiency improvements’ means any energy efficient building envelope component that is certified to meet or exceed the prescriptive criteria for such component in the IECC 2000 (Sec. 1333).
3. Provides a 30% tax credit for any qualified photovoltaic or solar water heating system (up to a maximum of $2,000) or qualified fuel cell system (up to a maximum of $500 per 0.5 kW of capacity) (Sec. 1335).
Non-Residential Buildings
EPACT 2005 amends the Internal Revenue Code of 1986 to promote energy conservation through tax credits and/or deductions for either the installation of energy-efficient equipment or the construction of energy-efficient buildings, including new and existing commercial properties. For example, the energy act contains the following conservation and energy efficiency provisions (Title XIII, Subtitle C):
• Provides tax deduction for energy-efficient commercial building property expenditures (Sec. 1331).
• Provides a tax credit for the business installation of qualified fuel cells and stationary microturbine power plants (Sec. 1336).
• Provides a tax credit for the business solar investments (Sec. 1337).
21

The first of these three provisions (Sec. 1331) specifies energy cost as the criteria for determining compliance. In the case of qualified fuel cells and microturbines (Sec. 1336) and solar investments (Sec. 1337), no energy efficiency criterion is specified (Table 2.9).
Table 2.9 – Non-residential Energy Efficiency Provisions in the Energy Policy Act of 2005
Section Application Energy Efficiency Criteria Notes
1331 New commercial construction Energy cost (1)
1336 Commercial fuels cells and microturbines None (2)
1337 Solar investments None (3)
Notes to Table 2.9:
1. The tax deduction for energy-efficient commercial building property expenditures is capped at $1.80 per square foot. The term ‘energy efficient property’ means any property which reduces total annual energy and power costs with respect to the lighting, heating, cooling, ventilation, and hot water systems by 50% or more in comparison to a building which meets the minimum requirements of ASHRAE Standard 90.1–2001. A partial allowance, capped at $0.60 per square foot, is available for any individual system that satisfies the energy-savings target with respect to that system. The energy efficiency criteria of the Standard are based on national average energy costs (Sec. 1331).
2. The tax credit for qualified fuel cell and microturbine power plants is set equal to $500 per 0.5 kW and $200 per kW of capacity, respectively. To qualify, power plants must have electricity-only generation efficiency greater than 30% for fuel cells and 26% for microturbines (Sec. 1336).
3. The tax credit for solar investments (Sec. 1337) is not a performance-based provision, but rather an incentive to switch to renewable energy sources.
Appliances
EPACT 2005 promotes energy conservation through tax credits and/or deductions for the installation of energy-efficient equipment, including a credit to eligible contractors for energy-efficient property installed in a qualified new energy-efficient home during construction (Sec. 1332), as well as a credit for the purchase of qualified energy efficiency improvements for existing homes (Sec. 1333). The new energy efficient home credit is an amount equal to the aggregate adjusted basis of all energy efficient property installed in a qualifying new home during construction of such a home and is discussed in detail above.
As part of the credit for certain nonbusiness energy property provision (Sec. 1333), EPACT 2005 provides tax credits for qualified energy efficient HVAC and service water heating equipment ranging from $50 to $300, including:
• Advanced main air circulating fans which have an annual electric use of no more than 2% of the total energy use of the furnace ($50)
• A qualified natural gas, propane, or oil furnace or hot water boiler which achieves an annual fuel utilization efficiency (AFUE) rate of not less than 95 ($150)
• Central air conditioners which have achieved the highest efficiency tier established by the Consortium for Energy Efficiency in effect on January 1, 2006 ($300)
• Electric heat pump water heater which yields an energy factor of at least 2.0 in the standard Department of Energy test procedure ($300)
22
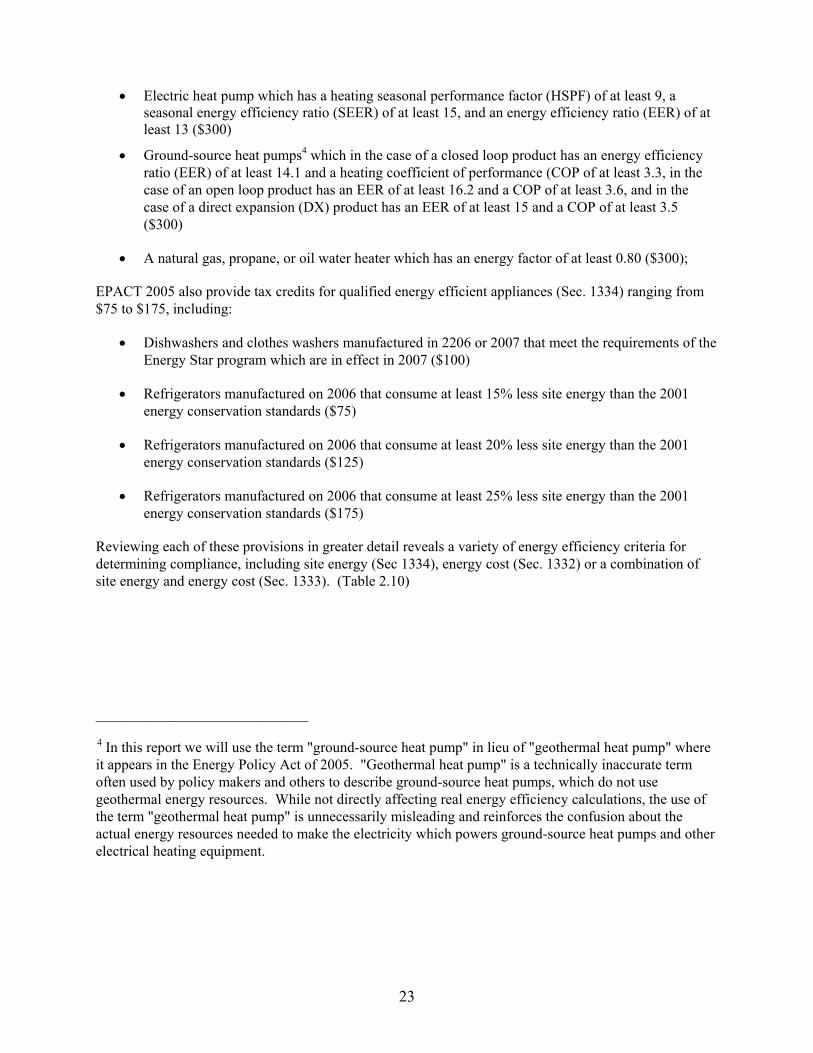
• Electric heat pump which has a heating seasonal performance factor (HSPF) of at least 9, a seasonal energy efficiency ratio (SEER) of at least 15, and an energy efficiency ratio (EER) of at least 13 ($300)
• Ground-source heat pumps4 which in the case of a closed loop product has an energy efficiency ratio (EER) of at least 14.1 and a heating coefficient of performance (COP of at least 3.3, in the case of an open loop product has an EER of at least 16.2 and a COP of at least 3.6, and in the case of a direct expansion (DX) product has an EER of at least 15 and a COP of at least 3.5 ($300)
• A natural gas, propane, or oil water heater which has an energy factor of at least 0.80 ($300);
EPACT 2005 also provide tax credits for qualified energy efficient appliances (Sec. 1334) ranging from $75 to $175, including:
• Dishwashers and clothes washers manufactured in 2206 or 2007 that meet the requirements of the Energy Star program which are in effect in 2007 ($100)
• Refrigerators manufactured on 2006 that consume at least 15% less site energy than the 2001 energy conservation standards ($75)
• Refrigerators manufactured on 2006 that consume at least 20% less site energy than the 2001 energy conservation standards ($125)
• Refrigerators manufactured on 2006 that consume at least 25% less site energy than the 2001 energy conservation standards ($175)
Reviewing each of these provisions in greater detail reveals a variety of energy efficiency criteria for determining compliance, including site energy (Sec 1334), energy cost (Sec. 1332) or a combination of site energy and energy cost (Sec. 1333). (Table 2.10)
_____________________________
P2
4 In this report we will use the term "ground-source heat pump" in lieu of "geothermal heat pump" where it appears in the Energy Policy Act of 2005. "Geothermal heat pump" is a technically inaccurate term often used by policy makers and others to describe ground-source heat pumps, which do not use geothermal energy resources. While not directly affecting real energy efficiency calculations, the use of the term "geothermal heat pump" is unnecessarily misleading and reinforces the confusion about the actual energy resources needed to make the electricity which powers ground-source heat pumps and other electrical heating equipment.
23
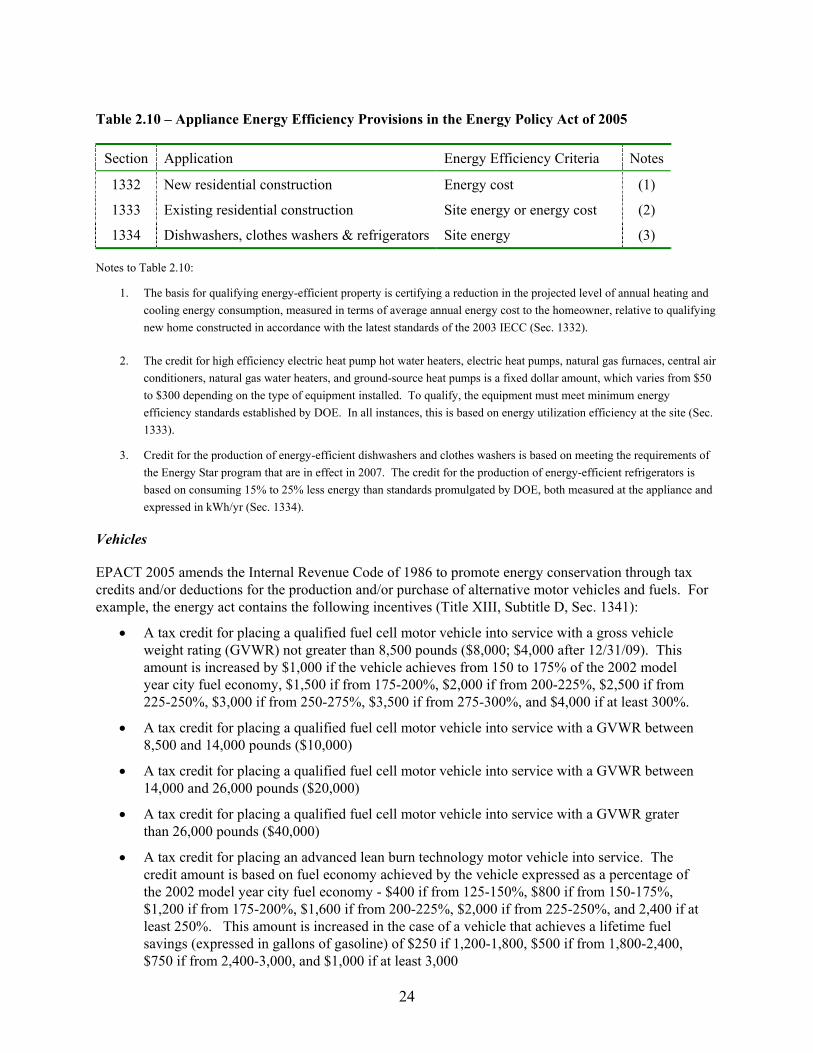
Table 2.10 – Appliance Energy Efficiency Provisions in the Energy Policy Act of 2005
Section Application Energy Efficiency Criteria Notes
1332 New residential construction Energy cost (1)
1333 Existing residential construction Site energy or energy cost (2)
1334 Dishwashers, clothes washers & refrigerators Site energy (3)
Notes to Table 2.10:
1. The basis for qualifying energy-efficient property is certifying a reduction in the projected level of annual heating and cooling energy consumption, measured in terms of average annual energy cost to the homeowner, relative to qualifying new home constructed in accordance with the latest standards of the 2003 IECC (Sec. 1332).
2. The credit for high efficiency electric heat pump hot water heaters, electric heat pumps, natural gas furnaces, central air conditioners, natural gas water heaters, and ground-source heat pumps is a fixed dollar amount, which varies from $50 to $300 depending on the type of equipment installed. To qualify, the equipment must meet minimum energy efficiency standards established by DOE. In all instances, this is based on energy utilization efficiency at the site (Sec. 1333).
3. Credit for the production of energy-efficient dishwashers and clothes washers is based on meeting the requirements of the Energy Star program that are in effect in 2007. The credit for the production of energy-efficient refrigerators is based on consuming 15% to 25% less energy than standards promulgated by DOE, both measured at the appliance and expressed in kWh/yr (Sec. 1334).
Vehicles
EPACT 2005 amends the Internal Revenue Code of 1986 to promote energy conservation through tax credits and/or deductions for the production and/or purchase of alternative motor vehicles and fuels. For example, the energy act contains the following incentives (Title XIII, Subtitle D, Sec. 1341):
• A tax credit for placing a qualified fuel cell motor vehicle into service with a gross vehicle weight rating (GVWR) not greater than 8,500 pounds ($8,000; $4,000 after 12/31/09). This amount is increased by $1,000 if the vehicle achieves from 150 to 175% of the 2002 model year city fuel economy, $1,500 if from 175-200%, $2,000 if from 200-225%, $2,500 if from 225-250%, $3,000 if from 250-275%, $3,500 if from 275-300%, and $4,000 if at least 300%.
• A tax credit for placing a qualified fuel cell motor vehicle into service with a GVWR between 8,500 and 14,000 pounds ($10,000)
• A tax credit for placing a qualified fuel cell motor vehicle into service with a GVWR between 14,000 and 26,000 pounds ($20,000)
• A tax credit for placing a qualified fuel cell motor vehicle into service with a GVWR grater than 26,000 pounds ($40,000)
• A tax credit for placing an advanced lean burn technology motor vehicle into service. The credit amount is based on fuel economy achieved by the vehicle expressed as a percentage of the 2002 model year city fuel economy - $400 if from 125-150%, $800 if from 150-175%, $1,200 if from 175-200%, $1,600 if from 200-225%, $2,000 if from 225-250%, and 2,400 if at least 250%. This amount is increased in the case of a vehicle that achieves a lifetime fuel savings (expressed in gallons of gasoline) of $250 if 1,200-1,800, $500 if from 1,800-2,400, $750 if from 2,400-3,000, and $1,000 if at least 3,000
24

• A tax credit for placing a qualified hybrid motor vehicle into service with a gross vehicle weight rating (GVWR) not greater than 8,500 pounds. The credit amount is based on fuel economy achieved by the vehicle expressed as a percentage of the 2002 model year city fuel economy - $400 if from 125-150%, $800 if from 150-175%, $1,200 if from 175-200%, $1,600 if from 200-225%, $2,000 if from 225-250%, and 2,400 if at least 250%. This amount is increased in the case of a vehicle that achieves a lifetime fuel savings (expressed in gallons of gasoline) of $250 if 1,200-1,800, $500 if from 1,800-2,400, $750 if from 2,400-3,000, and $1,000 if at least 3,000
• In the case of qualified hybrid motor vehicle to which the above provision does not apply, the amount of the tax credit will be a percentage of the qualified incremental hybrid cost of the vehicle as follows – 20% if the vehicle achieves an increase in city fuel economy relative to a comparable vehicle of from 30-40%, 30% if from 40-50%, and 40% if at least 50%. The qualified incremental hybrid cost cannot exceed $7,500 for a vehicle with a GVWR up to 14,000 pounds, $15,000 for a vehicle with a GVWR from 14,000 to 26,000 pounds, and $30,000 for a vehicle with a GVWR greater than 26,000 pounds
• A tax credit for placing a qualified alternative fuel (i.e., natural gas, liquefied natural gas, liquefied petroleum gas, hydrogen, and at least 85% methanol) motor vehicle into service. The amount of the tax credit is 50% of the qualified incremental cost of the vehicle plus 30% if the vehicle meets or exceeds the most stringent criteria under the Clean Air Act. The qualified incremental cost cannot exceed $5,000 for a vehicle with a GVWR up to 8,500 pounds, $10,000 for a vehicle with a GVWR from 8,500 to 14,000, $25,000 for a vehicle with a GVWR from 14,000 to 26,000 pounds, and $40,000 for a vehicle with a GVWR greater than 26,000 pounds
• A tax credit for placing a qualified mixed-fuel motor vehicle into service. The amount of the tax credit is a percentage of the credit allowed for a qualified alternative fuel vehicle (see above) as follows - 70% in the case of a 75/25 mixed fuel vehicle, and 90% in the case of a 90/10 mixed fuel vehicle
2.3.2 Federal Energy Efficiency Programs
The greatest impact from switching to a real energy criteria are those programs which currently use site energy as the criteria by which energy efficiency is determined since energy cost is a reasonable proxy for real energy for some applications and/or some regions of the country. The policies that meet that criterion are summarized in Table 2.11. They include ENERGY STAR, Appliances and Commercial Equipment Standards Program and EnergyGuide. Each of these programs is discussed in more detail below. A comprehensive listing of federal energy efficiency programs are summarized in Appendix A.
25
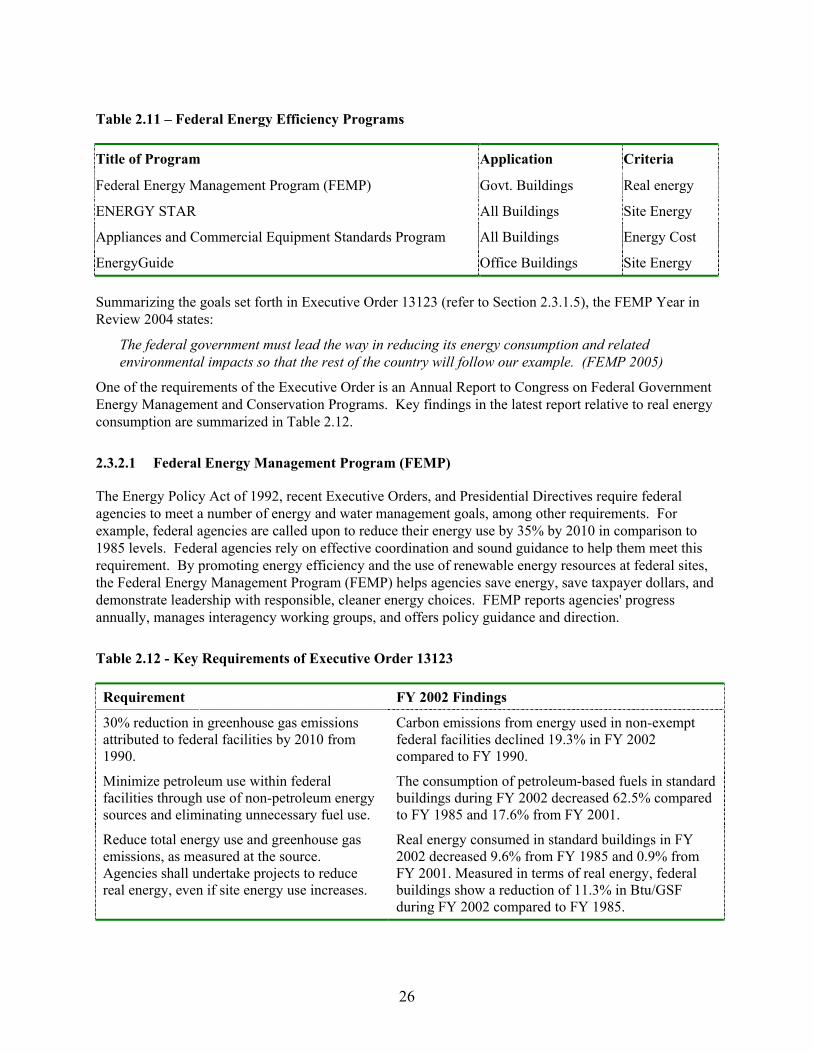
Table 2.11 – Federal Energy Efficiency Programs
Title of Program Application Criteria
Federal Energy Management Program (FEMP) Govt. Buildings Real energy
ENERGY STAR All Buildings Site Energy
Appliances and Commercial Equipment Standards Program All Buildings Energy Cost
EnergyGuide Office Buildings Site Energy
Summarizing the goals set forth in Executive Order 13123 (refer to Section 2.3.1.5), the FEMP Year in Review 2004 states:
The federal government must lead the way in reducing its energy consumption and related environmental impacts so that the rest of the country will follow our example. (FEMP 2005)
One of the requirements of the Executive Order is an Annual Report to Congress on Federal Government Energy Management and Conservation Programs. Key findings in the latest report relative to real energy consumption are summarized in Table 2.12.
2.3.2.1 Federal Energy Management Program (FEMP)
The Energy Policy Act of 1992, recent Executive Orders, and Presidential Directives require federal agencies to meet a number of energy and water management goals, among other requirements. For example, federal agencies are called upon to reduce their energy use by 35% by 2010 in comparison to 1985 levels. Federal agencies rely on effective coordination and sound guidance to help them meet this requirement. By promoting energy efficiency and the use of renewable energy resources at federal sites, the Federal Energy Management Program (FEMP) helps agencies save energy, save taxpayer dollars, and demonstrate leadership with responsible, cleaner energy choices. FEMP reports agencies' progress annually, manages interagency working groups, and offers policy guidance and direction.
Table 2.12 - Key Requirements of Executive Order 13123
Requirement FY 2002 Findings
30% reduction in greenhouse gas emissions attributed to federal facilities by 2010 from 1990.
Carbon emissions from energy used in non-exempt federal facilities declined 19.3% in FY 2002 compared to FY 1990.
Minimize petroleum use within federal facilities through use of non-petroleum energy sources and eliminating unnecessary fuel use.
The consumption of petroleum-based fuels in standard buildings during FY 2002 decreased 62.5% compared to FY 1985 and 17.6% from FY 2001.
Reduce total energy use and greenhouse gas emissions, as measured at the source. Agencies shall undertake projects to reduce real energy, even if site energy use increases.
Real energy consumed in standard buildings in FY 2002 decreased 9.6% from FY 1985 and 0.9% from FY 2001. Measured in terms of real energy, federal buildings show a reduction of 11.3% in Btu/GSF during FY 2002 compared to FY 1985.
26

2.3.2.2 ENERGY STAR
General
In 1992 the US Environmental Protection Agency (EPA) introduced ENERGY STAR as a voluntary labeling program designed to identify and promote energy-efficient products to reduce greenhouse gas emissions. Computers and monitors were the first labeled products. Through 1995, EPA expanded the label to additional office equipment products and residential heating and cooling equipment. The ENERGY STAR label is currently available for a large variety of products, new homes, home improvements, and business improvements. In each of these areas, reducing site energy consumption is the primary basis for achieving the ENERGY STAR label.
The ENERGY STAR website (http://www.energystar.gov/index.cfm?c=about.ab_learn_more) makes the following comment about energy efficiency as it relates to the program:
Energy efficiency -- delivering the same (or more) services for less energy -- helps protect the environment. When we use less energy, the less energy we need to generate at power plants, which reduces greenhouse gas emissions and improves the quality of our air. Energy efficiency helps the economy, too, by saving consumers and businesses millions of dollars in energy costs. Energy efficient solutions can reduce the energy bill for many homeowners and businesses by 20 to 30 percent.
Residential Buildings
ENERGY STAR qualified homes are independently verified to be at least 30% more site energy efficient than homes built to the 1993 Model Energy Code (MEC) or 15% more site energy efficient than the applicable state energy code, whichever is more rigorous. Savings are based on heating, cooling and hot water energy use and are typically achieved through a combination of: building envelope upgrades, controlled air infiltration, upgraded heating and air conditioning systems, tight duct systems and upgraded water-heating equipment.
Verification of a home's energy efficiency by a third party verifier is an integral step in acquiring the ENERGY STAR label and certificate. Verification is generally dependent upon the construction method used to build the home. Homes constructed on-site are typically verified using one of two methods: Home Energy Rating Systems (HERS) Ratings or Builder Option Packages (BOP). HERS ratings involve the analysis of a home's construction plans and at least one on-site inspection of the home. The construction plan review allows the home energy rater to attain technical information such as orientation, shading area, proposed SEER rating, insulation levels, etc. The on-site inspection includes a blower door test (to test the leakiness of the house) and a duct test (to test the leakiness of the ducts). Results of these tests, along with inputs derived from the construction plan review, are entered into a computer simulation program that generates the HERS score and the home's estimated annual energy costs. A BOP is the other manner through which a home can be qualified as an ENERGY STAR home. BOPs represent a set of construction specifications for a specific climate zone. BOPs specify performance levels for the thermal envelope, insulation, windows, orientation, HVAC system and water heating efficiency for a specific climate zone that meet the standard.
There are no specific requirements for participation in the ENERGY STAR Home Improvement program. Rather the objective of the program is to provide homeowners with the tools and resources to make energy efficient improvements as well as assess the benefits derived there from. Contact information is also available for local energy specialists that can assist homeowners achieve their objectives. Given the lack of specific energy efficiency requirements or guidelines, there would be little benefit in shifting the focus to real energy efficiency evaluation.
27
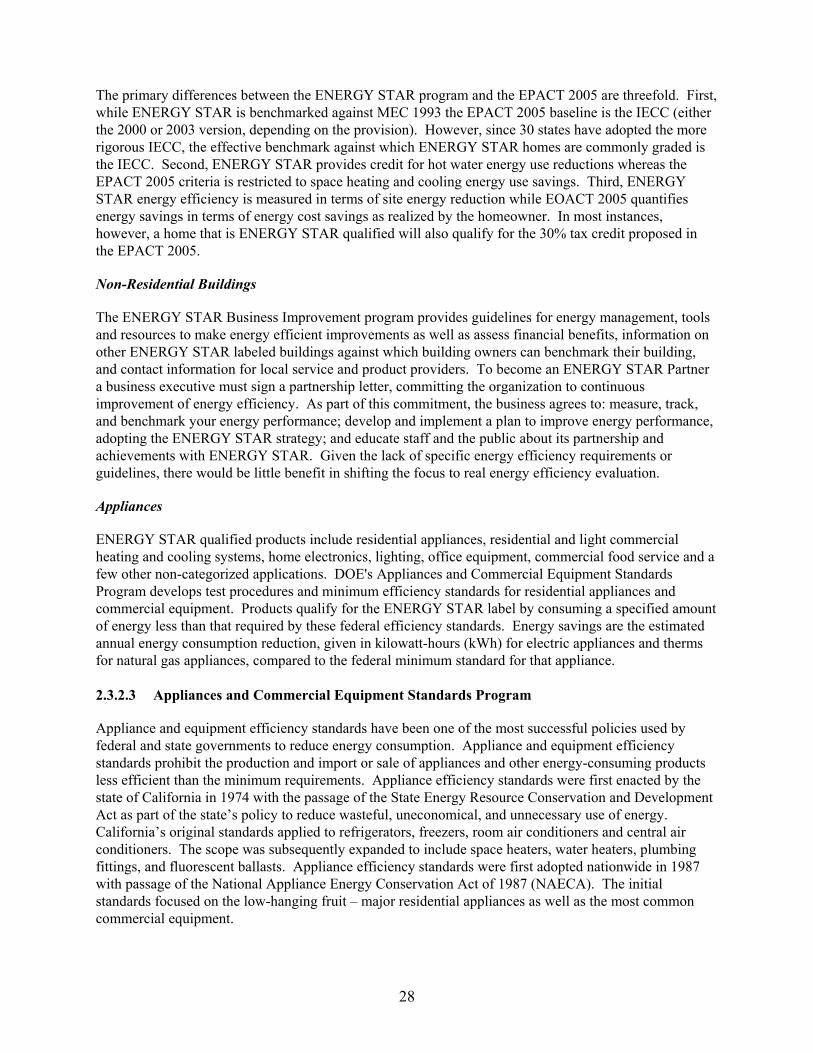
The primary differences between the ENERGY STAR program and the EPACT 2005 are threefold. First, while ENERGY STAR is benchmarked against MEC 1993 the EPACT 2005 baseline is the IECC (either the 2000 or 2003 version, depending on the provision). However, since 30 states have adopted the more rigorous IECC, the effective benchmark against which ENERGY STAR homes are commonly graded is the IECC. Second, ENERGY STAR provides credit for hot water energy use reductions whereas the EPACT 2005 criteria is restricted to space heating and cooling energy use savings. Third, ENERGY STAR energy efficiency is measured in terms of site energy reduction while EOACT 2005 quantifies energy savings in terms of energy cost savings as realized by the homeowner. In most instances, however, a home that is ENERGY STAR qualified will also qualify for the 30% tax credit proposed in the EPACT 2005.
Non-Residential Buildings
The ENERGY STAR Business Improvement program provides guidelines for energy management, tools and resources to make energy efficient improvements as well as assess financial benefits, information on other ENERGY STAR labeled buildings against which building owners can benchmark their building, and contact information for local service and product providers. To become an ENERGY STAR Partner a business executive must sign a partnership letter, committing the organization to continuous improvement of energy efficiency. As part of this commitment, the business agrees to: measure, track, and benchmark your energy performance; develop and implement a plan to improve energy performance, adopting the ENERGY STAR strategy; and educate staff and the public about its partnership and achievements with ENERGY STAR. Given the lack of specific energy efficiency requirements or guidelines, there would be little benefit in shifting the focus to real energy efficiency evaluation.
Appliances
ENERGY STAR qualified products include residential appliances, residential and light commercial heating and cooling systems, home electronics, lighting, office equipment, commercial food service and a few other non-categorized applications. DOE's Appliances and Commercial Equipment Standards Program develops test procedures and minimum efficiency standards for residential appliances and commercial equipment. Products qualify for the ENERGY STAR label by consuming a specified amount of energy less than that required by these federal efficiency standards. Energy savings are the estimated annual energy consumption reduction, given in kilowatt-hours (kWh) for electric appliances and therms for natural gas appliances, compared to the federal minimum standard for that appliance.
2.3.2.3 Appliances and Commercial Equipment Standards Program
Appliance and equipment efficiency standards have been one of the most successful policies used by federal and state governments to reduce energy consumption. Appliance and equipment efficiency standards prohibit the production and import or sale of appliances and other energy-consuming products less efficient than the minimum requirements. Appliance efficiency standards were first enacted by the state of California in 1974 with the passage of the State Energy Resource Conservation and Development Act as part of the state’s policy to reduce wasteful, uneconomical, and unnecessary use of energy. California’s original standards applied to refrigerators, freezers, room air conditioners and central air conditioners. The scope was subsequently expanded to include space heaters, water heaters, plumbing fittings, and fluorescent ballasts. Appliance efficiency standards were first adopted nationwide in 1987 with passage of the National Appliance Energy Conservation Act of 1987 (NAECA). The initial standards focused on the low-hanging fruit – major residential appliances as well as the most common commercial equipment.
28

DOE's Appliances and Commercial Equipment Standards Program develops test procedures and minimum efficiency standards for residential appliances and commercial equipment. DOE started the program in 1978 to determine and enforce minimum efficiency standards with the authority of NAECA and the Energy Policy Act of 1992 (EPACT 1992). DOE is specifically instructed to update standards whenever new available technology makes higher standard levels economically justifiable. The Appliances and Commercial Equipment Standards website, provides detailed information about the DOE program, including the general rules and regulations that manufacturers need to comply with, the latest information on rulemaking, standards, and test procedures for specific products. Residential and commercial products covered by the program and their current status is summarized in Tables 2.13 and 2.14, respectively.
Table 2.13 – Residential Appliances
Product Rulemaking StatusCentral Air Conditioners and Heat Pumps Priority Standards RulemakingsFurnaces and Boilers Priority Standards RulemakingsDishwashers Priority Test Procedure RulemakingSmall Duct, High Velocity Air Conditioners Priority Test Procedure RulemakingFurnaces and Boilers Priority Test Procedure RulemakingClothes Dryers Current Residential RulemakingsClothes Washers Current Residential RulemakingsCooking Products Current Residential RulemakingsGeneral Service Fluorescent Current Residential RulemakingsIncandescent Reflector Current Residential RulemakingsPlumbing Products Current Residential RulemakingsPool Heaters Current Residential RulemakingsRefrigerators and Freezers Current Residential RulemakingsRoom Air-conditioners Current Residential RulemakingsWater Heaters Current Residential Rulemakings
Table 2.14 - Commercial Equipment
Product Rulemaking StatusDistribution Transformers Priority Standards RulemakingsUnitary Air Conditioners and Heat Pumps Priority Standards RulemakingsDistribution Transformers Priority Test Procedure RulemakingFurnaces & Boilers Priority Test Procedure RulemakingUnitary Air Conditioners and Heat Pumps Priority Test Procedure RulemakingWater Heaters Priority Test Procedure RulemakingSmall Electric Motors Current Commercial RulemakingsElectric Motors Current Commercial RulemakingsFurnaces & Boilers Current Commercial RulemakingsHigh Intensity Discharge Lamps Current Commercial Rulemakings
29
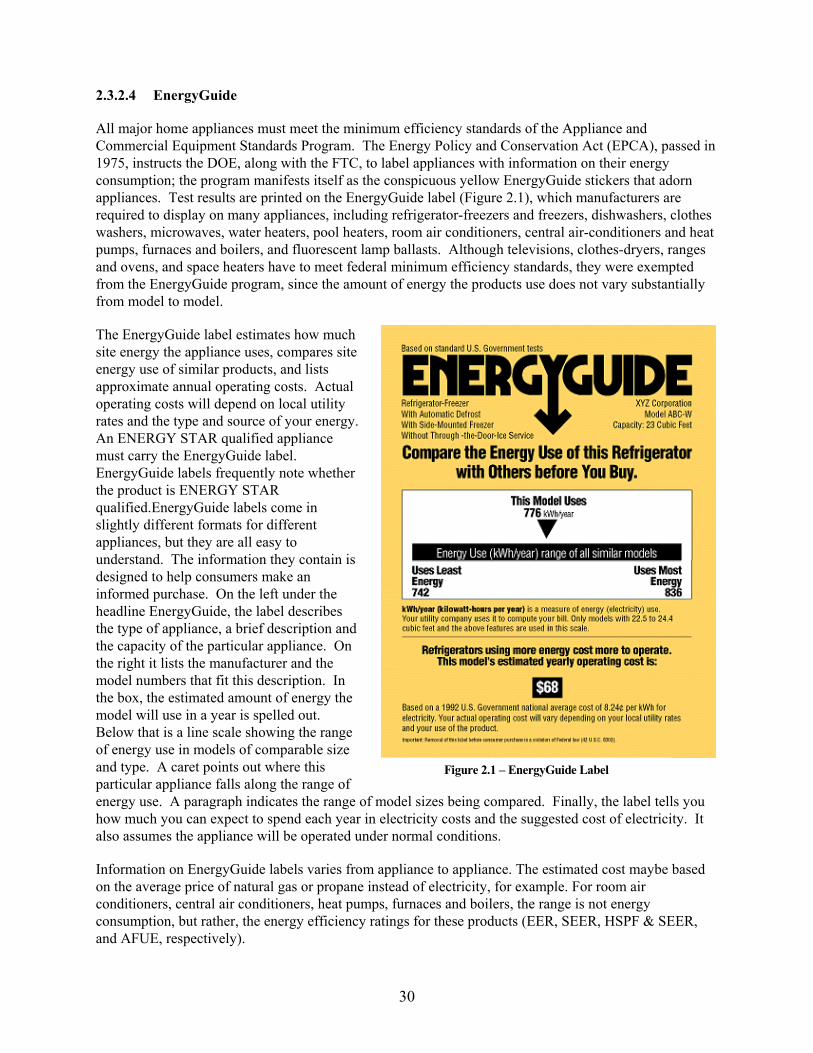
2.3.2.4 EnergyGuide
All major home appliances must meet the minimum efficiency standards of the Appliance and Commercial Equipment Standards Program. The Energy Policy and Conservation Act (EPCA), passed in 1975, instructs the DOE, along with the FTC, to label appliances with information on their energy consumption; the program manifests itself as the conspicuous yellow EnergyGuide stickers that adorn appliances. Test results are printed on the EnergyGuide label (Figure 2.1), which manufacturers are required to display on many appliances, including refrigerator-freezers and freezers, dishwashers, clothes washers, microwaves, water heaters, pool heaters, room air conditioners, central air-conditioners and heat pumps, furnaces and boilers, and fluorescent lamp ballasts. Although televisions, clothes-dryers, ranges and ovens, and space heaters have to meet federal minimum efficiency standards, they were exempted from the EnergyGuide program, since the amount of energy the products use does not vary substantially from model to model.
The EnergyGuide label estimates how much site energy the appliance uses, compares site energy use of similar products, and lists approximate annual operating costs. Actual operating costs will depend on local utility rates and the type and source of your energy. An ENERGY STAR qualified appliance must carry the EnergyGuide label. EnergyGuide labels frequently note whether the product is ENERGY STAR qualified.EnergyGuide labels come in slightly different formats for different appliances, but they are all easy to understand. The information they contain is designed to help consumers make an informed purchase. On the left under the headline EnergyGuide, the label describes the type of appliance, a brief description and the capacity of the particular appliance. On the right it lists the manufacturer and the model numbers that fit this description. In the box, the estimated amount of energy the model will use in a year is spelled out. Below that is a line scale showing the range of energy use in models of comparable size and type. A caret points out where this particular appliance falls along the range of energy use. A paragraph indicates the range of model sizes being compared. Finally, the label tells you how much you can expect to spend each year in electricity costs and the suggested cost of electricity. It also assumes the appliance will be operated under normal conditions.
Figure 2.1 – EnergyGuide Label
Information on EnergyGuide labels varies from appliance to appliance. The estimated cost maybe based on the average price of natural gas or propane instead of electricity, for example. For room air conditioners, central air conditioners, heat pumps, furnaces and boilers, the range is not energy consumption, but rather, the energy efficiency ratings for these products (EER, SEER, HSPF & SEER, and AFUE, respectively).
30

The EnergyGuide program treats gas and electr same category most gas appliances would get fashowed gas and electric water heaters on the samheaters would appear on the low-cost end. Howbetter than both gas and electric resistance watethem and consumers to buy them.
2.3.3 National Energy Codes, Standard
A comprehensive listing of national energy codA. The greatest impacts from switching to real that currently use site energy or energy cost as t(Although energy costs can be a reasonable procountry as a whole, the correlation can become for regions of the country where energy costs dipolicies that meet that criterion are summarizedAppliances and Commercial Equipment Standadiscussed in more detail below.
Table 2.15 – National Energy Efficiency Cod
Title of Code, Standard or Guideline
Model Energy Code/International Energy ConsCode
Energy-Efficient Design of Low-Rise Residenti(ASHRAE Std. 90.2)
Energy Standard for Buildings Except Low-RisBuildings (ASHRAE/IESNA Std. 90.1)
Leadership in Energy and Environmental Desig
ASHRAE Advanced Energy Design Guide
2.3.3.1 Model Energy Code/International E
The Model Energy Code (MEC), published andthe “International Energy Conservation Code” (new residential and commercial buildings and aceilings, walls, and floors/foundations; and the first published in 1983, with subsequent full edi1998 IECC and its 2000 and 2001 updates are ththe MEC/IECC without modifications, some stadeveloped amendments. Still others adopt the Mstatewide requirement that all new construction
The MEC/IECC applies to all new residential bbuildings are defined as a building three storiesfor a long time (e.g., houses, apartment, dormitobuildings must be heated and/or cooled for the M
ic appliances separately. If they were compared within ther better ratings. For example, if an EnergyGuide label e scale of annual cost of operation, few electric water
ever, an electric heat pump water heater might appear r heaters, which might encourage manufacturers to build
s and Guidelines
es, standards and guidelines are summarized in Appendix energy criteria are those codes, standards and guidelines he criteria by which energy efficiency is determined. xy for real energy for base load applications and/or for the suspect for applications with seasonal or peaking loads or verge substantially from the national average.) The in Table 2.15. They include ENERGY STAR, rds Program and EnergyGuide. Each of these programs is
es, Standards and Guidelines
Application Criteria
ervation Residential and non-residential buildings
Site Energy
al Buildings Residential buildings Energy Cost
e Residential Non-residential buildings Site Energy
n (LEED) Non-residential buildings Energy Cost
Small office buildings Site Energy
nergy Conservation Code
maintained by the International Code Council (ICC) as IECC) as of 1998, contains energy efficiency criteria for dditions to existing buildings. It covers the building’s mechanical, lighting, and power systems. The MEC was tions published in 1986, 1989, 1992, 1993, and 1995. The e successor to the MEC. While some states have adopted tes adopt one of the MEC/IECC editions with state-EC/IECC as recommended practice but have no
use it.
uildings, and additions to such buildings. Residential or less in height above grade where the occupants can live ries, but not hotels/motels). Additions to residential EC/IECC to apply. Additions that are not heated and/or
31

cooled, such as an unconditioned garage, need not comply. Energy-using systems that serve the addition must also comply with the MEC/IECC. For example, all new ductwork to an addition from an existing heating system must be insulated and sealed in accordance with the code.
Methods for demonstrating compliance of residential buildings include the use of a computerized building simulation tool to determine the energy use of the proposed design; a prescriptive component-by-component approach that uses tables in the code appendix; and a whole building trade-off approach. The prescriptive requirements may not be quite appropriate for a particular project, or it may be cheaper to do it another way. In this case, builders can demonstrate compliance by using the trade-off approach. Users can trade off insulation and window efficiency levels in different parts of the building. They can trade off ceiling, wall, floor, basement wall, slab-edge, and crawlspace wall insulation; glazing and door areas; and glazing and door U-values. DOE has developed a compliance tool set, REScheck (formerly MECcheck), which makes it fast and easy for designers and builders to determine if new homes and additions to existing homes meet the MEC/IECC requirements. A whole-building energy analysis can also be used to show energy use equal to that of a MEC/IECC-compliant home; however, this approach is complex and is seldom used.
The criteria for building envelope components are based on thermal performance, which although originally may have been based partially on site energy considerations no longer contain any direct linkage to energy consumption. The amount of insulation required on ceilings, walls, floors, and around slabs varies with the climate. Window energy efficiency requirements also increase with severity of climate. If the building designer chooses the prescriptive path, these requirements are totally independent of the type of mechanical systems specified. If the whole building trade-off approach is taken the designer can trade off insulation and window efficiency levels in different parts of the building but cannot trade off higher insulation or window efficiency levels against lower mechanical equipment efficiency levels. Only the MEC/IECC criteria for mechanical systems are explicitly based on site energy efficiency with no trade-offs allowed between mechanical systems or fuels.
32
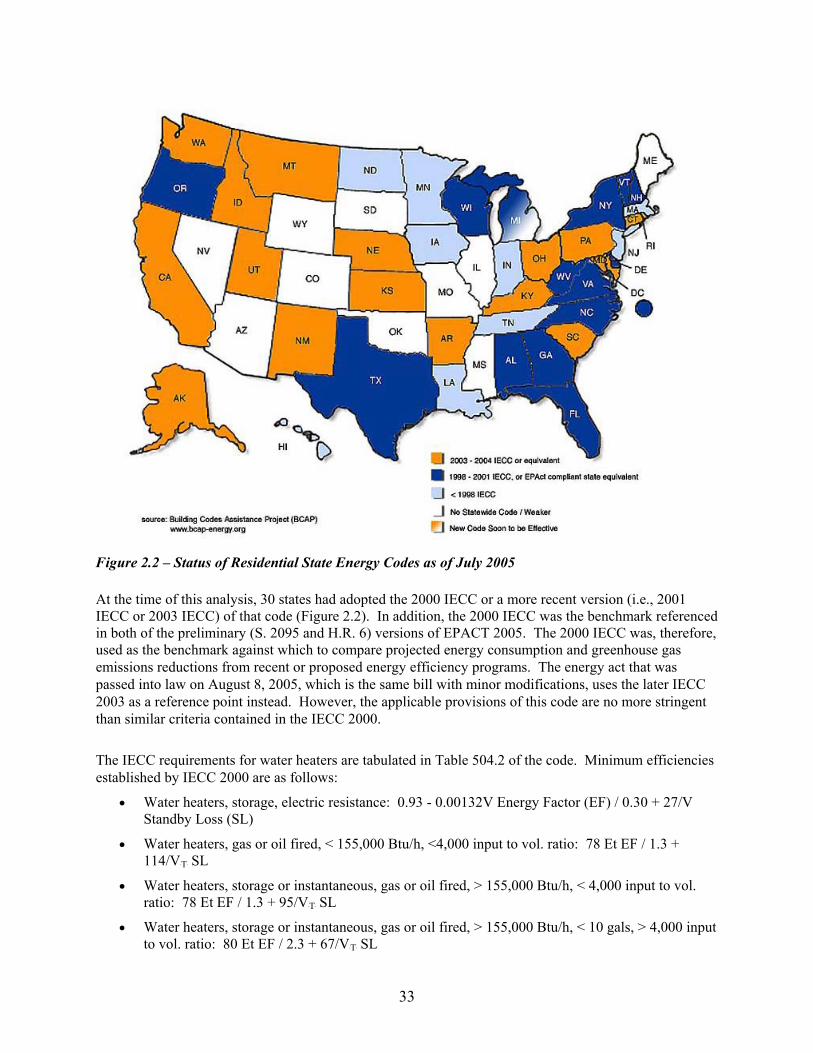
Figure 2.2 – Status of Residential State Energy Codes as of July 2005
At the time of this analysis, 30 states had adopted the 2000 IECC or a more recent version (i.e., 2001 IECC or 2003 IECC) of that code (Figure 2.2). In addition, the 2000 IECC was the benchmark referenced in both of the preliminary (S. 2095 and H.R. 6) versions of EPACT 2005. The 2000 IECC was, therefore, used as the benchmark against which to compare projected energy consumption and greenhouse gas emissions reductions from recent or proposed energy efficiency programs. The energy act that was passed into law on August 8, 2005, which is the same bill with minor modifications, uses the later IECC 2003 as a reference point instead. However, the applicable provisions of this code are no more stringent than similar criteria contained in the IECC 2000.
The IECC requirements for water heaters are tabulated in Table 504.2 of the code. Minimum efficiencies established by IECC 2000 are as follows:
• Water heaters, storage, electric resistance: 0.93 - 0.00132V Energy Factor (EF) / 0.30 + 27/V Standby Loss (SL)
• Water heaters, gas or oil fired, < 155,000 Btu/h, <4,000 input to vol. ratio: 78 Et EF / 1.3 + 114/VBTB SL
• Water heaters, storage or instantaneous, gas or oil fired, > 155,000 Btu/h, < 4,000 input to vol. ratio: 78 Et EF / 1.3 + 95/VBTB SL
• Water heaters, storage or instantaneous, gas or oil fired, > 155,000 Btu/h, < 10 gals, > 4,000 input to vol. ratio: 80 Et EF / 2.3 + 67/VBTB SL
33

• Water heaters, storage or instantaneous, gas or oil fired, > 155,000 Btu/h, > 10 gals, > 4,000 input to vol. ratio: 77 Et EF / 2.3 + 67/VBTB SL
The IECC requirements for heat pumps are tabulated in Table 803.2.2 (2) of the code. Minimum efficiencies established by IECC 2000 are as follows:
Cooling Mode
• Unitary/applied heat pump, air-cooled, 65 to 135 kBtu/h: 8.90 EER / 8.30 IPLV
• Unitary/applied heat pump, air-cooled, 135 to 760 kBtu/h: 8.50 EER / 7.50 IPLV
• Unitary/applied heat pump, air-cooled, > 760 kBtu/h: 8.20 EER
• Unitary/applied heat pump, water-source, 65 to 135: 10.50 EER
• Unitary/applied heat pump, groundwater-source, < 135: 11.00 EER
• Unitary/applied heat pump, evaporatively cooled, 65 to 135 kBtu/h: 10.50 EER / 9.70 IPLV
Heating Mode
• Unitary/applied heat pump, air-cooled, 65 to 135 kBtu/h: 3.00 COP
• Unitary/applied heat pump, air-cooled, > 135 kBtu/h: 2.90 COP
• Unitary/applied heat pump, water-source, < 135: 3.80 COP
• Unitary/applied heat pump, groundwater-source, < 135: 3.40 COP
The IECC requirements for furnaces, duct furnaces and unit heaters are tabulated in Table 803.2.2 (4) of the code. Minimum efficiencies established by IECC 2000 are as follows:
• Warm air furnace, gas-fired, < 225,000 Btu/h: 78 AFUE / 80 EBtB
• Warm air furnace, gas-fired, > 225,000 Btu/h: 80 EBcB
• Warm air furnace, oil-fired, < 225,000 Btu/h: 78 AFUE / 80 EBtB
• Warm air furnace, oil-fired, > 225,000 Btu/h: 81 EBcB
• Warm air duct furnace, gas-fired, maximum capacity: 78 EBtB
• Warm air duct furnace, gas-fired, minimum capacity: 75 EBtB
• Warm air unit heater, gas-fired, maximum capacity: 78 EBtB
• Warm air unit heater, gas-fired, minimum capacity: 74 Et
• Warm air unit heater, oil-fired, maximum capacity: 81 EBtB
• Warm air unit heater, oil-fired, minimum capacity: 81 EBtB
The IECC requirements for boilers are tabulated in Table 803.2.2 (5) of the code. Minimum efficiencies established by IECC 2000 are as follows:
• Boiler, gas-fired, < 300,000 Btu/h, hot water: 80 AFUE
• Boiler, gas-fired, < 300,000 Btu/h, steam: 75 AFUE
• Boiler, gas-fired, > 300,000, hot water or steam: 80 EBcB
• Boiler, oil-fired, < 300,000 Btu/h, hot water or steam: 80 AFUE
• Boiler, oil-fired, > 300,000 Btu/h, hot water or steam: 83 EBcB
• Boiler, oil-fired (residual), > 300,000 Btu/h, hot water or steam: 83 EBcB
34
2.3.3.2 Energy-Efficient Design of Low-Rise Residential Buildings (ASHRAE Std. 90.2)
The purpose of ASHRAE Standard 90.2, Energy Efficient Design of New Low-Rise Residential Buildings, is to provide minimum requirements for the energy-efficient design of residential buildings. The standard sets forth design requirements for new residential dwelling units for human occupancy, including single-family houses, multi-family structures (of three stories or fewer above grade), manufactured houses (mobile or modular homes). The standard covers the building envelope, HVAC equipment and systems, domestic water heating equipment and systems, and provisions for overall building design alternatives and trade-offs. The standard provides two different paths by which compliance can be determined – a prescriptive path and an annual cost method. The prescriptive path specifies thermal performance criteria for building envelope elements and energy efficiency ratings for room air conditioners, central air conditioners, heat pumps, furnaces and boilers (EER, SEER, HSPF & SEER, and AFUE, respectively). The standard is under continuous maintenance, which is a process ASHRAE uses to keep standards current through the issuance of addenda, or revisions.
Although the ASHRAE Energy Standard for Buildings Except Low-Rise Residential Buildings (ASHRAE 90.2) has the stated purpose of “[providing] minimum requirements for the energy efficient design of residential buildings”, in actual practice it is generally cited as a secondary resource by states that have adopted codes promulgated by another organization, primarily the IECC. In fact, the actual accepted methods of compliance for the latest versions of the IECC and ASHRAE 90.2 are essentially the same and, therefore, either can be used as a benchmark for more aggressive energy efficiency programs. The Arizona State Energy Code Commission in its 2003 State Energy Code Review & Recommendations report makes no differentiation between the two, concluding that ASHRAE Standard 90.2 appears to be the technical basis for the IECC code. (ASECC 2003)
Robert Lucas of the Pacific Northwest National Laboratory performed a comparison of ASHRAE Standard 90.2-2004 and the 2004 IECC Supplement and concludes:
Standard 90.2-2004 and the IECC have many elements in common. They utilize the exact same climate zones. Many of the requirements are of equal or similar stringency. They both have three compliance paths: a simple prescriptive table, a building envelope trade-off procedure, and an annual energy cost-based performance approach. They both also have requirements that are independent of window area and other component areas. (Lucas 2005)
On the other hand, in October 2004 Bruce Hunn, ASHRAE’s Director of Technology, citing an analysis used during recent revisions to 90.2, suggested that the ASHRAE 90.2 is more energy efficient than the existing provisions of the IECC by an average of 6.6% in terms of the national heating and cooling energy costs, and concludes that although Standard 90.2 is equal to the current IECC edition that overall it is more energy efficient than the IECC provisions contained in the 2004 IECC supplement.
For the purpose of our analysis, we chose to make no distinction between concurrent versions of ASHRAE 90.2 and the IECC.
2.3.3.3 Energy Standard for Buildings Except Low-Rise Residential Buildings (ASHRAE/IESNA Standard 90.1)
Although the Standard by itself is not legally binding on any organization, the Energy Policy Act of 1992 requires each state to update the energy efficiency provisions of its commercial building code to meet or exceed the Standard, and within two years to certify to DOE that it has done so. The legislation also requires that, should the Standard or its successors be amended the Department is required to make a determination as to whether the revised Standard will improve energy efficiency in commercial buildings. Should a positive determination be made, each state is required to update the energy efficiency provisions
35

of its commercial building code to meet or exceed the revised edition of the Standard. Within two years each State is also required to certify and demonstrate to DOE that it has done so.
The ASHRAE 90.1-1999 requirements for water heaters are tabulated in Table 7.2.2 of the standard. Minimum efficiencies established are as follows:
• Water heaters, storage, electric resistance, < 12 kW: 0.93 - 0.00132V Energy Factor (EF)
• Water heaters, storage, electric resistance, > 12 kW: 20 + 35/V Standby Loss (SL)
• Water heaters, storage, electric heat pump: 0.93 - 0.00132V EF
• Water heaters, storage, gas fired, < 75,000 Btu/h: 0.62 - 0.0019V EF
• Water heaters, storage, gas fired, > 75,000: 80 Et EF / Q/800 + 110/V SL
• Water heaters, instantaneous, gas fired, 50,000 to 200,000 Btu/h, 0.62 - 0.0019V EF
• Water heaters, instantaneous, gas fired, > 200,000 Btu/h, < 10 gals: 80 Et EF
• Water heaters, instantaneous, gas fired, > 200,000 Btu/h, > 10 gals: 80 Et EF / Q/800 + 110/V SL
• Water heaters, storage, oil fired, < 105,000 Btu/h: 0.59 - 0.0019V EF
• Water heaters, storage, oil fired, > 105,000: 78 Et EF / Q/800 + 110/V SL
• Water heaters, instantaneous, oil fired, < 210,000 Btu/h, 0.59 - 0.0019V EF
• Water heaters, instantaneous, oil fired, > 210,000 Btu/h, < 10 gals: 80 Et EF
• Water heaters, instantaneous, oil fired, > 210,000 Btu/h, > 10 gals: 78 Et EF / Q/800 + 110/V SL
The ASHRAE 90.1-1999 requirements for heat pumps are tabulated in Table 6.2.1B of the standard. Minimum efficiencies established are as follows:
Cooling Mode
• Unitary/applied heat pump, air-cooled, 65 to 135 kBtu/h: 10.10 EER
• Unitary/applied heat pump, air-cooled, 135 to 240 kBtu/h: 9.30 EER
• Unitary/applied heat pump, air-cooled, > 240 kBtu/h: 9.00 EER / 9.22 IPLV
• Unitary/applied heat pump, water-source, 65 to 135: 12.00 EER
• Unitary/applied heat pump, groundwater-source, < 135: 16.20 EER
• Unitary/applied heat pump, ground-source, < 135 kBtu/h: 13.40 EER
Heating Mode
• Unitary/applied heat pump, air-cooled, 65 to 135 kBtu/h: 3.20 COP
• Unitary/applied heat pump, air-cooled, > 135 kBtu/h: 3.10 COP
• Unitary/applied heat pump, water-source, < 135: 4.20 COP
• Unitary/applied heat pump, groundwater-source, < 135: 3.60 COP
• Unitary/applied heat pump, ground-source, < 135 kBtu/h: 3.10 COP
36

The ASHRAE 90.1-1999 requirements for furnaces and unit heaters are tabulated in Table 6.2.1E of the standard. Minimum efficiencies established are as follows:
• Warm air furnace, gas-fired, < 225,000 Btu/h: 78 AFUE / 80 EBtB
• Warm air furnace, gas-fired, > 225,000 Btu/h: 80 EBcB
• Warm air furnace, oil-fired, < 225,000 Btu/h: 78 AFUE / 80 EBtB
• Warm air furnace, oil-fired, > 225,000 Btu/h: 81 EBcB
• Warm air unit heater, gas or oil fired: 80 EBtB
The ASHRAE 90.1-1999 requirements for boilers are tabulated in Table 6.2.1F of the standard. Minimum efficiencies established are as follows:
• Boiler, gas-fired, < 300,000 Btu/h, hot water: 80 AFUE
• Boiler, gas-fired, < 300,000 Btu/h, steam: 75 AFUE
• Boiler, gas-fired, 300,000 to 2,500,000 hot water or steam: 75 EBtB
• Boiler, gas-fired, > 2,500,000, hot water or steam: 80 EBcB
• Boiler, oil-fired, < 300,000 Btu/h, hot water or steam: 80 AFUE
• Boiler, oil-fired, 300,000 to 2,500,000 hot water or steam: 78 EBtB
• Boiler, oil-fired, > 2,500,000 Btu/h, hot water or steam: 83 EBcB
None of the minimum requirements listed above were substantially revised in ASHRAE 90.1-2001.
2.3.3.4 Leadership in Energy and Environmental Design (LEED)
The Leadership in Energy and Environmental Design (LEED) Green Building Rating System is a voluntary, consensus-based, national standard for high-performance, sustainable buildings developed by the U.S. Green Building Council. LEED standards are currently available or under development for:
• New commercial construction and major renovation projects (LEED-NC)
• Existing building operations (LEED-EB)
• Commercial interiors projects (LEED-CI)
• Core and shell projects (LEED-CS)
• Homes (LEED-H)
LEED provides a complete framework for assessing building performance and meeting sustainability goals, emphasizing state of the art strategies for sustainable site development, water savings, energy efficiency, materials selection and indoor environmental quality. LEED recognizes achievements and promotes expertise in green building through a comprehensive system offering project certification, professional accreditation, training and practical resources.
To be LEED certified, a building must be designed to meet building energy efficiency and performance as required by ASHRAE/IESNA Standard 90.1-1999 or the local energy code, whichever is the more stringent. The LEED process requires the building designer to design the building envelope and building systems to maximize energy performance, use a computer simulation model to assess the energy performance and identify the most cost effective energy efficiency measures, and quantify energy performance as compared to a baseline building.
37
2.3.3.5 ASHRAE Advanced Energy Design Guide
A joint committee of the American Institute of Architects (AIA), the Illuminating Engineering Society of North America (IESNA), ASHRAE, DOE and the New Buildings Institute developed the Advanced Energy Design Guide (AEDG) to be a user-friendly guide to high-efficiency design. The initial document in the series focuses on small office buildings (up to 20,000 ftP
2P), one of the most commonly found
structures in the country, accounting for the bulk of the office space in the U.S. Further documents are planned for the 30% savings level that address additional building types beyond office buildings. In addition, the development of other series of documents to give recommendations to achieve 50% and 75% savings are under discussion.
The AEDG provides recommendations for achieving 30% energy savings over the minimum code requirements of ASHRAE Standard 90.1-1999. The 30% energy savings level is intended to meet the needs of various incentive programs for energy efficient design, such as LEED and utility demand side management programs. The selection of the 1999 standard was based on the fact that this version of the standard is frequently adopted into state and local building codes, and is the version of Standard 90.1 that has been determined by DOE as the minimum level that states must adopt under the requirements of the EPACT 1992.
The role of economics and whether and/or how economics were to be included in the AEDG was debated thoroughly by the cognizant ASHRAE committee. The project definition developed by the cognizant committee indicated that energy use was to be considered as the primary or independent variable that was to be specified and cost effectiveness as measured, for example, by simple payback period, was the resulting or dependent variable; thus 30% energy savings compared to ASHRAE Standard 90.1-1999 was the driver. When developing recommendations for efficiency levels of heating, cooling and hot water equipment, ASHRAE chose efficiency levels that were climate appropriate and exceed those in Standard 90.1 in most cases. Although economics were not used explicitly in establishing minimum equipment efficiencies, ASHRAE wanted to insure that sufficient product was available in the marketplace to provide competitive economics. The savings goal was that application of the recommendations would achieve a 30% savings in each climate zone rather than a national average of 30% savings for all climates (Colliver 2005).
Although the primary intended purpose of the guide is to provide a simple approach for contractors and designers of small office buildings, the AEDG aspires to be more than that. First, the AEDG for small office buildings represents the initial document in a series. Further documents are planned that will target the same 30% savings level in commercial building types beyond office buildings. In addition, the development of other series of documents to give recommendations to achieve 50% and 75% savings are under discussion. Second, the guide promotes green building practices by featuring examples of energy efficient buildings appropriate from each climate zone and providing recommendations that would assist the user in achieving energy efficiency credits for the Leadership in Energy and Environmental Design (LEED) or other building energy rating systems (ASHRAE 2004). Given these explicit environmental objectives, the use of real energy efficiency would have been a far more appropriate basis for quantifying energy savings than the economic approach utilized.
The greatest potential impact of the AEDG, however, is in how it shapes the development of future non-residential building standards and codes. It is interesting to note that although the document was developed as a guideline to provide recommendations for going beyond the minimum requirements of code-intended standards it was nonetheless written in prescriptive rather than suggestive language. This approach would facilitate the transition of the AEDG from guideline to standard in the future.
38

Modifying the existing and/or future AEDG’s to target real energy reductions rather than energy savings would be a relatively straightforward process. The AEDG could continue to use ASHRAE Standard 90.1-1999 as the benchmark for energy savings. The real energy consumption and greenhouse gas emissions impact of recommendations could continue to be climate specific. The EPA eGRID database contains emissions and resource mix data for virtually every power plant and company that generates electricity in the United States and can be aggregated at the power plant, electric generating company, power control area, state, North American Electric Reliability Council (NERC) region or nationwide levels (EPA 2003). Ascertaining the generation resource mix and emissions profile for each of the eight DOE climate zones should, again, be a relatively straightforward process. Converting the guidelines from energy cost savings to real energy reduction would provide ASHRAE with more than mere lip service in its claim to addressing today’s environmental challenges.
39

3 POTENTIAL ENERGY/EMISSIONS REDUCTIONS DUE TO THE ADOPTION OF REAL ENERGY EFFICIENCY POLICIES
Section 2 discussed energy programs and policies that might benefit from switching from either site energy or energy cost efficiency to a real energy efficiency metric. By creating and exercising models of the installed base, new construction and replacement markets of effected buildings, appliances and vehicles we can quantify the impact of these policy changes on future energy consumption and greenhouse gas emissions. To that end, this section addresses the following topics:
• Development of appropriate energy savings and emissions models
• Analysis of energy efficiency policies effecting residential construction
• Analysis of energy efficiency policies effecting residential appliances
• Analysis of energy efficiency policies effecting non-residential appliances
• Analysis of energy efficiency policies effecting light-duty vehicles
3.1 Energy Savings and Emissions Models
Sophisticated building simulation models are not required to measure the impact of a shift from real energy rather than site energy as a performance metric. The interactions between building systems (i.e., envelope, lighting and HVAC), building occupants and climate are often second order effects. Model variables essential to characterizing the efficiency of energy delivered to the site of use include extraction, processing, transportation, distribution and conversion. Extraction, processing, transportation and distribution losses are available from a variety of sources including AGA. Conversion efficiency, the efficiency of converting raw feedstock into usable energy, is a function of the energy type. For fossil fuels such as natural gas, propane and oil this is essentially 100%, whereas with electricity conversion efficiency is a function of the raw feedstock used to fuel the generating plant. Since electric power from a single generating plant fed into a grid rather than sent directly to the end-user, the mix of generating plants feeding the grid becomes key. This information is available at the federal, regional or state level using EPA, GRI and Hydropower Association data. Likewise, emission data, including carbon dioxide (COB2B), nitrous oxide (NOBXB), and sulfur oxides (SOBXB), is available at the national regional and state levels.
National and regional estimates of real energy and emissions at the generation source were computed using the EPA Emissions & Generation Resource Integrated Database (eGRID). eGRID is a comprehensive source of data on the environmental characteristics of all electric power generated in the United States. eGRID contains emissions and resource mix data for virtually every power plant and company that generates electricity in the United States. eGRID integrates 24 different federal data sources on power plants and power companies, from three different federal agencies: EPA, the Energy Information Administration (EIA), and the Federal Energy Regulatory Commission (FERC). Emissions data from EPA are carefully integrated with generation data from EIA to produce useful values like pounds per megawatt-hour (lbs/MWh) of emissions, which allows direct comparison of the environmental attributes of electricity generation. eGRID also provides aggregated data to facilitate comparison by company, state, or power grid region. eGRID’s data encompasses more than 4,700 power plants and nearly 2,000 generating companies. eGRID also documents power flows and industry structural changes.
40

Other losses, including extraction, processing, transportation and distribution, were calculated using values in Source Energy and Emission Factors for Residential Energy Consumption published by AGA in August 2000. The information presented in this publication was collected from the EPA, EIA, AGA, GRI, the National Propane Gas Association (NPGA) and the National Hydropower Association.
3.2 Savings & Emissions Analysis
3.2.1 New Energy Efficient Home Credit
3.2.1.1 Methodology
Our analysis used a three-step approach to achieve the targeted 30% or 50% energy savings target, recognizing the minimum 1/3 envelope contribution specified in some versions of the proposed New Energy Efficient Home Credit as proposed in 2003.1 The first step was to upgrade the building envelope of the reference building until 1/3 of the required energy savings had been achieved. The second step attempted to obtain the remaining 2/3 energy savings with available HVAC upgrades. In the third step, we added additional envelope upgrades as necessary until the full 30% or 50% energy savings were achieved. While this approach doesn't necessarily achieve the targeted energy savings in the most cost-effective manner, it is a straightforward approach that can be consistently applied to all building locations and system types. Using this approach there were no instances where it was impossible to achieve the 30% or 50% HVAC energy savings targeted by the legislation.2 A more detailed description of the analysis methodology is included in Appendix A
The results show projected annual site and source HVAC energy consumption, annual HVAC energy cost and annual greenhouse gas (GHG) emissions associated with HVAC energy consumption for the proposed energy efficiency home credit for upgrades that reduce HVAC energy cost to the homeowner by either 30% or 50% relative to a new home built in compliance with IECC 20003.
Site energy consumption, expressed as MMBtu/year, is shown for space heating and space cooling only, since these are the only savings that can be considered when qualifying a new home for the proposed energy credit.
____________________________________
P
1P The term New Energy Efficient Home Credit as proposed in 2003 as used in this Section refers to
legislation that was first introduced into both houses of the U.S. Congress in 2003 but which had still not been approved or implemented at the time this analysis was completed. This bill with minor modifications was passed into law on August 8, 2005 as the Energy Policy Act of 2005. 2 Under the final version of the legislation a tax credit of $1,000 is available for manufactured homes that achieve a 30% reduction in annual heating and cooling costs relative to a reference home with 1/3 of reduction coming from envelope improvements, and a tax credit of $2,000 is available for either site-built or manufactured homes that achieve a 50% reduction in annual heating and cooling costs relative to a reference home with 1/5 of reduction coming from envelope improvements. 3 The IECC 2000 was the reference specified for the New Energy Efficient Home Credit as proposed in 2003. The Energy Policy Act of 2005 passed into law on August 8, 2005, which is the same bill with minor modifications, uses the later IECC 2003 as a reference point instead. However, the applicable provisions of this code are no more stringent than similar criteria contained in the IECC 2000.
41

The site energy consumption for space heating and cooling is converted to real energy to obtain a clearer picture of the environmental impact of the fuel selected for space heating and cooling, as well as service water heating. This conversion takes into account how the energy is transported to building where it is consumed. Natural gas and propane are transported to the building site where it is burned to release heat energy, while electricity is generated off-site at a power plant. While some electricity is generated using renewable technologies (hydroelectric, wind power, photovoltaic, etc.) most electricity in the U.S. is produced through the burning of fossil fuels. Real energy consumption, expressed as MMBtu/year, is shown for space heating and space cooling only.
3.2.1.2 Results
Three cases are shown in Figures 3.1 through 3.8 - a home with electric furnace space heating, a home with air source heat pump space heating and a home with natural gas furnace space heating.
All of the locations evaluated were able to achieve both the 30% and 50% HVAC energy savings criteria. In general, a 30% reduction in annual HVAC energy cost also produced the same percentage reduction in HVAC site energy consumption. Exceptions were homes with natural gas-fired furnaces in Dallas, which only achieved a 29% reduction in HVAC site energy consumption, and gas heated homes in Boston, New York and Chicago, which produced from 31% to 33% reductions in HVAC site energy consumption. The exceptions occurred in locations with both a space heating energy requirement and per unit natural gas energy cost higher or lower than the average of all eight locations. Dallas has relatively low space heating requirements and gas energy costs while Boston, New York and Chicago have relatively high space heating requirements and gas energy costs.
Likewise, a 50% reduction in annual HVAC energy cost also generally produced the same percentage reduction in HVAC site energy consumption. Exceptions were homes with natural gas-fired furnaces in Phoenix, which only achieved a 49% reduction in HVAC site energy consumption, and gas heated homes in Chicago, Seattle, Denver and New York, which produced from 51% to 53% reductions in HVAC site energy consumption. These exceptions follow the same pattern observed with the 30% reduction scenario.
In general, a 30% reduction in annual HVAC energy cost also produced the same percentage reduction in HVAC real energy consumption. Exceptions were homes with natural gas-fired furnaces in Denver, which only achieved a 29% reduction in HVAC real energy consumption, and gas heated homes in Chicago, which produced a 31% reduction in HVAC real energy consumption. These exceptions are probably best explained by a combination of relatively low natural gas costs and the atypical electric generating mix in their respective states. For example, the generating mix in Colorado is dominated by relatively source-inefficient coal power plants (80%) while the generating mix in Illinois is dominated by efficient nuclear power plants (50%).
42

300 25,000
-
50
100
150
200
250
Baseli
ne
30% H
VAC
50% H
VAC
Baseli
ne
30% H
VAC
50% H
VAC
Baseli
ne
30% H
VAC
50% H
VAC
Electric Furnace Heat Pump NG Furnace
Ener
gy C
onsu
mpt
ion
(MM
Btu
/yr)
-
5,000
10,000
15,000
20,000
GH
G E
mis
sion
s (lb
s/yr
)
Site Energy
Real Energy
GHG Emissions
Figure 3.1 - Impact of New Energy Efficient Home Credit- Single Family Home in Atlanta, GA
-
50
100
150
200
250
300
Baseli
ne
30% H
VAC
50% H
VAC
Baseli
ne
30% H
VAC
50% H
VAC
Baseli
ne
30% H
VAC
50% H
VAC
Electric Furnace Heat Pump NG Furnace
Ener
gy C
onsu
mpt
ion
(MM
Btu
/yr)
-
10,000
20,000
30,000
40,000
GH
G E
mis
sion
s (lb
s/yr
)
Site EnergyReal EnergyGHG Emissions
Figure 3.2 - Impact of New Energy Efficient Home Credit - Single Family Home in Boston, MA
43

-
50
100
150
200
250
300
Baseli
ne
30% H
VAC
50% H
VAC
Baseli
ne
30% H
VAC
50% H
VAC
Baseli
ne
30% H
VAC
50% H
VAC
Electric Furnace Heat Pump NG Furnace
Ener
gy C
onsu
mpt
ion
(MM
Btu
/yr)
-
5,000
10,000
15,000
20,000
25,000
30,000
35,000
GH
G E
mis
sion
s (lb
s/yr
)
Site Energy
Real Energy
GHG Emissions
Figure 3.3 - Impact of New Energy Efficient Home Credit - Single Family Home in Chicago, IL
-
50
100
150
200
250
300
Baseli
ne
30% H
VAC
50% H
VAC
Baseli
ne
30% H
VAC
50% H
VAC
Baseli
ne
30% H
VAC
50% H
VAC
Electric Furnace Heat Pump NG Furnace
Ener
gy C
onsu
mpt
ion
(MM
Btu
/yr)
-
5,000
10,000
15,000
20,000
25,000
GH
G E
mis
sion
s (lb
s/yr
)
Site Energy
Real Energy
GHG Emissions
Figure 3.4 - Impact of New Energy Efficient Home Credit - Single Family Home in Dallas, TX
44
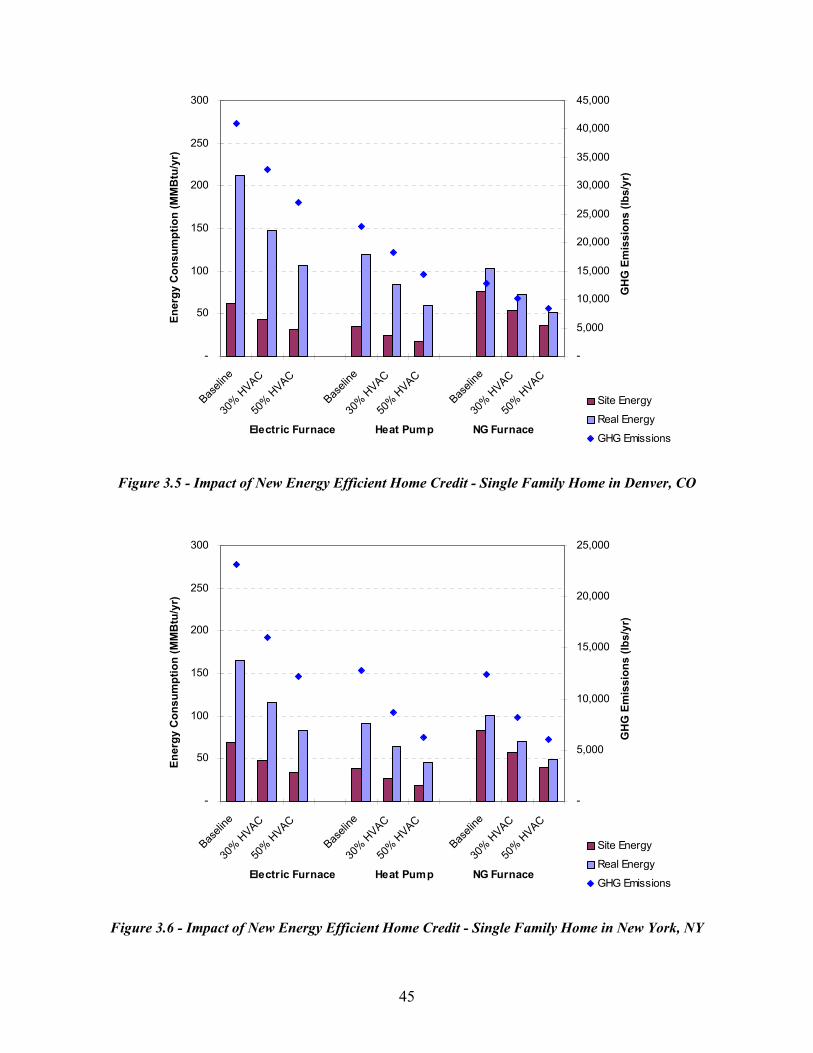
-
50
100
150
200
250
300
Baseli
ne
30% H
VAC
50% H
VAC
Baseli
ne
30% H
VAC
50% H
VAC
Baseli
ne
30% H
VAC
50% H
VAC
Electric Furnace Heat Pump NG Furnace
Ener
gy C
onsu
mpt
ion
(MM
Btu
/yr)
-
5,000
10,000
15,000
20,000
25,000
30,000
35,000
40,000
45,000
GH
G E
mis
sion
s (lb
s/yr
)
Site Energy
Real Energy
GHG Emissions
Figure 3.5 - Impact of New Energy Efficient Home Credit - Single Family Home in Denver, CO
-
50
100
150
200
250
300
Baseli
ne
30% H
VAC
50% H
VAC
Baseli
ne
30% H
VAC
50% H
VAC
Baseli
ne
30% H
VAC
50% H
VAC
Electric Furnace Heat Pump NG Furnace
Ener
gy C
onsu
mpt
ion
(MM
Btu
/yr)
-
5,000
10,000
15,000
20,000
25,000
GH
G E
mis
sion
s (lb
s/yr
)
Site Energy
Real Energy
GHG Emissions
Figure 3.6 - Impact of New Energy Efficient Home Credit - Single Family Home in New York, NY
45

-
50
100
150
200
250
300
Baseli
ne
30% H
VAC
50% H
VAC
Baseli
ne
30% H
VAC
50% H
VAC
Baseli
ne
30% H
VAC
50% H
VAC
Electric Furnace Heat Pump NG Furnace
Ener
gy C
onsu
mpt
ion
(MM
Btu
/yr)
-
2,000
4,000
6,000
8,000
10,000
12,000
14,000
16,000
18,000
20,000
GH
G E
mis
sion
s (lb
s/yr
)
Site Energy
Real Energy
GHG Emissions
Figure 3.7 - Impact of New Energy Efficient Home Credit - Single Family Home in Phoenix, AZ
-
50
100
150
200
250
300
Baseli
ne
30% H
VAC
50% H
VAC
Baseli
ne
30% H
VAC
50% H
VAC
Baseli
ne
30% H
VAC
50% H
VAC
Electric Furnace Heat Pump NG Furnace
Ener
gy C
onsu
mpt
ion
(MM
Btu
/yr)
-
1,000
2,000
3,000
4,000
5,000
6,000
7,000
8,000
9,000
GH
G E
mis
sion
s (lb
s/yr
)
Site EnergyReal EnergyGHG Emissions
Figure 3.8 - Impact of New Energy Efficient Home Credit - Single Family Home in Seattle, WA
46

Likewise, a 50% reduction in annual HVAC energy cost also generally produced the same percentage reduction in HVAC real energy consumption. Exceptions were homes with electric resistance furnaces in Atlanta, which only achieved a 49% reduction in HVAC real energy consumption, homes with an electric air source heat pump in Boston, Denver and Seattle, which generated 51% reductions in HVAC real energy consumption, and homes with natural gas-fired furnaces in Boston, New York and Seattle, which produced reductions in HVAC real energy consumption ranging from 49% to 53%. Complete results from the REM/Rate analysis are included in Appendix B.
The New Energy Efficient Home Credit measures energy efficiency in terms of energy cost to the homeowner, however if the basis were site or real energy instead of energy cost, the projected reduction in real energy consumption and greenhouse gas emissions would not change substantially.
The legislation as written requires that homebuilders hit the 30% and 50% energy cost savings targets without changing the space heating system type or fuel. Given these restrictions, the greatest societal benefits would be derived by focusing on homebuilders building with electric resistance space heating systems. Although, in percentage terms, the reduction in real energy consumption and greenhouse gas emissions is roughly equivalent for each location and space heating system evaluated, a comparison of actual energy consumption (MMBtu) suggests that far greater benefit could be realized through the application of the new energy efficiency home credit to homes with electric resistance space heating rather than homes heated by air-source heat pumps or natural gas furnaces.
On average, an electric resistance heated home qualifying for the 30% tax credit would reduce annual real energy consumption by 50 MMBtu (Figure 3.9). That represents a 40% greater reduction over what could be obtained by qualifying for the same credit with a home heated with either a heat pump (30 MMBtu/yr) or gas furnace (29 MMBtu/yr). The same home heated with electric resistance would reduce annual greenhouse gas emissions by 5,072 pounds. That represents a 34% greater reduction over what could be obtained by qualifying for the same credit with a home heated with a heat pump (3,325 lbs/yr) and 50% more than what could be obtained with a gas furnace (2,555 lbs/yr).
Similarly, an electric resistance heated home qualifying for the 50% tax credit would reduce annual real energy consumption by 83 MMBtu. That represents a 40% reduction over what could be obtained by qualifying for the same credit with a home heated with either a heat pump (50 MMBtu/yr) or gas furnace (48 MMBtu/yr). The same home heated with electric resistance would reduce annual greenhouse gas emissions by 9,302 pounds. That represents a 33% reduction over what could be obtained by qualifying for the same credit with a home heated with a heat pump (6,204 lbs/yr) and 51% more than what could be obtained with a gas furnace (4,552 lbs/yr).
Incentivizing homebuilders to switch from electric resistance space heating to either heat pump or natural gas space heating systems would be an even more cost-effective policy for reducing real energy consumption and greenhouse gas emissions.
47

160 10,000
-
20
40
60
80
100
120
140
Baseli
ne
30% H
VAC
50% H
VAC
Baseli
ne
30% H
VAC
50% H
VAC
Baseli
ne
30% H
VAC
50% H
VAC
Electric Furnace Heat Pump NG Furnace
Sour
ce E
nerg
y R
educ
tion
(MM
Btu
/yt)
-
1,000
2,000
3,000
4,000
5,000
6,000
7,000
8,000
9,000
GH
G E
mis
sion
s R
educ
tion
(lbs/
yr)
Real Energy
GHG Emissions
Figure 3.9 – Comparative Real Energy and Greenhouse Gas Reductions by HVAC System Type Single Family Home - National Average
A home with electric resistance heating qualifying for the proposed 30% tax credit would consume 118 MMBtu of real energy annually for space heating and cooling and be attributable for 19,383 pounds of greenhouse gas emissions annually. An otherwise equivalent home with a heat pump would consume only 70 MMBtu of real energy annually, which is 96% less than the home with an electric furnace, and 11,260 pounds of greenhouse gases, which represents a 160% reduction. An otherwise equivalent home with a gas furnace would consume 67 MMBtu of real energy annually, which is 102% less than the home with an electric furnace, and 9,094 pounds of greenhouse gases, which represents a 203% reduction. Given that homes with electric furnaces currently have an 8% share of the new housing market, or approximately 77,000 homes (US Census 2003), adopting this strategy would have the potential to reduce annual real energy consumption by almost 4 million MMBtu, and greenhouse gas emissions by almost 400,000 tons annually (Figures 3.10 & 3.11).
Similarly, A home with electric resistance heating qualifying for the proposed 50% tax credit would consume 84 MMBtu of real energy annually for space heating and cooling and be attributable for 15,040 pounds of greenhouse gas emissions annually. An otherwise equivalent home with a heat pump would consume only 50 MMBtu of real energy annually, which is 41% less than the home with an electric furnace, and 8,381 pounds of greenhouse gases, which represents a 73% reduction. An otherwise equivalent home with a gas furnace would consume 48 MMBtu of real energy annually, which is 44% less than the home with an electric furnace, and 7,097 pounds of greenhouse gases, which represents a 87% reduction. Adopting this strategy nationwide would have the potential to reduce annual real energy consumption by almost 3 million MMBtu, and greenhouse gas emissions by over 300,000 tons annually. (Figures 3.10 & 3.11).
48

-
20
40
60
80
100
120
140
Baseli
ne
30% H
VAC
50% H
VAC
Baseli
ne
30% H
VAC
50% H
VAC
Baseli
ne
30% H
VAC
50% H
VAC
Electric Furnace Heat Pump NG Furnace
(MM
Btu
/yr)
Sour
ce E
nerg
y C
onsu
mpt
ion
Reduction w ithin System Type
Overall Reduction
Figure 3.10 –Comparative Real Energy Reductions by HVAC System Type Single Family Home - National Average
-
2,000
4,000
6,000
8,000
10,000
12,000
14,000
16,000
18,000
20,000
Baseli
ne
30% H
VAC
50% H
VAC
Baseli
ne
30% H
VAC
50% H
VAC
Baseli
ne
30% H
VAC
50% H
VAC
Electric Furnace Heat Pump NG Furnace
Gre
enho
use
Gas
Em
issi
ons
(lbs/
yr)
Reduction Within System TypeOverall Reduction
Figure 3.11 – Comparative Greenhouse Gas Reductions by HVAC System Type Single Family Home - National Average
49

3.2.2 National Appliance Energy Conservation Act of 1987 (NAECA)
Several studies have been conducted on the impacts of efficiency standards to date on U.S. energy use. For example, both the American Council for an Energy-Efficient Economy (ACEEE) and Lawrence Berkeley National Laboratory (LBNL) have periodically published estimates of the national impacts of specific federal efficiency standards. These studies generally compare the efficiency of appliances with standards to what efficiencies would have been if pre-standard efficiency trends had continued. Although NAECA efficiency standards use site energy as the basis for qualifying appliances, ACEEE compiled a list of savings estimates including electricity savings, primary (i.e., source) energy savings, peak load reductions, and carbon reductions in the years 2000, 2010, and 2020 from all standards adopted so far. For example, the total site electrical savings in 2000 were 88 TWh per year, which is the equivalent of 0.30 quads per year. This compares to primary or real energy savings of 1.2 quads per year for a combined real energy conversion factor of 4.0. Since only electric appliances are included in the table, there is no basis for comparing the impact of a source-energy based policy versus the present site energy policy. However, the fact that real energy statistics can be readily compiled suggests that there would be no technical barriers to switching to a real energy metric (Table 3.1).
In addition to the recent standard updates, several other existing standards are now ready for updating. Some of these updates are now underway while others have yet to be scheduled. Furthermore, some of the standards recently updated will be ready for another round of revisions later this decade because of opportunities for significant additional cost-effective savings beyond the new standards. Table 3.2 summarizes additional updates to existing standards that DOE should act on in the next few years to harvest additional savings opportunities. Several gas appliances (e.g., furnaces and boilers, water heaters, gas, and commercial boilers) are included in this list, some of which might benefit from a switch from a site-based to source-based metric. This would be true if a given standard was applicable to all similar appliances, regardless of fuel used, since gas-fired appliances are relatively real energy efficient. For fuel specific appliance standards, the energy efficiency criteria would have no meaningful impact.
Table 3.1 - Savings from Federal Appliance and Equipment Efficiency Standards
Enact Standard Electrical Savings (TWh/yr)
Primary Energy Savings (quads/yr)
Peak Load Reduction (GW)
Carbon Reduction (MMT)
Year 2000 2010 2020 2000 2010 2020 2000 2010 2020 2000 2010 20201987 NAECA 8.0 40.9 45.2 0.21 0.55 0.61 1.4 14.9 16.5 3.7 10.0 10.11988 Ballasts 18.0 2.8 25.2 0.21 0.27 0.29 5.7 7.1 7.9 4.4 5.0 5.01989/91 NAECA Updates 20.0 37.1 41.0 0.23 0.43 0.47 3.6 6.9 7.7 4.8 8.1 8.11992 EPAct (lamps, motors, etc.) 42.0 110.3 121.9 0.59 1.51 1.67 10.1 26.2 28.9 11.8 27.5 27.91997 Refrigerator/freezer update 0.0 13.3 28.0 0.00 0.13 0.28 0.0 1.7 3.6 0.0 2.9 5.51997 Room A/C update 0.0 13.3 2.1 0.00 0.01 0.02 0.0 1.0 1.6 0.0 0.3 0.42000 Ballast update 0.0 1.3 13.7 0.00 0.06 0.13 0.0 1.8 3.0 0.0 1.3 2.72001 Clothes washer update 0.0 6.2 22.6 0.00 0.11 0.28 0.0 1.3 6.1 0.0 2.2 5.42001 Water heater update 0.0 8.0 4.9 0.00 0.08 0.13 0.0 1.5 3.6 0.0 1.4 2.22001 Central A/C & HP update 0.0 2.5 36.4 0.00 0.11 0.35 0.0 3.5 41.5 0.0 2.3 7.2
Total 88 236 341 1.2 3.3 4.2 21 66 120 25 61 75% of projected U.S. total 2.5 6.5 7.8 1.3 2.9 3.5 2.8 7.6 12.6 1.7 3.4 3.8
Source: Geller, Kubo, and Nadel (ACEEE 2001)
50
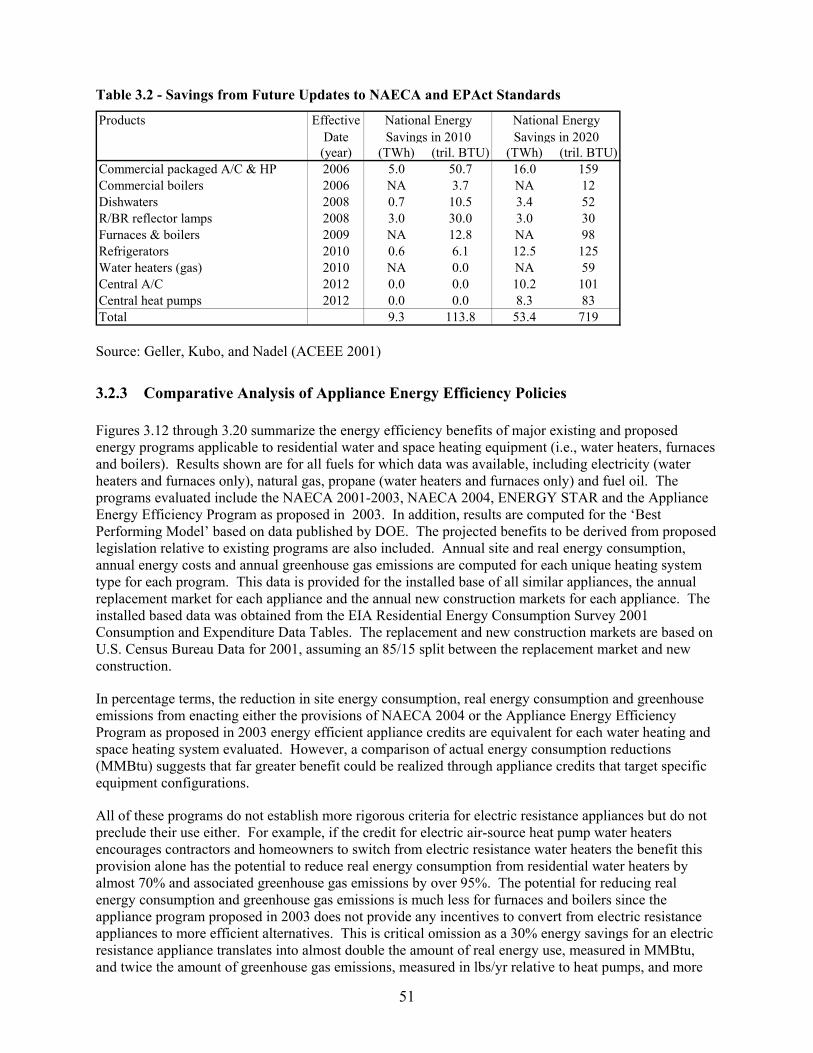
Table 3.2 - Savings from Future Updates to NAECA and EPAct Standards
Products Effective Date
National Energy Savings in 2010
National Energy Savings in 2020
(year) (TWh) (tril. BTU) (TWh) (tril. BTU)Commercial packaged A/C & HP 2006 5.0 50.7 16.0 159Commercial boilers 2006 NA 3.7 NA 12Dishwaters 2008 0.7 10.5 3.4 52R/BR reflector lamps 2008 3.0 30.0 3.0 30Furnaces & boilers 2009 NA 12.8 NA 98Refrigerators 2010 0.6 6.1 12.5 125Water heaters (gas) 2010 NA 0.0 NA 59Central A/C 2012 0.0 0.0 10.2 101Central heat pumps 2012 0.0 0.0 8.3 83Total 9.3 113.8 53.4 719
Source: Geller, Kubo, and Nadel (ACEEE 2001)
3.2.3 Comparative Analysis of Appliance Energy Efficiency Policies
Figures 3.12 through 3.20 summarize the energy efficiency benefits of major existing and proposed energy programs applicable to residential water and space heating equipment (i.e., water heaters, furnaces and boilers). Results shown are for all fuels for which data was available, including electricity (water heaters and furnaces only), natural gas, propane (water heaters and furnaces only) and fuel oil. The programs evaluated include the NAECA 2001-2003, NAECA 2004, ENERGY STAR and the Appliance Energy Efficiency Program as proposed in 2003. In addition, results are computed for the ‘Best Performing Model’ based on data published by DOE. The projected benefits to be derived from proposed legislation relative to existing programs are also included. Annual site and real energy consumption, annual energy costs and annual greenhouse gas emissions are computed for each unique heating system type for each program. This data is provided for the installed base of all similar appliances, the annual replacement market for each appliance and the annual new construction markets for each appliance. The installed based data was obtained from the EIA Residential Energy Consumption Survey 2001 Consumption and Expenditure Data Tables. The replacement and new construction markets are based on U.S. Census Bureau Data for 2001, assuming an 85/15 split between the replacement market and new construction.
In percentage terms, the reduction in site energy consumption, real energy consumption and greenhouse emissions from enacting either the provisions of NAECA 2004 or the Appliance Energy Efficiency Program as proposed in 2003 energy efficient appliance credits are equivalent for each water heating and space heating system evaluated. However, a comparison of actual energy consumption reductions (MMBtu) suggests that far greater benefit could be realized through appliance credits that target specific equipment configurations.
All of these programs do not establish more rigorous criteria for electric resistance appliances but do not preclude their use either. For example, if the credit for electric air-source heat pump water heaters encourages contractors and homeowners to switch from electric resistance water heaters the benefit this provision alone has the potential to reduce real energy consumption from residential water heaters by almost 70% and associated greenhouse gas emissions by over 95%. The potential for reducing real energy consumption and greenhouse gas emissions is much less for furnaces and boilers since the appliance program proposed in 2003 does not provide any incentives to convert from electric resistance appliances to more efficient alternatives. This is critical omission as a 30% energy savings for an electric resistance appliance translates into almost double the amount of real energy use, measured in MMBtu, and twice the amount of greenhouse gas emissions, measured in lbs/yr relative to heat pumps, and more
51

than double the amount of real energy use, measured in MMBtu, and almost four times the amount of greenhouse gas emissions, measured in lbs/yr relative to natural gas water heaters, furnaces and boilers.
4,000,000,000
5,000,000,000
6,000,000,000
7,000,000,000
8,000,000,000
onsu
mpt
ion
(MM
Btu
/yr)
200,000,000
250,000,000
300,000,000
350,000,000
400,000,000
-
1,000,000,000
2,000,000,000
3,000,000,000
NAECA (2001-2003)
NAECA (2004)
EPACT 2005 1($150 credit)
Best PerformingModel
Ener
gy C
-
50,000,000
100,000,000
150,000,000
Gre
enho
use
Gas
Em
siio
ns (t
ons/
yr)
Site Energy Real Energy GHG Emissions
Figure 3.12 - Residential Water Heater Energy Consumption & GHG Emissions - Installed Base
-
100,000,000
200,000,000
300,000,000
400,000,000
500,000,000
600,000,000
700,000,000
NAECA (2001-2003)
NAECA (2004)
EPACT 2005 1($150 credit)
Best PerformingModel
Ener
gy C
onsu
mpt
ion
(MM
Btu
/yr)
-
5,000,000
10,000,000
15,000,000
20,000,000
25,000,000
30,000,000
35,000,000
Gre
enho
use
Gas
Em
siio
ns (t
ons/
yr)
Site Energy Real Energy GHG Emissions
Figure 3.13 - Residential Water Heater Energy Consumption & GHG Emissions – Replacement Market
52

-
10,000,000
20,000,000
30,000,000
40,000,000
50,000,000
60,000,000
70,000,000
80,000,000
90,000,000
NAECA (2001-2003)
NAECA (2004)
EPACT 2005 1($150 credit)
Best PerformingModel
-
1,000,000
2,000,000
3,000,000
4,000,000
5,000,000
100,000,000 6,000,000
Site Energy Real Energy GHG Emissions
Figure 3.14 - Residential Water Heater Energy Consumption & GHG Emissions – New Construction
-
1,000,000,000
2,000,000,000
3,000,000,000
4,000,000,000
5,000,000,000
6,000,000,000
7,000,000,000
8,000,000,000
NAECA (2004)
ENERGYSTAR EPACT 2005 1($150 credit)
Ener
gy C
onsu
mpt
ion
(MM
Btu
/yr)
-
50,000,000
100,000,000
150,000,000
200,000,000
250,000,000
300,000,000
350,000,000
Gre
enho
use
Gas
Em
siio
ns (t
ons/
yr)9,000,000,000
10,000,000,000
400,000,000
450,000,000
Site Energy Real Energy GHG Emissions
Figure 3.15 - Residential Furnace Energy Consumption & GHG Emissions - Installed Base
53

-
100,000,000
200,000,000
300,000,000
400,000,000
500,000,000
600,000,000
700,000,000
800,000,000
900,000,000
1,000,000,000
NAECA (2004)
ENERGYSTAR EPACT 2005 1($150 credit)
Ener
gy C
onsu
mpt
ion
(MM
Btu
/yr)
-
10,000,000
20,000,000
30,000,000
40,000,000
50,000,000
60,000,000
Gre
enho
use
Gas
Em
siio
ns (t
ons/
yr)
Site Energy Real Energy GHG Emissions
Figure 3.16 - Residential Furnace Energy Consumption & GHG Emissions – Replacement Market
-
20,000,000
40,000,000
60,000,000
80,000,000
100,000,000
120,000,000
140,000,000
160,000,000
NAECA (2004)
ENERGYSTAR EPACT 2005 1($150 credit)
-
1,000,000
2,000,000
3,000,000
4,000,000
5,000,000
6,000,000
7,000,000
8,000,000
9,000,000
Site Energy Real Energy GHG Emissions
Figure 3.17 - Residential Furnace Energy Consumption & GHG Emissions – New Construction
54

-
200,000,000
400,000,000
600,000,000
800,000,000
1,000,000,000
1,200,000,000
1,400,000,000
1,600,000,000
1,800,000,000
2,000,000,000
NAECA (2001)
ENERGYSTAR EPACT 2005 1($150 credit)
Best PerformingModel
Ener
gy C
onsu
mpt
ion
(MM
Btu
/yr)
-
10,000,000
20,000,000
30,000,000
40,000,000
50,000,000
60,000,000
70,000,000
80,000,000
90,000,000
100,000,000
Gre
enho
use
Gas
Em
siio
ns (t
ons/
yr)
Site Energy Real Energy GHG Emissions
Figure 3.18 - Residential Boiler Energy Consumption & GHG Emissions - Installed Base
-
5,000,000
10,000,000
15,000,000
20,000,000
25,000,000
30,000,000
35,000,000
40,000,000
45,000,000
50,000,000
NAECA (2001)
ENERGYSTAR EPACT 2005 1($150 credit)
Best PerformingModel
Ener
gy C
onsu
mpt
ion
(MM
Btu
/yr)
-
200,000
400,000
600,000
800,000
1,000,000
1,200,000
1,400,000
1,600,000
1,800,000
2,000,000
Gre
enho
use
Gas
Em
siio
ns (t
ons/
yr)
Site Energy Real Energy GHG Emissions
Figure 3.19 - Residential Boiler Energy Consumption & GHG Emissions – Replacement Market
55

-
1,000,000
2,000,000
3,000,000
4,000,000
5,000,000
6,000,000
7,000,000
8,000,000
9,000,000
10,000,000
NAECA (2001)
ENERGYSTAR EPACT 2005 1($150 credit)
Best PerformingModel
-
50,000
100,000
150,000
200,000
250,000
300,000
350,000
Site Energy Real Energy GHG Emissions
Figure 3.20 - Residential Boiler Energy Consumption & GHG Emissions – New Construction
3.2.4 Comparative Analysis of Non-Residential Building and Appliance Energy Efficiency Programs
Non-residential building and appliance programs that meet that criterion summarized in Section 2.3 were analyzed to ascertain their projected impact on site/real energy and greenhouse gas emissions. They include:
• Energy Policy Act of 1992 - established efficiency requirements that correspond to the levels in the latest version of ASHRAE Standard 90.1.
• International Energy Conservation Code - establishes prescriptive requirements for water heaters, heat pumps, furnaces and unit heaters, and boilers.
• ASHRAE Standard 90.1 - establishes prescriptive requirements for water heaters, heat pumps, furnaces and unit heaters, and boilers.
• ASHRAE Advanced Energy Design Guide - The initial Design Guide focuses on small office buildings up to 20,000 ft2, which make up the bulk of the office space in the United States. The AEDG provides recommendations for achieving 30% energy savings over the minimum code requirements of ASHRAE Standard 90.1-1999.
Figures 3.22 through 3.33 summarize the energy efficiency benefits of major existing and proposed energy programs applicable to commercial water and space heating equipment (i.e., water heaters, heat pumps, furnaces and boilers) installed in commercial buildings. The programs evaluated include the Energy Policy Act of 1992 (EPACT 1992), the International Energy Conservation Code of 2000 (IECC 2000), the American Society of Heating, Refrigerating and Air-Conditioning Engineers Energy Standard for Buildings Except Low-Rise Residential Buildings (ASHRAE 90.1-1999 and 90.1-2001), and the ASHRAE Advanced Energy Design Guide (ASHRAE AEDG). Annual site energy consumption, real energy consumption, and greenhouse gas emissions are computed for water heaters, heat pumps, furnaces
56

and boilers for each program. This data is provided for the installed base of all similar appliances, the replacement market for each appliance type and the new construction market for each appliance type. The installed based data was obtained from the EIA 2003 Commercial Buildings Energy Consumption Survey - Commercial Building Characteristics database. The analysis assumes the annual replacement of 10% of existing installations and an 85/15 split between the replacement market and new construction.
Although the results shown in Figures 3.21 through 3.32 are a composite of all commercial building types, similar analyses to that described above were also performed for the each of the following building types:
• Assembly • Other
• Education • Religious
• Food Sales • Service
• Food Service • Transportation
• Health Care • Vacant
• Lodging • Warehouse
• Order & Safety • Transportation
Results for each of these building types are included in Appendix D.
-
200,000,000
400,000,000
600,000,000
800,000,000
1,000,000,000
1,200,000,000
1,400,000,000
1,600,000,000
1,800,000,000
2,000,000,000
EPACT 1992 IECC 2000 ASHRAE 90.1-1999
ASHRAE 90.1-2001
ASHRAE AEDG
Ener
gy C
onsu
mpt
ion
(MM
Btu
/yr)
-
50,000,000
100,000,000
150,000,000
200,000,000
250,000,000
300,000,000
Gre
enho
use
Gas
Em
siio
ns (t
ons/
yr)
Site Energy Real Energy GHG Emissions
Figure 3.21 - Commercial Water Heater Energy Consumption & GHG Emissions – Installed Base
57

Site Energy Real Energy GHG Emissions
-EPACT 1992 IECC 2000 ASHRAE
90.1-1999ASHRAE 90.1-2001
ASHRAE AEDG
-
5,000,000
10,000,000
15,000,000
20,000,000
25,000,000
30,000,000
500,000
1,000,000
1,500,000
2,000,000
2,500,000
3,000,000
3,500,000
4,000,000
4,500,000
5,000,000
-
20,000,000
40,000,000
60,000,000
80,000,000
100,000,000
120,000,000
140,000,000
160,000,000
180,000,000
200,000,000
EPACT 1992 IECC 2000 ASHRAE 90.1-1999
ASHRAE 90.1-2001
ASHRAE AEDG
Ener
gy C
onsu
mpt
ion
(MM
Btu
/yr)
-
5,000,000
10,000,000
15,000,000
20,000,000
25,000,000
30,000,000
Gre
enho
use
Gas
Em
siio
ns (t
ons/
yr)
Figure 3.22 - Commercial Water Heater Energy Consumption & GHG Emissions – Replacement Market
Site Energy Real Energy GHG Emissions
Figure 3.23 - Commercial Water Heater Energy Consumption & GHG Emissions – New Construction
58

-
100,000,000
200,000,000
300,000,000
400,000,000
500,000,000
600,000,000
EPACT 1992 IECC 2000 ASHRAE 90.1-1999
ASHRAE 90.1-2001
ASHRAE AEDG
Ener
gy C
onsu
mpt
ion
(MM
Btu
/yr)
-
50,000,000
100,000,000
150,000,000
200,000,000
250,000,000
300,000,000
Gre
enho
use
Gas
Em
siio
ns (t
ons/
yr)
700,000,000 350,000,000
Site Energy Real Energy GHG Emissions
Figure 3.24 - Commercial Heat Pump Energy Consumption & GHG Emissions – Installed Base
-
10,000,000
20,000,000
30,000,000
40,000,000
50,000,000
60,000,000
EPACT 1992 IECC 2000 ASHRAE 90.1-1999
ASHRAE 90.1-2001
ASHRAE AEDG
Ener
gy C
onsu
mpt
ion
(MM
Btu
/yr)
-
5,000,000
10,000,000
15,000,000
20,000,000
25,000,000
30,000,000
Gre
enho
use
Gas
Em
siio
ns (t
ons/
yr)
70,000,000 35,000,000
Site Energy Real Energy GHG Emissions
Figure 3.25 - Commercial Heat Pump Energy Consumption & GHG Emissions – Replacement Market
59
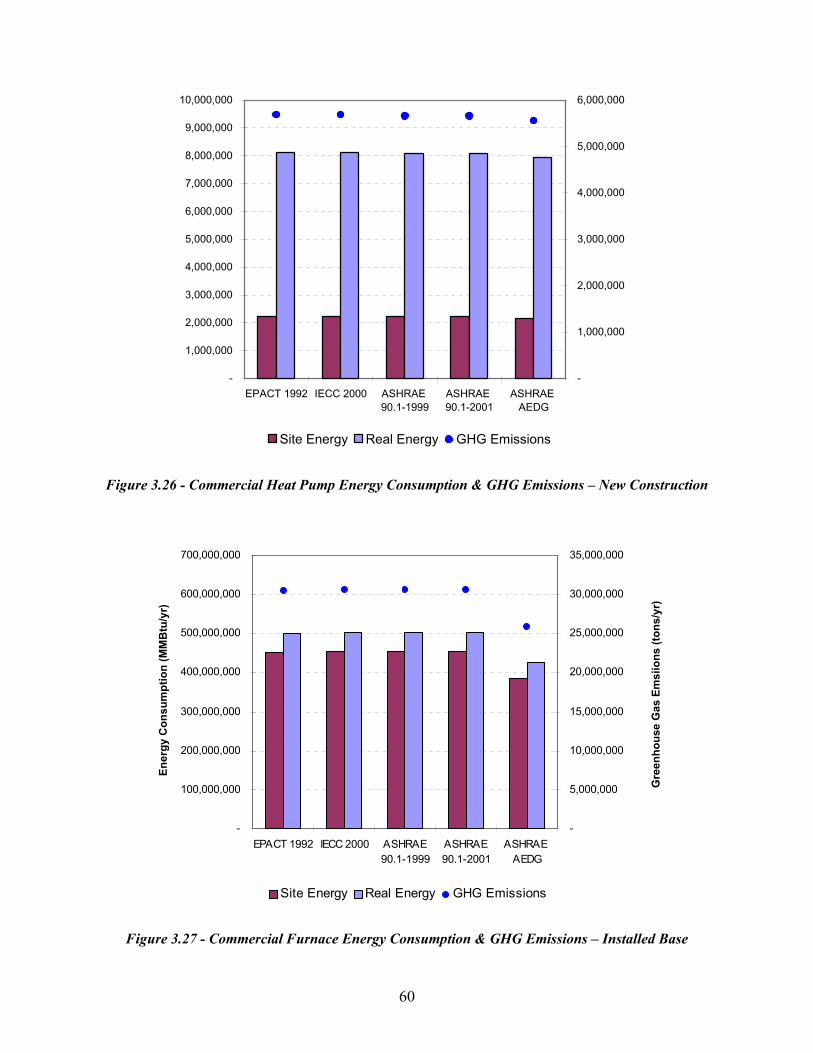
-
1,000,000
2,000,000
3,000,000
4,000,000
5,000,000
6,000,000
7,000,000
8,000,000
9,000,000
10,000,000
EPACT 1992 IECC 2000 ASHRAE 90.1-1999
ASHRAE 90.1-2001
ASHRAE AEDG
-
1,000,000
2,000,000
3,000,000
4,000,000
5,000,000
6,000,000
Site Energy Real Energy GHG Emissions
Figure 3.26 - Commercial Heat Pump Energy Consumption & GHG Emissions – New Construction
-
100,000,000
200,000,000
300,000,000
400,000,000
500,000,000
600,000,000
700,000,000
EPACT 1992 IECC 2000 ASHRAE 90.1-1999
ASHRAE 90.1-2001
ASHRAE AEDG
Ener
gy C
onsu
mpt
ion
(MM
Btu
/yr)
-
5,000,000
10,000,000
15,000,000
20,000,000
25,000,000
30,000,000
35,000,000
Gre
enho
use
Gas
Em
siio
ns (t
ons/
yr)
Site Energy Real Energy GHG Emissions
Figure 3.27 - Commercial Furnace Energy Consumption & GHG Emissions – Installed Base
60

-
10,000,000
20,000,000
30,000,000
40,000,000
50,000,000
60,000,000
70,000,000
EPACT 1992 IECC 2000 ASHRAE 90.1-1999
ASHRAE 90.1-2001
ASHRAE AEDG
Ener
gy C
onsu
mpt
ion
(MM
Btu
/yr)
-
500,000
1,000,000
1,500,000
2,000,000
2,500,000
3,000,000
3,500,000
Gre
enho
use
Gas
Em
siio
ns (t
ons/
yr)
Site Energy Real Energy GHG Emissions
Figure 3.28 - Commercial Furnace Energy Consumption & GHG Emissions – Replacement Market
-
2,000,000
4,000,000
6,000,000
8,000,000
10,000,000
12,000,000
EPACT 1992 IECC 2000 ASHRAE 90.1-1999
ASHRAE 90.1-2001
ASHRAE AEDG
-
100,000
200,000
300,000
400,000
500,000
600,000
Site Energy Real Energy GHG Emissions
Figure 3.29 - Commercial Furnace Energy Consumption & GHG Emissions – New Construction
61
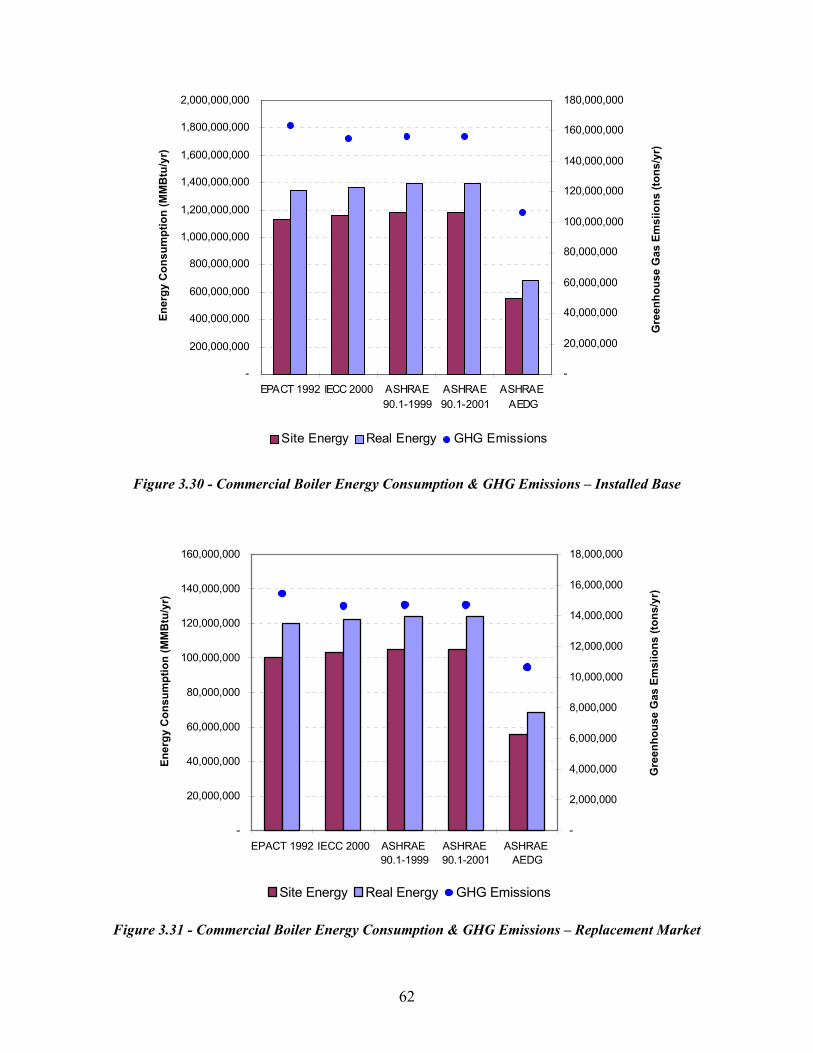
-
200,000,000
400,000,000
600,000,000
800,000,000
1,000,000,000
1,200,000,000
1,400,000,000
1,600,000,000
1,800,000,000
2,000,000,000
EPACT 1992 IECC 2000 ASHRAE 90.1-1999
ASHRAE 90.1-2001
ASHRAE AEDG
Ener
gy C
onsu
mpt
ion
(MM
Btu
/yr)
-
20,000,000
40,000,000
60,000,000
80,000,000
100,000,000
120,000,000
140,000,000
160,000,000
180,000,000
Gre
enho
use
Gas
Em
siio
ns (t
ons/
yr)
Site Energy Real Energy GHG Emissions
Figure 3.30 - Commercial Boiler Energy Consumption & GHG Emissions – Installed Base
-
20,000,000
40,000,000
60,000,000
80,000,000
100,000,000
120,000,000
140,000,000
160,000,000
EPACT 1992 IECC 2000 ASHRAE 90.1-1999
ASHRAE 90.1-2001
ASHRAE AEDG
Ener
gy C
onsu
mpt
ion
(MM
Btu
/yr)
-
2,000,000
4,000,000
6,000,000
8,000,000
10,000,000
12,000,000
14,000,000
16,000,000
18,000,000
Gre
enho
use
Gas
Em
siio
ns (t
ons/
yr)
Site Energy Real Energy GHG Emissions
Figure 3.31 - Commercial Boiler Energy Consumption & GHG Emissions – Replacement Market
62

-
5,000,000
10,000,000
15,000,000
20,000,000
25,000,000
30,000,000
EPACT 1992 IECC 2000 ASHRAE 90.1-1999
ASHRAE 90.1-2001
ASHRAE AEDG
-
500,000
1,000,000
1,500,000
2,000,000
2,500,000
3,000,000
Site Energy Real Energy GHG Emissions
Figure 3.32 - Commercial Boiler Energy Consumption & GHG Emissions – New Construction
There is very little difference between the criteria set forth in the IECC code and the ASHRAE standards, but the impact on both site and real energy consumption if building owners and designers aggressively adapt the efficiency levels promoted in the ASHRAE Advanced Energy Design Guide could be significant. The guide calls for an across the board 30% site energy improvement for all covered building systems relative to the criteria established in ASHRAE 90.1-1999. In percentage terms, the reduction in site energy consumption, real energy consumption and greenhouse emissions from following the guidelines of the ASHRAE Advanced Energy Design Guide are equivalent for each water heating and space heating system evaluated. However, a comparison of actual energy consumption reductions (MMBtu) suggests that far greater benefit could be realized through guidelines that target specific equipment types.
For example, implementing the recommended efficiency improvement for electric storage water heaters in office buildings accounts for less than 30% of the site energy reduction for the installed base of commercial water heaters (all fuels), but would reduce real energy consumption by almost 60% and associated greenhouse gas emissions by over 95%. The potential for reducing real energy consumption and greenhouse gas emissions is much less for furnaces and boilers since the guide doesn’t provide any incentives to convert from electric resistance appliances to more efficient alternatives. This points to a major shortcoming of the guide - it does not establish more rigorous criteria for electric resistance appliances but does not preclude their use either.
3.2.5 Comparative Analysis of Vehicle Energy Efficiency Policies
Figures 3.33 through 3.38 summarize the energy efficiency benefits of major existing and proposed energy programs applicable to passenger cars, class one light duty trucks (up to 6,000 GVWR), and class two light duty trucks (6,001 - 8,500 GVWR). Complete results are included in Appendix E. Although recently policy makers have been turning their attention to medium- and heavy-duty trucks as well there is insufficient market data available to perform a meaningful evaluation. The programs evaluated include 63
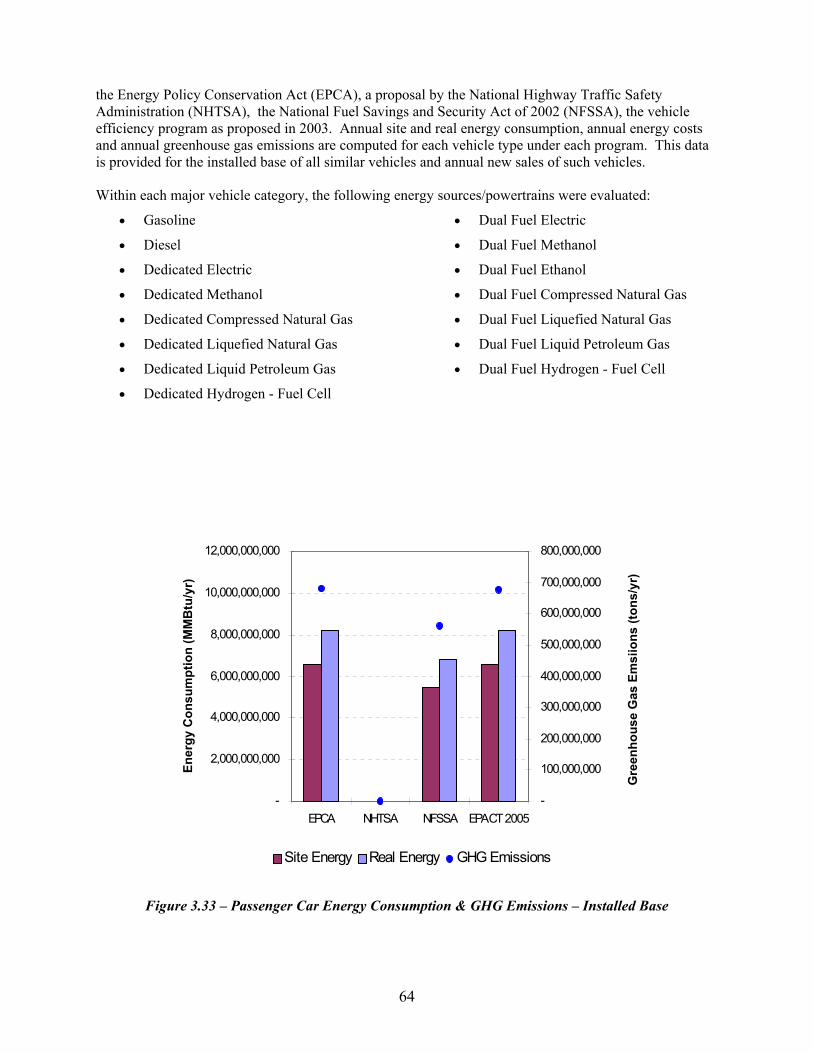
the Energy Policy Conservation Act (EPCA), a proposal by the National Highway Traffic Safety Administration (NHTSA), the National Fuel Savings and Security Act of 2002 (NFSSA), the vehicle efficiency program as proposed in 2003. Annual site and real energy consumption, annual energy costs and annual greenhouse gas emissions are computed for each vehicle type under each program. This data is provided for the installed base of all similar vehicles and annual new sales of such vehicles.
Within each major vehicle category, the following energy sources/powertrains were evaluated:
• Gasoline • Dual Fuel Electric
• Diesel • Dual Fuel Methanol
• Dedicated Electric • Dual Fuel Ethanol
• Dedicated Methanol • Dual Fuel Compressed Natural Gas
• Dedicated Compressed Natural Gas • Dual Fuel Liquefied Natural Gas
• Dedicated Liquefied Natural Gas • Dual Fuel Liquid Petroleum Gas
• Dedicated Liquid Petroleum Gas • Dual Fuel Hydrogen - Fuel Cell
• Dedicated Hydrogen - Fuel Cell
-
2,000,000,000
4,000,000,000
6,000,000,000
8,000,000,000
10,000,000,000
12,000,000,000
EPCA NHTSA NFSSA EPACT 2005
Ener
gy C
onsu
mpt
ion
(MM
Btu
/yr)
-
100,000,000
200,000,000
300,000,000
400,000,000
500,000,000
600,000,000
700,000,000
800,000,000
Gre
enho
use
Gas
Em
siio
ns (t
ons/
yr)
Site Energy Real Energy GHG Emissions
Figure 3.33 – Passenger Car Energy Consumption & GHG Emissions – Installed Base
64

400,000,000
500,000,000
600,000,000
30,000,000
35,000,000
40,000,000
45,000,000
-
100,000,000
200,000,000
300,000,000
EPCA NHTSA NFSSA EPACT 2005
Ener
gy C
onsu
mpt
ion
(MM
Btu
/yr)
-
5,000,000
10,000,000
15,000,000
20,000,000
25,000,000
Gre
enho
use
Gas
Em
siio
ns (t
ons/
yr)
Site Energy Real Energy GHG Emissions
Figure 3.34 – Passenger Car Energy Consumption & GHG Emissions – New Vehicle Sales
-
500,000,000
1,000,000,000
1,500,000,000
2,000,000,000
2,500,000,000
3,000,000,000
3,500,000,000
4,000,000,000
4,500,000,000
5,000,000,000
EPCA NHTSA NFSSA EPACT 2005
Ener
gy C
onsu
mpt
ion
(MM
Btu
/yr)
-
50,000,000
100,000,000
150,000,000
200,000,000
250,000,000
300,000,000
350,000,000
Gre
enho
use
Gas
Em
siio
ns (t
ons/
yr)
Site Energy Real Energy GHG Emissions
Figure 3.35 – Light Duty Truck 1 Energy Consumption & GHG Emissions – Installed Base
65
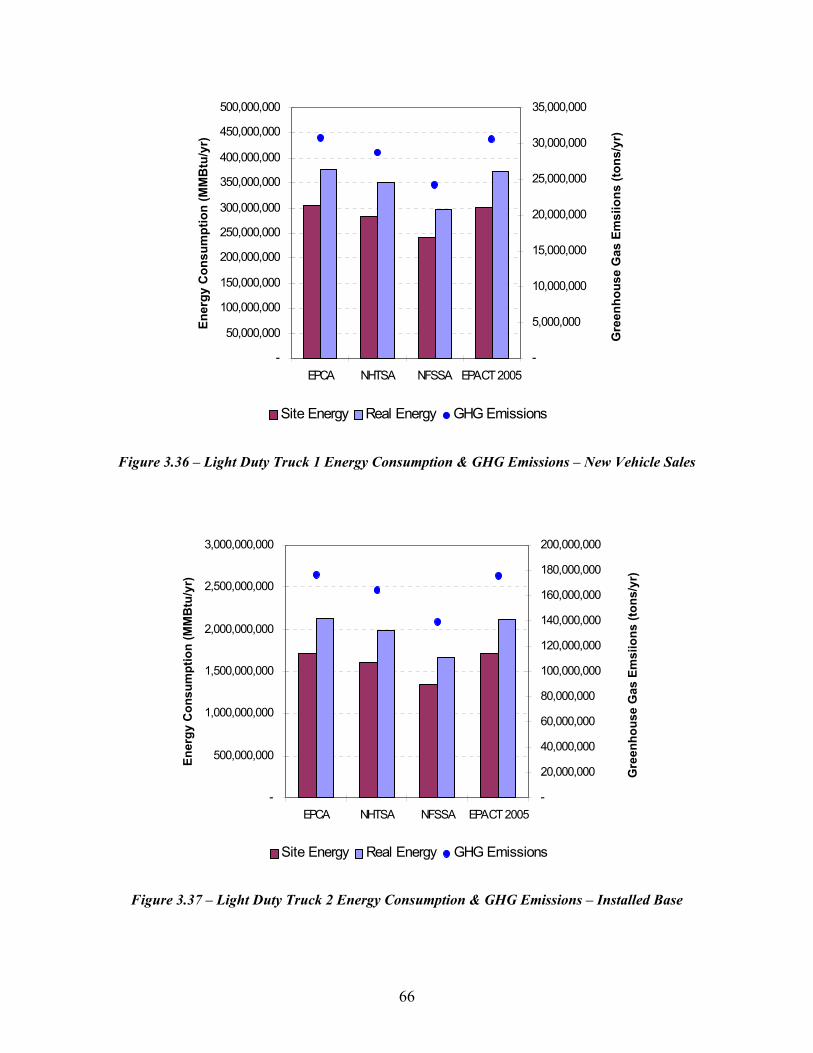
-
50,000,000
100,000,000
150,000,000
200,000,000
250,000,000
300,000,000
350,000,000
400,000,000
450,000,000
500,000,000
EPCA NHTSA NFSSA EPACT 2005
Ener
gy C
onsu
mpt
ion
(MM
Btu
/yr)
-
5,000,000
10,000,000
15,000,000
20,000,000
25,000,000
30,000,000
35,000,000
Gre
enho
use
Gas
Em
siio
ns (t
ons/
yr)
Site Energy Real Energy GHG Emissions
Figure 3.36 – Light Duty Truck 1 Energy Consumption & GHG Emissions – New Vehicle Sales
-
500,000,000
1,000,000,000
1,500,000,000
2,000,000,000
2,500,000,000
3,000,000,000
EPCA NHTSA NFSSA EPACT 2005
Ener
gy C
onsu
mpt
ion
(MM
Btu
/yr)
-
20,000,000
40,000,000
60,000,000
80,000,000
100,000,000
120,000,000
140,000,000
160,000,000
180,000,000
200,000,000
Gre
enho
use
Gas
Em
siio
ns (t
ons/
yr)
Site Energy Real Energy GHG Emissions
Figure 3.37 – Light Duty Truck 2 Energy Consumption & GHG Emissions – Installed Base
66

-
50,000,000
100,000,000
150,000,000
200,000,000
250,000,000
300,000,000
EPCA NHTSA NFSSA EPACT 2005
Ener
gy C
onsu
mpt
ion
(MM
Btu
/yr)
-
2,000,000
4,000,000
6,000,000
8,000,000
10,000,000
12,000,000
14,000,000
16,000,000
18,000,000
20,000,000
Gre
enho
use
Gas
Em
siio
ns (t
ons/
yr)
Site Energy Real Energy GHG Emissions
Figure 3.38 – Light Duty Truck 2 Energy Consumption & GHG Emissions – New Vehicle Sales
Of the vehicle energy efficiency programs evaluated, only the full implementation of the National Fuel Savings and Security Act of 2002 would result in a significant reduction in site or real energy consumption based on the current market share of dedicated and dual-fuel vehicles. Although it is likely that existing and proposed alternative fuel incentives will increase the market share of these vehicles, there is little in the way of market projections on which to accurately evaluate the impact on overall site and real energy consumption or associated greenhouse gas emissions.
Rather than continuing to provide tax incentives to producers of alternative fuels, which may or may not reduce energy imports or provide meaningful environmental benefits, it may be more advantageous to incorporate incentives for alternative fuel consumption within the CAFE standards by converting energy efficiency standards from site energy consumption to real energy consumption. For example, alternative fueled vehicles that operate exclusively on electricity must be plugged into the utility grid to recharge the onboard batteries. Depending on the generation resource mix and emissions profile of the local utility, this may or may not be a net benefit to our dependence on foreign energy imports or result in any improvement to the environment. Likewise, there have been numerous studies that call into question the full fuel cycle efficiency of ethanol-derived fuels, although it does provide an economic boost to the farming community. On the other hand, alternative fueled vehicles that operate on domestically produced compressed natural gas would appear to be a win-win proposition. In the end, whether or not including alternative fuel vehicles in the CAFE standards will have a measurable impact on energy consumption is highly dependent on the value proposition manufacturers can present to prospective buyers of such vehicles.
Although not necessarily a straightforward process, revising the existing incentive structure to reward the manufacture and operation of vehicles that have the smallest full fuel cycle impact on both energy consumption and the environment would seem to be beneficial. Using source rather than site energy consumption would be a critical part of the solution, however, other societal impacts such as reduced dependence on foreign oil, national security, a strong national economy and an improved environment should also be part of the equation.
67

4 POTENTIAL MARKET SHIFTS DUE TO THE ADOPTION OF REAL ENERGY EFFICIENCY POLICIES
4.1 Potential Market Shifts from the Adoption of Real Energy Policies
Market shifts can be anticipated if the metric for evaluating energy savings and emissions reductions is shifted from site energy to real energy since equipment manufacturers often encounter higher manufacturing costs when efficiency criteria are revised. GARD Analytics has been involved in four studies that looked at the impact of market shifts resulting from changes in federal energy efficiency policies or standards.
• An analysis performed by GARD Analytics for AGA assessed the impact of the New Energy Efficient Home Credit as proposed in 20031. The results suggest that, on average, energy costs are a reasonable proxy for real energy and, therefore, switching from energy cost to real energy efficiency cannot be expected to produce a significant market shift. In addition, the proposed tax credit levels appear to be too low to motivate homebuilders to alter current construction practices.
• A revised building energy code enacted in Minnesota in April 2000 that was expected to conserve energy in residences by reducing infiltration ended up increasing real energy consumption and greenhouse gas emissions by shifting the water heating market from natural gas to electric appliances.
• An analysis performed by GARD Analytics for the Gas Research Institute assessed the national differential impact on commercial building heating equipment choices of two different sets of building envelop criteria under consideration for incorporation into ASHRAE/IES Standard 90.1. The analysis indicated that implementation of one of the alternatives, a blended envelope criteria, would result in a market shift from gas-fired and electric heat pump heating systems to electric resistance heating systems resulting in 5% greater real energy consumption.
• An analysis performed by AGA in support of comments submitted to DOE’s Office of Energy Efficiency and Renewable Energy regarding the FY 2005 Priorities for the Appliance Standards Rulemaking Process. The analysis indicated that lack of updated efficiency standards for electric commercial water heaters has resulted in a market shift from gas-fired to electric water heaters and that this trend will continue unless action is taken.
The market shifts in each of these case studies is discussed in more detail on the pages that follow.
____________________________________
P
1P The term New Energy Efficient Home Credit as proposed in 2003 as used in this Section refers to a
provision in energy legislation that was first introduced into both houses of the U.S. Congress in 2003 but which had still not been approved or implemented at the time this analysis was completed. This bill with minor modifications was passed into law on August 8, 2005 as the Energy Policy Act of 2005.
68
4.1.1 New Energy Efficient Home Credit
Provisions of the New Energy Efficiency Home Credit and the projected impact on site/real energy consumption and greenhouse gas emissions are discussed in detail in Sections 2.3.1.8 and 3.2.1.2, respectively.
Since contractors will be motivated to minimize the out of pocket costs required to qualify for the tax credit, the potential for market shifts exists wherever there are significant cost discrepancies between alternative energy efficient properties. Our analysis focuses on the type of heating system selected by the homebuilder since this decision is impacted the greatest by the use of energy cost as the metric by which energy efficient homes will be qualified under this provision.
The cost premiums for qualifying for either the 30% or 50% tax credit2 can vary widely depending on the HVAC system and location of the new home. For the majority of states, the proposed legislation will actually require energy consumption savings in excess of the 20% and 30% reductions targeted since they have residential building codes less stringent than IECC 20003. Builders in these states will, therefore, face an increased burden to qualify for an energy credit. On the other hand, several states including California and Washington have residential energy codes that exceed IECC 2000 standards for most homes. Builders in these states will require energy consumption savings that are somewhat less than the 20% and 30% reductions targeted.
Figures 4.1 to 4.8 show the price premium for the energy efficient property that must be installed in a home built to conform to IECC 2000 built in eight geographically diverse locations in order to achieve 30% and 50% HVAC annual energy cost reductions, as required by the proposed legislation. Results are shown for three HVAC system configurations, with space heating provided by either an electric resistance furnace, an air-source heat pump or a natural gas-fired furnace. For each heating system, four scenarios are shown, cost premium with no tax credit, cost premium with a $1,000 credit, cost premium with a $1,250 credit and cost premium with a $2,000 credit. The latest draft of the proposed Energy Policy Act of 2003 under review in the House (H.R.6) provides for a $1,250 tax credit for a 30% home and a $2,000 credit for a 50% home, while the latest draft under review in the Senate (S.2095) provides for a $1,000 tax credit for a 30% home and a $2,000 credit for a 50% home. In each case, the minimum criteria was achieved with at least one-third of the total reduction achieved through building envelope upgrades as stipulated by some versions of the proposed Energy Policy Act of 2003 under consideration (refer to Section 2.3.1.8). Complete results are included in Appendix F.
____________________________________ 2 The IECC 2000 was the reference specified for the New Energy Efficient Home Credit as proposed in 2003. The Energy Policy Act of 2005 passed into law on August 8, 2005, which is the same bill with minor modifications, uses the later IECC 2003 as a reference point instead. However, the applicable provisions of this code are no more stringent than similar criteria contained in the IECC 2000.
3 Under EPACT 2005, a tax credit of $1,000 is available for manufactured homes that achieve a 30% reduction in annual heating and cooling costs relative to a reference home with 1/3 of reduction coming from envelope improvements. A tax credit of $2,000 is available for either site-built or manufactured homes that achieve a 50% reduction in annual heating and cooling costs relative to a reference home with 1/5 of reduction coming from envelope improvements.
69

10,000
-
1,000
2,000
3,000
4,000
5,000
6,000
7,000
8,000
9,000
30% H
VAC
50% H
VAC
30% H
VAC
50% H
VAC
30% H
VAC
50% H
VAC
Electric Furnace Heat Pump NG Furnace
Cos
t Pre
miu
m ($
)
Cost Premium w /o Credit
Cost Premium ($1,000 Credit)
Cost Premium ($1,250 Credit)
Cost Premium ($2,000 Credit)
Figure 4.1 – First Cost Premium Required to Qualify for the New Energy Efficient Home Credit -Single Family Home in Atlanta, GA
-
1,000
2,000
3,000
4,000
5,000
6,000
7,000
8,000
9,000
10,000
30% H
VAC
50% H
VAC
30% H
VAC
50% H
VAC
30% H
VAC
50% H
VAC
Electric Furnace Heat Pump NG Furnace
Cos
t Pre
miu
m ($
)
Cost Premium (w/o Credit)Cost Premium ($1,000 Credit)Cost Premium ($1,250 Credit)Cost Premium ($2,000 Credit)
Figure 4.2 – First Cost Premium Required to Qualify for the New Energy Efficient Home Credit -Single Family Home in Boston, MA
70

-
1,000
2,000
3,000
4,000
5,000
6,000
7,000
8,000
9,000
10,000
30% H
VAC
50% H
VAC
30% H
VAC
50% H
VAC
30% H
VAC
50% H
VAC
Electric Furnace Heat Pump NG Furnace
Cos
t Pre
miu
m ($
)
Cost Premium (w/o Credit)Cost Premium ($1,000 Credit)Cost Premium ($1,250 Credit)Cost Premium ($2,000 Credit)
Figure 4.3 – First Cost Premium Required to Qualify for the New Energy Efficient Home Credit -Single Family Home in Chicago, IL
-
1,000
2,000
3,000
4,000
5,000
6,000
7,000
8,000
9,000
10,000
30% H
VAC
50% H
VAC
30% H
VAC
50% H
VAC
30% H
VAC
50% H
VAC
Electric Furnace Heat Pump NG Furnace
Cos
t Pre
miu
m ($
)
Cost Premium (w /o Credit)
Cost Premium (w / $1,000 Credit)
Cost Premium (w / $1,250 Credit)
Cost Premium (w / $2,000 Credit)
Figure 4.4 – First Cost Premium Required to Qualify for the New Energy Efficient Home Credit -Single Family Home in Dallas, TX
71

-
1,000
2,000
3,000
4,000
5,000
6,000
7,000
8,000
9,000
10,000
30% H
VAC
50% H
VAC
30% H
VAC
50% H
VAC
30% H
VAC
50% H
VAC
Electric Furnace Heat Pump NG Furnace
Cos
t Pre
miu
m ($
)
Cost Premium (w /o Credit)
Cost Premium ($1,000 Credit)
Cost Premium ($1,250 Credit)
Cost Premium ($2,000 Credit)
Figure 4.5 – First Cost Premium Required to Qualify for the New Energy Efficient Home Credit -Single Family Home in Denver, CO
-
1,000
2,000
3,000
4,000
5,000
6,000
7,000
8,000
9,000
10,000
30% H
VAC
50% H
VAC
30% H
VAC
50% H
VAC
30% H
VAC
50% H
VAC
Electric Furnace Heat Pump NG Furnace
Cos
t Pre
miu
m ($
)
Cost Premium (w /o Credit)
Cost Premium ($1,000 Credit)
Cost Premium ($1,250 Credit)
Cost Premium ($2,000 Credit)
Figure 4.6 – First Cost Premium Required to Qualify for the New Energy Efficient Home Credit -Single Family Home in New York, NY
72

-
1,000
2,000
3,000
4,000
5,000
6,000
7,000
8,000
9,000
10,000
30% H
VAC
50% H
VAC
30% H
VAC
50% H
VAC
30% H
VAC
50% H
VAC
Electric Furnace Heat Pump NG Furnace
Cos
t Pre
miu
m ($
)
Cost Premium (w /o Credit)
Cost Premium ($1,000 Credit)
Cost Premium ($1,250 Credit)
Cost Premium ($2,000 Credit)
Figure 4.7 – First Cost Premium Required to Qualify for the New Energy Efficient Home Credit -Single Family Home in Phoenix, AZ
-
1,000
2,000
3,000
4,000
5,000
6,000
7,000
8,000
9,000
10,000
30% H
VAC
50% H
VAC
30% H
VAC
50% H
VAC
30% H
VAC
50% H
VAC
Electric Furnace Heat Pump NG Furnace
Cos
t Pre
miu
m ($
)
Cost Premium (w/o Credit)Cost Premium ($1,000 Credit)Cost Premium ($1,250 Credit)Cost Premium ($2,000 Credit)
Figure 4.8 – First Cost Premium Required to Qualify for the New Energy Efficient Home Credit -Single Family Home in Seattle, WA
73

All of the cities analyzed were able to meet both the 30% and 50% energy cost reduction criteria, regardless of the space heating system selected. The cost premium of the HVAC and HVAC equipment upgrades required to qualify for either the 30% or 50% home tax credit was highly dependent on the type of space heating system selected. The incremental cost to achieve the 30% energy cost reduction criteria was the lowest for homes heated with air source heat pumps in five of the eight cities evaluated, while in the remaining three cities the cost premium was the lowest for homes heated with natural gas-fired furnaces. The cost premium is typically significantly higher for homes with electric resistance furnaces since these systems are effectively 100% efficient, resulting in fewer opportunities for reducing HVAC operating costs. Depending on the location and space heating system selected, the tax credit covered from 12 to 48% of the additional costs required to achieve the 30% energy cost reduction.
The incremental cost to achieve the 50% energy cost reduction criteria was the lowest for homes heated with air source heat pumps in six of the eight cities evaluated, while in the remaining two cities the cost premium was the lowest for homes heated with electric resistance furnaces. Achieving this level of energy efficiency required the use of more sophisticated building techniques, specifically the use of aerosol duct sealing to achieve virtually leak-free distribution systems and tightening the building envelope to achieve an infiltration rate of no greater than six air changes at a pressure of 50 Pascal. Depending on the location and space heating system selected, the tax credit covered from 20% to 67% of the additional costs required to achieve the 50% energy cost reduction.
At first glance, the advantage of specific HVAC systems in some locations would impact homebuilders’ equipment purchasing decisions. However, given the proposed credit levels, there seems to be little economic incentive for the homebuilder to participate in the program since the tax credits are not sufficient to cover the actual cost premiums incurred.
4.1.2 2000 Minnesota Energy Code
In April 2000, the State of Minnesota revised its building energy code making it one of the most stringent in the nation at the time (see sidebar). With the revision came restrictions with regards to types of combustion appliances that would be allowed in new residences. The energy code requires that most new detached single-family and two-family dwellings with gas furnaces, water heaters or fireplaces have direct vent, power vent or sealed combustion equipment. The additional cost of purchasing and installing combustion appliances with these features put gas appliances at a disadvantage and allowed electric utilities within the CenterPoint Energy service territory to increase their water heater market share.
Prior to the adoption of the 2000 Energy Code, gas-fired water heaters enjoyed dominant market share in Minnesota because they provide an economical, clean and reliable source of hot water. The hot water needs of a typical home can easily be served by a 40-gallon natural draft (atmospheric) water heater that is:
• Economical to install and operate
• Reliable with little or no maintenance or repair required over its 10 - 12 year service life
• Provides more than adequate quantities of hot water during periods of high demand due to quick recovery times.
Since the enactment of the 2000 Minnesota Energy Code, however, there has been a decrease in the number of gas water heaters being installed in new residences in favor of electric water heaters. The new energy code, as revised by the Minnesota legislature, requires that most new single-family residences having non-solid fuel appliances such as gas water heaters to install direct vent, power vent or sealed
74

2000 Minnesota Energy Code
In 1991, the Minnesota State Legislature passed a law mandating that Minnesota have the most stringent energy code in the nation.
Under the 2000 Minnesota Energy Code, new residential construction must adhere to one of two compliance paths, referred to as Option A and Option B. Both options have requirements applicable to water heating appliances.
• Option A requires gas-fired service water heating systems to utilize direct vent, power vent, or sealed combustion appliances.
• Option B has four distinct prescriptive paths plus a performance path that a contractor can select from in designing and building a new house.
Depending on the compliance path chosen, a sealed combustion, a direct or power vented, or an atmospherically vented appliance can be used. However, in order to design a service water heating system with an atmospherically vented appliance the design must also meet other criteria including a carbon monoxide (CO) alarm, balanced occupancy and supplemental ventilation systems, and power make-up air to laundry and kitchen areas matched to mechanical exhaust from those areas.
The mechanical ventilation provisions required by the new code are in three parts: ventilation air quantity, equipment, and system design and installation. The requirement for fan-powered supply of outdoor air is 0.05 cfm/sq. ft. of floor area or 15 cfm per bedroom plus an additional 15 cfm, whichever is greater. This rate is intended for continuous operation whenever the house is occupied.
combustion equipment. This new requirement along the mandatory installation of mechanical ventilation was implemented to reduce the perceived hazards of depressurization in new homes and alleviate safety concerns of possible backdrafting of flue gases from combustion appliances. The cost of installing gas water heaters in new residences therefore increased causing the market share for new residential gas water heaters (including multi-family dwellings) to fall. To illustrate this point, the service territory for CenterPoint Energy fell from the traditional level above 90% to below 76%. (CenterPoint 2001)
Shortly after the enactment of the 2000 Minnesota Energy Code electric co-ops serving portions of CenterPoint’s service territory introduced incentives for homebuilders to specify electric water heaters for their new developments. One of the co-ops, Dakota Electric, was basically giving away 110-gallon Marathon water heaters along with controls that limited operation to off-peak billing periods. This undoubtedly contributed to the market shift from gas to electric appliances. In the opinion of Angela Kline, Conservation Projects Manager at CenterPoint Energy, the gas market share decrease from 92% in 1999 to 85% in 2000 was probably due primarily to the new energy code, whereas the further decrease to 76% by 2001 was probably due to the combined impact of the energy code and electric utility incentives. Curiously, even though the co-ops have continued to provide generous incentives to contractors to install electric water heaters, the market share for gas water heaters has stabilized and even increased as of late - up to 81% in 2003. (CenterPoint 2005)
The shift in use from gas to electric water heaters in Minnesota and the resultant increase in electric demand on generating plants is creating unintended consequences that were either unforeseen or overlooked by energy legislators and code officials when they enacted the 2000 Minnesota Energy Code.
75

Texas Water Heater Rulemaking
In order to comply with federal mandates, states may consider energy regulations whose main objectives could be met by site analysis but not if the full fuel cycle is considered. For example, in an effort to meet NOX limits set by the National Ambient Air Quality Standards (NAAQS) established under the Federal Clean Air Act of 1999, the Texas Commission on Environmental Quality proposed new revisions to the Texas Administrative Code concerning water heaters, boilers, and process heaters.
These revisions were proposed in order to reduce NOBXB emissions from new natural gas appliances sold and installed in Texas. It is the belief of the commission that the proposed rules are a necessary and essential component of a control strategy to demonstrate attainment with the NAAQS for ground-level ozone.
The implicit assumption by the commission is that no fuel switching will take place during this implementation period – that effectively the entire new construction and replacement market for natural gas-fired water heaters will shift to natural gas-fired units that meet the new emissions criteria for NOBXB. This assumption is seriously flawed for the following reasons:
• No complying gas-fired residential water heaters are currently available nor are expected to be available prior to enactment of the rulemaking,
• If and when these water heaters become available, gas-fired water heaters manufactured to comply with the rulemaking are expected to carry a substantial cost premium, and
• The market for residential water heaters is extremely competitive and demand for natural gas-fired water heaters will shift to readily available lower cost substitutes.
An analysis of the impacts of the rulemaking confirmed that if the new criteria were to be enacted before low-NOBXB units become widely available, homebuilders and consumers would switch to lower cost electric resistance water heaters. This market shift will cause overall Nemissions from residential water heaters to increase contrary to the stated objectives of the rulemakingin addition to higher costs to consumers and overincreased energy cons
OBXB
all
umption.
These include:
• Increased homeowner operating costs for domestic water heating equipment
• Increased net energy usage as measured on a real energy basis
• Increased electric generating plant atmospheric emissions of COB2B, SOB2B, NOBXB and mercury
• Potential decrease in reliability of meeting Minnesota’s future demands for electricity due to increased demand for electricity on already limited electric generating capacity
Some of these impacts quantified for a typical residential water heater installation in CenterPoint Energy’s service territory (Refer to Appendix A). These results indicate that:
• Electric water heaters cost as much as $185 more to operate annually than gas water heaters
• Electric water heaters consume as much as 2.3 times more energy than gas water heaters for equivalent hot water delivery as measured from the source or over the full fuel cycle
• Greenhouse gas emissions like COB2B attributable to electric water heater operation are more than 3 times greater than for gas water heaters
• Atmospheric air pollutant emissions increase dramatically when electric water heaters rather than gas water heaters are used
- More than 1000 times more SOB2
- More than 4 times more NOBXB
- Levels of mercury (Hg) emissions from coal-fired generation plants increase due to greater demand for electricity whereas gas-fired water heaters produce no mercury emissions.
76

4.1.3 ASHRAE/IES Standard 90.1-1999
A dual envelope standard was released as part of the first public review draft of BSR/ASHRAE/IESNA 90.1-1989R entitled Energy Code for Buildings Except Low-Rise Residential Buildings in March 1996. This draft of the standard contained envelope criteria which differentiated between electric resistance heated buildings and buildings heated by other means. The more stringent envelope criteria for electric resistance heated buildings was justified by the cognizant ASHRAE committee on the basis of rigorous life cycle cost analyses which used national average costs for electricity and natural gas. Subsequent to the close of the public review period, in March 1997 the ASHRAE 90.1 committee approved another draft of the revised standard that proposed a single set of envelope criteria for all buildings based on a single blended cost for heating energy. The resultant blended heating energy cost used by the Standard 90.1 committee was higher than national average natural gas cost used for the first public review of the revised standard. The single set of envelope criteria developed based on the blended cost raises the envelope thermal standard for gas heated and electric heat pump heated buildings and lowers the envelope thermal standard for resistance-heated buildings.
A report was prepared by Optima Consulting Services (Optima 1997) to assess the differential impact on commercial building heating equipment choices of two alternative building energy draft standards proposed by ASHRAE which contain different building envelope criteria: ASHRAE 90.1-1989R with envelope criteria based on a blended electric and gas heating energy cost (blended envelope criteria) and ASHRAE 90.1R with separate envelope criteria for electric resistance heated buildings and buildings heated by other means (dual envelope criteria).
-
5,000
10,000
15,000
20,000
25,000
30,000
35,000
40,000
45,000
Heat Pump Resistance Gas Other
Bill
ions
of B
TUs
Dual Std. Blended Std.
Figure 4.9 - Commercial Heating Service Demand Real Energy Consumed
77

The report concluded that use of the blended envelope criteria instead of the dual envelope criteria:
• Increases electric resistance heated floorspace from 17% to 22% of total commercial floorspace (new and retrofit)
• Increases overall real energy consumption by 5% nationwide
• Increases overall national energy costs by 10%
• Increases total costs including energy, equipment and envelope by 3%
As a result, the dual envelope criteria leads to a more efficient allocation of energy resources – the same level of service demand is satisfied at a lower cost using less gross energy. Further, to the degree to which equipment choices are constrained to be within the same fuel categories on behavioral grounds, increases in the resistance heating market share under the blended criteria are made principally at the expense of electric heat pumps.
4.1.4 DOE Appliance Standards Rulemaking Process
DOE is required to set priorities for appliance efficiency rulemaking under Appliance Rulemaking Process Improvement Plan under 10 CFR 430. The criteria that DOE must consider in developing priorities and establishing schedules for rulemakings include potential energy savings, potential environmental or energy security benefits, and evidence of energy efficiency gains in the market absent new or revised standards. Based on these criteria, DOE is obligated to establish rulemaking priorities that secure benefits of energy efficiency over the full fuel cycle and emissions reductions. AGA recently submitted comments to DOE regarding the FY2005 arguing that consideration of minimum efficiencies for electric commercial water heaters should be reclassified as a high priority. A summary of those comments follows.
4.1.4.1 Potential Energy Savings
Potential energy savings over the full fuel cycle is the only meaningful calculation of energy savings in the U. S. economy since site-based consumer savings are captured in other criteria (e.g., potential economic benefits). DOE could focus its prioritization on standards actions that are likely to produce the highest levels of potential energy savings based on energy usage over the full fuel cycle. Unfortunately, it appears that DOE balances this consideration with other factors, including site based energy savings.
4.1.4.2 Evidence of Energy Efficiency Gains
DOE only addresses federal, state, and utility sponsored non-regulatory initiatives in characterizing changes “absent new or revised standards.” Completely lacking is an attempt to capture relevant market changes absent of regulatory or public policy initiatives. The importance of including this consideration is paramount where it is known that improvements in equipment efficiencies are being pulled into the stock of installed appliances by market conditions without federal intervention and where implementation of new minimum efficiencies require long timetables.
4.1.4.3 Rulemaking Priorities
Minimum efficiencies for electric commercial water heaters are currently mandated by the EPCA and based upon ASHRAE 90.1-1989 rather than ASHRAE 90.1-1999 criteria. DOE determined that the minimum efficiency for electric commercial water heaters in ASHRAE 90.1-1999 would increase energy consumption relative to the standard in the EPCA. Under these circumstances, DOE cannot adopt the new level, since EPCA stipulates that the standards it contains cannot be relaxed” (66 FR 3350). Without standards action on these products, no consideration of changes to the minimum efficiencies of electric
78

commercial water heaters will have been considered since the passage of the EPCA. Without further action by DOE, the current bias in favor of electric commercial water heating will continue and fuel switching from natural gas to electric water heating will remain a bias in the market. As shown below (Table 4.10), shipments data for commercial water heaters shows steady market share growth in favor of electric commercial water heaters at the expense of gas commercial water heaters, particularly since the promulgation of the EPCA. Without the adoption of higher minimum efficiencies for gas water heaters (and without similar increases for electric water heaters), this trend is expected to continue. The result from this market shift is an increase in real energy consumption and greenhouse gas emissions.
0
20000
40000
60000
80000
100000
120000
140000
1991 1992 1993 1994 1995 1996 1997 1998 1999 2000 2001 2002 2003
Year
Uni
ts
GASELECTRIC
Figure 4.10 - Commercial Water Heater Shipments
79
5 POTENTIAL BARRIERS TO REAL ENERGY EFFICIENCY POLICIES
The development of government energy policy must accommodate a variety of viewpoints. This political process allows for factors other than cost, emissions, and energy use to influence regulations. Any changes to energy policy must be able to overcome political barriers.
Efficiency standards make sense when high-efficiency products are readily available or can be readily produced and are cost-effective to end-users. When other factors, such as peaking energy resources, dependence on foreign suppliers and the quality of the environment, are introduced into the equation, basing those standards on source rather than site energy efficiency seems inherently logical. But due to a number of barriers, the path of energy policy has, generally, not been in that direction. These barriers include:
• Political
• Legal
• Market
• Technical
• Economic
A more detailed discussion of each of these barriers follows.
5.1 Political Barriers
5.1.1 Conflicting Interests of Stakeholders
DOE received over 1,800 comments totaling 40,000 pages after publishing the Weighting Factors Technical Support Document for Notice of Proposed Rulemaking on Energy Performance Standards for New Buildings in 1979. The comments included technical and other substantive criticisms of the performance standard. Among these were numerous comments on whether the roughly 3:1 weighting of electricity versus fossil fuel consumption reflected the relative worth of these forms of energy. This historical fact is a strong indication of the highly politicized nature of the site energy versus real energy debate. Stakeholders in this debate include the electric and natural gas utilities, environmental groups, equipment manufacturers, professional designers, contractors and consumers. All of these stakeholders have active lobbyists representing their positions on Capitol Hill. The best hope for overcoming this barrier is alliances between multiple stakeholders that share compatible views. For example, on the issue of source versus site energy, the gas industry might be able to effectively team with representatives of environmental groups, equipment manufacturers and consumer organizations.
In the case of the transportation sector, tax incentives allow ethanol to be priced to compete with substitute fuels. The presumption is that without the incentives, ethanol fuel production would largely discontinue. The value of the tax incentives is shared among different groups in the economy, including alcohol fuel blenders, ethanol producers, and corn farmers. The tax incentives effectively lower the blenders’ after-tax cost of using ethanol when they mix ethanol with gasoline. Ethanol producers and corn farmers share in the value of the incentives because the blenders’ increased demand for ethanol increases the prices and sales of the products of these groups. The primary argument for providing tax incentives to ethanol producers is that it will decrease reliance on foreign oil imports and improve the quality of the environment. Although available evidence suggests that the tax incentives for alcohol fuels
80

increase ethanol fuel use, it also indicates that these incentives do not significantly reduce petroleum imports. These arguments, while made when gasoline prices were much lower, are still valid due to the substantial consumption of fossil fuels during the production of ethanol, including harvesting the grain, converting it into ethanol and transporting it to blenders. In addition, available evidence indicates that the ethanol tax incentives have had little effect on the environment. Despite the lack of evidence that ethanol incentives provide any benefits, these programs continue due to political considerations.
5.1.2 Lack of Funding
Many federal programs were never implemented as planned. Major programs were targeted for elimination, experienced massive budget cuts, suffered delays, or were simply never implemented. Many of these changes stemmed from specific federal policy changes exerted by the administration in the 1980s. Several federal programs initiated in the late 1970s and early 1980s had been in operation only a few years before they were scaled back (or eliminated) by shifts in federal political priorities.
Despite major successes in building and other energy technology R&D in the late 1970s and early 1980s, the DOE- conservation R&D budget was severely cut in the 1980s. These cuts stemmed from a major federal R&D policy change introduced by the Reagan administration, which advocated a shift toward private sector funded R&D. As a result, DOE conservation R&D budget requests were lower than the actual budgets authorized by Congress during fiscal years 1983 through 1990. In fiscal year 1983, the administration’s conservation R&D budget request for buildings, industrial, and transportation activities was zero. Congress continued funding these conservation programs but at levels far below the 1979 to 1981 fiscal years. (OTA 1992)
5.2 Legal Barriers
5.2.1 Current Federal Law
Energy use is defined in legislative language only once, in policy regulating development of test procedures for measuring efficiency of consumer appliances. Current federal law (42 USC 6291(4)) defines energy use as, “…the quantity of energy directly consumed by a consumer product at point of use…” Unfortunately, this language has been interpreted as THE definition for energy use in all instances: a misapplication that is probably an oversight. Congress had repeatedly urged conservation of our natural resources. However, policy and regulation continue to rely on this 1975 definition of energy policy that was meant to merely ensure equitable measurement of the efficiency in end use equipment. The broad interpretation and use of this definition may need to be reconsidered to reach a real energy efficiency approach.
5.2.2 Legal Action
Legal actions may be taken to prevent a new energy efficiency program from taking effect. Indeed, it is not uncommon when new rulemakings are enacted for trade organizations or equipment manufacturers to perceive some provisions to be discriminatory.
An instance of this occurred when the Gas Appliance Manufacturers Association (GAMA) filed a lawsuit against DOE and ASHRAE regarding minimum electric service water heater requirements in ASHRAE Standard 90.1-1999. In February 2001, GAMA brought suit in the United States Court of Appeals for the 4th Circuit challenging the water heater efficiency standards. At the same time, GAMA filed a petition for reconsideration with DOE, asking DOE to weaken the standards voluntarily. NRDC vigorously opposed both efforts to strike down and weaken the standards. In March, NRDC was granted permission to intervene in the 4th Circuit case to defend the water heater standards. In April 2001, DOE turned down
81

GAMA’s petition for reconsideration after which GAMA voluntarily dismissed its 4th Circuit lawsuit challenging the standards.
Lawsuits have also been used when energy efficiency programs have been withdrawn or delayed. For example, during the late 1970’s DOE had been directed to develop mandatory appliance efficiency standards for 13 categories of new products under NAECA. DOE proposed standards for 8 of the 13 covered products in June 1980. The following January, DOE notified Congress that the new appliance standards were essentially complete. Arguing that standards were neither economically justified nor likely to result in significant energy savings, DOE actually promulgated the proposed “no standards” standards through rulemakings for eight of the covered products in late 1982 and 1983. This prompted the filing of a citizen suit in late 1983 in the U.S. Court of Appeals for the District of Columbia Circuit. The suit challenged the “no standards” standards as contrary to law. Agreeing with the petitioners, the Court voided the DOE rules in July 1985 as arbitrary and capricious interpretations of the law and directed DOE to initiate a new rulemaking. (OTA 1992)
5.3 Market Barriers
Even though high-efficiency products are readily available and are cost-effective to end-users due to a number of market barriers, many consumers and businesses are purchasing less efficient products. These market barriers include:
• Uninformed decision-makers
• Third-party decision-makers (“split incentive”)
• Financial
Each of these barriers is discussed in more detail below.
5.3.1 Uninformed Decision-Makers
Many purchasers and end-users underestimate the amount of real energy consumption and the associated environmental impacts of operating buildings, appliances and vehicles. Very often, they are not even aware that different models with similar site efficiency can consume significantly different amounts of real energy and that buying some products can lead to real energy reductions. The energy end-user can hardly be faulted for this situation. Mass media journalists use the term energy efficiency to mean site energy efficiency almost exclusively. Even with those products marketed as clean or environmentally friendly, the issue of real energy consumption is generally not emphasized. Yet there is clearly a demand for products that have a smaller impact on the environment.
EnergyGuide
Although the EnergyGuide labeling program has been a centerpiece of U.S. appliance efficiency policy, there has not been a definitive study to demonstrate the labels’ effectiveness. Several studies have raised questions about the effectiveness of the label and consumers’ ability to accurately comprehend its content.
A California utility conducted group interviews and found out that about half of the participants “severely misunderstood” the information presented on the federal EnergyGuide appliance labels.
A study by the Bonneville Power Administration concluded that the EnergyGuide labels are not a very convenient way for consumers to identify energy-efficient models and that the labels are therefore “not particularly effective in specific purchase decisions.” (duPont 1998)
Even when the decision-maker is aware of variations in real energy efficiency, often he/she is too busy to research the ramifications of a decision, or information on high real energy efficiency products is not readily available. In the commercial/industrial sector, many purchasing decisions are made by a purchasing department or maintenance staff who are unfamiliar with the relative efficiencies and operating costs of the equipment they purchase, much less the real energy efficiency and associated environmental impacts. 82
5.3.2 Third-Party Decision-Makers (“Split Incentive”)
Many times the decision-maker (e.g., developer or landlord, purchasing department, etc.) is responsible for purchasing buildings, vehicles or equipment but someone else (e.g., tenant, operating department, store owner, etc.) is responsible for paying the energy bills. Traditionally, the purchaser tends to buy the least expensive equipment because s/he receives none of the benefits from improved equipment efficiency. However, while that may hold true when energy efficiency is measured at the site it is not necessarily true when energy efficiency is measured at the source. As a society, we all benefit from a cleaner environment and reduced dependence on foreign energy. As a result, many businesses have adopted sustainability as a cornerstone of their corporate mission. For the business community, sustainability is more than mere window-dressing. By adopting sustainable practices that are valued by consumers, companies can gain competitive edge, increase their market share, and boost shareholder value. Corporate environmental and social performance is now seen as an important business issue that needs to be evaluated against other competing strategic business decisions. As this ethos trickles down through the organization the split incentive starts to disappear.
5.3.3 Financial
5.3.3.1 Financial Procedures
Financial procedures traditionally emphasize initial costs over operating costs. It is very common that accounting processes in the commercial and industrial sectors closely scrutinize capital costs and tend to favor purchase of inexpensive equipment while operating costs are generally not scrutinized as closely. Furthermore, when operating costs are reduced, the savings typically show up in a corporate-level account and are rarely passed on to the department that made the decision and the investment. This diversion of benefits discourages energy-saving investments. When operating costs are taken into account, only the energy costs reflected on actual invoices are considered. Although it is recognized that there are societal costs associated with energy choices, these costs are seldom internalized by the buyer.
The price of energy does not reflect all the costs society pays. For example, pollution is a major hidden cost of electricity generation. EPA estimates acid rain pollutants, cause more than $12 billion per year in damage nationwide, much of it due to coal- and oil-fired power plants. Uncertainty can also lead to enormous societal costs. Energy conservation investments could help reduce utility SOB2B emissions 50% while lowering utility bills, according to a study by the American Council for an Energy-Efficient Economy. Energy efficiency is increasingly recognized as a low-cost, low-risk resource option, with far fewer societal costs than supply-side options. Research further supports energy efficiency as an indispensable component of least-cost acid rain clean-up programs. Over $20 billion has been wasted when partially constructed power plants have been abandoned because of reduced utility demand, unforeseen exorbitant cost overruns and improved, more costly, safety regulations. (CPA 1993)
Some examples of specific monetary values assigned to these societal costs include the following:
• The Northwest Power Planning Council provides a 10% bonus to efficiency options over all other supply resources.
• Wisconsin Public Service Commission provides a 15% "noncombustion credit" rewarding options that avoid the emission of greenhouse gases, water pollution and landfills. The commission also directs Wisconsin utilities to factor into their least-cost plans the external social, political and environmental costs "not easily expressed in dollars."
83

• Nevada has adopted, and Massachusetts is adopting, "shadow pricing mechanisms" which assign specific dollar values to various air pollutants. The environmental cost of a new coal-fired power plant is about 4.4 cents per kWh -- with COB2B emissions accounting for nearly half the cost.
• The New York Public Service Commission has established the first surcharge structure in the nation to incorporate the societal costs of air pollution, water pollution, land use and other impacts. It will include a 1.4 cent per kWh surcharge in the competitive bidding programs of New York's electric utilities.
5.3.3.2 Market Structure
The market structure barrier refers to product supply decisions made by equipment manufacturers. This barrier suggests that certain powerful firms may be able to inhibit the introduction by competitors of energy-efficient, cost-effective products. Evidence for the contention that market power has led to imperfect competition, while frequently cited informally, has not been developed systematically in the literature (LBNL 1996). Conceptually, since different manufacturers are competing for market share, if a manufacturer voluntarily increases efficiency, the small increases in retail cost to improve the efficiency of the product could adversely affect the business if there is little end-user demand for efficient products.
Of greater relevance to the issue of site versus source efficiency is the ability of various market segments to adapt to the new paradigm. A manufacturer whose product line is limited to electric resistance appliances for example cannot improve site efficiency since electric resistance is effectively 100% efficient already. On the other hand, the manufacturer is at the mercy of the local electric utility to improve source efficiency, since for an electric appliance this is largely a matter of the generating mix used by the utility. In reality, however, most major manufacturers of appliances and vehicles maintain a broad product mix that could provide them with the flexibility to adapt to a changing regulatory environment. For example, all major manufacturers of electric resistance water heaters also manufacture similar fossil fuel-fired appliances; the major manufacturers of conventional gasoline powered vehicles are also taking the lead in the development of alternative fuel and hybrid vehicles; and designers of conventional buildings have access to the tools necessary to incorporate energy efficiency elements into their design. On the other hand, the small manufacturer who has a very narrow product mix and does not have the resources to rapidly adapt to changing markets may be at a disadvantage.
Recognizing this situation, DOE is obligated to follow the following Procedures for Consideration of New or Revised Energy Conservation Standards for Consumer Products to insure that proposed efficiency standards are not anticompetitive. This procedure consists of the following steps:
1. In the very early stages of standard development, DOE will consider adverse impacts of design options on consumer utility and will identify other possible impacts on consumers of updated efficiency standards which may warrant closer examination during the standards development process.
2. DOE will determine, on the basis of any information submitted during the standard development process, whether a proposed standard is likely to result in the unavailability of any covered product type with performance characteristics, features, sizes, capacities, and volumes that are substantially the same as products generally available in the U.S. at the time. Consistent with EPCA, DOE will not promulgate a standard at a level where it concludes that it would result in such unavailability.
84
3. The Department will consider the views of the Department of Justice on any impacts of a proposed standard on competition, and will not issue a standard determined to have significant anticompetitive impacts.
4. The Department will use regional analysis and sensitivity analysis tools, as appropriate, to evaluate the potential distribution of impacts of candidate standards levels on consumers. The Department will consider impacts on significant segments of society in determining standards levels. Where significant subgroups would be expected to bear significant adverse impacts, DOE will place increased emphasis on voluntary programs to bring about additional potential energy savings.
5. If the Department or the Department of Justice determines that a candidate standard level would have significant anticompetitive effects, that standard level will be presumed not to be economically justified unless the Department determines that specifically identified expected benefits of the standard would outweigh this and any other expected adverse effects.
(DOE 1996)
The building development process organizes the various industry groups and market actors to produce a building product that responds to capital, land, and user requirements. For the most part “upstream” actors constrain the choices and actions of “downstream” actors. In general, as decisions about building form are made upstream by developers and financiers about budgets, location, revenues, target markets, and so forth, downstream participants are increasingly constrained in their options concerning content—what designs and technologies will be implemented and what services will be rendered. In this sense, each input structures the alternatives of subsequent participants. Consequently, as a project moves from conceptualization, to financing, to design, and finally to construction, choice becomes increasingly constrained. Given the structure of the building market and the nature of building industry interests, it is clear that increasing the energy efficiency of buildings is of little value to the building industry. In terms of the parameters important to the building industry, buildings are energy efficient. There is really no value to the building industry in making buildings more energy efficient—it is risky. The perceived market risks of doing energy efficiency are much greater than any potential benefits. Current industry views about energy efficiency constrain the ability to produce buildings that are more energy efficient. Historical approaches for encouraging the development of more energy efficient buildings have failed to effectively link to issues and standards important to the building industry. This limits the potential for creating transformation in the market towards greater energy efficiency. (CIEE 1998)
5.4 Technical Barriers
5.4.1 Advanced Metering Requirements
Reluctance to quantify energy efficiency in terms of real energy is based on the added complexity of collecting the requisite information at the point of use. Traditional meters measure the flow of energy at the building site or as an input into an appliance or vehicle.
However, recent advances in metering, information and communications technology have opened up new possibilities for improving energy efficiency and increasing the use of renewable energy sources. Use of technological resources such as the Internet and advanced meters can allow real-time trading of ‘green’ energy certificates, which guarantee that a specific percentage of power is generated from renewable energy sources.
Examples of the available technologies that will have a positive impact on demand management are real-time meters, which would allow users to know the price and environmental impact of the electricity they are using; intelligent appliances and equipment, which would allow energy savings to be maximized; and buildings designed to minimize energy use and maximize the well being of the occupants.
85
The evolution of power line communication and automated data collection (ADC) technology for energy management has permitted automatic meter reading (AMR) solutions to become highly competitive. Today these solutions are not only capable of guaranteeing the automatic reading of consumption; they also have the ability to offer the domestic user new services necessary for optimizing energy consumption and respecting the environment. (Bertoldi 2003)
Pacific Gas and Electric Company (PG&E) has recently applied for regulatory approval to begin a five-year effort to install advanced meters for all of its gas and electric customers. The technology, known as advanced metering infrastructure, or AMI, will improve customer service and provide operational savings through increased efficiencies. AMI will also allow customers to take advantage of prices that vary by time of day – potentially realizing cost savings by shifting use from peak to off-peak. Currently, more than a dozen U.S. utilities have or are moving towards deployment of AMI technology. (PG&E 2005)
5.4.2 Lack of Appropriate Measurement and Verification Protocols
As part of an ongoing assessment of U.S. energy efficiency trends and opportunities, the Office of Technology Assistance concluded that while federal efforts to reduce energy use in buildings have led often to significant and cost-effective energy savings, inappropriate performance measures and a lack of ongoing evaluation have prevented many of them from attaining the full range of cost-effective energy savings available. In fact, the authorizing legislation that establishes building efficiency programs often fails to focus on the promotion of cost-effective energy savings.
As an example of this predicament, the OTA cites the Tax Act of 1980, which was enacted to encourage residential energy conservation and renewable energy investments. There are no reliable determinations of the economic costs and benefits of the ETA residential conservation credits. A variety of policy and market changes were working simultaneously to motivate conservation investments in the residential sector. As a result, determining the incremental effect of the federal tax credits on residential energy investments has been elusive. By reducing consumer first costs for conservation and renewable investments, the credits clearly created social benefits but at undetermined social costs. As these comments suggest, studies analyzing the effectiveness of the federal residential tax credits as inducements to energy conservation and renewable energy investments have been inconclusive. One of these studies suggested that the increasing price of energy relative to other goods and services was the principal factor behind the decline in residential energy consumption at the time the tax credits were available. Average U.S. household energy costs rose sharply (nominally by about $400) from 1978 to 1988. And a decline in real income in the early 1980s may also have contributed to the drop in residential energy use during the period the credits were available. (OTA 1992)
The development of energy-efficiency indictors is limited by the availability of data. Data are limited for several reasons. As the amount of data collected increases so do the costs of collecting, processing, and analyzing the data. The configuration of certain technologies and processes can also limit the possibility of obtaining microdata. Defining energy efficiency is a difficult task but measuring changes in energy efficiency is even more difficult. What we can do is to decide which indicators are possible within the available resources and adjust these indicators for structural, economic, and behavioral changes where we can. The indicators that are developed can then be used to compare relative changes that do occur overtime. Although the indicators might be the best that can be developed within the constraints, they are only estimates. Supporting information on factors affecting the changes need to be presented in as much detail as possible.
Measurement of energy efficiency always relates to the specific policy objectives at stake. Different answers call for different indicators. Consequently, the appropriate indicator is dependent on the policy objective. For example, if the policy objective concerned the environment, then the intensity indicator would involve carbon emissions. From the global warming perspective, the absolute carbon emissions 86
are obviously most important, and energy intensity is not relevant. On the other hand, if economic productivity is the policy objective, then energy expenditures per dollar of GDP might be a more suitable indicator.
Primary conversion factors are calculated. These vary regionally according to the mix of fuels used directly or indirectly for electricity generation. For each of the sectors, these conversion factors convert site-adjusted estimates of energy consumption into real energy estimates. Information on losses is not available for all energy sources. Primary conversion factors are available or can be developed for natural gas and electricity.
Electricity. Electric utilities, and by association, nonutility generators, can fully measure their generation and transmission and distribution (T&D) losses by fuel input (i.e., fossil fuel, nuclear, hydropower, and geothermal). In the development of an economy composite using changes in energy-intensity indicators based on real energy, annual primary conversion factors for electricity by region are developed from the losses. These standard, useful measures of the efficiency of electricity generation and T&D are multiplied by regional site electricity requirements for each sector of the economy in order to estimate primary electricity consumption.
Natural Gas. Natural gas T&D losses are more difficult to measure since they are pipeline specific. Losses on the total amount of natural gas passing through the entire system vary with the volume of gas and distance traveled in the pipeline. Losses occur during extraction, processing, transportation and distribution. Industry experts within EIA and the AGA came to the conclusion that 1.10 was a reasonable real energy conversion factor in the development of real energy estimates.
LPG/Propane. From the refinery or processing plant, propane is shipped in two stages—first, to an intermediate terminal and from there, to the local propane supplier for delivery to the end user. All propane is transported under pressure in its more compact liquid form; 75% is transported by a pipeline-truck combination. Pumps are used to transfer propane from the tank truck to the consumer storage tank. The production efficiency for LPG is 96.5% and the transportation, storage and distribution efficiency is 97.9 % for a total efficiency of 89.3%. (LPG 1999)
Other Energy Sources. Energy losses in pipeline, marine, and truck transportation as well as in bulk storage and distribution facilities have not been quantified for either petroleum or coal products.
Real energy can be estimated by summing the site energy consumption for each sector, multiplied by the primary conversion factors at the regional level. This represents approximately 86% of the real energy reported by EIA in Table 2.1 in the Annual Energy Review. The only energy estimates omitted by this method are real energy estimates used in mining, agriculture, forestry, recreational boats, and military transport vehicles.
Initially, it was thought that the complexity of calculating appropriate fuel cycle factors would be a barrier to real energy based energy efficiency policies. But extensive research performed on behalf of DOE and EPA has largely negated this argument. The resource utilization weighting factors derived by DOE in support of the building energy performance standards have simplified the calculation of real energy where national level values are appropriate. Where it is important to address regional or even state level impacts due to local power generation mixes, the availability of the EPA eGRID database makes this a fairly straightforward process.
87
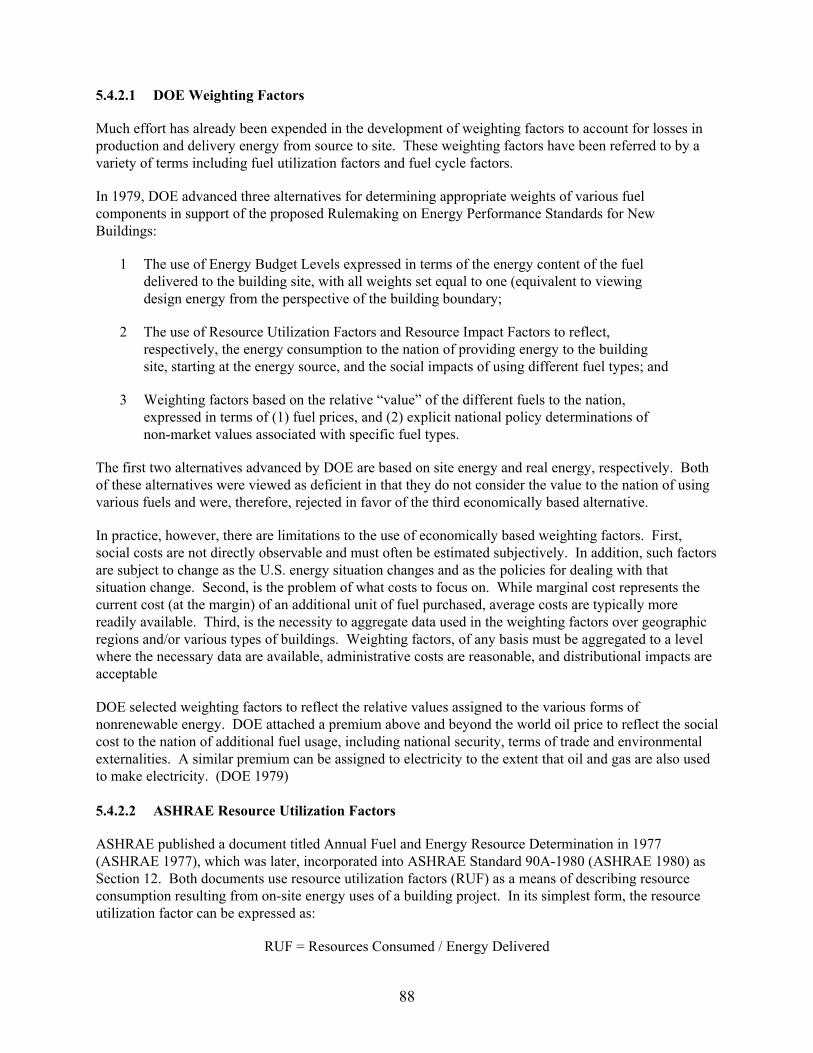
5.4.2.1 DOE Weighting Factors
Much effort has already been expended in the development of weighting factors to account for losses in production and delivery energy from source to site. These weighting factors have been referred to by a variety of terms including fuel utilization factors and fuel cycle factors.
In 1979, DOE advanced three alternatives for determining appropriate weights of various fuel components in support of the proposed Rulemaking on Energy Performance Standards for New Buildings:
1 The use of Energy Budget Levels expressed in terms of the energy content of the fuel delivered to the building site, with all weights set equal to one (equivalent to viewing design energy from the perspective of the building boundary;
2 The use of Resource Utilization Factors and Resource Impact Factors to reflect, respectively, the energy consumption to the nation of providing energy to the building site, starting at the energy source, and the social impacts of using different fuel types; and
3 Weighting factors based on the relative “value” of the different fuels to the nation, expressed in terms of (1) fuel prices, and (2) explicit national policy determinations of non-market values associated with specific fuel types.
The first two alternatives advanced by DOE are based on site energy and real energy, respectively. Both of these alternatives were viewed as deficient in that they do not consider the value to the nation of using various fuels and were, therefore, rejected in favor of the third economically based alternative.
In practice, however, there are limitations to the use of economically based weighting factors. First, social costs are not directly observable and must often be estimated subjectively. In addition, such factors are subject to change as the U.S. energy situation changes and as the policies for dealing with that situation change. Second, is the problem of what costs to focus on. While marginal cost represents the current cost (at the margin) of an additional unit of fuel purchased, average costs are typically more readily available. Third, is the necessity to aggregate data used in the weighting factors over geographic regions and/or various types of buildings. Weighting factors, of any basis must be aggregated to a level where the necessary data are available, administrative costs are reasonable, and distributional impacts are acceptable
DOE selected weighting factors to reflect the relative values assigned to the various forms of nonrenewable energy. DOE attached a premium above and beyond the world oil price to reflect the social cost to the nation of additional fuel usage, including national security, terms of trade and environmental externalities. A similar premium can be assigned to electricity to the extent that oil and gas are also used to make electricity. (DOE 1979)
5.4.2.2 ASHRAE Resource Utilization Factors
ASHRAE published a document titled Annual Fuel and Energy Resource Determination in 1977 (ASHRAE 1977), which was later, incorporated into ASHRAE Standard 90A-1980 (ASHRAE 1980) as Section 12. Both documents use resource utilization factors (RUF) as a means of describing resource consumption resulting from on-site energy uses of a building project. In its simplest form, the resource utilization factor can be expressed as:
RUF = Resources Consumed / Energy Delivered
88

The Standard included two attachments, which provided (1) general formulas for calculating resource utilization factors for coal, natural gas, oil, electricity, and other (e.g., geothermal, waste, and wood), and (2) derived weighting factors for each of these energy sources for nine different geographic regions.
The Standard does not include consideration of Resource Impact Factors (RIF) such as availability, social, economic, environmental and national interests associated with the fuel and energy resources consumed, although it leaves open the future application of RIF’s to resource requirements developed when approved by ASHRAE. (ASHRAE 1977)
5.4.2.3 The AGA Response
AGA published two critiques of the weighting factors developed by DOE in support of the proposed Rulemaking on Energy Performance Standards for New Buildings, finding that (1) without factors to account for off-site energy losses and building energy performance standards (BEPS) would favor the use of electric equipment, (2) any weighting factors should be based on average rather than marginal costs since the latter has no meaning where customers pay a regulated price, (3) it is inappropriate to lump oil and natural gas together since DOE policy actually encourages the use of gas, and (4) agreement on projected price and the basis for those prices may be harder to reach than basing the equation of various energy forms on a technically derived procedure. AGA concludes that the use of regional RUF values as calculated in Section 12 of ASHRAE 90A-1980 and the use of projected energy costs for RIF’s would be consistent with DOE’s desire to incorporate weighting factors into BEPS, electric industry goals of having RIF’s based on fuel/power costs, and ASHRAE’s Energy Policy. (AGA 1980-1/2)
In addition, AGA has published total energy efficiency information that allows the calculation of real energy conversion factors for residential applications. This information along with energy conversion factors published by DOE/EIA and source pollution emission factors published by EPA were used to create suitable real energy and emission factors for Total Energy Efficiency (TEE) -based ratings of homes, household equipment and other end-use applications using referenced and publicly available information. (AGA 2000)
5.4.3 HERS Rating Method
Ever since the inclusion of HERS in the 1992 Energy Policy Act, the most contentious issue associated with them has been the development of a uniform rating method. To date, four succeeding methods have been proposed:
1) “Original” Method
2) Equipment Adjustment Factor Method
3) Modified Loads Method
4) Normalized Modified Loads Method
The national discussion that has ensued from this effort has worked to clarify, and in some cases resolve, many of the issues involving the building energy efficiency marketplace, national building codes and appliance standards, and energy and environmental policy. It has led to a fuller appreciation of the complexity of building energy efficiency, its varied definitions and meanings, and to the adoption for the first time by a national association of governmental officials, a set of uniform technical guidelines for rating the energy efficiency of homes. (Fairey 2000)
89

A brief description of each these methods as explained in a paper by written by Philip Fairey, Florida Solar Energy Center, et al is presented below. A more detailed discussion of each method as well as the historical background behind their development can be found in the original paper. (Fairey 2003)
5.4.3.1 “Original” Method
The "Original" Method of rating home energy efficiency was developed by the HERS Council Technical Committee and published almost simultaneously in July 1995 by the HERS Council and by the U.S. Department of Energy (DOE) in a Notice of Proposed Rule (NOPR). This rating method was developed within the framework of a set of guiding principles approved by the HERS Council's Board of Directors. The equation used to calculate the point score is as follows:
Point score = 100 - 20 * (ER / EC) Eq. 1
where:
ER = Total estimated purchased energy consumption for heating, cooling and hot water for the Rated Home.
EC = Total estimated purchased energy consumption for heating, cooling and hot water for the Reference Home.
The framers of this method believed that fuel neutrality was provided by the Reference Home requirements, whereby the fuel types were required to be the same as the fuel types of the Rated Home. At the time, it was believed that this simple solution would result in fuel neutrality because competing fuel types would never be compared against each other in the calculation of the point score.
90

5.4.3.2 Equipment Adjustment Factor Method
The key to the failure of the Original Method is in the "rating fraction" term (EC/ER) of Equation 1. If the denominator (ER) of the rating fraction used in the point score equation is allowed to change as a function of fuel type, then the method will fail the fuel neutrality test by virtue of the fact that the reference (the denominator) is floating. When this occurs, each home will have multiple standards against which it may be judged (scored) and the system will certainly be "gamed" to the advantage of one fuel type or another.
In January 1996, the HERS Council Technical Committee adopted the Equipment Adjustment Factor Method to resolve this issue. It solved the "floating" denominator problem by adjusting the energy consumption values for equipment other than electric by the ratio of the NAECA minimum standard for that fuel type with respect to the minimum standard for the equivalent electric equipment. This method still relies on estimated site energy use values for its rating fraction. As a result, rating directly by energy consumption misrepresents the relative value of envelope efficiency measures with respect to equipment efficiency measures.
5.4.3.3 Modified Loads Method
The Modified Loads Method for rating the energy-efficiency of homes is specifically designed to avoid the problems encountered with the "Original" and the Equipment Adjustment Factor Methods. The underlying principle of the Modified Loads Method and the solution to the problems encountered with previous methods turns out to be quite simple – do not use energy consumption to construct the rating fraction, use the building loads instead. Since the loads on building end uses do not change as a function of fuel type, the denominator of the rating fraction (the sum of the Reference Home loads) remains the same across all fuel types. It is important to point out that, in addition to solving the "floating" denominator and envelope vs. equipment efficiency problems, this approach also renders the "site vs. source vs. cost" argument irrelevant – it does not matter which way energy consumption is counted, the point score will be identical no matter whether you count by site energy consumption, real energy consumption or cost. The revised equations for calculating the point score require a 2-step process, starting by calculating the Modified End Use Load for heating, cooling and hot water separately as follows:
MEUL = REUL * (ECx / ECr) Eq. 2
where:
MEUL = Modified end use load (for heating, cooling and water heating).
REUL = Reference Home end use load (for heating, cooling and water heating).
ECx = Rated Home's estimated energy consumption (for heating, cooling and water heating).
ECr = Reference Home's estimated energy consumption (for heating, cooling and water heating).
Equation 2 states that the modified end use loads (for the Rated home) are equal to the Reference Home end use loads multiplied by the ratio of the estimated energy uses (which are a derivative of the equipment performance efficiencies) of the two homes.
91

Step 2 involves adding the three loads together for both the Reference Home and the Rated Home and calculating the point score as follows:
Point score = 100 - 20 * (TML / TRL) Eq. 3
where:
TML = MEUL_heating + MEUL_cooling + MEUL_hot water (Total of all Rated Home's modified end use loads as calculated using equation 1).
TRL = REUL_heating + REUL_cooling + REUL_hot water (Total of all Reference Home's actual end use loads).
With the Modified Loads Method, all other things being equal, the space heating energy use in an electrically heated home may be improved (decreased) by 32% by upgrading from the reference standard (NAECA) equipment to the best available market technology equipment. However, space heating energy use can be improved (decreased) by only 18.7% if the home is heated by a natural gas-fired furnace. The ratio of these two energy end use improvement potentials (electric with respect to natural gas) is 1.7 to 1.
5.4.3.4 Normalized Modified Loads Method
It is mathematically possible to "normalize" Modified End Use Loads to reflect differences in equipment improvement potentials such that all equipment improvements are normalized with respect to the improvement potential of a "baseline" fuel type. This normalized Modified End Use Load (nMEUL) will then provide equal changes in HERS Scores across fuel types, all other things being equal. To accomplish this it is necessary to select a "baseline" improvement potential and then scale the energy improvement potentials for other fuel types to that of the "baseline." For this purpose, the improvement potential of electric equipment is selected as the "baseline."
Thus, the form of the revised Equation 2 remains the same as the original equation, as follows:
nMEUL = REUL * (nECx / ECr) Eq. 4
where:
nMEUL = the normalized Modified End Use Loads (for heating, cooling and water heating)
nECx = the normalized Energy Consumption for the Rated Home load (for heating, cooling and water heating)
ECr = the Energy Consumption for the Reference Home load (for heating, cooling and water heating)
The national discussion that has ensued from this effort has worked to clarify, and in some cases resolve, many of the issues involving the building energy efficiency marketplace, national building codes and appliance standards, and energy and environmental policy. It has led to a fuller appreciation of the complexity of building energy efficiency, its varied definitions and meanings, and to the adoption for the first time by a national association of governmental officials, a set of uniform technical guidelines for rating the energy efficiency of homes.
92

5.5 Economic Barriers
There is a misperception that the manufacturing/construction and operating costs of buildings, appliances and vehicles designed to meet real energy based efficiency criteria would be higher than with a site-based criteria. In general, energy policies that use real energy based criteria would cause a reallocation of energy dollars rather an increase in expenditures. For example, a homebuilder trying to qualify for the new home energy efficiency credit would have more flexibility with a space heating system based on a gas furnace or air-source heat pump since an electric resistance furnace can not be upgraded to a more efficient unit. In addition, an energy policy based on real energy efficiency would reduce the costs associated with air pollution and the trade deficit.
There have been some attempts to put hard dollar values on these societal costs. For example, the CAFE law provides for special treatment of vehicle fuel economy calculations for dedicated alternative fuel vehicles and dual-fuel vehicles. The fuel economy of a dedicated alternative fuel vehicle is determined by dividing its fuel economy in equivalent miles per gallon of gasoline or diesel fuel by 0.15. Thus a 15 mpg dedicated alternative fuel vehicle would be rated as 100 mpg. For dual-fuel vehicles (vehicles that can use the alternative fuel and gasoline or diesel interchangeably), the rating is the average of the fuel economy on gasoline or diesel and the fuel economy on the alternative fuel vehicle divided by 0.15. For example, this calculation procedure turns a dual fuel vehicle that averages 25 mpg on gasoline or diesel with the above 100 mpg alternative fuel to attain the 40 mpg value for CAFE purposes.
Energy prices and ratemaking can also be a barrier by sending the wrong economic signals to the energy end-user. Electricity tariffs in many instances have been a barrier to attracting consumers to invest in energy efficiency since they often do not reflect the marginal costs of producing electricity. Traditional rate making encourages sales of kWh (for an electric utility), and discourages efficiency measures.
For example, a recently released report from the General Accounting Office (GAO 2004) made the following observation:
“It is clear that connecting wholesale and retail markets through demand response would help competitive electricity markets function better and enhance the reliability of the electric system, thus potentially delivering large benefits to consumers…. Without these efforts to incorporate demand response in today’s markets, prices will be higher than they could be, the incidence of price spikes caused by either market conditions or by market manipulation will be greater, and industry will have less incentive for energy efficiency and other innovations, among other things”
93

6 CONCLUSIONS
6.1 Candidate Programs and Policies
Based on our analysis, the following three energy efficiency programs would have the greatest potential impact on the reduction of real energy and associated greenhouse gas emissions if their savings criteria were changed to real energy:
• Energy Policy Act of 2005
• ASHRAE Advanced Energy Design Guide
• Corporate Average Fuel Economy
These three programs all appear to be prime candidates for further investigation. Each of these programs targets one of the major energy use markets evaluated - residential, commercial and transportation. The first two programs currently use energy cost as the basis for quantifying energy savings, while the third uses site energy. Each of the programs covers a broad swath of its respective market.
6.1.1 Energy Policy Act of 2005
The New Energy Efficiency Home Credit provision of the Energy Policy Act of 2005 is available for all new residential construction in the U.S. while the Energy Efficient Appliance Credit and Residential Energy Efficient Property credit would be applicable to all major residential appliance purchases for both new and existing homes. The credit provides a $1,000 or $2,000 credit for a 30% or 50% energy cost reduction in manufactured homes and a $2,000 credit for a 50% energy cost reduction in site-built homes. The impact of this provision for a typical single-family residence built in the U.S. is shown in Figure 6.1.
-
50
100
150
200
250
300
Baseli
ne
30% H
VAC
50% H
VAC
Baseli
ne
30% H
VAC
50% H
VAC
Baseli
ne
30% H
VAC
50% H
VAC
Electric Furnace Heat Pump NG Furnace
Ener
gy C
onsu
mpt
ion
(MM
Btu
/yr)
-
5,000
10,000
15,000
20,000
25,000
GH
G E
mis
sion
s (lb
s/yr
)
Site Energy
Real Energy
GHG Emissions
Figure 6.1 - Impact of New Energy Efficient Home Credit
94
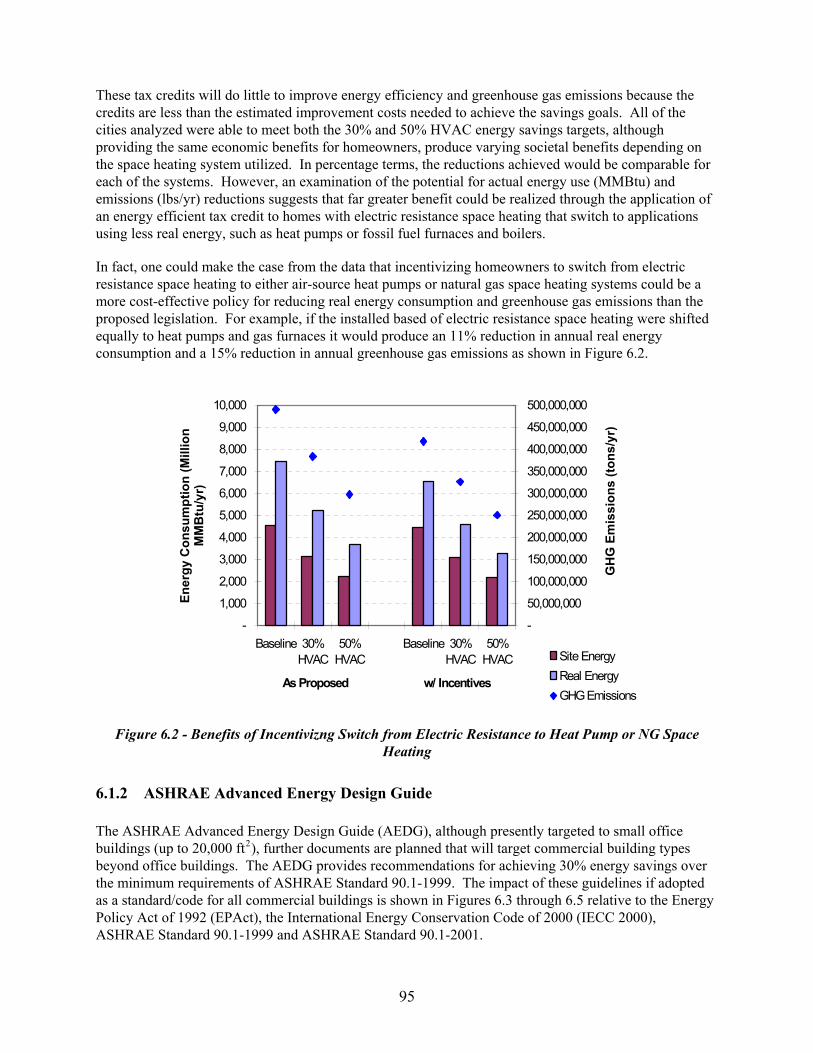
These tax credits will do little to improve energy efficiency and greenhouse gas emissions because the credits are less than the estimated improvement costs needed to achieve the savings goals. All of the cities analyzed were able to meet both the 30% and 50% HVAC energy savings targets, although providing the same economic benefits for homeowners, produce varying societal benefits depending on the space heating system utilized. In percentage terms, the reductions achieved would be comparable for each of the systems. However, an examination of the potential for actual energy use (MMBtu) and emissions (lbs/yr) reductions suggests that far greater benefit could be realized through the application of an energy efficient tax credit to homes with electric resistance space heating that switch to applications using less real energy, such as heat pumps or fossil fuel furnaces and boilers.
In fact, one could make the case from the data that incentivizing homeowners to switch from electric resistance space heating to either air-source heat pumps or natural gas space heating systems could be a more cost-effective policy for reducing real energy consumption and greenhouse gas emissions than the proposed legislation. For example, if the installed based of electric resistance space heating were shifted equally to heat pumps and gas furnaces it would produce an 11% reduction in annual real energy consumption and a 15% reduction in annual greenhouse gas emissions as shown in Figure 6.2.
-Baseline 30%
HVAC50%
HVACBaseline 30%
HVAC50%
HVAC
As Proposed w/ Incentives
-
1,000
2,000
3,000
4,000
5,000
6,000
7,000
8,000
9,000
10,000
Ener
gy C
onsu
mpt
ion
(Mill
ion
MM
Btu
/yr)
50,000,000
100,000,000
150,000,000
200,000,000
250,000,000
300,000,000
350,000,000
400,000,000
450,000,000
500,000,000
GH
G E
mis
sion
s (to
ns/y
r)
Site EnergyReal EnergyGHG Emissions
Figure 6.2 - Benefits of Incentivizng Switch from Electric Resistance to Heat Pump or NG Space Heating
6.1.2 ASHRAE Advanced Energy Design Guide
The ASHRAE Advanced Energy Design Guide (AEDG), although presently targeted to small office buildings (up to 20,000 ftP
2P), further documents are planned that will target commercial building types
beyond office buildings. The AEDG provides recommendations for achieving 30% energy savings over the minimum requirements of ASHRAE Standard 90.1-1999. The impact of these guidelines if adopted as a standard/code for all commercial buildings is shown in Figures 6.3 through 6.5 relative to the Energy Policy Act of 1992 (EPAct), the International Energy Conservation Code of 2000 (IECC 2000), ASHRAE Standard 90.1-1999 and ASHRAE Standard 90.1-2001.
95
5,000,000,000
-
500,000,000
1,000,000,000
1,500,000,000
2,000,000,000
2,500,000,000
3,000,000,000
3,500,000,000
4,000,000,000
4,500,000,000
EPACT 1992 IECC 2000 ASHRAE ASHRAE ASHRAE
Ener
gy C
onsu
mpt
ion
(MM
Btu
/yr)
-
100,000,000
200,000,000
300,000,000
400,000,000
500,000,000
600,000,000
700,000,000
800,000,000
900,000,000
Gre
enho
use
Gas
Em
siio
ns (t
ons/
yr)
90.1-1999 90.1-2001 AEDG
Site Energy Real Energy GHG Emissions
-
50,000,000
100,000,000
150,000,000
EPACT 1992 IECC 2000 ASHRAE 90.1-1999
ASHRAE 90.1-2001
ASHRAE AEDG
-
10,000,000
20,000,000
30,000,000200,000,000
250,000,000
300,000,000
350,000,000
400,000,000
450,000,000
500,000,000
Ener
gy C
onsu
mpt
ion
(MM
Btu
/yr)
40,000,000
50,000,000
60,000,000
70,000,000
80,000,000
90,000,000
Gre
enho
use
Gas
Em
siio
ns (t
ons/
yr)
Figure 6.3 - Impact of ASHRAE Advanced Energy Design Guide – Installed Base
Site Energy Real Energy GHG Emissions
Figure 6.4 - Impact of ASHRAE Advanced Energy Design Guide – Replacement Market
96

-
10,000,000
20,000,000
30,000,000
40,000,000
50,000,000
60,000,000
70,000,000
80,000,000
EPACT 1992 IECC 2000 ASHRAE 90.1-1999
ASHRAE 90.1-2001
ASHRAE AEDG
-
2,000,000
4,000,000
6,000,000
8,000,000
10,000,000
12,000,000
14,000,000
Site Energy Real Energy GHG Emissions
Figure 6.5 - Impact of ASHRAE Advanced Energy Design Guide – New Construction
As would be expected, given the stated objective of the AEDG, the reduction in site energy consumption in all three cases is approximately 30%. The reduction in real energy consumption, at about 25%, is somewhat less. Of greater concern, however, is that the corresponding reduction in greenhouse gas emissions is only about 10%. This reflects the fact that the AEDG does not include a target energy savings for electric furnaces and boilers, since both appliances theoretically operate at 100% efficiency.
Modifying the existing and/or future AEDG’s to target real energy reductions rather than energy savings would be a relatively straightforward process. The AEDG could continue to use ASHRAE Standard 90.1-1999 as the benchmark for energy savings. The real energy consumption and greenhouse gas emissions impact of recommendations could continue to be climate specific. The EPA eGRID database contains emissions and resource mix data for virtually every power plant and company that generates electricity in the United States and can be aggregated at the power plant, electric generating company, power control area, state, North American Electric Reliability Council (NERC) region or nationwide levels (EPA 2003). Ascertaining the generation resource mix and emissions profile for each of the eight DOE climate zones should, again, be a relatively straightforward process. Converting the guidelines from energy cost savings to real energy reduction would provide ASHRAE with more than mere lip service in its claim to addressing today’s environmental challenges.
6.1.3 Corporate Average Fuel Economy
The Corporate Average Fuel Economy (CAFE) standards apply to all passenger and light trucks manufactured and/or sold in the U.S. The standards are applied on a fleet-wide basis for each manufacturer; i.e., the fuel economy ratings for a manufacturer's entire line of passenger cars must average at least 27.5 mpg for the manufacturer to comply with the standard. For light trucks (including vans and sport utility vehicles), which make up the majority of new vehicles sales, the 2004 CAFE standard is 20.7 mpg. In addition, there are special standards for alternative and dual fuel vehicles. The National Fuel Savings and Security Act (NFSSA) of 2002 prescribes more stringent average fuel
97
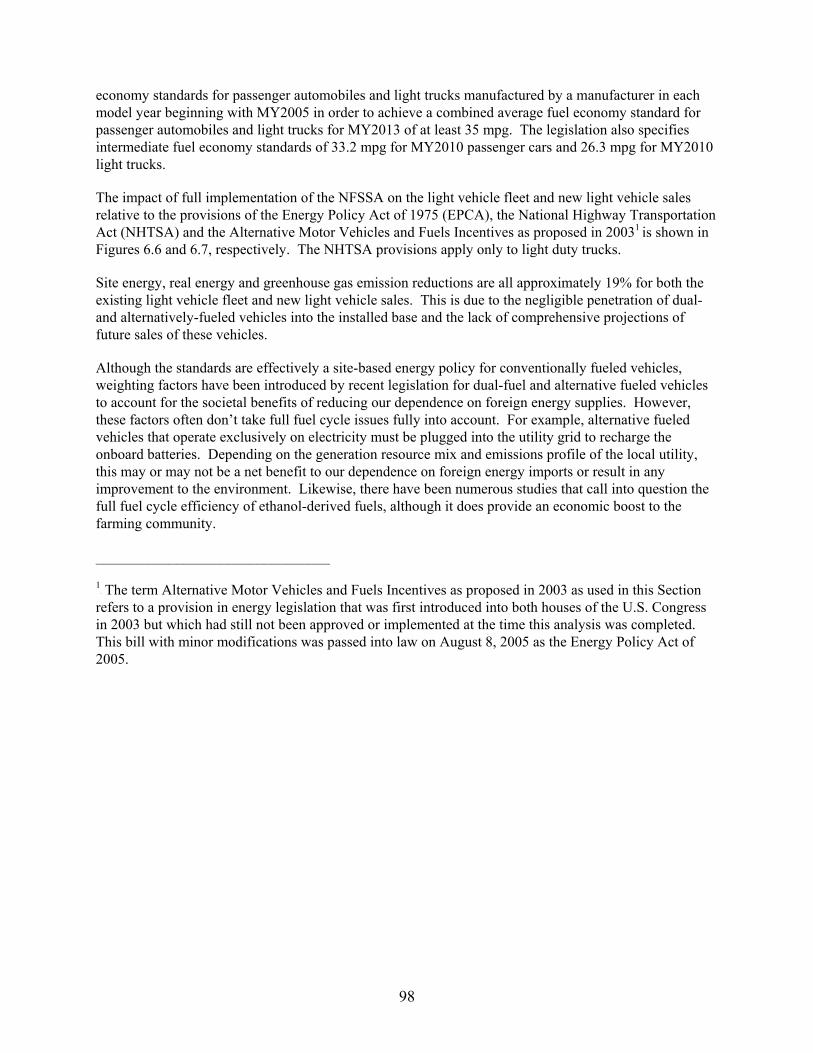
economy standards for passenger automobiles and light trucks manufactured by a manufacturer in each model year beginning with MY2005 in order to achieve a combined average fuel economy standard for passenger automobiles and light trucks for MY2013 of at least 35 mpg. The legislation also specifies intermediate fuel economy standards of 33.2 mpg for MY2010 passenger cars and 26.3 mpg for MY2010 light trucks.
The impact of full implementation of the NFSSA on the light vehicle fleet and new light vehicle sales relative to the provisions of the Energy Policy Act of 1975 (EPCA), the National Highway Transportation Act (NHTSA) and the Alternative Motor Vehicles and Fuels Incentives as proposed in 20031 is shown in Figures 6.6 and 6.7, respectively. The NHTSA provisions apply only to light duty trucks.
Site energy, real energy and greenhouse gas emission reductions are all approximately 19% for both the existing light vehicle fleet and new light vehicle sales. This is due to the negligible penetration of dual- and alternatively-fueled vehicles into the installed base and the lack of comprehensive projections of future sales of these vehicles.
Although the standards are effectively a site-based energy policy for conventionally fueled vehicles, weighting factors have been introduced by recent legislation for dual-fuel and alternative fueled vehicles to account for the societal benefits of reducing our dependence on foreign energy supplies. However, these factors often don’t take full fuel cycle issues fully into account. For example, alternative fueled vehicles that operate exclusively on electricity must be plugged into the utility grid to recharge the onboard batteries. Depending on the generation resource mix and emissions profile of the local utility, this may or may not be a net benefit to our dependence on foreign energy imports or result in any improvement to the environment. Likewise, there have been numerous studies that call into question the full fuel cycle efficiency of ethanol-derived fuels, although it does provide an economic boost to the farming community.
________________________________
1P The term Alternative Motor Vehicles and Fuels Incentives as proposed in 2003 as used in this Section
refers to a provision in energy legislation that was first introduced into both houses of the U.S. Congress in 2003 but which had still not been approved or implemented at the time this analysis was completed. This bill with minor modifications was passed into law on August 8, 2005 as the Energy Policy Act of 2005.
98

20,000,000,000 1,400,000,000
-
2,000,000,000
4,000,000,000
6,000,000,000
8,000,000,000
10,000,000,000
12,000,000,000
14,000,000,000
16,000,000,000
18,000,000,000
EPCA NHTSA NFSSA EPACT 2005
Ener
gy C
onsu
mpt
ion
(MM
Btu
/yr)
-
200,000,000
400,000,000
600,000,000
800,000,000
1,000,000,000
1,200,000,000
Gre
enho
use
Gas
Em
siio
ns (t
ons/
yr)
Site Energy Real Energy GHG Emissions
Figure 6.6 - Impact of NFSSA Revisions to CAFÉ Standards – Light Vehicle Fleet
-
200,000,000
400,000,000
600,000,000
800,000,000
1,000,000,000
1,200,000,000
1,400,000,000
1,600,000,000
1,800,000,000
2,000,000,000
EPCA NHTSA NFSSA EPACT 2005
Ener
gy C
onsu
mpt
ion
(MM
Btu
/yr)
-
10,000,000
20,000,000
30,000,000
40,000,000
50,000,000
60,000,000
70,000,000
80,000,000
90,000,000
100,000,000
Gre
enho
use
Gas
Em
siio
ns (t
ons/
yr)
Site Energy Real Energy GHG Emissions
Figure 6.7 - Impact of NFSSA Revisions to CAFÉ Standards – New Light Vehicle Sales
99

7 REFERENCES
ACEEE 2001. Opportunities for New Appliance and Equipment Efficiency Standards: Energy and Economic Savings Beyond Current Standards Programs. American Council for an Energy-Efficient Economy, Washington, DC.
AGA 1980-1. Weighting Factors – Building Energy Performance Standards Technical Support Document No. 4 (BCS 1A80). American Gas Association, Washington DC.
AGA 1980-2. Weighting Factors – An Alternative Approach on the Weighting Factors Technical Support Document to the Proposed BEPS (BCS 2A80). American Gas Association, Washington DC.
AGA 1990. A Comparison of Carbon Dioxide Emissions Attributable to New Natural Gas and All- Electric Homes (EA 1990-05). American Gas Association, Washington DC.
AGA 2000. Source Energy and Emission Factors for Residential Energy Consumption. American Gas Association, Washington DC.
AGCC 1994. Resource Energy Efficiency and Emissions Database and Modeling Program. American Gas Cooling Center, Washington DC.
AGCC 2001. Full Fuel Cycle Consideration of Energy Sources a No/Low Cost Policy Action Item. American Gas Cooling Center, Washington DC.
ARI 2002. Statistical Review, February 1, 2002. TAir-Conditioning & Refrigeration Institute, Arlington, VA.T
ASECC 2003. 2003 State Energy Code Review & Recommendations. Arizona State Energy Code Commission, Phoenix, AZ.
ASHRAE 1975. Energy Conservation in New Building Design (ASHRAE Standard 90-75). American Society of Heating, Refrigerating and Air-conditioning Engineers, Atlanta, GA.
ASHRAE 1977. Annual Fuel and Energy Resource Determination in 1977. American Society of Heating, Refrigerating and Air-conditioning Engineers, Atlanta, GA.
ASHRAE 1980. Energy Conservation in New Building Design (ANSI/ASHRAE/IES Standard 90A-1980). American Society of Heating, Refrigerating and Air-conditioning Engineers, Atlanta, GA.
ASHRAE 1989. Energy Standard for Buildings Except Low-Residential Buildings (ASHRAE/IESNA Standard 90.1-1989). American Society of Heating, Refrigerating and Air-conditioning Engineers, Atlanta, GA.
ASHRAE 1999. Energy Standard for Buildings Except Low-Residential Buildings (ASHRAE/IESNA Standard 90.1-1999). American Society of Heating, Refrigerating and Air-conditioning Engineers, Atlanta, GA.
ASHRAE 2001. Energy-Efficient Design of Low-Rise Residential Buildings (ASHRAE Standard 90.2-2001). American Society of Heating, Refrigerating and Air-conditioning Engineers, Atlanta, GA.
100
ASHRAE 2004. Advanced Energy Design Guide for Small Office Buildings. American Society of Heating, Refrigerating and Air-conditioning Engineers, Atlanta, GA.

Bertoldi 2003. Advanced Meters: Essential Components of Sustainable Energy Systems. Metering International, 3/2003, Steenberg, South Africa.
Bushnell 2004. Consumption Under Noisy Price Signals: A Study of Electrical Retail Rate Deregulation in San Diego.
CBECS 1999. 1999 Commercial Buildings Energy Consumption Survey - Commercial Building Characteristics Tables. Energy Information Administration, U.S. Department of Energy, Washington DC.
CBECS 2003. 2003 Commercial Buildings Energy Consumption Survey - Commercial Building Characteristics Tables. Energy Information Administration, U.S. Department of Energy, Washington DC.
Centerpoint 2001. 2001 Appliance Penetration in New Construction, Personnel communication with Angela Kline, CenterPoint Energy, September 27, 2001.
Centerpoint 2005. Personal communication with Angela Kline, CenterPoint Energy, February 18, 2005.
CIEE 1998. Market Structure and Energy Efficiency: The Case of New Commercial Buildings. California Institute for Energy Efficiency, Oakland, CA.
CLF 2004. Prefiled Testimony of Jurgen Weiss on Behalf of the Conservation law Foundation, State of Vermont Public Service Board, Docket No. 6958, August 31, 2004.
Colliver 2005. D.G. Colliver and R.E. Jarnagin. Advanced Energy Design Guide for Small Office Buildings. ASHRAE Journal, March 2005. American Society of Heating, Refrigerating and Air-conditioning Engineers, Atlanta, GA.
Pimentel 2005. D. Pimentel (Cornell University) and T.W.Patzek (UC Berkeley). Ethanol Production Using Corn, Switchgrass, and Wood; Biodiesel Production Using Soybean and Sunflower. Natural Resources Research, Vol. 14, No. 1, pp. 65-76, 2005.
CPA 1993. Energy Wise Options for State and Local Governments – 2P
ndP Edition. Center for Policy
Alternatives, Washington, DC.
DOE 1979. Weighting Factors – Technical Support Documentation for Notice of Proposed Rulemaking on Energy Performance standards for New Buildings (9564.00). U.S. Department of Energy, Washington DC.
DOE 1996. Procedures for Consideration of New or Revised Energy Conservation Standards for Consumer Products; Final Rule (10 CFR Part 430). Office of Energy Efficiency and Renewable Energy, U.S. Department of Energy, Washington DC.
DOE 1999. GREET 1.5 - Transportation Fuel-Cycle Model. Center for Transpiration Research,, Energy Systems Division, Argonne National Laboratory U.S. Department of Energy, Argonne, IL.
DOE 2000. Technical Support Document: Energy Efficiency Standards for Consumer Products: Residential Water Heaters. Office of Energy Efficiency and Renewable Energy, U.S. Department of Energy, Washington DC.
DOE 2004-1. DOE Residential Furnaces and Boilers ANOPR Analytical Tools (www.eere.energy.gov/buildings/appliance_standards/residential/furnace_boiler_draft_analysis.html).
DOE 2004-2. 2004 Buildings Energy Databook. Office of Energy Efficiency and Renewable Energy, U.S. Department of Energy, Washington DC. 101

DOE 2004-3. Federal Energy Management Program – Technologies (http://www.eere.energy.gov/ femp/technologies/eeproducts.cfm). Office of Energy Efficiency and Renewable Energy, U.S. Department of Energy, Washington DC.
DOE 2004-4. The Alternative Fuel Price Report – November 26, 2004. U.S. Department of Energy, Washington DC.
DOE 2004-5. Table ES1.B. Total Electric Power Industry Summary Statistics, Year-to-Date 2004 and 2003 (http://www.eia.doe.gov/cneaf/electricity/epm/tablees1b.html). Energy Information Administration, U.S. Department of Energy, Washington DC.
DOE 2005. Annual Energy Outlook 2005 (DOE/EIA-0383(2005)). Energy Information Administration, U.S. Department of Energy, Washington DC.
DOT 2002. Report to Congress – Effects of the Alternative Motor Fuel Act CAFÉ Incentives Policy. U.S. Department of Transportation. U.S. Department of Energy and U.S. Environmental Protection Agency, Washington DC.
DOT 2004-1. National Transportation Statistics 2004. U.S. Department of Transportation Bureau of Transportation Statistics, Washington DC.
duPont 1998. Energy Policy and Consumer Reality: The Role of Energy in the Purchase of Household Appliances in the United States and Thailand, University of Delaware, Newark, DE .
EPA 2003. Emissions and Generation Resource Integrated Database (eGRID). Environmental Protection Agency, Washington, DC.
EPACT 2005. Conference Report on H.R. 6, Energy Policy Act of 2005 -- House of Representatives - July 27, 2005.
Fairey 2000. Fairey, P. et al. The HERS Rating Method and the Derivation of the Normalized Modified Loads Method. Florida Solar Energy Center, Cocoa, FL.
FEMP 2004. Annual Report to Congress on Federal Government Energy Management and Conservation Programs. Federal Energy Management Program, Washington DC.
FEMP 2005. Federal Energy Management Program Year in Review 2004. Federal Energy Management Program, Washington DC.
GAMA 2005. Consumers' Directory of Certified Efficiency Ratings. Gas Appliance Manufacturers Association, Washington DC.
GAO 2004. Electricity Markets – Consumers Could Benefit from Demand Programs, but Challenges Remain, General Accounting Office Report No. GAO-04-844, August 2004, page 43. Genral Accounting Office, Washington DC.
H.R. 6. Energy Policy Act of 2003 (Public Print). U.S. House of Representatives - November 17, 2003 Congressional Record H11207-11356, Washington DC.
IECC 2000. International Energy Conservation Code 2000. International Code Council, Falls Church, VA.
102

LBNL 1996. Market Barriers to Energy Efficiency: A Critical Reappraisal of the Rationale for Public Policies to Promote Energy Efficiency. Energy & Environment Division, Lawrence Berkeley National Laboratory, Berkeley, California.
LEED. Leadership in Energy and Environmental Design Green Building Rating System. United States Green Building Council, Washington DC.
LPG 1997. LPG for Motor Vehicles: A Total Fuel Cycle Analysis of Emissions of Urban Air Pollutants and Greenhouse Gases (UCD-ITS-RR-97-22), February 1997 (updated 1999). Institute of Transportation Studies, Davis CA.
Lucas 2005. A Comparison of ASHRAE Standard 90.2-2004 to the 2004 IECC Supplement. Pacific Northwest National Laboratory, Richland, WA.
NAHB 2001. Housing Facts, Figures and Trends, National Association of Home Builders. National Association of Home Builders, Washington, DC
NARA 2001. Federal Register, March 8, 2001. Office of the Federal Register, National Archives and Records Administration, Washington DC.
NCEP 2004. Ending the Energy Stalemate – A Bipartisan Strategy to Meet America’s Energy Goals. National Commission on Energy Policy, Washington DC.
Optima 1997. Analysis of the Cost Sensitivity of Commercial Building Heating and Cooling Equipment Choices. Optima Consulting Services, Mount Holly, NJ.
OTA 1992. Building Energy Efficiency (OTA-E-518), U.S. Congress, Office of Technology Assessment, Washington, DC.
PG&E 2005. June 16, 2005 News Release, Pacific Gas and Electric Company News Department, San Francisco, CA.
RAND 1999. Measures of Residential Energy Consumption and Their Relationships to DOE Policy (MR-1105.0-DOE). U.S. Department of Energy Office of Energy Efficiency and Renewable Energy and the Office of Science and Technology Policy, Washington DC.
RAP 2005. Clean Energy Policies for Electric and Gas Regulators. Regulatory Assistance Project Newsletter, January 2005. The Regulatory Assistance Project, Gardiner, ME.
RECS 2001. Residential Energy Consumption Survey 2001 - Consumption and Expenditure Data Tables. Energy Information Administration, U.S. Department of Energy, Washington DC.
S. 2095. Energy Policy Act of 2003 (Placed on Calendar). U.S. Senate – February 23, 2004 Placed on Senate Legislative Calendar under General Orders (Calendar No. 432), Washington DC.
Wang 1999. Effects of Fuel Ethanol Use on Fuel-Cycle Energy and Greenhouse Gas Emissions (ANL/ESD-38). Center for Transportation Research, Energy Systems Division, Argonne National Laboratory, Argonne, Illinois.
WSJ 2005. More States Favor Energy-Efficiency Buildings. The Wall Street Journal, May 25, 2005. Dow Jones Publishing, New York, NY.
103