WTD project implementation in Latvia Strasbourg 5 June, 2014 1.

UnwtdtotalWork StatusSocial GradeAgeGender
Full/part-Wtd.OtherUnemployedRetiredtimeDEC2C1AB65+55-6435-5425-3416-24FemaleMaleTotal
(p)(o)(n)(m)(l)(k)(j)(i)(h)(g)(f)(e)(d)(c)(b)(a)(z)1001162612705082472013062472201693311581235274741001Unweighted Total100115758*2355512392013122491981433501671435154861001Weighted Total17024757763931484553264122228282164Very satisfied17%15%12%24%zlno14%16%16%16%18%27%zcdef18%e12%13%15%16%17%16%el
5338133126297142108157130106661819589269268537Quite satisfied53%52%57%54%54%60%zi54%50%52%53%46%52%57%63%zef52%55%54%f
11817820742220483013165620146653119Neither satisfied nor12%11%13%9%13%m9%10%15%zk12%7%11%16%zg12%10%13%11%12%gmdissatisfied
12120521762529432718215123107250123Quite dissatisfied12%13%9%9%14%10%14%14%11%9%15%c15%c14%7%14%10%12%4711392281112148121762222445Very dissatisfied5%7%5%4%4%3%5%4%6%4%8%zc5%4%2%4%5%5%
1242162353-33154813Don't know/Refused1%3%m3%m*1%1%1%1%1%-2%g1%1%4%zeg1%2%1%
7031054018337318213920517615992222117111351350701Satisfied70%67%69%78%zlo68%76%zi69%66%71%80%zdef64%63%70%78%zef68%72%70%e
16831831983340544126336829129474168Dissatisfied17%19%14%13%18%14%20%17%16%13%23%zcg19%c17%c9%18%15%17%c
535753215227514999151135133591548899257276534Net Satisfied53%47%55%65%zlo50%62%zij49%48%54%67%zdef41%44%53%f69%zdef50%57%zb53%befil
Public Perceptions of the NHS and Social CareFINAL PUBLIC
Table 1Q.1 Overall, how satisfied or dissatisfied are you with the running of the National Health Service nowadays?
Base : All respondents
Respondent type : General public aged 16+ Fieldwork dates : 14th November - 9th December 2011Source : Ipsos MORI (JN10-039262-01)Proportions/Means: Columns Tested (5% risk level) - z/a/b - z/c/d/e/f/g - z/h/i/j/k - z/l/m/n/o - z/pOverlap formulae used. * small base

People aretreated with
Unwtddignity andtotalrespectNHS useHospital useEthnicityNHS/social care staffHousehold TypeHome Ownership
NotAdultshospitalHospitalInformalSocialwith
Non NHS/A&E/A&EsocialcareKnow NHSNHSdependentNon-Owner -PrivateSocialWtd.DisagreeAgreeuserNHS useruseruserMixedWhiteAsianBlackcarerworkerstaffstaffchildrenpensionerPensionerOtheroccupierrenterrenterTotal
(v)(u)(t)(s)(r)(q)(p)(o)(n)(m)(l)(k)(j)(i)(h)(g)(f)(e)(d)(c)(b)(a)(z)100130864710090145854310750741612543628951291461249106491691731001Unweighted Total1001304652104*89746853311**74778*15925038*29252*30547522110**6401781731001Weighted Total17024135151496410011241425334455495957-1082829164Very satisfied17%8%21%zu14%17%14%19%zq9%17%19%15%13%11%15%10%16%12%26%zfg-17%15%17%16%fqu
53312938357480275262637949100127181622615626711593419889537Quite satisfied53%43%59%zu55%54%59%zp49%52%51%64%n63%zn51%48%55%49%51%56%52%89%53%55%51%54%npu
1185457191005762398413344375366419-782417119Neither satisfied nor12%18%zt9%18%11%12%12%29%13%m5%8%13%11%13%9%12%13%9%-12%13%10%12%rtdissatisfied
1216059611744791998143763713435821-781827123Quite dissatisfied12%20%zt9%5%13%zs9%15%zq10%13%11%9%15%16%13%24%zi14%12%10%-12%10%16%12%qst
4731123422026-38241859318189-2691045Very dissatisfied5%10%zt2%3%5%4%5%-5%2%2%7%zi14%zi3%6%6%4%4%-4%5%6%5%t
125658103-9-32-2139-191113Don't know/Refused1%2%1%5%zr1%2%p1%-1%-2%1%-1%2%1%2%e-11%1%1%1%1%pr
7031545187262933836375046412416023206312043251729449126117701Satisfied70%51%79%zu69%70%72%68%61%67%82%zn78%zn64%59%71%59%67%68%78%zfg89%70%71%68%70%knu
16891719159631051137101854124716617630-1032737168Dissatisfied17%30%zt11%8%18%zs13%20%zq10%18%zl13%12%22%zi30%zi16%30%zi20%16%14%-16%15%22%17%lqst
5356344763470275258636754106106111601514324914193469880534Net Satisfied53%21%69%zu61%52%59%zp48%51%49%69%zn66%zn42%29%55%hjk29%47%52%64%zfg89%54%55%46%53%aghjk
npu
Public Perceptions of the NHS and Social CareFINAL PUBLIC
Table 2Q.1 Overall, how satisfied or dissatisfied are you with the running of the National Health Service nowadays?
Base : All respondents
Respondent type : General public aged 16+ Fieldwork dates : 14th November - 9th December 2011Source : Ipsos MORI (JN10-039262-01)Proportions/Means: Columns Tested (5% risk level) - z/a/b/c/d - z/e/f/g - z/h/i/j/k - z/l/m/n/o - z/p/q - z/r/s - z/t/u - z/vOverlap formulae used. * small base; ** very small base (under 30) ineligible for sig testing

UnwtdtotalFuture of NHSSatisfaction with NHSGOR
DisYorkshire &WestEastWtd.WorseSameBettersatisfiedSatisfiedHumbersideMidlandsSouth-WestSouth-EastNorth-WestNorth-EastLondonEasternMidlandsTotal
(o)(n)(m)(l)(k)(j)(i)(h)(g)(f)(e)(d)(c)(b)(a)(z)1001328298343168703909910715413955143126881001Unweighted Total1001327302340168701100*106*10216213651*14810986*1001Weighted Total170535545-164141716282814142311164Very satisfied17%16%18%13%-23%zk14%16%15%18%c21%c28%zaci9%21%c13%16%ck
533164175185-537494455907426925947537Quite satisfied53%50%58%54%-77%zk49%42%54%56%h54%51%62%zh54%55%54%hk
118393537--1715161810618126119Neither satisfied nor12%12%12%11%--17%ae14%16%11%8%12%12%11%7%12%jkdissatisfied
121482351123-1522121414520913123Quite dissatisfied12%15%m8%15%m73%zj-15%21%zbef12%9%10%9%13%8%16%12%jm
471791945-37289-46745Very dissatisfied5%5%3%6%27%zj-3%6%2%5%6%-3%5%8%dg5%j
12643--22231--1113Don't know/Refused1%2%1%1%--2%2%2%2%1%--1%1%1%j
703217230231-701636171119102401068158701Satisfied70%66%76%zln68%-100%zk63%57%69%73%h75%h79%h72%h75%h68%70%hk
168653270168-17291422235241421168Dissatisfied17%20%m11%20%zm100%zj-17%27%zbcdfg14%13%17%9%16%13%24%bdf17%jm
535152198161-168701463257978035826738534Net Satisfied53%47%65%zln47%-100%100%zk46%h30%56%h60%ahi58%ah69%zahi55%h61%ahi44%53%hkln
Public Perceptions of the NHS and Social CareFINAL PUBLIC
Table 3Q.1 Overall, how satisfied or dissatisfied are you with the running of the National Health Service nowadays?
Base : All respondents
Respondent type : General public aged 16+ Fieldwork dates : 14th November - 9th December 2011Source : Ipsos MORI (JN10-039262-01)Proportions/Means: Columns Tested (5% risk level) - z/a/b/c/d/e/f/g/h/i - z/j/k - z/l/m/n - z/oOverlap formulae used. * small base

UnwtdPrivate healthSatisfaction withImpact of NHS reformsGovernment has righttotalinsurancesocial careon patientsNHS policyNHS use in last year
SocialNHSDissatisficareWalk InChoicesPharmacistWtd.
NoYesedSatisfiedWorseBetterDisagreeAgreeservicesClinicwebsite/ChemistNHS DirectA&EOutpatientInpatientGPTotal(r)(q)(p)(o)(n)(m)(l)(k)(j)(i)(h)(g)(f)(e)(d)(c)(b)(a)(z)10018151704424938220040326945182553001772253931967801001Unweighted Total100181117544*24437920139327642*18856*3011832303761927731001Weighted Total170141202445140486672494333357740131164Very satisfied17%17%12%5%18%o14%20%m12%24%zk18%13%17%14%18%15%21%zadfh21%fh17%16%ko
533433972313819511416017718105271598611317893417537Quite satisfied53%53%55%53%57%51%57%41%64%zk43%56%ce48%53%47%49%47%48%54%ce54%ck
1189324426412556185157352326481883119Neither satisfied nor12%11%14%9%11%11%13%14%j7%12%8%13%12%13%11%13%9%11%12%ajdissatisfied
121952610246716927628124825425029100123Quite dissatisfied12%12%15%22%zn10%18%zl8%23%zj3%14%15%21%16%z14%18%zac13%15%13%12%jl
47396310244325613115131021113745Very dissatisfied5%5%3%7%4%6%zl2%8%zj2%13%zacdfg7%2%5%7%5%6%6%5%5%j
1292121262-2-1231-413Don't know/Refused1%1%1%3%1%*1%1%1%-1%-*1%1%c*-1%1%acm
703574117261822461542082432512937201119149255133548701Satisfied70%71%67%58%75%o65%77%zm53%88%zk61%69%65%67%65%65%68%69%71%d70%dkm
1681343213349120124121141136338537141137168Dissatisfied17%17%18%30%zn14%24%zl10%31%zj4%27%22%23%21%z21%23%za19%21%18%17%jl
535439861314815513484231148824139829618592411534Net Satisfied53%54%49%29%61%zo41%67%zm21%84%zk34%47%42%46%45%42%49%di48%53%cdefi53%cdefikm
o
Public Perceptions of the NHS and Social CareFINAL PUBLIC
Table 4Q.1 Overall, how satisfied or dissatisfied are you with the running of the National Health Service nowadays?
Base : All respondents
Respondent type : General public aged 16+ Fieldwork dates : 14th November - 9th December 2011Source : Ipsos MORI (JN10-039262-01)Proportions/Means: Columns Tested (5% risk level) - z/a/b/c/d/e/f/g/h/i - z/j/k - z/l/m - z/n/o - z/p/q - z/rOverlap formulae used. * small base

UnwtdtotalWork StatusSocial GradeAgeGender
Full/part-Wtd.OtherUnemployedRetiredtimeDEC2C1AB65+55-6435-5425-3416-24FemaleMaleTotal
(p)(o)(n)(m)(l)(k)(j)(i)(h)(g)(f)(e)(d)(c)(b)(a)(z)1001162612705082472013062472201693311581235274741001Unweighted Total100115758*2355512392013122491981433501671435154861001Weighted Total
28558101354683629111728Strongly agree3%3%9%zl3%2%5%zi2%1%2%4%2%2%1%6%zde2%4%3%il
241431054141664869664925704955125124248Tend to agree24%27%18%23%26%28%24%22%27%25%17%20%29%ef39%zefg24%25%25%ef
224351350128415384494221825032106120226Neither agree nor22%22%23%21%23%17%26%k27%zhk20%21%15%23%f30%zf22%21%25%23%fkdisagree
2662813611605639907747471183515138124262Tend to disagree27%18%23%26%29%zo23%19%29%j31%j24%c33%zcdg34%zcdg21%c10%27%26%26%cjo
1372264063303133373136461367160131Strongly disagree14%14%10%17%zl11%13%15%11%15%16%cd25%zcdeg13%c8%4%14%12%13%cd
105241122493326311521112819276540105Don't know/ No opinion10%15%zl19%zlm9%9%14%h13%h10%6%11%7%8%11%19%zefg13%za8%11%ah
269481562151795373725728765164135141276Agree27%31%26%26%27%33%zi26%23%29%29%f20%22%31%ef45%zdefg26%29%28%ef
4035019101223867012411378831634820209184393Disagree40%32%32%43%o41%36%35%40%46%zjk39%cd58%zcdeg47%zcd29%c14%41%38%39%cdo
-134-2-4-39-73-7-17-51-42-21-55-88344-74-43-117Net agree-13%-1%-6%-16%-13%-3%-9%-16%-17%-11%-38%-25%2%31%dg-14%-9%-12%
Public Perceptions of the NHS and Social CareFINAL PUBLIC
Table 5Q2.a To what extent, if at all, do you agree or disagree with the following statements?
- The government has the right policies for the NHS -
Base : All respondents
Respondent type : General public aged 16+ Fieldwork dates : 14th November - 9th December 2011Source : Ipsos MORI (JN10-039262-01)Proportions/Means: Columns Tested (5% risk level) - z/a/b - z/c/d/e/f/g - z/h/i/j/k - z/l/m/n/o - z/pOverlap formulae used. * small base

People aretreated with
Unwtddignity andtotalrespectNHS useHospital useEthnicityNHS/social care staffHousehold TypeHome Ownership
NotAdultshospitalHospitalInformalSocialwith
Non NHS/A&E/A&EsocialcareKnow NHSNHSdependentNon-Owner -PrivateSocialWtd.DisagreeAgreeuserNHS useruseruserMixedWhiteAsianBlackcarerworkerstaffstaffchildrenpensionerPensionerOtheroccupierrenterrenterTotal
(v)(u)(t)(s)(r)(q)(p)(o)(n)(m)(l)(k)(j)(i)(h)(g)(f)(e)(d)(c)(b)(a)(z)100130864710090145854310750741612543628951291461249106491691731001Unweighted Total1001304652104*89746853311**74778*15925038*29252*30547522110**6401781731001Weighted Total
285232261414-2034714-10711-158528Strongly agree3%2%4%2%3%3%3%-3%4%3%3%3%1%-3%2%5%zf-2%5%3%3%f
2413819633215131117416438414910647711265231534844248Tend to agree24%13%30%zu32%24%28%zp22%40%22%48%zln26%20%27%22%13%23%27%23%30%24%27%25%25%hknpu
224611572919811710911861325518586671075311573236226Neither agree nor22%20%24%28%22%25%20%10%25%zl17%15%20%20%20%12%22%23%24%11%25%18%21%23%ldisagree
26611514322240112150219912487389021831265341595148262Tend to disagree27%38%zt22%21%27%24%28%21%27%m15%30%m29%20%31%z40%zj27%26%24%39%25%29%28%26%mt
13755699122488211055184384415356431-902218131Strongly disagree14%18%zt11%9%14%10%15%zq10%14%6%12%17%z20%15%29%zik11%14%14%-14%13%10%13%qt
1052964109645602747232733233944222661622105Don't know/ No opinion10%9%10%9%11%10%11%18%10%9%14%11%9%11%6%13%9%10%20%10%9%13%11%
2694321935241145131418440455712687801346231685749276Agree27%14%34%zu34%27%31%zp25%40%25%52%zln28%23%30%h23%13%26%28%28%30%26%32%28%28%hknpu
403171211313621612323303176711516134361181908442507366393Disagree40%56%zt32%30%40%zs34%44%zq31%41%m22%42%m46%z40%46%z69%zijk39%40%38%39%39%41%38%39%mqst
-134-12784-121-16-1011-11924-21-58-4-65-29-38-57-22-1-82-17-17-117Net agree-13%-42%1%4%-13%-3%-19%9%-16%30%l-13%-23%-10%-22%-56%-12%-12%-10%-8%-13%-9%-10%-12%
Public Perceptions of the NHS and Social CareFINAL PUBLIC
Table 6Q2.a To what extent, if at all, do you agree or disagree with the following statements?
- The government has the right policies for the NHS -
Base : All respondents
Respondent type : General public aged 16+ Fieldwork dates : 14th November - 9th December 2011Source : Ipsos MORI (JN10-039262-01)Proportions/Means: Columns Tested (5% risk level) - z/a/b/c/d - z/e/f/g - z/h/i/j/k - z/l/m/n/o - z/p/q - z/r/s - z/t/u - z/vOverlap formulae used. * small base; ** very small base (under 30) ineligible for sig testing

UnwtdtotalFuture of NHSSatisfaction with NHSGOR
DisYorkshire &WestEastWtd.WorseSameBettersatisfiedSatisfiedHumbersideMidlandsSouth-WestSouth-EastNorth-WestNorth-EastLondonEasternMidlandsTotal
(o)(n)(m)(l)(k)(j)(i)(h)(g)(f)(e)(d)(c)(b)(a)(z)1001328298343168703909910715413955143126881001Unweighted Total1001327302340168701100*106*10216213651*14810986*1001Weighted Total
28611812611159323228Strongly agree3%2%4%2%1%4%zk1%1%1%3%7%zcghi5%1%3%3%3%
24164988011218212320404513472416248Tend to agree24%20%32%zln24%7%31%zk21%21%20%25%33%zabg25%32%zag22%19%25%kn
22463846921168222025431911372822226Neither agree nor22%19%28%zln20%12%24%k22%19%24%e26%e14%22%25%e25%e25%e23%ekdisagree
2661065310067153352733393114403012262Tend to disagree27%33%zm18%29%m40%zj22%35%a26%a33%a24%23%27%27%a27%a14%26%ajm
13759165656551123717217111320131Strongly disagree14%18%zm5%17%zm34%zj8%11%22%zcfgi7%11%15%cg14%7%12%24%zbcfgi13%cgjm
105284027118210121617114101114105Don't know/ No opinion10%9%13%l8%7%12%10%11%16%c11%8%7%7%10%16%c11%
269711098912243222421465415492718276Agree27%22%36%zln26%7%35%zk22%22%21%28%40%zabfghi30%33%g25%21%28%kn
40316569156124208465140565221524332393Disagree40%50%zm23%46%zm74%zj30%45%48%cf39%35%38%41%35%39%38%39%jm
-134-9440-67-11136-23-27-19-112-6-2-16-14-117Net agree-13%-29%13%-20%-66%5%-23%-25%-19%-7%1%-11%-2%-15%-16%-12%
Public Perceptions of the NHS and Social CareFINAL PUBLIC
Table 7Q2.a To what extent, if at all, do you agree or disagree with the following statements?
- The government has the right policies for the NHS -
Base : All respondents
Respondent type : General public aged 16+ Fieldwork dates : 14th November - 9th December 2011Source : Ipsos MORI (JN10-039262-01)Proportions/Means: Columns Tested (5% risk level) - z/a/b/c/d/e/f/g/h/i - z/j/k - z/l/m/n - z/oOverlap formulae used. * small base

UnwtdPrivate healthSatisfaction withImpact of NHS reformsGovernment has righttotalinsurancesocial careon patientsNHS policyNHS use in last year
SocialNHSDissatisficareWalk InChoicesPharmacistWtd.
NoYesedSatisfiedWorseBetterDisagreeAgreeservicesClinicwebsite/ChemistNHS DirectA&EOutpatientInpatientGPTotal(r)(q)(p)(o)(n)(m)(l)(k)(j)(i)(h)(g)(f)(e)(d)(c)(b)(a)(z)10018151704424938220040326945182553001772253931967801001Unweighted Total100181117544*24437920139327642*18856*3011832303761927731001Weighted Total
2823226413-28-4-11441162228Strongly agree3%3%1%5%3%1%7%zm-10%zk-2%-4%2%2%3%3%3%3%km
241200441535786-24874994931498341178248Tend to agree24%25%25%3%22%o15%43%zm-90%zk16%26%ef15%16%17%21%22%f22%23%ef25%aefkmo
2241863910516742--745146848507241170226Neither agree nor22%23%22%22%21%18%21%--16%24%25%23%26%c22%19%22%22%23%cjkmdisagree
26620752237114232262-16442494476710060217262Tend to disagree27%26%30%52%zn29%37%zl16%67%zj-37%h23%42%zacdeh31%zh26%29%27%31%h28%z26%jl
137103267368711131-83355134356526107131Strongly disagree14%13%15%17%15%23%zl5%33%zj-19%18%8%17%z19%zag15%17%za14%14%13%jl
10592131272318--5125281927441779105Don't know/ No opinion10%11%7%2%11%6%9%--11%6%9%9%10%12%h12%h9%10%11%hjkm
269223463606199-27675396035529447200276Agree27%28%26%7%24%o16%49%zm-100%zk16%29%efg15%20%19%23%25%f25%26%ef28%aefgkmo
403310783010722942393-2477291458110216586324393Disagree40%38%44%69%zn44%60%zl21%100%zj-57%zah41%51%48%za44%44%44%z45%42%z39%jl
-134-86-32-27-47-16856-393276-17-23-20-85-46-50-70-39-124-117Net agree-13%-11%-18%-61%-19%-44%28%-100%100%z-40%-12%-36%-28%-25%-22%-19%-20%-16%-12%
Public Perceptions of the NHS and Social CareFINAL PUBLIC
Table 8Q2.a To what extent, if at all, do you agree or disagree with the following statements?
- The government has the right policies for the NHS -
Base : All respondents
Respondent type : General public aged 16+ Fieldwork dates : 14th November - 9th December 2011Source : Ipsos MORI (JN10-039262-01)Proportions/Means: Columns Tested (5% risk level) - z/a/b/c/d/e/f/g/h/i - z/j/k - z/l/m - z/n/o - z/p/q - z/rOverlap formulae used. * small base

UnwtdtotalWork StatusSocial GradeAgeGender
Full/part-Wtd.OtherUnemployedRetiredtimeDEC2C1AB65+55-6435-5425-3416-24FemaleMaleTotal
(p)(o)(n)(m)(l)(k)(j)(i)(h)(g)(f)(e)(d)(c)(b)(a)(z)1001162612705082472013062472201693311581235274741001Unweighted Total100115758*2355512392013122491981433501671435154861001Weighted Total11317829593329292127162326214765112Strongly agree11%11%13%12%11%14%14%9%9%13%e11%7%16%e14%e9%13%zb11%be
518843111928611997166138100641938678258262521Tend to agree52%53%54%51%52%50%48%53%56%50%45%55%f52%54%50%54%52%f
154191233944136463528185232277879157Neither agree nor15%12%20%14%17%17%18%15%14%14%13%15%19%19%15%16%16%disagree
1252023566251650312228511398241122Tend to disagree12%13%n3%15%n12%n11%8%16%zj12%11%19%zcdg15%cd8%6%16%za8%12%acjn
34825179798671721221033Strongly disagree3%5%3%2%3%4%4%3%3%3%5%c5%c1%1%4%2%3%
579414291216121616111388282856Don't know/ No opinion6%6%7%6%5%5%8%4%6%8%e8%4%5%6%5%6%6%
631101391483451521271951601278021611298306327633Agree63%64%67%63%63%64%63%62%64%64%56%62%67%f69%f59%67%zb63%bf
159294408334245939283468151010451155Disagree16%18%n6%17%n15%14%12%19%j16%14%c24%zcdg19%zcd9%7%20%za11%15%acdn
472723610826311810313612198451489889202276478Net agree47%46%61%zlmo46%48%50%51%44%49%50%f32%42%f58%zef62%zefg39%57%zb48%bef
Public Perceptions of the NHS and Social CareFINAL PUBLIC
Table 9Q2.b To what extent, if at all, do you agree or disagree with the following statements?
- The NHS is providing a good service nationally -
Base : All respondents
Respondent type : General public aged 16+ Fieldwork dates : 14th November - 9th December 2011Source : Ipsos MORI (JN10-039262-01)Proportions/Means: Columns Tested (5% risk level) - z/a/b - z/c/d/e/f/g - z/h/i/j/k - z/l/m/n/o - z/pOverlap formulae used. * small base

People aretreated with
Unwtddignity andtotalrespectNHS useHospital useEthnicityNHS/social care staffHousehold TypeHome Ownership
NotAdultshospitalHospitalInformalSocialwith
Non NHS/A&E/A&EsocialcareKnow NHSNHSdependentNon-Owner -PrivateSocialWtd.DisagreeAgreeuserNHS useruseruserMixedWhiteAsianBlackcarerworkerstaffstaffchildrenpensionerPensionerOtheroccupierrenterrenterTotal
(v)(u)(t)(s)(r)(q)(p)(o)(n)(m)(l)(k)(j)(i)(h)(g)(f)(e)(d)(c)(b)(a)(z)100130864710090145854310750741612543628951291461249106491691731001Unweighted Total1001304652104*89746853311**74778*15925038*29252*30547522110**6401781731001Weighted Total11361021110151611805242853163452261701922112Strongly agree11%2%16%zu11%11%11%12%9%11%7%15%11%14%11%12%11%11%12%10%11%11%13%11%u
5181363655346824927143884383134261652416824211173429379521Tend to agree52%45%56%zu51%52%53%51%41%52%55%52%54%67%h56%47%55%51%50%72%53%52%46%52%u
1545889211368571410715302913864186291883236157Neither agree nor15%19%t14%20%15%18%zp13%40%14%19%19%12%3%13%12%14%18%z13%10%14%18%21%c16%cjknpdisagree
t
1256549111115073-10161539336123754311782519122Tend to disagree12%21%zt7%11%12%11%14%-14%z8%10%16%8%12%23%zi12%11%14%8%12%14%11%12%t
342381321122-29121117310176-224733Strongly disagree3%8%zt1%1%4%2%4%-4%1%1%4%3%2%5%3%4%3%-3%2%4%3%t
57163874922341428582151152417-4151056Don't know/ No opinion6%5%6%7%5%5%6%10%6%11%l3%3%6%5%2%5%5%8%-6%3%6%6%
6311424676456930033354694810716231197302022941388412112101633Agree63%47%72%zu62%63%64%62%49%63%62%67%65%80%zhk67%58%66%62%62%82%64%63%58%63%u
1598856121436095-13071750443154771371992926155Disagree16%29%zt9%12%16%13%18%zq-17%zl9%11%20%zi11%15%28%zi15%15%17%8%16%16%15%15%qt
472544115242624023853384190111271541615522310083138375478Net agree47%18%63%zu50%48%51%zp45%49%45%53%57%zn45%h70%zhik53%hk30%51%47%45%74%49%47%43%48%hnpu
Public Perceptions of the NHS and Social CareFINAL PUBLIC
Table 10Q2.b To what extent, if at all, do you agree or disagree with the following statements?
- The NHS is providing a good service nationally -
Base : All respondents
Respondent type : General public aged 16+ Fieldwork dates : 14th November - 9th December 2011Source : Ipsos MORI (JN10-039262-01)Proportions/Means: Columns Tested (5% risk level) - z/a/b/c/d - z/e/f/g - z/h/i/j/k - z/l/m/n/o - z/p/q - z/r/s - z/t/u - z/vOverlap formulae used. * small base; ** very small base (under 30) ineligible for sig testing

UnwtdtotalFuture of NHSSatisfaction with NHSGOR
DisYorkshire &WestEastWtd.WorseSameBettersatisfiedSatisfiedHumbersideMidlandsSouth-WestSouth-EastNorth-WestNorth-EastLondonEasternMidlandsTotal
(o)(n)(m)(l)(k)(j)(i)(h)(g)(f)(e)(d)(c)(b)(a)(z)1001328298343168703909910715413955143126881001Unweighted Total1001327302340168701100*106*10216213651*14810986*1001Weighted Total113333539410610101019261061210112Strongly agree11%10%12%11%3%15%zk10%9%10%12%c19%zcgh20%zc4%11%c11%c11%ck
51815317217949414544348857824756548521Tend to agree52%47%57%zn53%29%59%zk54%41%47%53%58%h46%51%60%gh56%h52%hkn
154524655318712211827141236117157Neither agree nor15%16%15%16%18%j12%12%20%abe17%16%10%23%abe24%zabei10%8%16%ajdisagree
12563223451481615171510323139122Tend to disagree12%19%zlm7%10%30%zj7%16%e14%16%e10%7%6%16%e12%11%12%jm
341431626517254122833Strongly disagree3%4%m1%5%m15%zj1%1%7%zbci2%3%3%1%1%1%10%zbcefgi3%jm
571324177426108114266456Don't know/ No opinion6%4%8%n5%4%6%6%10%e8%7%3%3%4%5%4%6%
6311862072185452064535810410434817758633Agree63%57%69%zn64%32%74%zk64%50%56%64%h77%zcfghi66%55%71%cgh67%h63%chkn
159762550775317221920154251517155Disagree16%23%zlm8%15%m46%zj7%17%21%de19%13%11%7%17%14%20%de15%jm
472110182168-23467473139849030566240478Net agree47%34%60%zln49%n-14%67%zk47%h29%38%52%cgh66%zacfghi59%cgh38%57%zcgh47%h48%cghkn
Public Perceptions of the NHS and Social CareFINAL PUBLIC
Table 11Q2.b To what extent, if at all, do you agree or disagree with the following statements?
- The NHS is providing a good service nationally -
Base : All respondents
Respondent type : General public aged 16+ Fieldwork dates : 14th November - 9th December 2011Source : Ipsos MORI (JN10-039262-01)Proportions/Means: Columns Tested (5% risk level) - z/a/b/c/d/e/f/g/h/i - z/j/k - z/l/m/n - z/oOverlap formulae used. * small base

UnwtdPrivate healthSatisfaction withImpact of NHS reformsGovernment has righttotalinsurancesocial careon patientsNHS policyNHS use in last year
SocialNHSDissatisficareWalk InChoicesPharmacistWtd.
NoYesedSatisfiedWorseBetterDisagreeAgreeservicesClinicwebsite/ChemistNHS DirectA&EOutpatientInpatientGPTotal(r)(q)(p)(o)(n)(m)(l)(k)(j)(i)(h)(g)(f)(e)(d)(c)(b)(a)(z)10018151704424938220040326945182553001772253931967801001Unweighted Total100181117544*24437920139327642*18856*3011832303761927731001Weighted Total1139515234403135534229302624462888112Strongly agree11%12%8%4%14%11%15%z9%19%zk8%12%15%10%14%10%12%15%11%11%k
5184111011812719010715917119105211539112018599398521Tend to agree52%51%58%41%52%50%53%40%62%zk46%56%g38%51%50%52%g49%52%51%g52%gk
154129278344741693232064226314919118157Neither agree nor15%16%15%17%14%12%20%zm18%j12%7%11%11%14%14%14%13%10%15%b16%bhjmdisagree
125101201228621181982514491931512699122Tend to disagree12%13%12%26%zn12%16%zl6%21%zj3%19%13%26%zabcdeh16%zae10%14%14%13%13%12%jl
3426641122230-31011512101972833Strongly disagree3%3%3%9%z4%6%zl1%8%zj-7%5%2%5%6%za4%5%z3%4%3%jl
57496110199191056513111425134256Don't know/ No opinion6%6%4%3%4%5%5%5%4%13%zafh3%8%4%6%6%7%h7%5%6%
631506116201612301371932252312730183116143231127486633Agree63%62%66%45%66%o61%68%49%81%zk55%68%g53%61%64%62%62%66%63%63%ko
159127261639841311191135166330417032126155Disagree16%16%15%35%zn16%22%zl7%28%zj3%26%19%28%zae21%za17%18%19%z17%16%15%jl
472379894122145124822151292141208610216195359478Net agree47%47%51%9%50%o38%62%zm21%78%zk29%49%fgi26%40%g47%fgi44%gi43%g49%cfgi46%fgi48%cfgikmo
Public Perceptions of the NHS and Social CareFINAL PUBLIC
Table 12Q2.b To what extent, if at all, do you agree or disagree with the following statements?
- The NHS is providing a good service nationally -
Base : All respondents
Respondent type : General public aged 16+ Fieldwork dates : 14th November - 9th December 2011Source : Ipsos MORI (JN10-039262-01)Proportions/Means: Columns Tested (5% risk level) - z/a/b/c/d/e/f/g/h/i - z/j/k - z/l/m - z/n/o - z/p/q - z/rOverlap formulae used. * small base

UnwtdtotalWork StatusSocial GradeAgeGender
Full/part-Wtd.OtherUnemployedRetiredtimeDEC2C1AB65+55-6435-5425-3416-24FemaleMaleTotal
(p)(o)(n)(m)(l)(k)(j)(i)(h)(g)(f)(e)(d)(c)(b)(a)(z)1001162612705082472013062472201693311581235274741001Unweighted Total100115758*2355512392013122491981433501671435154861001Weighted Total259321781122625169696940714329115137252Strongly agree26%21%28%35%zlo22%26%25%22%28%35%zcde28%20%26%20%22%28%zb25%bel
517862811728913210215812897721818683279241520Tend to agree52%54%48%50%52%55%51%51%51%49%51%52%52%58%54%50%52%84147125214183321109391414424486Neither agree nor8%9%13%m5%9%m6%9%11%8%5%6%11%g8%10%8%9%9%gmdisagree
911451756241834171413401510563792Tend to disagree9%9%8%7%10%10%9%11%7%7%9%11%9%7%11%8%9%
328161766119671233191232Strongly disagree3%5%1%3%3%2%3%4%4%3%5%3%2%2%4%3%3%
183111517661176551419Don't know/ No opinion2%2%2%*3%m*3%k2%2%*1%2%4%g3%1%3%zb2%bgkm
77611845198411194153228196167112252129112394378771Agree78%75%77%84%zlo75%81%i76%73%79%84%ze79%72%77%78%76%78%77%ei
12322524732923462620215218137549124Disagree12%14%9%10%13%12%12%15%10%10%14%15%11%9%15%za10%12%a
65396391753381651301821711469220011199319329648Net agree65%61%67%74%zlo61%69%i64%58%69%i74%zef64%57%66%69%e62%68%65%eil
Public Perceptions of the NHS and Social CareFINAL PUBLIC
Table 13Q2.c To what extent, if at all, do you agree or disagree with the following statements?
- My local NHS is providing me with a good service -
Base : All respondents
Respondent type : General public aged 16+ Fieldwork dates : 14th November - 9th December 2011Source : Ipsos MORI (JN10-039262-01)Proportions/Means: Columns Tested (5% risk level) - z/a/b - z/c/d/e/f/g - z/h/i/j/k - z/l/m/n/o - z/pOverlap formulae used. * small base

People aretreated with
Unwtddignity andtotalrespectNHS useHospital useEthnicityNHS/social care staffHousehold TypeHome Ownership
NotAdultshospitalHospitalInformalSocialwith
Non NHS/A&E/A&EsocialcareKnow NHSNHSdependentNon-Owner -PrivateSocialWtd.DisagreeAgreeuserNHS useruseruserMixedWhiteAsianBlackcarerworkerstaffstaffchildrenpensionerPensionerOtheroccupierrenterrenterTotal
(v)(u)(t)(s)(r)(q)(p)(o)(n)(m)(l)(k)(j)(i)(h)(g)(f)(e)(d)(c)(b)(a)(z)100130864710090145854310750741612543628951291461249106491691731001Unweighted Total1001304652104*89746853311**74778*15925038*29252*30547522110**6401781731001Weighted Total2594220423229107145319316386997814711067621604445252Strongly agree26%14%31%zu22%26%23%27%31%26%21%24%28%24%27%26%23%22%34%zfg20%25%25%26%25%fu
5171423474847224827163734691111181522716024911163399481520Tend to agree52%47%53%46%53%53%51%59%50%59%57%44%46%52%k52%52%52%50%61%53%53%47%52%knu
84374719675234166513224264294710251112286Neither agree nor8%12%zt7%18%zr7%11%zp6%10%9%7%8%9%11%9%8%9%e10%e5%19%8%6%13%zb9%eprtdisagree
9151364883062-71615355295294518-61171492Tend to disagree9%17%zt6%4%10%zs6%12%zq-9%8%9%14%z13%10%9%10%10%8%-10%9%8%9%qst
322372291517-291110-3111146-176932Strongly disagree3%8%zt1%2%3%3%3%-4%zl1%1%4%i-1%2%4%3%3%-3%4%5%3%ilt
18109911154-154132515131-125219Don't know/ No opinion2%3%1%8%zr1%3%zp1%-2%5%1%1%6%k2%2%2%3%e*-2%3%1%2%epr
77618355271701356416105676212918027230412313551868499138126771Agree78%60%85%zu68%78%zs76%78%90%76%80%81%72%70%79%k78%76%75%84%zfg81%78%78%73%77%ksu
123744461184579-100716455326405924-782323124Disagree12%24%zt7%6%13%zs10%15%zq-13%9%10%18%zi13%11%11%13%13%11%-12%13%13%12%qst
65310950865583311337104675511313522198351902951628421115103648Net agree65%36%78%zu62%65%66%63%90%62%70%71%n54%57%68%k67%62%62%73%zfg81%66%65%60%65%knu
Public Perceptions of the NHS and Social CareFINAL PUBLIC
Table 14Q2.c To what extent, if at all, do you agree or disagree with the following statements?
- My local NHS is providing me with a good service -
Base : All respondents
Respondent type : General public aged 16+ Fieldwork dates : 14th November - 9th December 2011Source : Ipsos MORI (JN10-039262-01)Proportions/Means: Columns Tested (5% risk level) - z/a/b/c/d - z/e/f/g - z/h/i/j/k - z/l/m/n/o - z/p/q - z/r/s - z/t/u - z/vOverlap formulae used. * small base; ** very small base (under 30) ineligible for sig testing

UnwtdtotalFuture of NHSSatisfaction with NHSGOR
DisYorkshire &WestEastWtd.WorseSameBettersatisfiedSatisfiedHumbersideMidlandsSouth-WestSouth-EastNorth-WestNorth-EastLondonEasternMidlandsTotal
(o)(n)(m)(l)(k)(j)(i)(h)(g)(f)(e)(d)(c)(b)(a)(z)1001328298343168703909910715413955143126881001Unweighted Total1001327302340168701100*106*10216213651*14810986*1001Weighted Total25982827713226192726483722223219252Strongly agree26%25%27%23%8%32%zk19%26%c25%c30%c27%c43%zaceghi15%29%c22%25%ck
51715916218348406564555847825805145520Tend to agree52%49%54%54%29%58%zk56%43%54%52%57%h49%54%47%53%52%k
84322329233769813232511986Neither agree nor8%10%8%9%14%zj5%6%9%e8%e8%e1%5%17%zdefgi10%e11%e9%ejdisagree
9136213354221514781311810792Tend to disagree9%11%7%10%32%zj3%14%df13%df7%5%10%2%12%df9%8%9%j
321331524347365-12532Strongly disagree3%4%m1%5%m15%zj*4%6%c3%4%3%-1%2%5%c3%jm
1851125714421123119Don't know/ No opinion2%2%4%zl1%3%j1%1%4%4%1%1%2%2%3%1%2%jl
77624124326062633757381132115471028364771Agree78%74%81%n76%37%90%zk75%69%79%81%ch85%zch91%zabcghi69%76%75%77%chk
123502449792518201014181191212124Disagree12%15%m8%14%m47%zj4%18%df19%zdfg9%9%13%d2%13%d11%d13%d12%djm
653192219211-176075652711189846837153648Net agree65%59%73%zln62%-10%87%zk56%49%69%ch73%zchi72%chi89%zabcefghi56%65%h61%65%chkn
Public Perceptions of the NHS and Social CareFINAL PUBLIC
Table 15Q2.c To what extent, if at all, do you agree or disagree with the following statements?
- My local NHS is providing me with a good service -
Base : All respondents
Respondent type : General public aged 16+ Fieldwork dates : 14th November - 9th December 2011Source : Ipsos MORI (JN10-039262-01)Proportions/Means: Columns Tested (5% risk level) - z/a/b/c/d/e/f/g/h/i - z/j/k - z/l/m/n - z/oOverlap formulae used. * small base

UnwtdPrivate healthSatisfaction withImpact of NHS reformsGovernment has righttotalinsurancesocial careon patientsNHS policyNHS use in last year
SocialNHSDissatisficareWalk InChoicesPharmacistWtd.
NoYesedSatisfiedWorseBetterDisagreeAgreeservicesClinicwebsite/ChemistNHS DirectA&EOutpatientInpatientGPTotal(r)(q)(p)(o)(n)(m)(l)(k)(j)(i)(h)(g)(f)(e)(d)(c)(b)(a)(z)10018151704424938220040326945182553001772253931967801001Unweighted Total100181117544*24437920139327642*18856*3011832303761927731001Weighted Total259213345708457898810451466525311063203252Strongly agree26%26%19%10%29%o22%28%23%32%zk24%24%25%22%29%f23%29%zdf33%zadfh26%f25%o
51742193231261921151691562098251548712317985406520Tend to agree52%52%53%52%52%51%57%43%57%k47%52%44%51%48%53%b48%44%53%bc52%bck
84632161625144413314626161625125786Neither agree nor8%8%12%15%6%7%7%11%zj5%8%7%11%9%9%7%7%6%7%9%ajqdisagree
91741762151859137231042213245287392Tend to disagree9%9%10%14%9%14%zl4%15%zj5%16%12%18%za14%za11%14%za12%za15%za9%9%jl
32266442112512817651532632Strongly disagree3%3%3%9%zn2%6%zl*6%zj*4%4%1%2%3%2%4%b1%3%3%jl
18154-755651--51121819Don't know/ No opinion2%2%2%-3%1%3%2%2%2%h--2%1%*1%*1%2%ac
776633127281962771722582452914339220139176289148610771Agree78%78%72%62%80%o73%86%zm66%89%zk70%76%69%73%76%76%77%77%79%zf77%kmo
12399231026739851483111502738603198124Disagree12%12%13%23%zn10%19%zl5%22%zj5%20%17%20%16%za15%16%z16%za16%13%12%jl
653534104171702041631732312111128171113138229116511648Net agree65%66%59%39%70%o54%81%zm44%84%zk50%59%50%57%62%60%61%61%66%cdfghi65%cfgikmo
Public Perceptions of the NHS and Social CareFINAL PUBLIC
Table 16Q2.c To what extent, if at all, do you agree or disagree with the following statements?
- My local NHS is providing me with a good service -
Base : All respondents
Respondent type : General public aged 16+ Fieldwork dates : 14th November - 9th December 2011Source : Ipsos MORI (JN10-039262-01)Proportions/Means: Columns Tested (5% risk level) - z/a/b/c/d/e/f/g/h/i - z/j/k - z/l/m - z/n/o - z/p/q - z/rOverlap formulae used. * small base

My local NHS isThe NHS isThe governmentproviding meproviding ahas the rightwith a goodgood servicepolicies for
servicenationallythe NHS100110011001Unweighted Total100110011001Weighted Total25211228Strongly agree25%11%3%
520521248Tend to agree52%52%25%86157226Neither agree nor9%16%23%disagree
92122262Tend to disagree9%12%26%
3233131Strongly disagree3%3%13%
1956105Don't know/ No opinion2%6%11%
771633276Agree77%63%28%
124155393Disagree12%15%39%
648478-117Net agree65%48%-12%
Public Perceptions of the NHS and Social CareFINAL PUBLIC
Table 17Q2. To what extent, if at all, do you agree or disagree with the following statements?
- Summary -
Base : All respondents
Respondent type : General public aged 16+ Fieldwork dates : 14th November - 9th December 2011Source : Ipsos MORI (JN10-039262-01)

UnwtdtotalWork StatusSocial GradeAgeGender
Full/part-Wtd.OtherUnemployedRetiredtimeDEC2C1AB65+55-6435-5425-3416-24FemaleMaleTotal
(p)(o)(n)(m)(l)(k)(j)(i)(h)(g)(f)(e)(d)(c)(b)(a)(z)1001162612705082472013062472201693311581235274741001Unweighted Total100115758*2355512392013122491981433501671435154861001Weighted Total
6212116301912121714132446392160Get much better6%8%2%7%5%8%i6%4%7%7%d9%d7%d2%4%8%za4%6%ad
281432064153705295635346935236134147280Get better28%28%35%27%28%29%26%31%25%27%32%27%31%25%26%30%28%
2984519661726967818562301066045144158302Stay about the same30%29%32%28%31%29%33%26%34%i31%f21%30%f36%f31%28%32%30%f
266431464144624792644841943647148118266Get worse27%27%24%27%26%26%23%30%26%24%28%27%21%33%d29%24%27%626214399132416121324103323062Get much worse6%4%3%6%7%4%6%8%7%6%9%c7%6%2%6%6%6%
3262111291184101866181331Don't know3%4%3%5%2%4%6%zh2%2%5%f1%2%4%4%4%3%3%
34356218018389641078067581185642173167340Better34%36%36%34%33%37%32%34%32%34%41%zc34%34%29%34%34%34%
32850167818371601168060541184551180147327Worse33%32%28%33%33%30%30%37%z32%30%37%d34%27%35%35%30%33%15652*184-9*75*11-9-72013Net better1%4%zlm9%zlm1%l*7%zhij2%h-3%*3%ze3%ze*6%zce-6%-1%4%zb1%bcil
Public Perceptions of the NHS and Social CareFINAL PUBLIC
Table 18Q.3 Thinking about the NHS over the next few years do you expect it to ..... .?
Base : All respondents
Respondent type : General public aged 16+ Fieldwork dates : 14th November - 9th December 2011Source : Ipsos MORI (JN10-039262-01)Proportions/Means: Columns Tested (5% risk level) - z/a/b - z/c/d/e/f/g - z/h/i/j/k - z/l/m/n/o - z/pOverlap formulae used. * small base

People aretreated with
Unwtddignity andtotalrespectNHS useHospital useEthnicityNHS/social care staffHousehold TypeHome Ownership
NotAdultshospitalHospitalInformalSocialwith
Non NHS/A&E/A&EsocialcareKnow NHSNHSdependentNon-Owner -PrivateSocialWtd.DisagreeAgreeuserNHS useruseruserMixedWhiteAsianBlackcarerworkerstaffstaffchildrenpensionerPensionerOtheroccupierrenterrenterTotal
(v)(u)(t)(s)(r)(q)(p)(o)(n)(m)(l)(k)(j)(i)(h)(g)(f)(e)(d)(c)(b)(a)(z)100130864710090145854310750741612543628951291461249106491691731001Unweighted Total1001304652104*89746853311**74778*15925038*29252*30547522110**6401781731001Weighted Total
6228323571545-5136224125172914137101260Get much better6%9%zt5%3%6%3%8%zq-7%4%4%9%zi11%4%10%6%6%6%10%6%6%7%6%qt
2817019326254134146320523486898314761455921854944280Get better28%23%30%u25%28%29%27%30%27%30%30%27%23%28%27%25%31%27%18%29%28%26%28%u
2988021039263157145222429467110898981396531954955302Stay about the same30%26%32%37%29%33%zp27%20%30%37%29%28%h27%30%h15%32%29%30%29%31%27%32%30%hp
26687168272391261404200184062118920831245931645048266Get worse27%29%26%26%27%27%26%41%27%23%25%25%28%30%38%k27%26%27%31%26%28%28%27%6233273591943148110233144193013-4015762Get much worse6%11%zt4%2%7%4%8%zq9%6%1%7%9%zi9%5%8%6%6%6%-6%8%4%6%qt
326236251714-19394151137111195631Don't know3%2%3%6%3%4%3%-3%4%6%n2%3%2%2%4%f2%5%f12%3%3%3%3%f
34398224303111491913256265490139520931747332225957340Better34%32%34%28%35%32%36%30%34%34%34%36%34%33%37%30%37%33%28%35%33%33%34%
32812019530298145183524819508514103241011557132046556327Worse33%39%zt30%28%33%31%34%50%33%25%32%34%36%35%46%z33%33%32%31%32%37%32%33%t
15-2229*1358-28745-1-8-5-9202*18-6113Net better1%-7%4%zu*1%1%2%-20%1%9%zln2%2%hj-2%-3%-9%-3%4%zeg1%-2%3%zb-4%1%1%bghij
Public Perceptions of the NHS and Social CareFINAL PUBLIC
Table 19Q.3 Thinking about the NHS over the next few years do you expect it to ..... .?
Base : All respondents
Respondent type : General public aged 16+ Fieldwork dates : 14th November - 9th December 2011Source : Ipsos MORI (JN10-039262-01)Proportions/Means: Columns Tested (5% risk level) - z/a/b/c/d - z/e/f/g - z/h/i/j/k - z/l/m/n/o - z/p/q - z/r/s - z/t/u - z/vOverlap formulae used. * small base; ** very small base (under 30) ineligible for sig testing

UnwtdtotalFuture of NHSSatisfaction with NHSGOR
DisYorkshire &WestEastWtd.WorseSameBettersatisfiedSatisfiedHumbersideMidlandsSouth-WestSouth-EastNorth-WestNorth-EastLondonEasternMidlandsTotal
(o)(n)(m)(l)(k)(j)(i)(h)(g)(f)(e)(d)(c)(b)(a)(z)1001328298343168703909910715413955143126881001Unweighted Total1001327302340168701100*106*10216213651*14810986*1001Weighted Total
62--6023365136811236560Get much better6%--18%zmn14%zj5%5%12%zcf6%5%8%c3%2%5%6%6%cmn
281--28046195312924424311413129280Get better28%--82%zmn28%28%31%27%23%26%32%21%28%28%33%28%mn
298-302-32230292635533617503422302Stay about the same30%-100%zln-19%33%zk29%24%34%33%26%33%34%31%26%30%kln
266266--43190242534413213462922266Get worse27%81%zlm--25%27%24%24%33%25%24%25%31%26%26%27%lm
6262--2227992108556862Get much worse6%19%zlm--13%zj4%9%g8%2%6%6%9%g4%5%10%g6%jlm
32---12314186534-31Don't know3%---1%3%1%4%1%5%a4%9%zacgi2%3%-3%klmn
343--34070231364230505512443733340Better34%--100%zmn42%zj33%36%40%30%31%40%d24%30%34%39%34%mn
328327--65217333436514017513531327Worse33%100%zlm--39%31%33%32%35%31%29%34%34%32%36%33%lm
15-327034051338-6-115-5-72313Net better1%-100%0%100%zn3%2%z3%f8%zbcdfg-6%*11%zabcdfgi-10%-5%2%f3%f1%cdg
Public Perceptions of the NHS and Social CareFINAL PUBLIC
Table 20Q.3 Thinking about the NHS over the next few years do you expect it to ..... .?
Base : All respondents
Respondent type : General public aged 16+ Fieldwork dates : 14th November - 9th December 2011Source : Ipsos MORI (JN10-039262-01)Proportions/Means: Columns Tested (5% risk level) - z/a/b/c/d/e/f/g/h/i - z/j/k - z/l/m/n - z/oOverlap formulae used. * small base

UnwtdPrivate healthSatisfaction withImpact of NHS reformsGovernment has righttotalinsurancesocial careon patientsNHS policyNHS use in last year
SocialNHSDissatisficareWalk InChoicesPharmacistWtd.
NoYesedSatisfiedWorseBetterDisagreeAgreeservicesClinicwebsite/ChemistNHS DirectA&EOutpatientInpatientGPTotal(r)(q)(p)(o)(n)(m)(l)(k)(j)(i)(h)(g)(f)(e)(d)(c)(b)(a)(z)10018151704424938220040326945182553001772253931967801001Unweighted Total100181117544*24437920139327642*18856*3011832303761927731001Weighted Total
624812519374466410523152337135260Get much better6%6%7%11%8%10%zl2%12%zj2%8%5%9%8%8%10%zah10%zah7%7%6%jl
281221551169125581108212511991486910054220280Get better28%27%31%24%28%33%z29%28%30%28%27%33%30%26%30%27%28%28%28%
29825045572378369109104798254629856221302Stay about the same30%31%25%11%29%o10%41%zm18%39%zk25%25%16%27%29%g27%26%29%g29%g30%cgkmo
26621349185912548115641256207448529849209266Get worse27%26%28%42%zn24%33%zl24%29%23%29%30%35%25%26%23%26%26%27%27%625010515494506416426151933135162Get much worse6%6%6%12%6%13%zl2%13%zj2%10%9%8%9%8%8%9%z7%7%6%jl
32274-106438-7-6351052031Don't know3%3%2%-4%2%2%1%3%k-4%-2%2%2%3%3%3%3%km
3432706716881626215689156123114639213668271340Better34%33%38%35%36%43%zl31%40%zj32%37%32%41%38%35%40%z36%35%35%34%
328263602474174531657116732499637213162260327Worse33%32%34%53%zn30%46%zl26%42%zj26%38%39%42%33%34%31%35%33%34%33%jl
1567-814-129-1018-1-12-115120551113Net better1%1%4%zq-18%6%zo-3%5%z-2%6%zk-2%-6%-1%5%zacegh*g9%zabcefgh1%3%e1%1%hkmoq
i
Public Perceptions of the NHS and Social CareFINAL PUBLIC
Table 21Q.3 Thinking about the NHS over the next few years do you expect it to ..... .?
Base : All respondents
Respondent type : General public aged 16+ Fieldwork dates : 14th November - 9th December 2011Source : Ipsos MORI (JN10-039262-01)Proportions/Means: Columns Tested (5% risk level) - z/a/b/c/d/e/f/g/h/i - z/j/k - z/l/m - z/n/o - z/p/q - z/rOverlap formulae used. * small base

UnwtdtotalWork StatusSocial GradeAgeGender
Full/part-Wtd.OtherUnemployedRetiredtimeDEC2C1AB65+55-6435-5425-3416-24FemaleMaleTotal
(p)(o)(n)(m)(l)(k)(j)(i)(h)(g)(f)(e)(d)(c)(b)(a)(z)1001162612705082472013062472201693311581235274741001Unweighted Total100115758*2355512392013122491981433501671435154861001Weighted Total1963712568762335938472750452210685192Been an inpatient at an20%23%l21%24%zl16%26%zhij16%19%15%24%ze19%14%27%zce16%21%18%19%elNHS hospital
3935720122176947611591104761164930218158376Attended an NHS hospital39%36%34%52%zlno32%39%38%37%37%53%zcde53%zcde33%c29%21%42%za32%38%acdlas an outpatient
225361743134534773573326784647120110230Visited an accident and22%23%30%m18%24%m22%23%23%23%17%18%22%28%fg33%zefg23%23%23%gmemergency (A&E)
department17722102013029246762151973502611270183Used NHS Direct18%14%18%m9%24%zmo12%12%22%jk25%zjk8%13%21%fg30%zcefg18%g22%za14%18%agjkm
3004618671707944958250421135837182119301Visited a Pharmacist/30%29%31%29%31%33%j22%31%j33%j25%30%32%35%g26%35%za24%30%ajChemist for medical
advice55727408225227721156421556Used the NHS Choices5%5%4%3%7%zm3%1%8%zjk9%zjk4%5%6%9%g4%8%za3%6%ajkmwebsite
18233162411549385645172478343410880188Used a walk-in clinic18%21%m27%m10%21%m21%19%18%18%9%17%g22%zg21%g24%g21%16%19%gm
78012045194414190137239208159114273126100420353773Visited an NHS GP78%76%78%82%zl75%79%j68%77%j83%zj80%c80%78%76%70%81%za73%77%acj
4595161313111251291334241842Used social care4%5%l8%l7%zl2%6%h6%h4%2%6%d6%d4%2%3%5%4%4%hlservices
85135106113253220914331616266389None of these8%8%9%4%11%zm5%13%k10%k8%5%10%g10%g10%11%g5%13%zb9%bgkm
22----11--1--12-2Don't know/refused*1%zl----1%*--1%--1%*-*
90114153223479225169275228187126312148125482415897NHS user90%90%91%95%zl87%94%zij84%88%91%j94%zcdef88%89%88%87%93%za85%90%ajl
10016512711333372211183819183471104Non NHS user10%10%9%5%13%zm6%16%zhk12%k9%6%12%g11%g12%g13%g7%15%zb10%bgkm
90214253223479226169275228187126312148125482415897NHS user inc. social90%90%91%95%zl87%95%zij84%88%91%j94%zcdef88%89%88%87%94%za85%90%ajlcare services
5438732145269136106160131124851679266299233533Hospital/A&E user54%56%55%62%zl49%57%53%51%53%62%zce59%ce48%55%46%58%za48%53%ael
Public Perceptions of the NHS and Social CareFINAL PUBLIC
Table 22Q.4 Which of the following health services, if any, have you personally used in the last year or so?
Base : All respondents
Respondent type : General public aged 16+ Fieldwork dates : 14th November - 9th December 2011Source : Ipsos MORI (JN10-039262-01)Proportions/Means: Columns Tested (5% risk level) - z/a/b - z/c/d/e/f/g - z/h/i/j/k - z/l/m/n/o - z/pOverlap formulae used. * small base

People aretreated with
Unwtddignity andtotalrespectNHS useHospital useEthnicityNHS/social care staffHousehold TypeHome Ownership
NotAdultshospitalHospitalInformalSocialwith
Non NHS/A&E/A&EsocialcareKnow NHSNHSdependentNon-Owner -PrivateSocialWtd.DisagreeAgreeuserNHS useruseruserMixedWhiteAsianBlackcarerworkerstaffstaffchildrenpensionerPensionerOtheroccupierrenterrenterTotal
(v)(u)(t)(s)(r)(q)(p)(o)(n)(m)(l)(k)(j)(i)(h)(g)(f)(e)(d)(c)(b)(a)(z)100130864710090145854310750741612543628951291461249106491691731001Unweighted Total1001304652104*89746853311**74778*15925038*29252*30547522110**6401781731001Weighted Total19656131-192-192-153102845967962765311163442192Been an inpatient at an20%18%20%-21%zs-36%zq-20%13%17%18%22%23%17%20%16%24%zf8%18%19%24%19%fqsNHS hospital
393122241-376-376430513519714117199516711432506162376Attended an NHS hospital39%40%37%-42%zs-71%zq38%41%zlm17%32%m39%37%40%36%31%35%52%zfg27%39%34%36%38%gmqsas an outpatient
22582146-230-230317310416713739811113821345045230Visited an accident and22%27%z22%-26%zs-43%zq32%23%m12%26%m27%33%25%17%27%e23%17%18%21%28%c26%23%cemqsemergency (A&E)
department17762114-1835313011482315196911808617-1223328183Used NHS Direct18%21%17%-20%zs11%24%zq11%20%zm2%19%m20%24%24%z21%26%zef18%e8%-19%18%16%18%emqs
30011117612288101199124510428911102121021405811905950301Visited a Pharmacist/30%37%zt27%12%32%zs22%37%zq11%33%zm13%27%m36%zh29%35%z22%34%30%26%10%30%33%29%30%mqstChemist for medical
advice551936-5615421491513224914366-3318656Used the NHS Choices5%6%6%-6%zs3%8%zq11%7%z1%3%5%5%8%z17%zk5%8%ze3%-5%10%zac3%6%eqswebsite
18257121-188691192147162155136157196211984643188Used a walk-in clinic18%19%19%-21%zs15%22%zq21%20%l21%13%22%h33%zh21%h9%23%ze20%e9%11%15%26%zc25%zc19%celqs
780239500-77334442995855112220128228392333571837500138128773Visited an NHS GP78%79%77%-86%zs73%80%zq80%78%m66%76%81%72%78%75%76%75%83%zf72%78%77%74%77%mqs
451624141834-36-512275141316-2061642Used social care4%5%4%1%5%2%6%zq-5%-3%5%5%2%9%i4%3%7%zf-3%3%9%zbc4%cfqservices
85285789-89-1601116134196295010-59161489None of these8%9%9%85%zr-19%zp-10%8%15%10%5%10%7%11%10%e10%e5%-9%9%8%9%ekpr
2--2-2--2----1-11-11--2Don't know/refused*--2%zr-*--*----*-**-8%*--*
901271586-897364533106726614223535265472714162109571162155897NHS user90%89%90%-100%zs78%100%zq90%90%85%89%94%z90%91%89%89%88%95%zfg92%89%91%89%90%qs
1003365104-104-17511171542763459111691618104Non NHS user10%11%10%100%zr-22%zp-10%10%15%11%6%10%9%11%11%e12%e5%8%11%9%11%10%ekpr
9022725861897365533106726614323535265472714162109571162155897NHS user inc. social90%89%90%1%100%zs78%100%zq90%90%85%90%94%z90%91%89%89%88%95%zfg92%89%91%90%90%qscare services
543171346-533-53354172779138211652515823813743389695533Hospital/A&E user54%56%53%-59%zs-100%zq49%56%zm35%50%m55%53%56%48%52%50%62%zfg38%53%54%55%53%mqs
Public Perceptions of the NHS and Social CareFINAL PUBLIC
Table 23Q.4 Which of the following health services, if any, have you personally used in the last year or so?
Base : All respondents
Respondent type : General public aged 16+ Fieldwork dates : 14th November - 9th December 2011Source : Ipsos MORI (JN10-039262-01)Proportions/Means: Columns Tested (5% risk level) - z/a/b/c/d - z/e/f/g - z/h/i/j/k - z/l/m/n/o - z/p/q - z/r/s - z/t/u - z/vOverlap formulae used. * small base; ** very small base (under 30) ineligible for sig testing

UnwtdtotalFuture of NHSSatisfaction with NHSGOR
DisYorkshire &WestEastWtd.WorseSameBettersatisfiedSatisfiedHumbersideMidlandsSouth-WestSouth-EastNorth-WestNorth-EastLondonEasternMidlandsTotal
(o)(n)(m)(l)(k)(j)(i)(h)(g)(f)(e)(d)(c)(b)(a)(z)1001328298343168703909910715413955143126881001Unweighted Total1001327302340168701100*106*10216213651*14810986*1001Weighted Total19662566841133192215303211242317192Been an inpatient at an20%19%19%20%24%19%19%21%15%18%24%21%16%21%19%19%NHS hospital
3931319813671255364540614822405132376Attended an NHS hospital39%40%33%40%42%36%36%42%c40%c38%35%43%c27%47%zc37%38%cmas an outpatient
22572629253149223030362812272224230Visited an accident and22%22%20%27%z31%zj21%22%28%30%c22%21%24%18%20%28%23%jemergency (A&E)
department17763546338119232220371914142113183Used NHS Direct18%19%18%19%22%17%23%c21%c20%c23%c14%27%ce9%19%c15%18%c
300998211463201333928504216382827301Visited a Pharmacist/30%30%27%34%37%zj29%33%37%27%31%31%32%26%25%31%30%Chemist for medical
advice55249231337784571128556Used the NHS Choices5%7%m3%7%m8%5%7%7%4%3%5%2%8%7%6%6%mwebsite
182734761411291615945349251518188Used a walk-in clinic18%22%m16%18%24%z18%16%14%8%28%zbcghi25%zbg18%17%14%21%g19%g
780260221271137548757082128103401129271773Visited an NHS GP78%79%73%80%82%78%75%66%80%h79%h75%78%75%84%h83%h77%h
45161015112566553159242Used social care4%5%3%5%7%4%6%5%5%3%2%2%3%8%ze3%4%services
852533267621012917105116989None of these8%8%11%8%4%9%k10%11%9%10%7%10%7%6%10%9%k
22---2---1--1--2Don't know/refused*1%---*---1%--1%--*
9012982633111596298691911441254613410178897NHS user90%91%87%91%95%zj90%86%86%89%89%92%90%91%93%90%90%
100303930972141511181151489104Non NHS user10%9%13%9%5%10%k14%14%11%11%8%10%9%7%10%10%k
9022982633121606298791911441254613410178897NHS user inc. social90%91%87%92%95%zj90%87%86%89%89%92%90%91%93%90%90%care services
543183145191105363536357856831716145533Hospital/A&E user54%56%48%56%m62%zj52%53%59%56%52%50%61%48%56%52%53%m
Public Perceptions of the NHS and Social CareFINAL PUBLIC
Table 24Q.4 Which of the following health services, if any, have you personally used in the last year or so?
Base : All respondents
Respondent type : General public aged 16+ Fieldwork dates : 14th November - 9th December 2011Source : Ipsos MORI (JN10-039262-01)Proportions/Means: Columns Tested (5% risk level) - z/a/b/c/d/e/f/g/h/i - z/j/k - z/l/m/n - z/oOverlap formulae used. * small base

UnwtdPrivate healthSatisfaction withImpact of NHS reformsGovernment has righttotalinsurancesocial careon patientsNHS policyNHS use in last year
SocialNHSDissatisficareWalk InChoicesPharmacistWtd.
NoYesedSatisfiedWorseBetterDisagreeAgreeservicesClinicwebsite/ChemistNHS DirectA&EOutpatientInpatientGPTotal(r)(q)(p)(o)(n)(m)(l)(k)(j)(i)(h)(g)(f)(e)(d)(c)(b)(a)(z)10018151704424938220040326945182553001772253931967801001Unweighted Total100181117544*24437920139327642*18856*3011832303761927731001Weighted Total1961593135665438647185415886077131192156192Been an inpatient at an20%20%18%7%23%o17%21%22%17%42%za29%za27%29%za33%za33%za35%zaf100%zacdefg20%19%oNHS hospital
hi
393307642097144771659427793015189117376131315376Attended an NHS hospital39%38%37%45%40%38%38%42%zj34%65%zaefh42%53%z50%zah49%za51%zah100%zabdefg69%zadefg41%z38%as an outpatient
hih
22518743136810838102521961201048523011777182230Visited an accident and22%23%24%30%28%z29%zl19%26%j19%45%zac33%za35%za35%za46%zacfh100%zabcefg31%za40%zac24%23%emergency (A&E)
hidepartment1771245614478130813596533104183858960166183Used NHS Direct18%15%32%zq32%z19%21%15%21%j13%22%35%zac59%zabcdfh35%zac100%zabcdfg37%zaci24%z31%zac22%z18%jq
ihi
300222761979144491456024863630110410415188266301Visited a Pharmacist/30%27%43%zq43%33%38%zl25%37%zj22%57%zac46%za65%zabcdh100%zabcdeg57%zabcdh45%za40%za46%za34%z30%jqChemist for medical
hiadvice5536207123152996215636332030155356Used the NHS Choices5%4%11%zq16%zn5%8%zl2%7%j3%15%za11%za100%zabcdef12%zac18%zabcdfh9%z8%z8%7%z6%jlqwebsite
hi
182153329387648775314188218665617954153188Used a walk-in clinic18%19%19%20%16%20%24%19%19%34%zac100%zabcdef37%zac28%zac36%zacdf27%za21%28%zac20%19%
gi
780623139401933171433242003615353266166182315156773773Visited an NHS GP78%77%79%91%z79%84%zl71%82%zj72%85%82%93%zbdh88%zbcdh91%zbcdh79%84%z82%100%zbcdefg77%jl
hi
45382417225247421462491927183642Used social care4%5%p1%9%7%z6%2%6%zj2%100%zabcdefg8%z11%za8%za5%8%za7%za9%za5%4%pservices
h
85701721421212433---------89None of these8%9%10%5%6%6%10%m6%12%k---------9%abcdefgh
ikmn
22----------------2Don't know/refused**----------------*
901730153422293531773622414118856288183230376192773897NHS user90%90%88%95%94%z93%zl88%92%zj87%98%100%zfi100%z96%z100%zf100%zfi100%zfi100%zfi100%zfi90%
1008122215262431351--12-----104Non NHS user10%10%12%5%6%7%12%m8%13%k2%abcdh--4%abcdeh-----10%abcdefgh
kmn
902731153422293541773632414218856288183230376192773897NHS user inc. social90%90%88%95%94%z93%zl88%92%zj87%100%z100%zf100%z96%z100%zf100%zf100%zf100%zf100%zf90%care services
54343296291392111022321313411942199130230376192429533Hospital/A&E user54%53%55%65%57%56%51%59%zj48%82%zafh63%za74%za66%za71%za100%zaefghi100%zaefgh100%zaefgh55%z53%j
ii
Public Perceptions of the NHS and Social CareFINAL PUBLIC
Table 25Q.4 Which of the following health services, if any, have you personally used in the last year or so?
Base : All respondents
Respondent type : General public aged 16+ Fieldwork dates : 14th November - 9th December 2011Source : Ipsos MORI (JN10-039262-01)Proportions/Means: Columns Tested (5% risk level) - z/a/b/c/d/e/f/g/h/i - z/j/k - z/l/m - z/n/o - z/p/q - z/rOverlap formulae used. * small base

UnwtdtotalWork StatusSocial GradeAgeGender
Full/part-Wtd.OtherUnemployedRetiredtimeDEC2C1AB65+55-6435-5425-3416-24FemaleMaleTotal
(p)(o)(n)(m)(l)(k)(j)(i)(h)(g)(f)(e)(d)(c)(b)(a)(z)54393341672491421081611321381011618756310233543Unweighted Total54387*32*14526913610616013112485*16792*66*299233533Weighted Total1032362451341729232292731146439103Been an inpatient at a19%27%m17%16%19%25%16%18%17%17%11%16%34%zefg21%21%17%19%fNHS hospital
3084218102130696291698664942720166124291Attended an NHS hospital57%48%55%70%zlo48%51%59%57%53%70%zcde76%zcde56%cd29%30%56%53%55%cdlas an outpatient
13121920883327403816114633326969138Visited an accident and24%24%m28%m14%33%zm24%25%25%29%13%13%27%fg36%zfg49%zefg23%30%26%fgmemergency (A&E)
department11------1-1----11Don't know*1%------1%-1%----**
Public Perceptions of the NHS and Social CareFINAL PUBLIC
Table 26Q5. You say you have been an NHS inpatient, or an NHS outpatient or have visited an A&E department in an NHS hospital within the last year or so.Which ONE of these was the most recent hospital visit you have made as a patient?
Base : All respondents who have been an inpatient, outpatient or A&E user in the last year
Respondent type : General public aged 16+ Fieldwork dates : 14th November - 9th December 2011Source : Ipsos MORI (JN10-039262-01)Proportions/Means: Columns Tested (5% risk level) - z/a/b - z/c/d/e/f/g - z/h/i/j/k - z/l/m/n/o - z/pOverlap formulae used. * small base

People aretreated with
Unwtddignity andtotalrespectNHS useHospital useEthnicityNHS/social care staffHousehold TypeHome Ownership
NotAdultshospitalHospitalInformalSocialwith
Non NHS/A&E/A&EsocialcareKnow NHSNHSdependentNon-Owner -PrivateSocialWtd.DisagreeAgreeuserNHS useruseruserMixedWhiteAsianBlackcarerworkerstaffstaffchildrenpensionerPensionerOtheroccupierrenterrenterTotal
(v)(u)(t)(s)(r)(q)(p)(o)(n)(m)(l)(k)(j)(i)(h)(g)(f)(e)(d)(c)(b)(a)(z)543177350-543-54354262781140191662515123615643499397543Unweighted Total543171346-**533-**5335**41727**79*13821**16525**1582381374**33896*95*533Weighted Total1033269-103-103-78817275326403924-592321103Been an inpatient at a19%18%20%-19%-19%-19%29%21%19%27%20%24%25%zf17%17%-17%24%22%19%NHS hospital
30893186-291-291423911367198815661329332004147291Attended an NHS hospital57%54%54%-55%-55%77%57%z40%46%51%44%54%59%42%55%g68%zfg72%59%zb43%49%55%bgas an outpatient
1314691-138-1381999264064445167191803126138Visited an accident and24%27%26%-26%-26%23%24%32%33%29%29%27%17%33%ze28%e14%28%24%33%27%26%enemergency (A&E)
department11--1-1-1--------1---11Don't know*1%--*-*-*--------1%---1%*
Public Perceptions of the NHS and Social CareFINAL PUBLIC
Table 27Q5. You say you have been an NHS inpatient, or an NHS outpatient or have visited an A&E department in an NHS hospital within the last year or so.Which ONE of these was the most recent hospital visit you have made as a patient?
Base : All respondents who have been an inpatient, outpatient or A&E user in the last year
Respondent type : General public aged 16+ Fieldwork dates : 14th November - 9th December 2011Source : Ipsos MORI (JN10-039262-01)Proportions/Means: Columns Tested (5% risk level) - z/a/b/c/d - z/e/f/g - z/h/i/j/k - z/l/m/n/o - z/p/q - z/r/s - z/t/u - z/vOverlap formulae used. * small base; ** very small base (under 30) ineligible for sig testing

UnwtdtotalFuture of NHSSatisfaction with NHSGOR
DisYorkshire &WestEastWtd.WorseSameBettersatisfiedSatisfiedHumbersideMidlandsSouth-WestSouth-EastNorth-WestNorth-EastLondonEasternMidlandsTotal
(o)(n)(m)(l)(k)(j)(i)(h)(g)(f)(e)(d)(c)(b)(a)(z)543185147196106371476061817034707347543Unweighted Total54318314519110536353*63*57*85*68*31*71*61*45*533Weighted Total1033930331976812121513719107103Been an inpatient at a19%21%21%17%18%21%15%19%21%18%20%21%27%17%15%19%NHS hospital
3081057310357195283326484019324024291Attended an NHS hospital57%58%51%54%54%54%53%53%47%56%59%62%45%66%zcg55%55%as an outpatient
131394055299217171922155201113138Visited an accident and24%21%28%29%27%25%32%27%33%b26%22%17%28%17%30%26%emergency (A&E)
department1-1--1-1-------1Don't know*-1%--*-1%-------*
Public Perceptions of the NHS and Social CareFINAL PUBLIC
Table 28Q5. You say you have been an NHS inpatient, or an NHS outpatient or have visited an A&E department in an NHS hospital within the last year or so.Which ONE of these was the most recent hospital visit you have made as a patient?
Base : All respondents who have been an inpatient, outpatient or A&E user in the last year
Respondent type : General public aged 16+ Fieldwork dates : 14th November - 9th December 2011Source : Ipsos MORI (JN10-039262-01)Proportions/Means: Columns Tested (5% risk level) - z/a/b/c/d/e/f/g/h/i - z/j/k - z/l/m/n - z/oOverlap formulae used. * small base

UnwtdPrivate healthSatisfaction withImpact of NHS reformsGovernment has righttotalinsurancesocial careon patientsNHS policyNHS use in last year
SocialNHSDissatisficareWalk InChoicesPharmacistWtd.
NoYesedSatisfiedWorseBetterDisagreeAgreeservicesClinicwebsite/ChemistNHS DirectA&EOutpatientInpatientGPTotal(r)(q)(p)(o)(n)(m)(l)(k)(j)(i)(h)(g)(f)(e)(d)(c)(b)(a)(z)54344394291432131042411303711741201126225393196440543Unweighted Total54343296*29**13921110223213134*11942*199130230376192429533Weighted Total103841812935254428928114534345210283103Been an inpatient at a19%19%19%3%21%17%24%19%21%27%cd23%cd27%cd23%cd26%zacd15%14%53%zacdefg19%cd19%cdNHS hospital
hi
3082434417721115312976185919102475928968241291Attended an NHS hospital57%56%46%60%51%53%52%55%58%52%bd50%bde44%d51%bde36%d26%77%zabdefg36%d56%bde55%bdeas an outpatient
hi
131104331138652360287321251481373420103138Visited an accident and24%24%35%zq37%27%31%z23%26%21%21%c27%bc29%bc26%bc37%zabcfh59%zabcefg9%11%24%bc26%bcemergency (A&E)
hidepartment11--1-1-----11-1111Don't know**--1%-1%-----*1%-****
Public Perceptions of the NHS and Social CareFINAL PUBLIC
Table 29Q5. You say you have been an NHS inpatient, or an NHS outpatient or have visited an A&E department in an NHS hospital within the last year or so.Which ONE of these was the most recent hospital visit you have made as a patient?
Base : All respondents who have been an inpatient, outpatient or A&E user in the last year
Respondent type : General public aged 16+ Fieldwork dates : 14th November - 9th December 2011Source : Ipsos MORI (JN10-039262-01)Proportions/Means: Columns Tested (5% risk level) - z/a/b/c/d/e/f/g/h/i - z/j/k - z/l/m - z/n/o - z/p/q - z/rOverlap formulae used. * small base; ** very small base (under 30) ineligible for sig testing

UnwtdtotalWork StatusSocial GradeAgeGender
Full/part-Wtd.OtherUnemployedRetiredtimeDEC2C1AB65+55-6435-5425-3416-24FemaleMaleTotal
(p)(o)(n)(m)(l)(k)(j)(i)(h)(g)(f)(e)(d)(c)(b)(a)(z)1001162612705082472013062472201693311581235274741001Unweighted Total100115758*2355512392013122491981433501671435154861001Weighted Total3724320124172797410898113591034639177182359Very satisfied37%28%35%53%zlno31%33%37%35%39%57%zcdef41%cde29%27%27%34%37%36%cdelo
387672370234109761208953501518159217177394Fairly satisfied39%43%m39%30%43%zm45%zh38%39%36%27%35%43%g48%zfg41%g42%36%39%gm
64105133812102816101025813293766Neither satisfied nor6%7%8%6%7%5%5%9%6%5%7%7%4%9%6%8%7%dissatisfied
6313411361515211389211610333164Fairly dissatisfied6%8%8%5%7%6%7%7%5%4%6%6%9%g7%6%6%6%
421225238101411371968251743Very dissatisfied4%8%zm4%2%4%3%5%4%4%1%5%g5%g4%6%g5%4%4%gm
73124124716162122119311113344275Don't know/no opinion7%8%6%5%9%7%8%7%9%6%6%9%7%9%7%9%8%
7591104319440618815022818716610925312698395359753Satisfied76%70%74%82%zlo74%79%74%73%75%84%zcdef76%72%76%69%77%74%75%
10524716602225352411154022185848106Dissatisfied10%16%zm11%7%11%9%13%11%10%6%11%11%g13%g13%g11%10%11%gm
65486361783461661251941631559321310480336311647Net Satisfied65%55%63%76%zlno63%69%62%62%66%78%zcdef65%61%62%56%65%64%65%co
Public Perceptions of the NHS and Social CareFINAL PUBLIC
Table 30Q6. Now thinking about the last time you visited an NHS hospital, overall, how satisfied or dissatisfied were you with this last visit as a patient?
Base : All respondents
Respondent type : General public aged 16+ Fieldwork dates : 14th November - 9th December 2011Source : Ipsos MORI (JN10-039262-01)Proportions/Means: Columns Tested (5% risk level) - z/a/b - z/c/d/e/f/g - z/h/i/j/k - z/l/m/n/o - z/pOverlap formulae used. * small base

People aretreated with
Unwtddignity andtotalrespectNHS useHospital useEthnicityNHS/social care staffHousehold TypeHome Ownership
NotAdultshospitalHospitalInformalSocialwith
Non NHS/A&E/A&EsocialcareKnow NHSNHSdependentNon-Owner -PrivateSocialWtd.DisagreeAgreeuserNHS useruseruserMixedWhiteAsianBlackcarerworkerstaffstaffchildrenpensionerPensionerOtheroccupierrenterrenterTotal
(v)(u)(t)(s)(r)(q)(p)(o)(n)(m)(l)(k)(j)(i)(h)(g)(f)(e)(d)(c)(b)(a)(z)100130864710090145854310750741612543628951291461249106491691731001Unweighted Total1001304652104*89746853311**74778*15925038*29252*30547522110**6401781731001Weighted Total372742772333612323722928538912105168715112142524954359Very satisfied37%25%42%zu22%37%zs26%44%zq17%39%zm11%33%m36%33%36%31%28%32%55%zfg42%39%zab28%31%36%bfgmq
su
38711825132362195199726938799521124201401936142457767394Fairly satisfied39%39%39%31%40%42%37%63%36%49%n50%zn38%54%k42%38%46%ze41%e28%38%38%43%39%39%en
643232957343215455191195213213-40111566Neither satisfied nor6%11%zt5%8%6%7%6%10%7%7%3%8%3%6%10%7%7%6%-6%6%9%7%tdissatisfied
6331288552538-4751212219417397135101864Fairly dissatisfied6%10%zt4%8%6%5%7%-6%6%7%5%5%7%7%6%8%ze3%8%5%6%10%zc6%et
4228133391528-35352029419176-2212943Very dissatisfied4%9%zt2%3%4%3%5%-5%4%3%8%zi6%3%7%6%z4%3%-3%7%5%4%t
731950284775-15118615-173214312146181075Don't know/no opinion7%6%8%27%zr5%16%zp-10%7%23%zln3%6%-6%6%7%9%5%12%7%10%6%8%lpr
7591935285669831843595604713218433228362263441838497127121753Satisfied76%63%81%zu53%78%zs68%82%zq80%75%m60%83%zmn74%87%h78%69%74%73%83%zfg80%78%za71%70%75%mqsu
105594112954066-828173242973756141572227106Dissatisfied10%19%zt6%11%11%9%12%-11%10%10%13%10%10%14%12%e12%e6%8%9%12%15%zc11%cet
654134487446032783699479381151532920029189289169744010494647Net Satisfied65%44%75%zu42%67%zs59%69%zq80%64%m49%72%zm61%76%h68%k55%62%61%76%zfg73%69%zab59%55%65%afmqs
u
Public Perceptions of the NHS and Social CareFINAL PUBLIC
Table 31Q6. Now thinking about the last time you visited an NHS hospital, overall, how satisfied or dissatisfied were you with this last visit as a patient?
Base : All respondents
Respondent type : General public aged 16+ Fieldwork dates : 14th November - 9th December 2011Source : Ipsos MORI (JN10-039262-01)Proportions/Means: Columns Tested (5% risk level) - z/a/b/c/d - z/e/f/g - z/h/i/j/k - z/l/m/n/o - z/p/q - z/r/s - z/t/u - z/vOverlap formulae used. * small base; ** very small base (under 30) ineligible for sig testing

UnwtdtotalFuture of NHSSatisfaction with NHSGOR
DisYorkshire &WestEastWtd.WorseSameBettersatisfiedSatisfiedHumbersideMidlandsSouth-WestSouth-EastNorth-WestNorth-EastLondonEasternMidlandsTotal
(o)(n)(m)(l)(k)(j)(i)(h)(g)(f)(e)(d)(c)(b)(a)(z)1001328298343168703909910715413955143126881001Unweighted Total1001327302340168701100*106*10216213651*14810986*1001Weighted Total37210511812230292283942664731284831359Very satisfied37%32%39%36%18%42%zk27%37%c41%ci41%ci35%c61%zabcefghi19%44%ci36%c36%ck
38712312313761278453131637015654332394Fairly satisfied39%38%41%40%36%40%45%gh29%31%39%51%zadfgh30%44%gh39%37%39%h
642717212331711775-146966Neither satisfied nor6%8%6%6%13%zj4%7%11%def7%4%4%-9%d5%11%def7%jdissatisfied
6325132525298116842135764Fairly dissatisfied6%8%4%7%15%zj4%8%11%e6%5%3%4%9%e5%8%6%j
4216917211364576-82343Very dissatisfied4%5%3%5%12%zj2%6%4%5%5%5%-6%2%4%4%j
73322118958610111143216475Don't know/no opinion7%10%l7%5%5%8%6%9%e11%e7%3%5%14%zabe6%5%8%e
7592282412599157072697412911746929163753Satisfied76%70%80%zn76%54%81%zk72%65%72%80%ch86%zacghi91%zacghi62%83%zcgh73%75%chkn
10541224145421415111510222710106Dissatisfied10%12%m7%12%m27%zj6%14%15%b10%9%8%4%15%bd6%12%11%jm
6541872192184652858546311410744718452647Net Satisfied65%57%72%zln64%27%75%zk58%51%62%c70%ch78%zacghi87%zacfghi48%77%zacghi61%65%chkn
Public Perceptions of the NHS and Social CareFINAL PUBLIC
Table 32Q6. Now thinking about the last time you visited an NHS hospital, overall, how satisfied or dissatisfied were you with this last visit as a patient?
Base : All respondents
Respondent type : General public aged 16+ Fieldwork dates : 14th November - 9th December 2011Source : Ipsos MORI (JN10-039262-01)Proportions/Means: Columns Tested (5% risk level) - z/a/b/c/d/e/f/g/h/i - z/j/k - z/l/m/n - z/oOverlap formulae used. * small base

UnwtdPrivate healthSatisfaction withImpact of NHS reformsGovernment has righttotalinsurancesocial careon patientsNHS policyNHS use in last year
SocialNHSDissatisficareWalk InChoicesPharmacistWtd.
NoYesedSatisfiedWorseBetterDisagreeAgreeservicesClinicwebsite/ChemistNHS DirectA&EOutpatientInpatientGPTotal(r)(q)(p)(o)(n)(m)(l)(k)(j)(i)(h)(g)(f)(e)(d)(c)(b)(a)(z)10018151704424938220040326945182553001772253931967801001Unweighted Total100181117544*24437920139327642*18856*3011832303761927731001Weighted Total372300531110312781129110186718101608717598284359Very satisfied37%37%30%26%42%zo33%40%33%40%44%36%32%34%33%38%47%zadefgh51%zadefgh37%36%
38731177159514581146115137830127849313061317394Fairly satisfied39%38%44%34%39%38%40%37%42%30%42%b52%zbci42%bc46%zbci41%b35%32%41%bc39%bc
645313520378371338119101621104866Neither satisfied nor6%7%7%12%8%10%zl4%9%zj5%8%4%2%6%5%7%6%5%6%7%dissatisfied
6349156723153812214320122024124564Fairly dissatisfied6%6%9%15%zn3%6%7%10%zj4%5%7%5%7%7%9%6%6%6%6%n
4238554244209617419131425123343Very dissatisfied4%5%3%12%zn2%6%zl2%5%3%14%zad9%za8%6%z7%za6%7%za6%4%4%n
73601311423122318-31143---4675Don't know/no opinion7%7%8%2%6%6%6%6%6%-2%cd1%c5%bcdeh2%c---6%bcdeh8%abcdefh
759611129261992721622742253114548228144180306158600753Satisfied76%75%74%60%81%zo72%81%m70%81%zk74%78%84%76%79%78%81%zaf83%zf78%z75%kmo
10586201212471959208317392634492478106Dissatisfied10%11%11%26%zn5%13%10%15%zj7%18%16%za13%13%14%15%za13%a12%10%11%jn
654524109151872241422152042311540188119147256135522647Net Satisfied65%65%62%33%77%zo59%71%zm55%74%zk55%61%71%63%65%64%68%f70%fhi68%zf65%kmo
Public Perceptions of the NHS and Social CareFINAL PUBLIC
Table 33Q6. Now thinking about the last time you visited an NHS hospital, overall, how satisfied or dissatisfied were you with this last visit as a patient?
Base : All respondents
Respondent type : General public aged 16+ Fieldwork dates : 14th November - 9th December 2011Source : Ipsos MORI (JN10-039262-01)Proportions/Means: Columns Tested (5% risk level) - z/a/b/c/d/e/f/g/h/i - z/j/k - z/l/m - z/n/o - z/p/q - z/rOverlap formulae used. * small base

UnwtdtotalWork StatusSocial GradeAgeGender
Full/part-Wtd.OtherUnemployedRetiredtimeDEC2C1AB65+55-6435-5425-3416-24FemaleMaleTotal
(p)(o)(n)(m)(l)(k)(j)(i)(h)(g)(f)(e)(d)(c)(b)(a)(z)54393341672491421081611321381011618756310233543Unweighted Total54387*32*14526913610616013112485*16792*66*299233533Weighted Total247331385106564970627542673221129108237Very satisfied45%38%39%59%zlno39%41%46%44%48%61%zcde49%c40%35%31%43%46%44%cl
19832124011557365551342869422611583199Fairly satisfied36%36%36%28%43%zm42%34%34%39%28%33%41%g46%g39%39%36%37%gm
315291667117651127141732Neither satisfied nor6%6%7%6%6%5%6%7%6%5%6%6%2%11%d5%7%6%dissatisfied
39836211081565510116231538Fairly dissatisfied7%9%11%4%8%7%8%9%4%4%6%6%12%g10%8%6%7%
281025117794351046181028Very dissatisfied5%11%zlm7%4%4%5%7%6%3%2%6%6%5%9%g6%4%5%g
-----------------Don't know/no opinion-----------------
445652412522111384125114109701367447244191435Satisfied82%74%76%86%o82%83%80%78%87%88%zc82%81%81%70%82%82%82%c
67176113216152410810211512412566Dissatisfied12%20%zm18%8%12%12%14%15%8%6%12%12%17%g18%g14%11%12%gm
37848191131909669100103101601155934203166369Net Satisfied70%54%58%78%zno71%o71%65%63%79%zij82%zcdef70%c69%c64%52%68%71%69%cio
Public Perceptions of the NHS and Social CareFINAL PUBLIC
Table 34Q6. Now thinking about the last time you visited an NHS hospital, overall, how satisfied or dissatisfied were you with this last visit as a patient?
Base : All respondents who have been an inpatient, outpatient or A&E user in the last year
Respondent type : General public aged 16+ Fieldwork dates : 14th November - 9th December 2011Source : Ipsos MORI (JN10-039262-01)Proportions/Means: Columns Tested (5% risk level) - z/a/b - z/c/d/e/f/g - z/h/i/j/k - z/l/m/n/o - z/pOverlap formulae used. * small base

People aretreated with
Unwtddignity andtotalrespectNHS useHospital useEthnicityNHS/social care staffHousehold TypeHome Ownership
NotAdultshospitalHospitalInformalSocialwith
Non NHS/A&E/A&EsocialcareKnow NHSNHSdependentNon-Owner -PrivateSocialWtd.DisagreeAgreeuserNHS useruseruserMixedWhiteAsianBlackcarerworkerstaffstaffchildrenpensionerPensionerOtheroccupierrenterrenterTotal
(v)(u)(t)(s)(r)(q)(p)(o)(n)(m)(l)(k)(j)(i)(h)(g)(f)(e)(d)(c)(b)(a)(z)543177350-543-54354262781140191662515123615643499397543Unweighted Total543171346-**533-**5335**41727**79*13821**16525**1582381374**33896*95*533Weighted Total24751180-237-2372190536537681158988111613342237Very satisfied45%30%52%zu-44%-44%35%46%19%45%38%32%41%46%37%41%59%zfg26%48%zb34%44%44%bgu
19869122-199-19931491432541165767973521283831199Fairly satisfied36%40%35%-37%-37%65%36%51%41%39%54%40%28%42%e41%e26%54%38%40%32%37%e
311515-32-32-26327112211129-207532Neither satisfied nor6%9%4%-6%-6%-6%12%3%5%5%7%8%7%5%6%-6%7%5%6%tdissatisfied
391721-38-38-28381021441023611791138Fairly dissatisfied7%10%6%-7%-7%-7%12%10%7%9%8%15%6%10%e4%20%5%10%11%c7%c
28198-28-28-252114-511296-128728Very dissatisfied5%11%zt2%-5%-5%-6%7%1%10%zi-3%3%8%4%5%-4%9%c7%5%ct
-----------------------Don't know/no opinion-----------------------
445120302-435-43553391968107181331812419411632897173435Satisfied82%70%87%zu-82%-82%100%81%70%86%78%86%81%73%79%82%85%80%85%zab74%76%82%bu
673729-66-66-5259242195223212130181866Dissatisfied12%22%zt8%-12%-12%-13%19%11%17%9%12%18%14%14%9%20%9%19%c19%zc12%ct
37883273036903695287145983161141410216210522595355369Net Satisfied70%48%79%zu0%69%0%69%100%69%51%75%61%77%69%55%65%68%76%zg59%77%zab55%58%69%abku
Public Perceptions of the NHS and Social CareFINAL PUBLIC
Table 35Q6. Now thinking about the last time you visited an NHS hospital, overall, how satisfied or dissatisfied were you with this last visit as a patient?
Base : All respondents who have been an inpatient, outpatient or A&E user in the last year
Respondent type : General public aged 16+ Fieldwork dates : 14th November - 9th December 2011Source : Ipsos MORI (JN10-039262-01)Proportions/Means: Columns Tested (5% risk level) - z/a/b/c/d - z/e/f/g - z/h/i/j/k - z/l/m/n/o - z/p/q - z/r/s - z/t/u - z/vOverlap formulae used. * small base; ** very small base (under 30) ineligible for sig testing

UnwtdtotalFuture of NHSSatisfaction with NHSGOR
DisYorkshire &WestEastWtd.WorseSameBettersatisfiedSatisfiedHumbersideMidlandsSouth-WestSouth-EastNorth-WestNorth-EastLondonEasternMidlandsTotal
(o)(n)(m)(l)(k)(j)(i)(h)(g)(f)(e)(d)(c)(b)(a)(z)543185147196106371476061817034707347543Unweighted Total54318314519110536353*63*57*85*68*31*71*61*45*533Weighted Total24772718526186192929443019173020237Very satisfied45%39%49%44%25%51%zk36%46%c50%c52%c44%c63%zci24%48%c45%c44%ck
19867587137140201918332811312415199Fairly satisfied36%36%40%37%35%39%38%30%31%39%42%34%44%39%34%37%3116610131139412-64232Neither satisfied nor6%9%4%5%13%zj3%7%15%zdef7%2%3%-8%6%5%6%jdissatisfied
39175151518644241113438Fairly dissatisfied7%9%m4%8%15%zj5%11%6%6%3%6%3%15%zf5%9%7%jm
281161013742344-61328Very dissatisfied5%6%4%5%12%zj2%8%3%5%5%6%-9%1%8%5%j
----------------Don't know/no opinion----------------
44513912915663326394846775830485335435Satisfied82%76%89%zn82%60%90%zk74%77%81%91%zchi86%c97%zacghi68%87%c79%82%ckn
6728112528251067681174766Dissatisfied12%15%m8%13%27%zj7%19%bd9%12%8%12%3%24%zbdfh7%16%12%jm
37811111713135301294340715029314928369Net Satisfied70%61%81%zln68%33%83%zk55%68%c70%c83%zachi74%ci94%zaceghi44%80%zaci63%c69%cikn
Public Perceptions of the NHS and Social CareFINAL PUBLIC
Table 36Q6. Now thinking about the last time you visited an NHS hospital, overall, how satisfied or dissatisfied were you with this last visit as a patient?
Base : All respondents who have been an inpatient, outpatient or A&E user in the last year
Respondent type : General public aged 16+ Fieldwork dates : 14th November - 9th December 2011Source : Ipsos MORI (JN10-039262-01)Proportions/Means: Columns Tested (5% risk level) - z/a/b/c/d/e/f/g/h/i - z/j/k - z/l/m/n - z/oOverlap formulae used. * small base

UnwtdPrivate healthSatisfaction withImpact of NHS reformsGovernment has righttotalinsurancesocial careon patientsNHS policyNHS use in last year
SocialNHSDissatisficareWalk InChoicesPharmacistWtd.
NoYesedSatisfiedWorseBetterDisagreeAgreeservicesClinicwebsite/ChemistNHS DirectA&EOutpatientInpatientGPTotal(r)(q)(p)(o)(n)(m)(l)(k)(j)(i)(h)(g)(f)(e)(d)(c)(b)(a)(z)54344394291432131042411303711741201126225393196440543Unweighted Total54343296*29**13921110223213134*11942*199130230376192429533Weighted Total247202318707952956215461375498717598188237Very satisfied45%47%zp33%29%50%37%51%m41%47%45%39%31%37%38%38%47%defg51%zadefgh44%df44%dfmp
1981494710528336865011442384569313061164199Fairly satisfied36%35%49%zq35%37%39%35%37%38%31%37%55%zabchi42%bc43%bc41%b35%32%38%bc37%bcq
312754101941682511161621102332Neither satisfied nor6%6%5%15%7%9%z4%7%6%7%4%2%5%5%7%6%5%5%6%dissatisfied
39291034148237110215102024123038Fairly dissatisfied7%7%10%10%3%7%8%10%z6%3%9%4%8%8%9%6%6%7%7%n
282533316212451331581425122428Very dissatisfied5%6%3%11%2%7%2%5%3%14%zad11%zabd8%8%6%6%7%z6%6%5%-------------------Don't know/no opinion-------------------
445352781812216288181112269036158105180306158352435Satisfied82%81%82%64%88%z77%86%m78%85%76%76%86%79%81%78%81%83%82%82%m
6754136830103512624530183449245466Dissatisfied12%12%13%21%5%14%10%15%9%17%20%zabc12%15%14%15%13%12%13%12%n
37829866121141327814610020663112887147256135298369Net Satisfied70%69%69%43%82%z62%76%m63%76%zk59%56%74%h64%67%h64%68%h70%h69%dfh69%dfhkm
Public Perceptions of the NHS and Social CareFINAL PUBLIC
Table 37Q6. Now thinking about the last time you visited an NHS hospital, overall, how satisfied or dissatisfied were you with this last visit as a patient?
Base : All respondents who have been an inpatient, outpatient or A&E user in the last year
Respondent type : General public aged 16+ Fieldwork dates : 14th November - 9th December 2011Source : Ipsos MORI (JN10-039262-01)Proportions/Means: Columns Tested (5% risk level) - z/a/b/c/d/e/f/g/h/i - z/j/k - z/l/m - z/n/o - z/p/q - z/rOverlap formulae used. * small base; ** very small base (under 30) ineligible for sig testing

UnwtdtotalWork StatusSocial GradeAgeGender
Full/part-Wtd.OtherUnemployedRetiredtimeDEC2C1AB65+55-6435-5425-3416-24FemaleMaleTotal
(p)(o)(n)(m)(l)(k)(j)(i)(h)(g)(f)(e)(d)(c)(b)(a)(z)1001162612705082472013062472201693311581235274741001Unweighted Total100115758*2355512392013122491981433501671435154861001Weighted Total45459221272349888127130104811446350227215442Very satisfied45%38%37%54%zlno42%41%44%41%52%zik53%zcde57%zcde41%38%35%44%44%44%c
389672682218109761218772431546362207187394Fairly satisfied39%43%45%35%40%46%zh38%39%35%36%30%44%zf38%43%f40%39%39%f
501037321011201156161510223152Neither satisfied or5%6%5%3%6%4%5%7%4%3%4%5%9%zg7%4%6%5%gmdissatisfied
651259411514261288221712412667Fairly dissatisfied6%7%9%4%7%6%7%8%5%4%6%6%10%g8%8%5%7%m
2322811369563742131023Very dissatisfied2%1%3%3%2%1%3%3%2%3%2%2%2%2%3%2%2%
124--1024441-64221114Not applicable/haven't1%2%m--2%m1%2%1%1%*-2%3%f2%*2%zb1%bbeen83-15134111115369None/Don't know1%2%-*1%1%1%1%*1%1%*1%3%zeg1%1%1%
84312648210452207164248217176124297126112434403836Satisfied84%80%83%89%zlo82%87%i82%80%87%i89%zcd87%d85%d76%78%84%83%84%di
881471752182035171512292114543690Dissatisfied9%9%12%7%9%8%10%11%7%7%8%8%12%10%11%7%9%
7551134119240018914421320016211326810698379367746Net Satisfied75%72%70%82%zlno73%79%i72%68%80%zij82%zcd79%d77%d63%68%74%76%75%di
Public Perceptions of the NHS and Social CareFINAL PUBLIC
Table 38Q7. Now thinking about the last time you visited your local doctor or GP, overall, how satisfied or dissatisfied were you with this last visit as a patient?
Base : All respondents
Respondent type : General public aged 16+ Fieldwork dates : 14th November - 9th December 2011Source : Ipsos MORI (JN10-039262-01)Proportions/Means: Columns Tested (5% risk level) - z/a/b - z/c/d/e/f/g - z/h/i/j/k - z/l/m/n/o - z/pOverlap formulae used. * small base

People aretreated with
Unwtddignity andtotalrespectNHS useHospital useEthnicityNHS/social care staffHousehold TypeHome Ownership
NotAdultshospitalHospitalInformalSocialwith
Non NHS/A&E/A&EsocialcareKnow NHSNHSdependentNon-Owner -PrivateSocialWtd.DisagreeAgreeuserNHS useruseruserMixedWhiteAsianBlackcarerworkerstaffstaffchildrenpensionerPensionerOtheroccupierrenterrenterTotal
(v)(u)(t)(s)(r)(q)(p)(o)(n)(m)(l)(k)(j)(i)(h)(g)(f)(e)(d)(c)(b)(a)(z)100130864710090145854310750741612543628951291461249106491691731001Unweighted Total1001304652104*89746853311**74778*15925038*29252*30547522110**6401781731001Weighted Total4541263043241019225033611363128191332612520111643156261442Very satisfied45%42%47%z31%46%zs41%47%28%48%zlm17%40%m51%z49%45%50%41%42%53%zfg40%49%zab35%36%44%abms
38911525538356204190626441808911117201321847862406880394Fairly satisfied39%38%39%37%40%44%zp36%51%35%53%zn50%zn36%30%40%39%43%39%35%60%38%38%46%zc39%np
50153594325272311095213113345-25161152Neither satisfied or5%5%5%8%5%5%5%20%4%13%zn6%2%6%4%3%4%7%ze2%-4%9%zc7%5%cekndissatisfied
6536307612146-5755176202203413-37181267Fairly dissatisfied6%12%zt5%6%7%4%9%zq-8%l6%3%7%15%z7%4%7%7%6%-6%10%c7%7%lqt
23911419914-20-28-31877-106723Very dissatisfied2%3%2%4%2%2%3%-3%-2%3%-1%2%3%2%3%-2%3%4%2%c
12111103103-86-1-31581-76114Not applicable/haven't1%*2%10%zr*2%p1%-1%7%zln-*-1%2%1%2%*-1%3%z1%1%prbeen8144562-72-2-4-261-63-9None/Don't know1%*1%4%zr1%1%*-1%3%l-1%-1%-1%1%*-1%1%-1%r
84324156070766397440962555143217302494725738619410555130141836Satisfied84%79%86%zu67%85%zs85%83%80%84%m71%90%zm87%79%85%89%84%81%88%zf100%87%zb73%82%84%bmsu
88464111793061-7757246233294120-47241990Dissatisfied9%15%zt6%10%9%6%11%zq-10%zl6%5%10%15%8%6%9%9%9%-7%14%zc11%9%clqt
75519651860687367379954850136193242264322834417410508106122746Net Satisfied75%64%80%zu57%77%zs78%zp71%80%73%65%85%zmn77%64%77%83%j75%72%79%100%79%zab60%71%b75%bmpsu
Public Perceptions of the NHS and Social CareFINAL PUBLIC
Table 39Q7. Now thinking about the last time you visited your local doctor or GP, overall, how satisfied or dissatisfied were you with this last visit as a patient?
Base : All respondents
Respondent type : General public aged 16+ Fieldwork dates : 14th November - 9th December 2011Source : Ipsos MORI (JN10-039262-01)Proportions/Means: Columns Tested (5% risk level) - z/a/b/c/d - z/e/f/g - z/h/i/j/k - z/l/m/n/o - z/p/q - z/r/s - z/t/u - z/vOverlap formulae used. * small base; ** very small base (under 30) ineligible for sig testing

UnwtdtotalFuture of NHSSatisfaction with NHSGOR
DisYorkshire &WestEastWtd.WorseSameBettersatisfiedSatisfiedHumbersideMidlandsSouth-WestSouth-EastNorth-WestNorth-EastLondonEasternMidlandsTotal
(o)(n)(m)(l)(k)(j)(i)(h)(g)(f)(e)(d)(c)(b)(a)(z)1001328298343168703909910715413955143126881001Unweighted Total1001327302340168701100*106*10216213651*14810986*1001Weighted Total45413814214949344394748796626336541442Very satisfied45%42%47%44%29%49%zk39%c44%c47%c49%c49%c50%c22%59%zchi47%c44%ck
38913011813466277403639635121803431394Fairly satisfied39%40%39%39%40%39%40%34%38%39%37%42%54%zabefghi31%35%39%b
501414211529545681184152Neither satisfied or5%4%5%6%9%zj4%5%3%5%4%6%2%12%zabdfh4%1%5%jdissatisfied
65291820243091269521141067Fairly dissatisfied6%9%6%6%14%zj4%9%11%be6%5%4%3%7%4%11%e7%j
23106712532444-21323Very dissatisfied2%3%2%2%7%zj1%3%2%3%2%3%-1%1%4%2%j
1224711113-2213-114Not applicable/haven't1%1%1%2%1%2%1%2%-1%2%2%2%-1%1%been8511-6331---11-9None/Don't know1%2%**-1%3%f3%zf1%---1%1%-1%
843268259283115621798386141117471139971836Satisfied84%82%86%83%69%89%zk79%78%85%87%c86%c92%chi76%90%zchi83%84%ck
8838242837351214913921351390Dissatisfied9%12%z8%8%22%zj5%12%13%bd9%8%7%3%9%5%15%bd9%j
75522923525579586676877129108461009358746Net Satisfied75%70%78%n75%47%84%zk67%65%75%79%achi79%chi89%zacghi67%86%zachi68%75%chkn
Public Perceptions of the NHS and Social CareFINAL PUBLIC
Table 40Q7. Now thinking about the last time you visited your local doctor or GP, overall, how satisfied or dissatisfied were you with this last visit as a patient?
Base : All respondents
Respondent type : General public aged 16+ Fieldwork dates : 14th November - 9th December 2011Source : Ipsos MORI (JN10-039262-01)Proportions/Means: Columns Tested (5% risk level) - z/a/b/c/d/e/f/g/h/i - z/j/k - z/l/m/n - z/oOverlap formulae used. * small base

UnwtdPrivate healthSatisfaction withImpact of NHS reformsGovernment has righttotalinsurancesocial careon patientsNHS policyNHS use in last year
SocialNHSDissatisficareWalk InChoicesPharmacistWtd.
NoYesedSatisfiedWorseBetterDisagreeAgreeservicesClinicwebsite/ChemistNHS DirectA&EOutpatientInpatientGPTotal(r)(q)(p)(o)(n)(m)(l)(k)(j)(i)(h)(g)(f)(e)(d)(c)(b)(a)(z)10018151704424938220040326945182553001772253931967801001Unweighted Total100181117544*24437920139327642*18856*3011832303761927731001Weighted Total4543607417131181841681331875341501019218589364442Very satisfied45%44%43%38%54%z48%42%43%48%42%40%61%zadh50%zdh55%zadh40%49%zdh47%47%zdh44%
38931969217612789145112147714100618912969308394Fairly satisfied39%39%39%48%n31%34%45%m37%40%34%41%fg26%33%33%39%34%36%40%cefg39%cfgmn
50401221124122211-71136171693052Neither satisfied or5%5%7%5%4%6%6%6%4%-4%2%4%3%7%acef4%5%4%5%adissatisfied
6553133203653712520724112331215367Fairly dissatisfied6%7%7%7%8%10%zl2%10%zj4%13%11%za12%8%6%10%za8%11%za7%7%l
23194139214245-10361131523Very dissatisfied2%2%2%2%1%2%1%4%zj1%8%zabcdeg3%-3%a1%3%3%2%2%2%j
12121-2-65611-1-22--14Not applicable/haven't1%2%1%-1%-3%zm1%2%3%abe1%a-*-1%a1%a--1%ambeen881-11222-1-2111-29None/Don't know1%1%1%-1%*1%1%1%-1%-1%1%1%*-*1%a
843679143382073091743132443215349250162180314158672836Satisfied84%84%82%86%85%81%87%80%88%zk76%81%87%83%88%dfhi78%84%d83%87%zcdfhi84%dk
8872174224575114926734142942246790Dissatisfied9%9%10%9%9%12%zl3%13%zj5%21%zace14%zae12%11%8%13%zae11%a13%a9%9%jl
755607126341852631672612302312742216148151273134605746Net Satisfied75%75%72%77%76%69%83%zm66%83%zk55%68%75%i72%i81%zbcdfhi66%73%di70%i78%zbcdfhi75%dhikm
Public Perceptions of the NHS and Social CareFINAL PUBLIC
Table 41Q7. Now thinking about the last time you visited your local doctor or GP, overall, how satisfied or dissatisfied were you with this last visit as a patient?
Base : All respondents
Respondent type : General public aged 16+ Fieldwork dates : 14th November - 9th December 2011Source : Ipsos MORI (JN10-039262-01)Proportions/Means: Columns Tested (5% risk level) - z/a/b/c/d/e/f/g/h/i - z/j/k - z/l/m - z/n/o - z/p/q - z/rOverlap formulae used. * small base

UnwtdtotalWork StatusSocial GradeAgeGender
Full/part-Wtd.OtherUnemployedRetiredtimeDEC2C1AB65+55-6435-5425-3416-24FemaleMaleTotal
(p)(o)(n)(m)(l)(k)(j)(i)(h)(g)(f)(e)(d)(c)(b)(a)(z)1001162612705082472013062472201693311581235274741001Unweighted Total100115758*2355512392013122491981433501671435154861001Weighted Total87414052214463220161267221180121307145116466403869Face to face87%89%90%91%zl84%92%zij80%86%89%j91%zc85%88%86%81%90%za83%87%ajl
24538104914549428665362999483016281243Telephone (not including24%25%17%21%26%21%21%28%26%18%20%28%zfg29%g21%31%za17%24%agNHS Direct)151-2141-114135549816Email1%1%-1%2%*-4%zjk2%*2%1%3%3%2%2%2%2---21-1---1-1-22A voice or video call on*---**-*---*-1%-**the internet using a
microphone or webcam(e.g. using Skype)
2--2---112-----22Other*--1%l---**1%z-----**
921031567123327231218311716296795None9%7%5%6%12%zmo5%16%zhik9%9%6%13%g9%10%12%6%14%zb10%bgkm
-----------------Don't know-----------------
Public Perceptions of the NHS and Social CareFINAL PUBLIC
Table 42Q8. In which, if any, of the following ways have you consulted your GP in the last year? By consulted your GP, I mean sought advice from them about a health related matter.
Base : All respondents
Respondent type : General public aged 16+ Fieldwork dates : 14th November - 9th December 2011Source : Ipsos MORI (JN10-039262-01)Proportions/Means: Columns Tested (5% risk level) - z/a/b - z/c/d/e/f/g - z/h/i/j/k - z/l/m/n/o - z/pOverlap formulae used. * small base

People aretreated with
Unwtddignity andtotalrespectNHS useHospital useEthnicityNHS/social care staffHousehold TypeHome Ownership
NotAdultshospitalHospitalInformalSocialwith
Non NHS/A&E/A&EsocialcareKnow NHSNHSdependentNon-Owner -PrivateSocialWtd.DisagreeAgreeuserNHS useruseruserMixedWhiteAsianBlackcarerworkerstaffstaffchildrenpensionerPensionerOtheroccupierrenterrenterTotal
(v)(u)(t)(s)(r)(q)(p)(o)(n)(m)(l)(k)(j)(i)(h)(g)(f)(e)(d)(c)(b)(a)(z)100130864710090145854310750741612543628951291461249106491691731001Unweighted Total1001304652104*89746853311**74778*15925038*29252*30547522110**6401781731001Weighted Total87425757439830378491106496414022034249482733962008563148150869Face to face87%85%88%37%93%zs81%92%zq90%87%82%88%88%87%85%92%90%f83%90%f80%88%83%87%87%fqs
2458015682358815511829496988312831154511454948243Telephone (not including24%26%24%8%26%zs19%29%zq11%24%m11%31%zm27%22%28%23%27%24%20%10%23%27%28%24%mqsNHS Direct)1531341288-10151-6-2132-102416Email1%1%2%4%1%2%1%-1%1%3%*-2%-1%3%z1%-2%1%2%2%r
211112--2-----111---2-2A voice or video call on***1%zr**--*-----3%zik**---1%zc-*rthe internet using a
microphone or webcam(e.g. using Skype)
2-1-2-2-2----1---2-2--2Other*-*-*-*-*----*---1%z-*--*
92345456397025169916193311235715162191395None9%11%8%54%zr4%15%zp5%10%9%12%10%8%7%11%h2%8%12%ze7%10%10%11%8%10%hpr
-----------------------Don't know-----------------------
Public Perceptions of the NHS and Social CareFINAL PUBLIC
Table 43Q8. In which, if any, of the following ways have you consulted your GP in the last year? By consulted your GP, I mean sought advice from them about a health related matter.
Base : All respondents
Respondent type : General public aged 16+ Fieldwork dates : 14th November - 9th December 2011Source : Ipsos MORI (JN10-039262-01)Proportions/Means: Columns Tested (5% risk level) - z/a/b/c/d - z/e/f/g - z/h/i/j/k - z/l/m/n/o - z/p/q - z/r/s - z/t/u - z/vOverlap formulae used. * small base; ** very small base (under 30) ineligible for sig testing

UnwtdtotalFuture of NHSSatisfaction with NHSGOR
DisYorkshire &WestEastWtd.WorseSameBettersatisfiedSatisfiedHumbersideMidlandsSouth-WestSouth-EastNorth-WestNorth-EastLondonEasternMidlandsTotal
(o)(n)(m)(l)(k)(j)(i)(h)(g)(f)(e)(d)(c)(b)(a)(z)1001328298343168703909910715413955143126881001Unweighted Total1001327302340168701100*106*10216213651*14810986*1001Weighted Total874295252300155614819285139123461279877869Face to face87%90%zm83%88%92%z87%81%87%83%86%90%91%86%90%89%87%
24578669545171261336383913332916243Telephone (not including24%24%22%28%27%24%26%h13%35%zacfh23%h29%h25%22%27%h19%24%hNHS Direct)154472136-124111-16Email1%1%1%2%1%2%6%zabch-1%1%3%2%1%1%-2%21-1-21------1-2A voice or video call on**-*-*1%z------1%-*the internet using a
microphone or webcam(e.g. using Skype)
21-1-2-------2-2Other**-*-*-------1%z-*
922435298621091418114129795None9%7%12%8%5%9%10%9%14%11%8%7%8%8%9%10%k
----------------Don't know----------------
Public Perceptions of the NHS and Social CareFINAL PUBLIC
Table 44Q8. In which, if any, of the following ways have you consulted your GP in the last year? By consulted your GP, I mean sought advice from them about a health related matter.
Base : All respondents
Respondent type : General public aged 16+ Fieldwork dates : 14th November - 9th December 2011Source : Ipsos MORI (JN10-039262-01)Proportions/Means: Columns Tested (5% risk level) - z/a/b/c/d/e/f/g/h/i - z/j/k - z/l/m/n - z/oOverlap formulae used. * small base

UnwtdPrivate healthSatisfaction withImpact of NHS reformsGovernment has righttotalinsurancesocial careon patientsNHS policyNHS use in last year
SocialNHSDissatisficareWalk InChoicesPharmacistWtd.
NoYesedSatisfiedWorseBetterDisagreeAgreeservicesClinicwebsite/ChemistNHS DirectA&EOutpatientInpatientGPTotal(r)(q)(p)(o)(n)(m)(l)(k)(j)(i)(h)(g)(f)(e)(d)(c)(b)(a)(z)10018151704424938220040326945182553001772253931967801001Unweighted Total100181117544*24437920139327642*18856*3011832303761927731001Weighted Total874703151432113411723502393817354284175205354185740869Face to face87%87%86%97%zn86%90%z86%89%86%90%92%z97%z95%zd96%zd89%94%zd96%zdhi96%zdh87%
2451905117631005010766177129101827712259218243Telephone (not including24%24%29%38%z26%26%25%27%24%41%z38%za51%zabcdf34%za45%zabcdf33%z32%za31%z28%z24%NHS Direct)1588-24448-21464521116Email1%1%4%zq-1%1%2%1%3%-1%2%1%3%a2%1%1%1%2%q
22--11-11---1----12A voice or video call on**--1%*-**---*----**the internet using a
microphone or webcam(e.g. using Skype)
22--11-1---12112222Other**--**-*---1%z1%***1%z**
9279151152819262737211318821695None9%10%9%3%6%7%10%7%10%6%b3%3%4%a2%8%abcef2%1%2%10%abcefhkn
-------------------Don't know-------------------
Public Perceptions of the NHS and Social CareFINAL PUBLIC
Table 45Q8. In which, if any, of the following ways have you consulted your GP in the last year? By consulted your GP, I mean sought advice from them about a health related matter.
Base : All respondents
Respondent type : General public aged 16+ Fieldwork dates : 14th November - 9th December 2011Source : Ipsos MORI (JN10-039262-01)Proportions/Means: Columns Tested (5% risk level) - z/a/b/c/d/e/f/g/h/i - z/j/k - z/l/m - z/n/o - z/p/q - z/rOverlap formulae used. * small base

UnwtdtotalWork StatusSocial GradeAgeGender
Full/part-Wtd.OtherUnemployedRetiredtimeDEC2C1AB65+55-6435-5425-3416-24FemaleMaleTotal
(p)(o)(n)(m)(l)(k)(j)(i)(h)(g)(f)(e)(d)(c)(b)(a)(z)7561215021337219615921818317913323511297362394756Unweighted Total75611948*186406190159225184161114250119113*354405758Weighted Total22732949135564765583942853129110115225Very likely30%27%18%26%33%zn29%30%29%32%24%37%zg34%g26%26%31%28%30%g
2934523731547160868066331055439152144296Fairly likely39%38%48%39%38%37%38%38%43%41%f29%42%f45%f34%43%za36%39%af
10716726582321432022163019224464108Not very likely14%14%15%14%14%12%13%19%zh11%14%14%12%16%19%12%16%14%
11820935543828272532213014204473118Not at all likely16%17%18%19%13%20%zi17%12%13%20%e19%12%12%18%13%18%zb15%b
114-342351321243811Don't know/ No opinion1%4%zl-1%1%1%2%2%*2%2%*2%3%1%2%1%
5207832123289126107151138104751908568263259522Likely69%66%66%66%71%66%67%67%75%z65%66%76%zcfg71%60%74%za64%69%ac
22536166111261497045543760334288137225Not likely30%31%34%33%28%32%31%31%24%34%e32%24%27%37%e25%34%zb30%be
2954116621776558819350381305226175122296Net likely39%35%33%33%44%zm34%36%36%51%zijk31%33%52%zcfg44%cg23%49%za30%39%acgm
Public Perceptions of the NHS and Social CareFINAL PUBLIC
Table 46Q9.a If you were able to consult your GP in the following ways, how likely, if at all, would you be to do so? Again, by consulting your GP, I mean seeking advicefrom them about a health related matter.
- By telephone (not including NHS Direct) -
Base : All respondents who have not consulted their GP by telephone in the last year
Respondent type : General public aged 16+ Fieldwork dates : 14th November - 9th December 2011Source : Ipsos MORI (JN10-039262-01)Proportions/Means: Columns Tested (5% risk level) - z/a/b - z/c/d/e/f/g - z/h/i/j/k - z/l/m/n/o - z/pOverlap formulae used. * small base

People aretreated with
Unwtddignity andtotalrespectNHS useHospital useEthnicityNHS/social care staffHousehold TypeHome Ownership
NotAdultshospitalHospitalInformalSocialwith
Non NHS/A&E/A&EsocialcareKnow NHSNHSdependentNon-Owner -PrivateSocialWtd.DisagreeAgreeuserNHS useruseruserMixedWhiteAsianBlackcarerworkerstaffstaffchildrenpensionerPensionerOtheroccupierrenterrenterTotal
(v)(u)(t)(s)(r)(q)(p)(o)(n)(m)(l)(k)(j)(i)(h)(g)(f)(e)(d)(c)(b)(a)(z)7562264919266437138595676511018528206392093491989500122125756Unweighted Total75622449696*66238037810**56569*11018130**20940*2223601779**495129125758Weighted Total22758157261991041211161184360106612781014711434536225Very likely30%26%32%27%30%27%32%12%29%26%39%zn33%33%31%29%35%28%26%12%29%35%29%30%
29391192382591531434241232768129514831427231974552296Fairly likely39%41%39%39%39%40%38%45%43%zl33%25%37%39%45%z34%37%39%41%32%40%35%41%39%l
1072974169258491838162542632662192672118108Not very likely14%13%15%16%14%15%13%11%15%12%14%14%14%12%8%12%17%ze11%26%14%16%14%14%
1184566121055661374172227319103546373791818118Not at all likely16%20%zt13%13%16%15%16%32%13%25%zn20%n15%i10%9%24%i16%13%21%zf31%16%14%14%15%fint
11175783-6322142-93-91111Don't know/ No opinion1%*1%5%zr1%2%1%-1%5%zn2%1%4%2%5%-2%g2%-2%1%1%1%r
5201493496445825726554034070127221612616124311843409088522Likely69%67%70%66%69%68%70%56%71%zm58%63%70%72%77%z63%72%68%67%43%69%70%71%69%
2257414028197115111415726385274513611085651463836225Not likely30%33%28%29%30%30%29%44%28%37%35%29%i25%21%32%28%30%32%57%30%30%29%30%in
2957520936261142154124615327614116139913562-11945153296Net likely39%34%42%zu37%39%37%41%13%44%zlm21%29%42%47%55%zhk32%45%37%35%-14%39%40%42%39%lmu
Public Perceptions of the NHS and Social CareFINAL PUBLIC
Table 47Q9.a If you were able to consult your GP in the following ways, how likely, if at all, would you be to do so? Again, by consulting your GP, I mean seeking advicefrom them about a health related matter.
- By telephone (not including NHS Direct) -
Base : All respondents who have not consulted their GP by telephone in the last year
Respondent type : General public aged 16+ Fieldwork dates : 14th November - 9th December 2011Source : Ipsos MORI (JN10-039262-01)Proportions/Means: Columns Tested (5% risk level) - z/a/b/c/d - z/e/f/g - z/h/i/j/k - z/l/m/n/o - z/p/q - z/r/s - z/t/u - z/vOverlap formulae used. * small base; ** very small base (under 30) ineligible for sig testing

UnwtdtotalFuture of NHSSatisfaction with NHSGOR
DisYorkshire &WestEastWtd.WorseSameBettersatisfiedSatisfiedHumbersideMidlandsSouth-WestSouth-EastNorth-WestNorth-EastLondonEasternMidlandsTotal
(o)(n)(m)(l)(k)(j)(i)(h)(g)(f)(e)(d)(c)(b)(a)(z)75625023124712353067876911799421129271756Unweighted Total75624923624612353174*93*66*12497*38*11680*70*758Weighted Total22774687032168221726332521322128225Very likely30%30%29%29%26%32%30%18%39%h26%26%54%zbcefhi28%27%41%zefh30%h
2931048110553203324019533411533421296Fairly likely39%42%35%43%43%38%43%43%29%42%35%28%46%ag43%29%39%
107383628207069132711319147108Not very likely14%15%15%11%17%13%8%10%19%22%zaehi11%8%17%17%10%14%
11831453817801126911254101112118Not at all likely16%12%19%n15%14%15%15%28%zbcdfg13%9%26%zbcdf9%8%14%18%15%cf
1124411031-12-2-211Don't know/ No opinion1%1%2%2%1%2%5%z1%-1%2%-2%-2%1%
52017815017685371545745855932855549522Likely69%71%63%72%69%70%73%62%68%69%61%83%zeh73%69%70%69%m
2256982663715017342138367292519225Not likely30%28%35%27%30%28%22%37%d32%31%37%d17%25%31%28%30%
2951096811048221382324472325563130296Net likely39%44%m29%45%zm39%42%z51%zeh25%36%38%eh24%66%zabefgh48%zeh38%eh42%eh39%ehm
Public Perceptions of the NHS and Social CareFINAL PUBLIC
Table 48Q9.a If you were able to consult your GP in the following ways, how likely, if at all, would you be to do so? Again, by consulting your GP, I mean seeking advicefrom them about a health related matter.
- By telephone (not including NHS Direct) -
Base : All respondents who have not consulted their GP by telephone in the last year
Respondent type : General public aged 16+ Fieldwork dates : 14th November - 9th December 2011Source : Ipsos MORI (JN10-039262-01)Proportions/Means: Columns Tested (5% risk level) - z/a/b/c/d/e/f/g/h/i - z/j/k - z/l/m/n - z/oOverlap formulae used. * small base

UnwtdPrivate healthSatisfaction withImpact of NHS reformsGovernment has righttotalinsurancesocial careon patientsNHS policyNHS use in last year
SocialNHSDissatisficareWalk InChoicesPharmacistWtd.
NoYesedSatisfiedWorseBetterDisagreeAgreeservicesClinicwebsite/ChemistNHS DirectA&EOutpatientInpatientGPTotal(r)(q)(p)(o)(n)(m)(l)(k)(j)(i)(h)(g)(f)(e)(d)(c)(b)(a)(z)75662112027185283150295203261132819999151265135559756Unweighted Total75662012427**18128015128621025**11728**199101*154254133555758Weighted Total227183394528542826573276041548744168225Very likely30%29%31%14%29%31%28%29%31%27%27%24%30%41%zafh35%34%33%30%30%
29323753206911365115791051128637619551222296Fairly likely39%38%43%72%38%41%43%40%38%40%44%45%43%36%40%37%38%40%39%
1078123131391941284175251421291676108Not very likely14%13%18%4%17%14%13%14%13%15%15%17%12%13%13%12%12%14%14%
1181107328392345335174271018402084118Not at all likely16%18%zp6%10%15%14%15%16%15%18%14%14%13%10%12%16%15%15%15%p
1182-24235---2--22511Don't know/ No opinion1%1%2%-1%1%1%1%3%---1%--1%1%1%1%a
52042092231211991071971451683191467811518295390522Likely69%68%74%86%67%71%71%69%69%67%71%68%73%77%75%72%72%70%69%
225192304587742866083495124397036160225Not likely30%31%24%14%32%28%28%30%29%33%29%32%26%23%25%27%27%29%30%
29522862196312265111848491095547611259230296Net likely39%37%50%zq71%35%43%43%39%40%34%42%37%47%za53%zah49%za44%z45%41%z39%q
Public Perceptions of the NHS and Social CareFINAL PUBLIC
Table 49Q9.a If you were able to consult your GP in the following ways, how likely, if at all, would you be to do so? Again, by consulting your GP, I mean seeking advicefrom them about a health related matter.
- By telephone (not including NHS Direct) -
Base : All respondents who have not consulted their GP by telephone in the last year
Respondent type : General public aged 16+ Fieldwork dates : 14th November - 9th December 2011Source : Ipsos MORI (JN10-039262-01)Proportions/Means: Columns Tested (5% risk level) - z/a/b/c/d/e/f/g/h/i - z/j/k - z/l/m - z/n/o - z/p/q - z/rOverlap formulae used. * small base; ** very small base (under 30) ineligible for sig testing

UnwtdtotalWork StatusSocial GradeAgeGender
Full/part-Wtd.OtherUnemployedRetiredtimeDEC2C1AB65+55-6435-5425-3416-24FemaleMaleTotal
(p)(o)(n)(m)(l)(k)(j)(i)(h)(g)(f)(e)(d)(c)(b)(a)(z)98616161268496246201296243219166327154120519467986Unweighted Total98615658*233537238201301245197140345163140507478985Weighted Total1051239837163450613552666442107Very likely11%8%4%4%15%zmno3%8%k11%k20%zijk3%10%g16%zcg16%zcg4%13%9%11%cgkm
151235221062726525016197125258670156Fairly likely15%15%9%9%20%zmn11%13%17%20%zjk8%14%21%zg15%g18%g17%15%16%gkm
20040132912346457045212373424794112206Not very likely20%26%m23%m13%23%m19%22%23%18%11%16%21%g26%fg33%zefg18%23%21%bgm
520783716722515211314399148841447061256251507Not at all likely53%50%64%zl71%zlo42%64%zhi56%h48%40%75%zcdef60%zcde42%43%44%51%52%51%dehl
102-616121612-17310Don't know/ No opinion1%1%-3%zl*2%zh*1%*3%zde1%1%-1%1%1%1%l
2563583118934438610023331265131150113263Likely26%23%m13%13%35%zmno14%21%29%k41%zijk11%23%g36%zcfg31%g22%g30%za24%27%agjkmn
72011951196347198158213144169107217112107350363712Not likely73%76%l87%zl84%zlo65%83%zhi78%zh71%h59%86%zcdef76%e63%69%77%e69%76%zb72%behl
-464-83-43-165-158-164-115-127-44-147-74-91-62-77-200-250-450Net likely-47%-53%-74%-71%-30%-69%-57%-42%-18%-74%-53%-26%-38%-55%-39%-52%-46%
Public Perceptions of the NHS and Social CareFINAL PUBLIC
Table 50Q9.b If you were able to consult your GP in the following ways, how likely, if at all, would you be to do so? Again, by consulting your GP, I mean seeking advicefrom them about a health related matter.
- By email -
Base : All respondents who have not consulted their GP by email in the last year
Respondent type : General public aged 16+ Fieldwork dates : 14th November - 9th December 2011Source : Ipsos MORI (JN10-039262-01)Proportions/Means: Columns Tested (5% risk level) - z/a/b - z/c/d/e/f/g - z/h/i/j/k - z/l/m/n/o - z/pOverlap formulae used. * small base

People aretreated with
Unwtddignity andtotalrespectNHS useHospital useEthnicityNHS/social care staffHousehold TypeHome Ownership
NotAdultshospitalHospitalInformalSocialwith
Non NHS/A&E/A&EsocialcareKnow NHSNHSdependentNon-Owner -PrivateSocialWtd.DisagreeAgreeuserNHS useruseruserMixedWhiteAsianBlackcarerworkerstaffstaffchildrenpensionerPensionerOtheroccupierrenterrenterTotal
(v)(u)(t)(s)(r)(q)(p)(o)(n)(m)(l)(k)(j)(i)(h)(g)(f)(e)(d)(c)(b)(a)(z)986305635968904505361074173156253362845128945024710639167170986Unweighted Total986300639100*88446052511**73877*15424838*28752*30346222010**630176169985Weighted Total10537629984859182716356441043568-75248107Very likely11%12%10%8%11%10%11%11%11%9%11%14%16%15%z18%14%ze12%e4%-12%a14%a5%11%ae
1513711113143768011111625401044953832011062821156Fairly likely15%12%17%13%16%17%15%10%15%21%16%16%26%15%17%17%e18%e9%10%17%16%13%16%eu
200461542518110010511601826473698751082341214139206Not very likely20%15%24%zu25%20%22%20%10%22%23%17%19%8%24%j15%25%e23%e10%40%19%23%23%21%eu
52017830652455228279737635851261912725132212163532082100507Not at all likely53%59%zt48%52%51%50%53%68%51%46%55%51%49%44%48%44%46%74%zfg50%51%47%59%zb51%fgit
10272782-8-1--21126-81110Don't know/ No opinion1%1%1%2%1%2%p*-1%-1%--1%2%k**3%zfg-1%1%1%1%p
25674173212411241392193244175168818961402711805229263Likely26%25%27%21%27%27%26%21%26%31%27%30%42%z31%35%32%ze30%ze12%10%29%a30%a17%27%ae
7202244597763632838495365311117322197332073201869441123139712Not likely73%75%72%76%72%71%73%79%73%69%72%70%58%69%63%68%69%85%zfg90%70%70%82%zbc72%cj
-464-149-286-55-394-205-245-6-342-29-70-98-6-109-15-111-180-159-8-261-70-110-450Net likely-47%-50%-45%-55%-45%-45%-47%-57%-46%-38%-45%-39%-15%-38%-28%-37%-39%-72%-80%-41%-40%-65%-46%
Public Perceptions of the NHS and Social CareFINAL PUBLIC
Table 51Q9.b If you were able to consult your GP in the following ways, how likely, if at all, would you be to do so? Again, by consulting your GP, I mean seeking advicefrom them about a health related matter.
- By email -
Base : All respondents who have not consulted their GP by email in the last year
Respondent type : General public aged 16+ Fieldwork dates : 14th November - 9th December 2011Source : Ipsos MORI (JN10-039262-01)Proportions/Means: Columns Tested (5% risk level) - z/a/b/c/d - z/e/f/g - z/h/i/j/k - z/l/m/n/o - z/p/q - z/r/s - z/t/u - z/vOverlap formulae used. * small base; ** very small base (under 30) ineligible for sig testing

UnwtdtotalFuture of NHSSatisfaction with NHSGOR
DisYorkshire &WestEastWtd.WorseSameBettersatisfiedSatisfiedHumbersideMidlandsSouth-WestSouth-EastNorth-WestNorth-EastLondonEasternMidlandsTotal
(o)(n)(m)(l)(k)(j)(i)(h)(g)(f)(e)(d)(c)(b)(a)(z)98632429433616669185991061521355414212588986Unweighted Total98632329733316668994*106*10116013250*14710886*985Weighted Total10538323420729981910620215107Very likely11%12%11%10%12%10%9%9%8%12%8%12%14%a20%zaeghi5%11%
1514745562511119141124235271912156Fairly likely15%15%15%17%15%16%20%13%11%15%18%11%19%18%14%16%
2006966672915015221931188492917206Not very likely20%21%22%20%17%22%15%20%19%19%13%15%34%zadefghi27%e19%21%e
52016715217188350496063857931503851507Not at all likely53%52%51%51%53%51%52%bc57%bc63%zbc53%bc60%zbc62%bc34%35%60%bc51%bc
102263631-13--1110Don't know/ No opinion1%1%1%2%2%1%3%zc1%-1%2%--1%1%1%
25685779045183282319433311484117263Likely26%26%26%27%27%27%30%22%18%27%25%22%32%ag38%zaegh20%27%g
7202362182371175006382821169639996768712Not likely73%73%73%71%71%73%67%77%b82%zbci72%73%78%b68%62%79%b72%b
-464-150-141-148-72-317-35-59-64-73-63-27-52-26-51-450Net likely-47%-47%-47%-44%-43%-46%-37%-55%-63%-46%-48%-55%-35%-24%-59%-46%
Public Perceptions of the NHS and Social CareFINAL PUBLIC
Table 52Q9.b If you were able to consult your GP in the following ways, how likely, if at all, would you be to do so? Again, by consulting your GP, I mean seeking advicefrom them about a health related matter.
- By email -
Base : All respondents who have not consulted their GP by email in the last year
Respondent type : General public aged 16+ Fieldwork dates : 14th November - 9th December 2011Source : Ipsos MORI (JN10-039262-01)Proportions/Means: Columns Tested (5% risk level) - z/a/b/c/d/e/f/g/h/i - z/j/k - z/l/m/n - z/oOverlap formulae used. * small base

UnwtdPrivate healthSatisfaction withImpact of NHS reformsGovernment has righttotalinsurancesocial careon patientsNHS policyNHS use in last year
SocialNHSDissatisficareWalk InChoicesPharmacistWtd.
NoYesedSatisfiedWorseBetterDisagreeAgreeservicesClinicwebsite/ChemistNHS DirectA&EOutpatientInpatientGPTotal(r)(q)(p)(o)(n)(m)(l)(k)(j)(i)(h)(g)(f)(e)(d)(c)(b)(a)(z)986807163442473781963992624518054296172222388194770986Unweighted Total98680216744*24237519638926842*18655*296177227370190762985Weighted Total10566399214327493542618474124462089107Very likely11%8%23%zq20%zn9%11%14%13%13%8%14%32%zabcdfh16%zabd23%zabcdfh11%12%11%12%11%q
ii
151124319256238634473284936385028128156Fairly likely15%15%18%20%10%16%19%16%16%18%17%14%17%21%c17%13%15%17%c16%n
2001643674968436762339124934546835150206Not very likely20%20%22%16%20%18%22%17%23%7%21%i22%i17%19%i24%cfi18%i19%i20%i21%fik
52043960181431978820612628881714864111205105387507Not at all likely53%55%zp36%42%59%zo52%45%53%47%67%zadefgh47%eg30%50%eg36%49%eg55%aegh55%eg51%eg51%eglp
1091136-52-1131-21710Don't know/ No opinion1%1%1%2%1%1%-1%1%-*2%d1%1%-**1%1%
25619070184710565112791158259677629649217263Likely26%24%42%zq40%zn19%28%33%z29%29%26%31%46%zabcdfh33%zbc44%zabcdfh27%26%26%28%z27%nq
ii
7206039725192265131272188311272919799165273140538712Not likely73%75%zp58%58%79%zo71%67%70%70%74%eg68%eg52%66%eg56%73%eg74%efg74%efg71%eg72%aefgop
-464-413-27-8-146-160-65-160-109-20-69-3-101-22-103-177-92-321-450Net likely-47%-51%-16%-17%-60%-43%-33%-41%-41%-48%-37%-6%-34%-12%-45%-48%-48%-42%-46%
Public Perceptions of the NHS and Social CareFINAL PUBLIC
Table 53Q9.b If you were able to consult your GP in the following ways, how likely, if at all, would you be to do so? Again, by consulting your GP, I mean seeking advicefrom them about a health related matter.
- By email -
Base : All respondents who have not consulted their GP by email in the last year
Respondent type : General public aged 16+ Fieldwork dates : 14th November - 9th December 2011Source : Ipsos MORI (JN10-039262-01)Proportions/Means: Columns Tested (5% risk level) - z/a/b/c/d/e/f/g/h/i - z/j/k - z/l/m - z/n/o - z/p/q - z/rOverlap formulae used. * small base

UnwtdtotalWork StatusSocial GradeAgeGender
Full/part-Wtd.OtherUnemployedRetiredtimeDEC2C1AB65+55-6435-5425-3416-24FemaleMaleTotal
(p)(o)(n)(m)(l)(k)(j)(i)(h)(g)(f)(e)(d)(c)(b)(a)(z)99916261270506246201305247220169330158122527472999Unweighted Total99915758*235548238201310249198143349167142515483999Weighted Total539134248182421027115262854Very likely5%6%m1%1%8%zm2%4%6%k10%zjk1%7%g8%zg6%g4%5%6%5%gkm
12817618922318454611205723216864132Fairly likely13%11%11%8%17%zm10%9%14%18%zjk5%14%g16%zg14%g15%g13%13%13%gjm
18038101612739337544131875444088102190Not very likely18%24%m17%m7%23%zm16%16%24%zjk18%7%13%g22%fg26%zfg28%zfg17%21%19%fgm
6269241194283168141169131168951858774328281609Not at all likely63%58%71%l82%zlno52%70%zhi70%zhi54%53%85%zcdef66%cde53%52%53%64%58%61%cdehil
122-4641344-3315712Don't know/ No opinion1%1%-2%1%2%*1%2%2%-1%2%1%1%2%1%
181267211332826637012308534269493187Likely18%16%m12%9%24%zmno12%13%20%jk28%zijk6%21%g24%zg20%g18%g18%19%19%gjkm
80612951210410207174244175181113261130114416383800Not likely81%82%88%l89%zlo75%87%zhi86%zhi79%h70%92%zcdef79%75%78%81%81%79%80%ehl
-625-103-44-189-277-179-148-182-105-169-83-176-96-88-322-291-613Net likely-63%-66%-76%-80%-50%-75%-73%-59%-42%-85%-58%-51%-57%-62%-62%-60%-61%
Public Perceptions of the NHS and Social CareFINAL PUBLIC
Table 54Q9.c If you were able to consult your GP in the following ways, how likely, if at all, would you be to do so? Again, by consulting your GP, I mean seeking advicefrom them about a health related matter.
- A voice or video call on the internet using a microphone or webcam (e.g. using Skype) -
Base : All respondents who have not consulted their GP by voice or video call on the internet in the last year
Respondent type : General public aged 16+ Fieldwork dates : 14th November - 9th December 2011Source : Ipsos MORI (JN10-039262-01)Proportions/Means: Columns Tested (5% risk level) - z/a/b - z/c/d/e/f/g - z/h/i/j/k - z/l/m/n/o - z/pOverlap formulae used. * small base

People aretreated with
Unwtddignity andtotalrespectNHS useHospital useEthnicityNHS/social care staffHousehold TypeHome Ownership
NotAdultshospitalHospitalInformalSocialwith
Non NHS/A&E/A&EsocialcareKnow NHSNHSdependentNon-Owner -PrivateSocialWtd.DisagreeAgreeuserNHS useruseruserMixedWhiteAsianBlackcarerworkerstaffstaffchildrenpensionerPensionerOtheroccupierrenterrenterTotal
(v)(u)(t)(s)(r)(q)(p)(o)(n)(m)(l)(k)(j)(i)(h)(g)(f)(e)(d)(c)(b)(a)(z)999307646999004565431074874161254362895029046024910649167173999Unweighted Total999302651103*89646653311**74578*15925038*29251*30447322110**640176173999Weighted Total5321324501837-405916220417352-3613554Very likely5%7%5%4%6%4%7%zq-5%7%6%6%5%7%8%6%e7%ze1%-6%7%3%5%eq
12841859123785518816274274894575121793418132Fairly likely13%13%13%9%14%17%zp10%11%12%20%n17%17%18%16%18%15%e16%ze6%11%12%19%zac11%13%enp
18043138291619397313321323225686810716-1223434190Not very likely18%14%21%zu28%zr18%20%18%32%18%27%20%13%6%19%jk15%22%e23%ze7%-19%20%20%19%ejkru
62619438858551269341647534891592816730171251187939493113609Not at all likely63%64%60%56%62%58%64%zq57%64%zm43%56%64%72%57%59%56%53%85%zfg89%62%b53%66%b61%bfm
123821084-9211-2-354-82212Don't know/ No opinion1%1%1%2%1%2%1%-1%3%1%*-1%-1%1%2%-1%1%1%1%
18162116141739691112821365896813621101511164723187Likely18%20%18%14%19%21%17%11%17%27%n23%23%z23%23%z25%20%e23%ze7%11%18%27%zac13%19%en
80623752687713362438106085512219030223382393582039516127147800Not likely81%78%81%84%80%78%82%89%82%zm70%76%76%77%76%75%79%76%92%zfg89%81%b72%85%b80%bfm
-625-175-410-73-540-267-346-8-479-34-85-132-21-155-25-177-248-188-8-400-80-124-613Net likely-63%-58%-63%-71%-60%-57%-65%-78%-64%-43%-54%-53%-55%-53%-49%-58%-52%-85%-77%-63%-46%-72%-61%
Public Perceptions of the NHS and Social CareFINAL PUBLIC
Table 55Q9.c If you were able to consult your GP in the following ways, how likely, if at all, would you be to do so? Again, by consulting your GP, I mean seeking advicefrom them about a health related matter.
- A voice or video call on the internet using a microphone or webcam (e.g. using Skype) -
Base : All respondents who have not consulted their GP by voice or video call on the internet in the last year
Respondent type : General public aged 16+ Fieldwork dates : 14th November - 9th December 2011Source : Ipsos MORI (JN10-039262-01)Proportions/Means: Columns Tested (5% risk level) - z/a/b/c/d - z/e/f/g - z/h/i/j/k - z/l/m/n/o - z/p/q - z/r/s - z/t/u - z/vOverlap formulae used. * small base; ** very small base (under 30) ineligible for sig testing

UnwtdtotalFuture of NHSSatisfaction with NHSGOR
DisYorkshire &WestEastWtd.WorseSameBettersatisfiedSatisfiedHumbersideMidlandsSouth-WestSouth-EastNorth-WestNorth-EastLondonEasternMidlandsTotal
(o)(n)(m)(l)(k)(j)(i)(h)(g)(f)(e)(d)(c)(b)(a)(z)99932729834216870189991071541395514312588999Unweighted Total99932630233916869999*106*10216213651*14810886*999Weighted Total5321161515336551244116354Very likely5%7%5%4%9%zj5%6%5%5%7%3%8%7%6%3%5%
128414544229811111122205311112132Fairly likely13%13%15%13%13%14%11%10%10%14%14%9%21%zbghi10%13%13%
1805849772913220211128207512113190Not very likely18%18%16%23%zm18%19%20%20%11%17%14%13%35%zabdefghi19%15%19%g
626206187198101426616975998935537057609Not at all likely63%63%62%58%60%61%62%c65%c74%zcf61%c66%c69%c36%65%c66%c61%c
12-561102--24-2-212Don't know/ No opinion1%-2%n2%n1%1%2%--1%3%-2%-2%1%n
1816361583613016161634239411714187Likely18%19%20%17%22%19%16%15%16%21%17%17%28%zbeghi16%17%19%
806263236275130558819086126109421049170800Not likely81%81%78%81%78%80%82%85%c84%c78%80%83%70%84%c81%80%c
-625-201-175-217-94-428-64-74-70-93-86-33-63-74-55-613Net likely-63%-62%-58%-64%-56%-61%-65%-70%-69%-57%-63%-65%-43%-68%-64%-61%
Public Perceptions of the NHS and Social CareFINAL PUBLIC
Table 56Q9.c If you were able to consult your GP in the following ways, how likely, if at all, would you be to do so? Again, by consulting your GP, I mean seeking advicefrom them about a health related matter.
- A voice or video call on the internet using a microphone or webcam (e.g. using Skype) -
Base : All respondents who have not consulted their GP by voice or video call on the internet in the last year
Respondent type : General public aged 16+ Fieldwork dates : 14th November - 9th December 2011Source : Ipsos MORI (JN10-039262-01)Proportions/Means: Columns Tested (5% risk level) - z/a/b/c/d/e/f/g/h/i - z/j/k - z/l/m/n - z/oOverlap formulae used. * small base

UnwtdPrivate healthSatisfaction withImpact of NHS reformsGovernment has righttotalinsurancesocial careon patientsNHS policyNHS use in last year
SocialNHSDissatisficareWalk InChoicesPharmacistWtd.
NoYesedSatisfiedWorseBetterDisagreeAgreeservicesClinicwebsite/ChemistNHS DirectA&EOutpatientInpatientGPTotal(r)(q)(p)(o)(n)(m)(l)(k)(j)(i)(h)(g)(f)(e)(d)(c)(b)(a)(z)999813170442483812004022684518255299177225393196779999Unweighted Total99980817544*24337920139127542*18856*300183230376192772999Weighted Total533223632611201811391822163194354Very likely5%4%13%zq13%zn1%7%6%5%7%2%7%17%zabcdfhi6%12%zabdfhi7%8%zab5%6%5%nq
128943693147365738534134131253220105132Fairly likely13%12%21%zq20%13%12%18%z14%14%12%18%zabcd22%zbcd14%c17%bcd11%9%10%14%c13%cq
180154319396841656852695533505732139190Not very likely18%19%18%22%16%18%20%17%25%zk13%14%15%18%18%22%ch15%17%18%19%ch
6265217920167232111244147311132618496138253129475609Not at all likely63%65%zp45%46%69%zo61%56%62%j54%73%eg60%g46%61%eg52%60%eg67%zadefgh67%zeg62%eg61%egjop
1275-26164-2-311311012Don't know/ No opinion1%1%3%zq-1%2%1%1%2%-1%-1%1%1%1%*1%1%q
18112659143573487656647225954416329148187Likely18%16%34%zq33%zn14%19%24%20%20%14%25%zabcd39%zabcdfh20%29%zabcdfi18%17%15%19%19%nq
i
806676111302063001523092153613834238128188310162614800Not likely81%84%zp63%67%85%zo79%76%79%78%86%eg74%g61%79%eg70%82%egh82%egh84%egh80%egh80%eghop
-625-550-52-15-171-227-105-233-159-30-91-12-179-74-148-246-132-466-613Net likely-63%-68%-30%-35%-71%-60%-52%-60%-58%-72%-49%-22%-60%-41%-64%-66%-69%-60%-61%
Public Perceptions of the NHS and Social CareFINAL PUBLIC
Table 57Q9.c If you were able to consult your GP in the following ways, how likely, if at all, would you be to do so? Again, by consulting your GP, I mean seeking advicefrom them about a health related matter.
- A voice or video call on the internet using a microphone or webcam (e.g. using Skype) -
Base : All respondents who have not consulted their GP by voice or video call on the internet in the last year
Respondent type : General public aged 16+ Fieldwork dates : 14th November - 9th December 2011Source : Ipsos MORI (JN10-039262-01)Proportions/Means: Columns Tested (5% risk level) - z/a/b/c/d/e/f/g/h/i - z/j/k - z/l/m - z/n/o - z/p/q - z/rOverlap formulae used. * small base

A voice orvideo call onthe internet
using amicrophone orBy telephonewebcam (e.g.(not includingusing Skype)By emailNHS Direct)
999986756Unweighted Total999985758Weighted Total54107225Very likely5%11%30%
132156296Fairly likely13%16%39%
190206108Not very likely19%21%14%
609507118Not at all likely61%51%15%121011Don't know/ No opinion1%1%1%
187263522Likely19%27%69%
800712225Not likely80%72%30%
-613-450296Net likely-61%-46%39%
Public Perceptions of the NHS and Social CareFINAL PUBLIC
Table 58Q9. If you were able to consult your GP in the following ways, how likely, if at all, would you be to do so? Again, by consulting your GP, I mean seeking advicefrom them about a health related matter.
- Summary -
Base : All respondents who have not consulted their GP by telephone, email or voice/video call on the internet in the last year
Respondent type : General public aged 16+ Fieldwork dates : 14th November - 9th December 2011Source : Ipsos MORI (JN10-039262-01)

UnwtdtotalWork StatusSocial GradeAgeGender
Full/part-Wtd.OtherUnemployedRetiredtimeDEC2C1AB65+55-6435-5425-3416-24FemaleMaleTotal
(p)(o)(n)(m)(l)(k)(j)(i)(h)(g)(f)(e)(d)(c)(b)(a)(z)1001162612705082472013062472201693311581235274741001Unweighted Total100115758*2355512392013122491981433501671435154861001Weighted Total1091661277191144367214724116545110Online appointment11%10%10%5%14%zm8%6%14%zjk14%jk3%15%g14%g14%g8%13%9%11%gjmbooking service
21045162213351437446172583543612491215Receiving reminders21%28%zm27%m9%24%zm21%21%24%19%9%17%g24%g32%zfg25%g24%za19%21%agmabout appointments by
mobile phone textmessage
78722443912233219133076443276Online repeat8%4%3%10%o8%4%6%7%13%zijk10%d9%9%4%4%8%7%8%kprescriptions ordering
service28534189113652897171330Receiving reminders3%3%5%2%3%4%j*4%j3%2%1%2%5%f5%3%3%3%jabout repeat
prescriptions by mobilephone text message
195-21353662193614520111 telephone service2%3%-1%2%2%2%2%2%1%1%2%2%4%3%1%2%afor non-emergency
assistance64694401793271591371961491541012049290312329641None of these65%60%69%76%zlo59%67%68%63%60%78%zcde70%de58%55%63%60%68%zb64%bdel
3--122--11-11-3-3Don't know*--**1%--**-*1%-1%-*
Public Perceptions of the NHS and Social CareFINAL PUBLIC
Table 59Q10. Some people are starting to have contact with NHS services in a number of new ways. In which, if any, of the following ways have you had contact with anNHS service (such as your GP surgery, local hospital, dentist or pharmacy) in the last year?
Base : All respondents
Respondent type : General public aged 16+ Fieldwork dates : 14th November - 9th December 2011Source : Ipsos MORI (JN10-039262-01)Proportions/Means: Columns Tested (5% risk level) - z/a/b - z/c/d/e/f/g - z/h/i/j/k - z/l/m/n/o - z/pOverlap formulae used. * small base

People aretreated with
Unwtddignity andtotalrespectNHS useHospital useEthnicityNHS/social care staffHousehold TypeHome Ownership
NotAdultshospitalHospitalInformalSocialwith
Non NHS/A&E/A&EsocialcareKnow NHSNHSdependentNon-Owner -PrivateSocialWtd.DisagreeAgreeuserNHS useruseruserMixedWhiteAsianBlackcarerworkerstaffstaffchildrenpensionerPensionerOtheroccupierrenterrenterTotal
(v)(u)(t)(s)(r)(q)(p)(o)(n)(m)(l)(k)(j)(i)(h)(g)(f)(e)(d)(c)(b)(a)(z)100130864710090145854310750741612543628951291461249106491691731001Unweighted Total1001304652104*89746853311**74778*15925038*29252*30547522110**6401781731001Weighted Total109406621084070180918335419296912-662816110Online appointment11%13%10%2%12%zs9%13%zq9%11%11%11%13%13%14%17%10%15%ze5%-10%16%zc9%11%eqsbooking service
210661436209771382154203760117711751202111036546215Receiving reminders21%22%22%6%23%zs16%26%zq21%21%25%24%24%29%26%z21%24%e25%ze9%11%16%36%zc27%c21%ceqsabout appointments by
mobile phone textmessage
7824493733442-6637261276223222-5910776Online repeat8%8%8%3%8%7%8%-9%z4%5%11%3%9%12%7%7%10%-9%za5%4%8%aprescriptions ordering
service28111812811191233310-1237203-815630Receiving reminders3%3%3%1%3%2%4%11%3%4%2%4%-4%5%2%4%2%-1%8%zc4%c3%cabout repeat
prescriptions by mobilephone text message
19614-20109-9387232893-115420111 telephone service2%2%2%-2%2%2%-1%4%n5%zn3%6%i1%4%3%2%1%-2%3%2%2%nfor non-emergency
assistance646192416915503163258483481001472116730185288168943588109641None of these65%63%64%88%zr61%68%zp61%70%65%61%63%59%54%57%56%61%61%76%zfg89%68%zb49%63%b64%bfikp
r
3-3-33--111--1-111-1113Don't know*-*-*1%--*1%n*--*-***-*1%1%*
Public Perceptions of the NHS and Social CareFINAL PUBLIC
Table 60Q10. Some people are starting to have contact with NHS services in a number of new ways. In which, if any, of the following ways have you had contact with anNHS service (such as your GP surgery, local hospital, dentist or pharmacy) in the last year?
Base : All respondents
Respondent type : General public aged 16+ Fieldwork dates : 14th November - 9th December 2011Source : Ipsos MORI (JN10-039262-01)Proportions/Means: Columns Tested (5% risk level) - z/a/b/c/d - z/e/f/g - z/h/i/j/k - z/l/m/n/o - z/p/q - z/r/s - z/t/u - z/vOverlap formulae used. * small base; ** very small base (under 30) ineligible for sig testing

UnwtdtotalFuture of NHSSatisfaction with NHSGOR
DisYorkshire &WestEastWtd.WorseSameBettersatisfiedSatisfiedHumbersideMidlandsSouth-WestSouth-EastNorth-WestNorth-EastLondonEasternMidlandsTotal
(o)(n)(m)(l)(k)(j)(i)(h)(g)(f)(e)(d)(c)(b)(a)(z)1001328298343168703909910715413955143126881001Unweighted Total1001327302340168701100*106*10216213651*14810986*1001Weighted Total109402939217216691411524196110Online appointment11%12%9%11%12%10%16%ah5%9%8%8%11%16%zaefh17%zaefh6%11%booking service
21072647439151261329372710451712215Receiving reminders21%22%21%22%23%21%26%h12%28%abh23%h20%19%30%zabh16%14%21%habout appointments by
mobile phone textmessage
782819261252126814103215676Online repeat8%9%6%8%7%7%12%c6%8%c9%c7%c6%1%14%zch7%c8%cprescriptions ordering
service281371071764132-102-30Receiving reminders3%4%2%3%4%2%6%ag4%1%2%2%-7%zadefg2%-3%about repeat
prescriptions by mobilephone text message
191145-1821124611120111 telephone service2%3%1%1%-3%k2%1%1%1%3%11%zabcefghi1%1%1%2%for non-emergency
assistance6461991992191074485981601079032836565641None of these65%61%66%64%64%64%59%77%zbcgi58%66%66%63%56%60%75%zbcgi64%c
3111-2----111--3Don't know****-*----1%2%1%--*
Public Perceptions of the NHS and Social CareFINAL PUBLIC
Table 61Q10. Some people are starting to have contact with NHS services in a number of new ways. In which, if any, of the following ways have you had contact with anNHS service (such as your GP surgery, local hospital, dentist or pharmacy) in the last year?
Base : All respondents
Respondent type : General public aged 16+ Fieldwork dates : 14th November - 9th December 2011Source : Ipsos MORI (JN10-039262-01)Proportions/Means: Columns Tested (5% risk level) - z/a/b/c/d/e/f/g/h/i - z/j/k - z/l/m/n - z/oOverlap formulae used. * small base
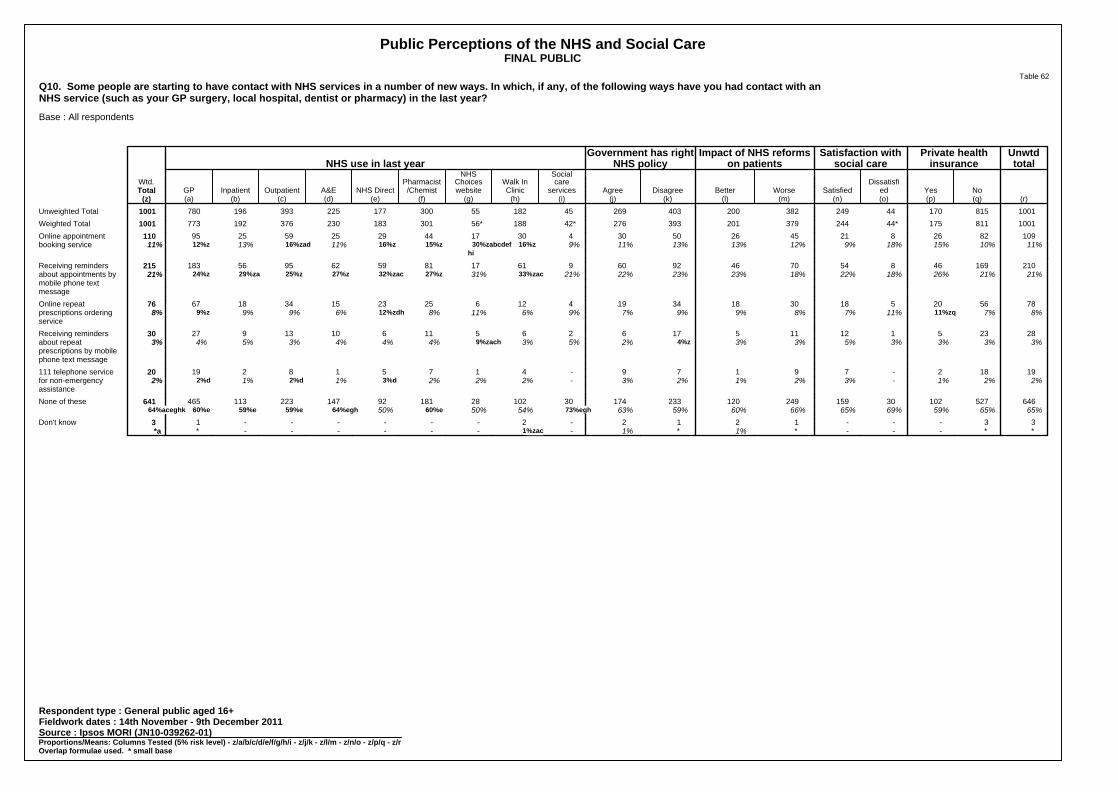
UnwtdPrivate healthSatisfaction withImpact of NHS reformsGovernment has righttotalinsurancesocial careon patientsNHS policyNHS use in last year
SocialNHSDissatisficareWalk InChoicesPharmacistWtd.
NoYesedSatisfiedWorseBetterDisagreeAgreeservicesClinicwebsite/ChemistNHS DirectA&EOutpatientInpatientGPTotal(r)(q)(p)(o)(n)(m)(l)(k)(j)(i)(h)(g)(f)(e)(d)(c)(b)(a)(z)10018151704424938220040326945182553001772253931967801001Unweighted Total100181117544*24437920139327642*18856*3011832303761927731001Weighted Total10982268214526503043017442925592595110Online appointment11%10%15%18%9%12%13%13%11%9%16%z30%zabcdef15%z16%z11%16%zad13%12%z11%booking service
hi
2101694685470469260961178159629556183215Receiving reminders21%21%26%18%22%18%23%23%22%21%33%zac31%27%z32%zac27%z25%z29%za24%z21%about appointments by
mobile phone textmessage
78562051830183419412625231534186776Online repeat8%7%11%zq11%7%8%9%9%7%9%6%11%8%12%zdh6%9%9%9%z8%prescriptions ordering
service28235112115176265116101392730Receiving reminders3%3%3%3%5%3%3%4%z2%5%3%9%zach4%4%4%3%5%4%3%about repeat
prescriptions by mobilephone text message
19182-79179-41751821920111 telephone service2%2%1%-3%2%1%2%3%-2%2%2%3%d1%2%d1%2%d2%for non-emergency
assistance64652710230159249120233174301022818192147223113465641None of these65%65%59%69%65%66%60%59%63%73%egh54%50%60%e50%64%egh59%e59%e60%e64%aceghk
33---1212-2------13Don't know**---*1%*1%-1%zac------**a
Public Perceptions of the NHS and Social CareFINAL PUBLIC
Table 62Q10. Some people are starting to have contact with NHS services in a number of new ways. In which, if any, of the following ways have you had contact with anNHS service (such as your GP surgery, local hospital, dentist or pharmacy) in the last year?
Base : All respondents
Respondent type : General public aged 16+ Fieldwork dates : 14th November - 9th December 2011Source : Ipsos MORI (JN10-039262-01)Proportions/Means: Columns Tested (5% risk level) - z/a/b/c/d/e/f/g/h/i - z/j/k - z/l/m - z/n/o - z/p/q - z/rOverlap formulae used. * small base

UnwtdtotalWork StatusSocial GradeAgeGender
Full/part-Wtd.OtherUnemployedRetiredtimeDEC2C1AB65+55-6435-5425-3416-24FemaleMaleTotal
(p)(o)(n)(m)(l)(k)(j)(i)(h)(g)(f)(e)(d)(c)(b)(a)(z)1001162612705082472013062472201693311581235274741001Unweighted Total100115758*2355512392013122491981433501671435154861001Weighted Total
158321031885829482622165733329367160ACCESS TO TREATMENT/16%20%m17%13%16%24%zhij14%15%11%11%11%16%20%fg23%zfg18%14%16%ghWAITING TIME
158321031885829482622165733329367160Long waiting lists/16%20%m17%13%16%24%zhij14%15%11%11%11%16%20%fg23%zfg18%14%16%ghtimes
3213331485172151475211132CHOICE3%8%zlm5%1%3%3%h2%5%zh1%*4%g4%g4%g3%4%2%3%ghm
1772-94391-346512517Not enough patient2%4%zlm3%m-2%m2%1%3%h*-2%g1%3%g3%g2%1%2%mchoice about care/
treatment
2292397311113134115722Not enough patient2%6%zlm3%1%2%3%h1%4%h**2%4%zg2%1%3%1%2%ghsay/involvement in
decisions abouthealthcare services
1069826602925302023173614144757104EXTERNAL FACTORS11%6%14%o11%11%12%13%10%8%11%12%10%8%10%9%12%10%o
1---1--1----1--11Bird flu*---*--*----1%--**1---1--1----1--11Swine flu*---*--*----1%--**
36331117111094851433151834Foreigners/immigrants4%2%5%5%3%4%5%h3%2%4%4%4%2%2%3%4%3%3-2-13------3--33Flu pandemic*-3%zlmo-*1%z------2%ze--1%*
565315311315111414121855282653Overstretched/aging6%3%5%6%6%6%7%4%6%7%8%d5%3%4%5%5%5%population
121129229--21366813Public health problems1%1%2%1%2%1%1%3%zh--2%*2%g4%zeg1%2%1%e(smoking, obesity,
sexual health, etc)
16143963432275-7916Trivial use/abuse2%1%6%zlmo1%2%2%2%1%1%1%1%2%3%-1%2%2%
2753413721536256787662461083819118155273MANAGEMENT/ BUREAUCRACY27%22%23%31%o28%26%28%25%31%32%c32%c31%c23%c13%23%32%zb27%bc
1621374791363352383933641937584159Bureaucracy/top heavy16%9%13%20%zo17%o15%16%17%15%20%cd23%zcd18%cd11%c2%15%17%16%comanagement
6511214381112162611132697254065Political influence/6%7%4%6%7%5%6%5%11%zik5%9%7%5%5%5%8%zb6%bgovernment targets
58842025201016121581898213757Privatisation6%5%7%8%zl5%8%5%5%5%7%6%5%5%6%4%8%zb6%b
275251563109631125111627Problems prioritising3%3%3%2%3%2%1%3%4%3%2%3%1%3%2%3%3%treatment/patient
groups
348-81989117741176122235Big changes to3%5%-3%3%3%4%4%3%4%3%3%4%4%2%5%3%services/ NHS reforms
Public Perceptions of the NHS and Social CareFINAL PUBLIC
Table 63Q11. Overall, what do you see as the biggest problems facing the NHS? What else?
Base : All respondents
Respondent type : General public aged 16+ Fieldwork dates : 14th November - 9th December 2011Source : Ipsos MORI (JN10-039262-01)Proportions/Means: Columns Tested (5% risk level) - z/a/b - z/c/d/e/f/g - z/h/i/j/k - z/l/m/n/o - z/pOverlap formulae used. * small base

UnwtdtotalWork StatusSocial GradeAgeGender
Full/part-Wtd.OtherUnemployedRetiredtimeDEC2C1AB65+55-6435-5425-3416-24FemaleMaleTotal
(p)(o)(n)(m)(l)(k)(j)(i)(h)(g)(f)(e)(d)(c)(b)(a)(z)100115758*2355512392013122491981433501671435154861001Weighted Total
61787341403581401221981601158822810781347272620RESOURCES/INVESTMENT62%55%59%60%65%zo59%60%64%64%58%61%65%64%57%67%za56%62%a
393452388237758012011971591635744212181393Lack of resources/39%29%39%38%43%zo31%40%38%48%zik36%41%47%zcdg34%31%41%37%39%ckoinvestment
56851429181219681315118312455Hospital closures/lack6%5%8%6%5%8%h6%6%h3%4%9%e4%7%6%6%5%6%hof hospitals/
facilities
1913613469852366737362860363311577192Not enough doctors/19%23%21%19%18%22%h18%22%h15%18%19%17%21%23%22%za16%19%ahnurses/understaffed
20412135482-3104214620Poor pay for NHS staff2%3%2%1%2%2%2%3%1%-2%g3%g2%g2%3%1%2%g
528215261181815121310106321951Poor quality staff5%5%3%6%5%4%4%6%6%6%9%ze3%6%4%6%4%5%eeducation/training
85124244322212316171526196473683Overworked staff8%8%7%10%8%9%11%7%6%9%11%c7%11%c4%9%7%8%
30425207712562995201131Shortage of beds3%3%3%2%4%3%4%4%2%3%2%2%6%3%4%2%3%
216321112-632-123513922Shortage of NHS2%4%m6%m1%2%5%zhij-2%j1%1%-4%f2%3%f2%2%2%jmdentists
3651725671865413132172137Staff retention4%3%2%3%5%2%4%6%zk3%3%3%4%8%zcg2%3%4%4%
89216184123142723131640144533387TREATMENT QUALITY/9%14%zlm11%8%8%9%7%9%9%7%11%c11%zc9%c3%10%7%9%cIMPROVEMENTS
49122102413912136122163301748Low quality of5%8%z3%4%4%6%5%4%5%3%8%zcg6%4%2%6%4%5%services/treatment/
care
296371345128631161181028Poor quality care of3%4%5%3%2%2%3%4%3%3%2%3%4%1%3%2%3%the elderly
223261173845286-12921Poor standards of2%2%3%2%2%3%1%3%2%3%1%2%4%c-2%2%2%cleanliness/superbugs/
MRSA
-----------------Access to services----------------------------------Bad press/the media----------------------------------Being supported through-----------------taxation1---1---1-1----11Cancellation of*---*---*-1%z----**appointments/operations-----------------Culture change/diversity-----------------71-25133--23-1267Cutbacks1%1%-1%1%*1%1%--2%1%-1%*1%1%
Public Perceptions of the NHS and Social CareFINAL PUBLIC
Table 63Q11. Overall, what do you see as the biggest problems facing the NHS? What else?
Base : All respondents
Respondent type : General public aged 16+ Fieldwork dates : 14th November - 9th December 2011Source : Ipsos MORI (JN10-039262-01)Proportions/Means: Columns Tested (5% risk level) - z/a/b - z/c/d/e/f/g - z/h/i/j/k - z/l/m/n/o - z/pOverlap formulae used. * small base

UnwtdtotalWork StatusSocial GradeAgeGender
Full/part-Wtd.OtherUnemployedRetiredtimeDEC2C1AB65+55-6435-5425-3416-24FemaleMaleTotal
(p)(o)(n)(m)(l)(k)(j)(i)(h)(g)(f)(e)(d)(c)(b)(a)(z)100115758*2355512392013122491981433501671435154861001Weighted Total
-----------------Doctors/consultants-----------------spending too much time
on private practice1--1---1--1---1-1Employment of overseas*--*---*--1%---*-*doctors/nursing staff-----------------Enable patients to see a-----------------doctor 24-7/out-of-hours
service51--41-13-22-1235Expectations/demands*1%--1%*-*1%-1%1%-1%*1%*from patients/public41-12--311-21-134GP appointment system/*1%-**--1%**-1%1%-*1%*long wait to get an
appointment-----------------Health risks due to-----------------uniforms being worn
outside hospital3--12-1111-2---33High cost of drugs/*--**-****-1%---1%*equipment/availability-----------------Improve hospital-----------------appointment system/fewer
cancellations-----------------Lack of aftercare-----------------611-41131-222-236Lack of communication1%*1%-1%**1%*-1%1%1%-*1%1%between departments2--11--111-1--112Lack of focus on the*--**--***-*--***patient2--2---112-----22Lack of government*--1%l---**1%z-----**support/backing-----------------Lack of information-----------------311-1--21-21--213Lack of vision/*1%1%-*--1%*-1%*--***direction/planning31-11111-111--123Language problems/*1%-*****-*1%*--***foreign staff-----------------Litigation----------------------------------Low staff morale-----------------2---2--11--2---22Management/too*---*--**--1%---**inefficient62-31--242121-336Misuse of funds/money1%1%-1%*--1%2%zk1%1%1%1%-1%1%1%not going to the right
places
Public Perceptions of the NHS and Social CareFINAL PUBLIC
Table 63Q11. Overall, what do you see as the biggest problems facing the NHS? What else?
Base : All respondents
Respondent type : General public aged 16+ Fieldwork dates : 14th November - 9th December 2011Source : Ipsos MORI (JN10-039262-01)Proportions/Means: Columns Tested (5% risk level) - z/a/b - z/c/d/e/f/g - z/h/i/j/k - z/l/m/n/o - z/pOverlap formulae used. * small base

UnwtdtotalWork StatusSocial GradeAgeGender
Full/part-Wtd.OtherUnemployedRetiredtimeDEC2C1AB65+55-6435-5425-3416-24FemaleMaleTotal
(p)(o)(n)(m)(l)(k)(j)(i)(h)(g)(f)(e)(d)(c)(b)(a)(z)100115758*2355512392013122491981433501671435154861001Weighted Total
1---1--1--1---1-1Mixed wards*---*--*--1%---*-*1---1---1--1--1-1Need new/updated*---*---*--*--*-*equipment/technology-----------------NHS is run by people-----------------with little/no
experience3---3--12-21--3-3Not being able to see/*---1%--*1%-1%z*--1%-*spend too much time with
a GP/the same GP twice-----------------Opening times of GP/-----------------doctor's surgery-----------------Overpaid management/GPs-----------------2-1-1-1-1--2--112Patients having to pay/*-2%z-*-*-*--1%--***pay for prescriptions/
general costs6--25--153-2-1426Poor administration/1%--1%1%--*2%zjk1%-1%-1%1%*1%organisation/lost
records1---1-1---1----11Poor/expensive hospital*---*-*---1%----**parking-----------------Poor food/catering----------------------------------Poor GP services/-----------------facilities-----------------Poor IT systems-----------------11-----1----1-1-1Poor/lack of A&E*1%-----*----*-*-*services-----------------Poor/slow response time-----------------of ambulances31-1111-111-1-213Postcode lottery*1%-***1%-**1%-1%-***-----------------Public opinions/-----------------perception/lack of
public confidence-----------------Reduce pay of-----------------underperforming staff1--1----1-1----11Rude/arrogant attitude*--*----*-*----**of NHS staff-----------------Security-----------------
Public Perceptions of the NHS and Social CareFINAL PUBLIC
Table 63Q11. Overall, what do you see as the biggest problems facing the NHS? What else?
Base : All respondents
Respondent type : General public aged 16+ Fieldwork dates : 14th November - 9th December 2011Source : Ipsos MORI (JN10-039262-01)Proportions/Means: Columns Tested (5% risk level) - z/a/b - z/c/d/e/f/g - z/h/i/j/k - z/l/m/n/o - z/pOverlap formulae used. * small base

UnwtdtotalWork StatusSocial GradeAgeGender
Full/part-Wtd.OtherUnemployedRetiredtimeDEC2C1AB65+55-6435-5425-3416-24FemaleMaleTotal
(p)(o)(n)(m)(l)(k)(j)(i)(h)(g)(f)(e)(d)(c)(b)(a)(z)100115758*2355512392013122491981433501671435154861001Weighted Total
31-111-1121---123Should bring back*1%-***-**1%1%---***matrons-----------------Too much admin/reduce-----------------amount spent on admin-----------------Too much centralisation-----------------
10113533132341-2810Too many people using1%1%2%1%1%1%2%*1%1%2%1%1%-*2%b1%bwho are not entitled/
have not paid N.I1--1----11----1-1Too unwieldy/too large*--*----**----*-*to manage1---1--1---1--1-1Use of sub-contractors*---*--*---*--*-*rather than permanent
staff102--9--110-254-6411Other1%1%--2%m--*4%zijk-1%2%2%g-1%1%1%
5720515171710181214271321282957Don't know6%13%zlm9%l6%l3%7%5%6%5%7%ef2%2%8%ef15%zefg5%6%6%efl
17335674236-4338917None of these/No answer2%2%5%zl2%1%3%i2%1%1%3%f-1%2%2%2%2%2%51-131-22-1-22325Not stated*1%-*1%*-1%1%-*-1%e2%e1%*1%
1.801.761.781.741.831.811.711.881.741.632.00zcg1.90cg1.86c1.491.851.741.79cgMean number of mentions
Public Perceptions of the NHS and Social CareFINAL PUBLIC
Table 63Q11. Overall, what do you see as the biggest problems facing the NHS? What else?
Base : All respondents
Respondent type : General public aged 16+ Fieldwork dates : 14th November - 9th December 2011Source : Ipsos MORI (JN10-039262-01)Proportions/Means: Columns Tested (5% risk level) - z/a/b - z/c/d/e/f/g - z/h/i/j/k - z/l/m/n/o - z/pOverlap formulae used. * small base

People aretreated with
Unwtddignity andtotalrespectNHS useHospital useEthnicityNHS/social care staffHousehold TypeHome Ownership
NotAdultshospitalHospitalInformalSocialwith
Non NHS/A&E/A&EsocialcareKnow NHSNHSdependentNon-Owner -PrivateSocialWtd.DisagreeAgreeuserNHS useruseruserMixedWhiteAsianBlackcarerworkerstaffstaffchildrenpensionerPensionerOtheroccupierrenterrenterTotal
(v)(u)(t)(s)(r)(q)(p)(o)(n)(m)(l)(k)(j)(i)(h)(g)(f)(e)(d)(c)(b)(a)(z)100130864710090145854310750741612543628951291461249106491691731001Unweighted Total1001304652104*89746853311**74778*15925038*29252*30547522110**6401781731001Weighted Total
158461091114966941992832375314567629-764440160ACCESS TO TREATMENT/16%15%17%10%17%14%18%10%13%36%zln20%n15%14%11%8%18%16%13%-12%25%zc23%zc16%cinWAITING TIME
158461091114966941992832375314567629-764440160Long waiting lists/16%15%17%10%17%14%18%10%13%36%zln20%n15%14%11%8%18%16%13%-12%25%zc23%zc16%cintimes
329211311418-2165726212173-991432CHOICE3%3%3%1%3%3%3%-3%7%zn3%3%5%2%4%4%4%1%-1%5%c8%zc3%ce
17510-1789-105222216101-45817Not enough patient2%2%2%-2%2%2%-1%6%zln1%1%5%ik1%2%2%2%*-1%3%c5%zc2%cchoice about care/
treatment
227151211012-162451511183-651122Not enough patient2%2%2%1%2%2%2%-2%2%2%2%3%2%2%4%2%1%-1%3%6%zc2%csay/involvement in
decisions abouthealthcare services
1063166139153511786182613352356253701714104EXTERNAL FACTORS11%10%10%12%10%11%10%9%10%8%11%10%2%11%9%7%12%12%29%11%9%8%10%g
1-1-11--1----1--1---1-1Bird flu*-*-**--*----*--*---1%c-*1-1-11--1----1--1---1-1Swine flu*-*-**--*----*--*---1%c-*
361120232151812416818-91411-236534Foreigners/immigrants4%3%3%2%4%3%3%9%3%1%4%3%2%3%-3%3%5%-4%3%3%3%3-3-33--111-----3---213Flu pandemic*-*-*1%--*1%1%-----1%---1%c1%*
5615348452627-413914-1611325151415653Overstretched/aging6%5%5%8%5%6%5%-6%4%6%6%-6%2%4%5%7%8%6%z3%4%5%population
125811277-10-3--411111136313Public health problems1%2%1%1%1%1%1%-1%-2%--1%3%k*2%zg*11%*3%zc2%1%c(smoking, obesity,
sexual health, etc)
1641111597-9256-7241021102316Trivial use/abuse2%1%2%1%2%2%1%-1%3%3%n2%-2%4%1%2%1%10%2%1%2%2%n
2759316422251120153221715366689019781266931894239273MANAGEMENT/ BUREAUCRACY27%31%25%21%28%26%29%20%29%z20%23%27%21%31%37%25%27%31%32%29%z24%22%27%
16267851114869901135615375481440794011182316159Bureaucracy/top heavy16%22%zt13%11%16%15%17%10%18%zlm8%10%15%14%16%26%zk13%17%18%10%19%za13%9%16%altmanagement
6518408573629-535615119218341314313865Political influence/6%6%6%8%6%8%5%-7%7%4%6%3%7%4%6%7%6%10%7%7%5%6%government targets
589463542829-3931615-213103216135101157Privatisation6%3%7%zu3%6%6%5%-5%4%10%zn6%-7%6%3%7%g7%g11%5%6%6%6%gu
Public Perceptions of the NHS and Social CareFINAL PUBLIC
Table 64Q11. Overall, what do you see as the biggest problems facing the NHS? What else?
Base : All respondents
Respondent type : General public aged 16+ Fieldwork dates : 14th November - 9th December 2011Source : Ipsos MORI (JN10-039262-01)Proportions/Means: Columns Tested (5% risk level) - z/a/b/c/d - z/e/f/g - z/h/i/j/k - z/l/m/n/o - z/p/q - z/r/s - z/t/u - z/vOverlap formulae used. * small base; ** very small base (under 30) ineligible for sig testing

People aretreated with
Unwtddignity andtotalrespectNHS useHospital useEthnicityNHS/social care staffHousehold TypeHome Ownership
NotAdultshospitalHospitalInformalSocialwith
Non NHS/A&E/A&EsocialcareKnow NHSNHSdependentNon-Owner -PrivateSocialWtd.DisagreeAgreeuserNHS useruseruserMixedWhiteAsianBlackcarerworkerstaffstaffchildrenpensionerPensionerOtheroccupierrenterrenterTotal
(v)(u)(t)(s)(r)(q)(p)(o)(n)(m)(l)(k)(j)(i)(h)(g)(f)(e)(d)(c)(b)(a)(z)1001304652104*89746853311**74778*15925038*29252*30547522110**6401781731001Weighted Total
2781912610171221381718128-155727Problems prioritising3%3%3%1%3%2%3%10%3%1%2%3%4%3%2%2%2%4%-2%3%4%3%treatment/patient
groups
348251341618123476-17491781247235Big changes to3%2%4%1%4%4%3%10%3%5%4%2%-6%zk8%k3%4%4%11%4%4%1%3%aservices/ NHS reforms
6171943985456627434554723310615030185402002911284393107116620RESOURCES/INVESTMENT62%64%61%52%63%zs59%65%zq42%63%m43%67%m60%78%zk63%77%zik66%61%58%41%61%60%67%62%ms
393117261393541752182307186410117122251331808032735859393Lack of resources/39%39%40%37%40%37%41%22%41%zm23%40%m40%44%42%48%44%38%36%30%43%zab33%34%39%minvestment
5617377482134-4456111144162612-23191255Hospital closures/lack6%6%6%6%5%4%6%-6%7%4%4%3%5%8%5%6%6%-4%11%zc7%c6%cof hospitals/
facilities
191611231218075117-14614324212621469843911103842192Not enough doctors/19%20%19%11%20%zs16%22%zq-20%18%20%17%32%zk21%27%23%18%18%11%17%22%25%c19%cqsnurses/understaffed
20413119109-13348-83128--105520Poor pay for NHS staff2%1%2%1%2%2%2%-2%4%2%3%-3%6%4%zef2%--2%3%3%2%e
5224263481140-391918416813251313461051Poor quality staff5%8%zt4%3%5%2%7%zq-5%1%6%7%11%6%16%zik4%5%6%11%5%3%6%5%qteducation/training
8528527763251159419218256273621-50151883Overworked staff8%9%8%7%8%7%10%10%8%5%12%8%21%zik8%12%9%8%9%-8%8%11%8%
3011191301318-203861819166-1210931Shortage of beds3%4%3%1%3%3%3%-3%4%5%2%3%3%2%3%3%3%-2%6%zc5%c3%c
214162201210-161441511382-811222Shortage of NHS2%1%2%2%2%3%2%-2%1%2%2%3%2%2%4%zef2%1%-1%1%7%zbc2%cdentists
36132433423151263654659226-209837Staff retention4%4%4%3%4%5%3%10%3%4%4%2%10%zik2%9%ik3%5%3%-3%5%5%4%i
8941416803255268412284183333716-54181487TREATMENT QUALITY/9%13%zt6%6%9%7%10%zq19%9%5%7%11%i12%6%6%11%8%7%-8%10%8%9%qtIMPROVEMENTS
49242134513341393418310-17238-2911848Low quality of5%8%zt3%3%5%3%6%zq10%5%4%2%7%zi9%h3%-6%5%4%-5%6%4%5%qtservices/treatment/
care
2914124241216122-41025211107-194528Poor quality care of3%5%zt2%4%3%3%3%9%3%-3%4%5%2%4%4%2%3%-3%2%3%3%tthe elderly
2210111201110-13163141885-114621Poor standards of2%3%2%1%2%2%2%-2%2%4%1%3%1%2%3%2%2%-2%2%3%2%cleanliness/superbugs/
MRSA
-----------------------Access to services----------------------------------------------Bad press/the media-----------------------
Public Perceptions of the NHS and Social CareFINAL PUBLIC
Table 64Q11. Overall, what do you see as the biggest problems facing the NHS? What else?
Base : All respondents
Respondent type : General public aged 16+ Fieldwork dates : 14th November - 9th December 2011Source : Ipsos MORI (JN10-039262-01)Proportions/Means: Columns Tested (5% risk level) - z/a/b/c/d - z/e/f/g - z/h/i/j/k - z/l/m/n/o - z/p/q - z/r/s - z/t/u - z/vOverlap formulae used. * small base; ** very small base (under 30) ineligible for sig testing

People aretreated with
Unwtddignity andtotalrespectNHS useHospital useEthnicityNHS/social care staffHousehold TypeHome Ownership
NotAdultshospitalHospitalInformalSocialwith
Non NHS/A&E/A&EsocialcareKnow NHSNHSdependentNon-Owner -PrivateSocialWtd.DisagreeAgreeuserNHS useruseruserMixedWhiteAsianBlackcarerworkerstaffstaffchildrenpensionerPensionerOtheroccupierrenterrenterTotal
(v)(u)(t)(s)(r)(q)(p)(o)(n)(m)(l)(k)(j)(i)(h)(g)(f)(e)(d)(c)(b)(a)(z)1001304652104*89746853311**74778*15925038*29252*30547522110**6401781731001Weighted Total
-----------------------Being supported through-----------------------taxation11--11--1-------1--1--1Cancellation of**--**--*-------*--*--*appointments/operations-----------------------Culture change/diversity-----------------------716165315-12-4-332-2327Cutbacks1%*1%1%1%1%1%10%1%-*1%-1%-1%1%1%-*1%1%1%c
-----------------------Doctors/consultants-----------------------spending too much time
on private practice11--11--1-------1--1--1Employment of overseas**--**--*-------*--*--*doctors/nursing staff-----------------------Enable patients to see a-----------------------doctor 24-7/out-of-hours
service514-532-4--2-2123--4-15Expectations/demands**1%-1%1%*-1%--1%-1%2%1%1%--1%-**from patients/public413-431-1211-3-3-1-22-4GP appointment system/***-*1%*-*3%zn1%*-1%-1%f-*-*1%-*nlong wait to get an
appointment-----------------------Health risks due to-----------------------uniforms being worn
outside hospital3-3-312-3--2-2--3-12--3High cost of drugs/*-*-***-*--1%-1%--1%-8%*--*equipment/availability-----------------------Improve hospital-----------------------appointment system/fewer
cancellations-----------------------Lack of aftercare-----------------------66--624-5-1311-141-2226Lack of communication1%2%zt--1%*1%-1%-1%1%3%*-*1%1%-*1%1%1%between departments211-211-1-12-21-11-2--2Lack of focus on the***-***-*-1%1%-1%2%z-**-*--*patient2-2-211-2--------2-2--2Lack of government*-*-***-*--------1%z-*--*support/backing-----------------------Lack of information-----------------------312-312-3--1-2--21-2-13Lack of vision/***-***-*--*-1%--**-*-**direction/planning
Public Perceptions of the NHS and Social CareFINAL PUBLIC
Table 64Q11. Overall, what do you see as the biggest problems facing the NHS? What else?
Base : All respondents
Respondent type : General public aged 16+ Fieldwork dates : 14th November - 9th December 2011Source : Ipsos MORI (JN10-039262-01)Proportions/Means: Columns Tested (5% risk level) - z/a/b/c/d - z/e/f/g - z/h/i/j/k - z/l/m/n/o - z/p/q - z/r/s - z/t/u - z/vOverlap formulae used. * small base; ** very small base (under 30) ineligible for sig testing

People aretreated with
Unwtddignity andtotalrespectNHS useHospital useEthnicityNHS/social care staffHousehold TypeHome Ownership
NotAdultshospitalHospitalInformalSocialwith
Non NHS/A&E/A&EsocialcareKnow NHSNHSdependentNon-Owner -PrivateSocialWtd.DisagreeAgreeuserNHS useruseruserMixedWhiteAsianBlackcarerworkerstaffstaffchildrenpensionerPensionerOtheroccupierrenterrenterTotal
(v)(u)(t)(s)(r)(q)(p)(o)(n)(m)(l)(k)(j)(i)(h)(g)(f)(e)(d)(c)(b)(a)(z)1001304652104*89746853311**74778*15925038*29252*30547522110**6401781731001Weighted Total
312-3-3-3--1---111-21-3Language problems/***-*-*-*--*---***-*1%-*foreign staff-----------------------Litigation----------------------------------------------Low staff morale-----------------------2-21111-2--1---11--2--2Management/too*-*1%***-*--*---**--*--*rinefficient6331524-5-15-41132-6--6Misuse of funds/money1%1%*1%1%*1%-1%-1%2%z-2%z2%*1%1%-1%--1%not going to the right
places1-1-1-1-1--1----1--1--1Mixed wards*-*-*-*-*--*----*--*--*1-1-11--1-------1--1--1Need new/updated*-*-**--*-------*--*--*equipment/technology-----------------------NHS is run by people-----------------------with little/no
experience321-321-3--1-1112--2-13Not being able to see/*1%*-***-*--*-*2%**--*-1%*spend too much time with
a GP/the same GP twice-----------------------Opening times of GP/-----------------------doctor's surgery-----------------------Overpaid management/GPs-----------------------211-21111----2-2---2--2Patients having to pay/***-***10%*----1%-1%---*--*pay for prescriptions/
general costs624-633-5-12-3--43-4116Poor administration/1%1%1%-1%1%1%-1%-1%1%-1%--1%1%-1%1%1%1%organisation/lost
records1-1-1-1-1-------1---1-1Poor/expensive hospital*-*-*-*-*-------*---1%-*parking-----------------------Poor food/catering----------------------------------------------Poor GP services/-----------------------facilities-----------------------Poor IT systems-----------------------1-1-1-1--1-1-1-1---1--1Poor/lack of A&E*-*-*-*--1%zn-*-*-*---*--*services
Public Perceptions of the NHS and Social CareFINAL PUBLIC
Table 64Q11. Overall, what do you see as the biggest problems facing the NHS? What else?
Base : All respondents
Respondent type : General public aged 16+ Fieldwork dates : 14th November - 9th December 2011Source : Ipsos MORI (JN10-039262-01)Proportions/Means: Columns Tested (5% risk level) - z/a/b/c/d - z/e/f/g - z/h/i/j/k - z/l/m/n/o - z/p/q - z/r/s - z/t/u - z/vOverlap formulae used. * small base; ** very small base (under 30) ineligible for sig testing

People aretreated with
Unwtddignity andtotalrespectNHS useHospital useEthnicityNHS/social care staffHousehold TypeHome Ownership
NotAdultshospitalHospitalInformalSocialwith
Non NHS/A&E/A&EsocialcareKnow NHSNHSdependentNon-Owner -PrivateSocialWtd.DisagreeAgreeuserNHS useruseruserMixedWhiteAsianBlackcarerworkerstaffstaffchildrenpensionerPensionerOtheroccupierrenterrenterTotal
(v)(u)(t)(s)(r)(q)(p)(o)(n)(m)(l)(k)(j)(i)(h)(g)(f)(e)(d)(c)(b)(a)(z)1001304652104*89746853311**74778*15925038*29252*30547522110**6401781731001Weighted Total
-----------------------Poor/slow response time-----------------------of ambulances321-3-3-3------111-21-3Postcode lottery*1%*-*-1%-*------***-**-*-----------------------Public opinions/-----------------------perception/lack of
public confidence-----------------------Reduce pay of-----------------------underperforming staff11-1-1--1-------1--1--1Rude/arrogant attitude**-1%r-*--*-------*--*--*of NHS staff-----------------------Security-----------------------3121212-3--1-1-1-2-2-13Should bring back***1%***-*--*-*-*-1%f-*-**matrons-----------------------Too much admin/reduce-----------------------amount spent on admin-----------------------Too much centralisation-----------------------
10171928-10--4141172-8-210Too many people using1%*1%1%1%*1%-1%--2%2%1%2%*1%1%-1%-1%1%who are not entitled/
have not paid N.I1-1-1-1-1--------1-1--1Too unwieldy/too large*-*-*-*-*--------*-*--*to manage1-1-1-1-1----1-1---1--1Use of sub-contractors*-*-*-*-*----*-*---*--*rather than permanent
staff106411055-101-311-731-91111Other1%2%1%1%1%1%1%-1%1%-1%3%*-2%1%*-1%1%1%1%
5774814434018-4110611112-222214327141357Don't know6%2%7%zu14%zr5%8%zp3%-5%13%zln4%4%3%4%-7%5%6%30%4%8%8%6%cpru
1741211689-7731-1-485-103417None of these/No answer2%1%2%1%2%2%2%-1%10%zln2%*-*-1%2%2%-2%2%3%2%ikn
532-514-5--1-1--51-41-5Not stated*1%*-1%*1%-1%--*-*--1%*-1%1%-1%
1.801.92zt1.741.351.85zs1.671.90zq1.301.811.621.801.802.001.812.21zik1.841.811.701.431.731.901.95c1.79cqsMean number of mentions
Public Perceptions of the NHS and Social CareFINAL PUBLIC
Table 64Q11. Overall, what do you see as the biggest problems facing the NHS? What else?
Base : All respondents
Respondent type : General public aged 16+ Fieldwork dates : 14th November - 9th December 2011Source : Ipsos MORI (JN10-039262-01)Proportions/Means: Columns Tested (5% risk level) - z/a/b/c/d - z/e/f/g - z/h/i/j/k - z/l/m/n/o - z/p/q - z/r/s - z/t/u - z/vOverlap formulae used. * small base; ** very small base (under 30) ineligible for sig testing

UnwtdtotalFuture of NHSSatisfaction with NHSGOR
DisYorkshire &WestEastWtd.WorseSameBettersatisfiedSatisfiedHumbersideMidlandsSouth-WestSouth-EastNorth-WestNorth-EastLondonEasternMidlandsTotal
(o)(n)(m)(l)(k)(j)(i)(h)(g)(f)(e)(d)(c)(b)(a)(z)1001328298343168703909910715413955143126881001Unweighted Total1001327302340168701100*106*10216213651*14810986*1001Weighted Total
158564257351111291518265501114160ACCESS TO TREATMENT/16%17%14%17%21%16%12%9%14%11%19%bh9%34%zabdefghi10%16%16%hWAITING TIME
158564257351111291518265501114160Long waiting lists/16%17%14%17%21%16%12%9%14%11%19%bh9%34%zabdefghi10%16%16%htimes
32105161315251411161132CHOICE3%3%2%5%m8%zj2%2%4%1%3%1%2%11%zabdefgi1%1%3%j
1752979-2-21-11-117Not enough patient2%2%1%3%4%zj1%-2%-1%1%-8%zabdefgi-1%2%choice about care/
treatment
22831111824141181-22Not enough patient2%3%1%3%6%zj1%2%3%1%3%1%2%5%zae1%-2%jsay/involvement in
decisions abouthealthcare services
106323534148010614208319159104EXTERNAL FACTORS11%10%12%10%8%11%10%6%14%e12%6%5%13%e14%eh11%10%e
1-1--1------1--1Bird flu*-*--*------1%--*1-1--1------1--1Swine flu*-*--*------1%--*
36121011526-1453297334Foreigners/immigrants4%4%3%3%3%4%-1%4%i3%2%4%6%hi6%zhi3%3%3--3-3------3--3Flu pandemic*--1%-*------2%z--*
561517194443471131712553Overstretched/aging6%5%6%6%3%6%z3%4%7%7%2%2%5%11%zdehi6%5%population
12832475--21-5--13Public health problems1%2%1%1%3%1%5%zabegh--1%1%-3%zb--1%(smoking, obesity,
sexual health, etc)
162683102131214-216Trivial use/abuse2%1%2%2%n2%1%2%1%3%1%2%2%3%-3%2%n
275946710468166224219403414382934273MANAGEMENT/ BUREAUCRACY27%29%22%30%m40%zj24%22%40%zbcefgi19%25%25%28%25%26%40%zbcefgi27%gjm
162544557449415251529197151421159Bureaucracy/top heavy16%17%15%17%26%zj13%15%23%zbc14%18%14%14%10%13%25%zbce16%cjmanagement
6519152816407124733911965Political influence/6%6%5%8%10%6%7%12%zefg4%5%2%6%6%10%e10%e6%egovernment targets
58237258414924123155457Privatisation6%7%m2%7%m5%6%4%8%fg2%3%9%fg6%10%zfg5%4%6%m
27126981325115264227Problems prioritising3%4%2%3%5%j2%2%4%f1%1%4%4%4%f3%2%3%jtreatment/patient
groups
Public Perceptions of the NHS and Social CareFINAL PUBLIC
Table 65Q11. Overall, what do you see as the biggest problems facing the NHS? What else?
Base : All respondents
Respondent type : General public aged 16+ Fieldwork dates : 14th November - 9th December 2011Source : Ipsos MORI (JN10-039262-01)Proportions/Means: Columns Tested (5% risk level) - z/a/b/c/d/e/f/g/h/i - z/j/k - z/l/m/n - z/oOverlap formulae used. * small base

UnwtdtotalFuture of NHSSatisfaction with NHSGOR
DisYorkshire &WestEastWtd.WorseSameBettersatisfiedSatisfiedHumbersideMidlandsSouth-WestSouth-EastNorth-WestNorth-EastLondonEasternMidlandsTotal
(o)(n)(m)(l)(k)(j)(i)(h)(g)(f)(e)(d)(c)(b)(a)(z)1001327302340168701100*106*10216213651*14810986*1001Weighted Total
34961972018-49-63435Big changes to3%3%2%6%zm4%3%1%7%zgi-2%6%zg-4%g3%4%g3%services/ NHS reforms
6172161692201074246178731037030936348620RESOURCES/INVESTMENT62%66%m56%65%m64%60%61%74%zabe72%zabe64%e51%59%63%57%56%62%em
39313411113954274375251713821414835393Lack of resources/39%41%37%41%32%39%37%49%zce50%zce44%ce28%40%28%44%ce41%ce39%cekinvestment
562681918334152432159255Hospital closures/lack6%8%zm3%6%11%zj5%4%14%zaefgi2%2%2%4%10%zaefg8%aefg2%6%mof hospitals/
facilities
1917738724312422282326254361514192Not enough doctors/19%23%zm13%21%m26%zj18%22%d26%bd23%d16%18%7%25%bd13%16%19%dmnurses/understaffed
206283141-152351220Poor pay for NHS staff2%2%1%2%2%2%1%-1%3%1%6%h3%1%2%2%
522114151628754109371651Poor quality staff5%6%5%5%10%zj4%7%b5%4%6%b7%b6%b5%b1%6%b5%bjeducation/training
85272529185941289122198783Overworked staff8%8%8%8%11%8%4%12%8%5%9%5%13%zfi8%8%8%
309121062233252213--31Shortage of beds3%3%4%3%4%3%3%3%2%3%2%4%b9%zabefg--3%b
216671192-410113--22Shortage of NHS2%2%2%2%1%3%2%-4%bh6%zabeh1%2%2%--2%dentists
361771262616363-103437Staff retention4%5%m2%4%4%4%1%6%3%4%2%-7%zi3%5%4%
892924332343109131297165587TREATMENT QUALITY/9%9%8%10%14%zj6%10%9%13%b7%7%14%b11%4%6%9%jIMPROVEMENTS
49181317182265864383448Low quality of5%5%4%5%11%zj3%6%5%7%4%3%6%5%3%4%5%jservices/treatment/
care
29871271345442243128Poor quality care of3%3%2%3%4%2%4%5%4%3%1%4%3%2%1%3%jthe elderly
229663132-333451-21Poor standards of2%3%2%2%2%2%2%-3%2%2%9%zabefh3%1%-2%cleanliness/superbugs/
MRSA
----------------Access to services--------------------------------Bad press/the media--------------------------------Being supported through----------------taxation1-1--1---1-----1Cancellation of*-*--*---1%-----*appointments/operations----------------Culture change/diversity----------------
Public Perceptions of the NHS and Social CareFINAL PUBLIC
Table 65Q11. Overall, what do you see as the biggest problems facing the NHS? What else?
Base : All respondents
Respondent type : General public aged 16+ Fieldwork dates : 14th November - 9th December 2011Source : Ipsos MORI (JN10-039262-01)Proportions/Means: Columns Tested (5% risk level) - z/a/b/c/d/e/f/g/h/i - z/j/k - z/l/m/n - z/oOverlap formulae used. * small base

UnwtdtotalFuture of NHSSatisfaction with NHSGOR
DisYorkshire &WestEastWtd.WorseSameBettersatisfiedSatisfiedHumbersideMidlandsSouth-WestSouth-EastNorth-WestNorth-EastLondonEasternMidlandsTotal
(o)(n)(m)(l)(k)(j)(i)(h)(g)(f)(e)(d)(c)(b)(a)(z)1001327302340168701100*106*10216213651*14810986*1001Weighted Total
7313153-1-2---27Cutbacks1%1%*1%*1%3%zf-1%-1%---3%f1%----------------Doctors/consultants----------------spending too much time
on private practice1--1-1--------11Employment of overseas*--*-*--------1%z*doctors/nursing staff----------------Enable patients to see a----------------doctor 24-7/out-of-hours
service522114---11--215Expectations/demands*1%1%*1%1%---1%1%--2%1%*from patients/public4-2213---1--21-4GP appointment system/*-1%1%1%*---1%--1%1%-*long wait to get an
appointment----------------Health risks due to----------------uniforms being worn
outside hospital3111-3---1---113High cost of drugs/****-*---1%---1%1%*equipment/availability----------------Improve hospital----------------appointment system/fewer
cancellations----------------Lack of aftercare----------------6213411--21--2-6Lack of communication1%1%*1%2%zj*1%--1%1%--1%-1%jbetween departments21-1-2--2------2Lack of focus on the**-*-*--2%z------*patient21-1-2-------2-2Lack of government**-*-*-------1%z-*support/backing----------------Lack of information----------------311111--12-----3Lack of vision/******--1%1%z-----*direction/planning3-12-1--1---11-3Language problems/*-*1%-*--1%---1%1%-*foreign staff----------------Litigation--------------------------------Low staff morale----------------2-11-2--1----1-2Management/too*-**-*--1%----1%-*inefficient
Public Perceptions of the NHS and Social CareFINAL PUBLIC
Table 65Q11. Overall, what do you see as the biggest problems facing the NHS? What else?
Base : All respondents
Respondent type : General public aged 16+ Fieldwork dates : 14th November - 9th December 2011Source : Ipsos MORI (JN10-039262-01)Proportions/Means: Columns Tested (5% risk level) - z/a/b/c/d/e/f/g/h/i - z/j/k - z/l/m/n - z/oOverlap formulae used. * small base

UnwtdtotalFuture of NHSSatisfaction with NHSGOR
DisYorkshire &WestEastWtd.WorseSameBettersatisfiedSatisfiedHumbersideMidlandsSouth-WestSouth-EastNorth-WestNorth-EastLondonEasternMidlandsTotal
(o)(n)(m)(l)(k)(j)(i)(h)(g)(f)(e)(d)(c)(b)(a)(z)1001327302340168701100*106*10216213651*14810986*1001Weighted Total
64-215---3-11-16Misuse of funds/money1%1%-1%*1%---2%z-2%1%-1%1%not going to the right
places1--1--------1--1Mixed wards*--*--------1%--*1-1-----------11Need new/updated*-*-----------1%z*equipment/technology----------------NHS is run by people----------------with little/no
experience311121---3-----3Not being able to see/****1%j*---2%z-----*spend too much time with
a GP/the same GP twice----------------Opening times of GP/----------------doctor's surgery----------------Overpaid management/GPs----------------211--1--2------2Patients having to pay/***--*--2%z------*pay for prescriptions/
general costs6123331-2-1-11-6Poor administration/1%*1%1%2%zj*1%-2%-1%-1%1%-1%organisation/lost
records11---1--1------1Poor/expensive hospital**---*--1%z------*parking----------------Poor food/catering--------------------------------Poor GP services/----------------facilities----------------Poor IT systems----------------1-1--1-------1-1Poor/lack of A&E*-*--*-------1%z-*services----------------Poor/slow response time----------------of ambulances3-2111---1--11-3Postcode lottery*-1%*1%*---1%--1%1%-*----------------Public opinions/----------------perception/lack of
public confidence----------------Reduce pay of----------------underperforming staff1-1-1--------1-1Rude/arrogant attitude*-*-*--------1%-*of NHS staff
Public Perceptions of the NHS and Social CareFINAL PUBLIC
Table 65Q11. Overall, what do you see as the biggest problems facing the NHS? What else?
Base : All respondents
Respondent type : General public aged 16+ Fieldwork dates : 14th November - 9th December 2011Source : Ipsos MORI (JN10-039262-01)Proportions/Means: Columns Tested (5% risk level) - z/a/b/c/d/e/f/g/h/i - z/j/k - z/l/m/n - z/oOverlap formulae used. * small base

UnwtdtotalFuture of NHSSatisfaction with NHSGOR
DisYorkshire &WestEastWtd.WorseSameBettersatisfiedSatisfiedHumbersideMidlandsSouth-WestSouth-EastNorth-WestNorth-EastLondonEasternMidlandsTotal
(o)(n)(m)(l)(k)(j)(i)(h)(g)(f)(e)(d)(c)(b)(a)(z)1001327302340168701100*106*10216213651*14810986*1001Weighted Total
----------------Security----------------3111-2--1-11---3Should bring back****-*--1%-1%2%---*matrons----------------Too much admin/reduce----------------amount spent on admin----------------Too much centralisation----------------
1036-28---33--3110Too many people using1%1%2%zl-1%1%---2%2%--2%1%1%who are not entitled/
have not paid N.I11------1------1Too unwieldy/too large**------1%z------*to manage1-1-1---1------1Use of sub-contractors*-*-1%---1%z------*rather than permanent
staff1023446---8111--11Other1%1%1%1%3%1%---5%zabcghi1%2%1%--1%
5714221244523611124127157Don't know6%4%7%l4%2%6%k2%3%6%7%9%ai7%8%a7%1%6%kl
173104-172--16142117None of these/No answer2%1%3%zn1%-2%zk2%--1%5%zfgh2%3%2%1%2%513114--11--12-5Not stated**1%*1%1%--1%1%--1%2%-1%
1.801.92zm1.521.95zm2.27zj1.671.581.98dei1.79e1.731.521.572.24zbdefgi1.691.86ei1.79ejmMean number of mentions
Public Perceptions of the NHS and Social CareFINAL PUBLIC
Table 65Q11. Overall, what do you see as the biggest problems facing the NHS? What else?
Base : All respondents
Respondent type : General public aged 16+ Fieldwork dates : 14th November - 9th December 2011Source : Ipsos MORI (JN10-039262-01)Proportions/Means: Columns Tested (5% risk level) - z/a/b/c/d/e/f/g/h/i - z/j/k - z/l/m/n - z/oOverlap formulae used. * small base

UnwtdPrivate healthSatisfaction withImpact of NHS reformsGovernment has righttotalinsurancesocial careon patientsNHS policyNHS use in last year
SocialNHSDissatisficareWalk InChoicesPharmacistWtd.
NoYesedSatisfiedWorseBetterDisagreeAgreeservicesClinicwebsite/ChemistNHS DirectA&EOutpatientInpatientGPTotal(r)(q)(p)(o)(n)(m)(l)(k)(j)(i)(h)(g)(f)(e)(d)(c)(b)(a)(z)
10018151704424938220040326945182553001772253931967801001Unweighted Total100181117544*24437920139327642*18856*3011832303761927731001Weighted Total
1581332412245636555633344318446931126160ACCESS TO TREATMENT/16%16%14%26%n10%15%18%14%20%zk6%18%e8%14%10%19%egi18%egi16%e16%e16%enWAITING TIME
1581332412245636555633344318446931126160Long waiting lists/16%16%14%26%n10%15%18%14%20%zk6%18%e8%14%10%19%egi18%egi16%e16%e16%entimes
322662714719723111481332632CHOICE3%3%4%5%3%4%4%5%z3%4%2%1%4%2%3%3%1%3%3%
1713412948513-5-4611517Not enough patient2%2%2%3%1%2%2%2%2%2%e2%-2%-2%2%*2%2%choice about care/
treatment
2217416103153211946821822Not enough patient2%2%3%2%3%3%1%4%zj1%4%1%1%3%h2%3%2%1%2%2%say/involvement in
decisions abouthealthcare services
1068519620262540293132281825311481104EXTERNAL FACTORS11%11%11%14%8%7%13%m10%10%6%7%3%9%10%11%8%7%10%10%m
11----1----------11Bird flu**----1%----------**11----1----------11Swine flu**----1%----------**
3629435107167151106101332934Foreigners/immigrants4%4%2%7%2%3%4%4%3%2%2%2%3%3%4%3%2%4%3%33---2111--------33Flu pandemic**---1%***--------**
564112111151218162511611151673953Overstretched/aging6%5%7%2%4%4%6%5%6%5%3%2%5%6%6%4%4%5%5%population
12112335584-4-53434913Public health problems1%1%1%7%zn1%1%2%2%2%-2%-2%2%2%1%2%1%1%(smoking, obesity,
sexual health, etc)
16142234275---522511516Trivial use/abuse2%2%1%5%1%1%1%2%2%---2%1%1%1%1%2%2%
275219501763138411495311451890466211447223273MANAGEMENT/ BUREAUCRACY27%27%29%38%26%36%zl21%38%zj19%27%24%32%30%25%27%30%25%29%z27%jl
16212136103566307835730135724297228133159Bureaucracy/top heavy16%15%20%24%14%17%15%20%zj13%16%16%23%d19%de13%13%19%zde15%17%zd16%management
655410315396408410520131123105265Political influence/6%7%6%7%6%10%zl3%10%zj3%9%5%9%6%7%5%6%5%7%6%jlgovernment targets
585252133264093842291222104657Privatisation6%6%3%5%5%8%zl3%10%zj3%7%4%7%7%5%5%6%5%6%6%j
272341618318515289101042327Problems prioritising3%3%2%2%2%5%zl2%5%z2%2%2%3%3%5%4%3%2%3%3%treatment/patient
groups
Public Perceptions of the NHS and Social CareFINAL PUBLIC
Table 66Q11. Overall, what do you see as the biggest problems facing the NHS? What else?
Base : All respondents
Respondent type : General public aged 16+ Fieldwork dates : 14th November - 9th December 2011Source : Ipsos MORI (JN10-039262-01)Proportions/Means: Columns Tested (5% risk level) - z/a/b/c/d/e/f/g/h/i - z/j/k - z/l/m - z/n/o - z/p/q - z/rOverlap formulae used. * small base

UnwtdPrivate healthSatisfaction withImpact of NHS reformsGovernment has righttotalinsurancesocial careon patientsNHS policyNHS use in last year
SocialNHSDissatisficareWalk InChoicesPharmacistWtd.
NoYesedSatisfiedWorseBetterDisagreeAgreeservicesClinicwebsite/ChemistNHS DirectA&EOutpatientInpatientGPTotal(r)(q)(p)(o)(n)(m)(l)(k)(j)(i)(h)(g)(f)(e)(d)(c)(b)(a)(z)
100181117544*24437920139327642*18856*3011832303761927731001Weighted Total3431428242241142147131263135Big changes to3%4%2%5%3%6%zl1%6%zj*2%2%3%5%4%6%3%3%4%3%jlservices/ NHS reforms
617501110321572571062761363212741197133150241124489620RESOURCES/INVESTMENT62%62%63%72%64%68%zl53%70%zj49%76%z68%72%65%72%zabcdf65%64%64%63%62%jl
3933078221941786017979268733121959215381307393Lack of resources/39%38%47%zq47%38%47%zl30%46%zj29%61%zabcdf46%za59%zabcdf40%52%zabcdf40%41%42%40%39%jlinvestment
565063163110339210523121821154455Hospital closures/lack6%6%3%7%7%8%z5%8%zj3%5%5%9%8%7%8%6%8%6%6%jof hospitals/
facilities
19115433135680319541738127440598047160192Not enough doctors/19%19%19%30%23%21%16%24%zj15%17%20%22%25%z22%26%za21%24%z21%z19%jnurses/understaffed
20182-772122-51655531420Poor pay for NHS staff2%2%1%-3%2%1%3%zj1%-2%1%2%3%2%1%2%2%2%
524464181592510420519141528184251Poor quality staff5%5%4%8%7%4%5%6%4%8%11%zaf10%6%8%7%8%za9%za5%5%education/training
85711032632163720114328112736196583Overworked staff8%9%6%6%11%8%8%9%7%3%7%5%9%6%12%zae10%10%8%8%
3027438111013715-8491052831Shortage of beds3%3%3%7%3%3%5%3%3%2%3%-3%2%4%3%3%4%3%
21202-34385-4-533731722Shortage of NHS2%2%1%-1%1%2%2%2%-2%-2%2%1%2%2%2%2%mdentists
3633328223166151837933137Staff retention4%4%2%4%3%6%zl1%4%2%2%3%1%3%2%3%2%2%4%c4%
89741392535174312717432192639167187TREATMENT QUALITY/9%9%7%21%z10%9%9%11%j5%17%9%7%11%10%11%11%8%9%9%jIMPROVEMENTS
4941721922829861331891726114148Low quality of5%5%4%4%8%z6%4%7%zj3%14%zabcef7%5%6%5%7%7%z6%5%5%services/treatment/
care
292357711311322112871232128Poor quality care of3%3%3%15%zn3%3%2%3%1%5%1%2%4%h5%bh3%3%2%3%3%jthe elderly
2219214969214-567631821Poor standards of2%2%1%2%2%2%3%2%1%2%2%-2%3%3%2%2%2%2%cleanliness/superbugs/
MRSA
-------------------Access to services--------------------------------------Bad press/the media--------------------------------------Being supported through-------------------taxation11-----1---------11Cancellation of**-----*---------**appointments/operations-------------------Culture change/diversity-------------------
Public Perceptions of the NHS and Social CareFINAL PUBLIC
Table 66Q11. Overall, what do you see as the biggest problems facing the NHS? What else?
Base : All respondents
Respondent type : General public aged 16+ Fieldwork dates : 14th November - 9th December 2011Source : Ipsos MORI (JN10-039262-01)Proportions/Means: Columns Tested (5% risk level) - z/a/b/c/d/e/f/g/h/i - z/j/k - z/l/m - z/n/o - z/p/q - z/rOverlap formulae used. * small base

UnwtdPrivate healthSatisfaction withImpact of NHS reformsGovernment has righttotalinsurancesocial careon patientsNHS policyNHS use in last year
SocialNHSDissatisficareWalk InChoicesPharmacistWtd.
NoYesedSatisfiedWorseBetterDisagreeAgreeservicesClinicwebsite/ChemistNHS DirectA&EOutpatientInpatientGPTotal(r)(q)(p)(o)(n)(m)(l)(k)(j)(i)(h)(g)(f)(e)(d)(c)(b)(a)(z)100181117544*24437920139327642*18856*3011832303761927731001Weighted Total
761-2413311-2-13267Cutbacks1%1%1%-1%1%*1%1%2%*-1%-*1%1%1%1%-------------------Doctors/consultants-------------------spending too much time
on private practice11---1-----------11Employment of overseas**---*-----------**doctors/nursing staff-------------------Enable patients to see a-------------------doctor 24-7/out-of-hours
service541-22-12-211212155Expectations/demands**1%-1%*-*1%-1%2%*1%*1%1%1%*from patients/public421-1112---121--144GP appointment system/**1%-***1%---2%cd1%1%--*1%*long wait to get an
appointment-------------------Health risks due to-------------------uniforms being worn
outside hospital33--2-121---1-12233High cost of drugs/**--1%-1%**---*-**1%**equipment/availability-------------------Improve hospital-------------------appointment system/fewer
cancellations-------------------Lack of aftercare-------------------65111-33213-4424466Lack of communication1%1%*3%*-2%m1%1%2%1%-1%2%za1%1%2%z1%1%between departments22-1-1-1----11-1-12Lack of focus on the**-2%zn-*-*----**-*-**patient22--12-1-------1122Lack of government**--**-*-------****support/backing-------------------Lack of information-------------------33--1-------11-2133Lack of vision/**--*-------**-1%1%**direction/planning33--2-22---1--13133Language problems/**--1%-1%*---1%f--*1%***foreign staff-------------------Litigation--------------------------------------Low staff morale-------------------22--1-11----1--1112Management/too**--*-1%*----*--*1%**inefficient
Public Perceptions of the NHS and Social CareFINAL PUBLIC
Table 66Q11. Overall, what do you see as the biggest problems facing the NHS? What else?
Base : All respondents
Respondent type : General public aged 16+ Fieldwork dates : 14th November - 9th December 2011Source : Ipsos MORI (JN10-039262-01)Proportions/Means: Columns Tested (5% risk level) - z/a/b/c/d/e/f/g/h/i - z/j/k - z/l/m - z/n/o - z/p/q - z/rOverlap formulae used. * small base

UnwtdPrivate healthSatisfaction withImpact of NHS reformsGovernment has righttotalinsurancesocial careon patientsNHS policyNHS use in last year
SocialNHSDissatisficareWalk InChoicesPharmacistWtd.
NoYesedSatisfiedWorseBetterDisagreeAgreeservicesClinicwebsite/ChemistNHS DirectA&EOutpatientInpatientGPTotal(r)(q)(p)(o)(n)(m)(l)(k)(j)(i)(h)(g)(f)(e)(d)(c)(b)(a)(z)100181117544*24437920139327642*18856*3011832303761927731001Weighted Total
633122421-2-2223156Misuse of funds/money1%*2%zq3%1%*2%z1%*-1%-1%1%1%1%*1%1%qnot going to the right
places11-----1---1---1-11Mixed wards**-----*---1%zaf---*-**1-1---11-----1---11Need new/updated*-1%q---1%*-----1%---**equipment/technology-------------------NHS is run by people-------------------with little/no
experience3-3112-21-211--1-33Not being able to see/*-2%zq2%*1%-1%*-1%1%*--*-**spend too much time with
a GP/the same GP twice-------------------Opening times of GP/-------------------doctor's surgery-------------------Overpaid management/GPs-------------------22--1--2------1--22Patients having to pay/**--*--1%------*--**pay for prescriptions/
general costs661-33-3--254313156Poor administration/1%1%*-1%1%-1%--1%8%zabcdefh1%1%1%1%1%1%1%organisation/lost
records11----1-1------1--1Poor/expensive hospital**----*-*------*--*parking-------------------Poor food/catering--------------------------------------Poor GP services/-------------------facilities-------------------Poor IT systems-------------------1-1---1-------1--11Poor/lack of A&E*-*---*-------*--**services-------------------Poor/slow response time-------------------of ambulances321--2-2--1-1112-33Postcode lottery***--1%-1%--1%-*1%1%*-**-------------------Public opinions/-------------------perception/lack of
public confidence-------------------Reduce pay of-------------------underperforming staff11---1-1----1-----1Rude/arrogant attitude**---*-*----*-----*of NHS staff
Public Perceptions of the NHS and Social CareFINAL PUBLIC
Table 66Q11. Overall, what do you see as the biggest problems facing the NHS? What else?
Base : All respondents
Respondent type : General public aged 16+ Fieldwork dates : 14th November - 9th December 2011Source : Ipsos MORI (JN10-039262-01)Proportions/Means: Columns Tested (5% risk level) - z/a/b/c/d/e/f/g/h/i - z/j/k - z/l/m - z/n/o - z/p/q - z/rOverlap formulae used. * small base

UnwtdPrivate healthSatisfaction withImpact of NHS reformsGovernment has righttotalinsurancesocial careon patientsNHS policyNHS use in last year
SocialNHSDissatisficareWalk InChoicesPharmacistWtd.
NoYesedSatisfiedWorseBetterDisagreeAgreeservicesClinicwebsite/ChemistNHS DirectA&EOutpatientInpatientGPTotal(r)(q)(p)(o)(n)(m)(l)(k)(j)(i)(h)(g)(f)(e)(d)(c)(b)(a)(z)
100181117544*24437920139327642*18856*3011832303761927731001Weighted Total-------------------Security-------------------33----111-1-2--2123Should bring back**----***-*-1%--****matrons-------------------Too much admin/reduce-------------------amount spent on admin-------------------Too much centralisation-------------------
108113421214-24454710Too many people using1%1%1%2%1%1%1%*1%2%2%-1%2%2%1%2%1%1%kwho are not entitled/
have not paid N.I11----1-1------1-11Too unwieldy/too large**----*-*------*-**to manage11----11-------1-11Use of sub-contractors**----**-------*-**rather than permanent
staff1083114151-424635-911Other1%1%2%3%*1%1%1%*-2%b4%zb1%3%zab1%1%-1%1%
57515-12722330171919583557Don't know6%6%3%-5%2%11%zm1%11%zk2%4%ce2%3%1%4%ce1%4%ce5%ce6%acefkmp
1715--327-12-2-3-2561317None of these/No answer2%2%--1%1%4%zm-4%zk-1%-1%-1%1%3%def2%2%km
532-211-2--11422-55Not stated**1%-1%*1%-1%--2%*2%zabcfh1%*-1%1%
1.801.811.762.50zn1.822.02zl1.562.19zj1.411.801.841.991.98z1.98z2.01z1.90z1.821.89z1.79jlMean number of mentions
Public Perceptions of the NHS and Social CareFINAL PUBLIC
Table 66Q11. Overall, what do you see as the biggest problems facing the NHS? What else?
Base : All respondents
Respondent type : General public aged 16+ Fieldwork dates : 14th November - 9th December 2011Source : Ipsos MORI (JN10-039262-01)Proportions/Means: Columns Tested (5% risk level) - z/a/b/c/d/e/f/g/h/i - z/j/k - z/l/m - z/n/o - z/p/q - z/rOverlap formulae used. * small base

UnwtdtotalWork StatusSocial GradeAgeGender
Full/part-Wtd.OtherUnemployedRetiredtimeDEC2C1AB65+55-6435-5425-3416-24FemaleMaleTotal
(p)(o)(n)(m)(l)(k)(j)(i)(h)(g)(f)(e)(d)(c)(b)(a)(z)1001162612705082472013062472201693311581235274741001Unweighted Total100115758*2355512392013122491981433501671435154861001Weighted Total16513554862628485643355415118177158Age-related illnesses/16%8%9%23%zlno16%o11%14%15%22%zijk22%zcd24%zcde15%cd9%8%16%16%16%cdkopeople living longer/old
age23233166711-3276771725Aids/HIV2%1%5%1%3%3%h4%h4%h-1%1%2%4%5%1%4%zb2%bh
20327163912351256959312773413398107205Alcohol abuse/drink-20%17%28%m17%22%22%j12%22%j24%j16%19%21%24%g23%19%22%20%gjrelated illnesses/
alcoholism/bingedrinking
36351208121381801257969521356049189176365Cancer36%32%34%34%39%34%40%40%h32%35%36%39%36%34%37%36%36%
12824427743123443025154426187256128Diabetes13%15%7%11%13%13%12%14%12%13%11%13%16%13%14%12%13%91116313212-51549Diabetes in children1%1%2%*1%1%*1%1%*1%e-3%ze1%1%1%1%
120201227604417382117154121265564120Drugs/abuse/misuse of12%13%21%zl12%11%19%zhij8%12%8%9%11%12%12%18%zg11%13%12%hdrugs/substances
182267471014729634239267725159883181Heart disease/attacks18%17%11%20%18%20%15%20%17%20%c18%22%zc15%10%19%17%18%c
5463163011101517121015106302454Lack of exercise/5%4%5%7%5%5%5%5%7%6%7%4%6%4%6%5%5%sedentary lifestyle
10015823562317362617133320175745102Unhealthy lifestyle10%9%13%10%10%10%8%11%11%9%9%10%12%12%11%9%10%7313612442252424711291712423375Mental health7%8%11%5%8%9%j3%8%j10%j4%7%8%g10%g8%8%7%8%gj
1642296-821177161016MRSA/cleanliness in2%3%3%1%2%3%j-3%j1%**2%4%zfg1%1%2%2%hospitals
343401667219567310510863541404243167175342Obesity/overeating34%25%27%29%40%zmo23%36%k34%k43%zik32%38%d40%zcdg25%30%32%36%34%dkmo
6110212391510251310429138333063Obesity in children6%6%3%5%7%6%5%8%5%5%3%8%f8%f6%6%6%6%f
81116224117172026161232165423880Poor diet/lack of8%7%10%9%8%7%8%6%10%8%9%9%c9%c3%8%8%8%cnutrition/eating habits/
junk food62113214-11--5167Bird flu1%1%2%*1%1%*1%-1%1%--4%zdeg*1%1%b
112128334221-365813Swine flu (pig flu)1%1%2%1%1%1%1%1%1%1%1%-2%e5%zefg1%2%1%e
2251315551122267781624Flu pandemic2%3%2%1%3%2%3%4%h1%1%1%2%4%5%zg2%3%2%h
164291030973928603822245335328284166Smoking/smoking related16%19%18%13%18%16%14%19%15%11%17%15%21%g23%g16%17%17%gmillnesses
Public Perceptions of the NHS and Social CareFINAL PUBLIC
Table 67Q12. Thinking generally, what are the biggest health problems facing people today? What else?
Base : All respondents
Respondent type : General public aged 16+ Fieldwork dates : 14th November - 9th December 2011Source : Ipsos MORI (JN10-039262-01)Proportions/Means: Columns Tested (5% risk level) - z/a/b - z/c/d/e/f/g - z/h/i/j/k - z/l/m/n/o - z/pOverlap formulae used. * small base

UnwtdtotalWork StatusSocial GradeAgeGender
Full/part-Wtd.OtherUnemployedRetiredtimeDEC2C1AB65+55-6435-5425-3416-24FemaleMaleTotal
(p)(o)(n)(m)(l)(k)(j)(i)(h)(g)(f)(e)(d)(c)(b)(a)(z)100115758*2355512392013122491981433501671435154861001Weighted Total1021771957231534281320431595447100Stress/pressure10%11%12%8%10%10%8%11%11%7%14%cg12%g9%7%10%10%10%g
438413181981151061845271643Stroke4%5%7%6%3%8%zhi4%3%2%5%4%5%3%3%5%3%4%h
5043132810158158141843252248Dementia5%3%5%5%5%4%7%i3%6%4%10%zcdeg5%2%2%5%5%5%i
516414268912201362074321749Other5%4%8%6%5%3%4%4%8%zik6%4%6%4%3%6%4%5%a
-----------------Access to treatment/-----------------specialist services/
treatment
11----1----1--1-1Allergies*1%----*----*--*-*-----------------Alzheimers disease-----------------5--3122-13-1--234Arthritis*--1%zl*1%1%-*2%z-*--*1%*51--41121-212-415Asthma*1%--1%**1%*-1%*1%-1%*1%-----------------Attitude of staff----------------------------------Back problems-----------------1---1---1--1---11Car accidents/*---*---*--*---**accidents caused by
bad driving
-----------------Dental care/-----------------children\222s dental
care
1---1---1--1---11Diseases from abroad/*---*---*--*---**foreign diseases
-----------------Getting appointments-----------------2-1-11-1---11-2-2Health & Hygiene*-2%zm-**-*---*1%-*-*1--1----11----1-1Immigrants using the*--*----**----*-*system/multicultural
issues
3-1111--2-21--123Lack of education/*-1%***--1%-1%*--***knowledge about health
issues
-----------------Liver diseases-----------------
Public Perceptions of the NHS and Social CareFINAL PUBLIC
Table 67Q12. Thinking generally, what are the biggest health problems facing people today? What else?
Base : All respondents
Respondent type : General public aged 16+ Fieldwork dates : 14th November - 9th December 2011Source : Ipsos MORI (JN10-039262-01)Proportions/Means: Columns Tested (5% risk level) - z/a/b - z/c/d/e/f/g - z/h/i/j/k - z/l/m/n/o - z/pOverlap formulae used. * small base

UnwtdtotalWork StatusSocial GradeAgeGender
Full/part-Wtd.OtherUnemployedRetiredtimeDEC2C1AB65+55-6435-5425-3416-24FemaleMaleTotal
(p)(o)(n)(m)(l)(k)(j)(i)(h)(g)(f)(e)(d)(c)(b)(a)(z)100115758*2355512392013122491981433501671435154861001Weighted Total
-----------------Overcrowding/-----------------overpopulation
-----------------Pollution/effects of-----------------pollution
-----------------Poor tolerance to-----------------illnesses/lack of
immunity to illnesses
41-21-1212-2--314Respiratory problems*1%-1%*-*1%*1%-1%--1%**52--3--14--212245Sexually transmitted*1%--1%--*2%z--1%1%2%*1%1%diseases/STD's
1--1---1--1---1-1TB*--*---*--1%---*-*1-1--1-----1--1-1Viruses/colds/flu*-2%zlm--*-----*--*-*-----------------Waiting lists----------------------------------Waiting time in-----------------hospitals
1--1--1---1---1-1Weather/cold weather*--*--*---1%---*-*
2424611546862103218523Other2%1%6%zlo3%2%2%2%2%3%3%1%3%2%1%3%za1%2%a
123225336-122436612No answer1%2%4%1%1%1%1%2%h-1%1%1%2%2%1%1%1%
72184203130151314194181714413172Don't know7%11%zl6%9%6%12%zhi7%4%6%10%ef3%5%10%ef10%f8%6%7%fil
13525528783424453326174429197660135Diabetes/Diabetes in13%16%8%12%14%14%12%14%13%13%12%13%17%13%15%12%14%children
134181132753223433726194128227362135Lack of exercise/13%11%18%14%14%13%12%14%15%13%14%12%16%15%14%13%14%sedentary/unhealthy
lifestyle359431771228617511211066551474744177181359Obesity/overeating/
36%27%29%30%41%zmo26%37%k36%k44%zik33%38%42%zcdg28%31%34%37%36%dkmoobesity in children
Public Perceptions of the NHS and Social CareFINAL PUBLIC
Table 67Q12. Thinking generally, what are the biggest health problems facing people today? What else?
Base : All respondents
Respondent type : General public aged 16+ Fieldwork dates : 14th November - 9th December 2011Source : Ipsos MORI (JN10-039262-01)Proportions/Means: Columns Tested (5% risk level) - z/a/b - z/c/d/e/f/g - z/h/i/j/k - z/l/m/n/o - z/pOverlap formulae used. * small base

People aretreated with
Unwtddignity andtotalrespectNHS useHospital useEthnicityNHS/social care staffHousehold TypeHome Ownership
NotAdultshospitalHospitalInformalSocialwith
Non NHS/A&E/A&EsocialcareKnow NHSNHSdependentNon-Owner -PrivateSocialWtd.DisagreeAgreeuserNHS useruseruserMixedWhiteAsianBlackcarerworkerstaffstaffchildrenpensionerPensionerOtheroccupierrenterrenterTotal
(v)(u)(t)(s)(r)(q)(p)(o)(n)(m)(l)(k)(j)(i)(h)(g)(f)(e)(d)(c)(b)(a)(z)100130864710090145854310750741612543628951291461249106491691731001Unweighted Total1001304652104*89746853311**74778*15925038*29252*30547522110**6401781731001Weighted Total165511021814072863118728507441437724931131824158Age-related illnesses/16%17%16%17%16%15%16%30%16%9%18%20%z18%15%27%zi12%15%22%zfg30%18%zb10%14%16%bgpeople living longer/old
age235196191411-135631446163-99725Aids/HIV2%2%3%6%zr2%3%2%-2%7%zn4%1%3%2%7%zik2%3%1%-1%5%zc4%c2%cnr
20364133201859211311601031505651471983621194538205Alcohol abuse/drink-20%21%20%19%21%20%21%9%21%13%20%20%13%22%26%23%e21%16%22%19%25%22%20%related illnesses/
alcoholism/bingedrinking
36311722833332159206228721559715109151101797722306568365Cancer36%39%35%32%37%34%39%21%38%zm27%34%39%39%37%30%36%38%35%19%36%37%39%36%
128309581215672184231931747123863281743023128Diabetes13%10%15%zu7%13%12%14%11%11%29%zln12%12%17%16%23%zk12%13%13%8%12%17%13%13%n
9534563-9--412-351-4239Diabetes in children1%2%1%4%zr1%1%1%-1%--1%3%1%-1%1%*-1%1%2%1%r
1203283511542781849242254144552222562239120Drugs/abuse/misuse of12%11%13%5%13%zs9%15%zq10%11%12%15%9%14%14%k8%15%11%10%23%9%12%23%zbc12%cqsdrugs/substances
182631109172701111137172555956957834111162639181Heart disease/attacks18%21%17%9%19%zs15%21%zq10%18%22%16%22%24%19%18%19%18%19%8%18%14%23%18%qs
5410414502331-4238921851426141377854Lack of exercise/5%3%6%4%6%5%6%-6%4%5%3%5%6%10%k4%6%6%8%6%4%5%5%usedentary lifestyle
10023757955249-7213152663593448201611722102Unhealthy lifestyle10%8%12%7%11%11%9%-10%16%10%11%15%12%18%11%10%9%11%10%10%13%10%7325504713145160311267191303510-38211675Mental health7%8%8%4%8%7%8%9%8%4%7%10%zi18%zhi6%2%10%e7%5%-6%12%zc10%8%ce
1678214610-14-32141592-82616MRSA/cleanliness in2%2%1%2%2%1%2%-2%-2%1%3%1%2%2%2%1%-1%1%4%zc2%hospitals
34311221333309153189228118378113114241011726822444947342Obesity/overeating34%37%33%32%34%33%35%19%38%zlm24%23%33%34%39%z45%33%36%31%19%38%zab28%27%34%ablm
611843855273615029112174242911135121563Obesity in children6%6%7%7%6%6%7%11%7%3%6%4%6%6%8%8%6%5%11%5%7%9%6%
812744278374316478194312204317-48171580Poor diet/lack of8%9%7%2%9%zs8%8%10%9%9%5%8%11%10%4%6%9%8%-7%9%9%8%snutrition/eating habits/
junk food6-7165216--211-151-2417Bird flu1%-1%1%1%1%*10%1%--1%4%zi*-*1%*-*2%zc1%1%c
1111121176192-211-562-63413Swine flu (pig flu)1%*2%2%1%1%1%10%1%3%l-1%4%i*-2%1%1%-1%1%2%1%
Public Perceptions of the NHS and Social CareFINAL PUBLIC
Table 68Q12. Thinking generally, what are the biggest health problems facing people today? What else?
Base : All respondents
Respondent type : General public aged 16+ Fieldwork dates : 14th November - 9th December 2011Source : Ipsos MORI (JN10-039262-01)Proportions/Means: Columns Tested (5% risk level) - z/a/b/c/d - z/e/f/g - z/h/i/j/k - z/l/m/n/o - z/p/q - z/r/s - z/t/u - z/vOverlap formulae used. * small base; ** very small base (under 30) ineligible for sig testing

People aretreated with
Unwtddignity andtotalrespectNHS useHospital useEthnicityNHS/social care staffHousehold TypeHome Ownership
NotAdultshospitalHospitalInformalSocialwith
Non NHS/A&E/A&EsocialcareKnow NHSNHSdependentNon-Owner -PrivateSocialWtd.DisagreeAgreeuserNHS useruseruserMixedWhiteAsianBlackcarerworkerstaffstaffchildrenpensionerPensionerOtheroccupierrenterrenterTotal
(v)(u)(t)(s)(r)(q)(p)(o)(n)(m)(l)(k)(j)(i)(h)(g)(f)(e)(d)(c)(b)(a)(z)1001304652104*89746853311**74778*15925038*29252*30547522110**6401781731001Weighted Total
223212221014-1445745-11112188724Flu pandemic2%1%3%zu2%2%2%3%-2%6%n3%3%10%zhik2%-4%e2%1%11%1%4%c4%c2%ceu
16449113171498185-1201134441057115288261923340166Smoking/smoking related16%16%17%16%17%17%16%-16%14%21%18%25%20%21%17%19%e12%10%14%18%23%zc17%ceillnesses
102335810915248272916274358334919-552124100Stress/pressure10%11%9%9%10%11%9%20%10%12%10%11%9%12%15%11%10%8%-9%12%14%c10%c
4314262412320131561139-131812-2261543Stroke4%4%4%2%5%5%4%9%4%6%4%4%8%h3%-4%4%5%-3%3%9%zbc4%
5020253442423142-523513-1325101328748Dementia5%7%4%3%5%5%4%9%6%zm-3%9%zhi14%zhi4%-4%5%4%8%5%4%4%5%
5112343471832142512021231619141359549Other5%4%5%3%5%4%6%11%6%l7%l1%8%zi6%4%5%5%4%6%10%5%5%3%5%l
-----------------------Access to treatment/-----------------------specialist services/
treatment
11--1-1-1----1--1--1--1Allergies**--*-*-*----*--*--*--*-----------------------Alzheimers disease-----------------------5-3-432-4--3---1-3-3114Arthritis*-*-*1%*-1%--1%---*-2%zf-**1%*5141423131-5211221-3115Asthma**1%1%**1%11%*1%-2%zi6%zi*2%1%**-*1%1%1%-----------------------Attitude of staff----------------------------------------------Back problems-----------------------1-1-1-1-1----1--1--1--1Car accidents/*-*-*-*-*----*--*--*--*accidents caused by
bad driving
-----------------------Dental care/-----------------------children\222s dental
care
1-1-11--1------1---1--1Diseases from abroad/*-*-**--*------*---*--*foreign diseases
-----------------------Getting appointments-----------------------211-211-2--2---2----112Health & Hygiene***-***-*--1%z---1%----1%1%*
Public Perceptions of the NHS and Social CareFINAL PUBLIC
Table 68Q12. Thinking generally, what are the biggest health problems facing people today? What else?
Base : All respondents
Respondent type : General public aged 16+ Fieldwork dates : 14th November - 9th December 2011Source : Ipsos MORI (JN10-039262-01)Proportions/Means: Columns Tested (5% risk level) - z/a/b/c/d - z/e/f/g - z/h/i/j/k - z/l/m/n/o - z/p/q - z/r/s - z/t/u - z/vOverlap formulae used. * small base; ** very small base (under 30) ineligible for sig testing

People aretreated with
Unwtddignity andtotalrespectNHS useHospital useEthnicityNHS/social care staffHousehold TypeHome Ownership
NotAdultshospitalHospitalInformalSocialwith
Non NHS/A&E/A&EsocialcareKnow NHSNHSdependentNon-Owner -PrivateSocialWtd.DisagreeAgreeuserNHS useruseruserMixedWhiteAsianBlackcarerworkerstaffstaffchildrenpensionerPensionerOtheroccupierrenterrenterTotal
(v)(u)(t)(s)(r)(q)(p)(o)(n)(m)(l)(k)(j)(i)(h)(g)(f)(e)(d)(c)(b)(a)(z)1001304652104*89746853311**74778*15925038*29252*30547522110**6401781731001Weighted Total
11--1-1-1--1-1---1-1--1Immigrants using the**--*-*-*--*-*---*-*--*system/multicultural
issues
3211221-21-1----3--2-13Lack of education/*1%*1%***-*1%-*----1%--*-**knowledge about health
issues
-----------------------Liver diseases----------------------------------------------Overcrowding/-----------------------overpopulation
-----------------------Pollution/effects of-----------------------pollution
-----------------------Poor tolerance to-----------------------illnesses/lack of
immunity to illnesses
413-422-31-2-1-2-2121-4Respiratory problems***-***-*1%-1%-*-1%-1%f10%*1%-*515-514-5--1-2-14--33-5Sexually transmitted**1%-1%*1%-1%--*-1%-*1%--*1%-1%diseases/STD's
1-1-1-1-1--------1---11TB*-*-*-*-*--------*---**1-1-11--1--1---1-----11Viruses/colds/flu*-*-**--*--*---*-----1%*-----------------------Waiting lists----------------------------------------------Waiting time in-----------------------hospitals
1-1-11--1--------1---11Weather/cold weather*-*-**--*--------*---**
24517122716-19317-62986-192223Other2%2%3%1%2%1%3%-3%4%1%3%-2%3%3%2%3%-3%z1%1%2%
1221021076-732--2-471-72312No answer1%1%2%2%1%1%1%-1%4%zn1%--1%-1%2%*-1%1%2%1%
7217525673636144719134122242721-35191872Don't know7%6%8%5%7%8%7%9%6%9%12%zn5%11%4%4%8%6%10%-5%11%c11%c7%cin
1353398111256075191231935748124066291773225135Diabetes/Diabetes in13%11%15%10%14%13%14%11%12%29%zln12%14%17%16%23%z13%14%13%8%12%18%15%14%nchildren
13429101111256967-99142132645134264292852226135Lack of exercise/13%9%15%zu10%14%15%13%-13%19%13%13%15%15%24%zk14%14%13%19%13%13%15%14%usedentary/unhealthy
lifestyle
Public Perceptions of the NHS and Social CareFINAL PUBLIC
Table 68Q12. Thinking generally, what are the biggest health problems facing people today? What else?
Base : All respondents
Respondent type : General public aged 16+ Fieldwork dates : 14th November - 9th December 2011Source : Ipsos MORI (JN10-039262-01)Proportions/Means: Columns Tested (5% risk level) - z/a/b/c/d - z/e/f/g - z/h/i/j/k - z/l/m/n/o - z/p/q - z/r/s - z/t/u - z/vOverlap formulae used. * small base; ** very small base (under 30) ineligible for sig testing

People aretreated with
Unwtddignity andtotalrespectNHS useHospital useEthnicityNHS/social care staffHousehold TypeHome Ownership
NotAdultshospitalHospitalInformalSocialwith
Non NHS/A&E/A&EsocialcareKnow NHSNHSdependentNon-Owner -PrivateSocialWtd.DisagreeAgreeuserNHS useruseruserMixedWhiteAsianBlackcarerworkerstaffstaffchildrenpensionerPensionerOtheroccupierrenterrenterTotal
(v)(u)(t)(s)(r)(q)(p)(o)(n)(m)(l)(k)(j)(i)(h)(g)(f)(e)(d)(c)(b)(a)(z)1001304652104*89746853311**74778*15925038*29252*30547522110**6401781731001Weighted Total
35911522635323161198329318408413116261101787122525351359Obesity/overeating/36%38%35%34%36%34%37%30%39%zlm24%25%34%34%40%50%zk36%37%32%19%39%zab30%30%36%lmobesity in children
Public Perceptions of the NHS and Social CareFINAL PUBLIC
Table 68Q12. Thinking generally, what are the biggest health problems facing people today? What else?
Base : All respondents
Respondent type : General public aged 16+ Fieldwork dates : 14th November - 9th December 2011Source : Ipsos MORI (JN10-039262-01)Proportions/Means: Columns Tested (5% risk level) - z/a/b/c/d - z/e/f/g - z/h/i/j/k - z/l/m/n/o - z/p/q - z/r/s - z/t/u - z/vOverlap formulae used. * small base; ** very small base (under 30) ineligible for sig testing

UnwtdtotalFuture of NHSSatisfaction with NHSGOR
DisYorkshire &WestEastWtd.WorseSameBettersatisfiedSatisfiedHumbersideMidlandsSouth-WestSouth-EastNorth-WestNorth-EastLondonEasternMidlandsTotal
(o)(n)(m)(l)(k)(j)(i)(h)(g)(f)(e)(d)(c)(b)(a)(z)1001328298343168703909910715413955143126881001Unweighted Total1001327302340168701100*106*10216213651*14810986*1001Weighted Total1654646632810813172026139142026158Age-related illnesses/16%14%15%18%17%15%13%16%20%ce16%9%18%10%18%ce30%zbcefhi16%cepeople living longer/old
age238413319442-1-121125Aids/HIV2%2%1%4%zm2%3%4%f3%f2%-1%-8%zabdefg1%1%2%
2036361713114924101337312338208205Alcohol abuse/drink-20%19%20%21%18%21%24%agh9%13%23%agh23%agh46%zabcefghi26%agh18%ah9%20%aghrelated illnesses/
alcoholism/bingedrinking
3631329213567256464537513217734617365Cancer36%40%m31%40%m40%37%46%zaef42%ae36%ae32%24%34%49%zadefg42%ae20%36%aem
128463048199413981812841145128Diabetes13%14%10%14%12%13%13%9%8%11%9%16%a28%zabefghi13%6%13%a
95122512-211-119Diabetes in children1%2%**1%1%1%2%-1%1%2%-1%1%1%
120393242189387121925132771120Drugs/abuse/misuse of12%12%11%12%11%13%8%a7%11%a12%a18%zabhi25%zabfghi19%zabhi7%1%12%abdrugs/substances
182554576321242420153118835229181Heart disease/attacks18%17%15%22%zm19%18%24%ae19%14%19%13%15%23%ae20%10%18%a
541121226423351114452654Lack of exercise/5%3%7%n6%4%6%3%3%5%7%b11%zbchi8%b3%1%7%5%bnsedentary lifestyle
100324223227251261524515514102Unhealthy lifestyle10%10%14%zl7%13%10%5%11%6%9%18%zbfgi9%10%4%17%zbgi10%bl
7323163520431111291221710275Mental health7%7%5%10%zm12%zj6%11%ag10%ag2%5%9%ag3%11%ag9%g2%8%agj
1654731111142231116MRSA/cleanliness in2%1%1%2%2%2%1%1%1%3%2%3%2%1%1%2%hospitals
34310811211251238292031832923544627342Obesity/overeating34%33%37%33%30%34%29%19%30%51%zaceghi21%45%eh36%eh42%zeh32%h34%eh
6116251984522222126113363Obesity in children6%5%8%6%5%6%2%2%2%14%zabghi9%ghi12%abghi7%3%3%6%g
81263121234239128215154480Poor diet/lack of8%8%10%6%14%zj6%3%8%12%bfi5%16%zabfi9%10%bi4%4%8%jnutrition/eating habits/
junk food6232-633----1--7Bird flu1%1%1%1%-1%3%z3%zef----1%--1%
1145311023-11-4-113Swine flu (pig flu)1%1%2%1%1%1%2%3%-1%1%-2%-1%1%
22987219163-3-9-224Flu pandemic2%3%2%2%1%3%1%6%zbf3%f-2%-6%zbf-3%f2%
164624055251191678303316251713166Smoking/smoking related16%19%13%16%15%17%16%7%8%18%gh24%zgh32%zabcfghi17%gh16%15%17%ghillnesses
Public Perceptions of the NHS and Social CareFINAL PUBLIC
Table 69Q12. Thinking generally, what are the biggest health problems facing people today? What else?
Base : All respondents
Respondent type : General public aged 16+ Fieldwork dates : 14th November - 9th December 2011Source : Ipsos MORI (JN10-039262-01)Proportions/Means: Columns Tested (5% risk level) - z/a/b/c/d/e/f/g/h/i - z/j/k - z/l/m/n - z/oOverlap formulae used. * small base

UnwtdtotalFuture of NHSSatisfaction with NHSGOR
DisYorkshire &WestEastWtd.WorseSameBettersatisfiedSatisfiedHumbersideMidlandsSouth-WestSouth-EastNorth-WestNorth-EastLondonEasternMidlandsTotal
(o)(n)(m)(l)(k)(j)(i)(h)(g)(f)(e)(d)(c)(b)(a)(z)1001327302340168701100*106*10216213651*14810986*1001Weighted Total1024224341962361115144261110100Stress/pressure10%13%m8%10%12%9%3%5%11%i9%10%9%18%zfhi10%11%i10%i
43145241125210-751162-43Stroke4%4%2%7%zm7%4%2%10%zabegi-5%ag3%2%11%zabefgi2%-4%gm
5018131414253131163610548Dementia5%6%4%4%8%zj4%3%1%3%7%h4%5%4%9%zgh6%5%j
5114171710336110961410349Other5%4%6%5%6%5%6%1%10%zch5%4%2%3%9%zch3%5%----------------Access to treatment/----------------specialist services/
treatment
1--11--------1-1Allergies*--**--------1%z-*----------------Alzheimers disease----------------5211-41-----13-4Arthritis*1%**-1%1%-----1%2%zf-*5-1414--121--1-5Asthma*-*1%zn1%1%--1%1%1%--1%-1%----------------Attitude of staff--------------------------------Back problems----------------1-1--1--1------1Car accidents/*-*--*--1%z------*accidents caused by
bad driving
----------------Dental care/----------------children\222s dental
care
1-1--1-----1---1Diseases from abroad/*-*--*-----2%z---*foreign diseases
----------------Getting appointments----------------21-111----1-1--2Health & Hygiene**-*1%*----1%-1%--*1--1-1--1------1Immigrants using the*--*-*--1%z------*system/multicultural
issues
312-3-----1-11-3Lack of education/**1%-2%zj-----1%-1%1%-*knowledge about health
issues
----------------Liver diseases----------------
Public Perceptions of the NHS and Social CareFINAL PUBLIC
Table 69Q12. Thinking generally, what are the biggest health problems facing people today? What else?
Base : All respondents
Respondent type : General public aged 16+ Fieldwork dates : 14th November - 9th December 2011Source : Ipsos MORI (JN10-039262-01)Proportions/Means: Columns Tested (5% risk level) - z/a/b/c/d/e/f/g/h/i - z/j/k - z/l/m/n - z/oOverlap formulae used. * small base

UnwtdtotalFuture of NHSSatisfaction with NHSGOR
DisYorkshire &WestEastWtd.WorseSameBettersatisfiedSatisfiedHumbersideMidlandsSouth-WestSouth-EastNorth-WestNorth-EastLondonEasternMidlandsTotal
(o)(n)(m)(l)(k)(j)(i)(h)(g)(f)(e)(d)(c)(b)(a)(z)1001327302340168701100*106*10216213651*14810986*1001Weighted Total
----------------Overcrowding/----------------overpopulation
----------------Pollution/effects of----------------pollution
----------------Poor tolerance to----------------illnesses/lack of
immunity to illnesses
4-4--32-1---1--4Respiratory problems*-1%zln--*2%z-1%---1%--*5311151--2---2-5Sexually transmitted*1%***1%1%--1%---2%-1%diseases/STD's
1--1-1----1----1TB*--*-*----1%----*1--1-1----1----1Viruses/colds/flu*--*-*----1%----*----------------Waiting lists--------------------------------Waiting time in----------------hospitals
11--1-----1----1Weather/cold weather**--*-----1%----*
2477841421643--4323Other2%2%2%2%2%2%2%1%6%zch3%2%--3%c3%c2%
1213829-31-3-22112No answer1%*1%2%zn1%1%-3%f1%-2%-1%2%1%1%n
7219242111544771315396772Don't know7%6%8%6%7%8%4%6%7%8%11%7%6%6%8%7%
1354931502198141281913841156135Diabetes/Diabetes in13%15%10%15%13%14%14%11%8%12%10%16%28%zabefghi14%7%14%amchildren
13439543924100715112231618618135Lack of exercise/13%12%18%zln11%14%14%7%14%b11%14%b23%zbcfgi12%12%6%21%bi14%bsedentary/unhealthy
lifestyle35911312011452253312031903223574629359Obesity/overeating/
36%34%40%34%31%36%31%19%30%55%zabceghi23%45%eh39%eh42%eh34%h36%ehobesity in children
Public Perceptions of the NHS and Social CareFINAL PUBLIC
Table 69Q12. Thinking generally, what are the biggest health problems facing people today? What else?
Base : All respondents
Respondent type : General public aged 16+ Fieldwork dates : 14th November - 9th December 2011Source : Ipsos MORI (JN10-039262-01)Proportions/Means: Columns Tested (5% risk level) - z/a/b/c/d/e/f/g/h/i - z/j/k - z/l/m/n - z/oOverlap formulae used. * small base

UnwtdPrivate healthSatisfaction withImpact of NHS reformsGovernment has righttotalinsurancesocial careon patientsNHS policyNHS use in last year
SocialNHSDissatisficareWalk InChoicesPharmacistWtd.
NoYesedSatisfiedWorseBetterDisagreeAgreeservicesClinicwebsite/ChemistNHS DirectA&EOutpatientInpatientGPTotal(r)(q)(p)(o)(n)(m)(l)(k)(j)(i)(h)(g)(f)(e)(d)(c)(b)(a)(z)10018151704424938220040326945182553001772253931967801001Unweighted Total100181117544*24437920139327642*18856*3011832303761927731001Weighted Total16512434134157317131624114422356631121158Age-related illnesses/16%15%19%30%zn17%15%16%18%j11%15%13%19%15%12%15%18%16%16%16%jpeople living longer/old
age232142649810-21212821425Aids/HIV2%3%2%5%2%1%5%zm2%4%-1%2%1%1%1%2%1%2%2%afm
203164411649664587511041166652478236168205Alcohol abuse/drink-20%20%23%36%zn20%17%23%22%18%23%22%28%22%29%zabcdf21%22%19%22%20%related illnesses/
alcoholism/bingedrinking
3632937021941536815684166527122798813572288365Cancer36%36%40%48%39%40%z34%40%j31%39%35%47%41%43%zch38%36%38%37%36%j
12810223103650315041428104126304925106128Diabetes13%13%13%22%15%13%16%13%15%9%15%17%14%14%13%13%13%14%13%963124252--11112149Diabetes in children1%1%2%2%1%1%1%1%1%--2%h*1%*1%1%1%1%a
120101197304122522843464432365334103120Drugs/abuse/misuse of12%12%11%16%12%11%11%13%10%9%18%z10%15%17%z16%14%18%z13%z12%drugs/substances
18214239144679378145832146339487639150181Heart disease/attacks18%17%22%33%zn19%21%19%21%16%18%17%25%21%21%21%20%20%19%18%5440134171712241427415131519144654Lack of exercise/5%5%8%9%7%4%6%6%5%5%4%7%5%7%6%5%7%6%5%sedentary lifestyle
10085174323519442432310312319372285102Unhealthy lifestyle10%10%10%8%13%9%9%11%9%7%12%18%d10%13%8%10%12%11%10%7364114233193817716229182133176475Mental health7%8%6%10%9%8%5%10%z6%17%zag8%3%10%10%9%9%9%8%8%
16124-79394-31624841216MRSA/cleanliness in2%1%2%-3%2%1%2%2%-1%1%2%1%2%2%2%2%2%hospitals
3432706921801287514385166419104748213666265342Obesity/overeating34%33%39%47%33%34%37%37%31%37%34%33%35%41%36%36%35%34%34%61511112218102416211213151723165063Obesity in children6%6%6%3%9%5%5%6%6%4%6%4%4%8%f8%6%8%f6%6%
81641362129153511-15122618173186680Poor diet/lack of8%8%7%14%9%8%7%9%j4%-8%b22%zabcdefh9%bi10%bi7%8%bi4%9%bi8%bjnutrition/eating habits/
ijunk food661-212-3-41432-167Bird flu1%1%1%-1%*1%-1%-2%zc2%c1%c1%c1%c-1%1%1%
11102143316-3-512241113Swine flu (pig flu)1%1%1%3%1%1%2%*2%k-1%-2%1%1%1%2%c1%1%k
22211-78669-51449552024Flu pandemic2%3%1%-3%2%3%2%3%-3%2%1%2%4%cf1%3%3%c2%
Public Perceptions of the NHS and Social CareFINAL PUBLIC
Table 70Q12. Thinking generally, what are the biggest health problems facing people today? What else?
Base : All respondents
Respondent type : General public aged 16+ Fieldwork dates : 14th November - 9th December 2011Source : Ipsos MORI (JN10-039262-01)Proportions/Means: Columns Tested (5% risk level) - z/a/b/c/d/e/f/g/h/i - z/j/k - z/l/m - z/n/o - z/p/q - z/rOverlap formulae used. * small base

UnwtdPrivate healthSatisfaction withImpact of NHS reformsGovernment has righttotalinsurancesocial careon patientsNHS policyNHS use in last year
SocialNHSDissatisficareWalk InChoicesPharmacistWtd.
NoYesedSatisfiedWorseBetterDisagreeAgreeservicesClinicwebsite/ChemistNHS DirectA&EOutpatientInpatientGPTotal(r)(q)(p)(o)(n)(m)(l)(k)(j)(i)(h)(g)(f)(e)(d)(c)(b)(a)(z)100181117544*24437920139327642*18856*3011832303761927731001Weighted Total16413828114963307338734134943435631130166Smoking/smoking related16%17%16%25%20%17%15%18%14%16%18%23%16%24%zabcf19%15%16%17%17%illnesses
1027921517502352246243311525331485100Stress/pressure10%10%12%10%7%13%z11%13%z9%14%13%b6%10%8%11%9%7%11%10%4340368191219927116571563943Stroke4%5%2%14%zn3%5%6%5%3%4%4%2%5%3%3%4%3%5%z4%
5041551419122512211-101091793948Dementia5%5%3%11%z6%5%6%6%4%6%6%-3%5%4%5%5%5%5%
5138112182010201011341813172694549Other5%5%6%4%8%z5%5%5%4%2%7%7%6%7%7%7%z5%6%z5%-------------------Access to treatment/-------------------specialist services/
treatment
11---1-1----1--1-11Allergies**---*-*----*--*-**-------------------Alzheimers disease-------------------54--423211--2--2244Arthritis*1%--2%z*1%**2%deh--1%--*1%1%*532-11112-2-1-22-45Asthma**1%-****1%-1%-*-1%1%-1%1%-------------------Attitude of staff--------------------------------------Back problems-------------------11--1---1-1-1-11-11Car accidents/**--*---*-1%-*-**-**accidents caused by
bad driving
-------------------Dental care/-------------------children\222s dental
care
11------1----1---11Diseases from abroad/**------*----1%---**foreign diseases
-------------------Getting appointments-------------------22--12-2--2-2--1-22Health & Hygiene**--*1%-1%--1%z-1%--*-**11--11-1---1---1-11Immigrants using the**--**-*---1%zaf---*-**system/multicultural
issues
321-12-3--1-1-11-23Lack of education/**1%-**-1%--*-*-**-**knowledge about health
issues
Public Perceptions of the NHS and Social CareFINAL PUBLIC
Table 70Q12. Thinking generally, what are the biggest health problems facing people today? What else?
Base : All respondents
Respondent type : General public aged 16+ Fieldwork dates : 14th November - 9th December 2011Source : Ipsos MORI (JN10-039262-01)Proportions/Means: Columns Tested (5% risk level) - z/a/b/c/d/e/f/g/h/i - z/j/k - z/l/m - z/n/o - z/p/q - z/rOverlap formulae used. * small base

UnwtdPrivate healthSatisfaction withImpact of NHS reformsGovernment has righttotalinsurancesocial careon patientsNHS policyNHS use in last year
SocialNHSDissatisficareWalk InChoicesPharmacistWtd.
NoYesedSatisfiedWorseBetterDisagreeAgreeservicesClinicwebsite/ChemistNHS DirectA&EOutpatientInpatientGPTotal(r)(q)(p)(o)(n)(m)(l)(k)(j)(i)(h)(g)(f)(e)(d)(c)(b)(a)(z)100181117544*24437920139327642*18856*3011832303761927731001Weighted Total
-------------------Liver diseases--------------------------------------Overcrowding/-------------------overpopulation
-------------------Pollution/effects of-------------------pollution
-------------------Poor tolerance to-------------------illnesses/lack of
immunity to illnesses
431-1-211-1-1222234Respiratory problems**1%-*-1%**-1%-*1%1%1%1%**532--3111-2-2222-55Sexually transmitted**1%--1%**1%-1%-1%1%1%1%-1%1%diseases/STD's
11-----1-------1111TB**-----*-------****11--11-1--1-1----11Viruses/colds/flu**--**-*--*-*----**-------------------Waiting lists--------------------------------------Waiting time in-------------------hospitals
11--11-1----1----11Weather/cold weather**--**-*----*----**
241762910593-5388101242223Other2%2%3%4%4%3%2%2%1%-3%5%3%4%z4%z3%2%3%z2%
1210-1124381312-434712No answer1%1%-2%*1%2%1%3%zk2%e2%2%1%-2%1%2%1%1%
72647-132315173511521991726135472Don't know7%8%4%-5%6%8%4%13%zk2%8%3%6%5%7%7%7%7%7%k
13510626113752335543428114227315127109135Diabetes/Diabetes in13%13%15%24%z15%14%17%14%16%9%15%19%14%15%14%14%14%14%14%children
1341102664246275736327123929294631114135Lack of exercise/13%14%15%13%17%z12%14%15%13%7%15%21%ci13%16%13%12%16%15%z14%sedentary/unhealthy
lifestyle3592827221861357515189166820108788514070280359Obesity/overeating/
36%35%41%47%35%36%37%38%32%37%36%35%36%43%zaf37%37%36%36%36%obesity in children
Public Perceptions of the NHS and Social CareFINAL PUBLIC
Table 70Q12. Thinking generally, what are the biggest health problems facing people today? What else?
Base : All respondents
Respondent type : General public aged 16+ Fieldwork dates : 14th November - 9th December 2011Source : Ipsos MORI (JN10-039262-01)Proportions/Means: Columns Tested (5% risk level) - z/a/b/c/d/e/f/g/h/i - z/j/k - z/l/m - z/n/o - z/p/q - z/rOverlap formulae used. * small base

UnwtdtotalWork StatusSocial GradeAgeGender
Full/part-Wtd.OtherUnemployedRetiredtimeDEC2C1AB65+55-6435-5425-3416-24FemaleMaleTotal
(p)(o)(n)(m)(l)(k)(j)(i)(h)(g)(f)(e)(d)(c)(b)(a)(z)1001162612705082472013062472201693311581235274741001Unweighted Total100115758*2355512392013122491981433501671435154861001Weighted Total
3473322641114341595221335A great deal3%5%4%1%4%2%2%4%6%zj1%3%4%5%g3%4%3%3%gm
25930970149493785865541874430123135258A fair amount26%19%16%30%no27%o20%19%27%j35%zjk28%29%25%26%21%24%28%26%jko
48768321112741119716311495771866760256229485Not very much49%43%55%47%50%46%48%52%46%48%54%cd53%zcd40%42%50%47%48%d
184391240956155442735195240409492186Nothing at all18%25%zlm21%17%17%25%zhi27%zhi14%11%18%13%15%24%ef28%zefg18%19%19%ehi
371321111139871011088211637Don't know4%8%zl3%5%l2%5%4%3%3%5%f1%3%5%5%f4%3%4%fl
29337127317055419610158451025335145148292Great deal/fair amount29%23%20%31%31%23%20%31%jk40%zijk29%32%29%31%24%28%30%29%jk
6711074515136917115120714113096238107100350322672Not very much/nothing at67%68%76%64%67%72%h75%zhi67%h57%66%67%68%64%70%68%66%67%hall
-378-70-33-78-198-117-110-111-41-73-51-136-54-66-205-174-379Net-38%-45%-56%-33%-36%-49%-55%-36%-16%-37%-35%-39%-33%-46%-40%-36%-38%
Public Perceptions of the NHS and Social CareFINAL PUBLIC
Table 71Q13. How much do you feel you know about the changes the government is making to the NHS?
Base : All respondents
Respondent type : General public aged 16+ Fieldwork dates : 14th November - 9th December 2011Source : Ipsos MORI (JN10-039262-01)Proportions/Means: Columns Tested (5% risk level) - z/a/b - z/c/d/e/f/g - z/h/i/j/k - z/l/m/n/o - z/pOverlap formulae used. * small base

People aretreated with
Unwtddignity andtotalrespectNHS useHospital useEthnicityNHS/social care staffHousehold TypeHome Ownership
NotAdultshospitalHospitalInformalSocialwith
Non NHS/A&E/A&EsocialcareKnow NHSNHSdependentNon-Owner -PrivateSocialWtd.DisagreeAgreeuserNHS useruseruserMixedWhiteAsianBlackcarerworkerstaffstaffchildrenpensionerPensionerOtheroccupierrenterrenterTotal
(v)(u)(t)(s)(r)(q)(p)(o)(n)(m)(l)(k)(j)(i)(h)(g)(f)(e)(d)(c)(b)(a)(z)100130864710090145854310750741612543628951291461249106491691731001Unweighted Total1001304652104*89746853311**74778*15925038*29252*30547522110**6401781731001Weighted Total
341025233132212653173169141741247335A great deal3%3%4%2%4%3%4%11%3%7%2%7%z8%5%17%zik4%4%2%8%4%4%2%3%
2598217226232118139319224386069019751255821724935258A fair amount26%27%26%25%26%25%26%29%26%31%24%24%15%31%zjk36%j24%26%26%20%27%28%20%26%
4871343254643921726843912365128261402113924010653217881485Not very much49%44%50%44%49%46%50%39%52%zlm29%41%51%69%zhik48%40%46%51%48%51%50%44%47%48%lm
1846810524162100861114185040238266784211023747186Nothing at all18%22%t16%23%18%21%zp16%10%15%24%32%zn16%h6%13%h3%22%16%19%12%16%21%27%zc19%chijn
pt
37102573020171257351921114121217837Don't know4%3%4%6%3%4%3%10%3%9%zln2%2%2%3%4%4%3%5%10%3%4%4%4%
29392197272651311624217294177910628881426231965637292Great deal/fair amount29%30%30%26%30%28%30%40%29%38%26%31%23%36%z53%zijk29%30%28%27%31%a32%a22%29%a
6712024307160131735455054111616829178232063181486423115128672Not very much/nothing at67%66%66%68%67%68%66%49%68%m53%73%m67%h75%h61%h43%67%67%67%63%66%65%74%z67%himall
-378-110-233-43-336-186-193-1-288-12-75-91-20-725-117-176-86-4-227-58-90-379Net-38%-36%-36%-41%-37%-40%-36%-9%-39%-15%-47%-36%-52%-25%10%-38%-37%-39%-36%-35%-33%-52%-38%
Public Perceptions of the NHS and Social CareFINAL PUBLIC
Table 72Q13. How much do you feel you know about the changes the government is making to the NHS?
Base : All respondents
Respondent type : General public aged 16+ Fieldwork dates : 14th November - 9th December 2011Source : Ipsos MORI (JN10-039262-01)Proportions/Means: Columns Tested (5% risk level) - z/a/b/c/d - z/e/f/g - z/h/i/j/k - z/l/m/n/o - z/p/q - z/r/s - z/t/u - z/vOverlap formulae used. * small base; ** very small base (under 30) ineligible for sig testing

UnwtdtotalFuture of NHSSatisfaction with NHSGOR
DisYorkshire &WestEastWtd.WorseSameBettersatisfiedSatisfiedHumbersideMidlandsSouth-WestSouth-EastNorth-WestNorth-EastLondonEasternMidlandsTotal
(o)(n)(m)(l)(k)(j)(i)(h)(g)(f)(e)(d)(c)(b)(a)(z)1001328298343168703909910715413955143126881001Unweighted Total1001327302340168701100*106*10216213651*14810986*1001Weighted Total
341761072226166-57235A great deal3%5%m2%3%4%3%2%5%1%4%5%-3%6%g2%3%
25986779345191281914453512503520258A fair amount26%26%25%27%27%27%28%g18%14%28%g26%g23%34%zgh33%gh23%26%g
48715613717869348455256896525575045485Not very much49%48%45%52%41%50%45%49%55%c55%c48%49%39%46%52%c48%ck
18459664840114222428182414261318186Nothing at all18%18%22%l14%24%j16%22%f23%bf27%zbf11%18%27%bf18%12%21%f19%bfjl
379161162645355193137Don't know4%3%5%3%4%4%4%5%3%3%4%2%6%3%1%4%
2931038310352213302515514212554222292Great deal/fair amount29%31%27%30%31%30%30%g23%15%31%g31%g23%37%zgh39%zadgh25%29%g
6712152032261094626676841068939846463672Not very much/nothing at67%66%67%67%65%66%66%72%bc83%zbcefi66%66%76%bc57%58%74%bc67%bcall
-378-113-120-123-57-250-36-51-69-56-48-27-29-21-42-379Net-38%-34%-40%-36%-34%-36%-36%-48%-68%-34%-35%-53%-19%-19%-48%-38%
Public Perceptions of the NHS and Social CareFINAL PUBLIC
Table 73Q13. How much do you feel you know about the changes the government is making to the NHS?
Base : All respondents
Respondent type : General public aged 16+ Fieldwork dates : 14th November - 9th December 2011Source : Ipsos MORI (JN10-039262-01)Proportions/Means: Columns Tested (5% risk level) - z/a/b/c/d/e/f/g/h/i - z/j/k - z/l/m/n - z/oOverlap formulae used. * small base

UnwtdPrivate healthSatisfaction withImpact of NHS reformsGovernment has righttotalinsurancesocial careon patientsNHS policyNHS use in last year
SocialNHSDissatisficareWalk InChoicesPharmacistWtd.
NoYesedSatisfiedWorseBetterDisagreeAgreeservicesClinicwebsite/ChemistNHS DirectA&EOutpatientInpatientGPTotal(r)(q)(p)(o)(n)(m)(l)(k)(j)(i)(h)(g)(f)(e)(d)(c)(b)(a)(z)
10018151704424938220040326945182553001772253931967801001Unweighted Total100181117544*24437920139327642*18856*3011832303761927731001Weighted Total
342872121812229383116819103035A great deal3%3%4%5%5%5%6%z6%z3%8%4%6%4%3%3%5%z5%4%3%
25920053155711269121861154218354618943200258A fair amount26%25%30%33%23%29%z34%z31%z31%z26%29%37%bc28%30%27%24%22%26%26%
4873879321125190921731271592271539611919994376485Not very much49%48%53%47%51%50%46%44%46%35%49%48%51%i52%i52%i53%zai49%49%48%k
1841611974151226941102944526385837141186Nothing at all18%20%zp11%15%17%13%11%18%15%24%g15%7%15%14%16%15%19%g18%g19%cglmp
37343-10868133518141082637Don't know4%4%2%-4%2%3%2%5%k6%e3%2%3%*2%3%e4%e3%e4%ekm
293228611769130811439514622494606910953230292Great deal/fair amount29%28%35%38%28%34%z40%z36%z34%z35%33%43%zabc31%33%30%29%28%30%29%
671548112271652411132421682512131198122157257131517672Not very much/nothing at67%68%64%62%68%64%57%62%61%59%64%56%66%67%68%68%g68%67%67%jklall
-378-321-51-11-96-111-32-99-73-10-59-7-105-62-88-148-78-287-379Net-38%-40%-29%-24%-39%-29%-16%-25%-26%-24%-31%-13%-35%-34%-38%-39%-41%-37%-38%
Public Perceptions of the NHS and Social CareFINAL PUBLIC
Table 74Q13. How much do you feel you know about the changes the government is making to the NHS?
Base : All respondents
Respondent type : General public aged 16+ Fieldwork dates : 14th November - 9th December 2011Source : Ipsos MORI (JN10-039262-01)Proportions/Means: Columns Tested (5% risk level) - z/a/b/c/d/e/f/g/h/i - z/j/k - z/l/m - z/n/o - z/p/q - z/rOverlap formulae used. * small base

UnwtdtotalWork StatusSocial GradeAgeGender
Full/part-Wtd.OtherUnemployedRetiredtimeDEC2C1AB65+55-6435-5425-3416-24FemaleMaleTotal
(p)(o)(n)(m)(l)(k)(j)(i)(h)(g)(f)(e)(d)(c)(b)(a)(z)1001162612705082472013062472201693311581235274741001Unweighted Total100115758*2355512392013122491981433501671435154861001Weighted Total
30142136718469601047256461114845149157306Cuts30%27%22%28%33%z29%30%33%29%28%32%32%29%31%29%32%31%686310501013271996311211294069Necessary/positive7%4%5%4%9%zmo4%7%9%k7%5%4%9%7%8%6%8%7%kmcuts (general mention)
10718322682818353018144019195456110Negative/ damaging/11%11%5%9%12%12%9%11%12%9%10%11%11%14%11%11%11%too many cuts (general
mention)
57102143212112781172668282958Cuts in managers6%6%3%6%6%5%5%9%zh3%6%5%7%3%6%5%6%6%h
5091103291118137101888212951Cuts in bureaucracy5%6%2%4%6%4%5%6%5%3%7%5%5%6%4%6%5%
6481213317122014181318104323163Hospital closures6%5%2%9%6%7%6%6%6%9%zc9%c5%6%3%6%6%6%
821051655162033171512321315503686Cuts in frontline8%6%9%7%10%7%10%10%7%7%8%9%8%10%10%7%9%services
1021423214522-16310Cuts in quangos1%1%2%2%l*1%1%*1%2%zd1%1%-1%1%1%1%
30732148017650528911165561163926142160302Organisational Change31%20%23%34%o32%o21%26%29%k44%zijk33%cd39%zcd33%cd23%18%28%33%30%cdko
1331053777131139673325461976169130Doctors and other13%7%9%16%o14%o5%5%13%jk27%zijk17%c17%c13%c11%5%12%14%13%cjkohealth care
professionalscommissioningservices/ having moreof a say in how theNHS is run
9373226311182144151646107504594Organisational9%4%5%9%o11%zo5%9%7%18%zijk8%11%c13%zcdg6%5%10%9%9%ikochanges/
reconfiguration(general mention)
14520632862928414723295821146876144Privatisation/ more14%13%10%13%16%12%14%13%19%zk11%20%zcg16%13%10%13%16%14%services provided by
private sector
28139146411674673161127More care available3%1%4%o4%o3%2%2%3%2%4%3%2%4%2%3%2%3%outside of hospital
17122124283244349817More services provided2%1%3%1%2%2%1%3%1%1%3%1%2%2%2%2%2%by charity sector
4985122214817108817104202848Access to Services5%5%8%5%4%6%4%5%4%4%6%5%6%3%4%6%5%
1932410436632112-9918Faster access to2%2%3%2%2%2%1%2%2%2%1%3%zc1%-2%2%2%hospitals/ shorter
hospital waiting times
214251074823455361521Faster access to GPs/2%3%4%2%2%3%2%3%1%1%3%2%3%2%1%3%b2%bshorter GP waiting
times
Public Perceptions of the NHS and Social CareFINAL PUBLIC
Table 75Q14. As far as you know, what do the government's changes to the NHS involve? What else?
Base : All respondents
Respondent type : General public aged 16+ Fieldwork dates : 14th November - 9th December 2011Source : Ipsos MORI (JN10-039262-01)Proportions/Means: Columns Tested (5% risk level) - z/a/b - z/c/d/e/f/g - z/h/i/j/k - z/l/m/n/o - z/pOverlap formulae used. * small base

UnwtdtotalWork StatusSocial GradeAgeGender
Full/part-Wtd.OtherUnemployedRetiredtimeDEC2C1AB65+55-6435-5425-3416-24FemaleMaleTotal
(p)(o)(n)(m)(l)(k)(j)(i)(h)(g)(f)(e)(d)(c)(b)(a)(z)100115758*2355512392013122491981433501671435154861001Weighted Total
1431463343333315813Longer waiting times1%2%2%2%1%1%2%1%1%1%2%1%2%1%1%2%1%
595414341352515101023132282957Choice of Services6%3%7%6%6%5%2%8%j6%5%7%c6%c8%c1%5%6%6%cj
1011-91-72--7125611More choice for1%1%2%m-2%m*-2%zj1%--2%zg1%1%1%1%1%patients (general
mention)
2432711631044595-91322Patients can choose2%2%3%3%2%2%1%3%1%2%4%c3%3%-2%3%2%their GP/GP surgery
27-19176-1196578-111527More choice for3%-2%4%o3%o2%j-4%j4%j3%c4%c2%5%c-2%3%3%jopatients over where
they get treated
201251173374375-11919Patients having more2%1%3%2%2%3%1%1%3%2%2%2%3%c-2%2%2%say in their
healthcare
102121315321132341192237163574198Other10%8%2%13%zn10%n9%7%7%17%zijk10%c15%zc11%c10%c2%11%8%10%cn
262-10145-61455124-141226Budget ring-fenced/3%1%-4%3%2%j-2%j6%zij2%3%c3%c3%-3%2%3%jprotected spending
111-54722-424--4610Encouraging people to1%1%-2%z1%3%zh1%1%-2%2%1%--1%1%1%take responsibility
for their own health
131-291435134315813Better quality1%1%-1%2%*2%1%2%*2%1%2%1%1%2%1%services for patients
62-132-22-24--416New non-emergency1%1%-*1%1%-1%1%-1%1%--1%*1%telephone number '111'
2--2--1-111---2-2Allocation of funds/*--1%zl--*-**1%---*-*saving money
3--12-1-21-2--123Better management/*--**-1%-1%*-1%--***efficiency
61-14-213-231-516Funding cuts1%1%-*1%-1%*1%-1%1%1%-1%*1%72-2311221311-426GPs responsible for1%1%-1%***1%1%*2%ze*1%-1%*1%their own budgets
21--1--2---1-1112More funding*1%--*--1%---*-1%***83-2331311223-717Reduction in staff1%2%-1%1%1%*1%**1%1%2%-1%a*1%a
1--1-1---1----1-1Re-instate matrons*--*-*---*----*-*31-11-11111-1-213Removing PCTs*1%-**-****1%-1%-***3--12--12-12--213Staff pensions*--**--*1%-1%1%--***
Public Perceptions of the NHS and Social CareFINAL PUBLIC
Table 75Q14. As far as you know, what do the government's changes to the NHS involve? What else?
Base : All respondents
Respondent type : General public aged 16+ Fieldwork dates : 14th November - 9th December 2011Source : Ipsos MORI (JN10-039262-01)Proportions/Means: Columns Tested (5% risk level) - z/a/b - z/c/d/e/f/g - z/h/i/j/k - z/l/m/n/o - z/pOverlap formulae used. * small base

UnwtdtotalWork StatusSocial GradeAgeGender
Full/part-Wtd.OtherUnemployedRetiredtimeDEC2C1AB65+55-6435-5425-3416-24FemaleMaleTotal
(p)(o)(n)(m)(l)(k)(j)(i)(h)(g)(f)(e)(d)(c)(b)(a)(z)100115758*2355512392013122491981433501671435154861001Weighted Total
2631812446117583115924Other3%2%2%3%2%2%2%2%4%z3%4%2%2%1%3%2%2%
3857621121296631289172339Not heard of any changes4%3%12%zlmo3%4%5%6%3%2%3%2%3%5%7%3%5%4%21-1-1--11---1112No answer*1%-*-*--**---1%***
383802785193115841157076441207669216169385Don't know38%51%zlm46%36%35%48%zhi42%h37%h28%38%31%34%45%ef48%zef42%za35%38%afhl
Public Perceptions of the NHS and Social CareFINAL PUBLIC
Table 75Q14. As far as you know, what do the government's changes to the NHS involve? What else?
Base : All respondents
Respondent type : General public aged 16+ Fieldwork dates : 14th November - 9th December 2011Source : Ipsos MORI (JN10-039262-01)Proportions/Means: Columns Tested (5% risk level) - z/a/b - z/c/d/e/f/g - z/h/i/j/k - z/l/m/n/o - z/pOverlap formulae used. * small base

People aretreated with
Unwtddignity andtotalrespectNHS useHospital useEthnicityNHS/social care staffHousehold TypeHome Ownership
NotAdultshospitalHospitalInformalSocialwith
Non NHS/A&E/A&EsocialcareKnow NHSNHSdependentNon-Owner -PrivateSocialWtd.DisagreeAgreeuserNHS useruseruserMixedWhiteAsianBlackcarerworkerstaffstaffchildrenpensionerPensionerOtheroccupierrenterrenterTotal
(v)(u)(t)(s)(r)(q)(p)(o)(n)(m)(l)(k)(j)(i)(h)(g)(f)(e)(d)(c)(b)(a)(z)100130864710090145854310750741612543628951291461249106491691731001Unweighted Total1001304652104*89746853311**74778*15925038*29252*30547522110**6401781731001Weighted Total
30193202272791291763233185076149722911526311816756306Cuts30%31%31%26%31%28%33%31%31%24%31%30%36%33%41%30%32%28%10%28%38%zc33%31%c
6815509603336145419152223124512-43161069Necessary/positive7%5%8%9%7%7%7%11%6%5%12%zn6%5%8%6%4%9%zg5%-7%9%6%7%gcuts (general mention)
10734711010047641856172663694347201573022110Negative/ damaging/11%11%11%10%11%10%12%10%11%8%11%10%16%12%16%14%10%9%10%9%17%zc13%11%ctoo many cuts (general
mention)
5718404543028-4629163181222512-30151358Cuts in managers6%6%6%3%6%6%5%-6%3%6%6%9%6%2%7%5%5%-5%9%7%6%c
5018322492130-404720120317268-3312651Cuts in bureaucracy5%6%5%2%5%4%6%-5%5%4%8%z3%7%6%5%6%4%-5%7%3%5%
6422381622340-43614143196132921-36131463Hospital closures6%7%6%1%7%zs5%7%-6%8%9%6%8%6%12%4%6%9%zg-6%7%8%6%s
8227598783056167215196277274414-54211186Cuts in frontline8%9%9%7%9%6%10%zq10%9%2%9%8%14%9%13%9%9%7%-8%12%7%9%mqservices
10281946-91-2-21234-72110Cuts in quangos1%1%1%1%1%1%1%-1%1%-1%-1%2%1%1%2%-1%1%1%1%
307106188242781451563232214390811026781507432064647302Organisational Change31%35%z29%23%31%31%29%28%31%27%27%36%z21%38%zj50%zj26%32%33%g27%32%26%27%30%g
133537313117646621079123924793757361951518130Doctors and other13%17%zt11%12%13%14%12%20%14%zl12%7%16%5%16%16%12%12%16%8%15%zb9%11%13%lthealth care
professionalscommissioningservices/ having moreof a say in how theNHS is run
9331629864450-79783243416304520262161494Organisational9%10%9%8%10%9%9%-11%zl9%5%13%z11%11%31%zijk10%10%9%20%10%9%8%9%lchanges/
reconfiguration(general mention)
14540100121326678210292836359123880261942425144Privatisation/ more14%13%15%12%15%14%15%20%14%12%17%15%7%20%zk23%j12%17%z12%10%15%13%15%14%services provided by
private sector
28819-27819-1926721125148-154827More care available3%3%3%-3%2%4%-3%3%4%3%5%4%4%2%3%4%-2%2%4%3%outside of hospital
17314116710-10251--3593-74617More services provided2%1%2%1%2%2%2%-1%2%3%*--6%zik2%2%1%-1%2%4%zc2%cikby charity sector
4914321471929-3549102101152111-23121348Access to Services5%5%5%1%5%4%5%-5%5%6%4%5%3%2%5%4%5%-4%7%7%c5%c
19811-18711-171-7241855-122518Faster access to2%2%2%-2%1%2%-2%1%-3%5%2%2%3%1%2%-2%1%3%2%hospitals/ shorter
hospital waiting times
Public Perceptions of the NHS and Social CareFINAL PUBLIC
Table 76Q14. As far as you know, what do the government's changes to the NHS involve? What else?
Base : All respondents
Respondent type : General public aged 16+ Fieldwork dates : 14th November - 9th December 2011Source : Ipsos MORI (JN10-039262-01)Proportions/Means: Columns Tested (5% risk level) - z/a/b/c/d - z/e/f/g - z/h/i/j/k - z/l/m/n/o - z/p/q - z/r/s - z/t/u - z/vOverlap formulae used. * small base; ** very small base (under 30) ineligible for sig testing

People aretreated with
Unwtddignity andtotalrespectNHS useHospital useEthnicityNHS/social care staffHousehold TypeHome Ownership
NotAdultshospitalHospitalInformalSocialwith
Non NHS/A&E/A&EsocialcareKnow NHSNHSdependentNon-Owner -PrivateSocialWtd.DisagreeAgreeuserNHS useruseruserMixedWhiteAsianBlackcarerworkerstaffstaffchildrenpensionerPensionerOtheroccupierrenterrenterTotal
(v)(u)(t)(s)(r)(q)(p)(o)(n)(m)(l)(k)(j)(i)(h)(g)(f)(e)(d)(c)(b)(a)(z)1001304652104*89746853311**74778*15925038*29252*30547522110**6401781731001Weighted Total
21515120813-14342-5-4124-78621Faster access to GPs/2%2%2%1%2%2%2%-2%4%2%1%-2%-1%3%2%-1%5%zc3%c2%cshorter GP waiting
times
14310-1358-7152-2-464-54413Longer waiting times1%1%2%-1%1%2%-1%1%3%zn1%-1%-1%1%2%-1%2%2%1%
5915396513126236812172166163011233111157Choice of Services6%5%6%6%6%7%5%20%5%10%8%7%5%6%11%5%6%5%18%5%6%7%6%n
1036289217-33-6156--63111More choice for1%1%1%2%1%2%p*9%1%-2%1%-2%2%2%1%--1%2%1%1%ppatients (general
mention)
24715121617-11666-716116-116622Patients can choose2%2%2%1%2%1%3%q-2%7%zn3%3%-3%2%2%2%3%-2%3%3%2%nqtheir GP/GP surgery
278173231413117275-7241661163627More choice for3%3%3%3%3%3%2%11%2%3%4%2%-3%4%1%3%3%8%3%2%3%3%patients over where
they get treated
20513316146-123462435951122419Patients having more2%2%2%3%2%3%p1%-2%4%2%2%5%2%5%2%2%2%10%2%1%2%2%psay in their
healthcare
102316379145531727162953310304919169151398Other10%10%10%7%10%10%10%10%10%9%10%12%12%11%19%z10%10%9%8%11%8%8%10%267192241016-1736629311105-193426Budget ring-fenced/3%2%3%2%3%2%3%-2%4%4%3%6%3%6%4%2%2%-3%2%2%3%protected spending
113711074-8121-2-254-72210Encouraging people to1%1%1%1%1%1%1%-1%1%1%*-1%-1%1%2%-1%1%1%1%take responsibility
for their own health
133911259-9132-4-2101-63313Better quality1%1%1%1%1%1%2%-1%1%2%1%-1%-1%2%*-1%2%2%1%services for patients
614-624-2-43--1321-4-26New non-emergency1%*1%-1%*1%-*-2%zn1%--2%i1%**-1%-1%1%ntelephone number '111'
2111111-2-------11-2--2Allocation of funds/***1%***-*-------**-*--*saving money
3-31221-3----1--21-3--3Better management/*-*1%***-*----*--**-*--*efficiency
642-642-5--211215--6--6Funding cuts1%1%*-1%1%*-1%--1%3%*4%zi*1%--1%--1%7421533-5-13-32231-51-6GPs responsible for1%1%t*1%1%1%1%-1%-*1%-1%4%z1%1%*-1%*-1%ttheir own budgets
2-2-22--2--111--2--11-2More funding*-*-**--*--*3%z*--*--*1%-*834-744-52-3-31341-4-37Reduction in staff1%1%1%-1%1%1%-1%3%l-1%-1%2%1%1%*-1%-2%1%
Public Perceptions of the NHS and Social CareFINAL PUBLIC
Table 76Q14. As far as you know, what do the government's changes to the NHS involve? What else?
Base : All respondents
Respondent type : General public aged 16+ Fieldwork dates : 14th November - 9th December 2011Source : Ipsos MORI (JN10-039262-01)Proportions/Means: Columns Tested (5% risk level) - z/a/b/c/d - z/e/f/g - z/h/i/j/k - z/l/m/n/o - z/p/q - z/r/s - z/t/u - z/vOverlap formulae used. * small base; ** very small base (under 30) ineligible for sig testing

People aretreated with
Unwtddignity andtotalrespectNHS useHospital useEthnicityNHS/social care staffHousehold TypeHome Ownership
NotAdultshospitalHospitalInformalSocialwith
Non NHS/A&E/A&EsocialcareKnow NHSNHSdependentNon-Owner -PrivateSocialWtd.DisagreeAgreeuserNHS useruseruserMixedWhiteAsianBlackcarerworkerstaffstaffchildrenpensionerPensionerOtheroccupierrenterrenterTotal
(v)(u)(t)(s)(r)(q)(p)(o)(n)(m)(l)(k)(j)(i)(h)(g)(f)(e)(d)(c)(b)(a)(z)1001304652104*89746853311**74778*15925038*29252*30547522110**6401781731001Weighted Total
11--11--1--1-----1-1--1Re-instate matrons**--**--*--*-----*-*--*33--3-3-3--1-1-111-3--3Removing PCTs*1%zt--*-*-*--*-*-***-*--*321-32112--1-21111-3--3Staff pensions*1%*-***10%*--*-1%2%z***-*--*
26716123816-20229-11371161166124Other3%2%2%1%3%2%3%-3%2%1%3%-4%5%2%2%3%8%3%3%1%2%
3813259301821-31259-11111226-2251239Not heard of any changes4%4%4%9%zr3%4%4%-4%3%3%4%-4%1%3%5%3%-3%3%7%zc4%r
2-1-22--2--1----11-2--2No answer*-*-**--*--*----**-*--*
383105256453401891963274396685139561311688552387170385Don't know38%35%39%43%38%40%37%31%37%50%zn42%34%h34%h32%h12%43%f35%39%52%37%40%41%38%hi
Public Perceptions of the NHS and Social CareFINAL PUBLIC
Table 76Q14. As far as you know, what do the government's changes to the NHS involve? What else?
Base : All respondents
Respondent type : General public aged 16+ Fieldwork dates : 14th November - 9th December 2011Source : Ipsos MORI (JN10-039262-01)Proportions/Means: Columns Tested (5% risk level) - z/a/b/c/d - z/e/f/g - z/h/i/j/k - z/l/m/n/o - z/p/q - z/r/s - z/t/u - z/vOverlap formulae used. * small base; ** very small base (under 30) ineligible for sig testing

UnwtdtotalFuture of NHSSatisfaction with NHSGOR
DisYorkshire &WestEastWtd.WorseSameBettersatisfiedSatisfiedHumbersideMidlandsSouth-WestSouth-EastNorth-WestNorth-EastLondonEasternMidlandsTotal
(o)(n)(m)(l)(k)(j)(i)(h)(g)(f)(e)(d)(c)(b)(a)(z)1001328298343168703909910715413955143126881001Unweighted Total1001327302340168701100*106*10216213651*14810986*1001Weighted Total
3011186911461210384433393413552922306Cuts30%36%zm23%34%m36%30%38%ef41%zabef32%24%25%26%37%ef26%26%31%m
68231133104911215582816269Necessary/positive7%7%4%10%zm6%7%11%afh2%14%zacdefh3%6%4%5%15%zacdefh2%7%fmcuts (general mention)
10743233916791411122315511136110Negative/ damaging/11%13%m8%12%10%11%14%11%12%14%11%9%7%12%7%11%mtoo many cuts (general
mention)
5725141817391285365122558Cuts in managers6%7%5%5%10%zj6%12%zbef8%f5%2%4%9%bf8%bf2%5%6%f
5020131714354114625132451Cuts in bureaucracy5%6%4%5%8%5%4%10%zbe4%4%1%9%be9%zbe2%5%5%be
6422103016443124684194363Hospital closures6%7%3%9%zm10%6%3%12%zbfgi4%4%6%7%13%zabfgi3%4%6%m
82401430205810201873206986Cuts in frontline8%12%zm5%9%12%8%10%g19%zbdefg1%5%5%7%g14%zbefg6%g11%g9%gmservices
103-617-5-11-11-10Cuts in quangos1%1%-2%m1%1%-5%zacefgi-1%1%-1%1%-1%
3071058211454209193029602610604028302Organisational Change31%32%27%33%32%30%19%28%29%37%dei19%20%41%zdehi36%dei32%e30%ei
1334636482882811123247252011130Doctors and other13%14%12%14%17%12%8%10%e12%e19%zei3%13%e17%e19%zei13%e13%ehealth care
professionalscommissioningservices/ having moreof a say in how theNHS is run
93362830166619732312291094Organisational9%11%9%9%9%9%1%9%ei6%20%zbdeghi2%2%15%zdegi9%ei12%dei9%deichanges/
reconfiguration(general mention)
1455533552410313181421184261714144Privatisation/ more14%17%m11%16%m15%15%13%17%13%13%13%7%18%16%16%14%mservices provided by
private sector
281341061712233-104227More care available3%4%1%3%4%2%1%2%2%2%2%-7%zfi4%2%3%outside of hospital
1763861012----121117More services provided2%2%1%2%4%z1%1%2%----8%zabdefghi1%1%2%by charity sector
49161120636355623176148Access to Services5%5%4%6%4%5%3%5%5%4%2%5%11%zaefi6%1%5%e
1949621512332-24118Faster access to2%1%3%2%1%2%1%2%3%2%2%-1%4%1%2%hospitals/ shorter
hospital waiting times
21741131613-212101121Faster access to GPs/2%2%1%3%2%2%1%3%-1%1%3%7%zabefg1%1%2%shorter GP waiting
times
Public Perceptions of the NHS and Social CareFINAL PUBLIC
Table 77Q14. As far as you know, what do the government's changes to the NHS involve? What else?
Base : All respondents
Respondent type : General public aged 16+ Fieldwork dates : 14th November - 9th December 2011Source : Ipsos MORI (JN10-039262-01)Proportions/Means: Columns Tested (5% risk level) - z/a/b/c/d/e/f/g/h/i - z/j/k - z/l/m/n - z/oOverlap formulae used. * small base

UnwtdtotalFuture of NHSSatisfaction with NHSGOR
DisYorkshire &WestEastWtd.WorseSameBettersatisfiedSatisfiedHumbersideMidlandsSouth-WestSouth-EastNorth-WestNorth-EastLondonEasternMidlandsTotal
(o)(n)(m)(l)(k)(j)(i)(h)(g)(f)(e)(d)(c)(b)(a)(z)1001327302340168701100*106*10216213651*14810986*1001Weighted Total
146161101121-162-13Longer waiting times1%2%*2%1%1%1%1%2%1%-2%4%ze2%-1%m
591615221338161855235457Choice of Services6%5%5%6%8%5%1%6%1%5%3%10%gi16%zabefghi4%5%6%gi
1013417---1136--11More choice for1%*1%1%1%1%---1%1%6%zabefghi4%zb--1%patients (general
mention)
24641181311-132112222Patients can choose2%2%1%3%5%zj2%1%1%-1%2%3%7%zfghi2%2%2%their GP/GP surgery
27581261712155182227More choice for3%2%3%4%3%2%1%2%1%3%3%2%6%z1%2%3%patients over where
they get treated
20647314-3-32271219Patients having more2%2%1%2%2%2%-3%-2%1%3%5%zgi1%3%2%say in their
healthcare
10227284020652310171252581598Other10%8%9%12%12%9%2%3%10%i11%hi9%i10%i17%zbehi7%17%zbhi10%hi
2688941913273-81126Budget ring-fenced/3%3%3%3%2%3%1%3%2%5%2%-5%1%1%3%protected spending
11442151--21-6-110Encouraging people to1%1%1%1%1%1%1%--1%1%-4%zbg-1%1%take responsibility
for their own health
131310111--132151-13Better quality1%*1%3%zn1%2%--1%2%2%1%4%z1%-1%nservices for patients
6-2214-----33--6New non-emergency1%-1%1%1%1%-----5%zabefghi2%z--1%telephone number '111'
21-11---2------2Allocation of funds/**-**---2%z------*saving money
33---2--1-----23Better management/*1%z---*--1%-----3%zf*efficiency
642-14---111--36Funding cuts1%1%l1%-1%1%---1%1%2%--3%zc1%722233-----11236GPs responsible for1%1%1%1%2%*-----2%1%1%3%zef1%their own budgets
2-2-11------1-12More funding*-1%-1%*------1%-1%*831435--1-3---37Reduction in staff1%1%*1%2%1%--1%-2%---4%zbcfh1%1-1--1--------11Re-instate matrons*-*--*--------1%z*312-11-------123Removing PCTs**1%-1%*-------1%2%z*
Public Perceptions of the NHS and Social CareFINAL PUBLIC
Table 77Q14. As far as you know, what do the government's changes to the NHS involve? What else?
Base : All respondents
Respondent type : General public aged 16+ Fieldwork dates : 14th November - 9th December 2011Source : Ipsos MORI (JN10-039262-01)Proportions/Means: Columns Tested (5% risk level) - z/a/b/c/d/e/f/g/h/i - z/j/k - z/l/m/n - z/oOverlap formulae used. * small base

UnwtdtotalFuture of NHSSatisfaction with NHSGOR
DisYorkshire &WestEastWtd.WorseSameBettersatisfiedSatisfiedHumbersideMidlandsSouth-WestSouth-EastNorth-WestNorth-EastLondonEasternMidlandsTotal
(o)(n)(m)(l)(k)(j)(i)(h)(g)(f)(e)(d)(c)(b)(a)(z)1001327302340168701100*106*10216213651*14810986*1001Weighted Total
3-1211--2-----13Staff pensions*-*1%1%*--2%z-----1%*
268313715--442-44624Other3%2%1%4%zm4%2%--4%hi2%2%-3%4%h6%zhi2%m
381414109254225653-1139Not heard of any changes4%4%4%3%6%4%4%b2%2%3%4%b9%bcg2%-13%zbcefghi4%b
21-1111-------12No answer**-*1%*1%-------1%*
38311013511955271423641686721484219385Don't know38%34%45%zln35%33%39%42%a34%40%a42%a49%zach42%a32%39%a22%38%an
Public Perceptions of the NHS and Social CareFINAL PUBLIC
Table 77Q14. As far as you know, what do the government's changes to the NHS involve? What else?
Base : All respondents
Respondent type : General public aged 16+ Fieldwork dates : 14th November - 9th December 2011Source : Ipsos MORI (JN10-039262-01)Proportions/Means: Columns Tested (5% risk level) - z/a/b/c/d/e/f/g/h/i - z/j/k - z/l/m/n - z/oOverlap formulae used. * small base

UnwtdPrivate healthSatisfaction withImpact of NHS reformsGovernment has righttotalinsurancesocial careon patientsNHS policyNHS use in last year
SocialNHSDissatisficareWalk InChoicesPharmacistWtd.
NoYesedSatisfiedWorseBetterDisagreeAgreeservicesClinicwebsite/ChemistNHS DirectA&EOutpatientInpatientGPTotal(r)(q)(p)(o)(n)(m)(l)(k)(j)(i)(h)(g)(f)(e)(d)(c)(b)(a)(z)10018151704424938220040326945182553001772253931967801001Unweighted Total100181117544*24437920139327642*18856*3011832303761927731001Weighted Total
301253501473183531427712641991568311858241306Cuts30%31%29%33%30%48%zl27%36%zj28%29%34%34%30%30%36%z31%30%31%31%68521641040173026414317121823105369Necessary/positive7%6%9%10%4%10%z9%8%10%8%7%5%6%7%8%6%5%7%7%ncuts (general mention)
107872142875952253285342430451990110Negative/ damaging/11%11%12%8%12%20%zl4%13%9%8%15%8%11%13%13%12%10%12%11%ltoo many cuts (general
mention)
5751741927152813-14221111915104758Cuts in managers6%6%4%9%8%7%7%7%5%-8%c4%7%c6%8%c4%5%6%c6%c
504296142714277211316131917104351Cuts in bureaucracy5%5%5%13%z6%7%z7%7%zj3%5%6%6%5%7%8%zc5%5%6%5%j
6453103154843813212523111729145463Hospital closures6%7%6%6%6%13%zl2%10%zj5%4%6%9%8%6%7%8%7%7%6%l
8271153176764319618924143134206186Cuts in frontline8%9%8%8%7%18%zl3%11%z7%15%9%16%zaef8%8%13%zacef9%10%8%9%lservices
1072-2715213343451810Cuts in quangos1%1%1%-1%2%z*1%1%2%2%5%zabcf1%2%2%1%*1%1%
3072366527681436715570135122111556012449258302Organisational Change31%29%37%zq61%zn28%38%z33%39%zj25%31%27%39%bd37%zbdh30%26%33%bd26%33%zbdh30%j
1339436123655337026825135135245718107130Doctors and other13%12%20%zq27%zn15%15%16%18%zj9%18%13%23%zabd17%zbd19%zabd10%15%bd10%14%13%jqhealth care
professionalscommissioningservices/ having moreof a say in how theNHS is run
937124141939274329619737151939127994Organisational9%9%14%33%zn8%10%14%z11%11%14%10%13%12%b8%8%10%b6%10%9%changes/
reconfiguration(general mention)
14511231112787188628623105629375625126144Privatisation/ more14%14%18%26%zn11%23%zl9%22%zj10%13%12%18%19%zbh16%16%15%13%16%z14%jlservices provided by
private sector
282433471111714111781682427More care available3%3%2%7%n2%2%5%zm3%2%2%2%2%4%4%4%4%z4%3%3%outside of hospital
1717-3265122--1425541617More services provided2%2%-7%zn1%1%3%3%zj1%--2%1%1%2%1%2%2%2%by charity sector
49361051021162511172157142184048Access to Services5%4%6%11%z4%5%8%z6%4%2%4%3%5%4%6%5%4%5%5%
19115344974-31646841518Faster access to2%1%3%7%zn2%1%5%zm2%2%-2%2%2%2%3%2%2%2%2%qhospitals/ shorter
hospital waiting times
Public Perceptions of the NHS and Social CareFINAL PUBLIC
Table 78Q14. As far as you know, what do the government's changes to the NHS involve? What else?
Base : All respondents
Respondent type : General public aged 16+ Fieldwork dates : 14th November - 9th December 2011Source : Ipsos MORI (JN10-039262-01)Proportions/Means: Columns Tested (5% risk level) - z/a/b/c/d/e/f/g/h/i - z/j/k - z/l/m - z/n/o - z/p/q - z/rOverlap formulae used. * small base
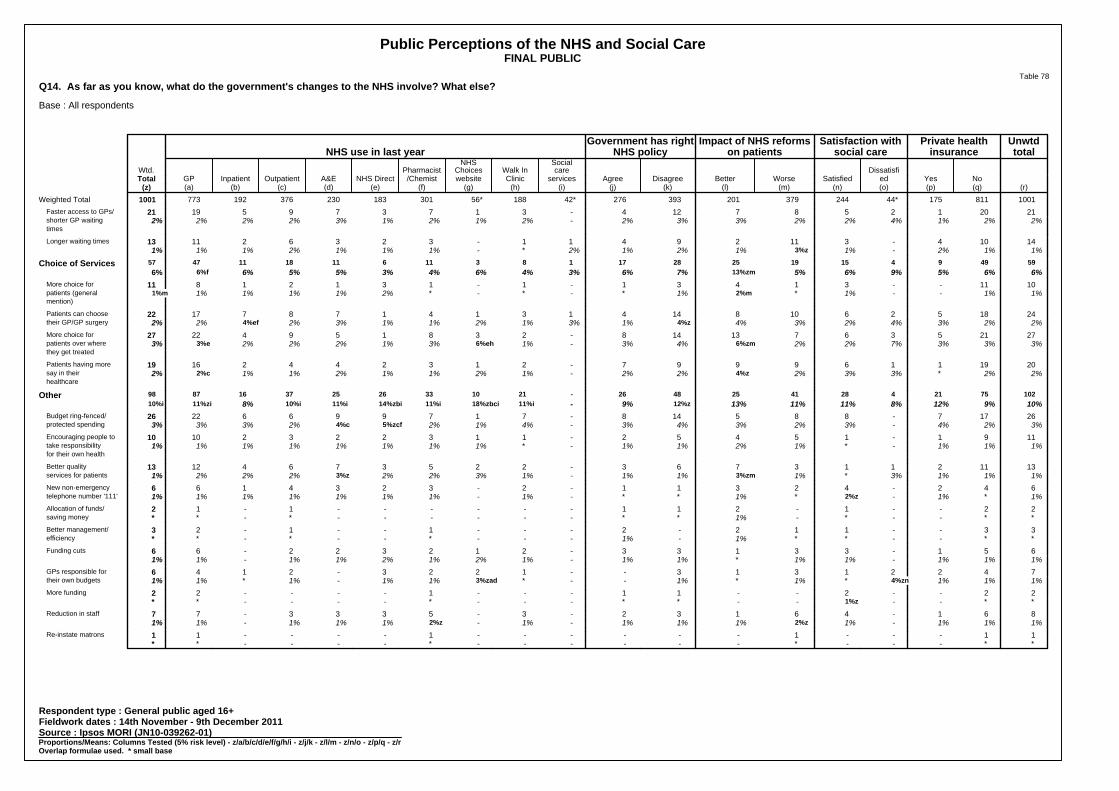
UnwtdPrivate healthSatisfaction withImpact of NHS reformsGovernment has righttotalinsurancesocial careon patientsNHS policyNHS use in last year
SocialNHSDissatisficareWalk InChoicesPharmacistWtd.
NoYesedSatisfiedWorseBetterDisagreeAgreeservicesClinicwebsite/ChemistNHS DirectA&EOutpatientInpatientGPTotal(r)(q)(p)(o)(n)(m)(l)(k)(j)(i)(h)(g)(f)(e)(d)(c)(b)(a)(z)100181117544*24437920139327642*18856*3011832303761927731001Weighted Total
212012587124-31737951921Faster access to GPs/2%2%1%4%2%2%3%3%2%-2%1%2%1%3%2%2%2%2%shorter GP waiting
times
14104-31129411-323621113Longer waiting times1%1%2%-1%3%z1%2%1%2%*-1%1%1%2%1%1%1%
59499415192528171831161118114757Choice of Services6%6%5%9%6%5%13%zm7%6%3%4%6%4%3%5%5%6%6%f6%
1011--31431-1-13121811More choice for1%1%--1%*2%m1%*-*-*2%1%1%1%1%1%mpatients (general
mention)
2418526108144131417871722Patients can choose2%2%3%4%2%3%4%4%z1%3%1%2%1%1%3%2%4%ef2%2%their GP/GP surgery
2721536713148-23815942227More choice for3%3%3%7%2%2%6%zm4%3%-1%6%eh3%1%2%2%2%3%e3%patients over where
they get treated
20191169997-21324421619Patients having more2%2%*3%3%2%4%z2%2%-1%2%1%1%2%1%1%2%c2%say in their
healthcare
102752142841254826-211033262537168798Other10%9%12%8%11%11%13%12%z9%-11%i18%zbci11%i14%zbi11%i10%i8%11%zi10%i
26177-885148-71799662226Budget ring-fenced/3%2%4%-3%2%3%4%3%-4%1%2%5%zcf4%c2%3%3%3%protected spending
1191-15452-11322321010Encouraging people to1%1%1%-*1%2%1%1%-*1%1%1%1%1%1%1%1%take responsibility
for their own health
13112113763-22537641213Better quality1%1%1%3%*1%3%zm1%1%-1%3%2%2%3%z2%2%2%1%services for patients
642-42311-2-3234166New non-emergency1%*1%-2%z*1%**-1%-1%1%1%1%1%1%1%telephone number '111'
22--1-211------1-12Allocation of funds/**--*-1%**------*-**saving money
33--112-2---1--1-23Better management/**--**1%-1%---*--*-**efficiency
651-33133-212322-66Funding cuts1%1%1%-1%1%*1%1%-1%2%1%2%1%1%-1%1%74221313--1223-2146GPs responsible for1%1%1%4%zn*1%*1%--*3%zad1%1%-1%*1%1%their own budgets
22--2--11---1----22More funding**--1%z--**---*----**861-46132-3-5333-77Reduction in staff1%1%1%-1%2%z1%1%1%-1%-2%z1%1%1%-1%1%11---1------1----11Re-instate matrons**---*------*----**
Public Perceptions of the NHS and Social CareFINAL PUBLIC
Table 78Q14. As far as you know, what do the government's changes to the NHS involve? What else?
Base : All respondents
Respondent type : General public aged 16+ Fieldwork dates : 14th November - 9th December 2011Source : Ipsos MORI (JN10-039262-01)Proportions/Means: Columns Tested (5% risk level) - z/a/b/c/d/e/f/g/h/i - z/j/k - z/l/m - z/n/o - z/p/q - z/rOverlap formulae used. * small base

UnwtdPrivate healthSatisfaction withImpact of NHS reformsGovernment has righttotalinsurancesocial careon patientsNHS policyNHS use in last year
SocialNHSDissatisficareWalk InChoicesPharmacistWtd.
NoYesedSatisfiedWorseBetterDisagreeAgreeservicesClinicwebsite/ChemistNHS DirectA&EOutpatientInpatientGPTotal(r)(q)(p)(o)(n)(m)(l)(k)(j)(i)(h)(g)(f)(e)(d)(c)(b)(a)(z)100181117544*24437920139327642*18856*3011832303761927731001Weighted Total
33-1-2-2---1-1-3-33Removing PCTs**-2%zn-*-*---2%f-*-1%-**33--22-3---2111--33Staff pensions**--1%*-1%---3%zabcdfh*1%*--**
2618615152155-6511761422224Other3%2%4%2%2%4%zl1%4%z2%-3%9%zabd4%b4%2%4%b1%3%2%
38363177711121811161113112639Not heard of any changes4%4%2%2%3%2%3%3%4%2%4%2%4%4%5%3%6%3%4%m
211-21--2---2----22No answer**1%-1%z*--1%---1%----**
383307681293786811611421721699698313177278385Don't know38%38%39%28%38%20%34%m29%41%k51%acfg38%28%33%38%36%35%40%36%38%afkm
Public Perceptions of the NHS and Social CareFINAL PUBLIC
Table 78Q14. As far as you know, what do the government's changes to the NHS involve? What else?
Base : All respondents
Respondent type : General public aged 16+ Fieldwork dates : 14th November - 9th December 2011Source : Ipsos MORI (JN10-039262-01)Proportions/Means: Columns Tested (5% risk level) - z/a/b/c/d/e/f/g/h/i - z/j/k - z/l/m - z/n/o - z/p/q - z/rOverlap formulae used. * small base

Q14. As far as you know, what do the government's changes tothe NHS involve? What else?
Doctors andothers
commissioningCuts inservices/having
managers/more say in howPrivatisationbureaucracyNegative cutsNHS is runTotal
145862051331001Unweighted Total144872111301001Weighted Total
458721135306Cuts31%100%100%27%31%8823869Necessary/positive6%9%11%6%7%cuts (general mention)
1371108110Negative/ damaging/9%8%52%6%11%too many cuts (general
mention)
45824958Cuts in managers3%67%11%7%6%
115123851Cuts in bureaucracy8%59%11%6%5%
121663563Hospital closures8%18%30%4%6%
172086486Cuts in frontline12%23%41%3%9%services
266310Cuts in quangos1%7%3%2%1%
1443358130302Organisational Change100%38%27%100%30%381515130130Doctors and other26%17%7%100%13%health care
professionalscommissioningservices/ having moreof a say in how theNHS is run
328162594Organisational22%10%7%19%9%changes/
reconfiguration(general mention)
144143438144Privatisation/ more100%16%16%29%14%services provided by
private sector
5371227More care available4%3%3%9%3%outside of hospital
839517More services provided5%3%4%4%2%by charity sector
10520948Access to Services7%6%9%7%5%312418Faster access to2%1%1%3%2%hospitals/ shorter
hospital waiting times
539421Faster access to GPs/3%3%4%3%2%shorter GP waiting
times
Public Perceptions of the NHS and Social CareFINAL PUBLIC
Table 79Q14. As far as you know, what do the government's changes to the NHS involve? What else?
Base : All respondents
Respondent type : General public aged 16+ Fieldwork dates : 14th November - 9th December 2011Source : Ipsos MORI (JN10-039262-01)

Q14. As far as you know, what do the government's changes tothe NHS involve? What else?
Doctors andothers
commissioningCuts inservices/having
managers/more say in howPrivatisationbureaucracyNegative cutsNHS is runTotal
144872111301001Weighted Total3110213Longer waiting times2%1%5%1%1%
1312161157Choice of Services9%14%8%8%6%542411More choice for3%5%1%3%1%patients (general
mention)
5511322Patients can choose4%5%5%2%2%their GP/GP surgery
436527More choice for2%3%3%4%3%patients over where
they get treated
415319Patients having more3%1%2%2%2%say in their
healthcare
2210202598Other16%11%9%19%10%726826Budget ring-fenced/5%2%3%6%3%protected spending
343410Encouraging people to2%4%1%3%1%take responsibility
for their own health
314113Better quality2%1%2%1%1%services for patients
13216New non-emergency1%4%1%1%1%telephone number '111'
2---2Allocation of funds/1%---*saving money
1---3Better management/1%---*efficiency
----6Funding cuts----1%--126GPs responsible for--*1%1%their own budgets
----2More funding----*-11-7Reduction in staff-1%*-1%----1Re-instate matrons----*---13Removing PCTs---1%*1---3Staff pensions1%---*
Public Perceptions of the NHS and Social CareFINAL PUBLIC
Table 79Q14. As far as you know, what do the government's changes to the NHS involve? What else?
Base : All respondents
Respondent type : General public aged 16+ Fieldwork dates : 14th November - 9th December 2011Source : Ipsos MORI (JN10-039262-01)

Q14. As far as you know, what do the government's changes tothe NHS involve? What else?
Doctors andothers
commissioningCuts inservices/having
managers/more say in howPrivatisationbureaucracyNegative cutsNHS is runTotal
144872111301001Weighted Total7141024Other5%1%2%8%2%----39Not heard of any changes----4%----2No answer----*----385Don't know----38%
Public Perceptions of the NHS and Social CareFINAL PUBLIC
Table 79Q14. As far as you know, what do the government's changes to the NHS involve? What else?
Base : All respondents
Respondent type : General public aged 16+ Fieldwork dates : 14th November - 9th December 2011Source : Ipsos MORI (JN10-039262-01)

UnwtdtotalWork StatusSocial GradeAgeGender
Full/part-Wtd.OtherUnemployedRetiredtimeDEC2C1AB65+55-6435-5425-3416-24FemaleMaleTotal
(p)(o)(n)(m)(l)(k)(j)(i)(h)(g)(f)(e)(d)(c)(b)(a)(z)1001162612705082472013062472201693311581235274741001Unweighted Total100115758*2355512392013122491981433501671435154861001Weighted Total
236441093744484391323Much better2%4%6%zlm2%2%4%2%2%2%2%2%2%2%2%2%3%2%
177281341954826545137176029349484178A little better18%18%23%18%17%20%j13%17%20%j19%12%17%18%24%f18%17%18%fj
23035947141474582584234784534112120232Neither better nor worse23%22%16%20%26%20%23%26%23%21%23%22%27%24%22%25%23%
229261551138445172634030943630118112230A little worse23%17%26%22%25%o19%25%23%25%20%21%27%z21%21%23%23%23%o
1532153886313445392840512388267150Much worse15%13%8%16%16%13%17%14%16%14%c28%zcdeg15%c14%c6%16%14%15%c
1894112548161425234471958303410089188Don't know19%26%zl21%23%zl15%25%zhi21%h17%13%24%zef13%17%18%24%f19%18%19%fhl
20034174510556296155412169333710397201Better20%22%29%19%19%24%j14%19%22%j21%14%20%20%26%f20%20%20%fj
382472089224758511710268701455938200179379Worse38%30%35%38%41%o32%42%k38%41%k34%49%zcdg41%c35%26%39%37%38%cko
-182-12-3-44-119-19-56-56-47-27-49-76-25-1-97-82-179Net better-18%-8%-6%-19%-22%-8%-28%-18%-19%-14%-34%-22%-15%*-19%-17%-18%
Public Perceptions of the NHS and Social CareFINAL PUBLIC
Table 80Q15. And thinking about these changes overall, from what you know, how much better or worse do you think services will be for patients?
Base : All respondents
Respondent type : General public aged 16+ Fieldwork dates : 14th November - 9th December 2011Source : Ipsos MORI (JN10-039262-01)Proportions/Means: Columns Tested (5% risk level) - z/a/b - z/c/d/e/f/g - z/h/i/j/k - z/l/m/n/o - z/pOverlap formulae used. * small base

People aretreated with
Unwtddignity andtotalrespectNHS useHospital useEthnicityNHS/social care staffHousehold TypeHome Ownership
NotAdultshospitalHospitalInformalSocialwith
Non NHS/A&E/A&EsocialcareKnow NHSNHSdependentNon-Owner -PrivateSocialWtd.DisagreeAgreeuserNHS useruseruserMixedWhiteAsianBlackcarerworkerstaffstaffchildrenpensionerPensionerOtheroccupierrenterrenterTotal
(v)(u)(t)(s)(r)(q)(p)(o)(n)(m)(l)(k)(j)(i)(h)(g)(f)(e)(d)(c)(b)(a)(z)100130864710090145854310750741612543628951291461249106491691731001Unweighted Total1001304652104*89746853311**74778*15925038*29252*30547522110**6401781731001Weighted Total
236163201211-158-616-797-105823Much better2%2%2%3%2%2%2%-2%10%zln-2%3%2%-2%2%3%-2%3%5%zc2%c
1773613321157879121302124447525469339-1153033178A little better18%12%20%zu20%18%19%17%19%17%27%zln15%18%17%18%10%15%20%18%-18%17%19%18%u
23066160351971171152168144652116914701194331433947232Neither better nor worse23%22%25%33%zr22%25%22%21%22%18%29%21%28%24%27%23%25%19%28%22%22%27%23%r
22976143202101131175178143356963147810547-1564232230A little worse23%25%22%19%23%24%22%50%24%17%21%23%22%21%28%25%22%21%-24%24%19%23%
153717361445594-12332254755133976341982526150Much worse15%23%zt11%6%16%zs12%18%zq-17%zm4%14%m22%z19%19%z25%13%16%15%10%15%14%15%15%mqst
1894812819169841041134193437449665725161193627188Don't know19%16%20%18%19%18%20%10%18%24%22%15%11%17%11%21%f15%23%f61%19%20%16%19%f
200421482417798102214529245085755310246-1253541201Better20%14%23%zu23%20%21%19%19%19%37%zln15%20%20%20%10%17%21%21%-20%20%24%20%u
382147215263531682115301165511016117271171818112536758379Worse38%48%zt33%25%39%zs36%40%50%40%zm21%34%m44%z41%40%52%z38%38%37%10%40%38%34%38%mst
-182-105-67-2-177-70-109-3-15612-31-60-8-60-22-64-80-35-1-128-32-17-179Net better-18%-35%-10%-2%-20%-15%-20%-31%-21%16%-19%-24%-21%-20%-43%-21%-17%-16%-10%-20%-18%-10%-18%
Public Perceptions of the NHS and Social CareFINAL PUBLIC
Table 81Q15. And thinking about these changes overall, from what you know, how much better or worse do you think services will be for patients?
Base : All respondents
Respondent type : General public aged 16+ Fieldwork dates : 14th November - 9th December 2011Source : Ipsos MORI (JN10-039262-01)Proportions/Means: Columns Tested (5% risk level) - z/a/b/c/d - z/e/f/g - z/h/i/j/k - z/l/m/n/o - z/p/q - z/r/s - z/t/u - z/vOverlap formulae used. * small base; ** very small base (under 30) ineligible for sig testing

UnwtdtotalFuture of NHSSatisfaction with NHSGOR
DisYorkshire &WestEastWtd.WorseSameBettersatisfiedSatisfiedHumbersideMidlandsSouth-WestSouth-EastNorth-WestNorth-EastLondonEasternMidlandsTotal
(o)(n)(m)(l)(k)(j)(i)(h)(g)(f)(e)(d)(c)(b)(a)(z)1001328298343168703909910715413955143126881001Unweighted Total1001327302340168701100*106*10216213651*14810986*1001Weighted Total
235810217-2439-21223Much better2%1%3%3%1%2%-2%4%2%6%zbci-1%1%2%2%
177487552171371614183121838238178A little better18%15%25%zln15%10%19%zk16%13%17%19%16%16%26%zaeh21%a9%18%ak
23053977629168241435372913372419232Neither better nor worse23%16%32%zln22%n17%24%24%13%34%zbefh23%21%25%25%h22%22%23%hkn
229943210043158272915372212263328230A little worse23%29%zm11%29%zm26%23%27%g27%g14%23%16%24%18%30%zceg33%zceg23%gm
15381562488811241617285221216150Much worse15%25%zlm2%18%zm28%zj13%11%23%zbfi15%10%21%zbf10%15%11%19%15%jm
18947854029133212316372612231613188Don't know19%14%28%zln12%17%19%21%22%15%23%19%24%16%15%15%19%ln
2005383622015416162134308402410201Better20%16%27%zln18%12%22%zk16%15%21%21%22%16%27%zah22%12%20%akn
3821743716291246385330545118484444379Worse38%53%zm12%48%zm54%zj35%38%50%zcfg30%33%37%35%32%41%51%zcefg38%jm
-182-12146-100-71-92-21-37-9-20-20-10-8-20-34-179Net better-18%-37%15%-29%-42%-13%-21%-35%-9%-12%-15%-19%-5%-18%-40%-18%
Public Perceptions of the NHS and Social CareFINAL PUBLIC
Table 82Q15. And thinking about these changes overall, from what you know, how much better or worse do you think services will be for patients?
Base : All respondents
Respondent type : General public aged 16+ Fieldwork dates : 14th November - 9th December 2011Source : Ipsos MORI (JN10-039262-01)Proportions/Means: Columns Tested (5% risk level) - z/a/b/c/d/e/f/g/h/i - z/j/k - z/l/m/n - z/oOverlap formulae used. * small base

UnwtdPrivate healthSatisfaction withImpact of NHS reformsGovernment has righttotalinsurancesocial careon patientsNHS policyNHS use in last year
SocialNHSDissatisficareWalk InChoicesPharmacistWtd.
NoYesedSatisfiedWorseBetterDisagreeAgreeservicesClinicwebsite/ChemistNHS DirectA&EOutpatientInpatientGPTotal(r)(q)(p)(o)(n)(m)(l)(k)(j)(i)(h)(g)(f)(e)(d)(c)(b)(a)(z)10018151704424938220040326945182553001772253931967801001Unweighted Total100181117544*24437920139327642*18856*3011832303761927731001Weighted Total
2319314-23513-7-342961523Much better2%2%2%3%1%-11%zm1%5%zk-4%df-1%2%1%3%3%d2%2%km
17714233650-178388554154626376737128178A little better18%18%19%13%21%-89%zm10%31%zk11%22%efg9%15%14%16%18%19%17%18%km
230190381050--6672841126443497845171232Neither better nor worse23%23%22%23%20%--17%26%k19%22%22%21%24%21%21%24%22%23%klm
229180451058230-115491139138645637332190230A little worse23%22%26%23%24%61%zl-29%zj18%26%21%23%29%zbch25%b28%bc19%17%25%zbc23%bcjl
153120281042150-114111136185836457133127150Much worse15%15%16%23%17%39%zl-29%zj4%27%z19%31%zabcdef19%z20%20%z19%z17%16%z15%jl
h
18916027741--564472384429357739142188Don't know19%20%16%16%17%--14%16%17%12%14%15%16%15%20%dfh20%fh18%fh19%fhklm
20016136754-201429954854930387743143201Better20%20%21%15%22%-100%zm11%36%zk11%25%adefgi9%16%16%17%20%g22%fg18%20%agkm
3823007420100379-229612276311448110814465317379Worse38%37%42%46%41%100%zl-58%zj22%53%zbc40%55%zabch48%zabc44%b47%zabc38%34%41%zb38%jl
-182-139-38-14-46-379201-18738-17-28-26-95-51-70-67-22-174-179Net better-18%-17%-22%-31%-19%-100%100%z-48%14%-42%-15%-46%-31%-28%-30%-18%-12%-23%-18%
Public Perceptions of the NHS and Social CareFINAL PUBLIC
Table 83Q15. And thinking about these changes overall, from what you know, how much better or worse do you think services will be for patients?
Base : All respondents
Respondent type : General public aged 16+ Fieldwork dates : 14th November - 9th December 2011Source : Ipsos MORI (JN10-039262-01)Proportions/Means: Columns Tested (5% risk level) - z/a/b/c/d/e/f/g/h/i - z/j/k - z/l/m - z/n/o - z/p/q - z/rOverlap formulae used. * small base

UnwtdtotalWork StatusSocial GradeAgeGender
Full/part-Wtd.OtherUnemployedRetiredtimeDEC2C1AB65+55-6435-5425-3416-24FemaleMaleTotal
(p)(o)(n)(m)(l)(k)(j)(i)(h)(g)(f)(e)(d)(c)(b)(a)(z)61881331733311291181931781361172168663307311618Unweighted Total61877*32*1503581231181961791229923091*74*300317616Weighted Total16413833733353261016Much better3%5%3%2%2%2%3%3%2%2%3%2%3%3%2%3%3%
11712731663018363326124418165166117A little better19%16%23%21%19%24%15%18%19%21%12%19%20%22%17%21%19%f
14519634862727514130225319216779146Neither better nor worse23%25%20%23%24%22%23%26%23%25%22%23%21%28%22%25%24%
174209381072937545530237526218490174A little worse28%26%29%25%30%23%31%28%31%25%23%33%28%28%28%29%28%
1301643375233039352435421987355127Much worse21%21%12%22%21%19%25%20%20%19%35%zcdeg18%21%11%24%za17%21%ac
36641115124911941166191636Don't know6%7%13%l7%4%10%zj3%4%6%8%4%5%7%8%6%5%6%
13316834753321433629154921195677133Better22%21%26%23%21%27%18%22%20%24%15%21%24%25%19%24%22%f
3043613711825267949054581174528157145302Worse49%47%41%47%51%42%57%k48%50%44%58%zcg51%49%39%52%46%49%
-171-20-5-37-107-18-46-51-54-25-43-68-23-10-100-69-169Net-28%-26%-15%-24%-30%-15%-39%-26%-30%-20%-44%-29%-25%-13%-33%-22%-27%
Public Perceptions of the NHS and Social CareFINAL PUBLIC
Table 84Q15. And thinking about these changes overall, from what you know, how much better or worse do you think services will be for patients?
Base : All respondents who state a change being made to the NHS
Respondent type : General public aged 16+ Fieldwork dates : 14th November - 9th December 2011Source : Ipsos MORI (JN10-039262-01)Proportions/Means: Columns Tested (5% risk level) - z/a/b - z/c/d/e/f/g - z/h/i/j/k - z/l/m/n/o - z/pOverlap formulae used. * small base

People aretreated with
Unwtddignity andtotalrespectNHS useHospital useEthnicityNHS/social care staffHousehold TypeHome Ownership
NotAdultshospitalHospitalInformalSocialwith
Non NHS/A&E/A&EsocialcareKnow NHSNHSdependentNon-Owner -PrivateSocialWtd.DisagreeAgreeuserNHS useruseruserMixedWhiteAsianBlackcarerworkerstaffstaffchildrenpensionerPensionerOtheroccupierrenterrenterTotal
(v)(u)(t)(s)(r)(q)(p)(o)(n)(m)(l)(k)(j)(i)(h)(g)(f)(e)(d)(c)(b)(a)(z)618202394575612743447475379516824197451662991535410101102618Unweighted Total61819939660*5562793378**47339*93*16526**19846*1743071365**402107*103*616Weighted Total166921478-124-415-466-84416Much better3%3%2%4%2%3%3%-3%10%zln-2%4%3%-2%2%4%-2%3%4%3%
11730831310457602871017313374296227-772020117A little better19%15%21%21%19%20%18%27%18%25%19%19%12%19%9%16%20%20%-19%18%20%19%
14542100221247175210992432748124076302932428146Neither better nor worse23%21%25%36%zr22%25%22%30%23%25%26%19%29%24%25%23%25%22%36%23%22%27%24%r
1745011615159868931369264184914607737-1203124174A little worse28%25%29%25%29%31%26%42%29%24%28%25%30%25%29%35%zf25%27%-30%29%23%28%
130596441244384-10521947648133466271822420127Much worse21%30%zt16%6%22%zs16%25%zq-22%m5%20%m28%z25%24%28%20%21%20%22%21%23%19%21%mqst
3611235311520-245711-11471992215736Don't know6%6%6%8%6%6%6%-5%12%8%7%-6%9%4%6%7%42%5%5%7%6%
13336921511864692991317354424326832-852324133Better22%18%23%25%21%23%20%27%21%35%z19%21%h16%21%h9%19%22%24%-21%22%24%22%h
304109180192831291733241114588149726951436412025544302Worse49%55%zt46%31%51%zs46%51%42%51%m29%48%m53%54%49%57%55%47%47%22%50%51%43%49%mst
-171-73-88-4-165-65-104-1-1422-27-53-10-55-22-62-75-32-1-117-32-19-169Net-28%-37%-22%-7%-30%-23%-31%-15%-30%6%-29%-32%-38%-28%-49%-36%-24%-24%-22%-29%-29%-19%-27%
Public Perceptions of the NHS and Social CareFINAL PUBLIC
Table 85Q15. And thinking about these changes overall, from what you know, how much better or worse do you think services will be for patients?
Base : All respondents who state a change being made to the NHS
Respondent type : General public aged 16+ Fieldwork dates : 14th November - 9th December 2011Source : Ipsos MORI (JN10-039262-01)Proportions/Means: Columns Tested (5% risk level) - z/a/b/c/d - z/e/f/g - z/h/i/j/k - z/l/m/n/o - z/p/q - z/r/s - z/t/u - z/vOverlap formulae used. * small base; ** very small base (under 30) ineligible for sig testing

UnwtdtotalFuture of NHSSatisfaction with NHSGOR
DisYorkshire &WestEastWtd.WorseSameBettersatisfiedSatisfiedHumbersideMidlandsSouth-WestSouth-EastNorth-WestNorth-EastLondonEasternMidlandsTotal
(o)(n)(m)(l)(k)(j)(i)(h)(g)(f)(e)(d)(c)(b)(a)(z)618217167223113432516565897233977670618Unweighted Total61821716722111343058*70*61*94*69*30*100*67*67*616Weighted Total16286210-2433-11216Much better3%1%5%n3%2%2%-3%6%4%5%-1%1%3%3%n
117334833139099111812730147117A little better19%15%29%zln15%12%21%k15%14%19%19%17%24%30%zah20%10%19%kl
1453464461710816102024127251615146Neither better nor worse23%15%38%zln21%15%25%k28%14%33%eh25%17%24%25%24%23%24%hkn
1746827773012519251327138192624174A little worse28%31%m16%35%zm27%29%33%35%ce21%29%18%28%19%39%zceg36%ce28%cem
130694534372920131425419715127Much worse21%32%zm2%24%m38%zj17%15%29%bf22%15%36%zbcdfi15%19%10%22%b21%bjm
361217682554-74264436Don't know6%5%10%zl3%7%6%8%g6%-7%g6%g8%g6%g5%5%6%gl
13335563915100911152115731149133Better22%16%33%zln18%14%23%k15%16%25%23%22%24%31%zahi22%14%22%kn
3041373113073197284526423813383339302Worse49%63%zm19%59%zm65%zj46%49%64%zcfg43%45%54%c43%38%49%59%c49%cjm
-171-10224-91-58-97-19-34-11-20-22-6-8-18-30-169Net-28%-47%15%-41%-51%-23%-34%-48%-18%-22%-32%-19%-8%-27%-45%-27%
Public Perceptions of the NHS and Social CareFINAL PUBLIC
Table 86Q15. And thinking about these changes overall, from what you know, how much better or worse do you think services will be for patients?
Base : All respondents who state a change being made to the NHS
Respondent type : General public aged 16+ Fieldwork dates : 14th November - 9th December 2011Source : Ipsos MORI (JN10-039262-01)Proportions/Means: Columns Tested (5% risk level) - z/a/b/c/d/e/f/g/h/i - z/j/k - z/l/m/n - z/oOverlap formulae used. * small base

UnwtdPrivate healthSatisfaction withImpact of NHS reformsGovernment has righttotalinsurancesocial careon patientsNHS policyNHS use in last year
SocialNHSDissatisficareWalk InChoicesPharmacistWtd.
NoYesedSatisfiedWorseBetterDisagreeAgreeservicesClinicwebsite/ChemistNHS DirectA&EOutpatientInpatientGPTotal(r)(q)(p)(o)(n)(m)(l)(k)(j)(i)(h)(g)(f)(e)(d)(c)(b)(a)(z)618507105321533041332851572211340201111145256117501618Unweighted Total61850410732*15130213327716221**11641*202114147245115495616Weighted Total1612312-1629-3-232831116Much better3%2%3%4%1%-12%zm1%6%zk-3%-1%3%1%3%f3%2%3%km
1179322631-11729542243341624452588117A little better19%19%20%17%20%-88%zm11%33%zk9%21%g7%17%14%17%18%21%g18%19%gkm
14512620734--454732483822315326113146Neither better nor worse23%25%19%23%23%--16%29%k14%21%19%19%19%21%22%22%23%24%fklm
17413835839174-8833731126735455926145174A little worse28%27%32%25%26%58%zl-32%j21%32%27%29%33%bc31%31%24%22%29%c28%jl
13010423837127-999733165032396428109127Much worse21%21%21%25%25%42%zl-36%zj6%35%29%z40%zabcf25%28%z27%26%z25%22%21%jl
3631528--1392-211651682836Don't know6%6%4%6%5%--5%6%9%-5%h5%h5%h4%h7%h7%h6%h6%hlm
13310625732-13331642283361926532899133Better22%21%23%21%21%-100%zm11%39%zk9%24%g7%18%17%18%21%g24%g20%g22%gkm
304242581677302-18743146528117678412354254302Worse49%48%54%50%51%100%zl-68%zj26%67%56%69%zabc58%zabc59%zb57%zb50%47%51%z49%jl
-171-136-33-9-44-302133-15621-12-37-26-81-48-58-71-27-155-169Net-28%-27%-31%-28%-29%-100%100%-56%13%-58%-32%-63%-40%-42%-40%-29%-23%-31%-27%
Public Perceptions of the NHS and Social CareFINAL PUBLIC
Table 87Q15. And thinking about these changes overall, from what you know, how much better or worse do you think services will be for patients?
Base : All respondents who state a change being made to the NHS
Respondent type : General public aged 16+ Fieldwork dates : 14th November - 9th December 2011Source : Ipsos MORI (JN10-039262-01)Proportions/Means: Columns Tested (5% risk level) - z/a/b/c/d/e/f/g/h/i - z/j/k - z/l/m - z/n/o - z/p/q - z/rOverlap formulae used. * small base; ** very small base (under 30) ineligible for sig testing

Q14. As far as you know, what do the government's changes tothe NHS involve? What else?
Doctors andothers
commissioningCuts inservices/having
managers/more say in howPrivatisationbureaucracyNegative cutsNHS is runTotal
14586205133618Unweighted Total14487211130616Weighted Total
13-216Much better1%4%-2%3%
17221630117A little better12%25%8%23%19%36174133146Neither better nor worse25%19%20%26%24%45227733174A little worse31%25%36%25%28%42197123127Much worse29%22%34%18%21%345936Don't know2%4%2%7%6%
18251633133Better12%29%8%25%22%874114855302Worse60%48%70%43%49%-69-17-132-23-169Net-48%-19%-63%-18%-27%
Public Perceptions of the NHS and Social CareFINAL PUBLIC
Table 88Q15. And thinking about these changes overall, from what you know, how much better or worse do you think services will be for patients?
Base : All respondents who state a change being made to the NHS
Respondent type : General public aged 16+ Fieldwork dates : 14th November - 9th December 2011Source : Ipsos MORI (JN10-039262-01)

UnwtdtotalWork StatusSocial GradeAgeGender
Full/part-Wtd.OtherUnemployedRetiredtimeDEC2C1AB65+55-6435-5425-3416-24FemaleMaleTotal
(p)(o)(n)(m)(l)(k)(j)(i)(h)(g)(f)(e)(d)(c)(b)(a)(z)1001162612705082472013062472201693311581235274741001Unweighted Total100115758*2355512392013122491981433501671435154861001Weighted Total
69129939151020249731913412869Get a lot better7%8%15%zlm4%7%6%5%7%10%4%5%9%g5%9%8%6%7%m
39764238422998891219178451377268195204399Get a little better40%40%40%36%42%41%44%39%37%39%32%39%43%f47%f38%42%40%f
212351547118563965544329724227111103214Stay the same21%22%25%20%21%23%19%21%22%22%21%21%25%19%21%21%21%
16325446863431544331296421188181162Get a little worse16%16%8%20%n16%14%15%17%17%16%20%18%12%13%16%17%16%887532402016242423222792473784Get a lot worse9%5%8%14%zlo7%8%8%8%9%12%zcd16%zcde8%c6%2%9%8%8%c
721431739171627141410191515413273Don't know7%9%5%7%7%7%8%9%6%7%7%5%9%11%e8%7%7%
4667632932681129914211586531698081236233469Better47%48%54%m40%49%m47%49%45%46%44%37%48%f48%f56%zfg46%48%47%fm
25132978126544778665451903020128118245Worse25%21%15%33%zlno23%23%23%25%27%27%cd36%zcde26%c18%14%25%24%25%cd
21543231614158526449322785060108115223Net better21%28%m39%zlm7%26%zm24%26%20%20%16%f1%22%f30%zfg42%zdefg21%24%22%fgm
Public Perceptions of the NHS and Social CareFINAL PUBLIC
Table 89Q16. The Government has announced that GPs and other healthcare professionals will have much more say in deciding how the NHS spends its money. To what extent do youthink this particular policy will make the NHS better or worse over the next few years, or will it stay the same?
Base : All respondents
Respondent type : General public aged 16+ Fieldwork dates : 14th November - 9th December 2011Source : Ipsos MORI (JN10-039262-01)Proportions/Means: Columns Tested (5% risk level) - z/a/b - z/c/d/e/f/g - z/h/i/j/k - z/l/m/n/o - z/pOverlap formulae used. * small base

People aretreated with
Unwtddignity andtotalrespectNHS useHospital useEthnicityNHS/social care staffHousehold TypeHome Ownership
NotAdultshospitalHospitalInformalSocialwith
Non NHS/A&E/A&EsocialcareKnow NHSNHSdependentNon-Owner -PrivateSocialWtd.DisagreeAgreeuserNHS useruseruserMixedWhiteAsianBlackcarerworkerstaffstaffchildrenpensionerPensionerOtheroccupierrenterrenterTotal
(v)(u)(t)(s)(r)(q)(p)(o)(n)(m)(l)(k)(j)(i)(h)(g)(f)(e)(d)(c)(b)(a)(z)100130864710090145854310750741612543628951291461249106491691731001Unweighted Total1001304652104*89746853311**74778*15925038*29252*30547522110**6401781731001Weighted Total
6921475653040155410194192263310143131269Get a lot better7%7%7%4%7%6%7%9%7%5%6%8%11%6%3%9%e7%4%10%7%8%7%7%
397106277423571992012297306910020114141271868622497969399Get a little better40%35%43%zu41%40%42%38%19%40%38%43%40%53%h39%27%42%39%39%21%39%44%40%40%u
21268137311831091054155233152105110621094341373340214Stay the same21%22%21%29%zr20%23%20%41%21%29%20%21%26%17%19%20%23%19%36%21%18%23%21%r
1635598141486597312114224336114546939-1053225162Get a little worse16%18%15%13%16%14%18%31%16%17%14%17%8%21%z26%j18%15%18%-16%18%15%16%8836434803351-6551224-2710144128-6491184Get a lot worse9%12%zt7%4%9%7%10%-9%6%8%10%-9%19%zij5%9%g13%zg-10%zb5%6%8%gt
7217509653340-55215121203223516342121673Don't know7%6%8%8%7%7%7%-7%3%9%5%3%7%6%7%7%7%32%6%7%9%7%
466128324474212282403352347911824133161532209632929281469Better47%42%50%zu45%47%49%45%28%47%44%49%47%h63%zhi46%h30%50%46%43%32%46%52%47%47%hu
2519114118227971483186193468388236811167-1694036245Worse25%30%zt22%17%25%21%28%zq31%25%24%21%27%j8%30%zj44%zijk22%23%30%zfg-26%23%21%25%jqt
215371842919413192*1661544512145-7851092931235245223Net better21%12%28%zu28%22%28%zp17%-3%22%20%28%20%h55%zhik15%h-14%28%ze23%e13%32%19%29%zc26%22%cehip
u
Public Perceptions of the NHS and Social CareFINAL PUBLIC
Table 90Q16. The Government has announced that GPs and other healthcare professionals will have much more say in deciding how the NHS spends its money. To what extent do youthink this particular policy will make the NHS better or worse over the next few years, or will it stay the same?
Base : All respondents
Respondent type : General public aged 16+ Fieldwork dates : 14th November - 9th December 2011Source : Ipsos MORI (JN10-039262-01)Proportions/Means: Columns Tested (5% risk level) - z/a/b/c/d - z/e/f/g - z/h/i/j/k - z/l/m/n/o - z/p/q - z/r/s - z/t/u - z/vOverlap formulae used. * small base; ** very small base (under 30) ineligible for sig testing

UnwtdtotalFuture of NHSSatisfaction with NHSGOR
DisYorkshire &WestEastWtd.WorseSameBettersatisfiedSatisfiedHumbersideMidlandsSouth-WestSouth-EastNorth-WestNorth-EastLondonEasternMidlandsTotal
(o)(n)(m)(l)(k)(j)(i)(h)(g)(f)(e)(d)(c)(b)(a)(z)1001328298343168703909910715413955143126881001Unweighted Total1001327302340168701100*106*10216213651*14810986*1001Weighted Total
69222026115074710182213569Get a lot better7%7%7%8%6%7%7%c4%7%c6%c14%zcdfh4%1%12%zch6%c7%c
39711413613647298283244635728714631399Get a little better40%35%45%zn40%28%43%zk28%30%43%i39%42%i54%zafhi48%zhi43%hi36%40%hikn
2125986653115930312236258292113214Stay the same21%18%28%zln19%18%23%30%a29%a22%22%18%16%19%19%15%21%
163663557399918201226137291819162Get a little worse16%20%zm12%17%23%zj14%18%19%11%16%10%13%20%e16%22%eg16%ejm
884393132431310871441081084Get a lot worse9%13%zm3%9%m19%zj6%13%f10%8%4%10%8%7%7%11%f8%jm
72221625852599209374873Don't know7%7%5%7%5%7%5%9%9%12%zbc6%6%5%3%10%7%
46613715616358348353651737530736036469Better47%42%52%n48%34%50%zk35%34%50%hi45%55%zhi58%hi49%hi55%hi42%47%hikn
251109448871141313020332711392529245Worse25%33%zlm14%26%m42%zj20%31%28%19%21%20%21%26%23%33%zefg25%jm
2152811275-14207463240481934347223Net better21%8%37%zln22%n-8%30%zk4%5%31%zahi24%ahi35%zacfhi37%zachi23%ahi31%zahi9%22%ahikn
Public Perceptions of the NHS and Social CareFINAL PUBLIC
Table 91Q16. The Government has announced that GPs and other healthcare professionals will have much more say in deciding how the NHS spends its money. To what extent do youthink this particular policy will make the NHS better or worse over the next few years, or will it stay the same?
Base : All respondents
Respondent type : General public aged 16+ Fieldwork dates : 14th November - 9th December 2011Source : Ipsos MORI (JN10-039262-01)Proportions/Means: Columns Tested (5% risk level) - z/a/b/c/d/e/f/g/h/i - z/j/k - z/l/m/n - z/oOverlap formulae used. * small base

UnwtdPrivate healthSatisfaction withImpact of NHS reformsGovernment has righttotalinsurancesocial careon patientsNHS policyNHS use in last year
SocialNHSDissatisficareWalk InChoicesPharmacistWtd.
NoYesedSatisfiedWorseBetterDisagreeAgreeservicesClinicwebsite/ChemistNHS DirectA&EOutpatientInpatientGPTotal(r)(q)(p)(o)(n)(m)(l)(k)(j)(i)(h)(g)(f)(e)(d)(c)(b)(a)(z)10018151704424938220040326945182553001772253931967801001Unweighted Total100181117544*24437920139327642*18856*3011832303761927731001Weighted Total
69491911321252618320925181631105569Get a lot better7%6%11%zq3%5%6%12%zm7%7%7%11%zb15%zabd8%10%b7%8%5%7%7%q
397337571210012010812213798715108698614679302399Get a little better40%42%zp32%28%41%32%54%zm31%50%zk22%47%zacdefg27%36%38%i37%i39%i41%gi39%i40%gikmp
i
212167451252564067701035106236496247158214Stay the same21%21%25%27%21%15%20%17%25%k24%19%17%21%20%21%16%24%c20%c21%ckm
1631302883697139724112285636447232130162Get a little worse16%16%16%18%15%26%zl6%25%zj9%26%h11%14%19%h20%h19%h19%zh17%17%h16%jl
8864179236366496141136132239127284Get a lot worse9%8%10%21%zn9%17%zl3%16%zj3%16%b7%19%zabcdeh12%zbeh7%10%10%b6%9%8%jl
7263102202291819210414101426135573Don't know7%8%6%4%8%6%4%5%7%4%5%7%5%6%6%7%7%7%f7%fk
466386751311314213214815512108241338810217788358469Better47%48%43%30%46%37%66%zm38%56%zk30%57%zabcdef42%44%48%i44%47%i46%i46%i47%ikmo
gi
251194451758160191603317351991496611144202245Worse25%24%26%39%zn24%42%zl10%41%zj12%42%zabeh19%33%h30%zbh27%h29%h29%zbh23%26%zh25%hjl
21519130-454-19113-12122-57254238356645155223Net better21%24%z17%-8%22%o-5%56%zm-3%44%zk-12%39%zabcde9%i14%i21%fgi15%i18%i23%cdfgi20%fgi22%acdfgik
fgimo
Public Perceptions of the NHS and Social CareFINAL PUBLIC
Table 92Q16. The Government has announced that GPs and other healthcare professionals will have much more say in deciding how the NHS spends its money. To what extent do youthink this particular policy will make the NHS better or worse over the next few years, or will it stay the same?
Base : All respondents
Respondent type : General public aged 16+ Fieldwork dates : 14th November - 9th December 2011Source : Ipsos MORI (JN10-039262-01)Proportions/Means: Columns Tested (5% risk level) - z/a/b/c/d/e/f/g/h/i - z/j/k - z/l/m - z/n/o - z/p/q - z/rOverlap formulae used. * small base

UnwtdtotalWork StatusSocial GradeAgeGender
Full/part-Wtd.OtherUnemployedRetiredtimeDEC2C1AB65+55-6435-5425-3416-24FemaleMaleTotal
(p)(o)(n)(m)(l)(k)(j)(i)(h)(g)(f)(e)(d)(c)(b)(a)(z)1001162612705082472013062472201693311581235274741001Unweighted Total100115758*2355512392013122491981433501671435154861001Weighted Total32947188816665668710177521193932179140318Strongly agree33%30%32%37%zl30%27%33%28%40%zik39%zcd36%cd34%cd23%22%35%z29%32%cd
4075923962331087712710075561536859213198411Tend to agree41%38%40%41%42%45%38%41%40%38%39%44%41%41%41%41%41%
11019720663025441319153323245162113Neither agree nor11%12%13%9%12%13%h13%h14%h5%9%11%9%14%17%e10%13%11%hdisagree951861656221639191313272915514597Tend to disagree9%12%11%7%10%9%8%13%z8%7%9%8%17%zefg10%10%9%10%
356310159979961153122334Strongly disagree3%4%5%4%3%4%4%2%4%5%4%3%3%2%2%5%b3%b
258-51549865183991827Don't know2%5%-2%3%2%4%2%2%3%1%2%2%7%zef2%4%3%b
7361064218439817314321320115210827110791392338730Agree74%68%72%78%zo72%72%71%68%81%zijk77%cd76%cd78%zcd64%64%76%za70%73%acdi
13024927713224472922193834186368131Disagree13%15%16%11%13%13%12%15%11%11%13%11%20%zeg13%12%14%13%
6068233157327141118167172130892337373329270598Net agree61%52%56%67%zlo59%59%59%54%69%zijk66%zcd62%d67%zcd44%51%64%za56%60%acdio
Public Perceptions of the NHS and Social CareFINAL PUBLIC
Table 93Q.17 Thinking back to the last time you saw a health professional, such as a GP or hospital doctor, to what extent would you agree or disagree with each ofthe following statements.
- I was involved as much as I wanted to be in decisions about my care or treatment -
Base : All respondents
Respondent type : General public aged 16+ Fieldwork dates : 14th November - 9th December 2011Source : Ipsos MORI (JN10-039262-01)Proportions/Means: Columns Tested (5% risk level) - z/a/b - z/c/d/e/f/g - z/h/i/j/k - z/l/m/n/o - z/pOverlap formulae used. * small base

People aretreated with
Unwtddignity andtotalrespectNHS useHospital useEthnicityNHS/social care staffHousehold TypeHome Ownership
NotAdultshospitalHospitalInformalSocialwith
Non NHS/A&E/A&EsocialcareKnow NHSNHSdependentNon-Owner -PrivateSocialWtd.DisagreeAgreeuserNHS useruseruserMixedWhiteAsianBlackcarerworkerstaffstaffchildrenpensionerPensionerOtheroccupierrenterrenterTotal
(v)(u)(t)(s)(r)(q)(p)(o)(n)(m)(l)(k)(j)(i)(h)(g)(f)(e)(d)(c)(b)(a)(z)100130864710090145854310750741612543628951291461249106491691731001Unweighted Total1001304652104*89746853311**74778*15925038*29252*30547522110**6401781731001Weighted Total32986224212971351832269113493139019951378722254150318Strongly agree33%28%34%z21%33%zs29%34%19%36%zlm15%21%37%zi35%31%36%31%29%39%zfg21%35%zb23%29%32%blms
407116275413701982139280388210614122241301958652637667411Tend to agree41%38%42%39%41%42%40%81%38%49%52%zn43%37%42%46%43%41%39%50%41%43%39%41%n
110426320936053-8011202233223262192641829113Neither agree nor11%14%10%19%zr10%13%10%-11%14%13%9%9%11%5%10%13%9%18%10%10%17%zc11%rtdisagree9539576914156-701215226335325015153242097Tend to disagree9%13%zt9%6%10%9%10%-9%15%10%9%14%11%10%10%10%7%11%8%13%c11%10%c
3516154311123-2915418-10168-1813334Strongly disagree3%5%zt2%4%3%2%4%-4%1%3%2%3%3%-3%3%4%-3%7%zac2%3%t
254181215234-195331827155-176427Don't know2%1%3%11%zr2%5%zp1%-3%6%2%1%2%3%4%2%3%2%-3%3%2%3%pr
73620249963667333396115494911719928212432243331737488117117730Agree74%67%77%zu60%74%zs71%74%100%73%64%73%80%zi72%72%82%74%70%78%zf71%76%zab66%68%73%bsu
1305671101225279-9913202674154266231713723131Disagree13%18%zt11%9%14%11%15%-13%16%12%10%17%14%10%14%14%11%11%11%21%zc13%13%ct
60614742753546281317114503797173211713718226714964188094598Net agree61%48%66%zu51%61%z60%60%100%60%m47%61%69%zi54%58%71%60%56%68%zf60%65%zab45%55%60%bfmu
Public Perceptions of the NHS and Social CareFINAL PUBLIC
Table 94Q.17 Thinking back to the last time you saw a health professional, such as a GP or hospital doctor, to what extent would you agree or disagree with each ofthe following statements.
- I was involved as much as I wanted to be in decisions about my care or treatment -
Base : All respondents
Respondent type : General public aged 16+ Fieldwork dates : 14th November - 9th December 2011Source : Ipsos MORI (JN10-039262-01)Proportions/Means: Columns Tested (5% risk level) - z/a/b/c/d - z/e/f/g - z/h/i/j/k - z/l/m/n/o - z/p/q - z/r/s - z/t/u - z/vOverlap formulae used. * small base; ** very small base (under 30) ineligible for sig testing

UnwtdtotalFuture of NHSSatisfaction with NHSGOR
DisYorkshire &WestEastWtd.WorseSameBettersatisfiedSatisfiedHumbersideMidlandsSouth-WestSouth-EastNorth-WestNorth-EastLondonEasternMidlandsTotal
(o)(n)(m)(l)(k)(j)(i)(h)(g)(f)(e)(d)(c)(b)(a)(z)1001328298343168703909910715413955143126881001Unweighted Total1001327302340168701100*106*10216213651*14810986*1001Weighted Total3291078910945247252725624822225433318Strongly agree33%33%29%32%27%35%zk25%26%c25%38%cghi35%c43%cghi15%49%zceghi39%cgi32%c
40712813713955300464246685622673629411Tend to agree41%39%46%41%33%43%k45%39%45%42%41%43%45%b33%34%41%bk
1104227412866161813131521989113Neither agree nor11%13%9%12%17%zj9%16%bd17%bdf13%8%11%4%13%7%11%11%jdisagree9531273724548131011623071097Tend to disagree9%9%9%11%14%zj8%8%12%e9%7%5%3%20%zbdefgi6%12%10%ej
3511138151424847321434Strongly disagree3%3%4%2%9%zj2%2%4%7%zbc2%5%5%2%1%5%3%j
2578712232134184-27Don't know2%2%3%2%1%3%3%2%1%2%3%2%6%za3%-3%
73623522724710054770697113010444899062730Agree74%72%75%73%60%78%zk70%65%70%80%zcgh76%c87%zcghi60%82%zcghi73%73%ck
13042404539671017171513432814131Disagree13%13%13%13%23%zj10%10%16%b17%b9%10%8%22%zbdefi7%17%b13%bj
606193186202624806052541159140578248598Net agree61%59%62%59%37%68%zk60%c49%53%c71%zacgh67%cgh78%zacghi38%75%zacghi56%c60%chk
Public Perceptions of the NHS and Social CareFINAL PUBLIC
Table 95Q.17 Thinking back to the last time you saw a health professional, such as a GP or hospital doctor, to what extent would you agree or disagree with each ofthe following statements.
- I was involved as much as I wanted to be in decisions about my care or treatment -
Base : All respondents
Respondent type : General public aged 16+ Fieldwork dates : 14th November - 9th December 2011Source : Ipsos MORI (JN10-039262-01)Proportions/Means: Columns Tested (5% risk level) - z/a/b/c/d/e/f/g/h/i - z/j/k - z/l/m/n - z/oOverlap formulae used. * small base

UnwtdPrivate healthSatisfaction withImpact of NHS reformsGovernment has righttotalinsurancesocial careon patientsNHS policyNHS use in last year
SocialNHSDissatisficareWalk InChoicesPharmacistWtd.
NoYesedSatisfiedWorseBetterDisagreeAgreeservicesClinicwebsite/ChemistNHS DirectA&EOutpatientInpatientGPTotal(r)(q)(p)(o)(n)(m)(l)(k)(j)(i)(h)(g)(f)(e)(d)(c)(b)(a)(z)10018151704424938220040326945182553001772253931967801001Unweighted Total100181117544*24437920139327642*18856*3011832303761927731001Weighted Total32925166191061316413679154923101616514164263318Strongly agree33%31%38%42%43%z34%32%34%29%36%26%40%h33%h34%28%38%zdh34%34%zdh32%
40733572139315091147129169621121759114572321411Tend to agree41%41%41%28%38%39%46%37%47%zk39%51%zabcdef38%40%41%40%39%38%42%41%
1108919420461550303142332127351578113Neither agree nor11%11%11%10%8%12%7%13%11%8%8%4%11%12%g12%9%8%10%11%aldisagree95821282037204027620636173236277297Tend to disagree9%10%7%19%zn8%10%10%10%10%15%11%11%12%9%14%zac10%14%zac9%10%
35295-5135183-93961316102734Strongly disagree3%4%3%-2%3%2%5%j1%-5%6%3%3%6%4%5%3%3%j
25251-135391-1221221227Don't know2%3%1%-*1%3%1%3%k2%h-2%h1%1%*1%1%2%c3%acdfhkmn
736586137311992811552822083114544221136156286137584730Agree74%72%78%71%81%z74%77%72%75%75%77%d78%74%75%68%76%d71%76%zd73%
13011117825502558296299442345533899131Disagree13%14%10%19%10%13%13%15%11%15%15%17%15%13%20%zace14%20%zace13%13%
60647512023174230130225179251163417711311123499486598Net agree61%59%69%zq52%71%zo61%65%57%65%61%62%bd61%59%d62%bd48%62%bd52%63%zbd60%bd
Public Perceptions of the NHS and Social CareFINAL PUBLIC
Table 96Q.17 Thinking back to the last time you saw a health professional, such as a GP or hospital doctor, to what extent would you agree or disagree with each ofthe following statements.
- I was involved as much as I wanted to be in decisions about my care or treatment -
Base : All respondents
Respondent type : General public aged 16+ Fieldwork dates : 14th November - 9th December 2011Source : Ipsos MORI (JN10-039262-01)Proportions/Means: Columns Tested (5% risk level) - z/a/b/c/d/e/f/g/h/i - z/j/k - z/l/m - z/n/o - z/p/q - z/rOverlap formulae used. * small base

UnwtdtotalWork StatusSocial GradeAgeGender
Full/part-Wtd.OtherUnemployedRetiredtimeDEC2C1AB65+55-6435-5425-3416-24FemaleMaleTotal
(p)(o)(n)(m)(l)(k)(j)(i)(h)(g)(f)(e)(d)(c)(b)(a)(z)1001162612705082472013062472201693311581235274741001Unweighted Total100115758*2355512392013122491981433501671435154861001Weighted Total21230165010941415667413175322512778205Strongly agree21%19%27%21%20%17%20%18%27%zik21%22%22%19%18%25%za16%20%a
376571787219106731138969581376254199181380Tend to agree38%36%30%37%40%44%z36%36%36%35%40%39%37%38%39%37%38%
18933104310836536244402163343887108194Neither agree nor19%21%18%18%20%15%26%zhk20%17%20%15%18%20%26%zf17%22%zb19%bkdisagree
142221136703920542631233931157366139Tend to disagree14%14%19%16%13%16%j10%17%zhj10%16%16%11%19%ce10%14%14%14%5110410261191713982355203050Strongly disagree5%6%6%4%5%5%4%6%5%5%6%7%3%3%4%6%5%
315-8196791182123792332Don't know3%3%-3%3%2%3%3%4%4%1%3%2%5%2%5%zb3%b
5888733137328147114169156110892139479326259585Agree59%55%57%58%60%61%56%54%63%56%62%61%56%55%63%za53%58%a
193321547965028713940316236199396189Disagree19%20%25%20%17%21%14%23%zhj16%20%22%18%22%13%18%20%19%
39555189123296859811770581505760233162395Net agree39%35%32%39%42%40%i42%i31%47%zi35%41%43%34%42%45%za33%39%ai
Public Perceptions of the NHS and Social CareFINAL PUBLIC
Table 97Q.17 Thinking back to the last time you saw a health professional, such as a GP or hospital doctor, to what extent would you agree or disagree with each ofthe following statements.
- I was able to choose the treatment or service which best suited my needs -
Base : All respondents
Respondent type : General public aged 16+ Fieldwork dates : 14th November - 9th December 2011Source : Ipsos MORI (JN10-039262-01)Proportions/Means: Columns Tested (5% risk level) - z/a/b - z/c/d/e/f/g - z/h/i/j/k - z/l/m/n/o - z/pOverlap formulae used. * small base

People aretreated with
Unwtddignity andtotalrespectNHS useHospital useEthnicityNHS/social care staffHousehold TypeHome Ownership
NotAdultshospitalHospitalInformalSocialwith
Non NHS/A&E/A&EsocialcareKnow NHSNHSdependentNon-Owner -PrivateSocialWtd.DisagreeAgreeuserNHS useruseruserMixedWhiteAsianBlackcarerworkerstaffstaffchildrenpensionerPensionerOtheroccupierrenterrenterTotal
(v)(u)(t)(s)(r)(q)(p)(o)(n)(m)(l)(k)(j)(i)(h)(g)(f)(e)(d)(c)(b)(a)(z)100130864710090145854310750741612543628951291461249106491691731001Unweighted Total1001304652104*89746853311**74778*15925038*29252*30547522110**6401781731001Weighted Total212521491219281124116410296796619698550-1413033205Strongly agree21%17%23%zu12%21%zs17%23%zq11%22%z13%18%27%z24%23%36%zi23%18%23%-22%17%19%20%qs
37611024739341183197727037649915102161161838132486365380Tend to agree38%36%38%37%38%39%37%60%36%47%40%40%39%35%31%38%38%37%30%39%36%38%38%n
1895712432163110851147163046862958983861233036194Neither agree nor19%19%19%30%zr18%23%zp16%9%20%20%19%18%21%21%17%19%21%17%59%19%17%21%19%prdisagree
142568271325189-103926254397366834-793327139Tend to disagree14%18%zt13%7%15%zs11%17%zq-14%12%16%10%11%13%13%12%14%16%-12%18%c16%14%kqs
5122265461833239277118117249-2814850Strongly disagree5%7%zt4%5%5%4%6%20%5%2%4%3%3%6%k2%6%5%4%-4%8%5%5%t
316241022267-2454616191681198432Don't know3%2%4%10%zr2%6%zp1%-3%6%2%2%3%2%2%3%3%4%11%3%4%2%3%pr
5881623965153426432084354793166241683518526813133909399585Agree59%54%61%zu49%60%zs56%60%71%58%60%58%67%zi62%58%67%61%56%59%30%61%z52%57%58%su
19378108121786812121421133325578539344-1084735189Disagree19%26%zt17%11%20%zs15%23%zq20%19%14%21%13%14%19%k14%17%20%20%-17%26%zc20%19%ckqst
39584288393561961996293356013419111271321758832824664395Net agree39%28%44%zu38%40%42%37%51%39%46%38%54%zi48%38%52%i43%37%40%30%44%zb26%37%b39%bu
Public Perceptions of the NHS and Social CareFINAL PUBLIC
Table 98Q.17 Thinking back to the last time you saw a health professional, such as a GP or hospital doctor, to what extent would you agree or disagree with each ofthe following statements.
- I was able to choose the treatment or service which best suited my needs -
Base : All respondents
Respondent type : General public aged 16+ Fieldwork dates : 14th November - 9th December 2011Source : Ipsos MORI (JN10-039262-01)Proportions/Means: Columns Tested (5% risk level) - z/a/b/c/d - z/e/f/g - z/h/i/j/k - z/l/m/n/o - z/p/q - z/r/s - z/t/u - z/vOverlap formulae used. * small base; ** very small base (under 30) ineligible for sig testing

UnwtdtotalFuture of NHSSatisfaction with NHSGOR
DisYorkshire &WestEastWtd.WorseSameBettersatisfiedSatisfiedHumbersideMidlandsSouth-WestSouth-EastNorth-WestNorth-EastLondonEasternMidlandsTotal
(o)(n)(m)(l)(k)(j)(i)(h)(g)(f)(e)(d)(c)(b)(a)(z)1001328298343168703909910715413955143126881001Unweighted Total1001327302340168701100*106*10216213651*14810986*1001Weighted Total21261577624158131617363821103024205Strongly agree21%19%19%22%14%23%zk13%15%c17%c22%c28%zcghi41%zcfghi6%27%zchi28%chi20%ck
37612511812950286404438665415583827380Tend to agree38%38%39%38%30%41%zk40%41%38%41%40%29%39%35%31%38%k
1896562623513227231528205342418194Neither agree nor19%20%20%18%21%19%27%deg22%15%18%15%10%23%d22%21%19%disagree
142523548378218151915104371210139Tend to disagree14%16%12%14%22%zj12%18%e14%18%ef10%7%9%25%zabdefh11%12%14%ej
511814181920161289422650Strongly disagree5%6%5%5%11%zj3%1%6%12%zbci5%7%bci8%bci1%1%7%bci5%bcj
31615832423185275132Don't know3%2%5%zn2%2%3%2%2%1%5%4%3%5%4%1%3%
588186176205744445360551029236686851585Agree59%57%58%60%44%63%zk53%56%54%63%c68%zcgi70%ci46%62%c60%c58%ck
1937049665610119213124199391316189Disagree19%21%16%19%34%zj14%19%20%30%zbef15%14%17%27%zbef12%19%19%bj
39511612714017342343925787427285435395Net agree39%35%42%41%10%49%zk34%c37%cg24%48%zcgi54%zcghi53%zcgi19%50%zcgi41%cg39%cgk
Public Perceptions of the NHS and Social CareFINAL PUBLIC
Table 99Q.17 Thinking back to the last time you saw a health professional, such as a GP or hospital doctor, to what extent would you agree or disagree with each ofthe following statements.
- I was able to choose the treatment or service which best suited my needs -
Base : All respondents
Respondent type : General public aged 16+ Fieldwork dates : 14th November - 9th December 2011Source : Ipsos MORI (JN10-039262-01)Proportions/Means: Columns Tested (5% risk level) - z/a/b/c/d/e/f/g/h/i - z/j/k - z/l/m/n - z/oOverlap formulae used. * small base

UnwtdPrivate healthSatisfaction withImpact of NHS reformsGovernment has righttotalinsurancesocial careon patientsNHS policyNHS use in last year
SocialNHSDissatisficareWalk InChoicesPharmacistWtd.
NoYesedSatisfiedWorseBetterDisagreeAgreeservicesClinicwebsite/ChemistNHS DirectA&EOutpatientInpatientGPTotal(r)(q)(p)(o)(n)(m)(l)(k)(j)(i)(h)(g)(f)(e)(d)(c)(b)(a)(z)10018151704424938220040326945182553001772253931967801001Unweighted Total100181117544*24437920139327642*18856*3011832303761927731001Weighted Total212158451171844487601133186142479740175205Strongly agree21%19%26%24%29%z22%22%22%22%27%18%33%zdfh20%23%20%26%zfh21%23%z20%
37630666198514680129119188519115678213767287380Tend to agree38%38%38%43%35%39%40%33%43%zk42%45%zabcde33%38%36%36%36%35%37%38%k
189156364556738774322876133415333141194Neither agree nor19%19%20%10%23%18%19%20%16%5%15%12%20%ci18%i18%i14%17%i18%ci19%cidisagree
142121168205427673492494727386135111139Tend to disagree14%15%zp9%18%8%14%13%17%z12%21%13%16%15%15%17%16%18%14%14%np
5144617267267115415121724144050Strongly disagree5%5%4%2%3%7%4%7%j2%2%8%7%5%7%8%6%7%5%5%j
31266142461312-224331932Don't know3%3%3%3%2%1%2%2%5%k2%1%-1%1%2%1%2%2%cf3%acfkm
588463111301572311242161802911837176108130234107462585Agree59%57%63%68%64%z61%62%55%65%zk69%63%66%59%59%56%62%zb56%60%58%
19316522928803493401039136239568549150189Disagree19%20%zp13%20%11%21%17%24%zj15%24%21%22%21%21%24%z23%z25%za19%19%jnp
395298892112915190123139197924114697414958312395Net agree39%37%51%zq48%53%z40%45%31%50%zk46%b42%bd43%38%b38%32%40%bd30%40%bd39%bdkq
Public Perceptions of the NHS and Social CareFINAL PUBLIC
Table 100Q.17 Thinking back to the last time you saw a health professional, such as a GP or hospital doctor, to what extent would you agree or disagree with each ofthe following statements.
- I was able to choose the treatment or service which best suited my needs -
Base : All respondents
Respondent type : General public aged 16+ Fieldwork dates : 14th November - 9th December 2011Source : Ipsos MORI (JN10-039262-01)Proportions/Means: Columns Tested (5% risk level) - z/a/b/c/d/e/f/g/h/i - z/j/k - z/l/m - z/n/o - z/p/q - z/rOverlap formulae used. * small base

I was able toI was involvedchoose theas much as Itreatment orwanted to be inservice whichdecisions aboutbest suited mymy care or
needstreatment10011001Unweighted Total10011001Weighted Total205318Strongly agree20%32%
380411Tend to agree38%41%
194113Neither agree nor19%11%disagree
13997Tend to disagree14%10%5034Strongly disagree5%3%
3227Don't know3%3%
585730Agree58%73%
189131Disagree19%13%
395598Net agree39%60%
Public Perceptions of the NHS and Social CareFINAL PUBLIC
Table 101Q.17 Thinking back to the last time you saw a health professional, such as a GP or hospital doctor, to what extent would you agree or disagree with each ofthe following statements.
- Summary -
Base : All respondents
Respondent type : General public aged 16+ Fieldwork dates : 14th November - 9th December 2011Source : Ipsos MORI (JN10-039262-01)

UnwtdtotalWork StatusSocial GradeAgeGender
Full/part-Wtd.OtherUnemployedRetiredtimeDEC2C1AB65+55-6435-5425-3416-24FemaleMaleTotal
(p)(o)(n)(m)(l)(k)(j)(i)(h)(g)(f)(e)(d)(c)(b)(a)(z)1001162612705082472013062472201693311581235274741001Unweighted Total100115758*2355512392013122491981433501671435154861001Weighted Total361552011017411173101731014511454441701893591 - Agree much more with36%35%34%47%zlo32%47%zhij36%32%29%51%zcdef32%33%33%31%33%39%36%bhlstatement A
211371136132424965603026873240102114216221%24%m19%15%24%m18%24%21%24%15%18%25%g19%28%g20%24%22%gm
238311549140414986592946804634126109235324%20%25%21%25%17%24%27%k24%14%32%zeg23%g27%g24%g24%22%23%gk
9814917611916343215133622136535100410%9%15%7%11%8%8%11%13%8%9%10%13%9%13%za7%10%a
831842039191225252012301374932815 - Agree much more with8%12%7%9%7%8%6%8%10%10%8%9%8%5%10%7%8%statement B
102-3562114-2-54610Don't know1%1%-1%1%3%zhi1%**2%-1%-3%zdef1%1%1%
Public Perceptions of the NHS and Social CareFINAL PUBLIC
Table 102Q18. Please read to the following pair of statements and decide, on a scale of 1 to 5, which comes closest to your own opinion. A score of 1 means you agreemuch more with statement A while a score of 5 means you agree much more with Statement B.A) In general, I want a health professional, such as a GP or a consultant, to make decisions about my treatmentB) In general, I want to make my own decisions about my treatment, not rely on a health professional, such as a GP or consultant
Base : All respondents
Respondent type : General public aged 16+ Fieldwork dates : 14th November - 9th December 2011Source : Ipsos MORI (JN10-039262-01)Proportions/Means: Columns Tested (5% risk level) - z/a/b - z/c/d/e/f/g - z/h/i/j/k - z/l/m/n/o - z/pOverlap formulae used. * small base

People aretreated with
Unwtddignity andtotalrespectNHS useHospital useEthnicityNHS/social care staffHousehold TypeHome Ownership
NotAdultshospitalHospitalInformalSocialwith
Non NHS/A&E/A&EsocialcareKnow NHSNHSdependentNon-Owner -PrivateSocialWtd.DisagreeAgreeuserNHS useruseruserMixedWhiteAsianBlackcarerworkerstaffstaffchildrenpensionerPensionerOtheroccupierrenterrenterTotal
(v)(u)(t)(s)(r)(q)(p)(o)(n)(m)(l)(k)(j)(i)(h)(g)(f)(e)(d)(c)(b)(a)(z)100130864710090145854310750741612543628951291461249106491691731001Unweighted Total1001304652104*89746853311**74778*15925038*29252*30547522110**6401781731001Weighted Total361100243313281791802257356183151028106148105523760563591 - Agree much more with36%33%37%30%37%38%34%21%34%45%38%33%h38%h35%h16%35%31%48%zfg52%37%34%32%36%fhstatement A
211571493118410311331731227503579751093211484027216221%19%23%30%zr21%22%21%30%23%z16%17%20%9%20%17%25%e23%e15%11%23%a23%15%22%aer
23878147212141001343171144765117124691244231454443235324%26%23%20%24%21%25%30%23%18%29%26%29%24%45%zik23%26%e19%29%23%25%25%23%e
983462128945562797112843963056141611820100410%11%10%11%10%10%10%19%11%10%7%11%11%14%z11%10%12%e6%8%10%10%12%10%e
8334448733546-59712235206233424-451422815 - Agree much more with8%11%zt7%8%8%8%9%-8%9%8%9%14%7%11%7%7%11%-7%8%13%zc8%tstatement B
10161965-8112-3-254-51410Don't know1%*1%1%1%1%1%-1%2%1%1%-1%-1%1%2%-1%1%3%c1%
Public Perceptions of the NHS and Social CareFINAL PUBLIC
Table 103Q18. Please read to the following pair of statements and decide, on a scale of 1 to 5, which comes closest to your own opinion. A score of 1 means you agreemuch more with statement A while a score of 5 means you agree much more with Statement B.A) In general, I want a health professional, such as a GP or a consultant, to make decisions about my treatmentB) In general, I want to make my own decisions about my treatment, not rely on a health professional, such as a GP or consultant
Base : All respondents
Respondent type : General public aged 16+ Fieldwork dates : 14th November - 9th December 2011Source : Ipsos MORI (JN10-039262-01)Proportions/Means: Columns Tested (5% risk level) - z/a/b/c/d - z/e/f/g - z/h/i/j/k - z/l/m/n/o - z/p/q - z/r/s - z/t/u - z/vOverlap formulae used. * small base; ** very small base (under 30) ineligible for sig testing

UnwtdtotalFuture of NHSSatisfaction with NHSGOR
DisYorkshire &WestEastWtd.WorseSameBettersatisfiedSatisfiedHumbersideMidlandsSouth-WestSouth-EastNorth-WestNorth-EastLondonEasternMidlandsTotal
(o)(n)(m)(l)(k)(j)(i)(h)(g)(f)(e)(d)(c)(b)(a)(z)1001328298343168703909910715413955143126881001Unweighted Total1001327302340168701100*106*10216213651*14810986*1001Weighted Total361105119123512783648306350245234223591 - Agree much more with36%32%40%36%31%40%zk36%46%zabg30%39%a37%46%ag35%31%25%36%astatement A
21175656924156202123372311322524216221%23%22%20%14%22%k20%19%23%23%17%21%22%23%28%e22%k
2388267824715020163223449373322235324%25%22%24%28%21%20%15%32%zdfh14%32%zdfhi17%25%f30%fh25%f23%fhj
98332636137217982434121211100410%10%9%11%7%10%17%zce9%e8%e15%ze2%8%8%e11%e13%e10%e
8329202932376106141641456815 - Agree much more with8%9%7%9%19%zj5%6%9%6%9%11%b8%10%4%7%8%jstatement B
104412812211-11110Don't know1%1%1%*1%1%1%2%2%1%1%-1%1%1%1%
Public Perceptions of the NHS and Social CareFINAL PUBLIC
Table 104Q18. Please read to the following pair of statements and decide, on a scale of 1 to 5, which comes closest to your own opinion. A score of 1 means you agreemuch more with statement A while a score of 5 means you agree much more with Statement B.A) In general, I want a health professional, such as a GP or a consultant, to make decisions about my treatmentB) In general, I want to make my own decisions about my treatment, not rely on a health professional, such as a GP or consultant
Base : All respondents
Respondent type : General public aged 16+ Fieldwork dates : 14th November - 9th December 2011Source : Ipsos MORI (JN10-039262-01)Proportions/Means: Columns Tested (5% risk level) - z/a/b/c/d/e/f/g/h/i - z/j/k - z/l/m/n - z/oOverlap formulae used. * small base

UnwtdPrivate healthSatisfaction withImpact of NHS reformsGovernment has righttotalinsurancesocial careon patientsNHS policyNHS use in last year
SocialNHSDissatisficareWalk InChoicesPharmacistWtd.
NoYesedSatisfiedWorseBetterDisagreeAgreeservicesClinicwebsite/ChemistNHS DirectA&EOutpatientInpatientGPTotal(r)(q)(p)(o)(n)(m)(l)(k)(j)(i)(h)(g)(f)(e)(d)(c)(b)(a)(z)10018151704424938220040326945182553001772253931967801001Unweighted Total100181117544*24437920139327642*18856*3011832303761927731001Weighted Total3613034999113479130120146518946175124712813591 - Agree much more with36%37%zp28%20%37%o35%40%33%43%zk35%35%33%31%33%33%33%37%36%f36%opstatement A
21117240115178427260640106544567239159216221%21%23%24%21%21%21%18%22%14%21%18%22%24%24%19%21%21%22%k
2381914118559244108511345177638599739181235324%24%23%41%zn23%24%22%27%zj18%32%24%30%25%21%26%26%21%23%23%j
986929327371936284164342122421978100410%8%17%zq7%11%10%10%9%10%9%8%7%11%12%9%11%10%10%10%q
836615419381344194206281716371966815 - Agree much more with8%8%9%9%8%10%7%11%z7%10%11%11%9%9%7%10%10%8%8%statement B
1010--1224--2-32254910Don't know1%1%--**1%1%--1%-1%1%1%1%2%1%1%
Public Perceptions of the NHS and Social CareFINAL PUBLIC
Table 105Q18. Please read to the following pair of statements and decide, on a scale of 1 to 5, which comes closest to your own opinion. A score of 1 means you agreemuch more with statement A while a score of 5 means you agree much more with Statement B.A) In general, I want a health professional, such as a GP or a consultant, to make decisions about my treatmentB) In general, I want to make my own decisions about my treatment, not rely on a health professional, such as a GP or consultant
Base : All respondents
Respondent type : General public aged 16+ Fieldwork dates : 14th November - 9th December 2011Source : Ipsos MORI (JN10-039262-01)Proportions/Means: Columns Tested (5% risk level) - z/a/b/c/d/e/f/g/h/i - z/j/k - z/l/m - z/n/o - z/p/q - z/rOverlap formulae used. * small base

UnwtdtotalWork StatusSocial GradeAgeGender
Full/part-Wtd.OtherUnemployedRetiredtimeDEC2C1AB65+55-6435-5425-3416-24FemaleMaleTotal
(p)(o)(n)(m)(l)(k)(j)(i)(h)(g)(f)(e)(d)(c)(b)(a)(z)1001162612705082472013062472201693311581235274741001Unweighted Total100115758*2355512392013122491981433501671435154861001Weighted Total20536164510545405759382972313111091201Much better20%23%27%19%19%19%20%18%24%19%20%20%18%22%21%19%20%
4548025882701239814210174591619179223241464A little better45%51%m43%38%49%m51%h49%46%41%37%41%46%g55%zfg55%zfg43%50%zb46%bghm
159211148783426603837245227189067157Neither better nor worse16%13%18%20%zl14%14%13%19%z15%19%17%15%16%12%17%14%16%
1061252958212134282321399115746103A little worse11%8%8%12%10%9%10%11%11%12%d15%zd11%6%8%11%9%10%d
4332132581010141361851202342Much worse4%2%3%6%4%4%5%3%6%6%c4%5%c3%1%4%5%4%c
345113159798135944151834Don't know3%3%2%5%z3%4%4%3%3%6%ze3%2%2%2%3%4%3%
6591164013337516713819916011288233122110333332664Better66%74%zm69%57%68%m70%69%64%64%57%61%67%g73%fg77%zefg65%68%66%gm
14915642822930434335275715127769146Worse15%10%11%18%o15%12%15%14%17%18%cd19%cd16%cd9%8%15%14%15%cd
5101013491293138108155118776017610798256263519Net better51%64%zlm59%m39%53%m58%zh54%50%47%39%42%50%g64%zefg69%zefg50%54%52%fgm
Public Perceptions of the NHS and Social CareFINAL PUBLIC
Table 106Q19. The NHS may move more services which have traditionally been provided in hospitals out into the community. This will mean more services are provided throughGP practices or clinics or by NHS staff delivering them in patients' homes. How much better or worse do you think this will make services for patients?
Base : All respondents
Respondent type : General public aged 16+ Fieldwork dates : 14th November - 9th December 2011Source : Ipsos MORI (JN10-039262-01)Proportions/Means: Columns Tested (5% risk level) - z/a/b - z/c/d/e/f/g - z/h/i/j/k - z/l/m/n/o - z/pOverlap formulae used. * small base

People aretreated with
Unwtddignity andtotalrespectNHS useHospital useEthnicityNHS/social care staffHousehold TypeHome Ownership
NotAdultshospitalHospitalInformalSocialwith
Non NHS/A&E/A&EsocialcareKnow NHSNHSdependentNon-Owner -PrivateSocialWtd.DisagreeAgreeuserNHS useruseruserMixedWhiteAsianBlackcarerworkerstaffstaffchildrenpensionerPensionerOtheroccupierrenterrenterTotal
(v)(u)(t)(s)(r)(q)(p)(o)(n)(m)(l)(k)(j)(i)(h)(g)(f)(e)(d)(c)(b)(a)(z)100130864710090145854310750741612543628951291461249106491691731001Unweighted Total1001304652104*89746853311**74778*15925038*29252*30547522110**6401781731001Weighted Total205611312118098103115611336518554561024331244033201Much better20%20%20%20%20%21%19%10%21%14%21%26%zhi46%zhik19%h8%18%21%20%31%19%23%19%20%h
45413331049414232231534042739411136241592208442898784464A little better45%44%48%47%46%50%43%42%45%54%46%38%28%46%jk46%52%ze46%e38%39%45%49%49%46%ejkp
1594210817140728511081335387451247694221042625157Neither better nor worse16%14%17%16%16%15%16%10%14%17%22%zn15%19%15%23%15%15%19%20%16%15%15%16%
1064357895386528759281367255326-701518103A little worse11%14%zt9%8%11%8%12%zq20%12%zl6%5%11%2%12%13%8%11%12%-11%9%10%10%lqt
43152453814282332518-141121912-285942Much worse4%5%4%5%4%3%5%17%4%3%3%7%z-5%2%4%4%5%-4%3%5%4%
349214291321-23557264712151254434Don't know3%3%3%4%3%3%4%-3%6%3%3%6%2%8%i2%2%7%zfg10%4%2%2%3%
6591944417159433033464965310615928191282153221287413127117664Better66%64%68%68%66%70%zp63%53%66%68%66%64%73%65%54%70%e68%e58%70%64%72%68%66%ep
14958811313353934120714471508377237-992027146Worse15%19%zt13%12%15%11%17%zq37%16%zl8%9%19%zj2%17%j15%12%15%17%-15%11%15%15%jlqt
5101363605846127724223754792112271412117825090731410791519Net better51%45%55%zu56%51%59%zp45%16%50%60%58%45%71%zhik48%39%58%ze53%e41%70%49%60%zc52%52%cekpu
Public Perceptions of the NHS and Social CareFINAL PUBLIC
Table 107Q19. The NHS may move more services which have traditionally been provided in hospitals out into the community. This will mean more services are provided throughGP practices or clinics or by NHS staff delivering them in patients' homes. How much better or worse do you think this will make services for patients?
Base : All respondents
Respondent type : General public aged 16+ Fieldwork dates : 14th November - 9th December 2011Source : Ipsos MORI (JN10-039262-01)Proportions/Means: Columns Tested (5% risk level) - z/a/b/c/d - z/e/f/g - z/h/i/j/k - z/l/m/n/o - z/p/q - z/r/s - z/t/u - z/vOverlap formulae used. * small base; ** very small base (under 30) ineligible for sig testing

UnwtdtotalFuture of NHSSatisfaction with NHSGOR
DisYorkshire &WestEastWtd.WorseSameBettersatisfiedSatisfiedHumbersideMidlandsSouth-WestSouth-EastNorth-WestNorth-EastLondonEasternMidlandsTotal
(o)(n)(m)(l)(k)(j)(i)(h)(g)(f)(e)(d)(c)(b)(a)(z)1001328298343168703909910715413955143126881001Unweighted Total1001327302340168701100*106*10216213651*14810986*1001Weighted Total20560686830140201431302914183015201Much better20%18%22%20%18%20%20%13%30%zacfh18%21%c28%ch12%28%zch17%20%c
45413915814861336405246836024754141464A little better45%42%52%zln43%36%48%k40%49%45%51%b44%48%51%b38%48%46%bk
1594850583710517231219237291712157Neither better nor worse16%15%16%17%22%zj15%17%22%fg11%11%17%13%19%16%13%16%
1064616412169149821124131211103A little worse11%14%zm5%12%m13%10%14%8%8%13%9%8%9%11%13%10%m
4322415142553447197442Much worse4%7%zm1%4%m8%zj4%5%3%4%3%5%2%6%6%4%4%m
341261162745255143434Don't know3%4%2%3%3%4%4%5%2%3%4%2%3%2%4%3%
659199226216914756066761139039937156664Better66%61%75%zln63%54%68%k60%62%75%i70%66%76%63%65%65%66%kn
149682056359419121225185221815146Worse15%21%zm7%16%m21%zj13%19%11%12%15%13%10%15%17%17%15%m
51013220616056381425465887134725341519Net better51%40%68%zln47%33%54%zk42%51%63%zabci54%52%66%zabci48%48%48%52%ikln
Public Perceptions of the NHS and Social CareFINAL PUBLIC
Table 108Q19. The NHS may move more services which have traditionally been provided in hospitals out into the community. This will mean more services are provided throughGP practices or clinics or by NHS staff delivering them in patients' homes. How much better or worse do you think this will make services for patients?
Base : All respondents
Respondent type : General public aged 16+ Fieldwork dates : 14th November - 9th December 2011Source : Ipsos MORI (JN10-039262-01)Proportions/Means: Columns Tested (5% risk level) - z/a/b/c/d/e/f/g/h/i - z/j/k - z/l/m/n - z/oOverlap formulae used. * small base

UnwtdPrivate healthSatisfaction withImpact of NHS reformsGovernment has righttotalinsurancesocial careon patientsNHS policyNHS use in last year
SocialNHSDissatisficareWalk InChoicesPharmacistWtd.
NoYesedSatisfiedWorseBetterDisagreeAgreeservicesClinicwebsite/ChemistNHS DirectA&EOutpatientInpatientGPTotal(r)(q)(p)(o)(n)(m)(l)(k)(j)(i)(h)(g)(f)(e)(d)(c)(b)(a)(z)10018151704424938220040326945182553001772253931967801001Unweighted Total100181117544*24437920139327642*18856*3011832303761927731001Weighted Total2051673066358676563445105944497537158201Much better20%21%17%13%26%z15%33%zm17%23%k10%24%i18%20%24%i21%20%19%20%20%km
4543728415106147951571461885251298510015583351464A little better45%46%48%35%43%39%48%m40%53%zk43%45%44%43%46%43%41%43%45%c46%ckm
159126299346824684282575231406339125157Neither better nor worse16%16%17%22%14%18%12%17%15%20%13%13%17%17%18%17%20%zh16%16%
1068121725579591152410361924472381103A little worse11%10%12%15%10%15%zl4%15%zj4%13%13%18%12%10%10%13%12%11%10%jl
43393512314306364143121973342Much worse4%5%z2%12%z5%8%zl2%8%zj2%7%e3%8%e5%e2%5%e5%e4%4%e4%ej
342681418214932-10251632534Don't know3%3%4%3%2%5%l1%4%3%7%eh1%-3%1%2%4%bh2%3%3%l
659538115211692051622222092213035188128149230120509664Better66%66%65%48%69%o54%81%zm57%76%zk53%69%ci62%63%70%cfi65%61%62%66%c66%ckmo
14912124123788138917830145121366730114146Worse15%15%14%28%zn15%23%zl6%23%zj6%20%16%25%zae17%e12%16%18%zae16%15%15%jl
51041791913211715013319214992113710711316390395519Net better51%51%52%20%54%o31%75%zm34%69%zk33%53%cgi37%46%59%abcdfgi49%i43%47%51%cfgi52%cfgikmo
Public Perceptions of the NHS and Social CareFINAL PUBLIC
Table 109Q19. The NHS may move more services which have traditionally been provided in hospitals out into the community. This will mean more services are provided throughGP practices or clinics or by NHS staff delivering them in patients' homes. How much better or worse do you think this will make services for patients?
Base : All respondents
Respondent type : General public aged 16+ Fieldwork dates : 14th November - 9th December 2011Source : Ipsos MORI (JN10-039262-01)Proportions/Means: Columns Tested (5% risk level) - z/a/b/c/d/e/f/g/h/i - z/j/k - z/l/m - z/n/o - z/p/q - z/rOverlap formulae used. * small base

UnwtdtotalWork StatusSocial GradeAgeGender
Full/part-Wtd.OtherUnemployedRetiredtimeDEC2C1AB65+55-6435-5425-3416-24FemaleMaleTotal
(p)(o)(n)(m)(l)(k)(j)(i)(h)(g)(f)(e)(d)(c)(b)(a)(z)1001162612705082472013062472201693311581235274741001Unweighted Total100115758*2355512392013122491981433501671435154861001Weighted Total
527383541218187519912282552Get a lot better5%4%5%3%6%2%6%k6%k7%k4%3%5%5%9%5%5%5%k
31756225319780641028150321186662175153328Get a little better32%35%m38%m23%36%zm34%32%33%33%25%22%34%fg39%fg43%zfg34%32%33%fgm
269461864140685387604847824547135133268Stay the same27%29%32%27%25%28%26%28%24%24%33%e24%27%33%26%27%27%
197286639448395846513274221391100191Get a little worse20%18%11%27%zlno17%20%19%19%18%26%zcd22%cd21%cd13%9%18%21%19%cd
1101143162221831372519431655057108Get a lot worse11%7%6%13%11%9%9%10%15%z13%c13%c12%c10%c3%10%12%11%c
561051623171515617914104361753Don't know6%6%8%7%4%7%h8%h5%2%8%ze6%4%6%3%7%za4%5%ah
369622561231847612110057371377575202178380Better37%40%m43%m26%42%zm35%38%39%40%29%26%39%fg45%fg52%zefg39%37%38%fgm
3073910941567057908377501173817141158299Worse31%25%17%40%zlno28%29%28%29%33%39%zcd35%cd33%cd23%c12%27%32%30%cdn
622315-337514193117-20-14203757612081Net better6%15%z26%zl-14%14%zm6%9%10%7%-10%-9%6%fg22%zefg40%zdefg12%za4%8%aefgm
Public Perceptions of the NHS and Social CareFINAL PUBLIC
Table 110Q20. NHS services and care, whilst still free, will be provided by a wider range of organisations in future. This will include the private sector and charities.To what extent do you think this will make the NHS better or worse over the next few years, or will it stay the same?
Base : All respondents
Respondent type : General public aged 16+ Fieldwork dates : 14th November - 9th December 2011Source : Ipsos MORI (JN10-039262-01)Proportions/Means: Columns Tested (5% risk level) - z/a/b - z/c/d/e/f/g - z/h/i/j/k - z/l/m/n/o - z/pOverlap formulae used. * small base

People aretreated with
Unwtddignity andtotalrespectNHS useHospital useEthnicityNHS/social care staffHousehold TypeHome Ownership
NotAdultshospitalHospitalInformalSocialwith
Non NHS/A&E/A&EsocialcareKnow NHSNHSdependentNon-Owner -PrivateSocialWtd.DisagreeAgreeuserNHS useruseruserMixedWhiteAsianBlackcarerworkerstaffstaffchildrenpensionerPensionerOtheroccupierrenterrenterTotal
(v)(u)(t)(s)(r)(q)(p)(o)(n)(m)(l)(k)(j)(i)(h)(g)(f)(e)(d)(c)(b)(a)(z)100130864710090145854310750741612543628951291461249106491691731001Unweighted Total1001304652104*89746853311**74778*15925038*29252*30547522110**6401781731001Weighted Total
521338943242813571010415318277-3413552Get a lot better5%4%6%9%5%5%5%9%5%9%6%4%11%k5%6%6%6%3%-5%7%3%5%
317992153829015317542403642721792101121605722036954328Get a little better32%32%33%36%32%33%33%39%32%46%zln27%29%45%hk32%19%37%e34%e26%22%32%39%31%33%eh
2697418332236142126-199175263117413781385231643566268Stay the same27%25%28%31%26%30%zp24%-27%22%33%25%28%25%25%26%29%24%33%26%20%38%zbc27%bp
19769113131797511641511027534601760706221313028191Get a little worse20%23%17%12%20%z16%22%zq41%20%13%17%21%11%21%33%zij20%15%28%zfg19%20%17%16%19%fq
11035674104476118351736-3592556271751814108Get a lot worse11%11%10%4%12%zs10%11%11%11%7%11%14%zj-12%j18%j8%12%12%8%12%10%8%11%js
5614358452627-3931115216-12241723412653Don't know6%5%5%8%5%6%5%-5%4%7%6%5%5%-4%5%8%18%5%7%3%5%
36911225347333178203527543528222108131301866422378259380Better37%37%39%45%37%38%38%48%37%55%zln33%33%56%zhik37%24%43%e39%e29%22%37%46%zac34%38%eh
30710318117282122177623415449049527851268832064942299Worse31%34%t28%16%32%zs26%33%zq52%31%m19%27%36%zj11%33%j51%zijk28%26%40%zfg27%32%za27%24%30%fjmqs
t
6297230515526*41288-81712-144561-25-131331781Net better6%3%11%zu29%zr6%12%zp5%-4%5%36%zln5%-3%45%zhik4%k-26%15%ze13%ze-11%-5%5%19%zac10%c8%cehik
npru
Public Perceptions of the NHS and Social CareFINAL PUBLIC
Table 111Q20. NHS services and care, whilst still free, will be provided by a wider range of organisations in future. This will include the private sector and charities.To what extent do you think this will make the NHS better or worse over the next few years, or will it stay the same?
Base : All respondents
Respondent type : General public aged 16+ Fieldwork dates : 14th November - 9th December 2011Source : Ipsos MORI (JN10-039262-01)Proportions/Means: Columns Tested (5% risk level) - z/a/b/c/d - z/e/f/g - z/h/i/j/k - z/l/m/n/o - z/p/q - z/r/s - z/t/u - z/vOverlap formulae used. * small base; ** very small base (under 30) ineligible for sig testing

UnwtdtotalFuture of NHSSatisfaction with NHSGOR
DisYorkshire &WestEastWtd.WorseSameBettersatisfiedSatisfiedHumbersideMidlandsSouth-WestSouth-EastNorth-WestNorth-EastLondonEasternMidlandsTotal
(o)(n)(m)(l)(k)(j)(i)(h)(g)(f)(e)(d)(c)(b)(a)(z)1001328298343168703909910715413955143126881001Unweighted Total1001327302340168701100*106*10216213651*14810986*1001Weighted Total
52151519738237792117352Get a lot better5%5%5%6%4%5%2%3%7%4%6%4%8%7%3%5%
31710410510653230383830613915522925328Get a little better32%32%35%31%32%33%38%36%29%37%29%30%35%27%29%33%
269771028137199213126444515402720268Stay the same27%24%34%zln24%22%28%21%29%25%27%33%i30%27%25%23%27%
19768487240125251923251511282322191Get a little worse20%21%16%21%24%18%25%e18%23%e16%11%21%19%21%e26%e19%e
1104618412668109911205121714108Get a lot worse11%14%zm6%12%m15%zj10%10%9%9%7%15%f10%8%16%cf16%f11%m
56171321542456148346253Don't know6%5%4%6%3%6%4%5%6%9%c6%5%3%6%3%5%
36911912112560268404238684817643628380Better37%36%40%37%36%38%40%39%37%42%35%34%43%33%32%38%
3071146611366193352832363516404036299Worse31%35%zm22%33%m39%zj28%35%f27%32%22%26%31%27%37%f42%zcefh30%fjm
6255412-57551453213123-4-981Net better6%2%18%zln4%-3%11%zk5%b13%abd5%b19%zabdegi9%ab3%16%zabdgi-3%-10%8%abkln
Public Perceptions of the NHS and Social CareFINAL PUBLIC
Table 112Q20. NHS services and care, whilst still free, will be provided by a wider range of organisations in future. This will include the private sector and charities.To what extent do you think this will make the NHS better or worse over the next few years, or will it stay the same?
Base : All respondents
Respondent type : General public aged 16+ Fieldwork dates : 14th November - 9th December 2011Source : Ipsos MORI (JN10-039262-01)Proportions/Means: Columns Tested (5% risk level) - z/a/b/c/d/e/f/g/h/i - z/j/k - z/l/m/n - z/oOverlap formulae used. * small base

UnwtdImpact of NHS reforms ontotalDifficulties answering Q20Private health insuranceSatisfaction with social carepatientsGovernment has right NHS policy
Wtd.NoYesNoYesDissatisfiedSatisfiedWorseBetterDisagreeAgreeTotal
(k)(j)(i)(h)(g)(f)(e)(d)(c)(b)(a)(z)100193467815170442493822004032691001Unweighted Total100193665*81117544*2443792013932761001Weighted Total
525114393141024132252Get a lot better5%5%1%5%5%7%6%3%12%zd3%8%zb5%bd
31731513259631075949297114328Get a little better32%34%zi20%32%36%23%31%25%46%zd25%41%zb33%bdi
2692551322141116076528785268Stay the same27%27%20%27%23%25%24%20%26%22%31%b27%bd
197172201563414591041810131191Get a little worse20%18%30%zj19%20%32%z24%z27%zc9%26%za11%19%acj
11099983246277968012108Get a lot worse11%11%14%10%13%13%11%21%zc3%20%za4%11%ac
56449485-91710161253Don't know6%5%14%zj6%3%-4%4%5%4%4%5%j
36936614302721389104116110136380Better37%39%zi21%37%41%30%37%27%58%zd28%49%zb38%bdi
307270292395820861832318143299Worse31%29%44%zj30%33%45%z35%z48%zc12%46%za16%30%acj
6296-156314-73-7992-719381Net better6%10%zi-23%8%8%-15%1%-21%46%zd-18%34%zb8%bdefi
Public Perceptions of the NHS and Social CareFINAL PUBLIC
Table 113Q20. NHS services and care, whilst still free, will be provided by a wider range of organisations in future. This will include the private sector and charities.To what extent do you think this will make the NHS better or worse over the next few years, or will it stay the same?
Base : All respondents
Respondent type : General public aged 16+ Fieldwork dates : 14th November - 9th December 2011Source : Ipsos MORI (JN10-039262-01)Proportions/Means: Columns Tested (5% risk level) - z/a/b - z/c/d - z/e/f - z/g/h - z/i/j - z/kOverlap formulae used. * small base

UnwtdtotalWork StatusSocial GradeAgeGender
Full/part-Wtd.OtherUnemployedRetiredtimeDEC2C1AB65+55-6435-5425-3416-24FemaleMaleTotal
(p)(o)(n)(m)(l)(k)(j)(i)(h)(g)(f)(e)(d)(c)(b)(a)(z)1001162612705082472013062472201693311581235274741001Unweighted Total100115758*2355512392013122491981433501671435154861001Weighted Total
2633614886463558131326Strongly agree3%2%5%3%3%3%4%2%2%3%2%2%3%5%e3%3%3%
240391668116684379496032693741120119239Tend to agree24%25%27%29%zl21%29%h21%25%19%30%ze22%20%22%29%e23%24%24%el
1953193612247445553332071423111583198Neither agree nor19%20%15%15%22%m20%22%18%21%17%14%20%25%fg22%22%za17%20%afmdisagree
251411362131604083654942973922118130248Tend to disagree25%26%23%26%24%25%20%27%26%25%c29%c28%c24%15%23%27%25%c
1281273073213135352132531256756123Strongly disagree13%8%13%13%13%9%16%k11%14%10%c22%zcdg15%zcd7%3%13%12%12%cdo
16131933943435544429155432378285167Don't know/no opinion16%20%16%14%17%14%17%17%18%15%11%15%19%f26%zefg16%18%17%f
266421974131765185536634754249134132265Agree27%26%33%31%zl24%32%zh25%27%21%33%zef24%21%25%34%ze26%27%26%ehl
379532192204817111810069741505126185186370Disagree38%34%36%39%37%34%35%38%40%35%c51%zcdg43%zcd31%c18%36%38%37%c
-113-12-2-18-73-5-20-33-47-3-39-76-1023-51-54-105Net agree-11%-7%-3%-8%-13%-2%-10%-11%-19%-2%-27%-22%-6%16%dg-10%-11%-11%
Public Perceptions of the NHS and Social CareFINAL PUBLIC
Table 122Q21. The Department of Health defines social care as services to support people to be independent, play a full part in society and protect them invulnerable situations. It includes practical help in the home, day centres, residential and nursing care homes, as well as advice and guidance.To what extent, if at all, do you agree or disagree with the following statements?
- The government has the right policies for social care in England -
Base : All respondents
Respondent type : General public aged 16+ Fieldwork dates : 14th November - 9th December 2011Source : Ipsos MORI (JN10-039262-01)Proportions/Means: Columns Tested (5% risk level) - z/a/b - z/c/d/e/f/g - z/h/i/j/k - z/l/m/n/o - z/pOverlap formulae used. * small base

People aretreated with
Unwtddignity andtotalrespectNHS useHospital useEthnicityNHS/social care staffHousehold TypeHome Ownership
NotAdultshospitalHospitalInformalSocialwith
Non NHS/A&E/A&EsocialcareKnow NHSNHSdependentNon-Owner -PrivateSocialWtd.DisagreeAgreeuserNHS useruseruserMixedWhiteAsianBlackcarerworkerstaffstaffchildrenpensionerPensionerOtheroccupierrenterrenterTotal
(v)(u)(t)(s)(r)(q)(p)(o)(n)(m)(l)(k)(j)(i)(h)(g)(f)(e)(d)(c)(b)(a)(z)100130864710090145854310750741612543628951291461249106491691731001Unweighted Total1001304652104*89746853311**74778*15925038*29252*30547522110**6401781731001Weighted Total
26421125188-15561145-11971128526Strongly agree3%1%3%1%3%4%zp1%-2%7%zn4%4%i9%zhi2%-4%2%3%11%2%5%c3%3%cnp
240391933320612211711593344515701776996411604335239Tend to agree24%13%30%zu31%23%26%22%11%21%43%zln28%20%13%24%33%jk25%21%29%zf10%25%24%20%24%fnu
19557132211779810041511032521150467943731203541198Neither agree nor19%19%20%20%20%21%19%40%20%13%20%21%h29%h17%8%22%20%17%27%19%19%24%20%hdisagree
25111112519229102146319783859119314631305531564247248Tend to disagree25%37%zt19%18%26%22%27%zq30%26%m11%24%m24%28%32%zk27%21%27%g25%29%24%24%27%25%gmqt
128576161174577-1005174553011346326-892113123Strongly disagree13%19%zt9%5%13%zs10%15%zq-13%7%11%18%zi14%10%20%i11%13%12%-14%za12%8%12%aqst
161361202614183842126162331344655803221032933167Don't know/no opinion16%12%18%u25%zr16%18%16%18%17%20%15%12%7%15%11%18%17%14%22%16%16%19%17%kru
2664221434232140125117539506287517861087121735139265Agree27%14%33%zu32%26%30%zp23%11%23%50%zln31%n25%22%26%33%28%23%32%zf21%27%29%23%26%fnpu
37916818624346147224329613551051612325971938132456360370Disagree38%55%zt28%23%39%zs31%42%zq30%40%zm17%34%m42%42%42%z47%32%41%zg37%29%38%35%35%37%gmqst
-113-125289-115-7-99-2-12225-5-43-8-48-8-10-85-10-1-72-12-21-105Net agree-11%-41%4%9%-13%-1%-18%-19%-16%32%l-3%-17%-20%-16%-14%-3%-18%-5%-8%-11%-7%-12%-11%
Public Perceptions of the NHS and Social CareFINAL PUBLIC
Table 123Q21. The Department of Health defines social care as services to support people to be independent, play a full part in society and protect them invulnerable situations. It includes practical help in the home, day centres, residential and nursing care homes, as well as advice and guidance.To what extent, if at all, do you agree or disagree with the following statements?
- The government has the right policies for social care in England -
Base : All respondents
Respondent type : General public aged 16+ Fieldwork dates : 14th November - 9th December 2011Source : Ipsos MORI (JN10-039262-01)Proportions/Means: Columns Tested (5% risk level) - z/a/b/c/d - z/e/f/g - z/h/i/j/k - z/l/m/n/o - z/p/q - z/r/s - z/t/u - z/vOverlap formulae used. * small base; ** very small base (under 30) ineligible for sig testing

UnwtdtotalFuture of NHSSatisfaction with NHSGOR
DisYorkshire &WestEastWtd.WorseSameBettersatisfiedSatisfiedHumbersideMidlandsSouth-WestSouth-EastNorth-WestNorth-EastLondonEasternMidlandsTotal
(o)(n)(m)(l)(k)(j)(i)(h)(g)(f)(e)(d)(c)(b)(a)(z)1001328298343168703909910715413955143126881001Unweighted Total1001327302340168701100*106*10216213651*14810986*1001Weighted Total
264910323-2-29452226Strongly agree3%1%3%3%2%3%-2%-1%7%zfgi7%zfgi3%2%2%3%
24068887718198221322355112372324239Tend to agree24%21%29%zn23%11%28%zk22%12%22%22%38%zbcdfghi23%25%h21%28%h24%hk
19557696731138221821271710362620198Neither agree nor19%18%23%20%18%20%22%17%20%17%13%20%24%e24%e23%e20%edisagree
25187639556148342825412711442415248Tend to disagree25%27%21%28%m33%zj21%34%zae27%24%25%20%22%29%a22%17%25%j
128571548417210178121310161818123Strongly disagree13%17%zm5%14%m24%zj10%10%16%f8%7%10%19%f11%17%f21%zcefgi12%fjm
161535843191221227264519511147167Don't know/no opinion16%16%19%l13%11%17%k12%26%zabcdei26%zabcdei27%zabcdei14%9%8%13%9%17%ackl
26673978721221221522376015412626265Agree27%22%32%zn25%13%32%zk22%14%22%23%44%zabcfghi30%h28%h24%30%h26%hkn
3791447814497220434533534021604333370Disagree38%44%zm26%42%zm58%zj31%43%e43%e32%33%29%40%40%39%38%37%ejm
-113-7219-57-751-21-30-11-1620-5-18-17-7-105Net agree-11%-22%6%-17%-45%*-21%-29%-11%-10%15%abcdfg-10%-12%-15%-8%-11%
Public Perceptions of the NHS and Social CareFINAL PUBLIC
Table 124Q21. The Department of Health defines social care as services to support people to be independent, play a full part in society and protect them invulnerable situations. It includes practical help in the home, day centres, residential and nursing care homes, as well as advice and guidance.To what extent, if at all, do you agree or disagree with the following statements?
- The government has the right policies for social care in England -
Base : All respondents
Respondent type : General public aged 16+ Fieldwork dates : 14th November - 9th December 2011Source : Ipsos MORI (JN10-039262-01)Proportions/Means: Columns Tested (5% risk level) - z/a/b/c/d/e/f/g/h/i - z/j/k - z/l/m/n - z/oOverlap formulae used. * small base

UnwtdPrivate healthSatisfaction withImpact of NHS reformsGovernment has righttotalinsurancesocial careon patientsNHS policyNHS use in last year
SocialNHSDissatisficareWalk InChoicesPharmacistWtd.
NoYesedSatisfiedWorseBetterDisagreeAgreeservicesClinicwebsite/ChemistNHS DirectA&EOutpatientInpatientGPTotal(r)(q)(p)(o)(n)(m)(l)(k)(j)(i)(h)(g)(f)(e)(d)(c)(b)(a)(z)10018151704424938220040326945182553001772253931967801001Unweighted Total100181117544*24437920139327642*18856*3011832303761927731001Weighted Total
2623--8711416-5-436542126Strongly agree3%3%p--3%2%5%zm1%6%zk-3%-1%2%3%1%2%3%cf3%ckp
2401993547556723912663594628497451167239Tend to agree24%25%20%8%31%zo15%36%zm10%46%zk15%19%16%15%16%21%f20%f27%cefh22%ef24%acefkmo
1951574055067426346843116148496935154198Neither agree nor19%19%23%11%21%18%21%16%17%18%23%20%20%27%zabcf21%18%18%20%20%kdisagree
251200451860122341494215461488446110949204248Tend to disagree25%25%26%41%zn24%32%zl17%38%zj15%36%24%25%29%z24%26%29%z25%26%z25%jl
1281012115298112966531114523325930106123Strongly disagree13%12%12%35%zn12%21%zl6%24%zj2%12%16%19%15%13%14%16%z16%14%z12%jl
1611313522246314239828115636336023122167Don't know/no opinion16%16%20%5%9%12%15%11%14%18%15%20%19%b20%b14%16%12%16%17%bkmno
2662223548464824314264195032567955188265Agree27%27%p20%8%34%zo17%41%zm11%52%zk15%22%16%17%17%24%ef21%29%cefgi24%ef26%acefkmo
p
3793016633892024624548207625133679316879310370Disagree38%37%38%76%zn36%53%zl23%62%zj17%48%41%44%44%ze36%40%45%zae41%40%z37%jl
-113-79-32-30-5-13936-20294-14-35-16-83-35-37-89-24-122-105Net agree-11%-10%-18%-67%-2%-37%18%-51%34%-33%-19%-28%-28%-19%-16%-24%-12%-16%-11%
Public Perceptions of the NHS and Social CareFINAL PUBLIC
Table 125Q21. The Department of Health defines social care as services to support people to be independent, play a full part in society and protect them invulnerable situations. It includes practical help in the home, day centres, residential and nursing care homes, as well as advice and guidance.To what extent, if at all, do you agree or disagree with the following statements?
- The government has the right policies for social care in England -
Base : All respondents
Respondent type : General public aged 16+ Fieldwork dates : 14th November - 9th December 2011Source : Ipsos MORI (JN10-039262-01)Proportions/Means: Columns Tested (5% risk level) - z/a/b/c/d/e/f/g/h/i - z/j/k - z/l/m - z/n/o - z/p/q - z/rOverlap formulae used. * small base

UnwtdtotalWork StatusSocial GradeAgeGender
Full/part-Wtd.OtherUnemployedRetiredtimeDEC2C1AB65+55-6435-5425-3416-24FemaleMaleTotal
(p)(o)(n)(m)(l)(k)(j)(i)(h)(g)(f)(e)(d)(c)(b)(a)(z)1001162612705082472013062472201693311581235274741001Unweighted Total100115758*2355512392013122491981433501671435154861001Weighted Total
47341622121111101581057232245Strongly agree5%2%7%7%zo4%5%6%4%4%7%ze6%3%3%5%4%4%4%
3285720801718674104656847945960164165329Tend to agree33%37%35%34%31%36%h37%h33%26%34%33%27%35%42%ze32%34%33%eh
19032134010649376342332576342390100191Neither agree nor19%20%22%17%19%21%18%20%17%16%17%22%20%16%18%21%19%disagree
228301352131513780604235953222122105227Tend to disagree23%19%23%22%24%21%18%26%24%21%25%27%zc19%15%24%22%23%c
7783174714162223131628144472875Strongly disagree8%5%5%7%9%6%8%7%9%7%11%c8%c8%c2%9%6%7%ac
13127529732627324927124623286966135Don't know/no opinion13%17%9%13%13%11%14%10%20%zik14%8%13%14%19%f13%14%13%f
37560249719398851157582551056467187186374Agree37%38%41%41%35%41%h42%h37%30%42%e39%30%38%47%ze36%38%37%eh
30538166917865521018356511234626168133302Disagree30%24%28%29%32%27%26%33%33%28%c36%c35%zc27%18%33%27%30%c
702282715333314-8274-181841195372Net agree7%14%zl13%l12%zl3%14%zhi16%zhi4%h-3%14%zef3%-5%11%ef29%zdefg4%11%zb7%befhil
Public Perceptions of the NHS and Social CareFINAL PUBLIC
Table 126Q21. The Department of Health defines social care as services to support people to be independent, play a full part in society and protect them invulnerable situations. It includes practical help in the home, day centres, residential and nursing care homes, as well as advice and guidance.To what extent, if at all, do you agree or disagree with the following statements?
- Overall, local authorities in England are providing good social care services -
Base : All respondents
Respondent type : General public aged 16+ Fieldwork dates : 14th November - 9th December 2011Source : Ipsos MORI (JN10-039262-01)Proportions/Means: Columns Tested (5% risk level) - z/a/b - z/c/d/e/f/g - z/h/i/j/k - z/l/m/n/o - z/pOverlap formulae used. * small base

People aretreated with
Unwtddignity andtotalrespectNHS useHospital useEthnicityNHS/social care staffHousehold TypeHome Ownership
NotAdultshospitalHospitalInformalSocialwith
Non NHS/A&E/A&EsocialcareKnow NHSNHSdependentNon-Owner -PrivateSocialWtd.DisagreeAgreeuserNHS useruseruserMixedWhiteAsianBlackcarerworkerstaffstaffchildrenpensionerPensionerOtheroccupierrenterrenterTotal
(v)(u)(t)(s)(r)(q)(p)(o)(n)(m)(l)(k)(j)(i)(h)(g)(f)(e)(d)(c)(b)(a)(z)100130864710090145854310750741612543628951291461249106491691731001Unweighted Total1001304652104*89746853311**74778*15925038*29252*30547522110**6401781731001Weighted Total
476375402421-29511142111151415-2710845Strongly agree5%2%6%zu5%4%5%4%-4%7%7%6%5%4%2%5%3%7%zf-4%6%5%4%fu
328542604228715517422294056831595231021557132025866329Tend to agree33%18%40%zu40%32%33%33%22%31%52%zln35%33%39%32%44%34%33%32%31%32%33%38%33%nu
190591212216999922138113846756661933821223235191Neither agree nor19%20%19%21%19%21%17%21%18%14%24%18%17%19%12%20%20%17%18%19%18%20%19%disagree
2281071111521210312331875305477514641164731434239227Tend to disagree23%35%zt17%15%24%zs22%23%30%25%zm7%19%m22%18%26%27%21%24%21%29%22%23%23%23%mst
774429471235226229338175193718-5710775Strongly disagree8%14%zt4%4%8%5%10%zq18%8%2%5%13%zi20%zi6%10%6%8%8%-9%za6%4%7%qt
13133941711864711102141619-3834459322892618135Don't know/no opinion13%11%14%16%13%14%13%9%14%19%10%8%-13%jk5%14%13%14%22%14%15%10%13%jk
3756029747327179195225845679717106241171708732296874374Agree37%20%46%zu45%36%38%37%22%35%58%zln42%39%44%36%45%38%36%39%31%36%38%43%37%nu
30515114019282127175524973888159219831536532005246302Disagree30%50%zt21%18%32%zs27%33%z49%33%zlm9%24%m35%39%32%37%27%32%30%29%31%29%27%30%mst
70-9115728455220-39382992144341721*28162872Net agree7%-30%24%zu27%zr5%11%zp4%-27%1%49%zln18%zn4%5%5%8%11%zf4%10%f2%4%9%c16%zc7%cfikn
pr
Public Perceptions of the NHS and Social CareFINAL PUBLIC
Table 127Q21. The Department of Health defines social care as services to support people to be independent, play a full part in society and protect them invulnerable situations. It includes practical help in the home, day centres, residential and nursing care homes, as well as advice and guidance.To what extent, if at all, do you agree or disagree with the following statements?
- Overall, local authorities in England are providing good social care services -
Base : All respondents
Respondent type : General public aged 16+ Fieldwork dates : 14th November - 9th December 2011Source : Ipsos MORI (JN10-039262-01)Proportions/Means: Columns Tested (5% risk level) - z/a/b/c/d - z/e/f/g - z/h/i/j/k - z/l/m/n/o - z/p/q - z/r/s - z/t/u - z/vOverlap formulae used. * small base; ** very small base (under 30) ineligible for sig testing

UnwtdtotalFuture of NHSSatisfaction with NHSGOR
DisYorkshire &WestEastWtd.WorseSameBettersatisfiedSatisfiedHumbersideMidlandsSouth-WestSouth-EastNorth-WestNorth-EastLondonEasternMidlandsTotal
(o)(n)(m)(l)(k)(j)(i)(h)(g)(f)(e)(d)(c)(b)(a)(z)1001328298343168703909910715413955143126881001Unweighted Total1001327302340168701100*106*10216213651*14810986*1001Weighted Total
47101417439312313565645Strongly agree5%3%5%5%3%6%z3%1%2%2%10%zfgh11%zfgh4%4%7%h4%
32810311310132258382536466012483528329Tend to agree33%32%37%zl30%19%37%zk38%h23%35%28%44%zcdfh24%32%32%33%33%hk
19055686433134171920262113351821191Neither agree nor19%17%22%19%20%19%17%18%20%16%15%25%24%17%24%19%disagree
22880489656138252925411610373014227Tend to disagree23%24%m16%28%zm33%zj20%25%e27%e24%e25%e12%20%25%e27%e17%23%ejm
77361029273851249136591275Strongly disagree8%11%zm3%8%m16%zj5%5%11%c4%5%9%c12%c3%8%14%zcfg7%cjm
13143493416941221153713417125135Don't know/no opinion13%13%16%l10%10%13%12%19%ae15%a23%zabcdei10%8%11%11%6%13%al
37511412711836297412638507318544034374Agree37%35%42%z35%22%42%zk41%h24%37%h31%54%zabcdfgh34%36%h37%h40%h37%hk
3051165812582176304129492916423926302Disagree30%35%zm19%37%zm49%zj25%30%39%e28%30%21%32%28%36%e30%30%ejm
70-269-7-4612111-159*441121872Net agree7%-1%23%zln-2%-28%17%zk11%bf-14%9%bf*33%zabcdfghi2%8%bf1%10%bf7%bfhkln
Public Perceptions of the NHS and Social CareFINAL PUBLIC
Table 128Q21. The Department of Health defines social care as services to support people to be independent, play a full part in society and protect them invulnerable situations. It includes practical help in the home, day centres, residential and nursing care homes, as well as advice and guidance.To what extent, if at all, do you agree or disagree with the following statements?
- Overall, local authorities in England are providing good social care services -
Base : All respondents
Respondent type : General public aged 16+ Fieldwork dates : 14th November - 9th December 2011Source : Ipsos MORI (JN10-039262-01)Proportions/Means: Columns Tested (5% risk level) - z/a/b/c/d/e/f/g/h/i - z/j/k - z/l/m/n - z/oOverlap formulae used. * small base

UnwtdPrivate healthSatisfaction withImpact of NHS reformsGovernment has righttotalinsurancesocial careon patientsNHS policyNHS use in last year
SocialNHSDissatisficareWalk InChoicesPharmacistWtd.
NoYesedSatisfiedWorseBetterDisagreeAgreeservicesClinicwebsite/ChemistNHS DirectA&EOutpatientInpatientGPTotal(r)(q)(p)(o)(n)(m)(l)(k)(j)(i)(h)(g)(f)(e)(d)(c)(b)(a)(z)10018151704424938220040326945182553001772253931967801001Unweighted Total100181117544*24437920139327642*18856*3011832303761927731001Weighted Total
47403-1714161320481123716123445Strongly agree5%5%2%-7%z4%8%zm3%7%zk8%e4%1%4%2%3%4%6%e4%e4%e
32827347310694859612613691079608111566232329Tend to agree33%34%27%7%43%zo25%42%zm24%46%zk32%37%afg18%26%33%g35%fg30%g34%fg30%33%afgkmo
190160306397534714363295931506134145191Neither agree nor19%20%17%14%16%20%17%18%15%14%17%16%20%17%22%c16%18%19%19%disagree
22817352214710825131401543208349459140194227Tend to disagree23%21%30%zq48%zn19%28%zl13%33%zj15%37%zbcdh23%36%zbdh28%zbd27%d20%24%21%25%zd23%jlq
77641112214812489116728172238226275Strongly disagree8%8%6%27%zn8%13%zl6%12%zj3%3%9%13%9%9%9%10%z12%z8%7%j
131101322154129353831993923255618105135Don't know/no opinion13%12%18%q4%6%11%14%9%14%k6%10%16%13%13%11%15%b10%14%13%kmn
37531350312310810110914617771192638813178266374Agree37%39%p29%7%50%zo29%50%zm28%53%zk40%g41%afg20%31%34%g38%fg35%g40%fg34%g37%afgkmop
3052366333671553717949175927111666712962256302Disagree30%29%36%75%zn28%41%zl18%45%zj18%40%32%48%zabcdh37%zd36%29%34%z32%33%z30%jl
7077-13-3055-4764-7097*18-16-19-3211151072Net agree7%9%zp-7%-68%23%zo-12%32%zm-18%35%zk*9%acegi-29%-6%-2%9%acefg*8%acei1%e7%acefgkmo
p
Public Perceptions of the NHS and Social CareFINAL PUBLIC
Table 129Q21. The Department of Health defines social care as services to support people to be independent, play a full part in society and protect them invulnerable situations. It includes practical help in the home, day centres, residential and nursing care homes, as well as advice and guidance.To what extent, if at all, do you agree or disagree with the following statements?
- Overall, local authorities in England are providing good social care services -
Base : All respondents
Respondent type : General public aged 16+ Fieldwork dates : 14th November - 9th December 2011Source : Ipsos MORI (JN10-039262-01)Proportions/Means: Columns Tested (5% risk level) - z/a/b/c/d/e/f/g/h/i - z/j/k - z/l/m - z/n/o - z/p/q - z/rOverlap formulae used. * small base

UnwtdtotalWork StatusSocial GradeAgeGender
Full/part-Wtd.OtherUnemployedRetiredtimeDEC2C1AB65+55-6435-5425-3416-24FemaleMaleTotal
(p)(o)(n)(m)(l)(k)(j)(i)(h)(g)(f)(e)(d)(c)(b)(a)(z)1001162612705082472013062472201693311581235274741001Unweighted Total100115758*2355512392013122491981433501671435154861001Weighted Total
7485282921191317241318211343669Strongly agree7%5%8%12%zlo5%9%i9%i4%7%12%zde9%d5%d1%8%d7%7%7%dil
311492084159907098547040905953152160312Tend to agree31%31%34%36%29%38%zh35%h32%h22%36%e28%26%35%e37%e29%33%31%eh
182306341174535624425217838259393186Neither agree nor18%19%10%14%21%zmn19%17%20%18%13%14%22%zfg23%g18%18%19%19%gmdisagree
159281136794225563428326018178868156Tend to disagree16%18%20%16%14%17%12%18%14%14%22%zcdg17%11%12%17%14%16%5664837101315179102672312455Strongly disagree6%4%7%4%7%4%7%5%7%4%7%c8%c4%2%6%5%5%c
219361345129324068834127774334118105223Don't know/no opinion22%23%22%19%23%13%20%22%k33%zijk21%19%22%26%24%23%22%22%k
3855824111188111891117195531096164185196381Agree38%37%42%47%zlo34%46%zhi44%h36%28%48%zdef37%31%36%44%e36%40%38%ehl
21534154511651387151374286262011992211Disagree21%22%26%19%21%21%19%23%20%19%29%zcdg25%cd15%14%23%19%21%c
170249667260514020581123354466105171Net agree17%15%15%28%zlno13%25%zhi25%zhi13%8%29%zef8%7%21%ef31%zef13%22%zb17%befhil
Public Perceptions of the NHS and Social CareFINAL PUBLIC
Table 130Q21. The Department of Health defines social care as services to support people to be independent, play a full part in society and protect them invulnerable situations. It includes practical help in the home, day centres, residential and nursing care homes, as well as advice and guidance.To what extent, if at all, do you agree or disagree with the following statements?
- My local authority is providing people in this area with good social care services -
Base : All respondents
Respondent type : General public aged 16+ Fieldwork dates : 14th November - 9th December 2011Source : Ipsos MORI (JN10-039262-01)Proportions/Means: Columns Tested (5% risk level) - z/a/b - z/c/d/e/f/g - z/h/i/j/k - z/l/m/n/o - z/pOverlap formulae used. * small base

People aretreated with
Unwtddignity andtotalrespectNHS useHospital useEthnicityNHS/social care staffHousehold TypeHome Ownership
NotAdultshospitalHospitalInformalSocialwith
Non NHS/A&E/A&EsocialcareKnow NHSNHSdependentNon-Owner -PrivateSocialWtd.DisagreeAgreeuserNHS useruseruserMixedWhiteAsianBlackcarerworkerstaffstaffchildrenpensionerPensionerOtheroccupierrenterrenterTotal
(v)(u)(t)(s)(r)(q)(p)(o)(n)(m)(l)(k)(j)(i)(h)(g)(f)(e)(d)(c)(b)(a)(z)100130864710090145854310750741612543628951291461249106491691731001Unweighted Total1001304652104*89746853311**74778*15925038*29252*30547522110**6401781731001Weighted Total
749583663238-51414234205212226-46111369Strongly agree7%3%9%zu3%7%7%7%-7%5%9%9%10%7%9%7%5%12%zfg-7%6%7%7%fu
31170230402721611512222335378128919891477621885864312Tend to agree31%23%35%zu39%30%34%zp28%21%30%42%zn34%31%30%30%35%29%31%34%20%29%33%37%31%pu
182561202616097893138133044862769882941173233186Neither agree nor18%18%18%25%18%21%17%31%18%17%19%18%20%21%14%23%ze18%13%37%18%18%19%19%edisagree
1596586121446789211852940444123983331922537156Tend to disagree16%22%zt13%11%16%14%17%19%16%m6%18%m16%10%15%23%13%18%15%10%14%14%21%zc16%mt
5638141541738-4627266114123211-408755Strongly disagree6%13%zt2%1%6%zs4%7%zq-6%2%5%10%zi17%zi4%7%4%7%5%-6%5%4%5%qst
21965143222009412931722125395676751024631564320223Don't know/no opinion22%21%22%21%22%20%24%29%23%26%16%16%12%23%k12%24%22%21%34%24%za24%a11%22%akl
385802884433819318922743767101161092310917010222346977381Agree38%26%44%zu42%38%41%35%21%37%48%42%40%40%37%44%36%36%46%zfg20%37%39%44%38%u
2151041001319884126216473767105515521154411333343211Disagree21%34%zt15%12%22%zs18%24%zq19%22%m9%23%m27%zi27%19%30%17%24%zg20%10%21%19%25%21%gmqst
170-241873114010862*110303134554858545911013633171Net agree17%-8%29%zu30%zr16%23%zp12%2%15%39%zln19%14%13%19%15%19%f11%27%zfg10%16%20%19%17%fnpru
Public Perceptions of the NHS and Social CareFINAL PUBLIC
Table 131Q21. The Department of Health defines social care as services to support people to be independent, play a full part in society and protect them invulnerable situations. It includes practical help in the home, day centres, residential and nursing care homes, as well as advice and guidance.To what extent, if at all, do you agree or disagree with the following statements?
- My local authority is providing people in this area with good social care services -
Base : All respondents
Respondent type : General public aged 16+ Fieldwork dates : 14th November - 9th December 2011Source : Ipsos MORI (JN10-039262-01)Proportions/Means: Columns Tested (5% risk level) - z/a/b/c/d - z/e/f/g - z/h/i/j/k - z/l/m/n/o - z/p/q - z/r/s - z/t/u - z/vOverlap formulae used. * small base; ** very small base (under 30) ineligible for sig testing

UnwtdtotalFuture of NHSSatisfaction with NHSGOR
DisYorkshire &WestEastWtd.WorseSameBettersatisfiedSatisfiedHumbersideMidlandsSouth-WestSouth-EastNorth-WestNorth-EastLondonEasternMidlandsTotal
(o)(n)(m)(l)(k)(j)(i)(h)(g)(f)(e)(d)(c)(b)(a)(z)1001328298343168703909910715413955143126881001Unweighted Total1001327302340168701100*106*10216213651*14810986*1001Weighted Total
741724255604445176812969Strongly agree7%5%8%7%3%9%zk4%3%4%3%12%zfghi13%fhi6%11%fh11%fh7%fk
3119210110525251412323456316423326312Tend to agree31%28%34%31%15%36%zk41%zfgh22%23%28%46%zabcfgh31%29%30%30%31%ghk
1825572563712511212326168392023186Neither agree nor18%17%24%zln16%22%18%11%20%22%ei16%12%15%26%zefi18%26%ei19%edisagree
159542973478726181714161132166156Tend to disagree16%17%m10%21%zm28%zj12%26%zaef17%af16%8%11%23%af22%zaef15%7%16%afjm
56257232229288583351155Strongly disagree6%8%m2%7%m13%zj4%2%8%c7%c3%6%7%2%5%13%zbcfi5%jm
2198469593115016312866176232411223Don't know/no opinion22%26%l23%17%18%21%16%29%acdei27%acde41%zabcdegi13%12%16%22%e13%22%acel
38510912513030311452727507922514435381Agree38%33%41%n38%18%44%zk45%fgh25%27%31%58%zabcfghi44%gh34%41%gh41%gh38%ghkn
21579369669116282724192415352118211Disagree21%24%m12%28%zm41%zj16%28%f25%f24%f12%17%29%f24%f19%20%21%fjm
170298934-3919617*331568152317171Net agree17%9%30%zln10%-23%28%zk17%gh*3%19%cgh41%zabcdfghi15%gh10%gh21%cgh20%cgh17%cghkln
Public Perceptions of the NHS and Social CareFINAL PUBLIC
Table 132Q21. The Department of Health defines social care as services to support people to be independent, play a full part in society and protect them invulnerable situations. It includes practical help in the home, day centres, residential and nursing care homes, as well as advice and guidance.To what extent, if at all, do you agree or disagree with the following statements?
- My local authority is providing people in this area with good social care services -
Base : All respondents
Respondent type : General public aged 16+ Fieldwork dates : 14th November - 9th December 2011Source : Ipsos MORI (JN10-039262-01)Proportions/Means: Columns Tested (5% risk level) - z/a/b/c/d/e/f/g/h/i - z/j/k - z/l/m/n - z/oOverlap formulae used. * small base

UnwtdPrivate healthSatisfaction withImpact of NHS reformsGovernment has righttotalinsurancesocial careon patientsNHS policyNHS use in last year
SocialNHSDissatisficareWalk InChoicesPharmacistWtd.
NoYesedSatisfiedWorseBetterDisagreeAgreeservicesClinicwebsite/ChemistNHS DirectA&EOutpatientInpatientGPTotal(r)(q)(p)(o)(n)(m)(l)(k)(j)(i)(h)(g)(f)(e)(d)(c)(b)(a)(z)10018151704424938220040326945182553001772253931967801001Unweighted Total100181117544*24437920139327642*18856*3011832303761927731001Weighted Total
74652-3031153022813320121628155769Strongly agree7%8%zp1%-12%zo8%8%8%8%19%zabcdefg7%6%7%7%7%7%8%7%7%p
h
31126144210510278881201356872477110063228312Tend to agree31%32%25%5%43%zo27%39%zm22%43%zk31%30%g14%24%26%g31%fg27%g33%cfg30%fg31%acfgkmo
1821493633566347343742146236415338135186Neither agree nor18%18%21%7%14%17%17%19%16%17%22%c26%c21%c20%c18%14%20%c17%c19%codisagree
15913023183475298925102375728376431128156Tend to disagree16%16%13%41%zn14%20%z15%23%zj9%23%12%13%19%h16%16%17%16%17%16%j
5644111211359365216621151627144555Strongly disagree6%5%7%28%zn5%9%z5%9%zj2%5%8%11%7%8%7%7%7%6%5%j
21916258928703576602381769434910331179223Don't know/no opinion22%20%33%zq19%12%18%18%19%22%5%20%i30%bi23%bi24%bi21%i27%zabdhi16%i23%bi22%bimnq
3853264621351339311914221691191598712878285381Agree38%40%zp26%5%55%zo35%46%zm30%52%zk50%cefg37%g20%30%32%g38%fg34%g40%cfg37%fg38%cfgkop
21517334304511039125311239147844539245174211Disagree21%21%20%69%zn19%29%zl19%32%zj11%28%21%25%26%z24%23%24%z24%22%z21%j
17015312-28902355-7112930-31315343733112171Net agree17%19%zp7%-63%37%zo6%27%zm-2%40%zk21%cefg16%cefg-5%4%g8%g15%cefg10%fg17%cefg14%cefg17%acefgkm
op
Public Perceptions of the NHS and Social CareFINAL PUBLIC
Table 133Q21. The Department of Health defines social care as services to support people to be independent, play a full part in society and protect them invulnerable situations. It includes practical help in the home, day centres, residential and nursing care homes, as well as advice and guidance.To what extent, if at all, do you agree or disagree with the following statements?
- My local authority is providing people in this area with good social care services -
Base : All respondents
Respondent type : General public aged 16+ Fieldwork dates : 14th November - 9th December 2011Source : Ipsos MORI (JN10-039262-01)Proportions/Means: Columns Tested (5% risk level) - z/a/b/c/d/e/f/g/h/i - z/j/k - z/l/m - z/n/o - z/p/q - z/rOverlap formulae used. * small base

UnwtdtotalWork StatusSocial GradeAgeGender
Full/part-Wtd.OtherUnemployedRetiredtimeDEC2C1AB65+55-6435-5425-3416-24FemaleMaleTotal
(p)(o)(n)(m)(l)(k)(j)(i)(h)(g)(f)(e)(d)(c)(b)(a)(z)1001162612705082472013062472201693311581235274741001Unweighted Total100115758*2355512392013122491981433501671435154861001Weighted Total
757430312421169251516312333871Strongly agree7%4%7%13%zlo6%10%zhi11%zhi5%4%13%zde10%de5%2%8%d6%8%7%deh
271401482132786176546839794340131137269Tend to agree27%26%25%35%zl24%32%zhi31%h24%22%34%ze27%23%26%28%25%28%27%ehl
1732810331054432623828186534308987176Neither agree nor17%18%16%14%19%19%16%20%15%14%13%19%20%21%17%18%18%disagree
169291137904331573629305929198680167Tend to disagree17%19%19%16%16%18%15%18%14%15%21%17%18%13%17%17%17%70841146121523209133864472369Strongly disagree7%5%7%5%8%5%7%7%8%5%9%c11%zcdg4%3%9%za5%7%ac
243451543146384177923829925138128120248Don't know/no opinion24%28%m26%18%26%m16%20%25%k37%zijk19%20%26%31%fg27%25%25%25%gkm
34647181111631028392639354964752164176340Agree35%30%31%47%zlno30%43%zhi41%zhi30%25%47%zde37%e27%28%36%32%36%34%ehl
239381548136554580563843973623133103236Disagree24%24%26%20%25%23%23%26%22%19%30%zcg28%zcg21%16%26%21%24%c
107103632747371275511-211293173104Net agree11%6%5%27%zlno5%20%zhi19%zhi4%3%28%zdef8%e*7%e20%zdef6%15%zb10%behil
Public Perceptions of the NHS and Social CareFINAL PUBLIC
Table 134Q21. The Department of Health defines social care as services to support people to be independent, play a full part in society and protect them invulnerable situations. It includes practical help in the home, day centres, residential and nursing care homes, as well as advice and guidance.To what extent, if at all, do you agree or disagree with the following statements?
- My local authority is providing a good service for older people -
Base : All respondents
Respondent type : General public aged 16+ Fieldwork dates : 14th November - 9th December 2011Source : Ipsos MORI (JN10-039262-01)Proportions/Means: Columns Tested (5% risk level) - z/a/b - z/c/d/e/f/g - z/h/i/j/k - z/l/m/n/o - z/pOverlap formulae used. * small base

People aretreated with
Unwtddignity andtotalrespectNHS useHospital useEthnicityNHS/social care staffHousehold TypeHome Ownership
NotAdultshospitalHospitalInformalSocialwith
Non NHS/A&E/A&EsocialcareKnow NHSNHSdependentNon-Owner -PrivateSocialWtd.DisagreeAgreeuserNHS useruseruserMixedWhiteAsianBlackcarerworkerstaffstaffchildrenpensionerPensionerOtheroccupierrenterrenterTotal
(v)(u)(t)(s)(r)(q)(p)(o)(n)(m)(l)(k)(j)(i)(h)(g)(f)(e)(d)(c)(b)(a)(z)100130864710090145854310750741612543628951291461249106491691731001Unweighted Total1001304652104*89746853311**74778*15925038*29252*30547522110**6401781731001Weighted Total
7511584683438-52612253154202229-43121671Strongly agree7%4%9%zu4%8%7%7%-7%8%7%10%zi7%5%8%7%5%13%zfg-7%7%9%7%fu
27154203332351361331182266068137716701277231723757269Tend to agree27%18%31%zu32%26%29%25%10%24%33%38%zn27%33%26%31%23%27%32%zg28%27%21%33%b27%nu
173491182415296802136171837561657893141103230176Neither agree nor17%16%18%23%17%21%zp15%21%18%l22%l11%15%13%21%k11%19%19%14%40%17%18%17%18%lpdisagree
16970891515173943130231435491245863611013430167Tend to disagree17%23%zt14%15%17%15%18%30%17%m2%19%m17%13%17%22%15%18%16%10%16%19%18%17%mt
7046222672149-54411339204193812-5461069Strongly disagree7%15%zt3%2%8%zs4%9%zq-7%5%7%13%zi23%zhi7%7%6%8%5%-8%zb3%6%7%bqst
2437216126223110139419322274347111941134221605829248Don't know/no opinion24%24%25%24%25%23%26%39%26%l29%l17%17%9%24%jk20%31%zef24%19%22%25%a32%za17%25%aejkl
346652623730316917112343272931692219014910132154973340Agree35%22%40%zu36%34%36%32%10%31%41%45%zn37%40%31%40%30%31%45%zfg28%34%28%42%zbc34%nu
2391171111821993143318464276146915641244811554041236Disagree24%38%zt17%17%24%20%27%zq30%25%m8%26%m31%zi37%24%29%21%26%22%10%24%22%24%24%mqt
107-5115120847627-2502630171235262552260932104Net agree11%-17%23%zu19%zr9%16%zp5%-20%7%33%zln19%zn7%4%8%10%8%5%24%zfg18%9%5%19%zbc10%bfknp
ru
Public Perceptions of the NHS and Social CareFINAL PUBLIC
Table 135Q21. The Department of Health defines social care as services to support people to be independent, play a full part in society and protect them invulnerable situations. It includes practical help in the home, day centres, residential and nursing care homes, as well as advice and guidance.To what extent, if at all, do you agree or disagree with the following statements?
- My local authority is providing a good service for older people -
Base : All respondents
Respondent type : General public aged 16+ Fieldwork dates : 14th November - 9th December 2011Source : Ipsos MORI (JN10-039262-01)Proportions/Means: Columns Tested (5% risk level) - z/a/b/c/d - z/e/f/g - z/h/i/j/k - z/l/m/n/o - z/p/q - z/r/s - z/t/u - z/vOverlap formulae used. * small base; ** very small base (under 30) ineligible for sig testing

UnwtdtotalFuture of NHSSatisfaction with NHSGOR
DisYorkshire &WestEastWtd.WorseSameBettersatisfiedSatisfiedHumbersideMidlandsSouth-WestSouth-EastNorth-WestNorth-EastLondonEasternMidlandsTotal
(o)(n)(m)(l)(k)(j)(i)(h)(g)(f)(e)(d)(c)(b)(a)(z)1001328298343168703909910715413955143126881001Unweighted Total1001327302340168701100*106*10216213651*14810986*1001Weighted Total
75191729859773619598771Strongly agree7%6%6%9%5%8%z7%7%3%3%14%zcfg10%f6%7%8%7%
27176949024219362121354717353126269Tend to agree27%23%31%n27%14%31%zk36%zfgh20%20%22%34%zfgh33%24%29%30%27%k
1734970552612415152227187362115176Neither agree nor17%15%23%zln16%16%18%15%14%22%16%13%13%24%zeh19%18%18%disagree
1695433774888212215211812252014167Tend to disagree17%17%m11%23%zm28%zj12%21%21%14%13%13%23%17%18%16%17%jm
70331423263851395115741069Strongly disagree7%10%zm5%7%16%zj5%5%13%zbcf9%3%8%9%5%4%12%bcf7%fj
2439774663617416283268236362414248Don't know/no opinion24%29%zl24%19%21%25%16%26%d32%adei42%zabcdehi17%12%24%22%16%25%deil
3469511112032278432824416522453933340Agree35%29%37%n35%19%40%zk43%fgh26%23%25%48%zcfgh43%fgh30%36%g38%fg34%fgkn
239874810074125263623262916322424236Disagree24%27%m16%29%zm44%zj18%26%34%zcef23%16%21%32%f21%22%28%f24%fjm
10786320-4115317-8*1536613159104Net agree11%2%21%zln6%n-25%22%zk17%zgh-7%*9%gh27%zabcdfgh12%g9%gh14%gh10%gh10%ghkln
Public Perceptions of the NHS and Social CareFINAL PUBLIC
Table 136Q21. The Department of Health defines social care as services to support people to be independent, play a full part in society and protect them invulnerable situations. It includes practical help in the home, day centres, residential and nursing care homes, as well as advice and guidance.To what extent, if at all, do you agree or disagree with the following statements?
- My local authority is providing a good service for older people -
Base : All respondents
Respondent type : General public aged 16+ Fieldwork dates : 14th November - 9th December 2011Source : Ipsos MORI (JN10-039262-01)Proportions/Means: Columns Tested (5% risk level) - z/a/b/c/d/e/f/g/h/i - z/j/k - z/l/m/n - z/oOverlap formulae used. * small base

UnwtdPrivate healthSatisfaction withImpact of NHS reformsGovernment has righttotalinsurancesocial careon patientsNHS policyNHS use in last year
SocialNHSDissatisficareWalk InChoicesPharmacistWtd.
NoYesedSatisfiedWorseBetterDisagreeAgreeservicesClinicwebsite/ChemistNHS DirectA&EOutpatientInpatientGPTotal(r)(q)(p)(o)(n)(m)(l)(k)(j)(i)(h)(g)(f)(e)(d)(c)(b)(a)(z)10018151704424938220040326945182553001772253931967801001Unweighted Total100181117544*24437920139327642*18856*3011832303761927731001Weighted Total
75635-39281729245731151526125971Strongly agree7%8%p3%-16%zo7%8%7%9%11%efh4%5%4%3%7%e7%ef6%8%efh7%efhp
27123925286836170106124646832619353195269Tend to agree27%30%zp14%4%35%zo22%30%m18%38%zk28%g24%eg7%22%g17%g27%eg25%eg28%eg25%eg27%aefgkmo
p
1731403323960396740634105338384938133176Neither agree nor17%17%19%4%16%o16%19%17%14%15%18%18%18%c21%c17%13%20%c17%c18%codisagree
169135301534812794291034115936367033132167Tend to disagree17%17%17%33%zn14%21%zl13%24%zj10%24%18%19%20%20%16%19%17%17%17%j
70571219173715488318424172435195569Strongly disagree7%7%7%42%zn7%10%z7%12%zj3%7%10%8%8%9%10%za9%z10%7%7%j
24317771830914285696492485555510335199248Don't know/no opinion24%22%40%zq17%12%24%21%22%25%15%26%b43%zabcdef28%bi30%bi24%27%b18%26%b25%bknq
hi
346302292125111781001301652779377611966254340Agree35%37%zp17%4%51%zo29%39%m25%47%zk39%eg28%eg12%26%g20%33%efg32%efg34%efg33%efg34%efgkmop
239192423351118421413713521584536010552187236Disagree24%24%24%75%zn21%31%zl21%36%zj13%32%28%26%28%z29%26%28%za27%24%24%j
107111-13-3174-736-42933*-8-5-1616151467104Net agree11%14%zp-7%-71%30%zo-2%18%zm-11%34%zk7%h*-14%-2%-9%7%cefgh4%fgh7%cfgh9%cefgh10%acefghkm
op
Public Perceptions of the NHS and Social CareFINAL PUBLIC
Table 137Q21. The Department of Health defines social care as services to support people to be independent, play a full part in society and protect them invulnerable situations. It includes practical help in the home, day centres, residential and nursing care homes, as well as advice and guidance.To what extent, if at all, do you agree or disagree with the following statements?
- My local authority is providing a good service for older people -
Base : All respondents
Respondent type : General public aged 16+ Fieldwork dates : 14th November - 9th December 2011Source : Ipsos MORI (JN10-039262-01)Proportions/Means: Columns Tested (5% risk level) - z/a/b/c/d/e/f/g/h/i - z/j/k - z/l/m - z/n/o - z/p/q - z/rOverlap formulae used. * small base

My localMy localauthority isOverall, local
authority isprovidingauthorities inThe governmentproviding apeople in thisEngland arehas the right
good servicearea with goodproviding goodpolicies forfor oldersocial caresocial caresocial care inpeopleservicesservicesEngland
1001100110011001Unweighted Total1001100110011001Weighted Total
71694526Strongly agree7%7%4%3%
269312329239Tend to agree27%31%33%24%
176186191198Neither agree nor18%19%19%20%disagree
167156227248Tend to disagree17%16%23%25%695575123Strongly disagree7%5%7%12%
248223135167Don't know/no opinion25%22%13%17%
340381374265Agree34%38%37%26%
236211302370Disagree24%21%30%37%
10417172-105Net agree10%17%7%-11%
Public Perceptions of the NHS and Social CareFINAL PUBLIC
Table 138Q21. The Department of Health defines social care as services to support people to be independent, play a full part in society and protect them invulnerable situations. It includes practical help in the home, day centres, residential and nursing care homes, as well as advice and guidance.To what extent, if at all, do you agree or disagree with the following statements?
- Summary -
Base : All respondents
Respondent type : General public aged 16+ Fieldwork dates : 14th November - 9th December 2011Source : Ipsos MORI (JN10-039262-01)

UnwtdtotalWork StatusSocial GradeAgeGender
Full/part-Wtd.OtherUnemployedRetiredtimeDEC2C1AB65+55-6435-5425-3416-24FemaleMaleTotal
(p)(o)(n)(m)(l)(k)(j)(i)(h)(g)(f)(e)(d)(c)(b)(a)(z)1001162612705082472013062472201693311581235274741001Unweighted Total100115758*2355512392013122491981433501671435154861001Weighted Total
316371510678741245211031Assisted technology3%4%5%3%3%4%3%2%3%3%3%3%3%3%4%2%3%(e.g. automatic sensors
to say if lights lefton/fridge door open)
50761026167179772059311849Basic needs such as5%4%11%zlm4%5%7%3%5%4%3%5%6%3%7%6%4%5%food, shelter and
medical care for olderpeople/people withdisabilities
444610269121596715314232245Day/community/luncheon4%3%9%o4%5%4%6%5%4%3%5%4%2%9%zdeg5%4%5%centres for people with
disabilities5286102814131411892096331952Day/community/luncheon5%5%10%4%5%6%6%5%4%4%6%6%5%4%6%4%5%centres for older people
5912213311011181991020117382058Direct payment/6%8%3%5%6%4%6%6%8%4%7%6%7%5%7%za4%6%aIndividual budgets
(payment of allowances/funds into personalaccounts/personalbudgets/allowances tospend on services)
1041552854132440252020389166339102Home care/day care for10%10%8%12%10%5%12%k13%k10%k10%14%d11%d5%11%12%za8%10%adkolder people6710616351219201515927611333467Home care/day care for7%7%10%7%6%5%10%7%6%7%6%8%4%8%6%7%7%people with disabilities
519473481119156619914371754Meals on wheels5%5%6%3%6%3%6%6%6%3%4%5%5%10%zg7%za3%5%am
316181729813551137211131Residential/nursing care3%4%1%3%3%1%4%k3%5%k3%4%3%2%5%4%2%3%kfor people with
disabilities961042457122530281618311317544195Residential/nursing care10%7%7%10%10%5%13%k10%k11%k8%13%9%8%12%10%8%9%kfor older people316412385119-512610191433Support to stay in work3%4%m6%m*4%m3%3%4%4%-3%g3%g4%g7%zg4%3%3%gmfor those with a
disability/long-termhealth condition
11415630621826373224163620176449113Transport services for11%10%11%13%11%8%13%12%13%k12%11%10%12%12%12%10%11%kolder people/people with
disabilities7-1321311-2121527Other1%-2%1%**1%**-2%*1%1%1%*1%
62499351313651491251951601188122411592310320630No answer62%63%60%56%66%zm63%62%63%64%60%56%64%68%f64%60%66%63%m
291128717353831053151428Don't know3%7%zl3%4%l1%7%zhij1%2%1%4%2%3%3%2%3%3%3%l
Public Perceptions of the NHS and Social CareFINAL PUBLIC
Table 139Q.22 Which of the following social care services, if any, have you, members of your household, family or friends used in the last year or so?
Base : All respondents
Respondent type : General public aged 16+ Fieldwork dates : 14th November - 9th December 2011Source : Ipsos MORI (JN10-039262-01)Proportions/Means: Columns Tested (5% risk level) - z/a/b - z/c/d/e/f/g - z/h/i/j/k - z/l/m/n/o - z/pOverlap formulae used. * small base

UnwtdtotalWork StatusSocial GradeAgeGender
Full/part-Wtd.OtherUnemployedRetiredtimeDEC2C1AB65+55-6435-5425-3416-24FemaleMaleTotal
(p)(o)(n)(m)(l)(k)(j)(i)(h)(g)(f)(e)(d)(c)(b)(a)(z)100115758*2355512392013122491981433501671435154861001Weighted Total
34847219517972731118672601154848191152343Any social care service35%30%37%41%zlo32%30%36%36%34%36%42%zd33%29%33%37%31%34%
18631134110132475550283167243511075185Multiple user19%19%22%17%18%13%24%zk18%20%k14%21%19%14%24%dg21%za15%18%ak
Public Perceptions of the NHS and Social CareFINAL PUBLIC
Table 139Q.22 Which of the following social care services, if any, have you, members of your household, family or friends used in the last year or so?
Base : All respondents
Respondent type : General public aged 16+ Fieldwork dates : 14th November - 9th December 2011Source : Ipsos MORI (JN10-039262-01)Proportions/Means: Columns Tested (5% risk level) - z/a/b - z/c/d/e/f/g - z/h/i/j/k - z/l/m/n/o - z/pOverlap formulae used. * small base

People aretreated with
Unwtddignity andtotalrespectNHS useHospital useEthnicityNHS/social care staffHousehold TypeHome Ownership
NotAdultshospitalHospitalInformalSocialwith
Non NHS/A&E/A&EsocialcareKnow NHSNHSdependentNon-Owner -PrivateSocialWtd.DisagreeAgreeuserNHS useruseruserMixedWhiteAsianBlackcarerworkerstaffstaffchildrenpensionerPensionerOtheroccupierrenterrenterTotal
(v)(u)(t)(s)(r)(q)(p)(o)(n)(m)(l)(k)(j)(i)(h)(g)(f)(e)(d)(c)(b)(a)(z)100130864710090145854310750741612543628951291461249106491691731001Unweighted Total1001304652104*89746853311**74778*15925038*29252*30547522110**6401781731001Weighted Total
3110201301120-271317213381671188531Assisted technology3%3%3%1%3%2%4%-4%2%2%7%z6%4%6%3%3%3%10%3%4%3%3%(e.g. automatic sensors
to say if lights lefton/fridge door open)
5019292471633-432525415217221012591549Basic needs such as5%6%4%2%5%3%6%zq-6%z2%3%10%zi9%5%4%6%5%5%10%4%5%9%zc5%cqfood, shelter and
medical care for olderpeople/people withdisabilities
4415284422125-354724615214229-2871045Day/community/luncheon4%5%4%4%5%4%5%-5%5%4%9%zi15%zi5%5%5%5%4%-4%4%6%5%centres for people with
disabilities521435448223014227214183212110-3391152Day/community/luncheon5%4%5%4%5%5%6%9%6%3%4%8%z10%6%6%7%4%4%-5%5%6%5%centres for older people
592530454243314817315194153211135101258Direct payment/6%8%zt5%4%6%5%6%11%6%1%5%12%zi13%7%7%5%7%5%10%5%5%7%6%tIndividual budgets
(payment of allowances/funds into personalaccounts/personalbudgets/allowances tospend on services)
10436636963864-83-184673372653231711119102Home care/day care for10%12%10%5%11%8%12%q-11%m-11%m18%zi18%11%14%9%11%10%10%11%b6%11%10%bmqolder people672838759283815736345211163516-4491467Home care/day care for7%9%6%7%7%6%7%11%8%4%4%14%zhi13%7%2%5%7%7%-7%5%8%7%people with disabilities
5118355492331-47-724616216299-3681054Meals on wheels5%6%5%5%5%5%6%-6%zm-4%9%zi15%zhi5%3%5%6%4%-6%4%6%5%m
3113171301120-28-319511151971232531Residential/nursing care3%4%3%1%3%2%4%-4%-2%7%zi14%zhi4%2%2%4%3%8%4%1%3%3%for people with
disabilities9631574904451-832103493610284720-73101295Residential/nursing care10%10%9%4%10%9%9%-11%zm3%6%14%z24%z12%19%z9%10%9%-11%zb6%7%9%mfor older people31132133014201281315-734263-1371333Support to stay in work3%4%3%3%3%3%4%11%4%1%2%6%zi-2%6%1%6%zeg1%-2%4%8%zc3%cegfor those with a
disability/long-termhealth condition
114407171064667194215618394276026-692123113Transport services for11%13%11%7%12%10%13%11%13%zm3%10%24%zhi21%13%9%9%13%12%-11%12%13%11%molder people/people with
disabilities7251643-3215-1-223-4-37Other1%1%1%1%1%1%*-*3%n1%2%zi-*-1%*1%-1%-2%1%
624187413735573023289450521141022017332208294128640112499630No answer62%62%63%70%62%65%62%81%60%67%72%zn41%53%59%k62%k68%ze62%58%54%63%70%a58%63%kn
Public Perceptions of the NHS and Social CareFINAL PUBLIC
Table 140Q.22 Which of the following social care services, if any, have you, members of your household, family or friends used in the last year or so?
Base : All respondents
Respondent type : General public aged 16+ Fieldwork dates : 14th November - 9th December 2011Source : Ipsos MORI (JN10-039262-01)Proportions/Means: Columns Tested (5% risk level) - z/a/b/c/d - z/e/f/g - z/h/i/j/k - z/l/m/n/o - z/p/q - z/r/s - z/t/u - z/vOverlap formulae used. * small base; ** very small base (under 30) ineligible for sig testing

People aretreated with
Unwtddignity andtotalrespectNHS useHospital useEthnicityNHS/social care staffHousehold TypeHome Ownership
NotAdultshospitalHospitalInformalSocialwith
Non NHS/A&E/A&EsocialcareKnow NHSNHSdependentNon-Owner -PrivateSocialWtd.DisagreeAgreeuserNHS useruseruserMixedWhiteAsianBlackcarerworkerstaffstaffchildrenpensionerPensionerOtheroccupierrenterrenterTotal
(v)(u)(t)(s)(r)(q)(p)(o)(n)(m)(l)(k)(j)(i)(h)(g)(f)(e)(d)(c)(b)(a)(z)1001304652104*89746853311**74778*15925038*29252*30547522110**6401781731001Weighted Total
294235241613-14123715-13962156628Don't know3%1%3%4%3%3%2%-2%15%zln2%3%3%2%-4%2%3%18%2%3%3%3%nu
34811321627316151192228314431411711420841728732244868343Any social care service35%37%33%25%35%z32%36%19%38%zlm18%27%56%zhi44%39%z38%28%36%g39%g28%35%27%39%b34%bglm
1866810912173781061159420811159949993721212537185Multiple user19%22%zt17%11%19%17%20%11%21%zlm5%12%32%zhi30%20%18%16%21%17%20%19%14%21%18%lm
Public Perceptions of the NHS and Social CareFINAL PUBLIC
Table 140Q.22 Which of the following social care services, if any, have you, members of your household, family or friends used in the last year or so?
Base : All respondents
Respondent type : General public aged 16+ Fieldwork dates : 14th November - 9th December 2011Source : Ipsos MORI (JN10-039262-01)Proportions/Means: Columns Tested (5% risk level) - z/a/b/c/d - z/e/f/g - z/h/i/j/k - z/l/m/n/o - z/p/q - z/r/s - z/t/u - z/vOverlap formulae used. * small base; ** very small base (under 30) ineligible for sig testing

UnwtdtotalFuture of NHSSatisfaction with NHSGOR
DisYorkshire &WestEastWtd.WorseSameBettersatisfiedSatisfiedHumbersideMidlandsSouth-WestSouth-EastNorth-WestNorth-EastLondonEasternMidlandsTotal
(o)(n)(m)(l)(k)(j)(i)(h)(g)(f)(e)(d)(c)(b)(a)(z)1001328298343168703909910715413955143126881001Unweighted Total1001327302340168701100*106*10216213651*14810986*1001Weighted Total
31108125241537832-231Assisted technology3%3%3%4%3%3%1%5%b3%4%b6%b6%b2%-2%3%b(e.g. automatic sensors
to say if lights lefton/fridge door open)
50141420734251093448549Basic needs such as5%4%4%6%4%5%2%4%9%zcei5%2%8%3%7%6%5%food, shelter and
medical care for olderpeople/people withdisabilities
4410181683366676424545Day/community/luncheon4%3%6%5%5%5%6%6%6%4%4%7%c1%4%6%c5%ccentres for people with
disabilities52151717938774811237552Day/community/luncheon5%5%6%5%5%5%7%6%4%5%8%c4%2%6%5%5%centres for older people
591622201038598128339158Direct payment/6%5%7%6%6%5%5%9%ac8%ac7%ac6%5%2%8%ac1%6%acIndividual budgets
(payment of allowances/funds into personalaccounts/personalbudgets/allowances tospend on services)
104342242177391213157710919102Home care/day care for10%11%7%12%m10%10%9%11%13%e9%5%14%e7%8%22%zbcefi10%eolder people6717222815393107983881067Home care/day care for7%5%7%8%9%6%3%10%7%5%6%5%5%8%12%zi7%jpeople with disabilities
51161718441287146175354Meals on wheels5%5%6%5%2%6%2%8%7%9%z4%2%5%4%4%5%k
311081262032575323231Residential/nursing care3%3%3%4%4%3%3%2%5%4%4%5%1%3%3%3%for people with
disabilities96312537167010131215128316695Residential/nursing care10%9%8%11%9%10%10%c12%c11%c9%c9%c15%c2%15%zc7%9%cfor older people311491152224556-61433Support to stay in work3%4%3%3%3%3%2%4%5%3%5%-4%1%5%3%for those with a
disability/long-termhealth condition
11440304221731114161815614146113Transport services for11%12%10%12%13%10%11%13%15%11%11%12%9%13%7%11%older people/people with
disabilities722233--21111--7Other1%1%1%1%2%*--2%z1%1%1%1%--1%
62420420420210744163516010384251206856630No answer62%62%68%zl59%63%63%63%h48%59%63%h62%h49%81%zabdefghi62%h65%h63%dh
29681322418141131--28Don't know3%2%3%4%1%3%1%8%zabcgi1%2%8%zabcfgi5%abc1%--3%
Public Perceptions of the NHS and Social CareFINAL PUBLIC
Table 141Q.22 Which of the following social care services, if any, have you, members of your household, family or friends used in the last year or so?
Base : All respondents
Respondent type : General public aged 16+ Fieldwork dates : 14th November - 9th December 2011Source : Ipsos MORI (JN10-039262-01)Proportions/Means: Columns Tested (5% risk level) - z/a/b/c/d/e/f/g/h/i - z/j/k - z/l/m/n - z/oOverlap formulae used. * small base

UnwtdtotalFuture of NHSSatisfaction with NHSGOR
DisYorkshire &WestEastWtd.WorseSameBettersatisfiedSatisfiedHumbersideMidlandsSouth-WestSouth-EastNorth-WestNorth-EastLondonEasternMidlandsTotal
(o)(n)(m)(l)(k)(j)(i)(h)(g)(f)(e)(d)(c)(b)(a)(z)1001327302340168701100*106*10216213651*14810986*1001Weighted Total
3481179012559236364841564124274130343Any social care service35%36%30%37%35%34%36%c45%zce40%c34%c30%c46%ce18%38%c35%c34%c
1865952693213114212531218182621185Multiple user19%18%17%20%19%19%14%20%24%c19%15%16%12%24%c24%c18%c
Public Perceptions of the NHS and Social CareFINAL PUBLIC
Table 141Q.22 Which of the following social care services, if any, have you, members of your household, family or friends used in the last year or so?
Base : All respondents
Respondent type : General public aged 16+ Fieldwork dates : 14th November - 9th December 2011Source : Ipsos MORI (JN10-039262-01)Proportions/Means: Columns Tested (5% risk level) - z/a/b/c/d/e/f/g/h/i - z/j/k - z/l/m/n - z/oOverlap formulae used. * small base

UnwtdPrivate healthSatisfaction withImpact of NHS reformsGovernment has righttotalinsurancesocial careon patientsNHS policyNHS use in last year
SocialNHSDissatisficareWalk InChoicesPharmacistWtd.
NoYesedSatisfiedWorseBetterDisagreeAgreeservicesClinicwebsite/ChemistNHS DirectA&EOutpatientInpatientGPTotal(r)(q)(p)(o)(n)(m)(l)(k)(j)(i)(h)(g)(f)(e)(d)(c)(b)(a)(z)10018151704424938220040326945182553001772253931967801001Unweighted Total100181117544*24437920139327642*18856*3011832303761927731001Weighted Total
3126532313516537221991492431Assisted technology3%3%3%6%10%z3%3%4%2%7%4%4%7%zac5%4%4%5%3%3%(e.g. automatic sensors
to say if lights lefton/fridge door open)
504275391911171464-17131524154049Basic needs such as5%5%4%11%16%z5%6%4%5%15%zacfgh2%-6%h7%gh7%h6%h8%zgh5%h5%food, shelter and
medical care for olderpeople/people withdisabilities
443875291712161246-1812181483645Day/community/luncheon4%5%4%12%z12%z5%6%4%4%9%g3%-6%7%8%zacgh4%4%5%5%centres for people with
disabilities524742402312231041211811141994252Day/community/luncheon5%6%p2%4%16%zo6%6%6%3%10%6%1%6%6%6%5%5%5%5%pcentres for older people
594710842251426124151124231823134758Direct payment/6%6%6%18%z17%z7%7%7%4%9%8%19%zabcdfh8%13%zabcdf8%6%7%6%6%Individual budgets
(payment of allowances/funds into personalaccounts/personalbudgets/allowances tospend on services)
10483181866431947185246392833451988102Home care/day care for10%10%10%41%z27%z11%10%12%j6%12%13%10%13%16%zb14%z12%10%11%z10%jolder people67561013423213371081222618222884967Home care/day care for7%7%6%30%z17%z8%7%9%zj4%18%zabcfgh6%3%9%b10%ab10%zab7%4%6%7%jpeople with disabilities
51459837238171421342718191864254Meals on wheels5%6%5%17%z15%z6%4%4%5%5%7%8%9%zabc10%zabc8%zabc5%3%5%5%
31266521186158333139121382831Residential/nursing care3%3%3%12%z8%z5%z3%4%3%6%2%5%4%5%h5%h4%4%4%3%for people with
disabilities968113195941214520622735302634158295Residential/nursing care10%10%7%43%zn24%z11%10%12%7%14%12%12%12%17%zabcf11%9%8%11%z9%for older people31275622167176242169131253033Support to stay in work3%3%3%13%z9%z4%3%4%2%4%2%4%5%zch5%6%h3%3%4%3%for those with a
disability/long-termhealth condition
1149219148359185817102110453439402193113Transport services for11%11%11%33%z34%z16%zl9%15%zj6%24%zabch11%18%15%zc19%zabch17%zabch11%11%12%11%jolder people/people with
disabilities77--5221123-2113267Other1%1%--2%z1%1%**5%zacdef2%-1%1%*1%1%1%1%
624496123--2301272261911711735177104132233115482630No answer62%61%70%zq--61%63%58%69%zk40%62%i62%i59%i57%i57%i62%i60%i62%i63%iknoq
29262--79713-9-625671628Don't know3%3%1%--2%4%2%5%zk-5%acef-2%1%2%2%4%c2%3%acn
Public Perceptions of the NHS and Social CareFINAL PUBLIC
Table 142Q.22 Which of the following social care services, if any, have you, members of your household, family or friends used in the last year or so?
Base : All respondents
Respondent type : General public aged 16+ Fieldwork dates : 14th November - 9th December 2011Source : Ipsos MORI (JN10-039262-01)Proportions/Means: Columns Tested (5% risk level) - z/a/b/c/d/e/f/g/h/i - z/j/k - z/l/m - z/n/o - z/p/q - z/rOverlap formulae used. * small base

UnwtdPrivate healthSatisfaction withImpact of NHS reformsGovernment has righttotalinsurancesocial careon patientsNHS policyNHS use in last year
SocialNHSDissatisficareWalk InChoicesPharmacistWtd.
NoYesedSatisfiedWorseBetterDisagreeAgreeservicesClinicwebsite/ChemistNHS DirectA&EOutpatientInpatientGPTotal(r)(q)(p)(o)(n)(m)(l)(k)(j)(i)(h)(g)(f)(e)(d)(c)(b)(a)(z)100181117544*24437920139327642*18856*3011832303761927731001Weighted Total
34828850442441436616072256122117769313769275343Any social care service35%36%28%100%z100%z38%33%41%zj26%60%zabcdef33%38%39%z42%zh40%z36%36%36%34%j
gh
1861523129123803982341937147451587435154185Multiple user19%19%18%65%z50%z21%20%21%j12%46%zabcdef20%25%25%zabc28%zabch25%zab20%18%20%z18%j
gh
Public Perceptions of the NHS and Social CareFINAL PUBLIC
Table 142Q.22 Which of the following social care services, if any, have you, members of your household, family or friends used in the last year or so?
Base : All respondents
Respondent type : General public aged 16+ Fieldwork dates : 14th November - 9th December 2011Source : Ipsos MORI (JN10-039262-01)Proportions/Means: Columns Tested (5% risk level) - z/a/b/c/d/e/f/g/h/i - z/j/k - z/l/m - z/n/o - z/p/q - z/rOverlap formulae used. * small base

UnwtdtotalWork StatusSocial GradeAgeGender
Full/part-Wtd.OtherUnemployedRetiredtimeDEC2C1AB65+55-6435-5425-3416-24FemaleMaleTotal
(p)(o)(n)(m)(l)(k)(j)(i)(h)(g)(f)(e)(d)(c)(b)(a)(z)481252562461442211933282048Unweighted Total48*10**5**21**7**22**5**13**3**19**9**9**3**3**26**18**43*Weighted Total41-212-1121-1-314Assisted technology8%7%-9%18%9%-9%23%10%8%-40%-11%6%9%(e.g. automatic sensors
to say if lights lefton/fridge door open)
5212-31-1113--314Basic needs such as10%16%21%8%-13%15%-23%4%8%31%--14%5%10%food, shelter and
medical care for olderpeople/people withdisabilities
3-111-12-1---23-3Day/community/luncheon6%-20%4%18%-15%17%-4%---69%12%-7%centres for people with
disabilities62-214-1-212--335Day/community/luncheon
13%17%-11%16%20%-6%-13%11%19%--10%14%12%centres for older people11413151222251-3610Direct payment/23%42%21%15%18%25%15%15%51%13%19%54%31%-13%37%23%Individual budgets
(payment of allowances/funds into personalaccounts/personalbudgets/allowances tospend on services)
6--5-231-5----325Home care/day care for13%--24%-7%50%7%-27%----11%14%12%older people73-3-321-33---246Home care/day care for
15%25%-16%-15%33%7%-18%28%---7%24%14%people with disabilities1-1----1-----11-1Meals on wheels2%-19%----7%-----31%4%-2%11------1-1---1-1Residential/nursing care2%7%------23%-8%---3%-2%for people with
disabilities-----------------Residential/nursing care-----------------for older people74--33-22-331-527Support to stay in work
15%35%--49%15%-16%50%-28%38%31%-19%12%16%for those with adisability/long-termhealth condition
172111-63321013--12315Transport services for35%22%21%53%-29%65%27%49%55%16%30%--47%15%34%older people/people with
disabilities3-11--11--1-1-112Other6%-18%7%--18%11%--16%-30%-6%5%5%
48105217225133199933261843Any social care service100%100%100%100%100%100%100%100%100%100%100%100%100%100%100%100%100%
14416153325251-8513Multiple user29%42%21%28%18%25%50%23%50%27%18%54%31%-31%26%29%
Public Perceptions of the NHS and Social CareFINAL PUBLIC
Table 143Q.22a Which of the following social care services, if any, have you, members of your household, family or friends used in the last year or so? And did you usethat service personally or was it someone else?
Base : All respondents who have received/experienced social care personally
Respondent type : General public aged 16+ Fieldwork dates : 14th November - 9th December 2011Source : Ipsos MORI (JN10-039262-01)Proportions/Means: Columns Tested (5% risk level) - z/a/b - z/c/d/e/f/g - z/h/i/j/k - z/l/m/n/o - z/pOverlap formulae used. * small base; ** very small base (under 30) ineligible for sig testing

People aretreated with
Unwtddignity andtotalrespectNHS useHospital useEthnicityNHS/social care staffHousehold TypeHome Ownership
NotAdultshospitalHospitalInformalSocialwith
Non NHS/A&E/A&EsocialcareKnow NHSNHSdependentNon-Owner -PrivateSocialWtd.DisagreeAgreeuserNHS useruseruserMixedWhiteAsianBlackcarerworkerstaffstaffchildrenpensionerPensionerOtheroccupierrenterrenterTotal
(v)(u)(t)(s)(r)(q)(p)(o)(n)(m)(l)(k)(j)(i)(h)(g)(f)(e)(d)(c)(b)(a)(z)481827246840-3611010-10-81327-1892148Unweighted Total48*17**24**2**41*7**36*-**33*1**8**9**-**9**-**8**12**23**-**16**9**19**43*Weighted Total412-4-4-4--1-1--22-31-4Assisted technology8%7%7%-9%-11%-12%--13%-13%--16%8%-17%14%-9%(e.g. automatic sensors
to say if lights lefton/fridge door open)
523-4-4-3-21-1-311-2124Basic needs such as10%11%11%-11%-12%-8%-20%11%-9%-36%6%3%-10%10%10%10%food, shelter and
medical care for olderpeople/people withdisabilities
3-3-312-1-21-3-111-12-3Day/community/luncheon6%-12%-7%14%5%-4%-21%10%-32%-13%10%3%-5%24%-7%centres for people with
disabilities6231433-3-21----32-2135Day/community/luncheon
13%12%13%46%10%36%7%-10%-21%8%----23%10%-10%12%14%12%pcentres for older people11541919-7-32-3-334-42410Direct payment/23%29%18%46%22%12%25%-22%-30%23%-36%-37%21%19%-23%22%24%23%Individual budgets
(payment of allowances/funds into personalaccounts/personalbudgets/allowances tospend on services)
623-5-5-3-21-2---5-1-45Home care/day care for13%11%13%-12%-14%-8%-19%8%-17%---22%-5%-23%12%older people7231515-6--1-1--24-2-46Home care/day care for
15%10%14%54%12%14%14%-18%--8%-9%--15%18%-12%-22%14%people with disabilities1-1-1-1-1----1-1----1-1Meals on wheels2%-4%-2%-3%-3%----10%-12%----11%-2%1-1-1-1-1-------1--1--1Residential/nursing care2%-3%-2%-2%-2%-------6%--5%--2%for people with
disabilities-----------------------Residential/nursing care-----------------------for older people734-716-7--2-2-142-3-47Support to stay in work
15%17%17%-17%12%17%-21%--23%-19%-13%31%9%-19%-21%16%for those with adisability/long-termhealth condition
1768114213-10-42-2-2210-72615Transport services for35%36%36%46%33%24%36%-29%-50%20%-17%-25%19%45%-43%17%34%34%older people/people with
disabilities311-211--112---1-1-1-22Other6%5%6%-6%13%4%--100%18%17%---12%-6%-4%-9%5%
481724241736-33189-9-81223-1691943Any social care service100%100%100%100%100%100%100%-100%100%100%100%-100%-100%100%100%-100%100%100%100%
Public Perceptions of the NHS and Social CareFINAL PUBLIC
Table 144Q.22a Which of the following social care services, if any, have you, members of your household, family or friends used in the last year or so? And did you usethat service personally or was it someone else?
Base : All respondents who have received/experienced social care personally
Respondent type : General public aged 16+ Fieldwork dates : 14th November - 9th December 2011Source : Ipsos MORI (JN10-039262-01)Proportions/Means: Columns Tested (5% risk level) - z/a/b/c/d - z/e/f/g - z/h/i/j/k - z/l/m/n/o - z/p/q - z/r/s - z/t/u - z/vOverlap formulae used. * small base; ** very small base (under 30) ineligible for sig testing

People aretreated with
Unwtddignity andtotalrespectNHS useHospital useEthnicityNHS/social care staffHousehold TypeHome Ownership
NotAdultshospitalHospitalInformalSocialwith
Non NHS/A&E/A&EsocialcareKnow NHSNHSdependentNon-Owner -PrivateSocialWtd.DisagreeAgreeuserNHS useruseruserMixedWhiteAsianBlackcarerworkerstaffstaffchildrenpensionerPensionerOtheroccupierrenterrenterTotal
(v)(u)(t)(s)(r)(q)(p)(o)(n)(m)(l)(k)(j)(i)(h)(g)(f)(e)(d)(c)(b)(a)(z)48*17**24**2**41*7**36*-**33*1**8**9**-**9**-**8**12**23**-**16**9**19**43*Weighted Total1467112112-9-34-3-337-41813Multiple user29%34%28%46%28%12%32%-27%-30%42%-27%-36%21%31%-22%10%44%29%
Public Perceptions of the NHS and Social CareFINAL PUBLIC
Table 144Q.22a Which of the following social care services, if any, have you, members of your household, family or friends used in the last year or so? And did you usethat service personally or was it someone else?
Base : All respondents who have received/experienced social care personally
Respondent type : General public aged 16+ Fieldwork dates : 14th November - 9th December 2011Source : Ipsos MORI (JN10-039262-01)Proportions/Means: Columns Tested (5% risk level) - z/a/b/c/d - z/e/f/g - z/h/i/j/k - z/l/m/n/o - z/p/q - z/r/s - z/t/u - z/vOverlap formulae used. * small base; ** very small base (under 30) ineligible for sig testing

UnwtdtotalFuture of NHSSatisfaction with NHSGOR
DisYorkshire &WestEastWtd.WorseSameBettersatisfiedSatisfiedHumbersideMidlandsSouth-WestSouth-EastNorth-WestNorth-EastLondonEasternMidlandsTotal
(o)(n)(m)(l)(k)(j)(i)(h)(g)(f)(e)(d)(c)(b)(a)(z)481714148355107537110-48Unweighted Total48*15**13**12**7**32*5**10**6**5**3**6**1**8**-**43*Weighted Total4112-41111-----4Assisted technology8%8%7%14%-12%23%10%13%19%-----9%(e.g. automatic sensors
to say if lights lefton/fridge door open)
511312-13--1---4Basic needs such as10%6%6%22%11%6%-10%43%--14%---10%food, shelter and
medical care for olderpeople/people withdisabilities
3-2-121----2---3Day/community/luncheon6%-15%-11%7%23%----31%---7%centres for people with
disabilities623114-11--1-2-5Day/community/luncheon
13%10%19%8%13%13%-10%15%--15%-30%-12%centres for older people1125325-22122-2-10Direct payment/23%16%36%21%26%16%-19%30%24%66%28%-20%-23%Individual budgets
(payment of allowances/funds into personalaccounts/personalbudgets/allowances tospend on services)
6113232----2-2-5Home care/day care for13%6%6%20%24%11%37%----28%-20%-12%older people73-223-3----12-6Home care/day care for
15%23%-20%26%10%-27%----100%30%-14%people with disabilities1-1--1-------1-1Meals on wheels2%-7%--3%-------12%-2%1--1-1--1------1Residential/nursing care2%--6%-2%--13%------2%for people with
disabilities----------------Residential/nursing care----------------for older people7223-613111----7Support to stay in work
15%14%16%22%-18%17%31%13%24%36%----16%for those with adisability/long-termhealth condition
17455211212313-2-15Transport services for35%30%39%40%34%36%37%10%42%57%34%56%-28%-34%older people/people with
disabilities311-11--2--1---2Other6%5%7%-13%2%--28%--12%---5%
48151312732510653618-43Any social care service100%100%100%100%100%100%100%100%100%100%100%100%100%100%-100%
1425628223112-2-13Multiple user29%12%34%50%24%25%37%19%43%24%36%28%-30%-29%
Public Perceptions of the NHS and Social CareFINAL PUBLIC
Table 145Q.22a Which of the following social care services, if any, have you, members of your household, family or friends used in the last year or so? And did you usethat service personally or was it someone else?
Base : All respondents who have received/experienced social care personally
Respondent type : General public aged 16+ Fieldwork dates : 14th November - 9th December 2011Source : Ipsos MORI (JN10-039262-01)Proportions/Means: Columns Tested (5% risk level) - z/a/b/c/d/e/f/g/h/i - z/j/k - z/l/m/n - z/oOverlap formulae used. * small base; ** very small base (under 30) ineligible for sig testing

UnwtdPrivate healthSatisfaction withImpact of NHS reformsGovernment has righttotalinsurancesocial careon patientsNHS policyNHS use in last year
SocialNHSDissatisficareWalk InChoicesPharmacistWtd.
NoYesedSatisfiedWorseBetterDisagreeAgreeservicesClinicwebsite/ChemistNHS DirectA&EOutpatientInpatientGPTotal(r)(q)(p)(o)(n)(m)(l)(k)(j)(i)(h)(g)(f)(e)(d)(c)(b)(a)(z)
4844244118142310131021771432223748Unweighted Total48*39*2**4**37*16**13**21**10**11**9**2**16**6**13**29*20**33*43*Weighted Total431-4222112-3--3344Assisted technology8%7%46%-10%12%14%10%9%7%24%-20%--11%15%12%9%(e.g. automatic sensors
to say if lights lefton/fridge door open)
54--422222--1143334Basic needs such as10%11%--12%10%15%8%19%15%--6%14%29%9%17%10%10%food, shelter and
medical care for olderpeople/people withdisabilities
321-3-2-2----112123Day/community/luncheon6%5%54%-8%-16%-22%----15%6%7%4%5%7%qcentres for people with
disabilities64--413312-----3135Day/community/luncheon
13%11%--12%5%21%14%8%14%-----9%4%10%12%centres for older people1110-19344222164488910Direct payment/23%25%-32%23%21%29%22%21%18%21%45%37%57%29%28%42%27%23%Individual budgets
(payment of allowances/funds into personalaccounts/personalbudgets/allowances tospend on services)
65--52-4131-1124345Home care/day care for13%13%--14%11%-17%8%25%9%-5%12%13%12%17%11%12%older people75-233-4-32-3124146Home care/day care for
15%13%-47%9%21%-21%-30%19%-21%12%20%15%4%13%14%npeople with disabilities11--1-----111111111Meals on wheels2%2%--3%-----11%55%6%15%8%3%5%3%2%11--11-1-1------111Residential/nursing care2%2%--2%5%-4%-7%------4%2%2%for people with
disabilities-------------------Residential/nursing care-------------------for older people77-1642321--4114377Support to stay in work
15%18%-32%15%24%16%13%24%7%--26%14%10%14%15%21%16%for those with adisability/long-termhealth condition
1714-114718362-21588915Transport services for35%35%-21%37%42%8%41%29%53%27%-15%14%42%30%39%26%34%aolder people/people with
disabilities32--2-2--11-1-11122Other6%6%--4%-12%--7%8%-5%-6%5%4%7%5%
483924371613211011921661329203343Any social care service100%100%100%100%100%100%100%100%100%100%100%100%100%100%100%100%100%100%100%
1412-111446351-534971013Multiple user29%30%-32%30%27%30%29%31%47%9%-30%40%35%32%37%30%29%
Public Perceptions of the NHS and Social CareFINAL PUBLIC
Table 146Q.22a Which of the following social care services, if any, have you, members of your household, family or friends used in the last year or so? And did you usethat service personally or was it someone else?
Base : All respondents who have received/experienced social care personally
Respondent type : General public aged 16+ Fieldwork dates : 14th November - 9th December 2011Source : Ipsos MORI (JN10-039262-01)Proportions/Means: Columns Tested (5% risk level) - z/a/b/c/d/e/f/g/h/i - z/j/k - z/l/m - z/n/o - z/p/q - z/rOverlap formulae used. * small base; ** very small base (under 30) ineligible for sig testing

UnwtdtotalWork StatusSocial GradeAgeGender
Full/part-Wtd.OtherUnemployedRetiredtimeDEC2C1AB65+55-6435-5425-3416-24FemaleMaleTotal
(p)(o)(n)(m)(l)(k)(j)(i)(h)(g)(f)(e)(d)(c)(b)(a)(z)297382084155507097805960984139166131297Unweighted Total29737*18**73*16848*69*98*81*53*50*103*45*46*163133296Weighted Total2753514866754123518928Assisted technology9%14%15%7%9%17%i9%6%9%9%7%11%7%10%11%7%9%(e.g. automatic sensors
to say if lights lefton/fridge door open)
353572076147551239221235Basic needs such as12%7%29%9%12%15%9%15%9%10%9%12%8%21%14%9%12%food, shelter and
medical care for olderpeople/people withdisabilities
41459259121396715311212242Day/community/luncheon14%11%25%12%15%18%17%13%11%11%13%15%8%25%d13%16%14%centres for people with
disabilities466682710131311681996301747Day/community/luncheon15%16%30%11%16%20%18%14%13%11%15%18%20%13%18%13%16%centres for older people4881103041016176815117341348Direct payment/16%20%4%13%18%9%15%16%21%12%16%15%24%16%21%za10%16%aIndividual budgets
(payment of allowances/funds into personalaccounts/personalbudgets/allowances tospend on services)
98155235411223925152038916603797Home care/day care for33%41%26%31%32%23%32%40%31%27%40%d37%20%34%37%28%33%older people60861335918201511627611313061Home care/day care for20%21%31%18%21%18%26%20%18%21%12%26%f13%24%19%23%21%people with disabilities509373481118156619913361753Meals on wheels17%23%15%10%20%m17%16%19%19%11%12%18%20%29%fg22%za13%18%am
305181729812541137201131Residential/nursing care10%14%4%11%10%5%13%8%15%10%9%10%8%15%12%8%10%for people with
disabilities961042457122530281618311317544195Residential/nursing care32%28%23%32%34%24%37%31%34%31%36%30%29%37%33%31%32%for older people24241204597-29510141226Support to stay in work8%6%20%1%12%m9%8%10%9%-5%8%g12%g22%zefg9%9%9%gmfor those with a
disability/long-termhealth condition
971351862122333311415332017524799Transport services for33%34%30%25%37%24%33%34%38%26%30%32%44%37%32%35%33%older people/people with
disabilities4--2212-1-1111314Other1%--3%1%2%3%-1%-2%1%3%2%2%1%1%
2973718731684869988153501034546163133296Any social care service100%100%100%100%100%100%100%100%100%100%100%100%100%100%100%100%100%17025113410125445349232962223510170171Multiple user57%68%m59%46%60%m51%64%55%60%42%58%60%g50%76%zdg62%52%58%gm
Public Perceptions of the NHS and Social CareFINAL PUBLIC
Table 147Q.22b Which of the following social care services, if any, have you, members of your household, family or friends used in the last year or so? And did you usethat service personally or was it someone else?
Base : All respondents who have experienced social care through someone else
Respondent type : General public aged 16+ Fieldwork dates : 14th November - 9th December 2011Source : Ipsos MORI (JN10-039262-01)Proportions/Means: Columns Tested (5% risk level) - z/a/b - z/c/d/e/f/g - z/h/i/j/k - z/l/m/n/o - z/pOverlap formulae used. * small base; ** very small base (under 30) ineligible for sig testing

People aretreated with
Unwtddignity andtotalrespectNHS useHospital useEthnicityNHS/social care staffHousehold TypeHome Ownership
NotAdultshospitalHospitalInformalSocialwith
Non NHS/A&E/A&EsocialcareKnow NHSNHSdependentNon-Owner -PrivateSocialWtd.DisagreeAgreeuserNHS useruseruserMixedWhiteAsianBlackcarerworkerstaffstaffchildrenpensionerPensionerOtheroccupierrenterrenterTotal
(v)(u)(t)(s)(r)(q)(p)(o)(n)(m)(l)(k)(j)(i)(h)(g)(f)(e)(d)(c)(b)(a)(z)2979618923274142155224812351351510320711557132123646297Unweighted Total29797*18824**2721421542**24713**34*13317**10220**75*15863*3**20739*47*296Weighted Total278181261116-241316211381451157528Assisted technology9%9%10%5%10%8%10%-10%9%8%12%14%11%15%11%9%9%35%7%17%11%9%c(e.g. automatic sensors
to say if lights lefton/fridge door open)
3516181341223-3212224102101871196935Basic needs such as12%16%10%5%12%8%15%-13%7%6%17%zi22%9%10%13%11%11%38%9%16%19%12%cfood, shelter and
medical care for olderpeople/people withdisabilities
4115254392023-344523612213218-2751042Day/community/luncheon14%16%13%16%14%14%15%-14%27%14%17%35%11%12%18%13%13%-13%13%22%14%centres for people with
disabilities46123234320271382520418321187-318847Day/community/luncheon15%12%17%13%16%14%18%44%16%18%15%15%22%18%14%29%zef11%11%-15%19%17%16%fcentres for older people482026345232414115295164122971328848Direct payment/16%20%14%12%16%16%16%56%17%7%14%21%z30%15%19%16%18%11%35%15%19%16%16%Individual budgets
(payment of allowances/funds into personalaccounts/personalbudgets/allowances tospend on services)
9834606913859-80-16457327265318170111597Home care/day care for33%36%32%23%34%27%38%zq-33%-48%z34%42%31%36%35%33%29%38%34%27%32%33%qolder people602634754273315136335201163312-4291061Home care/day care for20%27%18%27%20%19%22%56%21%25%17%25%29%20%5%22%21%18%-20%24%20%21%people with disabilities5018345482330-46-724615215299-3671053Meals on wheels17%18%18%21%17%16%20%-18%-21%18%33%14%9%20%18%14%-17%18%21%18%3013161291119-27-319511151871232531Residential/nursing care10%13%9%5%11%8%13%-11%-9%14%32%11%5%7%12%11%28%11%6%10%10%for people with
disabilities9631574904451-832103493610284720-73101295Residential/nursing care32%32%30%19%33%31%33%-34%15%29%25%55%35%k49%38%30%31%-35%26%25%32%kfor older people24101732313141211312-533231-1071026Support to stay in work8%10%9%14%8%9%9%56%9%9%9%9%-5%15%4%14%zeg1%-5%19%zc20%zc9%cefor those with a
disability/long-termhealth condition
9734636934554184211598384255816-63191799Transport services for33%35%33%25%34%31%35%56%34%16%32%44%z48%37%22%34%36%25%-30%49%zc36%33%older people/people with
disabilities4131331-31-3-1-121-3-14Other1%1%2%3%1%2%1%-1%8%-3%-1%-2%1%2%-1%-2%1%
2979718824272142154224713341331710220751586332073947296Any social care service100%100%100%100%100%100%100%100%100%100%100%100%100%100%100%100%100%100%100%100%100%100%100%
Public Perceptions of the NHS and Social CareFINAL PUBLIC
Table 148Q.22b Which of the following social care services, if any, have you, members of your household, family or friends used in the last year or so? And did you usethat service personally or was it someone else?
Base : All respondents who have experienced social care through someone else
Respondent type : General public aged 16+ Fieldwork dates : 14th November - 9th December 2011Source : Ipsos MORI (JN10-039262-01)Proportions/Means: Columns Tested (5% risk level) - z/a/b/c/d - z/e/f/g - z/h/i/j/k - z/l/m/n/o - z/p/q - z/r/s - z/t/u - z/vOverlap formulae used. * small base; ** very small base (under 30) ineligible for sig testing

People aretreated with
Unwtddignity andtotalrespectNHS useHospital useEthnicityNHS/social care staffHousehold TypeHome Ownership
NotAdultshospitalHospitalInformalSocialwith
Non NHS/A&E/A&EsocialcareKnow NHSNHSdependentNon-Owner -PrivateSocialWtd.DisagreeAgreeuserNHS useruseruserMixedWhiteAsianBlackcarerworkerstaffstaffchildrenpensionerPensionerOtheroccupierrenterrenterTotal
(v)(u)(t)(s)(r)(q)(p)(o)(n)(m)(l)(k)(j)(i)(h)(g)(f)(e)(d)(c)(b)(a)(z)29797*18824**2721421542**24713**34*13317**10220**75*15863*3**20739*47*296Weighted Total170621001115976951149317771156944963021172428171Multiple user57%64%53%47%59%53%62%56%60%z26%50%58%68%55%47%59%61%48%72%56%61%59%58%
Public Perceptions of the NHS and Social CareFINAL PUBLIC
Table 148Q.22b Which of the following social care services, if any, have you, members of your household, family or friends used in the last year or so? And did you usethat service personally or was it someone else?
Base : All respondents who have experienced social care through someone else
Respondent type : General public aged 16+ Fieldwork dates : 14th November - 9th December 2011Source : Ipsos MORI (JN10-039262-01)Proportions/Means: Columns Tested (5% risk level) - z/a/b/c/d - z/e/f/g - z/h/i/j/k - z/l/m/n/o - z/p/q - z/r/s - z/t/u - z/vOverlap formulae used. * small base; ** very small base (under 30) ineligible for sig testing

UnwtdtotalFuture of NHSSatisfaction with NHSGOR
DisYorkshire &WestEastWtd.WorseSameBettersatisfiedSatisfiedHumbersideMidlandsSouth-WestSouth-EastNorth-WestNorth-EastLondonEasternMidlandsTotal
(o)(n)(m)(l)(k)(j)(i)(h)(g)(f)(e)(d)(c)(b)(a)(z)2971027511253203263638453919253930297Unweighted Total297101*78*11054*20029**39*36*48*39*18**26**33*30**296Weighted Total278811520-426832-228Assisted technology9%8%10%10%9%10%-11%5%13%b21%zb16%9%-7%9%(e.g. automatic sensors
to say if lights lefton/fridge door open)
35111211625-4742346535Basic needs such as12%11%15%10%11%12%-9%19%9%6%14%15%19%17%12%food, shelter and
medical care for olderpeople/people withdisabilities
4110161673146676224542Day/community/luncheon14%10%20%14%13%16%15%15%16%14%16%10%8%13%18%14%centres for people with
disabilities46141516833753811134547Day/community/luncheon15%14%19%15%14%17%23%14%9%17%27%zg6%12%13%15%16%centres for older people48131817833576116137148Direct payment/16%13%23%15%15%17%17%19%18%22%17%6%12%22%3%16%Individual budgets
(payment of allowances/funds into personalaccounts/personalbudgets/allowances tospend on services)
9834214015698121315761071997Home care/day care for33%33%28%36%28%35%26%32%36%32%17%31%38%22%64%33%eolder people601422251336387983761061Home care/day care for20%14%28%n23%24%18%10%20%21%18%21%15%28%18%35%21%npeople with disabilities50161618440287146174353Meals on wheels17%16%21%16%7%20%k9%22%20%30%zb15%5%27%11%11%18%k
301081261932475323231Residential/nursing care10%10%11%11%12%10%11%5%12%14%13%16%8%8%7%10%for people with
disabilities96312537167010131215128316695Residential/nursing care32%31%32%34%29%35%35%34%32%31%31%44%12%49%z20%32%for older people24127851711445-61426Support to stay in work8%11%9%7%10%8%4%3%11%8%14%-21%3%14%9%for those with a
disability/long-termhealth condition
97352537196191313161431412699Transport services for33%35%32%34%35%31%31%33%36%33%36%17%52%35%20%33%older people/people with
disabilities411222--111-1--4Other1%1%1%2%4%1%--2%2%3%-4%--1%
2971017811054200293936483918263330296Any social care service100%100%100%100%100%100%100%100%100%100%100%100%100%100%100%100%1705648622912112182131206182321171Multiple user57%56%62%56%54%61%44%46%59%65%51%36%68%71%h70%58%
Public Perceptions of the NHS and Social CareFINAL PUBLIC
Table 149Q.22b Which of the following social care services, if any, have you, members of your household, family or friends used in the last year or so? And did you usethat service personally or was it someone else?
Base : All respondents who have experienced social care through someone else
Respondent type : General public aged 16+ Fieldwork dates : 14th November - 9th December 2011Source : Ipsos MORI (JN10-039262-01)Proportions/Means: Columns Tested (5% risk level) - z/a/b/c/d/e/f/g/h/i - z/j/k - z/l/m/n - z/oOverlap formulae used. * small base; ** very small base (under 30) ineligible for sig testing

UnwtdPrivate healthSatisfaction withImpact of NHS reformsGovernment has righttotalinsurancesocial careon patientsNHS policyNHS use in last year
SocialNHSDissatisficareWalk InChoicesPharmacistWtd.
NoYesedSatisfiedWorseBetterDisagreeAgreeservicesClinicwebsite/ChemistNHS DirectA&EOutpatientInpatientGPTotal(r)(q)(p)(o)(n)(m)(l)(k)(j)(i)(h)(g)(f)(e)(d)(c)(b)(a)(z)29724846412031285514060165120102667711250247297Unweighted Total29724746*42*20212855*13861*15**53*20**105*69*81*10650*244296Weighted Total2724431911315425218991162028Assisted technology9%10%9%7%10%8%6%10%6%14%10%11%17%zac13%11%10%12%8%9%(e.g. automatic sensors
to say if lights lefton/fridge door open)
3529652516813854-15101215103335Basic needs such as12%12%13%11%12%13%16%9%13%30%8%-14%15%15%14%20%13%12%food, shelter and
medical care for olderpeople/people withdisabilities
413665261710161046-1811171273442Day/community/luncheon14%15%13%13%13%14%17%11%16%25%12%-17%16%21%c11%15%14%14%centres for people with
disabilities4643423522920931211811141783947Day/community/luncheon15%17%8%4%18%o17%16%14%15%18%22%4%17%16%18%16%17%16%16%ocentres for older people48371073321102210213101820151553848Direct payment/16%15%22%17%16%17%18%16%17%11%24%b49%17%28%zabcf18%14%10%16%16%Individual budgets
(payment of allowances/funds into personalaccounts/personalbudgets/allowances tospend on services)
987818186141194317224638283241158497Home care/day care for33%32%38%43%30%32%35%31%27%14%44%28%36%40%39%39%31%35%33%older people60511011392813331041022318202384561Home care/day care for20%21%22%27%19%22%24%24%16%30%19%10%22%25%25%22%15%19%21%people with disabilities50449836238171421232617181754153Meals on wheels17%18%18%18%18%18%14%12%22%14%23%17%25%zabc25%23%b16%11%17%18%k
30256520176148233139121382731Residential/nursing care10%10%12%13%10%13%10%10%12%12%6%15%12%13%14%13%15%11%10%for people with
disabilities968113195941214520622735302634158295Residential/nursing care32%33%28%46%n29%32%38%33%33%38%42%34%34%44%zc32%32%29%34%32%for older people2420551612515314212811822326Support to stay in work8%8%10%11%8%9%9%11%5%7%7%12%12%12%14%b7%4%9%9%for those with a
disability/long-termhealth condition
9778191469521750144191043333431148599Transport services for33%32%42%33%34%41%z31%36%23%29%35%51%41%c48%zabc42%bc30%27%35%33%older people/people with
disabilities44--3211112-11-1134Other1%2%--2%2%1%1%2%8%4%-1%2%-1%2%1%1%
29724746422021285513861155320105698110650244296Any social care service100%100%100%100%100%100%100%100%100%100%100%100%100%100%100%100%100%100%100%
Public Perceptions of the NHS and Social CareFINAL PUBLIC
Table 150Q.22b Which of the following social care services, if any, have you, members of your household, family or friends used in the last year or so? And did you usethat service personally or was it someone else?
Base : All respondents who have experienced social care through someone else
Respondent type : General public aged 16+ Fieldwork dates : 14th November - 9th December 2011Source : Ipsos MORI (JN10-039262-01)Proportions/Means: Columns Tested (5% risk level) - z/a/b/c/d/e/f/g/h/i - z/j/k - z/l/m - z/n/o - z/p/q - z/rOverlap formulae used. * small base; ** very small base (under 30) ineligible for sig testing

UnwtdPrivate healthSatisfaction withImpact of NHS reformsGovernment has righttotalinsurancesocial careon patientsNHS policyNHS use in last year
SocialNHSDissatisficareWalk InChoicesPharmacistWtd.
NoYesedSatisfiedWorseBetterDisagreeAgreeservicesClinicwebsite/ChemistNHS DirectA&EOutpatientInpatientGPTotal(r)(q)(p)(o)(n)(m)(l)(k)(j)(i)(h)(g)(f)(e)(d)(c)(b)(a)(z)29724746*42*20212855*13861*15**53*20**105*69*81*10650*244296Weighted Total1701383129110743675311436146949536529143171Multiple user57%56%67%69%54%58%65%54%51%94%68%71%66%z71%za66%62%59%58%58%
Public Perceptions of the NHS and Social CareFINAL PUBLIC
Table 150Q.22b Which of the following social care services, if any, have you, members of your household, family or friends used in the last year or so? And did you usethat service personally or was it someone else?
Base : All respondents who have experienced social care through someone else
Respondent type : General public aged 16+ Fieldwork dates : 14th November - 9th December 2011Source : Ipsos MORI (JN10-039262-01)Proportions/Means: Columns Tested (5% risk level) - z/a/b/c/d/e/f/g/h/i - z/j/k - z/l/m - z/n/o - z/p/q - z/rOverlap formulae used. * small base; ** very small base (under 30) ineligible for sig testing

UnwtdtotalWork StatusSocial GradeAgeGender
Full/part-Wtd.OtherUnemployedRetiredtimeDEC2C1AB65+55-6435-5425-3416-24FemaleMaleTotal
(p)(o)(n)(m)(l)(k)(j)(i)(h)(g)(f)(e)(d)(c)(b)(a)(z)348502311016576751128581721104441196152348Unweighted Total34847*21**9517972*73*11186*72*60*11548*48*191152343Weighted Total10614732492725242625223510115745102Very satisfied30%30%31%34%28%37%i34%22%30%35%37%30%20%22%30%29%30%i
14320841733135453232194527207765142Quite satisfied41%42%40%43%41%42%48%40%37%44%31%39%56%zf41%41%43%41%f
42917277523821112710261743Neither satisfied nor12%18%m3%7%15%m10%7%20%zhj9%3%18%g11%15%g22%g14%11%12%gmdissatisfied272371441101152143117926Quite dissatisfied8%4%13%7%8%5%1%9%j13%zj7%4%12%7%3%9%6%8%j
17124122665339-481018Very dissatisfied5%2%9%4%6%3%8%5%5%4%4%8%-7%4%7%5%
1321542235441125712Don't know/Refused4%4%4%5%2%3%3%3%5%6%e6%e1%2%4%2%5%3%e
249341573122586069585741793730135109244Satisfied72%71%70%77%68%80%i81%zhi62%67%79%68%69%77%63%71%72%71%i
44351026661616852335251944Dissatisfied13%6%22%11%15%8%9%14%18%11%8%20%zdf7%10%13%12%13%
2053110639652535342493657332510991200Net Satisfied59%65%48%66%54%72%zhi73%zhi48%49%68%ze60%49%70%e53%57%60%58%ehi
Public Perceptions of the NHS and Social CareFINAL PUBLIC
Table 151Q23. Overall, how satisfied or dissatisfied are you with the service?
Base : All respondents who have received/experienced social care either personally or through someone else
Respondent type : General public aged 16+ Fieldwork dates : 14th November - 9th December 2011Source : Ipsos MORI (JN10-039262-01)Proportions/Means: Columns Tested (5% risk level) - z/a/b - z/c/d/e/f/g - z/h/i/j/k - z/l/m/n/o - z/pOverlap formulae used. * small base; ** very small base (under 30) ineligible for sig testing

People aretreated with
Unwtddignity andtotalrespectNHS useHospital useEthnicityNHS/social care staffHousehold TypeHome Ownership
NotAdultshospitalHospitalInformalSocialwith
Non NHS/A&E/A&EsocialcareKnow NHSNHSdependentNon-Owner -PrivateSocialWtd.DisagreeAgreeuserNHS useruseruserMixedWhiteAsianBlackcarerworkerstaffstaffchildrenpensionerPensionerOtheroccupierrenterrenterTotal
(v)(u)(t)(s)(r)(q)(p)(o)(n)(m)(l)(k)(j)(i)(h)(g)(f)(e)(d)(c)(b)(a)(z)34811322026322151197228713451431511520801699932314569348Unweighted Total34811321627**3161511922**28314**43*14117**11420**84*17287*3**22448*68*343Weighted Total106188010924557186113485361245126-711318102Very satisfied30%16%37%zu36%29%30%30%56%30%8%31%34%30%31%4%29%30%30%-32%26%27%30%u
143488961366082-114121655549133568392872826142Quite satisfied41%42%41%21%43%z40%43%-40%84%38%39%28%43%63%42%40%44%72%39%58%zac38%41%4214257362320-36151551429286-2561243Neither satisfied nor12%13%12%27%11%15%10%-13%8%13%11%30%13%9%11%16%ze6%-11%12%18%12%erdissatisfied2715101251115-22-4111641097-191626Quite dissatisfied8%13%zt5%4%8%7%8%-8%-9%8%6%6%20%12%5%8%-9%2%8%8%t
17144117514-16-29-31685-151218Very dissatisfied5%13%zt2%5%5%3%7%-6%-5%6%-3%4%7%4%5%-7%2%3%5%t
13472108419-2316--7517-412Don't know/Refused4%3%3%8%3%5%2%44%3%-5%2%6%5%--4%5%g28%3%-6%3%
249661691522910513912001329103108514601206521584044244Satisfied72%58%78%zu57%72%69%73%56%71%92%69%73%58%75%67%71%70%75%72%70%84%za65%71%u
4429152421629-38-620195161712-342844Dissatisfied13%26%zt7%8%13%10%15%-14%-14%14%i6%8%24%19%10%13%-15%5%12%13%t
20537154131878911111621324839769441035321243836200Net Satisfied59%33%72%zu49%59%59%58%56%57%92%55%59%52%66%z43%52%60%61%72%55%79%zac53%58%u
Public Perceptions of the NHS and Social CareFINAL PUBLIC
Table 152Q23. Overall, how satisfied or dissatisfied are you with the service?
Base : All respondents who have received/experienced social care either personally or through someone else
Respondent type : General public aged 16+ Fieldwork dates : 14th November - 9th December 2011Source : Ipsos MORI (JN10-039262-01)Proportions/Means: Columns Tested (5% risk level) - z/a/b/c/d - z/e/f/g - z/h/i/j/k - z/l/m/n/o - z/p/q - z/r/s - z/t/u - z/vOverlap formulae used. * small base; ** very small base (under 30) ineligible for sig testing

UnwtdtotalFuture of NHSSatisfaction with NHSGOR
DisYorkshire &WestEastWtd.WorseSameBettersatisfiedSatisfiedHumbersideMidlandsSouth-WestSouth-EastNorth-WestNorth-EastLondonEasternMidlandsTotal
(o)(n)(m)(l)(k)(j)(i)(h)(g)(f)(e)(d)(c)(b)(a)(z)3481208812959242334544534226264930348Unweighted Total34811790*12559*23636*48*41*56*41*24**27**41*30**343Weighted Total106322836117962081618123127102Very satisfied30%27%31%29%19%34%zk17%42%gi20%29%43%zgi50%13%29%23%30%k
1434244522310321171518147141916142Quite satisfied41%36%49%41%39%44%59%zefh36%36%33%34%30%53%46%55%41%4216917121765857254143Neither satisfied nor12%14%10%14%20%j7%16%11%19%10%16%9%18%10%4%12%jdissatisfied2712311101411561234326Quite dissatisfied8%11%m3%9%17%zj6%3%2%11%11%2%8%12%11%8%8%
1711253122326111-218Very dissatisfied5%10%zm2%4%5%5%6%7%4%10%b2%3%4%-7%5%
13444-11-1441--2112Don't know/Refused4%3%5%3%-5%-2%9%z7%2%--4%3%3%
24974728834182273723343219183123244Satisfied72%63%80%zn70%58%77%zk76%78%g56%62%77%g80%65%75%78%71%gkn
44245161326346122344544Dissatisfied13%20%zm5%12%22%zj11%9%9%16%22%ze5%11%16%11%15%13%m
20550677221156243217223016132619200Net Satisfied59%43%74%zln58%n36%66%zk67%fg68%fg41%40%73%zfg69%49%64%fg63%58%fgkn
Public Perceptions of the NHS and Social CareFINAL PUBLIC
Table 153Q23. Overall, how satisfied or dissatisfied are you with the service?
Base : All respondents who have received/experienced social care either personally or through someone else
Respondent type : General public aged 16+ Fieldwork dates : 14th November - 9th December 2011Source : Ipsos MORI (JN10-039262-01)Proportions/Means: Columns Tested (5% risk level) - z/a/b/c/d/e/f/g/h/i - z/j/k - z/l/m/n - z/oOverlap formulae used. * small base; ** very small base (under 30) ineligible for sig testing

UnwtdPrivate healthSatisfaction withImpact of NHS reformsGovernment has righttotalinsurancesocial careon patientsNHS policyNHS use in last year
SocialNHSDissatisficareWalk InChoicesPharmacistWtd.
NoYesedSatisfiedWorseBetterDisagreeAgreeservicesClinicwebsite/ChemistNHS DirectA&EOutpatientInpatientGPTotal(r)(q)(p)(o)(n)(m)(l)(k)(j)(i)(h)(g)(f)(e)(d)(c)(b)(a)(z)34829449442491456716471286022116749014672282348Unweighted Total34828850*44*24414366*16072*25**61*22**11776*93*13769*275343Weighted Total1068715-102402643245154301923442781102Very satisfied30%30%29%-42%zo28%39%27%33%20%24%18%26%25%25%32%39%defh29%30%o
14311920-14260286436122384928455329113142Quite satisfied41%41%41%-58%zo42%43%40%49%46%38%35%42%37%48%39%43%41%41%o
42385--1841883133171491883243Neither satisfied nor12%13%9%--13%7%11%12%11%21%zad14%15%18%10%13%12%12%12%nodissatisfied2722326-11219-34511961012526Quite dissatisfied8%8%6%59%zn-8%3%12%zj-10%6%23%9%b12%b7%7%1%9%zb8%bjn
1712618-1051131528571021518Very dissatisfied5%4%12%zq41%zn-7%7%7%5%5%9%9%7%6%8%7%3%6%5%nq
13102--515122-21332912Don't know/Refused4%4%3%--3%1%3%1%7%3%-2%1%3%2%3%3%3%n
24920535-24410054107601738127947689756193244Satisfied72%71%70%-100%zo70%82%z67%83%zk67%62%53%68%62%73%71%81%zacefh70%71%o
4434944-2073034971914132034044Dissatisfied13%12%17%100%zn-14%10%19%zj5%15%15%b32%16%b19%b14%b14%b4%15%b13%bjn
20517126-4424479477656132956133557753153200Net Satisfied59%59%53%-100%100%zo56%72%zm48%78%zk51%47%21%52%43%59%e56%e77%zacdefh56%e58%aeko
Public Perceptions of the NHS and Social CareFINAL PUBLIC
Table 154Q23. Overall, how satisfied or dissatisfied are you with the service?
Base : All respondents who have received/experienced social care either personally or through someone else
Respondent type : General public aged 16+ Fieldwork dates : 14th November - 9th December 2011Source : Ipsos MORI (JN10-039262-01)Proportions/Means: Columns Tested (5% risk level) - z/a/b/c/d/e/f/g/h/i - z/j/k - z/l/m - z/n/o - z/p/q - z/rOverlap formulae used. * small base; ** very small base (under 30) ineligible for sig testing

UnwtdtotalWork StatusSocial GradeAgeGender
Full/part-Wtd.OtherUnemployedRetiredtimeDEC2C1AB65+55-6435-5425-3416-24FemaleMaleTotal
(p)(o)(n)(m)(l)(k)(j)(i)(h)(g)(f)(e)(d)(c)(b)(a)(z)481252562461442211933282048Unweighted Total48*10**5**21**7**22**5**13**3**19**9**9**3**3**26**18**43*Weighted Total285215211382147211141024Agree58%49%41%71%28%53%67%59%47%72%74%21%31%31%55%57%56%1241428-12325-17511Disagree25%41%21%17%36%39%-9%53%15%26%55%-38%26%27%26%6122-222-2-111425Don't know
13%10%38%12%-9%33%14%-13%-11%30%31%14%10%12%2---2--2---11-112Refused4%---36%--19%---13%40%-5%7%6%
Public Perceptions of the NHS and Social CareFINAL PUBLIC
Table 155Q24. On the whole, do you agree or disagree with the following statement:
- Social care services I receive take account of my personal needs -
Base : All respondents who have received/experienced social care personally
Respondent type : General public aged 16+ Fieldwork dates : 14th November - 9th December 2011Source : Ipsos MORI (JN10-039262-01)Proportions/Means: Columns Tested (5% risk level) - z/a/b - z/c/d/e/f/g - z/h/i/j/k - z/l/m/n/o - z/pOverlap formulae used. * small base; ** very small base (under 30) ineligible for sig testing

People aretreated with
Unwtddignity andtotalrespectNHS useHospital useEthnicityNHS/social care staffHousehold TypeHome Ownership
NotAdultshospitalHospitalInformalSocialwith
Non NHS/A&E/A&EsocialcareKnow NHSNHSdependentNon-Owner -PrivateSocialWtd.DisagreeAgreeuserNHS useruseruserMixedWhiteAsianBlackcarerworkerstaffstaffchildrenpensionerPensionerOtheroccupierrenterrenterTotal
(v)(u)(t)(s)(r)(q)(p)(o)(n)(m)(l)(k)(j)(i)(h)(g)(f)(e)(d)(c)(b)(a)(z)481827246840-3611010-10-81327-1892148Unweighted Total48*17**24**2**41*7**36*-**33*1**8**9**-**9**-**8**12**23**-**16**9**19**43*Weighted Total28517123321-18-55-6-2715-1021224Agree58%28%71%46%56%49%57%-55%-59%56%-64%-26%57%65%-64%23%65%56%128311029-10-2--1-344-25511Disagree25%48%14%54%25%26%26%-29%-22%--13%-37%33%19%-12%53%26%26%624-524-3122-1-3-2-3125Don't know
13%10%15%-13%25%10%-9%100%19%19%-10%-37%-11%-17%11%10%12%22--2-2-2--2-1--11-11-2Refused4%14%--6%-7%-7%--26%-13%--10%5%-8%14%-6%
Public Perceptions of the NHS and Social CareFINAL PUBLIC
Table 156Q24. On the whole, do you agree or disagree with the following statement:
- Social care services I receive take account of my personal needs -
Base : All respondents who have received/experienced social care personally
Respondent type : General public aged 16+ Fieldwork dates : 14th November - 9th December 2011Source : Ipsos MORI (JN10-039262-01)Proportions/Means: Columns Tested (5% risk level) - z/a/b/c/d - z/e/f/g - z/h/i/j/k - z/l/m/n/o - z/p/q - z/r/s - z/t/u - z/vOverlap formulae used. * small base; ** very small base (under 30) ineligible for sig testing

UnwtdtotalFuture of NHSSatisfaction with NHSGOR
DisYorkshire &WestEastWtd.WorseSameBettersatisfiedSatisfiedHumbersideMidlandsSouth-WestSouth-EastNorth-WestNorth-EastLondonEasternMidlandsTotal
(o)(n)(m)(l)(k)(j)(i)(h)(g)(f)(e)(d)(c)(b)(a)(z)481714148355107537110-48Unweighted Total48*15**13**12**7**32*5**10**6**5**3**6**1**8**-**43*Weighted Total28849321352324-6-24Agree58%55%32%72%37%66%z54%48%25%56%66%72%-79%-56%12462451441--11-11Disagree25%26%44%13%51%16%23%41%60%19%--100%9%-26%j
622214-11-12-1-5Don't know13%11%14%15%13%14%-10%15%-34%28%-12%-12%211--11--1-----2Refused4%8%9%--4%23%--24%-----6%
Public Perceptions of the NHS and Social CareFINAL PUBLIC
Table 157Q24. On the whole, do you agree or disagree with the following statement:
- Social care services I receive take account of my personal needs -
Base : All respondents who have received/experienced social care personally
Respondent type : General public aged 16+ Fieldwork dates : 14th November - 9th December 2011Source : Ipsos MORI (JN10-039262-01)Proportions/Means: Columns Tested (5% risk level) - z/a/b/c/d/e/f/g/h/i - z/j/k - z/l/m/n - z/oOverlap formulae used. * small base; ** very small base (under 30) ineligible for sig testing

UnwtdPrivate healthSatisfaction withImpact of NHS reformsGovernment has righttotalinsurancesocial careon patientsNHS policyNHS use in last year
SocialNHSDissatisficareWalk InChoicesPharmacistWtd.
NoYesedSatisfiedWorseBetterDisagreeAgreeservicesClinicwebsite/ChemistNHS DirectA&EOutpatientInpatientGPTotal(r)(q)(p)(o)(n)(m)(l)(k)(j)(i)(h)(g)(f)(e)(d)(c)(b)(a)(z)
4844244118142310131021771432223748Unweighted Total48*39*2**4**37*16**13**21**10**11**9**2**16**6**13**29*20**33*43*Weighted Total282111229710574173516101924Agree58%54%46%21%59%53%55%51%45%68%46%45%44%41%41%57%51%56%56%12101110345432-43765811Disagree25%26%54%26%26%18%29%26%43%32%20%-28%44%52%22%28%25%26%65-15414--212114245Don't know
13%14%-21%12%22%7%17%--21%55%13%15%8%13%9%11%12%22-111111-1-2--2222Refused4%6%-32%3%7%9%6%12%-14%-15%--8%12%7%6%
Public Perceptions of the NHS and Social CareFINAL PUBLIC
Table 158Q24. On the whole, do you agree or disagree with the following statement:
- Social care services I receive take account of my personal needs -
Base : All respondents who have received/experienced social care personally
Respondent type : General public aged 16+ Fieldwork dates : 14th November - 9th December 2011Source : Ipsos MORI (JN10-039262-01)Proportions/Means: Columns Tested (5% risk level) - z/a/b/c/d/e/f/g/h/i - z/j/k - z/l/m - z/n/o - z/p/q - z/rOverlap formulae used. * small base; ** very small base (under 30) ineligible for sig testing

UnwtdtotalWork StatusSocial GradeAgeGender
Full/part-Wtd.OtherUnemployedRetiredtimeDEC2C1AB65+55-6435-5425-3416-24FemaleMaleTotal
(p)(o)(n)(m)(l)(k)(j)(i)(h)(g)(f)(e)(d)(c)(b)(a)(z)1001162612705082472013062472201693311581235274741001Unweighted Total100115758*2355512392013122491981433501671435154861001Weighted Total
787121468101938191328115403575To a great extent8%5%1%9%n8%3%5%6%15%zijk10%c9%8%7%3%8%7%8%k
2592911591594039879048381044720147110257To some extent26%18%19%25%29%zo17%20%28%jk36%zijk24%c27%c30%zc28%c14%29%za23%26%acjko
21434124213152497246333186373298120219Hardly at all21%22%20%18%24%22%24%23%18%16%22%25%g22%22%19%25%zb22%bg
44384351102151351011337695591317287227218445Not at all44%54%zl60%zl47%l39%56%zhi50%h43%h30%48%e42%38%43%61%zdefg44%45%44%ehl
72-3-42--321--336Already using social1%2%l-1%l-2%zhi1%--2%z1%*--1%1%1%care services
337361280204484910712867511315825187145332To a great/some extent34%23%20%34%no37%zno20%25%34%jk51%zijk34%c36%c38%zc35%c17%36%za30%33%acjkno
6571194715234618715020512112891217109118326338663Hardly/not at all66%75%zlm80%zlm65%63%78%zhi75%zhi66%h49%65%63%62%65%83%zdefg63%70%zb66%bhl
-320-82-35-72-142-139-101-987-61-40-86-51-93-138-193-331Net-32%-52%-60%-31%-26%-58%-50%-31%3%-31%-28%-25%-30%-65%-27%-40%-33%
Public Perceptions of the NHS and Social CareFINAL PUBLIC
Table 159Q25. Many people will need to use social care services when they are older and it is likely that they may have to contribute towards the cost. Before today, to whatextent had you thought about preparing financially to pay for social care services you might need when you are older?
Base : All respondents
Respondent type : General public aged 16+ Fieldwork dates : 14th November - 9th December 2011Source : Ipsos MORI (JN10-039262-01)Proportions/Means: Columns Tested (5% risk level) - z/a/b - z/c/d/e/f/g - z/h/i/j/k - z/l/m/n/o - z/pOverlap formulae used. * small base

People aretreated with
Unwtddignity andtotalrespectNHS useHospital useEthnicityNHS/social care staffHousehold TypeHome Ownership
NotAdultshospitalHospitalInformalSocialwith
Non NHS/A&E/A&EsocialcareKnow NHSNHSdependentNon-Owner -PrivateSocialWtd.DisagreeAgreeuserNHS useruseruserMixedWhiteAsianBlackcarerworkerstaffstaffchildrenpensionerPensionerOtheroccupierrenterrenterTotal
(v)(u)(t)(s)(r)(q)(p)(o)(n)(m)(l)(k)(j)(i)(h)(g)(f)(e)(d)(c)(b)(a)(z)100130864710090145854310750741612543628951291461249106491691731001Unweighted Total1001304652104*89746853311**74778*15925038*29252*30547522110**6401781731001Weighted Total
7825458673046259492932652233211597875To a great extent8%8%7%8%8%6%9%21%8%6%6%12%z8%9%9%7%7%9%8%9%zb4%5%8%b
2598616224233138119220425267799014781235721715034257To some extent26%28%25%23%26%29%zp22%21%27%zl32%l16%31%z24%31%z27%25%26%26%21%27%28%20%26%alp
214481662519410111821562336425669681143611443538219Hardly at all21%16%25%zu24%22%21%22%19%21%30%23%17%12%23%k16%22%24%e16%10%23%20%22%22%eku
4431432754739819924643252586100221102513720410362638689445Not at all44%47%42%45%44%42%46%39%44%32%54%zmn40%56%ik38%48%45%43%47%62%41%49%51%zc44%cim
7231524-3-22-1--24-2-36Already using social1%1%*1%1%*1%-*-1%1%-*--*2%zfg-*-2%zc1%care services
33711120832300167165526329351061211619991557732305743332To a great/some extent34%37%32%30%34%36%31%42%35%zl38%l22%42%z31%40%z36%33%33%35%28%36%za32%25%33%al
6571914417259129936464814812214226176342063181407407121127663Hardly/not at all66%63%68%69%66%64%68%58%64%62%77%zmn57%69%60%64%67%67%63%72%64%68%74%zc66%cikn
-320-80-233-40-291-132-199-2-218-19-87-36-14-60-15-106-163-62-4-177-65-85-331Net-32%-26%-36%-39%-32%-28%-37%-16%-29%-25%-55%-15%-38%-20%-28%-35%-34%-28%-43%-28%-36%-49%-33%
Public Perceptions of the NHS and Social CareFINAL PUBLIC
Table 160Q25. Many people will need to use social care services when they are older and it is likely that they may have to contribute towards the cost. Before today, to whatextent had you thought about preparing financially to pay for social care services you might need when you are older?
Base : All respondents
Respondent type : General public aged 16+ Fieldwork dates : 14th November - 9th December 2011Source : Ipsos MORI (JN10-039262-01)Proportions/Means: Columns Tested (5% risk level) - z/a/b/c/d - z/e/f/g - z/h/i/j/k - z/l/m/n/o - z/p/q - z/r/s - z/t/u - z/vOverlap formulae used. * small base; ** very small base (under 30) ineligible for sig testing

UnwtdtotalFuture of NHSSatisfaction with NHSGOR
DisYorkshire &WestEastWtd.WorseSameBettersatisfiedSatisfiedHumbersideMidlandsSouth-WestSouth-EastNorth-WestNorth-EastLondonEasternMidlandsTotal
(o)(n)(m)(l)(k)(j)(i)(h)(g)(f)(e)(d)(c)(b)(a)(z)1001328298343168703909910715413955143126881001Unweighted Total1001327302340168701100*106*10216213651*14810986*1001Weighted Total
78202331174554616105712975To a great extent8%6%8%9%10%6%5%4%6%10%7%10%5%11%h11%8%j
25982917741186262426432612473814257To some extent26%25%30%zl23%24%26%26%23%25%27%19%23%32%ae35%zae17%26%a
2145869843116015262336376382117219Hardly at all21%18%23%25%n18%23%15%24%23%22%27%di11%25%d19%20%22%n
44316611814579307525248676326553646445Not at all44%51%zlm39%43%47%44%52%bc49%b47%b42%46%b50%b37%33%53%bc44%bm
7212141----212-6Already using social1%**1%*1%1%----5%zacefgh1%1%-1%care services
33710211410857231322831593617555124332To a great/some extent34%31%38%z32%34%33%32%27%31%36%26%34%37%46%zaeghi27%33%
65722418723011046768787110310032935762663Hardly/not at all66%68%62%67%65%67%68%b73%b69%b64%74%zbc62%62%52%73%b66%b
-320-123-73-121-52-236-36-50-39-45-64-14-38-6-39-331Net-32%-37%-24%-36%-31%-34%-36%-47%-38%-27%-47%-28%-25%-6%-45%-33%
Public Perceptions of the NHS and Social CareFINAL PUBLIC
Table 161Q25. Many people will need to use social care services when they are older and it is likely that they may have to contribute towards the cost. Before today, to whatextent had you thought about preparing financially to pay for social care services you might need when you are older?
Base : All respondents
Respondent type : General public aged 16+ Fieldwork dates : 14th November - 9th December 2011Source : Ipsos MORI (JN10-039262-01)Proportions/Means: Columns Tested (5% risk level) - z/a/b/c/d/e/f/g/h/i - z/j/k - z/l/m/n - z/oOverlap formulae used. * small base

My responsibility to save forImpact of NHS reforms onsocial carePrivate health insuranceSatisfaction with social carepatientsGovernment has right NHS policy
Wtd.DisagreeAgreeNoYesDissatisfiedSatisfiedWorseBetterDisagreeAgreeTotal
(j)(i)(h)(g)(f)(e)(d)(c)(b)(a)(z)393431815170442493822004032691001Unweighted Total39243481117544*2443792013932761001Weighted Total205152248243314322175To a great extent5%12%zj6%13%zh17%z10%9%7%8%7%8%hj
59165186651170965911379257To some extent15%38%zj23%37%zh25%28%25%29%29%29%26%hj
85801734434879526166219Hardly at all22%18%21%25%7%19%21%26%16%24%b22%bfi
22413939443229816876183108445Not at all57%zi32%49%zg25%51%40%44%38%47%39%44%acgi
4-6--53-426Already using social1%i-1%--2%z1%-1%1%1%care services
7921523888199412973145100332To a great/some extent20%50%zj29%50%zh42%39%z34%36%37%z36%33%hj
3092195678726145247128244175663Hardly/not at all79%zi50%70%zg50%58%59%65%64%62%63%66%begi
-230-4-3291-7-51-118-56-99-75-331Net-59%-1%-41%1%-16%-21%-31%-28%-25%-27%-33%
Public Perceptions of the NHS and Social CareFINAL PUBLIC
Table 162Q25. Many people will need to use social care services when they are older and it is likely that they may have to contribute towards the cost. Before today, to whatextent had you thought about preparing financially to pay for social care services you might need when you are older?
Base : All respondents
Respondent type : General public aged 16+ Fieldwork dates : 14th November - 9th December 2011Source : Ipsos MORI (JN10-039262-01)Proportions/Means: Columns Tested (5% risk level) - z/a/b - z/c/d - z/e/f - z/g/h - z/i/jOverlap formulae used. * small base

UnwtdtotalWork StatusSocial GradeAgeGender
Full/part-Wtd.OtherUnemployedRetiredtimeDEC2C1AB65+55-6435-5425-3416-24FemaleMaleTotal
(p)(o)(n)(m)(l)(k)(j)(i)(h)(g)(f)(e)(d)(c)(b)(a)(z)1001162612705082472013062472201693311581235274741001Unweighted Total100115758*2355512392013122491981433501671435154861001Weighted Total
55311633110152815918111302353To a great extent5%2%1%7%o6%o*5%k5%k11%zijk7%c6%c5%c7%c1%6%5%5%cko
2222075114128288281433692361212990219To some extent22%13%12%22%o26%zno12%14%26%zjk33%zjk22%c25%c26%zc22%c8%25%za19%22%acjkno
17427950894633633239216032248689174Hardly at all17%17%16%21%16%19%16%20%h13%19%15%17%19%16%17%18%17%h
54410541114288160130151108987717988107269280549Not at all54%67%zlm71%zlm49%52%67%zhi64%zhi49%43%49%54%51%52%74%zdefg52%58%55%him
62-3-32--311--235Already using social1%1%l-1%zl-1%i1%--2%z1%*--*1%*care services
2772386817429379710958441094813159114273To a great/some extent28%15%13%29%no32%zno12%19%31%jk44%zijk29%c31%c31%zc29%c9%31%za23%27%acjkno
7181325116437620616221514013698239119130354369723Hardly/not at all72%84%zlm87%zlm70%68%86%zhi81%zhi69%h56%69%69%68%71%91%zdefg69%76%zb72%bhl
-441-109-43-97-202-177-125-118-31-78-54-130-72-117-195-255-451Net-44%-69%-73%-41%-37%-74%-62%-38%-12%-40%-38%-37%-43%-82%-38%-53%-45%
Public Perceptions of the NHS and Social CareFINAL PUBLIC
Table 163Q26. And to what extent are you already preparing financially to pay for the social care services you might need when you are older?
Base : All respondents
Respondent type : General public aged 16+ Fieldwork dates : 14th November - 9th December 2011Source : Ipsos MORI (JN10-039262-01)Proportions/Means: Columns Tested (5% risk level) - z/a/b - z/c/d/e/f/g - z/h/i/j/k - z/l/m/n/o - z/pOverlap formulae used. * small base

People aretreated with
Unwtddignity andtotalrespectNHS useHospital useEthnicityNHS/social care staffHousehold TypeHome Ownership
NotAdultshospitalHospitalInformalSocialwith
Non NHS/A&E/A&EsocialcareKnow NHSNHSdependentNon-Owner -PrivateSocialWtd.DisagreeAgreeuserNHS useruseruserMixedWhiteAsianBlackcarerworkerstaffstaffchildrenpensionerPensionerOtheroccupierrenterrenterTotal
(v)(u)(t)(s)(r)(q)(p)(o)(n)(m)(l)(k)(j)(i)(h)(g)(f)(e)(d)(c)(b)(a)(z)100130864710090145854310750741612543628951291461249106491691731001Unweighted Total1001304652104*89746853311**74778*15925038*29252*30547522110**6401781731001Weighted Total
5523295481935242451932011721161408453To a great extent5%8%zt4%5%5%4%7%21%6%5%3%8%8%7%2%5%4%7%8%6%a5%2%5%a
2227913021198108111-18114246568016611055411653220219To some extent22%26%zt20%20%22%23%21%-24%zl17%15%26%16%27%z31%20%22%24%10%26%zab18%12%22%alt
174381292115393822112273432344556764231103031174Hardly at all17%13%20%zu21%17%20%15%19%15%34%zln21%n13%8%15%10%18%16%19%32%17%17%18%17%knu
544162361564932473027409339413326148301712721065322107115549Not at all54%53%55%54%55%53%57%60%55%43%59%m53%69%i51%57%56%57%e48%50%50%60%c67%zc55%cem
6131423-3-22-1--23-2-25Already using social1%**1%**1%-*-1%1%-*--*2%zg-*-1%*care services
277103158262461271462224182984910017771267022064124273To a great/some extent28%34%zt24%25%27%27%27%21%30%zl23%18%33%z24%34%z33%25%26%32%17%32%zab23%a14%27%alt
7182004907764634038495216012816529192352283481488432137146723Hardly/not at all72%66%75%zu74%72%73%72%79%70%77%80%zn66%76%66%67%75%73%67%83%67%77%c85%zc72%ceikn
u
-441-97-331-51-400-213-238-6-297-43-99-81-20-92-18-150-222-78-7-226-96-122-451Net-44%-32%-51%-49%-45%-46%-45%-58%-40%-55%-62%-32%-53%-32%-34%-49%-47%-35%-65%-35%-54%-71%-45%
Public Perceptions of the NHS and Social CareFINAL PUBLIC
Table 164Q26. And to what extent are you already preparing financially to pay for the social care services you might need when you are older?
Base : All respondents
Respondent type : General public aged 16+ Fieldwork dates : 14th November - 9th December 2011Source : Ipsos MORI (JN10-039262-01)Proportions/Means: Columns Tested (5% risk level) - z/a/b/c/d - z/e/f/g - z/h/i/j/k - z/l/m/n/o - z/p/q - z/r/s - z/t/u - z/vOverlap formulae used. * small base; ** very small base (under 30) ineligible for sig testing

UnwtdtotalFuture of NHSSatisfaction with NHSGOR
DisYorkshire &WestEastWtd.WorseSameBettersatisfiedSatisfiedHumbersideMidlandsSouth-WestSouth-EastNorth-WestNorth-EastLondonEasternMidlandsTotal
(o)(n)(m)(l)(k)(j)(i)(h)(g)(f)(e)(d)(c)(b)(a)(z)1001328298343168703909910715413955143126881001Unweighted Total1001327302340168701100*106*10216213651*14810986*1001Weighted Total
551916171136247146356553To a great extent5%6%5%5%7%5%2%4%7%9%i5%6%3%6%6%5%
22270707335153212223422113273318219To some extent22%21%23%21%21%22%21%20%22%26%e16%25%18%31%zce21%22%
1744556701813113151224325441813174Hardly at all17%14%18%21%n11%19%k12%14%12%15%24%zdgi9%30%zabdfghi17%15%17%kn
544193159178103377646560827628735050549Not at all54%59%53%52%61%54%64%bc61%b59%b51%56%56%49%46%59%55%b
6112141----2-2-5Already using social1%**1%*1%1%----5%zacefgh-1%-*care services
27789869047189232630562816324023273To a great/some extent28%27%29%26%28%27%23%24%30%35%zce20%31%22%37%zcehi27%27%e
718237215248121508768072106109331166863723Hardly/not at all72%73%71%73%72%72%76%b76%b70%65%80%zbdf65%78%bdf62%73%72%bf
-441-148-128-158-74-319-53-55-42-50-81-17-84-28-40-451Net-44%-45%-43%-46%-44%-45%-53%-52%-41%-31%-59%-34%-57%-25%-47%-45%
Public Perceptions of the NHS and Social CareFINAL PUBLIC
Table 165Q26. And to what extent are you already preparing financially to pay for the social care services you might need when you are older?
Base : All respondents
Respondent type : General public aged 16+ Fieldwork dates : 14th November - 9th December 2011Source : Ipsos MORI (JN10-039262-01)Proportions/Means: Columns Tested (5% risk level) - z/a/b/c/d/e/f/g/h/i - z/j/k - z/l/m/n - z/oOverlap formulae used. * small base

My responsibility to save forImpact of NHS reforms onsocial carePrivate health insuranceSatisfaction with social carepatientsGovernment has right NHS policy
Wtd.DisagreeAgreeNoYesDissatisfiedSatisfiedWorseBetterDisagreeAgreeTotal
(j)(i)(h)(g)(f)(e)(d)(c)(b)(a)(z)393431815170442493822004032691001Unweighted Total39243481117544*2443792013932761001Weighted Total
84133211202210231453To a great extent2%10%zj4%12%zh3%8%z6%5%6%5%5%hj
4614314871165386459663219To some extent12%33%zj18%40%zh37%ze22%23%23%24%23%22%hj
56731472243456515061174Hardly at all14%17%18%12%10%14%15%25%zd13%22%zb17%bj
278177478622313221395221136549Not at all71%zi41%59%zg36%51%54%56%c47%56%49%55%acgi
3-5--52-325Already using social1%-1%--2%z1%-1%1%*care services
551851819117731085611977273To a great/some extent14%43%zj22%52%zh39%30%29%28%30%28%27%hj
3352506258427166269145271198723Hardly/not at all85%zi57%77%zg48%61%68%71%72%69%71%72%gi
-280-65-4447-9-93-160-89-152-121-451Net-71%-15%-55%4%-21%-38%-42%-45%-39%-44%-45%
Public Perceptions of the NHS and Social CareFINAL PUBLIC
Table 166Q26. And to what extent are you already preparing financially to pay for the social care services you might need when you are older?
Base : All respondents
Respondent type : General public aged 16+ Fieldwork dates : 14th November - 9th December 2011Source : Ipsos MORI (JN10-039262-01)Proportions/Means: Columns Tested (5% risk level) - z/a/b - z/c/d - z/e/f - z/g/h - z/i/jOverlap formulae used. * small base

UnwtdtotalWork StatusSocial GradeAgeGender
Full/part-Wtd.OtherUnemployedRetiredtimeDEC2C1AB65+55-6435-5425-3416-24FemaleMaleTotal
(p)(o)(n)(m)(l)(k)(j)(i)(h)(g)(f)(e)(d)(c)(b)(a)(z)1001162612705082472013062472201693311581235274741001Unweighted Total100115758*2355512392013122491981433501671435154861001Weighted Total
96156215421102243219302512524496Strongly agree10%9%10%9%10%9%5%7%17%zijk10%6%9%15%zef8%10%9%10%j
33550187020064581199659401128147186153338Tend to agree33%32%32%30%36%27%29%38%jk39%jk30%28%32%48%zcefg33%36%31%34%k
156271233834429522926255521278866154Neither agree nor16%17%20%14%15%18%h14%17%12%13%17%16%13%19%17%13%15%disagree
19429104711051405748393076242694101196Tend to disagree19%18%17%20%20%21%20%18%19%20%21%22%14%18%18%21%20%
1993295510148605731463773162583114197Strongly disagree20%20%16%23%18%20%h30%zhik18%13%23%d26%zd21%d10%17%16%23%zb20%bdh
21538411451724-712821Don't know/no opinion2%3%l5%l3%l1%5%zhi2%2%*4%d2%1%-5%zde2%2%2%hl
4316524922538569141139794914110659237197434Agree43%41%42%39%46%36%34%45%jk56%zijk40%34%40%63%zcefg41%46%41%43%fjk
3936019102211991001148085671494051177215392Disagree39%38%33%44%38%41%h49%zhi37%32%43%d47%zd43%d24%35%d34%44%zb39%bdh
3845-1143-14-312760-6-18-866860-1842Net agree4%3%9%-4%8%zmo-6%-15%9%zk24%zijk-3%-13%-2%39%zcefg6%eg12%za-4%4%aefgjkm
Public Perceptions of the NHS and Social CareFINAL PUBLIC
Table 167Q27. And please tell me whether you agree or disagree with the following statement. It is my responsibility to save so that I can pay towards my care when I am older.
Base : All respondents
Respondent type : General public aged 16+ Fieldwork dates : 14th November - 9th December 2011Source : Ipsos MORI (JN10-039262-01)Proportions/Means: Columns Tested (5% risk level) - z/a/b - z/c/d/e/f/g - z/h/i/j/k - z/l/m/n/o - z/pOverlap formulae used. * small base

People aretreated with
Unwtddignity andtotalrespectNHS useHospital useEthnicityNHS/social care staffHousehold TypeHome Ownership
NotAdultshospitalHospitalInformalSocialwith
Non NHS/A&E/A&EsocialcareKnow NHSNHSdependentNon-Owner -PrivateSocialWtd.DisagreeAgreeuserNHS useruseruserMixedWhiteAsianBlackcarerworkerstaffstaffchildrenpensionerPensionerOtheroccupierrenterrenterTotal
(v)(u)(t)(s)(r)(q)(p)(o)(n)(m)(l)(k)(j)(i)(h)(g)(f)(e)(d)(c)(b)(a)(z)100130864710090145854310750741612543628951291461249106491691731001Unweighted Total1001304652104*89746853311**74778*15925038*29252*30547522110**6401781731001Weighted Total
9622716903462373136285392383424159251196Strongly agree10%7%11%6%10%7%12%zq31%10%l17%zln4%11%12%13%z4%12%f7%11%8%9%14%za6%10%flq
3359123737302172166326034417712109221111616632117549338Tend to agree33%30%36%z35%34%37%31%31%35%l43%l26%31%32%37%42%37%34%30%31%33%42%zac28%34%l
156411041613876781101153632237104085281931842154Neither agree nor16%14%16%15%15%16%15%10%14%19%23%zn13%5%13%19%13%18%z13%10%15%10%24%zbc15%bndisagree
194661221717985110-1461336489561154934921312339196Tend to disagree19%22%19%16%20%18%21%-20%16%23%19%23%19%20%18%20%22%21%20%b13%23%b20%b
1998210224173911063149338591145757924721353426197Strongly disagree20%27%zt16%23%19%19%20%28%20%m4%24%m24%i28%15%13%19%19%21%22%21%19%15%20%imt
212155161010-19-26-614971112621Don't know/no opinion2%1%2%5%r2%2%2%-3%-1%2%-2%1%1%2%3%8%2%1%4%2%ru
4311133084339120622873334747105171482414919589427010060434Agree43%37%47%zu41%44%44%43%61%45%l61%zln29%42%44%51%zk46%49%zf41%40%39%42%56%zac35%43%alu
393148225413521762163295167410719101171111859642655865392Disagree39%49%zt34%39%39%38%41%28%39%m20%47%zm43%i51%35%33%36%39%44%43%41%b32%38%39%bmt
38-3583240301243832-28-3-34773810-7*543-542Net agree4%-11%13%zu2%4%6%zp2%33%5%zl41%zln-17%-1%-7%16%zjk13%zjk13%zef2%e-3%-4%1%24%zac-3%4%acefj
klpu
Public Perceptions of the NHS and Social CareFINAL PUBLIC
Table 168Q27. And please tell me whether you agree or disagree with the following statement. It is my responsibility to save so that I can pay towards my care when I am older.
Base : All respondents
Respondent type : General public aged 16+ Fieldwork dates : 14th November - 9th December 2011Source : Ipsos MORI (JN10-039262-01)Proportions/Means: Columns Tested (5% risk level) - z/a/b/c/d - z/e/f/g - z/h/i/j/k - z/l/m/n/o - z/p/q - z/r/s - z/t/u - z/vOverlap formulae used. * small base; ** very small base (under 30) ineligible for sig testing

UnwtdtotalFuture of NHSSatisfaction with NHSGOR
DisYorkshire &WestEastWtd.WorseSameBettersatisfiedSatisfiedHumbersideMidlandsSouth-WestSouth-EastNorth-WestNorth-EastLondonEasternMidlandsTotal
(o)(n)(m)(l)(k)(j)(i)(h)(g)(f)(e)(d)(c)(b)(a)(z)1001328298343168703909910715413955143126881001Unweighted Total1001327302340168701100*106*10216213651*14810986*1001Weighted Total
9627363016695614231631612396Strongly agree10%8%12%9%10%10%5%6%14%ahi14%ahi11%a5%11%a11%a3%10%a
33511011010846247343328664118523927338Tend to agree33%34%37%32%27%35%34%31%27%40%g30%36%35%36%32%34%
1564254501911312162312315251714154Neither agree nor16%13%18%15%11%16%12%15%23%zdf7%23%zdf9%17%f15%f16%f15%fdisagree
19466507843133232423231510421719196Tend to disagree19%20%16%23%m26%z19%23%e22%e22%e14%11%19%28%zbef15%22%e20%e
19977447042123252711322714132522197Strongly disagree20%24%zm15%20%25%j18%25%cg26%cg11%20%c20%c27%cg8%23%cg26%cg20%cgjm
215842161-37621-121Don't know/no opinion2%2%3%1%1%2%1%-3%4%bh5%zbch4%b1%-1%2%
43113714713862316393942885721685030434Agree43%42%49%zl41%37%45%39%37%41%54%zaeghi42%41%46%46%35%43%
3931439414785257485134564324544242392Disagree39%44%m31%43%m50%zj37%48%efg48%efg33%34%31%46%37%38%48%efg39%ejm
38-653-9-2259-9-1283314-3148-1242Net agree4%-2%18%zln-3%-13%8%zk-9%-11%8%d20%zabcdeghi10%zadhi-5%9%zadhi8%zd-14%4%adhikln
Public Perceptions of the NHS and Social CareFINAL PUBLIC
Table 169Q27. And please tell me whether you agree or disagree with the following statement. It is my responsibility to save so that I can pay towards my care when I am older.
Base : All respondents
Respondent type : General public aged 16+ Fieldwork dates : 14th November - 9th December 2011Source : Ipsos MORI (JN10-039262-01)Proportions/Means: Columns Tested (5% risk level) - z/a/b/c/d/e/f/g/h/i - z/j/k - z/l/m/n - z/oOverlap formulae used. * small base

UnwtdPrivate healthSatisfaction withImpact of NHS reformsGovernment has righttotalinsurancesocial careon patientsNHS policyNHS use in last year
SocialNHSDissatisficareWalk InChoicesPharmacistWtd.
NoYesedSatisfiedWorseBetterDisagreeAgreeservicesClinicwebsite/ChemistNHS DirectA&EOutpatientInpatientGPTotal(r)(q)(p)(o)(n)(m)(l)(k)(j)(i)(h)(g)(f)(e)(d)(c)(b)(a)(z)10018151704424938220040326945182553001772253931967801001Unweighted Total100181117544*24437920139327642*18856*3011832303761927731001Weighted Total
96752122825253236320832233242257696Strongly agree10%9%12%4%11%7%13%m8%13%zk7%11%14%11%13%14%za11%13%10%10%m
3352547811801167712610296525110726912055267338Tend to agree33%31%45%zq25%33%31%38%32%37%21%34%45%bdi36%bi40%bcdi30%32%29%34%34%q
156132157364940495292574627364930114154Neither agree nor16%16%p9%16%15%13%20%zm12%19%k21%13%12%15%15%16%13%16%15%15%kpdisagree
194161321144822989421235115429508143155196Tend to disagree19%20%19%26%18%22%l14%23%zj15%29%e18%20%18%16%22%21%22%e20%20%jl
19917027104610726943684165431417636149197Strongly disagree20%21%z15%24%19%28%zl13%24%zj13%20%22%g11%18%17%18%20%19%19%20%jl
21191210143812-513831221Don't know/no opinion2%2%1%5%4%z*2%m1%3%k2%1%-2%1%1%2%1%2%2%akm
431329100131071411021581381285331429610116281342434Agree43%41%57%zq30%44%37%51%zm40%50%zk28%45%i58%zabcdi47%i52%zabcdi44%i43%i42%44%i43%imq
3933316022911895418378217617108599015679304392Disagree39%41%z34%49%37%50%zl27%47%zj28%49%eg40%30%36%32%39%42%ef41%e39%e39%ejl
38-240-917-4848-2559-9916343611623842Net agree4%*23%zq-20%7%zo-13%24%zm-6%21%zk-21%5%bci28%zabcdfhi11%zabcdhi20%zabcdfh5%ci2%1%5%zbci4%bcikoq
i
Public Perceptions of the NHS and Social CareFINAL PUBLIC
Table 170Q27. And please tell me whether you agree or disagree with the following statement. It is my responsibility to save so that I can pay towards my care when I am older.
Base : All respondents
Respondent type : General public aged 16+ Fieldwork dates : 14th November - 9th December 2011Source : Ipsos MORI (JN10-039262-01)Proportions/Means: Columns Tested (5% risk level) - z/a/b/c/d/e/f/g/h/i - z/j/k - z/l/m - z/n/o - z/p/q - z/rOverlap formulae used. * small base

UnwtdtotalWork StatusSocial GradeAgeGender
Full/part-Wtd.OtherUnemployedRetiredtimeDEC2C1AB65+55-6435-5425-3416-24FemaleMaleTotal
(p)(o)(n)(m)(l)(k)(j)(i)(h)(g)(f)(e)(d)(c)(b)(a)(z)1001162612705082472013062472201693311581235274741001Unweighted Total100115758*2355512392013122491981433501671435154861001Weighted Total249401471113645353685946743426107131238Strongly agree25%25%23%30%zl21%27%i26%i17%27%i30%zcde32%zcde21%20%18%21%27%zb24%bil
47769261062841078916712490591877773245241486Tend to agree48%44%45%45%52%45%44%53%zjk50%46%41%54%zf46%51%48%50%49%f
135181127803328502623234621248353136Tend to disagree13%12%19%12%14%14%14%16%10%12%16%13%12%17%16%za11%14%a
531021031131017138616204391553Strongly disagree5%7%3%4%6%6%5%6%5%4%4%5%12%zcefg2%8%za3%5%a
87195204222212619189271617414687Don't know9%12%9%9%8%9%10%8%7%9%7%8%9%12%8%9%9%
7261094017839717114221919214910526111198352373724Agree73%70%69%76%72%71%71%70%77%75%73%75%67%69%68%77%zb72%b
18828133711146386738312962402712268190Disagree19%18%23%16%20%19%19%21%15%16%20%18%24%g19%24%za14%19%a
5388127141286125104152154117761997171230305535Net agree54%51%46%60%zln52%52%52%49%62%zijk59%zd53%57%d42%50%45%63%zb53%bd
Public Perceptions of the NHS and Social CareFINAL PUBLIC
Table 171Q28. Please tell me whether on the whole you agree or disagree with each of the following statements:
- Britain's National Health Service is one of the best in the world -
Base : All respondents
Respondent type : General public aged 16+ Fieldwork dates : 14th November - 9th December 2011Source : Ipsos MORI (JN10-039262-01)Proportions/Means: Columns Tested (5% risk level) - z/a/b - z/c/d/e/f/g - z/h/i/j/k - z/l/m/n/o - z/pOverlap formulae used. * small base

People aretreated with
Unwtddignity andtotalrespectNHS useHospital useEthnicityNHS/social care staffHousehold TypeHome Ownership
NotAdultshospitalHospitalInformalSocialwith
Non NHS/A&E/A&EsocialcareKnow NHSNHSdependentNon-Owner -PrivateSocialWtd.DisagreeAgreeuserNHS useruseruserMixedWhiteAsianBlackcarerworkerstaffstaffchildrenpensionerPensionerOtheroccupierrenterrenterTotal
(v)(u)(t)(s)(r)(q)(p)(o)(n)(m)(l)(k)(j)(i)(h)(g)(f)(e)(d)(c)(b)(a)(z)100130864710090145854310750741612543628951291461249106491691731001Unweighted Total1001304652104*89746853311**74778*15925038*29252*30547522110**6401781731001Weighted Total24935196142249614221721348648831572986841613340238Strongly agree25%11%30%zu14%25%zs20%27%zq18%23%17%30%zm26%21%29%z29%23%21%31%zf38%25%19%23%24%fqsu
477133334674192492385358477411520148241402529443178481486Tend to agree48%44%51%zu64%zr47%53%zp45%42%48%61%zln46%46%52%51%45%46%53%ze43%42%50%47%47%49%epru
1357853131236076-1039243753783769301773325136Tend to disagree13%26%zt8%12%14%13%14%-14%12%15%15%13%13%15%12%15%13%11%12%19%zc14%14%t
5332202511835-47241538218269-3312853Strongly disagree5%10%zt3%2%6%4%7%-6%z2%2%6%i9%3%4%6%5%4%-5%7%5%5%iqt
872649879454146769192164382920152151987Don't know9%8%8%7%9%10%8%39%9%8%6%8%5%5%7%13%zf6%9%8%8%8%11%9%fi
7261685298264334438075316012217928232392113511638478117121724Agree73%55%81%zu78%72%74%71%61%71%78%77%72%73%79%zk74%69%74%74%80%75%zb66%70%72%bu
188110731517579111-1501128518451056953911104633190Disagree19%36%zt11%14%19%17%21%-20%14%18%21%22%15%19%18%20%18%11%17%26%zc19%19%t
538574566746826626973814994128201872915525512473687288535Net agree54%19%70%zu64%zr52%57%p50%61%51%63%n59%51%51%64%zk55%51%54%56%69%57%zb40%51%b53%bnpru
Public Perceptions of the NHS and Social CareFINAL PUBLIC
Table 172Q28. Please tell me whether on the whole you agree or disagree with each of the following statements:
- Britain's National Health Service is one of the best in the world -
Base : All respondents
Respondent type : General public aged 16+ Fieldwork dates : 14th November - 9th December 2011Source : Ipsos MORI (JN10-039262-01)Proportions/Means: Columns Tested (5% risk level) - z/a/b/c/d - z/e/f/g - z/h/i/j/k - z/l/m/n/o - z/p/q - z/r/s - z/t/u - z/vOverlap formulae used. * small base; ** very small base (under 30) ineligible for sig testing

UnwtdtotalFuture of NHSSatisfaction with NHSGOR
DisYorkshire &WestEastWtd.WorseSameBettersatisfiedSatisfiedHumbersideMidlandsSouth-WestSouth-EastNorth-WestNorth-EastLondonEasternMidlandsTotal
(o)(n)(m)(l)(k)(j)(i)(h)(g)(f)(e)(d)(c)(b)(a)(z)1001328298343168703909910715413955143126881001Unweighted Total1001327302340168701100*106*10216213651*14810986*1001Weighted Total24977708023199161826274824173526238Strongly agree25%23%23%23%14%28%zk16%17%26%c17%35%zcfhi47%zacfghi11%32%zcfhi30%cfhi24%cfk
47714915217358354505948865821814538486Tend to agree48%45%50%51%35%50%k50%55%b47%53%b43%40%55%be41%45%49%k
13552364749701721112219522136136Tend to disagree13%16%12%14%29%zj10%17%a19%a11%14%14%9%15%12%7%14%j
5324121723223551041144653Strongly disagree5%7%4%5%14%zj3%3%5%5%6%3%2%10%ze4%7%5%j
8727322315571331217711411987Don't know9%8%11%7%9%8%13%deh3%11%dh10%dh5%2%9%10%h11%dh9%h
7262252222538155367777411410645988064724Agree73%69%73%74%48%79%zk66%73%73%70%78%c88%zbcfghi66%74%75%72%k
188764864729220261632235371812190Disagree19%23%zm16%19%43%zj13%20%25%d16%19%17%11%25%d16%14%19%j
5381491741899461465158828239616352535Net agree54%46%58%n55%n5%66%zk46%48%57%c51%60%ci77%zabcefghi41%57%c60%c53%ckn
Public Perceptions of the NHS and Social CareFINAL PUBLIC
Table 173Q28. Please tell me whether on the whole you agree or disagree with each of the following statements:
- Britain's National Health Service is one of the best in the world -
Base : All respondents
Respondent type : General public aged 16+ Fieldwork dates : 14th November - 9th December 2011Source : Ipsos MORI (JN10-039262-01)Proportions/Means: Columns Tested (5% risk level) - z/a/b/c/d/e/f/g/h/i - z/j/k - z/l/m/n - z/oOverlap formulae used. * small base

UnwtdPrivate healthSatisfaction withImpact of NHS reformsGovernment has righttotalinsurancesocial careon patientsNHS policyNHS use in last year
SocialNHSDissatisficareWalk InChoicesPharmacistWtd.
NoYesedSatisfiedWorseBetterDisagreeAgreeservicesClinicwebsite/ChemistNHS DirectA&EOutpatientInpatientGPTotal(r)(q)(p)(o)(n)(m)(l)(k)(j)(i)(h)(g)(f)(e)(d)(c)(b)(a)(z)10018151704424938220040326945182553001772253931967801001Unweighted Total100181117544*24437920139327642*18856*3011832303761927731001Weighted Total249196392759046947213441871495710462201238Strongly agree25%24%22%4%31%zo24%23%24%26%31%23%32%24%27%25%28%z32%zadfh26%z24%o
47739286201121731111671491685221468010516971362486Tend to agree48%48%49%46%46%46%55%zm42%54%zk37%46%b40%48%b44%46%b45%b37%47%b49%abk
1351082711336516712562863926345127101136Tend to disagree13%13%16%25%z14%17%zl8%18%zj9%15%15%10%13%14%15%13%14%13%14%jl
53411059288318212522131824174253Strongly disagree5%5%6%11%n4%7%z4%8%zj3%4%6%9%7%7%8%6%9%za5%5%j
87731361522203121618623161628166787Don't know9%9%7%13%6%6%10%8%8%14%10%10%8%9%7%8%8%9%9%m
726588125221872641572602212812940217129162273133563724Agree73%73%71%51%77%o70%78%zm66%80%zk68%69%71%72%70%70%73%69%73%72%ko
188149381642932410233840116138537543143190Disagree19%18%21%36%zn17%25%zl12%26%zj12%19%21%19%20%21%23%20%23%19%19%jl
5384398771451701321581882190301569010919889419535Net agree54%54%50%15%59%zo45%66%zm40%68%zk49%48%53%52%49%47%53%47%54%bd53%bdkmo
Public Perceptions of the NHS and Social CareFINAL PUBLIC
Table 174Q28. Please tell me whether on the whole you agree or disagree with each of the following statements:
- Britain's National Health Service is one of the best in the world -
Base : All respondents
Respondent type : General public aged 16+ Fieldwork dates : 14th November - 9th December 2011Source : Ipsos MORI (JN10-039262-01)Proportions/Means: Columns Tested (5% risk level) - z/a/b/c/d/e/f/g/h/i - z/j/k - z/l/m - z/n/o - z/p/q - z/rOverlap formulae used. * small base
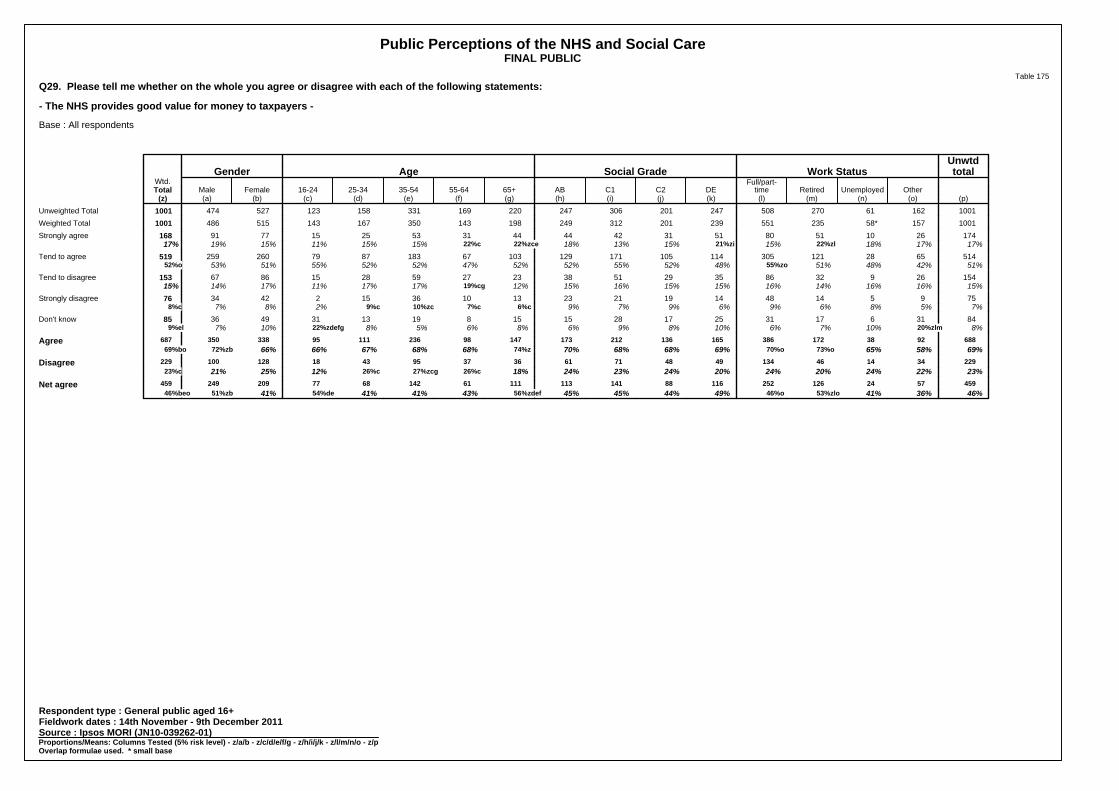
UnwtdtotalWork StatusSocial GradeAgeGender
Full/part-Wtd.OtherUnemployedRetiredtimeDEC2C1AB65+55-6435-5425-3416-24FemaleMaleTotal
(p)(o)(n)(m)(l)(k)(j)(i)(h)(g)(f)(e)(d)(c)(b)(a)(z)1001162612705082472013062472201693311581235274741001Unweighted Total100115758*2355512392013122491981433501671435154861001Weighted Total174261051805131424444315325157791168Strongly agree17%17%18%22%zl15%21%zi15%13%18%22%zce22%c15%15%11%15%19%17%
5146528121305114105171129103671838779260259519Tend to agree51%42%48%51%55%zo48%52%55%52%52%47%52%52%55%51%53%52%o
15426932863529513823275928158667153Tend to disagree15%16%16%14%16%15%15%16%15%12%19%cg17%17%11%17%14%15%7595144814192123131036152423476Strongly disagree7%5%8%6%9%6%9%7%9%6%c7%c10%zc9%c2%8%7%8%c
84316173125172815158191331493685Don't know8%20%zlm10%7%6%10%8%9%6%8%6%5%8%22%zdefg10%7%9%el
68892381723861651362121731479823611195338350687Agree69%58%65%73%o70%o69%68%68%70%74%z68%68%67%66%66%72%zb69%bo
229341446134494871613637954318128100229Disagree23%22%24%20%24%20%24%23%24%18%26%c27%zcg26%c12%25%21%23%c
459572412625211688141113111611426877209249459Net agree46%36%41%53%zlo46%o49%44%45%45%56%zdef43%41%41%54%de41%51%zb46%beo
Public Perceptions of the NHS and Social CareFINAL PUBLIC
Table 175Q29. Please tell me whether on the whole you agree or disagree with each of the following statements:
- The NHS provides good value for money to taxpayers -
Base : All respondents
Respondent type : General public aged 16+ Fieldwork dates : 14th November - 9th December 2011Source : Ipsos MORI (JN10-039262-01)Proportions/Means: Columns Tested (5% risk level) - z/a/b - z/c/d/e/f/g - z/h/i/j/k - z/l/m/n/o - z/pOverlap formulae used. * small base

People aretreated with
Unwtddignity andtotalrespectNHS useHospital useEthnicityNHS/social care staffHousehold TypeHome Ownership
NotAdultshospitalHospitalInformalSocialwith
Non NHS/A&E/A&EsocialcareKnow NHSNHSdependentNon-Owner -PrivateSocialWtd.DisagreeAgreeuserNHS useruseruserMixedWhiteAsianBlackcarerworkerstaffstaffchildrenpensionerPensionerOtheroccupierrenterrenterTotal
(v)(u)(t)(s)(r)(q)(p)(o)(n)(m)(l)(k)(j)(i)(h)(g)(f)(e)(d)(c)(b)(a)(z)100130864710090145854310750741612543628951291461249106491691731001Unweighted Total1001304652104*89746853311**74778*15925038*29252*30547522110**6401781731001Weighted Total174191461015867101212315254865412497247-1072536168Strongly agree17%6%22%zu10%18%zs14%19%zq19%16%20%16%19%15%19%23%16%15%21%zf-17%14%21%17%qsu
51412536861458255264737048941131915125156249114633710274519Tend to agree51%41%56%zu58%51%54%50%60%49%61%59%zn45%49%52%49%51%52%51%56%53%a58%a43%52%aknu
15492591813569841124721489496477531-942633153Tend to disagree15%30%zt9%17%15%15%16%10%17%9%13%19%z22%17%11%15%16%14%-15%15%19%15%t
7548245713244-6059243198263614-50111576Strongly disagree7%16%zt4%5%8%7%8%-8%7%6%10%8%6%16%zi9%8%6%-8%6%9%8%t
84215510754540171210162201274316452131685Don't know8%7%8%10%8%10%8%10%9%3%6%6%6%7%2%9%9%7%44%8%7%9%9%
6881435147161632236594926311916125205372053211616444128110687Agree69%47%79%zu68%69%69%69%79%66%81%zn75%n65%64%70%71%67%68%73%56%69%72%63%69%nu
229140832320510112711841230721268147311144-1443748229Disagree23%46%zt13%22%23%22%24%10%25%z16%19%29%z30%23%26%24%23%20%-22%21%28%23%t
4594430484112202388308519089131372413221011763009062459Net agree46%1%66%zu46%46%47%45%69%41%65%zn56%zn36%34%47%k45%43%44%53%zfg56%47%a51%a36%46%aknu
Public Perceptions of the NHS and Social CareFINAL PUBLIC
Table 176Q29. Please tell me whether on the whole you agree or disagree with each of the following statements:
- The NHS provides good value for money to taxpayers -
Base : All respondents
Respondent type : General public aged 16+ Fieldwork dates : 14th November - 9th December 2011Source : Ipsos MORI (JN10-039262-01)Proportions/Means: Columns Tested (5% risk level) - z/a/b/c/d - z/e/f/g - z/h/i/j/k - z/l/m/n/o - z/p/q - z/r/s - z/t/u - z/vOverlap formulae used. * small base; ** very small base (under 30) ineligible for sig testing

UnwtdtotalFuture of NHSSatisfaction with NHSGOR
DisYorkshire &WestEastWtd.WorseSameBettersatisfiedSatisfiedHumbersideMidlandsSouth-WestSouth-EastNorth-WestNorth-EastLondonEasternMidlandsTotal
(o)(n)(m)(l)(k)(j)(i)(h)(g)(f)(e)(d)(c)(b)(a)(z)1001328298343168703909910715413955143126881001Unweighted Total1001327302340168701100*106*10216213651*14810986*1001Weighted Total1745348601514392213244110142115168Strongly agree17%16%16%18%9%20%zk9%21%ci13%15%30%zabcfgi20%10%19%ci18%17%cik
51415718116657396614459855828845742519Tend to agree51%48%60%zln49%34%56%zk61%eh42%58%eh52%43%55%57%eh52%49%52%ehk
154603655547014191521215291812153Tend to disagree15%18%m12%16%32%zj10%14%18%14%13%16%9%19%16%14%15%jm
75291630313781281373105976Strongly disagree7%9%5%9%18%zj5%8%12%8%8%5%7%7%5%11%8%j
8428212911568972095119885Don't know8%9%7%9%7%8%8%8%7%12%7%10%7%8%9%9%
688210229226725397066721089938987857687Agree69%64%76%zln66%43%77%zk70%62%71%67%73%75%66%71%66%69%kn
2298952858410722312334288392321229Disagree23%27%zm17%25%m50%zj15%22%30%22%21%21%16%26%21%24%23%jm
459121177141-12432483550757130595536459Net agree46%37%59%zln41%-7%62%zk48%h33%49%h46%h52%ch59%zch40%50%h42%46%hkln
Public Perceptions of the NHS and Social CareFINAL PUBLIC
Table 177Q29. Please tell me whether on the whole you agree or disagree with each of the following statements:
- The NHS provides good value for money to taxpayers -
Base : All respondents
Respondent type : General public aged 16+ Fieldwork dates : 14th November - 9th December 2011Source : Ipsos MORI (JN10-039262-01)Proportions/Means: Columns Tested (5% risk level) - z/a/b/c/d/e/f/g/h/i - z/j/k - z/l/m/n - z/oOverlap formulae used. * small base

UnwtdPrivate healthSatisfaction withImpact of NHS reformsGovernment has righttotalinsurancesocial careon patientsNHS policyNHS use in last year
SocialNHSDissatisficareWalk InChoicesPharmacistWtd.
NoYesedSatisfiedWorseBetterDisagreeAgreeservicesClinicwebsite/ChemistNHS DirectA&EOutpatientInpatientGPTotal(r)(q)(p)(o)(n)(m)(l)(k)(j)(i)(h)(g)(f)(e)(d)(c)(b)(a)(z)10018151704424938220040326945182553001772253931967801001Unweighted Total100181117544*24437920139327642*18856*3011832303761927731001Weighted Total17414223260723173611239105730417544140168Strongly agree17%18%13%5%25%zo19%15%18%22%z28%z21%18%19%17%18%20%z23%z18%z17%o
51441991191191771151671561787261499011419090393519Tend to agree51%52%52%42%49%47%57%m42%56%k40%47%46%49%49%49%51%47%51%52%km
1541242912406327783372995334356035118153Tend to disagree15%15%17%27%z17%17%14%20%zj12%16%15%16%18%19%15%16%19%15%15%7553219124210529519620171928155976Strongly disagree7%7%12%zq20%zn5%11%zl5%13%zj3%12%10%11%7%9%8%7%8%8%8%jnq
8472123132517241721352111212376285Don't know8%9%7%6%5%7%9%6%6%5%7%9%7%6%9%b6%4%8%b9%bckn
688561114211792491462392172812636206121155265134533687Agree69%69%65%47%73%o66%73%61%78%zk68%67%64%69%66%67%71%70%69%69%ko
22917750215210537130431248157451548850177229Disagree23%22%28%47%zn21%28%zl19%33%zj15%28%26%27%25%28%24%23%26%23%23%j
45938364*1271441091101741778211326910117784356459Net agree46%47%zp37%*52%zo38%54%zm28%63%zk40%42%37%44%38%44%47%e44%46%e46%ekmop
Public Perceptions of the NHS and Social CareFINAL PUBLIC
Table 178Q29. Please tell me whether on the whole you agree or disagree with each of the following statements:
- The NHS provides good value for money to taxpayers -
Base : All respondents
Respondent type : General public aged 16+ Fieldwork dates : 14th November - 9th December 2011Source : Ipsos MORI (JN10-039262-01)Proportions/Means: Columns Tested (5% risk level) - z/a/b/c/d/e/f/g/h/i - z/j/k - z/l/m - z/n/o - z/p/q - z/rOverlap formulae used. * small base

UnwtdtotalWork StatusSocial GradeAgeGender
Full/part-Wtd.OtherUnemployedRetiredtimeDEC2C1AB65+55-6435-5425-3416-24FemaleMaleTotal
(p)(o)(n)(m)(l)(k)(j)(i)(h)(g)(f)(e)(d)(c)(b)(a)(z)1001162612705082472013062472201693311581235274741001Unweighted Total100115758*2355512392013122491981433501671435154861001Weighted Total280521876129805367757038873942117158275Strongly agree28%33%l31%32%zl23%34%zi26%21%30%i35%zde26%25%23%29%23%33%zb28%bil
46063251042751049615411384651578377240227466Tend to agree46%40%43%44%50%zo44%48%49%45%43%45%45%49%54%g47%47%47%
14524825873122533918256423148263145Tend to disagree14%15%14%11%16%13%11%17%16%9%17%g18%zcg14%10%16%13%14%gm
83146164616222817121432196552882Strongly disagree8%9%10%7%8%6%11%9%7%6%9%9%11%c4%11%za6%8%a
33411413981061421034221132Don't know3%3%2%6%zl2%4%4%3%2%7%zdef2%3%2%3%4%2%3%
74011543179404184149221188154102244122119357385742Agree74%73%74%76%73%77%74%71%75%78%e72%70%73%83%zdef69%79%zb74%be
22838144213446448156303896432013790227Disagree23%24%24%18%24%m19%22%26%22%15%27%cg27%zcg25%cg14%27%za19%23%acgm
5127729138270138105140132124641487999220294515Net agree51%49%50%59%zl49%58%zi52%45%53%63%zdef45%42%47%69%zdef43%61%zb51%bei
Public Perceptions of the NHS and Social CareFINAL PUBLIC
Table 179Q30. Please tell me whether on the whole you agree or disagree with each of the following statements:
- If I was very ill I would feel safe in an NHS hospital -
Base : All respondents
Respondent type : General public aged 16+ Fieldwork dates : 14th November - 9th December 2011Source : Ipsos MORI (JN10-039262-01)Proportions/Means: Columns Tested (5% risk level) - z/a/b - z/c/d/e/f/g - z/h/i/j/k - z/l/m/n/o - z/pOverlap formulae used. * small base

People aretreated with
Unwtddignity andtotalrespectNHS useHospital useEthnicityNHS/social care staffHousehold TypeHome Ownership
NotAdultshospitalHospitalInformalSocialwith
Non NHS/A&E/A&EsocialcareKnow NHSNHSdependentNon-Owner -PrivateSocialWtd.DisagreeAgreeuserNHS useruseruserMixedWhiteAsianBlackcarerworkerstaffstaffchildrenpensionerPensionerOtheroccupierrenterrenterTotal
(v)(u)(t)(s)(r)(q)(p)(o)(n)(m)(l)(k)(j)(i)(h)(g)(f)(e)(d)(c)(b)(a)(z)100130864710090145854310750741612543628951291461249106491691731001Unweighted Total1001304652104*89746853311**74778*15925038*29252*30547522110**6401781731001Weighted Total2802424525251116160519225507387919881137521824150275Strongly agree28%8%38%zu24%28%25%30%48%26%32%31%29%21%27%35%29%24%34%zf21%29%23%29%28%fnu
460110326614062402275345407510317137201392369283028273466Tend to agree46%36%50%zu58%zr45%51%zp43%42%46%52%47%41%45%47%38%45%50%e41%79%47%46%42%47%kpru
14593491213363821114822406478477028-773632145Tend to disagree14%31%zt8%11%15%13%15%10%15%10%14%16%15%16%16%15%15%13%-12%20%zc18%c14%ct
8365144783250-7039276225244514-55141482Strongly disagree8%21%zt2%4%9%7%9%-9%z4%5%11%16%8%9%8%9%6%-9%8%8%8%t
3311173291814-2724717181213-244532Don't know3%4%3%3%3%4%3%-4%2%2%3%2%3%2%3%2%6%zf-4%2%3%3%
740134571856563553861053765124176262163822634916610485123123742Agree74%44%88%zu82%73%76%72%90%72%84%zn78%70%66%74%73%74%74%75%100%76%69%71%74%nu
22815963162119513211831131671269137011442-1315145227Disagree23%52%zt10%15%24%20%25%10%25%zm14%19%27%31%24%25%23%24%19%-20%28%c26%23%ct
512-2550869445260254935454941091414725156235124103547378515Net agree51%-8%78%zu66%zr50%56%zp48%80%47%70%zn59%zn43%35%50%48%51%49%56%100%55%zab41%45%51%bknpr
u
Public Perceptions of the NHS and Social CareFINAL PUBLIC
Table 180Q30. Please tell me whether on the whole you agree or disagree with each of the following statements:
- If I was very ill I would feel safe in an NHS hospital -
Base : All respondents
Respondent type : General public aged 16+ Fieldwork dates : 14th November - 9th December 2011Source : Ipsos MORI (JN10-039262-01)Proportions/Means: Columns Tested (5% risk level) - z/a/b/c/d - z/e/f/g - z/h/i/j/k - z/l/m/n/o - z/p/q - z/r/s - z/t/u - z/vOverlap formulae used. * small base; ** very small base (under 30) ineligible for sig testing

UnwtdtotalFuture of NHSSatisfaction with NHSGOR
DisYorkshire &WestEastWtd.WorseSameBettersatisfiedSatisfiedHumbersideMidlandsSouth-WestSouth-EastNorth-WestNorth-EastLondonEasternMidlandsTotal
(o)(n)(m)(l)(k)(j)(i)(h)(g)(f)(e)(d)(c)(b)(a)(z)1001328298343168703909910715413955143126881001Unweighted Total1001327302340168701100*106*10216213651*14810986*1001Weighted Total28091917716236173128435121223428275Strongly agree28%28%30%l22%9%34%zk17%29%c28%c27%c37%zcfi41%zci15%31%ci32%ci28%cikl
46014613917156348504753765922764637466Tend to agree46%45%46%50%33%50%zk50%44%52%47%43%43%51%43%43%47%k
145434159496923121224115271812145Tend to disagree14%13%14%17%29%zj10%23%zegh11%12%15%8%10%18%e17%e14%14%ej
833620263831813812112147882Strongly disagree8%11%z7%8%23%zj4%8%12%7%7%8%5%10%7%9%8%j
331111791823185194132Don't know3%3%4%2%6%j3%2%3%1%5%3%1%6%g3%1%3%
7402372302487158467788211911043998065742Agree74%72%76%73%42%83%zk67%73%80%c73%81%ci83%ci67%73%75%74%ck
228796185879931252036228412520227Disagree23%24%20%25%52%zj14%31%de23%19%22%16%15%27%e23%24%23%ej
512158169163-16485375362838935585544515Net agree51%48%56%l48%-10%69%zk37%50%61%zci51%ci65%zabcfhi68%zbcfhi39%50%51%51%cik
Public Perceptions of the NHS and Social CareFINAL PUBLIC
Table 181Q30. Please tell me whether on the whole you agree or disagree with each of the following statements:
- If I was very ill I would feel safe in an NHS hospital -
Base : All respondents
Respondent type : General public aged 16+ Fieldwork dates : 14th November - 9th December 2011Source : Ipsos MORI (JN10-039262-01)Proportions/Means: Columns Tested (5% risk level) - z/a/b/c/d/e/f/g/h/i - z/j/k - z/l/m/n - z/oOverlap formulae used. * small base

UnwtdPrivate healthSatisfaction withImpact of NHS reformsGovernment has righttotalinsurancesocial careon patientsNHS policyNHS use in last year
SocialNHSDissatisficareWalk InChoicesPharmacistWtd.
NoYesedSatisfiedWorseBetterDisagreeAgreeservicesClinicwebsite/ChemistNHS DirectA&EOutpatientInpatientGPTotal(r)(q)(p)(o)(n)(m)(l)(k)(j)(i)(h)(g)(f)(e)(d)(c)(b)(a)(z)10018151704424938220040326945182553001772253931967801001Unweighted Total100181117544*24437920139327642*18856*3011832303761927731001Weighted Total280230405799160929512451576485812172217275Strongly agree28%28%23%12%32%o24%30%23%34%zk28%24%27%25%26%25%32%zadfh37%zadefh28%28%ko
46038377171131711061651381691281398010515169351466Tend to agree46%47%44%39%46%45%53%42%50%k38%48%bc49%46%bc44%46%b40%36%45%bc47%bck
1451143012315722692682765329385926116145Tend to disagree14%14%17%28%zn13%15%11%18%zj9%20%15%11%17%16%17%16%13%15%14%j
835921913488578620525232535196882Strongly disagree8%7%12%zq21%zn5%13%zl4%15%zj3%14%11%8%8%13%z11%9%10%9%8%jlq
33256-81261010-43744962032Don't know3%3%4%-3%3%3%3%4%-2%5%2%2%2%2%3%3%3%a
740612117221922621662562322813643216127163272141568742Agree74%76%zp67%51%79%o69%83%zm65%84%zk66%73%76%72%70%71%72%73%74%74%kmop
22817352224510529127341447117852639445185227Disagree23%21%30%zq49%zn18%28%zl15%32%zj12%34%25%19%26%28%27%25%23%24%23%jlq
5124396511471571371291991389321387510017896383515Net agree51%54%zp37%1%60%zo41%68%zm33%72%zk32%47%i57%ei46%41%44%47%i50%ei50%dei51%acdefik
mop
Public Perceptions of the NHS and Social CareFINAL PUBLIC
Table 182Q30. Please tell me whether on the whole you agree or disagree with each of the following statements:
- If I was very ill I would feel safe in an NHS hospital -
Base : All respondents
Respondent type : General public aged 16+ Fieldwork dates : 14th November - 9th December 2011Source : Ipsos MORI (JN10-039262-01)Proportions/Means: Columns Tested (5% risk level) - z/a/b/c/d/e/f/g/h/i - z/j/k - z/l/m - z/n/o - z/p/q - z/rOverlap formulae used. * small base

UnwtdtotalWork StatusSocial GradeAgeGender
Full/part-Wtd.OtherUnemployedRetiredtimeDEC2C1AB65+55-6435-5425-3416-24FemaleMaleTotal
(p)(o)(n)(m)(l)(k)(j)(i)(h)(g)(f)(e)(d)(c)(b)(a)(z)1001162612705082472013062472201693311581235274741001Unweighted Total100115758*2355512392013122491981433501671435154861001Weighted Total147251735676123342635194126245985144Strongly agree15%16%30%zlmo15%12%26%zhij12%11%10%18%13%12%16%17%11%18%zb14%bhil
500802311529010010217213495601729684255253507Tend to agree50%51%39%49%53%42%50%55%k54%k48%42%49%58%f59%f49%52%51%fk
21931105012545456759423990222213086216Tend to disagree22%20%18%21%23%19%22%21%24%21%d27%cd26%zcd13%16%25%za18%22%ad
89105235018193218161931184513788Strongly disagree9%7%8%10%9%8%10%10%7%8%13%zc9%c11%c3%10%8%9%c
46113121915126131071549212546Don't know5%7%5%5%4%6%i6%i2%5%i5%5%4%3%6%4%5%5%i
6471054015035716112520616013078213123108314338652Agree65%67%69%64%65%67%62%66%64%66%f55%61%73%zef75%zef61%70%zb65%bf
3084115731756364997758581214026181123304Disagree31%26%26%31%32%26%32%32%31%29%c40%zcdg35%zcd24%18%35%za25%30%ac
3396425771829861107837221928281133215348Net agree34%41%44%33%33%41%zj30%34%33%36%ef15%26%f49%zefg57%zefg26%44%zb35%bef
Public Perceptions of the NHS and Social CareFINAL PUBLIC
Table 183Q31. Please tell me whether on the whole you agree or disagree with each of the following statements:
- People are treated with dignity and respect when they use NHS services -
Base : All respondents
Respondent type : General public aged 16+ Fieldwork dates : 14th November - 9th December 2011Source : Ipsos MORI (JN10-039262-01)Proportions/Means: Columns Tested (5% risk level) - z/a/b - z/c/d/e/f/g - z/h/i/j/k - z/l/m/n/o - z/pOverlap formulae used. * small base

People aretreated with
Unwtddignity andtotalrespectNHS useHospital useEthnicityNHS/social care staffHousehold TypeHome Ownership
NotAdultshospitalHospitalInformalSocialwith
Non NHS/A&E/A&EsocialcareKnow NHSNHSdependentNon-Owner -PrivateSocialWtd.DisagreeAgreeuserNHS useruseruserMixedWhiteAsianBlackcarerworkerstaffstaffchildrenpensionerPensionerOtheroccupierrenterrenterTotal
(v)(u)(t)(s)(r)(q)(p)(o)(n)(m)(l)(k)(j)(i)(h)(g)(f)(e)(d)(c)(b)(a)(z)100130864710090145854310750741612543628951291461249106491691731001Unweighted Total1001304652104*89746853311**74778*15925038*29252*30547522110**6401781731001Weighted Total147-14411133598519717263274394961351892332144Strongly agree15%-22%zu11%15%13%16%10%13%21%n17%13%18%15%17%16%13%16%10%14%13%19%14%nu
500-5075445424626153654592119161613015724410663239583507Tend to agree50%-78%zu51%51%53%49%49%49%58%58%n48%42%55%k58%51%51%48%61%50%53%48%51%nu
219216-251909811841731225589629691004711384036216Tend to disagree22%71%zt-24%21%21%22%40%23%zl15%16%23%24%21%17%22%21%21%10%22%23%21%22%t
8988-7803454-74211284123204721157171388Strongly disagree9%29%zt-7%9%7%10%-10%zm2%7%11%i11%4%6%6%10%9%10%9%10%7%9%imt
46--7393115-39251221411123121333946Don't know5%--6%4%7%zp3%-5%3%3%5%5%5%2%4%5%5%8%5%2%5%5%bptu
647-6526558630534664616211815223204392063051417411117116652Agree65%-100%zu62%65%65%65%60%62%80%zn74%zn61%60%70%zk75%k67%64%64%72%64%66%67%65%nu
308304-332711321714247133686137412881476821955749304Disagree31%100%zt-31%30%28%32%40%33%zlm17%23%35%i35%25%23%29%31%31%20%31%32%28%30%ilmt
339-30465232316173175221448826510130271171587352166067348Net agree34%-100%100%zu31%35%37%33%20%29%62%zn51%zn26%26%44%zjk52%zjk38%33%33%52%34%34%39%35%knu
Public Perceptions of the NHS and Social CareFINAL PUBLIC
Table 184Q31. Please tell me whether on the whole you agree or disagree with each of the following statements:
- People are treated with dignity and respect when they use NHS services -
Base : All respondents
Respondent type : General public aged 16+ Fieldwork dates : 14th November - 9th December 2011Source : Ipsos MORI (JN10-039262-01)Proportions/Means: Columns Tested (5% risk level) - z/a/b/c/d - z/e/f/g - z/h/i/j/k - z/l/m/n/o - z/p/q - z/r/s - z/t/u - z/vOverlap formulae used. * small base; ** very small base (under 30) ineligible for sig testing

UnwtdtotalFuture of NHSSatisfaction with NHSGOR
DisYorkshire &WestEastWtd.WorseSameBettersatisfiedSatisfiedHumbersideMidlandsSouth-WestSouth-EastNorth-WestNorth-EastLondonEasternMidlandsTotal
(o)(n)(m)(l)(k)(j)(i)(h)(g)(f)(e)(d)(c)(b)(a)(z)1001328298343168703909910715413955143126881001Unweighted Total1001327302340168701100*106*10216213651*14810986*1001Weighted Total14743395411127613151944107209144Strongly agree15%13%13%16%7%18%zk6%12%c15%c12%c32%zabcfghi20%ci5%18%ci11%14%cik
50015317017060391564649746426955642507Tend to agree50%47%56%zn50%36%56%zk56%44%48%46%47%51%64%zabefgh51%49%51%k
21983577155120192927441612312019216Tend to disagree22%25%z19%21%33%zj17%19%27%e26%e27%e12%23%e21%e18%22%e22%ej
893723273534131381693861288Strongly disagree9%11%8%8%21%zj5%13%c12%8%10%6%6%5%5%14%bce9%j
4613121863065394-77446Don't know5%4%4%5%4%4%6%5%3%6%3%-5%7%4%5%
6471952102247151862596493108361027651652Agree65%60%69%n66%42%74%zk62%56%62%57%79%zafghi70%69%fh70%fh59%65%fhkn
308120809891154324135602515392631304Disagree31%37%zlm26%29%54%zj22%32%e39%zbce34%e37%bce18%30%26%24%36%be30%ej
33976130126-20364311829338321645119348Net agree34%23%43%zn37%n-12%52%zk31%h17%28%20%61%zabcdfghi41%afh43%zafgh46%zafghi23%35%afhkn
Public Perceptions of the NHS and Social CareFINAL PUBLIC
Table 185Q31. Please tell me whether on the whole you agree or disagree with each of the following statements:
- People are treated with dignity and respect when they use NHS services -
Base : All respondents
Respondent type : General public aged 16+ Fieldwork dates : 14th November - 9th December 2011Source : Ipsos MORI (JN10-039262-01)Proportions/Means: Columns Tested (5% risk level) - z/a/b/c/d/e/f/g/h/i - z/j/k - z/l/m/n - z/oOverlap formulae used. * small base

UnwtdPrivate healthSatisfaction withImpact of NHS reformsGovernment has righttotalinsurancesocial careon patientsNHS policyNHS use in last year
SocialNHSDissatisficareWalk InChoicesPharmacistWtd.
NoYesedSatisfiedWorseBetterDisagreeAgreeservicesClinicwebsite/ChemistNHS DirectA&EOutpatientInpatientGPTotal(r)(q)(p)(o)(n)(m)(l)(k)(j)(i)(h)(g)(f)(e)(d)(c)(b)(a)(z)10018151704424938220040326945182553001772253931967801001Unweighted Total100181117544*24437920139327642*18856*3011832303761927731001Weighted Total147125161394141435962853925356541113144Strongly agree15%15%p9%2%16%o11%20%zm11%21%zk15%15%8%13%14%15%17%f22%zadefgh15%14%kmop
50041486131301741071681601793311388911117789386507Tend to agree50%51%49%31%53%o46%54%43%58%zk42%50%55%46%48%48%47%47%50%51%fkmo
219167481652942911832938127138548033170216Tend to disagree22%21%27%36%zn21%25%l15%30%zj12%21%20%21%24%b21%23%21%17%22%22%jl
896818131454135311719740242942226988Strongly disagree9%8%10%29%zn6%14%zl6%13%zj4%16%10%13%13%za13%za12%z11%z12%9%9%jn
463771917101114310213721263446Don't know5%5%4%2%4%4%5%3%5%6%d5%d3%4%d4%d1%3%3%4%d5%dk
647539102151692151482112192412136176114146241131500652Agree65%67%p58%33%69%o57%74%zm54%79%zk56%64%64%59%62%63%64%f68%f65%f65%fkmop
3082356629661474217143165719111628212256239304Disagree31%29%38%zq65%zn27%39%zl21%43%zj16%37%30%33%37%zab34%36%33%29%31%30%jl
33930436-1410368106411768641765526411975261348Net agree34%38%zp21%-32%42%zo18%53%zm10%64%zk19%34%fi30%22%28%f28%f32%f39%cdefi34%dfi35%defikmo
p
Public Perceptions of the NHS and Social CareFINAL PUBLIC
Table 186Q31. Please tell me whether on the whole you agree or disagree with each of the following statements:
- People are treated with dignity and respect when they use NHS services -
Base : All respondents
Respondent type : General public aged 16+ Fieldwork dates : 14th November - 9th December 2011Source : Ipsos MORI (JN10-039262-01)Proportions/Means: Columns Tested (5% risk level) - z/a/b/c/d/e/f/g/h/i - z/j/k - z/l/m - z/n/o - z/p/q - z/rOverlap formulae used. * small base

UnwtdtotalWork StatusSocial GradeAgeGender
Full/part-Wtd.OtherUnemployedRetiredtimeDEC2C1AB65+55-6435-5425-3416-24FemaleMaleTotal
(p)(o)(n)(m)(l)(k)(j)(i)(h)(g)(f)(e)(d)(c)(b)(a)(z)1001162612705082472013062472201693311581235274741001Unweighted Total100115758*2355512392013122491981433501671435154861001Weighted Total
767102038291317141912191412314474Strongly agree8%5%16%zlo8%7%12%zhij6%6%6%9%8%5%8%8%6%9%7%
36559208520797761287173471246067184187371Tend to agree36%38%34%36%38%40%h38%41%h29%37%33%35%36%47%zef36%39%37%h
19527134211442466246293289192610689196Tend to disagree19%17%22%18%21%18%23%20%18%15%22%d25%zdg12%18%21%18%20%dg
7713414441817192191929163453075Strongly disagree8%8%6%6%8%8%8%6%9%5%13%zcg8%c9%c2%9%6%8%cg
288511274147525086966833905835149135285Don't know29%32%21%32%27%22%25%28%39%zijk34%zef23%26%35%ef24%29%28%28%k
4416729105245126891458691591427479215231445Agree44%43%50%45%44%53%zh44%h46%h34%46%41%41%44%55%zef42%47%45%h
2724017561596162816738511173529151120271Disagree27%25%28%24%29%25%31%26%27%19%36%zcdg34%zcdg21%20%29%25%27%g
169271349866526641953825395064111175Net agree17%17%22%21%16%27%zhj13%21%hj8%27%zef6%7%23%zef35%zdef12%23%zb17%befh
Public Perceptions of the NHS and Social CareFINAL PUBLIC
Table 187Q32. Please tell me whether on the whole you agree or disagree with each of the following statements:
- People are treated with dignity and respect when they use social care services -
Base : All respondents
Respondent type : General public aged 16+ Fieldwork dates : 14th November - 9th December 2011Source : Ipsos MORI (JN10-039262-01)Proportions/Means: Columns Tested (5% risk level) - z/a/b - z/c/d/e/f/g - z/h/i/j/k - z/l/m/n/o - z/pOverlap formulae used. * small base

People aretreated with
Unwtddignity andtotalrespectNHS useHospital useEthnicityNHS/social care staffHousehold TypeHome Ownership
NotAdultshospitalHospitalInformalSocialwith
Non NHS/A&E/A&EsocialcareKnow NHSNHSdependentNon-Owner -PrivateSocialWtd.DisagreeAgreeuserNHS useruseruserMixedWhiteAsianBlackcarerworkerstaffstaffchildrenpensionerPensionerOtheroccupierrenterrenterTotal
(v)(u)(t)(s)(r)(q)(p)(o)(n)(m)(l)(k)(j)(i)(h)(g)(f)(e)(d)(c)(b)(a)(z)100130864710090145854310750741612543628951291461249106491691731001Unweighted Total1001304652104*89746853311**74778*15925038*29252*30547522110**6401781731001Weighted Total
761737683639146918227235193521139161974Strongly agree8%*11%zu6%8%8%7%11%6%12%11%n9%18%zi8%9%6%7%9%10%6%9%11%c7%cnu
365493125132019417722613869911498251121807912277074371Tend to agree36%16%48%zu49%zr36%42%zp33%21%35%49%zn43%n37%36%33%48%i37%38%36%10%35%39%43%37%npru
19512070191778910641606235986810621013321252642196Tend to disagree19%39%zt11%18%20%19%20%39%21%zlm8%14%24%20%23%18%20%21%e15%20%20%15%24%b20%emt
776011669304516339288145174612-4819975Strongly disagree8%20%zt2%6%8%6%8%9%8%4%5%11%zi21%zi5%9%6%10%ze5%-7%11%5%8%it
288731852126311916622172141492908951127762014730285Don't know29%24%28%20%29%z25%31%z21%29%28%26%20%j5%31%hjk15%31%f24%35%zf60%31%za27%a17%28%afhjk
u
441503865838823021533074787113211213013121510022668592445Agree44%17%59%zu56%zr43%49%zp40%32%41%61%zn55%zn45%54%41%57%i43%45%45%20%42%48%53%zc45%cnpru
2721808125246119152522393287168214791474421734551271Disagree27%59%zt12%24%27%25%28%47%30%zlm12%20%35%zi41%28%28%26%31%ze20%20%27%26%29%27%elmt
169-1303053314211164-28438562654015516855*934042175Net agree17%-43%47%zu31%zr16%24%zp12%-15%11%49%zln35%zn10%13%14%30%zik17%14%25%zfg-1%15%22%c24%zc17%cfikn
pru
Public Perceptions of the NHS and Social CareFINAL PUBLIC
Table 188Q32. Please tell me whether on the whole you agree or disagree with each of the following statements:
- People are treated with dignity and respect when they use social care services -
Base : All respondents
Respondent type : General public aged 16+ Fieldwork dates : 14th November - 9th December 2011Source : Ipsos MORI (JN10-039262-01)Proportions/Means: Columns Tested (5% risk level) - z/a/b/c/d - z/e/f/g - z/h/i/j/k - z/l/m/n/o - z/p/q - z/r/s - z/t/u - z/vOverlap formulae used. * small base; ** very small base (under 30) ineligible for sig testing

UnwtdtotalFuture of NHSSatisfaction with NHSGOR
DisYorkshire &WestEastWtd.WorseSameBettersatisfiedSatisfiedHumbersideMidlandsSouth-WestSouth-EastNorth-WestNorth-EastLondonEasternMidlandsTotal
(o)(n)(m)(l)(k)(j)(i)(h)(g)(f)(e)(d)(c)(b)(a)(z)1001328298343168703909910715413955143126881001Unweighted Total1001327302340168701100*106*10216213651*14810986*1001Weighted Total
76241727565295428759574Strongly agree8%7%6%8%3%9%zk2%9%f5%3%20%zabcfghi14%zcfgi4%8%f5%7%fik
36510212113850291424432396517593636371Tend to agree36%31%40%n41%n30%42%zk42%f42%f32%24%48%zbfg34%40%f33%42%f37%fkn
1957454654410825241632199352016196Tend to disagree19%22%18%19%26%zj15%25%e23%15%20%14%17%24%e18%18%20%j
77331627253641091574881175Strongly disagree8%10%zm5%8%15%zj5%4%9%9%10%5%7%5%7%12%e8%j
28895958444201261940711814413719285Don't know29%29%31%25%26%29%26%e18%39%zaeh44%zacdehi13%27%e28%e34%eh22%28%eh
44112613816555356445337449325644541445Agree44%39%46%48%n33%51%zk44%f50%f37%27%68%zabcdfghi48%f43%f41%f47%f45%fkn
272107709269144303325482612432726271Disagree27%33%zm23%27%41%zj21%30%32%e25%30%e19%24%29%25%31%e27%ej
169196873-14212142012-46712211714175Net agree17%6%23%zn22%zn-8%30%zk14%f19%f12%f-3%49%zabcdfghi24%fg14%f16%f16%f17%fkn
Public Perceptions of the NHS and Social CareFINAL PUBLIC
Table 189Q32. Please tell me whether on the whole you agree or disagree with each of the following statements:
- People are treated with dignity and respect when they use social care services -
Base : All respondents
Respondent type : General public aged 16+ Fieldwork dates : 14th November - 9th December 2011Source : Ipsos MORI (JN10-039262-01)Proportions/Means: Columns Tested (5% risk level) - z/a/b/c/d/e/f/g/h/i - z/j/k - z/l/m/n - z/oOverlap formulae used. * small base

UnwtdPrivate healthSatisfaction withImpact of NHS reformsGovernment has righttotalinsurancesocial careon patientsNHS policyNHS use in last year
SocialNHSDissatisficareWalk InChoicesPharmacistWtd.
NoYesedSatisfiedWorseBetterDisagreeAgreeservicesClinicwebsite/ChemistNHS DirectA&EOutpatientInpatientGPTotal(r)(q)(p)(o)(n)(m)(l)(k)(j)(i)(h)(g)(f)(e)(d)(c)(b)(a)(z)10018151704424938220040326945182553001772253931967801001Unweighted Total100181117544*24437920139327642*18856*3011832303761927731001Weighted Total
76656-332221203251241791922235874Strongly agree8%8%p3%-14%zo6%11%m5%12%zk11%6%7%6%5%8%6%12%zacefh7%7%kp
36531451910613081116138197213101548111954271371Tend to agree36%39%zp29%21%44%zo34%40%30%50%zk46%bceg38%beg22%33%30%35%32%28%35%bg37%abcegko
p
1951583715499033104291041136335447336153196Tend to disagree19%20%21%33%z20%24%z17%27%zj11%24%22%23%21%19%19%19%19%20%20%j
775617141543134711315629171641186175Strongly disagree8%7%10%32%zn6%11%z7%12%zj4%8%8%10%10%9%7%11%zad9%8%8%j
288217646409552104665482192697012161231285Don't know29%27%36%zq14%17%25%26%27%24%11%26%i38%i30%i38%zafhi30%i32%zi32%i30%i28%ijnoq
4413795791401521021371702483171176310014178328445Agree44%47%zp33%21%57%zo40%51%zm35%62%zk57%bcefg44%eg30%39%34%44%e38%40%43%ce45%acefgkm
op
272215542964133461524013561892516011453213271Disagree27%27%31%65%zn26%35%zl23%39%zj15%32%30%32%31%28%26%30%28%28%27%j
1691643-19761956-151301127-12511402724115175Net agree17%20%zp2%-44%31%zo5%28%zm-4%47%zk25%bcefg15%cefg-3%8%g6%g17%cefg7%g13%ceg15%cefg17%acefgkm
op
Public Perceptions of the NHS and Social CareFINAL PUBLIC
Table 190Q32. Please tell me whether on the whole you agree or disagree with each of the following statements:
- People are treated with dignity and respect when they use social care services -
Base : All respondents
Respondent type : General public aged 16+ Fieldwork dates : 14th November - 9th December 2011Source : Ipsos MORI (JN10-039262-01)Proportions/Means: Columns Tested (5% risk level) - z/a/b/c/d/e/f/g/h/i - z/j/k - z/l/m - z/n/o - z/p/q - z/rOverlap formulae used. * small base

UnwtdtotalWork StatusSocial GradeAgeGender
Full/part-Wtd.OtherUnemployedRetiredtimeDEC2C1AB65+55-6435-5425-3416-24FemaleMaleTotal
(p)(o)(n)(m)(l)(k)(j)(i)(h)(g)(f)(e)(d)(c)(b)(a)(z)1001162612705082472013062472201693311581235274741001Unweighted Total100115758*2355512392013122491981433501671435154861001Weighted Total
901892240331425162210221717404888Strongly agree9%12%15%l9%7%14%zhij7%8%6%11%e7%6%10%12%8%10%9%e
46567271182521099613512398681606771219244463Tend to agree46%42%46%50%46%46%48%43%49%50%47%46%40%49%43%50%zb46%b
2834416591665956927847431184235162123285Tend to disagree28%28%27%25%30%25%28%29%31%24%30%34%zg25%24%31%za25%28%a
99164205924213520181734246574299Strongly disagree10%10%7%9%11%10%10%11%8%9%12%c10%14%zc4%11%9%10%c
64123163513142513135161715372966Don't know6%8%5%7%6%6%7%8%5%6%3%5%10%zef10%ef7%6%7%
5558535140291143110160139121781828488259292552Agree55%54%61%60%53%60%55%51%56%61%zde55%52%50%61%50%60%zb55%b
38260207922583771269765601526641219165384Disagree38%38%34%34%41%35%38%41%39%33%42%c43%zcg40%28%43%za34%38%acg
1732416616760333441561830174740128168Net agree17%16%27%zl26%zlo12%25%zhij16%11%17%28%zdef13%8%10%33%zdef8%26%zb17%bdeil
Public Perceptions of the NHS and Social CareFINAL PUBLIC
Table 191Q33. Please tell me whether on the whole you agree or disagree with each of the following statements:
- The NHS puts quality at the heart of all it does -
Base : All respondents
Respondent type : General public aged 16+ Fieldwork dates : 14th November - 9th December 2011Source : Ipsos MORI (JN10-039262-01)Proportions/Means: Columns Tested (5% risk level) - z/a/b - z/c/d/e/f/g - z/h/i/j/k - z/l/m/n/o - z/pOverlap formulae used. * small base

People aretreated with
Unwtddignity andtotalrespectNHS useHospital useEthnicityNHS/social care staffHousehold TypeHome Ownership
NotAdultshospitalHospitalInformalSocialwith
Non NHS/A&E/A&EsocialcareKnow NHSNHSdependentNon-Owner -PrivateSocialWtd.DisagreeAgreeuserNHS useruseruserMixedWhiteAsianBlackcarerworkerstaffstaffchildrenpensionerPensionerOtheroccupierrenterrenterTotal
(v)(u)(t)(s)(r)(q)(p)(o)(n)(m)(l)(k)(j)(i)(h)(g)(f)(e)(d)(c)(b)(a)(z)100130864710090145854310750741612543628951291461249106491691731001Unweighted Total1001304652104*89746853311**74778*15925038*29252*30547522110**6401781731001Weighted Total
90485682355315714152343011323522255112088Strongly agree9%1%13%zu6%9%8%10%11%8%18%zn10%9%10%10%21%zik10%7%10%18%9%6%12%9%nu
465643824841622923513354182108181292513821411162958478463Tend to agree46%21%59%zu46%46%49%44%10%45%53%51%43%47%44%47%45%45%50%60%46%47%45%46%u
2831461263125413015532261244771287119013955-1874850285Tend to disagree28%48%zt19%29%28%28%29%29%30%zm15%28%m31%30%30%20%30%29%25%-29%27%29%28%mt
998016990376238149263266245519159221799Strongly disagree10%26%zt2%9%10%8%12%zq30%11%5%6%11%8%9%12%8%12%9%10%9%12%10%10%qt
641043105538282487915220-20311414413866Don't know6%3%7%u10%6%8%5%19%6%8%6%6%5%7%-7%7%6%12%7%7%4%7%u
555674675449726428823925597131221593617024913383509698552Agree55%22%72%zu52%55%56%54%21%52%71%zn61%52%57%54%68%k56%52%60%78%55%54%57%55%nu
382226142403441662176307165310415113171151957412466967384Disagree38%74%zt22%38%38%36%41%60%41%zm20%34%m42%38%39%32%38%41%34%10%38%39%39%38%mt
173-159325141549770-4853944277461955545871042631168Net agree17%-52%50%zu14%17%21%zp13%-39%11%51%zln27%zn11%19%16%k36%zik18%f11%26%zfg69%16%15%18%17%fknpu
Public Perceptions of the NHS and Social CareFINAL PUBLIC
Table 192Q33. Please tell me whether on the whole you agree or disagree with each of the following statements:
- The NHS puts quality at the heart of all it does -
Base : All respondents
Respondent type : General public aged 16+ Fieldwork dates : 14th November - 9th December 2011Source : Ipsos MORI (JN10-039262-01)Proportions/Means: Columns Tested (5% risk level) - z/a/b/c/d - z/e/f/g - z/h/i/j/k - z/l/m/n/o - z/p/q - z/r/s - z/t/u - z/vOverlap formulae used. * small base; ** very small base (under 30) ineligible for sig testing

UnwtdtotalFuture of NHSSatisfaction with NHSGOR
DisYorkshire &WestEastWtd.WorseSameBettersatisfiedSatisfiedHumbersideMidlandsSouth-WestSouth-EastNorth-WestNorth-EastLondonEasternMidlandsTotal
(o)(n)(m)(l)(k)(j)(i)(h)(g)(f)(e)(d)(c)(b)(a)(z)1001328298343168703909910715413955143126881001Unweighted Total1001327302340168701100*106*10216213651*14810986*1001Weighted Total
90232434679465122766111088Strongly agree9%7%8%10%4%11%zk4%6%5%7%20%zbcfghi11%4%10%11%c9%ck
46515015614647372393550797122745438463Tend to agree46%46%52%zl43%28%53%zk39%33%49%h49%h52%h43%50%h50%h44%46%hk
283917711368166364029462617433216285Tend to disagree28%28%25%33%zm40%zj24%36%ae38%zae29%28%19%32%e29%30%e19%28%aej
99422531453612181213641351699Strongly disagree10%13%z8%9%27%zj5%12%e17%zbef12%be8%4%9%9%5%18%zbcef10%bej
642221162489651272126666Don't know6%7%7%5%1%7%k9%6%5%8%5%4%8%6%7%7%k
55517218018053451434256919828806648552Agree55%53%60%53%32%64%zk43%39%55%h56%h72%zabcdfghi55%54%h60%hi56%h55%hik
382133102144112202485842593221553732384Disagree38%41%34%42%m67%zj29%48%be55%zabcefg41%e36%e23%41%e37%e34%37%e38%ejm
173397836-59249-5-161433667252816168Net agree17%12%26%zln11%-35%35%zk-5%-15%14%i20%hi49%zabcdfghi13%i17%hi26%zghi19%i17%hikln
Public Perceptions of the NHS and Social CareFINAL PUBLIC
Table 193Q33. Please tell me whether on the whole you agree or disagree with each of the following statements:
- The NHS puts quality at the heart of all it does -
Base : All respondents
Respondent type : General public aged 16+ Fieldwork dates : 14th November - 9th December 2011Source : Ipsos MORI (JN10-039262-01)Proportions/Means: Columns Tested (5% risk level) - z/a/b/c/d/e/f/g/h/i - z/j/k - z/l/m/n - z/oOverlap formulae used. * small base

UnwtdPrivate healthSatisfaction withImpact of NHS reformsGovernment has righttotalinsurancesocial careon patientsNHS policyNHS use in last year
SocialNHSDissatisficareWalk InChoicesPharmacistWtd.
NoYesedSatisfiedWorseBetterDisagreeAgreeservicesClinicwebsite/ChemistNHS DirectA&EOutpatientInpatientGPTotal(r)(q)(p)(o)(n)(m)(l)(k)(j)(i)(h)(g)(f)(e)(d)(c)(b)(a)(z)10018151704424938220040326945182553001772253931967801001Unweighted Total100181117544*24437920139327642*18856*3011832303761927731001Weighted Total
9077622627212635822527162335277088Strongly agree9%10%p3%4%11%7%10%7%13%zk20%zacdef12%9%9%9%10%9%14%zacf9%9%kp
4653886991231541151531631686231258210615994357463Tend to agree46%48%zp39%20%50%o41%57%zm39%59%zk38%46%40%42%45%46%42%49%cf46%46%ckmo
283214692366125421385610521997506011647220285Tend to disagree28%26%39%zq53%zn27%33%zl21%35%zj20%24%28%33%32%b27%26%31%b24%28%28%jlq
9973249205412629721935273146207699Strongly disagree10%9%14%21%zn8%14%zl6%16%zj3%16%11%16%12%15%za14%z12%10%10%10%jl
645871820111414161178112044966Don't know6%7%4%2%3%5%6%4%5%2%3%2%6%b4%5%5%b2%6%b7%bkn
5554657511149181136179198241082715298128194121427552Agree55%57%zp43%24%61%zo48%68%zm46%72%zk58%58%49%51%54%56%52%63%zacefg55%55%kmop
3822879332861795320065177328131769116267296384Disagree38%35%53%zq73%zn35%47%zl27%51%zj23%40%39%49%b44%zab42%40%43%zab35%38%38%jlq
173178-17-2263283-21133736*2122373255131168Net agree17%22%zp-10%-49%26%zo1%41%zm-5%48%zk17%cfg19%cefg-1%7%g12%fg16%cfg9%g28%zacdefgh17%cfg17%cfgkmop
Public Perceptions of the NHS and Social CareFINAL PUBLIC
Table 194Q33. Please tell me whether on the whole you agree or disagree with each of the following statements:
- The NHS puts quality at the heart of all it does -
Base : All respondents
Respondent type : General public aged 16+ Fieldwork dates : 14th November - 9th December 2011Source : Ipsos MORI (JN10-039262-01)Proportions/Means: Columns Tested (5% risk level) - z/a/b/c/d/e/f/g/h/i - z/j/k - z/l/m - z/n/o - z/p/q - z/rOverlap formulae used. * small base

UnwtdtotalWork StatusSocial GradeAgeGender
Full/part-Wtd.OtherUnemployedRetiredtimeDEC2C1AB65+55-6435-5425-3416-24FemaleMaleTotal
(p)(o)(n)(m)(l)(k)(j)(i)(h)(g)(f)(e)(d)(c)(b)(a)(z)1001162612705082472013062472201693311581235274741001Unweighted Total100115758*2355512392013122491981433501671435154861001Weighted Total
8610111848221424261613241221493787Strongly agree9%6%19%zlmo8%9%9%7%8%11%8%9%7%7%15%zde10%8%9%
541893412229912310917313899771909185282261543Tend to agree54%56%58%52%54%52%54%56%55%50%54%54%54%60%55%54%54%
20934948117523966503733863218102106207Tend to disagree21%22%16%20%21%22%19%21%20%19%23%c25%zc19%13%20%22%21%c
4881112811111981062094291948Strongly disagree5%5%2%5%5%4%6%6%3%5%4%6%6%2%6%4%5%
11717436593128302735142922155362115Don't know12%11%6%15%z11%13%14%10%11%18%zef10%8%13%10%10%13%12%e
627984514034714512319716411590215103106331298630Agree63%62%76%zlm60%63%61%61%63%66%58%63%61%62%74%zdefg64%61%63%
2574210591456350845847391064222131125256Disagree26%27%17%25%26%26%25%27%23%24%27%c30%zc25%c15%25%26%26%c
370563481202827311210668501096285201173374Net agree37%36%59%zlmo35%37%35%36%36%43%35%35%31%37%59%zdefg39%36%37%e
Public Perceptions of the NHS and Social CareFINAL PUBLIC
Table 195Q34. Please tell me whether on the whole you agree or disagree with each of the following statements:
- People have increasing choice about their treatment and care -
Base : All respondents
Respondent type : General public aged 16+ Fieldwork dates : 14th November - 9th December 2011Source : Ipsos MORI (JN10-039262-01)Proportions/Means: Columns Tested (5% risk level) - z/a/b - z/c/d/e/f/g - z/h/i/j/k - z/l/m/n/o - z/pOverlap formulae used. * small base

People aretreated with
Unwtddignity andtotalrespectNHS useHospital useEthnicityNHS/social care staffHousehold TypeHome Ownership
NotAdultshospitalHospitalInformalSocialwith
Non NHS/A&E/A&EsocialcareKnow NHSNHSdependentNon-Owner -PrivateSocialWtd.DisagreeAgreeuserNHS useruseruserMixedWhiteAsianBlackcarerworkerstaffstaffchildrenpensionerPensionerOtheroccupierrenterrenterTotal
(v)(u)(t)(s)(r)(q)(p)(o)(n)(m)(l)(k)(j)(i)(h)(g)(f)(e)(d)(c)(b)(a)(z)100130864710090145854310750741612543628951291461249106491691731001Unweighted Total1001304652104*89746853311**74778*15925038*29252*30547522110**6401781731001Weighted Total
86137377933541601015204289343419-54131987Strongly agree9%4%11%zu7%9%7%10%11%8%13%10%8%11%10%18%zk11%7%9%-8%7%11%9%u
5411443696148227327054024983144201653115627111663479793543Tend to agree54%47%57%zu58%54%58%zp51%50%54%63%52%57%52%56%58%51%57%52%55%54%55%54%54%pu
2099111120187861213160113358861769974111363634207Tend to disagree21%30%zt17%20%21%18%23%29%21%14%20%23%21%21%14%23%20%19%11%21%20%20%21%t
483313742183114024123121142411-3014448Strongly disagree5%11%zt2%7%5%4%6%10%5%3%3%5%8%4%2%5%5%5%-5%8%a2%5%t
117238591065858-856241632643349343721823115Don't know12%7%13%zu9%12%12%11%-11%8%15%6%8%9%8%11%10%15%zf34%11%10%13%12%ku
627157443685623063237462599816424193401903051356402111112630Agree63%52%68%zu65%63%65%61%61%62%76%zln62%66%63%66%76%62%64%61%55%63%62%65%63%u
25712412327229104152420013377011739831215211675039256Disagree26%41%zt19%26%25%22%29%zq39%27%17%23%28%29%25%16%27%26%23%11%26%28%22%26%qt
3703331941333202171226246619413119311071848352356173374Net agree37%11%49%zu39%37%43%zp32%22%35%59%zln38%38%34%41%60%zijk35%39%38%44%37%34%42%37%npu
Public Perceptions of the NHS and Social CareFINAL PUBLIC
Table 196Q34. Please tell me whether on the whole you agree or disagree with each of the following statements:
- People have increasing choice about their treatment and care -
Base : All respondents
Respondent type : General public aged 16+ Fieldwork dates : 14th November - 9th December 2011Source : Ipsos MORI (JN10-039262-01)Proportions/Means: Columns Tested (5% risk level) - z/a/b/c/d - z/e/f/g - z/h/i/j/k - z/l/m/n/o - z/p/q - z/r/s - z/t/u - z/vOverlap formulae used. * small base; ** very small base (under 30) ineligible for sig testing

UnwtdtotalFuture of NHSSatisfaction with NHSGOR
DisYorkshire &WestEastWtd.WorseSameBettersatisfiedSatisfiedHumbersideMidlandsSouth-WestSouth-EastNorth-WestNorth-EastLondonEasternMidlandsTotal
(o)(n)(m)(l)(k)(j)(i)(h)(g)(f)(e)(d)(c)(b)(a)(z)1001328298343168703909910715413955143126881001Unweighted Total1001327302340168701100*106*10216213651*14810986*1001Weighted Total
862725288744751823938987Strongly agree9%8%8%8%5%11%zk4%7%5%11%c17%zbcghi18%zbcghi2%8%c10%c9%ck
54117517318265419534254888326885951543Tend to agree54%53%57%54%39%60%zk53%39%53%h54%h61%h50%59%h54%h59%h54%hk
2096851835311629302128191037249207Tend to disagree21%21%17%24%zm32%zj16%29%zaef28%aef21%a17%14%20%25%ae22%a10%21%aej
482471826145114912521048Strongly disagree5%7%zm2%5%16%zj2%5%10%zbce4%6%e1%3%4%2%11%zbceg5%ejm
1173446301578916182011515158115Don't know12%10%15%zl9%9%11%9%15%18%ze12%8%9%10%14%9%12%l
6272021982107349357495910510635916760630Agree63%62%66%62%44%70%zk57%46%58%65%h78%zbcfghi68%h61%h62%h70%h63%hk
257925810180130344125372012422718256Disagree26%28%m19%30%zm48%zj19%34%e39%zabdefg25%e23%14%23%29%e24%e21%26%ejm
370110139109-736323834688623494042374Net agree37%34%46%zln32%-4%52%zk23%h7%33%h42%hi63%zabcdfghi46%hi33%h37%hi48%zcghi37%hikl
Public Perceptions of the NHS and Social CareFINAL PUBLIC
Table 197Q34. Please tell me whether on the whole you agree or disagree with each of the following statements:
- People have increasing choice about their treatment and care -
Base : All respondents
Respondent type : General public aged 16+ Fieldwork dates : 14th November - 9th December 2011Source : Ipsos MORI (JN10-039262-01)Proportions/Means: Columns Tested (5% risk level) - z/a/b/c/d/e/f/g/h/i - z/j/k - z/l/m/n - z/oOverlap formulae used. * small base

UnwtdPrivate healthSatisfaction withImpact of NHS reformsGovernment has righttotalinsurancesocial careon patientsNHS policyNHS use in last year
SocialNHSDissatisficareWalk InChoicesPharmacistWtd.
NoYesedSatisfiedWorseBetterDisagreeAgreeservicesClinicwebsite/ChemistNHS DirectA&EOutpatientInpatientGPTotal(r)(q)(p)(o)(n)(m)(l)(k)(j)(i)(h)(g)(f)(e)(d)(c)(b)(a)(z)10018151704424938220040326945182553001772253931967801001Unweighted Total100181117544*24437920139327642*18856*3011832303761927731001Weighted Total
86731242726212930519930282434187087Strongly agree9%9%7%9%11%7%11%7%11%13%10%15%10%15%zabcf11%9%9%9%9%
5414359724139188131185181241123416798118194106417543Tend to agree54%54%55%55%57%50%65%zm47%66%zk57%60%cd60%55%54%51%52%55%54%54%km
209168371248105301063473586130508339160207Tend to disagree21%21%21%26%20%28%zl15%27%zj12%17%18%13%20%16%22%22%20%21%21%jl
48409310264315310320101524173548Strongly disagree5%5%5%7%4%7%zl2%8%zj2%7%6%5%7%5%6%6%a9%za5%5%jl
1179420120351442253123231723401291115Don't know12%12%12%2%8%9%7%11%9%6%6%6%8%9%10%11%bh6%12%bfh12%bfhlo
627508109291662141522142112913143197126142228124487630Agree63%63%62%65%68%z56%76%zm55%77%zk70%70%zac76%zacd65%69%c62%61%65%63%63%km
257208461557131341374010451181406510755195256Disagree26%26%26%33%24%34%zl17%35%zj14%24%24%19%27%22%28%29%e29%25%26%jl
37030063141098311877172198632115867812069292374Net agree37%37%36%31%45%z22%59%zm20%62%zk46%c46%zabcd57%zabcdf38%c47%zabcdf34%32%36%38%c37%ckm
Public Perceptions of the NHS and Social CareFINAL PUBLIC
Table 198Q34. Please tell me whether on the whole you agree or disagree with each of the following statements:
- People have increasing choice about their treatment and care -
Base : All respondents
Respondent type : General public aged 16+ Fieldwork dates : 14th November - 9th December 2011Source : Ipsos MORI (JN10-039262-01)Proportions/Means: Columns Tested (5% risk level) - z/a/b/c/d/e/f/g/h/i - z/j/k - z/l/m - z/n/o - z/p/q - z/rOverlap formulae used. * small base

UnwtdtotalWork StatusSocial GradeAgeGender
Full/part-Wtd.OtherUnemployedRetiredtimeDEC2C1AB65+55-6435-5425-3416-24FemaleMaleTotal
(p)(o)(n)(m)(l)(k)(j)(i)(h)(g)(f)(e)(d)(c)(b)(a)(z)1001162612705082472013062472201693311581235274741001Unweighted Total100115758*2355512392013122491981433501671435154861001Weighted Total
741091738181723171410211415324274Strongly agree7%7%16%zlmo7%7%8%8%7%7%7%7%6%8%11%6%9%7%
4996525125283116107155120110681768164260239498Tend to agree50%41%43%53%o51%o49%53%50%48%56%47%50%48%45%50%49%50%o
1793083710443286046273467292110771178Tend to disagree18%19%13%16%19%18%14%19%19%14%24%zg19%17%15%21%za15%18%a
7811624362418221223926127443276Strongly disagree8%7%10%10%7%10%h9%7%5%11%zc6%7%7%5%9%7%8%h
1714010339137325153242259333673101174Don't know17%26%zlm17%14%16%16%16%16%21%12%15%17%19%25%zfg14%21%zb17%bg
5737535142321134123178137124781979479292281573Agree57%48%60%60%o58%o56%61%57%55%63%54%56%56%55%57%58%57%o
257421360139674683584943934028151104255Disagree26%27%23%26%25%28%23%27%23%25%30%c27%24%20%29%za21%25%a
3163421821816777957975351035451141178318Net agree32%21%37%o35%o33%o28%38%zk31%32%38%zef24%30%32%36%f27%37%zb32%bfo
Public Perceptions of the NHS and Social CareFINAL PUBLIC
Table 199Q35. Please tell me whether on the whole you agree or disagree with each of the following statements:
- NHS hospitals are getting infections like MRSA under control -
Base : All respondents
Respondent type : General public aged 16+ Fieldwork dates : 14th November - 9th December 2011Source : Ipsos MORI (JN10-039262-01)Proportions/Means: Columns Tested (5% risk level) - z/a/b - z/c/d/e/f/g - z/h/i/j/k - z/l/m/n/o - z/pOverlap formulae used. * small base

People aretreated with
Unwtddignity andtotalrespectNHS useHospital useEthnicityNHS/social care staffHousehold TypeHome Ownership
NotAdultshospitalHospitalInformalSocialwith
Non NHS/A&E/A&EsocialcareKnow NHSNHSdependentNon-Owner -PrivateSocialWtd.DisagreeAgreeuserNHS useruseruserMixedWhiteAsianBlackcarerworkerstaffstaffchildrenpensionerPensionerOtheroccupierrenterrenterTotal
(v)(u)(t)(s)(r)(q)(p)(o)(n)(m)(l)(k)(j)(i)(h)(g)(f)(e)(d)(c)(b)(a)(z)100130864710090145854310750741612543628951291461249106491691731001Unweighted Total1001304652104*89746853311**74778*15925038*29252*30547522110**6401781731001Weighted Total
7411636692747158114192249253713145111874Strongly agree7%4%10%zu6%8%6%9%9%8%m1%9%m8%5%8%18%zik8%8%6%8%7%6%10%7%mu
4991223604445523326573763280122221473014923211743377482498Tend to agree50%40%55%zu42%51%50%50%60%50%41%50%49%56%50%57%49%49%53%43%53%zb42%48%50%bu
1798287221578494113715255510601051923511113234178Tend to disagree18%27%zt13%21%17%18%18%10%18%19%16%22%z25%21%19%17%19%16%10%17%18%20%18%t
7852223732849164110193162193325-5216876Strongly disagree8%17%zt3%3%8%6%9%11%9%m1%6%8%7%5%4%6%7%11%zfg-8%9%5%8%mt
17137120301449677111229313524616181324944531174Don't know17%12%18%u29%zr16%21%zp14%10%15%38%zln19%14%h6%16%h2%20%17%14%40%15%25%zc18%17%chnpr
u
57313342449523260312743433941412417139174269130538285100573Agree57%44%65%zu47%58%zs56%59%69%58%m42%59%m56%62%58%75%zik57%57%59%50%60%zb48%58%57%bmsu
257134108252291111432201163574127612701256011634842255Disagree26%44%zt17%24%26%24%27%21%27%20%22%30%32%26%23%23%26%27%10%26%27%25%25%t
316-13152429414916952341759671195271041447042193858318Net agree32%*48%zu23%33%z32%32%48%31%22%37%m27%29%32%52%zijk34%30%32%41%34%zb21%33%b32%bku
Public Perceptions of the NHS and Social CareFINAL PUBLIC
Table 200Q35. Please tell me whether on the whole you agree or disagree with each of the following statements:
- NHS hospitals are getting infections like MRSA under control -
Base : All respondents
Respondent type : General public aged 16+ Fieldwork dates : 14th November - 9th December 2011Source : Ipsos MORI (JN10-039262-01)Proportions/Means: Columns Tested (5% risk level) - z/a/b/c/d - z/e/f/g - z/h/i/j/k - z/l/m/n/o - z/p/q - z/r/s - z/t/u - z/vOverlap formulae used. * small base; ** very small base (under 30) ineligible for sig testing

UnwtdtotalFuture of NHSSatisfaction with NHSGOR
DisYorkshire &WestEastWtd.WorseSameBettersatisfiedSatisfiedHumbersideMidlandsSouth-WestSouth-EastNorth-WestNorth-EastLondonEasternMidlandsTotal
(o)(n)(m)(l)(k)(j)(i)(h)(g)(f)(e)(d)(c)(b)(a)(z)1001328298343168703909910715413955143126881001Unweighted Total1001327302340168701100*106*10216213651*14810986*1001Weighted Total
74341223658611610145710574Strongly agree7%10%zm4%7%4%8%k6%11%6%6%11%9%4%9%6%7%km
49915915817173367475044906725666149498Tend to agree50%48%52%50%43%52%zk47%47%43%55%49%50%44%56%57%50%
179515171431111923232826925178178Tend to disagree18%16%17%21%26%zj16%19%22%a23%a17%19%18%17%16%9%18%aj
7834132825401088994146876Strongly disagree8%11%zm4%8%m15%zj6%10%8%8%5%6%9%9%6%10%8%jm
1714968472112519142026217381415174Don't know17%15%23%zln14%12%18%19%13%20%16%15%14%25%zbeh13%18%17%l
573193170193794255361501008130727154573Agree57%59%56%57%47%61%zk53%57%49%62%cg60%59%49%65%cg63%c57%ck
25786649968151293132363414382417255Disagree26%26%21%29%m41%zj21%29%30%31%22%25%26%26%22%19%25%jm
3161071069411275243019644717344738318Net agree32%33%35%l28%6%39%zk24%28%18%39%zcgi34%cg33%g23%43%zcghi44%zcghi32%cgkl
Public Perceptions of the NHS and Social CareFINAL PUBLIC
Table 201Q35. Please tell me whether on the whole you agree or disagree with each of the following statements:
- NHS hospitals are getting infections like MRSA under control -
Base : All respondents
Respondent type : General public aged 16+ Fieldwork dates : 14th November - 9th December 2011Source : Ipsos MORI (JN10-039262-01)Proportions/Means: Columns Tested (5% risk level) - z/a/b/c/d/e/f/g/h/i - z/j/k - z/l/m/n - z/oOverlap formulae used. * small base

UnwtdPrivate healthSatisfaction withImpact of NHS reformsGovernment has righttotalinsurancesocial careon patientsNHS policyNHS use in last year
SocialNHSDissatisficareWalk InChoicesPharmacistWtd.
NoYesedSatisfiedWorseBetterDisagreeAgreeservicesClinicwebsite/ChemistNHS DirectA&EOutpatientInpatientGPTotal(r)(q)(p)(o)(n)(m)(l)(k)(j)(i)(h)(g)(f)(e)(d)(c)(b)(a)(z)10018151704424938220040326945182553001772253931967801001Unweighted Total100181117544*24437920139327642*18856*3011832303761927731001Weighted Total
74581252527193720410729202135215574Strongly agree7%7%7%12%10%7%10%9%7%9%5%12%10%h11%zah9%9%a11%zah7%7%
499412812112118810017515122102311439211617894402498Tend to agree50%51%46%47%49%49%50%45%55%k54%54%54%48%50%50%47%49%52%zc50%k
179139369507439785053076533447339131178Tend to disagree18%17%21%19%20%19%20%20%18%11%16%13%21%a18%19%20%21%17%18%7861135184410537718522131933176276Strongly disagree8%8%7%12%7%12%zl5%14%zj3%18%zacdef9%9%7%7%8%9%9%8%8%j
171140334314732504842964324295520123174Don't know17%17%19%10%13%12%16%13%17%9%15%11%14%13%13%15%11%16%b17%abdkmn
57347093261452141202121712611238172112137213115456573Agree57%58%53%59%60%57%60%54%62%k62%60%67%57%61%60%57%60%59%z57%
257200491467118491315712471286466410756193255Disagree26%25%28%31%28%31%z25%33%zj21%28%25%22%29%25%28%28%29%25%25%j
31627044127897708111414652586667310659263318Net agree32%33%zp25%28%32%26%35%m21%41%zk34%35%45%zbcf28%36%cf32%28%31%34%zcf32%kmp
Public Perceptions of the NHS and Social CareFINAL PUBLIC
Table 202Q35. Please tell me whether on the whole you agree or disagree with each of the following statements:
- NHS hospitals are getting infections like MRSA under control -
Base : All respondents
Respondent type : General public aged 16+ Fieldwork dates : 14th November - 9th December 2011Source : Ipsos MORI (JN10-039262-01)Proportions/Means: Columns Tested (5% risk level) - z/a/b/c/d/e/f/g/h/i - z/j/k - z/l/m - z/n/o - z/p/q - z/rOverlap formulae used. * small base

UnwtdtotalWork StatusSocial GradeAgeGender
Full/part-Wtd.OtherUnemployedRetiredtimeDEC2C1AB65+55-6435-5425-3416-24FemaleMaleTotal
(p)(o)(n)(m)(l)(k)(j)(i)(h)(g)(f)(e)(d)(c)(b)(a)(z)1001162612705082472013062472201693311581235274741001Unweighted Total100115758*2355512392013122491981433501671435154861001Weighted Total
4973122781416111091776242548Strongly agree5%4%5%5%5%3%7%5%4%5%6%5%4%4%5%5%5%
3013820771627169837464511133532164132296Tend to agree30%24%34%33%29%30%34%27%30%33%d36%zcd32%cd21%23%32%27%30%d
263401752158643895703839914950140126267Tend to disagree26%25%29%22%29%27%19%30%j28%j19%27%26%30%g35%zg27%26%27%gj
162271031954237513329245336209073163Strongly disagree16%17%17%13%17%18%18%16%13%15%17%15%21%14%17%15%16%
2264596311055446761572076393598129227Don't know23%29%zln15%27%l20%23%22%21%25%29%zf14%22%f24%f24%f19%27%zb23%bfl
3504522891887883998574601294338188157345Agree35%29%38%38%o34%33%41%zi32%34%37%cd42%zcd37%cd26%27%36%32%34%d
4256727832521067514610367631448570230199429Disagree42%43%47%35%46%m44%37%47%j41%34%44%g41%51%zeg49%g45%41%43%gm
-75-22-56-64-278-47-197-3-15-42-32-42-42-85Net agree-7%-14%-8%3%n-12%-12%4%-15%-7%4%f-2%-4%-25%-22%-8%-9%-8%
Public Perceptions of the NHS and Social CareFINAL PUBLIC
Table 203Q36. Please tell me whether on the whole you agree or disagree with each of the following statements:
- NHS waiting times for non-emergency treatment and care are getting shorter -
Base : All respondents
Respondent type : General public aged 16+ Fieldwork dates : 14th November - 9th December 2011Source : Ipsos MORI (JN10-039262-01)Proportions/Means: Columns Tested (5% risk level) - z/a/b - z/c/d/e/f/g - z/h/i/j/k - z/l/m/n/o - z/pOverlap formulae used. * small base

People aretreated with
Unwtddignity andtotalrespectNHS useHospital useEthnicityNHS/social care staffHousehold TypeHome Ownership
NotAdultshospitalHospitalInformalSocialwith
Non NHS/A&E/A&EsocialcareKnow NHSNHSdependentNon-Owner -PrivateSocialWtd.DisagreeAgreeuserNHS useruseruserMixedWhiteAsianBlackcarerworkerstaffstaffchildrenpensionerPensionerOtheroccupierrenterrenterTotal
(v)(u)(t)(s)(r)(q)(p)(o)(n)(m)(l)(k)(j)(i)(h)(g)(f)(e)(d)(c)(b)(a)(z)100130864710090145854310750741612543628951291461249106491691731001Unweighted Total1001304652104*89746853311**74778*15925038*29252*30547522110**6401781731001Weighted Total
497404441929-3321393175172011-347748Strongly agree5%2%6%zu4%5%4%6%-4%2%8%zn4%8%6%10%k6%4%5%-5%4%4%5%u
30173214312661281681222244679158612861347612014451296Tend to agree30%24%33%zu29%30%27%32%9%30%30%29%31%39%29%23%28%28%34%10%31%25%29%30%u
2639116521246129138720024356578020771444541584955267Tend to disagree26%30%25%20%27%28%26%63%27%30%22%26%18%27%38%j25%30%ze21%41%25%28%32%27%e
16278801315064991113163351747115871342923929163Strongly disagree16%26%zt12%12%17%14%19%zq9%15%20%21%20%z20%16%20%19%15%16%18%14%22%zc17%16%cqt
22655152361911289921791331466625671065431553931227Don't know23%18%23%35%zr21%27%zp19%20%24%17%20%19%15%21%h10%22%22%25%32%24%22%18%23%hpru
3507925435310147197125625608818103171031548712355158345Agree35%26%39%zu33%35%31%37%9%34%33%37%35%48%35%33%34%32%39%10%37%z29%33%34%u
425169245333961932368312396811614128301352158062508984429Disagree42%56%zt38%32%44%zs41%44%71%42%51%43%46%38%44%58%zj44%45%e36%59%39%50%c49%c43%cest
-75-8991-86-46-39-7-56-14-9-284-24-13-32-607-5-15-38-27-85Net agree-7%-29%1%1%-10%-10%-7%-63%-8%-18%-5%-11%10%-8%-25%-10%-13%3%-49%-2%-21%-15%-8%
Public Perceptions of the NHS and Social CareFINAL PUBLIC
Table 204Q36. Please tell me whether on the whole you agree or disagree with each of the following statements:
- NHS waiting times for non-emergency treatment and care are getting shorter -
Base : All respondents
Respondent type : General public aged 16+ Fieldwork dates : 14th November - 9th December 2011Source : Ipsos MORI (JN10-039262-01)Proportions/Means: Columns Tested (5% risk level) - z/a/b/c/d - z/e/f/g - z/h/i/j/k - z/l/m/n/o - z/p/q - z/r/s - z/t/u - z/vOverlap formulae used. * small base; ** very small base (under 30) ineligible for sig testing

UnwtdtotalFuture of NHSSatisfaction with NHSGOR
DisYorkshire &WestEastWtd.WorseSameBettersatisfiedSatisfiedHumbersideMidlandsSouth-WestSouth-EastNorth-WestNorth-EastLondonEasternMidlandsTotal
(o)(n)(m)(l)(k)(j)(i)(h)(g)(f)(e)(d)(c)(b)(a)(z)1001328298343168703909910715413955143126881001Unweighted Total1001327302340168701100*106*10216213651*14810986*1001Weighted Total
491711177386634137-5548Strongly agree5%5%4%5%4%5%6%c5%c3%c3%9%zcfg13%zbcfg-4%c6%c5%c
301981028732232232826475217482926296Tend to agree30%30%34%l25%19%33%zk23%26%26%29%39%zbghi33%32%26%31%30%kl
26397631035717532252739308463721267Tend to disagree26%30%m21%30%m34%zj25%32%d24%27%24%22%16%31%d34%de25%27%m
1625343644887241817251711261214163Strongly disagree16%16%14%19%28%zj12%24%zbe17%17%15%13%21%17%11%16%16%j
2266382702516914302947249282719227Don't know23%19%27%zn21%15%24%k14%28%i28%i29%zei18%17%19%25%22%23%ik
35011411410339271293329516524483332345Agree35%35%38%30%23%39%zk29%31%29%32%48%zbcfghi47%bfgi32%31%37%34%k
425151106167104262574344644719724835429Disagree42%46%m35%49%zm62%zj37%57%zadefh41%43%39%34%36%49%e44%41%43%ejm
-75-368-64-659-28-10-15-13185-24-15-4-85Net agree-7%-11%3%-19%-39%1%-27%-9%-15%-8%13%abfgh10%a-17%-14%-4%-8%
Public Perceptions of the NHS and Social CareFINAL PUBLIC
Table 205Q36. Please tell me whether on the whole you agree or disagree with each of the following statements:
- NHS waiting times for non-emergency treatment and care are getting shorter -
Base : All respondents
Respondent type : General public aged 16+ Fieldwork dates : 14th November - 9th December 2011Source : Ipsos MORI (JN10-039262-01)Proportions/Means: Columns Tested (5% risk level) - z/a/b/c/d/e/f/g/h/i - z/j/k - z/l/m/n - z/oOverlap formulae used. * small base

UnwtdPrivate healthSatisfaction withImpact of NHS reformsGovernment has righttotalinsurancesocial careon patientsNHS policyNHS use in last year
SocialNHSDissatisficareWalk InChoicesPharmacistWtd.
NoYesedSatisfiedWorseBetterDisagreeAgreeservicesClinicwebsite/ChemistNHS DirectA&EOutpatientInpatientGPTotal(r)(q)(p)(o)(n)(m)(l)(k)(j)(i)(h)(g)(f)(e)(d)(c)(b)(a)(z)10018151704424938220040326945182553001772253931967801001Unweighted Total100181117544*24437920139327642*18856*3011832303761927731001Weighted Total
49425-15139152027714141421123848Strongly agree5%5%3%-6%4%5%4%7%4%4%12%zacfh5%8%6%6%6%5%5%
30124943128310972989411761788406512065229296Tend to agree30%31%24%26%34%29%36%z25%34%k26%40%zacdef30%29%e22%28%32%e34%e30%e30%ek
26320558135811253118681545127746649352210267Tend to disagree26%25%33%zq29%24%30%27%30%25%36%24%22%26%25%28%25%27%27%27%q
162136231138782793341132105241447534128163Strongly disagree16%17%13%25%16%20%zl13%24%zj12%26%17%19%17%22%za19%20%za18%17%16%j
2261794695067396960327106941446628167227Don't know23%22%26%20%21%18%19%17%22%7%14%17%23%bchi23%bhi19%i18%i15%22%bchi23%bchikm
35029048129712381113114138324102557914177267345Agree35%36%p27%26%40%z32%40%z29%41%zk31%44%zadef42%e34%30%34%38%e40%e35%34%kp
425341812497190802111032678231298710816886339429Disagree42%42%46%54%40%50%zl40%54%zj37%63%zabcdfg41%41%43%48%47%45%45%44%43%j
h
-75-51-33-121-671-9711-1351-27-33-29-27-9-72-85Net agree-7%-6%-19%-28%*-18%*-25%4%-32%3%2%-9%-18%-12%-7%-5%-9%-8%
Public Perceptions of the NHS and Social CareFINAL PUBLIC
Table 206Q36. Please tell me whether on the whole you agree or disagree with each of the following statements:
- NHS waiting times for non-emergency treatment and care are getting shorter -
Base : All respondents
Respondent type : General public aged 16+ Fieldwork dates : 14th November - 9th December 2011Source : Ipsos MORI (JN10-039262-01)Proportions/Means: Columns Tested (5% risk level) - z/a/b/c/d/e/f/g/h/i - z/j/k - z/l/m - z/n/o - z/p/q - z/rOverlap formulae used. * small base

UnwtdtotalWork StatusSocial GradeAgeGender
Full/part-Wtd.OtherUnemployedRetiredtimeDEC2C1AB65+55-6435-5425-3416-24FemaleMaleTotal
(p)(o)(n)(m)(l)(k)(j)(i)(h)(g)(f)(e)(d)(c)(b)(a)(z)1001162612705082472013062472201693311581235274741001Unweighted Total100115758*2355512392013122491981433501671435154861001Weighted Total
49451621121312101561187281947Strongly agree5%3%8%7%z4%5%6%4%4%8%ze4%3%5%5%5%4%5%
396642196217106901178581521435667189210398Tend to agree40%41%36%41%39%44%h45%h38%34%41%36%41%33%47%d37%43%zb40%bh
21337134611452318246353780372111991210Tend to disagree21%24%23%20%21%22%15%26%zhj18%18%26%c23%22%14%23%19%21%j
95134225420162829171939153593593Strongly disagree9%8%7%9%10%8%8%9%12%9%c13%c11%c9%c2%11%za7%9%ac
248381555144495272794930765245120132252Don't know25%24%26%23%26%20%26%23%32%zik25%21%22%31%ef32%ef23%27%25%k
44569261122391181031299596571556474217229445Agree44%44%44%48%43%50%h51%zhi41%38%49%d40%44%38%51%d42%47%45%h
30850176816872461107553561195124178125303Disagree31%32%30%29%31%30%23%35%zj30%27%c39%zcg34%c31%c17%35%za26%30%acj
13718845714657192043136135039103142Net agree14%12%14%19%zlo13%19%zhi28%zhik6%8%22%zdef1%10%f7%f35%zdefg8%21%zb14%bdefhi
Public Perceptions of the NHS and Social CareFINAL PUBLIC
Table 207Q37. Please tell me whether on the whole you agree or disagree with each of the following statements:
- NHS and social care services work well together to give people co-ordinated care -
Base : All respondents
Respondent type : General public aged 16+ Fieldwork dates : 14th November - 9th December 2011Source : Ipsos MORI (JN10-039262-01)Proportions/Means: Columns Tested (5% risk level) - z/a/b - z/c/d/e/f/g - z/h/i/j/k - z/l/m/n/o - z/pOverlap formulae used. * small base

People aretreated with
Unwtddignity andtotalrespectNHS useHospital useEthnicityNHS/social care staffHousehold TypeHome Ownership
NotAdultshospitalHospitalInformalSocialwith
Non NHS/A&E/A&EsocialcareKnow NHSNHSdependentNon-Owner -PrivateSocialWtd.DisagreeAgreeuserNHS useruseruserMixedWhiteAsianBlackcarerworkerstaffstaffchildrenpensionerPensionerOtheroccupierrenterrenterTotal
(v)(u)(t)(s)(r)(q)(p)(o)(n)(m)(l)(k)(j)(i)(h)(g)(f)(e)(d)(c)(b)(a)(z)100130864710090145854310750741612543628951291461249106491691731001Unweighted Total1001304652104*89746853311**74778*15925038*29252*30547522110**6401781731001Weighted Total
492434431829-32411152175181316-2791147Strongly agree5%1%7%zu4%5%4%5%-4%5%7%6%4%6%9%6%f3%7%zf-4%5%6%5%fu
3966930943355196203129337649816104141211908872476481398Tend to agree40%23%47%zu41%40%42%38%11%39%47%40%39%40%36%26%40%40%40%68%39%36%47%z40%hu
21310010615195941163169102763117618561134211344035210Tend to disagree21%33%zt16%15%22%20%22%31%23%z13%17%25%28%26%z33%z18%24%19%10%21%22%20%21%t
95602988530631705163572512254721-63161593Strongly disagree9%20%zt5%8%9%6%12%zq9%9%7%10%14%zi19%zi9%24%zi8%10%9%-10%9%8%9%qt
248721643421812912351832141393704861135421704931252Don't know25%24%25%33%24%28%23%49%25%28%26%16%8%24%hjk8%28%24%24%22%27%a28%a18%25%ahjk
445723524739921423113254176113171221813920310472747392445Agree44%24%54%zu45%44%46%43%11%43%52%47%45%45%42%35%45%43%47%68%43%41%53%zbc45%u
3081601352428012517842391642981810030811606311975650303Disagree31%53%zt21%23%31%27%33%zq40%32%zm20%27%39%z47%z34%57%zik26%34%zg28%10%31%31%29%30%mqt
137-88217231198953-386253314-121-125843416771742142Net agree14%-29%33%zu22%zr13%19%zp10%-29%11%32%zn21%zn6%h-2%7%hj-22%19%zf9%19%zf58%12%10%24%zbc14%cfhij
knpru
Public Perceptions of the NHS and Social CareFINAL PUBLIC
Table 208Q37. Please tell me whether on the whole you agree or disagree with each of the following statements:
- NHS and social care services work well together to give people co-ordinated care -
Base : All respondents
Respondent type : General public aged 16+ Fieldwork dates : 14th November - 9th December 2011Source : Ipsos MORI (JN10-039262-01)Proportions/Means: Columns Tested (5% risk level) - z/a/b/c/d - z/e/f/g - z/h/i/j/k - z/l/m/n/o - z/p/q - z/r/s - z/t/u - z/vOverlap formulae used. * small base; ** very small base (under 30) ineligible for sig testing

UnwtdtotalFuture of NHSSatisfaction with NHSGOR
DisYorkshire &WestEastWtd.WorseSameBettersatisfiedSatisfiedHumbersideMidlandsSouth-WestSouth-EastNorth-WestNorth-EastLondonEasternMidlandsTotal
(o)(n)(m)(l)(k)(j)(i)(h)(g)(f)(e)(d)(c)(b)(a)(z)1001328298343168703909910715413955143126881001Unweighted Total1001327302340168701100*106*10216213651*14810986*1001Weighted Total
49131416441422515547347Strongly agree5%4%5%5%2%6%z4%2%2%3%11%zcfgh10%cgh3%6%4%5%
39611513413841308383238577619634332398Tend to agree40%35%44%n41%25%44%zk38%31%37%35%56%zabcdfghi37%43%40%37%40%kn
21377527859119302821281811342416210Tend to disagree21%23%17%23%35%zj17%30%zef26%e20%17%13%21%23%e22%19%21%ej
953914413644101411189697993Strongly disagree9%12%m5%12%zm21%zj6%10%13%11%11%7%12%6%6%10%9%jm
24883886828190173030541811382826252Don't know25%26%29%l20%17%27%zk17%28%e30%ei33%zei13%21%26%e25%e31%ei25%ekl
44512814815445349423540629124675035445Agree44%39%49%n45%27%50%zk42%33%39%38%67%zabcdfghi46%45%46%h40%45%hkn
3081166611995162404232462717433125303Disagree31%35%zm22%35%zm56%zj23%40%ze39%ze31%e29%20%33%29%28%29%30%ejm
137138235-491872-781664724199142Net agree14%4%27%zln10%n-29%27%zk2%-7%8%h10%hi47%zabcdfghi14%i16%ghi18%fghi11%hi14%ghikln
Public Perceptions of the NHS and Social CareFINAL PUBLIC
Table 209Q37. Please tell me whether on the whole you agree or disagree with each of the following statements:
- NHS and social care services work well together to give people co-ordinated care -
Base : All respondents
Respondent type : General public aged 16+ Fieldwork dates : 14th November - 9th December 2011Source : Ipsos MORI (JN10-039262-01)Proportions/Means: Columns Tested (5% risk level) - z/a/b/c/d/e/f/g/h/i - z/j/k - z/l/m/n - z/oOverlap formulae used. * small base

UnwtdPrivate healthSatisfaction withImpact of NHS reformsGovernment has righttotalinsurancesocial careon patientsNHS policyNHS use in last year
SocialNHSDissatisficareWalk InChoicesPharmacistWtd.
NoYesedSatisfiedWorseBetterDisagreeAgreeservicesClinicwebsite/ChemistNHS DirectA&EOutpatientInpatientGPTotal(r)(q)(p)(o)(n)(m)(l)(k)(j)(i)(h)(g)(f)(e)(d)(c)(b)(a)(z)10018151704424938220040326945182553001772253931967801001Unweighted Total100181117544*24437920139327642*18856*3011832303761927731001Weighted Total
49433-17141515194921461020133447Strongly agree5%5%2%-7%z4%8%z4%7%z9%5%3%5%3%4%5%7%e4%5%p
39634250810612695119147199015104659814284303398Tend to agree40%42%zp28%18%43%o33%47%zm30%53%zk45%g48%zacefg27%34%35%43%fg38%44%fg39%fg40%fgkmop
213162461857913811537938147341488239168210Tend to disagree21%20%26%40%zn24%24%19%29%zj13%20%20%24%24%22%21%22%20%22%21%j
95702213254813678820937242350287293Strongly disagree9%9%13%29%zn10%13%zl7%17%zj3%19%zad10%17%12%za13%za10%13%za14%za9%9%j
24819453538100397765331177347528228196252Don't know25%24%31%12%16%26%19%20%23%7%16%30%bhi24%bhi26%bhi22%bi22%bi15%25%bchi25%bchikln
o
4453855381231401101341672299171177010816297337445Agree44%48%zp30%18%51%zo37%55%zm34%60%zk53%g53%zacefg29%39%39%47%efg43%g51%acefg44%g45%fgkmop
3082316931821405118245175823110657013267240303Disagree31%29%39%zq69%zn34%37%zl26%46%zj16%40%31%41%37%za36%31%35%za35%31%30%jq
137154-16-2241159-48121641-67538303097142Net agree14%19%zp-9%-51%17%o*29%zm-12%44%zk13%ef22%zacefg-11%2%g3%17%cefg8%efg16%cefg13%cefg14%acefgkm
op
Public Perceptions of the NHS and Social CareFINAL PUBLIC
Table 210Q37. Please tell me whether on the whole you agree or disagree with each of the following statements:
- NHS and social care services work well together to give people co-ordinated care -
Base : All respondents
Respondent type : General public aged 16+ Fieldwork dates : 14th November - 9th December 2011Source : Ipsos MORI (JN10-039262-01)Proportions/Means: Columns Tested (5% risk level) - z/a/b/c/d/e/f/g/h/i - z/j/k - z/l/m - z/n/o - z/p/q - z/rOverlap formulae used. * small base

UnwtdtotalWork StatusSocial GradeAgeGender
Full/part-Wtd.OtherUnemployedRetiredtimeDEC2C1AB65+55-6435-5425-3416-24FemaleMaleTotal
(p)(o)(n)(m)(l)(k)(j)(i)(h)(g)(f)(e)(d)(c)(b)(a)(z)1001162612705082472013062472201693311581235274741001Unweighted Total100115758*2355512392013122491981433501671435154861001Weighted Total4325721104241957813311684781616435215207422Strongly agree43%36%36%44%44%40%39%43%47%42%c55%zcdg46%c38%c25%42%43%42%c
409712598219102921239686491357271215198413Tend to agree41%45%42%42%40%43%46%39%38%43%35%39%43%50%zef42%41%41%669411471411291687261217284371Tend to disagree7%6%7%5%9%m6%6%9%7%4%5%7%7%12%zfg5%9%zb7%b
152-5823735253111415Strongly disagree1%1%-2%2%1%1%2%1%2%1%1%2%1%2%1%2%
79188173626171917157241618463380Don't know8%12%l14%l7%6%11%8%6%7%8%5%7%9%13%zef9%7%8%
84112846202459197170256212170128296136106430405835Agree84%81%79%86%83%83%84%82%85%86%c89%zcd85%c81%74%84%83%83%c
81114155516143620139301619394786Disagree8%7%7%7%10%7%7%12%zk8%7%6%9%9%13%8%10%9%
7601174218740418215622019215711926612088391358749Net agree76%75%71%79%z73%76%77%70%77%79%c83%zcd76%c72%61%76%74%75%ci
Public Perceptions of the NHS and Social CareFINAL PUBLIC
Table 211Q38. Please tell me whether on the whole you agree or disagree with each of the following statements:
- The NHS will face a severe funding problem in the future -
Base : All respondents
Respondent type : General public aged 16+ Fieldwork dates : 14th November - 9th December 2011Source : Ipsos MORI (JN10-039262-01)Proportions/Means: Columns Tested (5% risk level) - z/a/b - z/c/d/e/f/g - z/h/i/j/k - z/l/m/n/o - z/pOverlap formulae used. * small base

People aretreated with
Unwtddignity andtotalrespectNHS useHospital useEthnicityNHS/social care staffHousehold TypeHome Ownership
NotAdultshospitalHospitalInformalSocialwith
Non NHS/A&E/A&EsocialcareKnow NHSNHSdependentNon-Owner -PrivateSocialWtd.DisagreeAgreeuserNHS useruseruserMixedWhiteAsianBlackcarerworkerstaffstaffchildrenpensionerPensionerOtheroccupierrenterrenterTotal
(v)(u)(t)(s)(r)(q)(p)(o)(n)(m)(l)(k)(j)(i)(h)(g)(f)(e)(d)(c)(b)(a)(z)100130864710090145854310750741612543628951291461249106491691731001Unweighted Total1001304652104*89746853311**74778*15925038*29252*30547522110**6401781731001Weighted Total432162240323911862367326196912620144321321949752847064422Strongly agree43%53%zt37%30%44%zs40%44%61%44%m24%43%m51%z53%49%z61%z43%41%44%52%44%39%37%42%mst
40910229551362204209130741639114107121231999142637274413Tend to agree41%34%45%zu49%40%44%39%10%41%52%z40%37%35%37%23%40%42%41%38%41%40%43%41%hu
66214813583536149911152177204011-42181171Tend to disagree7%7%7%13%zr6%7%7%10%7%11%7%6%6%6%14%ik6%9%5%-6%10%6%7%r
1549-156911111212-385-92415Strongly disagree1%1%1%-2%1%2%9%2%1%1%1%3%1%-1%2%2%-1%1%3%2%
7915598713743154914151221283318143162080Don't know8%5%9%u8%8%8%8%10%7%12%9%6%3%7%2%9%7%8%10%7%9%12%c8%cu
8412645358375239144586335913321734252442553931879547142137835Agree84%87%z82%80%84%83%83%71%85%76%83%87%88%86%84%83%83%85%90%85%z80%79%83%81255813734145260913173197234815-50201586Disagree8%8%9%13%8%9%8%19%8%12%8%7%8%7%14%7%10%7%-8%11%9%9%
7602394777067935040065735012020031233372323451729497122122749Net agree76%79%73%67%76%z75%75%52%77%zm64%75%80%z80%80%z71%76%73%78%90%78%zb68%71%75%bm
Public Perceptions of the NHS and Social CareFINAL PUBLIC
Table 212Q38. Please tell me whether on the whole you agree or disagree with each of the following statements:
- The NHS will face a severe funding problem in the future -
Base : All respondents
Respondent type : General public aged 16+ Fieldwork dates : 14th November - 9th December 2011Source : Ipsos MORI (JN10-039262-01)Proportions/Means: Columns Tested (5% risk level) - z/a/b/c/d - z/e/f/g - z/h/i/j/k - z/l/m/n/o - z/p/q - z/r/s - z/t/u - z/vOverlap formulae used. * small base; ** very small base (under 30) ineligible for sig testing

UnwtdtotalFuture of NHSSatisfaction with NHSGOR
DisYorkshire &WestEastWtd.WorseSameBettersatisfiedSatisfiedHumbersideMidlandsSouth-WestSouth-EastNorth-WestNorth-EastLondonEasternMidlandsTotal
(o)(n)(m)(l)(k)(j)(i)(h)(g)(f)(e)(d)(c)(b)(a)(z)1001328298343168703909910715413955143126881001Unweighted Total1001327302340168701100*106*10216213651*14810986*1001Weighted Total4321639615590269373749715523575243422Strongly agree43%50%zm32%45%m53%zj38%37%34%48%44%40%45%38%47%49%h42%jm
40912014114254309365441665618624435413Tend to agree41%37%47%zn42%32%44%zk36%51%zi40%41%41%36%42%41%40%41%kn
66162626105415841066136271Tend to disagree7%5%9%8%6%8%15%zabefg7%4%6%5%12%a9%a5%2%7%
155377832-32-21215Strongly disagree1%2%1%2%4%zj1%3%2%-2%1%-1%1%2%2%
7923361166185812174136580Don't know8%7%l12%zln3%4%9%k8%5%8%8%13%zh7%9%6%6%8%kl
841283237296144578749190137110411199677835Agree84%86%m78%87%zm86%82%74%85%i88%i84%i81%81%80%88%i90%i83%im
812129331762181041386167486Disagree8%7%10%10%10%9%18%zabefg10%4%8%6%12%10%6%4%9%
760261208263126516568086124102351048973749Net agree76%80%zm69%77%m75%74%55%76%i84%zcdi76%i75%i69%70%i82%ci85%zcdi75%im
Public Perceptions of the NHS and Social CareFINAL PUBLIC
Table 213Q38. Please tell me whether on the whole you agree or disagree with each of the following statements:
- The NHS will face a severe funding problem in the future -
Base : All respondents
Respondent type : General public aged 16+ Fieldwork dates : 14th November - 9th December 2011Source : Ipsos MORI (JN10-039262-01)Proportions/Means: Columns Tested (5% risk level) - z/a/b/c/d/e/f/g/h/i - z/j/k - z/l/m/n - z/oOverlap formulae used. * small base

UnwtdPrivate healthSatisfaction withImpact of NHS reformsGovernment has righttotalinsurancesocial careon patientsNHS policyNHS use in last year
SocialNHSDissatisficareWalk InChoicesPharmacistWtd.
NoYesedSatisfiedWorseBetterDisagreeAgreeservicesClinicwebsite/ChemistNHS DirectA&EOutpatientInpatientGPTotal(r)(q)(p)(o)(n)(m)(l)(k)(j)(i)(h)(g)(f)(e)(d)(c)(b)(a)(z)10018151704424938220040326945182553001772253931967801001Unweighted Total100181117544*24437920139327642*18856*3011832303761927731001Weighted Total432336802511321259230762077291409811016790347422Strongly agree43%42%45%58%z46%56%zl29%58%zj27%48%41%51%46%54%zacfh48%44%47%45%z42%jl
40933474149412798117140177925124688914973307413Tend to agree41%41%42%33%39%33%49%zm30%51%zk41%42%44%41%37%39%40%38%40%41%km
6659102181924272621021541625124871Tend to disagree7%7%6%5%7%5%12%zm7%9%4%5%4%5%2%7%e7%e6%e6%e7%ae
15114-4827422-323721215Strongly disagree1%1%2%-2%2%1%2%1%4%1%-1%1%1%2%1%2%2%
7970721613181231119119101228145980Don't know8%9%p4%4%6%3%9%m3%11%zk2%10%defg1%6%5%5%7%7%8%8%kmp
841670154402073391573472163815654263166199316164654835Agree84%83%88%90%85%89%zl78%88%zj78%90%83%95%zach88%z91%zach86%84%85%85%83%jl
8170152212726343031221971932146086Disagree8%9%8%5%9%7%13%zm9%11%8%7%4%6%4%8%e8%e8%8%e9%e
760600139371863121313131863414351245159179284149594749Net agree76%74%79%85%76%82%zl65%80%zj67%82%76%91%zabcdh81%zac87%zabcdfh78%76%78%77%z75%jl
Public Perceptions of the NHS and Social CareFINAL PUBLIC
Table 214Q38. Please tell me whether on the whole you agree or disagree with each of the following statements:
- The NHS will face a severe funding problem in the future -
Base : All respondents
Respondent type : General public aged 16+ Fieldwork dates : 14th November - 9th December 2011Source : Ipsos MORI (JN10-039262-01)Proportions/Means: Columns Tested (5% risk level) - z/a/b/c/d/e/f/g/h/i - z/j/k - z/l/m - z/n/o - z/p/q - z/rOverlap formulae used. * small base

UnwtdtotalWork StatusSocial GradeAgeGender
Full/part-Wtd.OtherUnemployedRetiredtimeDEC2C1AB65+55-6435-5425-3416-24FemaleMaleTotal
(p)(o)(n)(m)(l)(k)(j)(i)(h)(g)(f)(e)(d)(c)(b)(a)(z)1001162612705082472013062472201693311581235274741001Unweighted Total100115758*2355512392013122491981433501671435154861001Weighted Total
48851222111091610811610222446Strongly agree5%5%9%5%4%5%5%3%6%5%6%3%4%7%4%5%5%
4487228972571108316010179541687776231223454Tend to agree45%46%49%41%47%46%41%51%zhj40%40%38%48%f46%53%fg45%46%45%f
2513317601395545767247431023719131118249Tend to disagree25%21%29%26%25%23%22%24%29%24%c30%c29%zc22%c13%26%24%25%c
88112244919222222231626165434285Strongly disagree9%7%3%10%9%8%11%7%9%11%c11%c8%9%c3%8%9%9%c
16633642854341443839214231348878166Don't know17%21%10%18%15%18%20%14%15%19%e15%12%19%e24%ze17%16%17%e
49680341092781229316911689631798386253248501Agree50%51%58%46%51%51%46%54%47%45%44%51%50%60%zfg49%51%50%
3394419841877467999570601295323175160334Disagree34%28%32%36%34%31%33%32%38%35%c42%zc37%c32%c16%34%33%33%c
15735152591472770221935130637888166Net agree16%22%zm25%m11%17%m20%h13%23%zhj9%10%f2%15%f18%fg44%zdefg15%18%17%fghm
Public Perceptions of the NHS and Social CareFINAL PUBLIC
Table 215Q39. Please tell me whether on the whole you agree or disagree with each of the following statements:
- The NHS is changing so it can provide the service we need for years to come -
Base : All respondents
Respondent type : General public aged 16+ Fieldwork dates : 14th November - 9th December 2011Source : Ipsos MORI (JN10-039262-01)Proportions/Means: Columns Tested (5% risk level) - z/a/b - z/c/d/e/f/g - z/h/i/j/k - z/l/m/n/o - z/pOverlap formulae used. * small base

People aretreated with
Unwtddignity andtotalrespectNHS useHospital useEthnicityNHS/social care staffHousehold TypeHome Ownership
NotAdultshospitalHospitalInformalSocialwith
Non NHS/A&E/A&EsocialcareKnow NHSNHSdependentNon-Owner -PrivateSocialWtd.DisagreeAgreeuserNHS useruseruserMixedWhiteAsianBlackcarerworkerstaffstaffchildrenpensionerPensionerOtheroccupierrenterrenterTotal
(v)(u)(t)(s)(r)(q)(p)(o)(n)(m)(l)(k)(j)(i)(h)(g)(f)(e)(d)(c)(b)(a)(z)100130864710090145854310750741612543628951291461249106491691731001Unweighted Total1001304652104*89746853311**74778*15925038*29252*30547522110**6401781731001Weighted Total
4810331451927-4223152112122113-298946Strongly agree5%3%5%1%5%4%5%-6%zl3%2%6%5%4%4%4%4%6%-5%5%5%5%ls
44895343563982352192332437510718131261542158632957383454Tend to agree45%31%53%zu54%44%50%zp41%19%44%56%47%43%46%45%49%50%ze45%39%31%46%41%48%45%epu
251109133182311081416192163462127116611286021604542249Tend to disagree25%36%zt20%17%26%23%26%52%26%20%21%25%30%24%31%20%27%g27%19%25%25%24%25%gt
8849336792659-67215324275283621155191085Strongly disagree9%16%zt5%6%9%6%11%zq-9%3%9%13%z11%9%9%9%7%10%10%9%11%6%9%qt
166401092314379873115143333353450754141013229166Don't know17%13%17%22%16%17%16%29%15%19%21%13%8%18%h7%16%16%19%40%16%18%17%17%
496105376574442542462373467812220142281662359933248192501Agree50%35%58%zu54%50%54%zp46%19%50%59%49%49%51%49%53%54%e50%45%31%51%46%53%50%pu
339158166243101352006259184994169821891648132156552334Disagree34%52%zt26%23%35%zs29%38%zq52%35%m23%31%38%41%33%40%29%35%37%29%34%36%30%33%mqst
157-532103213412046-41142829284447777118*1091740166Net agree16%-17%32%zu31%zr15%26%zp9%-33%15%36%zln18%11%10%15%13%25%zef15%e8%2%17%b9%23%zb17%beknp
ru
Public Perceptions of the NHS and Social CareFINAL PUBLIC
Table 216Q39. Please tell me whether on the whole you agree or disagree with each of the following statements:
- The NHS is changing so it can provide the service we need for years to come -
Base : All respondents
Respondent type : General public aged 16+ Fieldwork dates : 14th November - 9th December 2011Source : Ipsos MORI (JN10-039262-01)Proportions/Means: Columns Tested (5% risk level) - z/a/b/c/d - z/e/f/g - z/h/i/j/k - z/l/m/n/o - z/p/q - z/r/s - z/t/u - z/vOverlap formulae used. * small base; ** very small base (under 30) ineligible for sig testing

UnwtdtotalFuture of NHSSatisfaction with NHSGOR
DisYorkshire &WestEastWtd.WorseSameBettersatisfiedSatisfiedHumbersideMidlandsSouth-WestSouth-EastNorth-WestNorth-EastLondonEasternMidlandsTotal
(o)(n)(m)(l)(k)(j)(i)(h)(g)(f)(e)(d)(c)(b)(a)(z)1001328298343168703909910715413955143126881001Unweighted Total1001327302340168701100*106*10216213651*14810986*1001Weighted Total
481812143382457102311346Strongly agree5%5%4%4%2%5%2%4%5%4%7%c3%2%10%zcfi4%5%
44812116615252343464442727221745231454Tend to agree45%37%55%zln45%n31%49%zk46%42%41%44%53%a42%50%a48%36%45%kn
25187679558160263131442214431523249Tend to disagree25%27%22%28%35%zj23%26%b29%be31%be27%be16%27%b29%be14%27%b25%bej
88439313540612697713131185Strongly disagree9%13%zm3%9%m21%zj6%6%11%6%6%5%14%e9%12%e13%e9%jm
1665948491912020151731267151718166Don't know17%18%16%14%11%17%20%c14%17%19%c19%c13%10%16%21%c17%ck
49613917816655381484847788223766334501Agree50%42%59%zln49%33%54%zk48%46%46%48%60%zafgh45%52%58%a40%50%akn
3391307612594200324337532921572834334Disagree34%40%zm25%37%m56%zj29%32%40%be37%e33%e21%41%be38%be26%40%be33%ejm
157910241-3818115610255322035*166Net agree16%3%34%zln12%n-23%26%zk15%adh5%a10%a16%adh39%zacdfghi4%13%ah32%zacdfghi*17%adghkln
Public Perceptions of the NHS and Social CareFINAL PUBLIC
Table 217Q39. Please tell me whether on the whole you agree or disagree with each of the following statements:
- The NHS is changing so it can provide the service we need for years to come -
Base : All respondents
Respondent type : General public aged 16+ Fieldwork dates : 14th November - 9th December 2011Source : Ipsos MORI (JN10-039262-01)Proportions/Means: Columns Tested (5% risk level) - z/a/b/c/d/e/f/g/h/i - z/j/k - z/l/m/n - z/oOverlap formulae used. * small base

UnwtdPrivate healthSatisfaction withImpact of NHS reformsGovernment has righttotalinsurancesocial careon patientsNHS policyNHS use in last year
SocialNHSDissatisficareWalk InChoicesPharmacistWtd.
NoYesedSatisfiedWorseBetterDisagreeAgreeservicesClinicwebsite/ChemistNHS DirectA&EOutpatientInpatientGPTotal(r)(q)(p)(o)(n)(m)(l)(k)(j)(i)(h)(g)(f)(e)(d)(c)(b)(a)(z)10018151704424938220040326945182553001772253931967801001Unweighted Total100181117544*24437920139327642*18856*3011832303761927731001Weighted Total
483864111417132348414111021104346Strongly agree5%5%3%9%5%4%8%zm3%8%zk10%4%7%5%6%4%6%5%6%z5%
4483668014116131129131168119020118729714688338454Tend to agree45%45%46%31%47%35%64%zm33%61%zk25%48%cefi36%39%39%42%i39%46%ci44%ci45%cfikm
251204431854121351444017501484516210547211249Tend to disagree25%25%25%42%zn22%32%zl17%37%zj14%40%zb27%25%28%28%27%28%24%27%z25%jl
886421626674638619934222846276685Strongly disagree9%8%12%14%11%18%zl2%16%zj3%14%10%16%11%12%12%za12%za14%za9%9%jl
1661382523746164138421105127335720115166Don't know17%17%14%4%15%12%8%11%14%10%11%17%17%bh15%14%15%b10%15%b17%abhklmo
49640586181271451461451901598241328410716798381501Agree50%50%49%41%52%38%73%zm37%69%zk35%52%cfi43%44%46%46%45%51%cfi49%cf50%cfikm
3392686424801883920748236923118729015174277334Disagree34%33%37%55%zn33%50%zl19%53%zj17%54%zabdfh37%40%39%z39%39%z40%za39%36%z33%jl
15713722-646-43107-62143-82911312171624104166Net agree16%17%12%-15%19%o-11%53%zm-16%52%zk-19%16%cdefgi3%4%i6%i7%i4%i13%cdefgi13%cdefgi17%acdefgi
kmo
Public Perceptions of the NHS and Social CareFINAL PUBLIC
Table 218Q39. Please tell me whether on the whole you agree or disagree with each of the following statements:
- The NHS is changing so it can provide the service we need for years to come -
Base : All respondents
Respondent type : General public aged 16+ Fieldwork dates : 14th November - 9th December 2011Source : Ipsos MORI (JN10-039262-01)Proportions/Means: Columns Tested (5% risk level) - z/a/b/c/d/e/f/g/h/i - z/j/k - z/l/m - z/n/o - z/p/q - z/rOverlap formulae used. * small base

UnwtdtotalWork StatusSocial GradeAgeGender
Full/part-Wtd.OtherUnemployedRetiredtimeDEC2C1AB65+55-6435-5425-3416-24FemaleMaleTotal
(p)(o)(n)(m)(l)(k)(j)(i)(h)(g)(f)(e)(d)(c)(b)(a)(z)1001162612705082472013062472201693311581235274741001Unweighted Total100115758*2355512392013122491981433501671435154861001Weighted Total
4677923197137941887271945Strongly agree5%4%12%zlmo4%4%8%zh3%4%3%4%3%5%5%5%5%4%5%
385672594200115771108482501246565187198386Tend to agree38%42%44%40%36%48%zhij38%35%34%42%35%35%39%45%36%41%39%
2633516611484851956743521033526134126260Tend to disagree26%22%28%26%27%20%25%30%zk27%22%37%zcdg29%c21%18%26%26%26%ck
1401843779242738493621502287562138Strongly disagree14%11%6%16%14%10%13%12%20%zik18%zc15%c14%c13%c6%15%13%14%ck
167316351003439574327165537389280172Don't know17%20%10%15%18%14%19%18%17%14%11%16%22%fg26%zefg18%16%17%f
4317332102223133841239091541417371214217431Agree43%47%56%zl44%40%56%zhij42%39%36%46%38%40%44%50%f42%45%43%h
403532097228727813211679731535834209189398Disagree40%34%34%41%41%30%39%42%k47%zk40%c51%zcdg44%cd34%24%41%39%40%ck
2820125-5626-9-2612-19-12153752833Net agree3%13%zlm21%zlm2%l-1%26%zhij3%-3%-10%6%z-13%-3%9%ze26%zdefg1%6%zb3%befhil
Public Perceptions of the NHS and Social CareFINAL PUBLIC
Table 219Q40. Please tell me whether on the whole you agree or disagree with each of the following statements:
- The NHS is doing everything it can to reduce waste and inefficiency -
Base : All respondents
Respondent type : General public aged 16+ Fieldwork dates : 14th November - 9th December 2011Source : Ipsos MORI (JN10-039262-01)Proportions/Means: Columns Tested (5% risk level) - z/a/b - z/c/d/e/f/g - z/h/i/j/k - z/l/m/n/o - z/pOverlap formulae used. * small base

People aretreated with
Unwtddignity andtotalrespectNHS useHospital useEthnicityNHS/social care staffHousehold TypeHome Ownership
NotAdultshospitalHospitalInformalSocialwith
Non NHS/A&E/A&EsocialcareKnow NHSNHSdependentNon-Owner -PrivateSocialWtd.DisagreeAgreeuserNHS useruseruserMixedWhiteAsianBlackcarerworkerstaffstaffchildrenpensionerPensionerOtheroccupierrenterrenterTotal
(v)(u)(t)(s)(r)(q)(p)(o)(n)(m)(l)(k)(j)(i)(h)(g)(f)(e)(d)(c)(b)(a)(z)100130864710090145854310750741612543628951291461249106491691731001Unweighted Total1001304652104*89746853311**74778*15925038*29252*30547522110**6401781731001Weighted Total
468373421827134451418616209-21101445Strongly agree5%3%6%zu3%5%4%5%11%5%5%3%5%2%3%11%zi5%4%4%-3%6%8%zc5%cu
3856430741345200186327345649412103181261748562487062386Tend to agree38%21%47%zu39%38%43%zp35%31%36%58%zln40%37%32%35%34%41%37%39%60%39%39%36%39%npu
263110140302301191412212103467989145615054-1694447260Tend to disagree26%36%zt22%29%26%26%26%19%28%zm13%21%27%24%30%27%18%32%zeg24%-26%25%27%26%gmt
14079541112646912107521441141104355401962219138Strongly disagree14%26%zt8%11%14%10%17%zq18%14%7%13%17%27%zi14%19%14%12%18%zf10%15%13%11%14%qt
167431141815485872121133532651564753331063131172Don't know17%14%17%18%17%18%16%21%16%17%22%13%14%17%9%21%z16%15%30%17%18%18%17%k
43172344443872182135307496910713111231431949462698076431Agree43%24%53%zu42%43%46%zp40%42%41%63%zln43%43%34%38%45%47%41%43%60%42%45%44%43%inpu
40318919442356166232431916561112013024982059412656765398Disagree40%62%zt30%40%40%35%44%zq37%43%zm20%35%m44%51%45%46%32%43%zg43%g10%41%38%38%40%gmqt
28-11715033152-191-133313-3-7-19-144-11*54131133Net agree3%-39%23%zu2%3%11%zp-3%5%-2%43%zln8%zn-1%-17%-7%-1%15%zef-2%*51%1%7%zc6%zc3%cefijk
np
Public Perceptions of the NHS and Social CareFINAL PUBLIC
Table 220Q40. Please tell me whether on the whole you agree or disagree with each of the following statements:
- The NHS is doing everything it can to reduce waste and inefficiency -
Base : All respondents
Respondent type : General public aged 16+ Fieldwork dates : 14th November - 9th December 2011Source : Ipsos MORI (JN10-039262-01)Proportions/Means: Columns Tested (5% risk level) - z/a/b/c/d - z/e/f/g - z/h/i/j/k - z/l/m/n/o - z/p/q - z/r/s - z/t/u - z/vOverlap formulae used. * small base; ** very small base (under 30) ineligible for sig testing

UnwtdtotalFuture of NHSSatisfaction with NHSGOR
DisYorkshire &WestEastWtd.WorseSameBettersatisfiedSatisfiedHumbersideMidlandsSouth-WestSouth-EastNorth-WestNorth-EastLondonEasternMidlandsTotal
(o)(n)(m)(l)(k)(j)(i)(h)(g)(f)(e)(d)(c)(b)(a)(z)1001328298343168703909910715413955143126881001Unweighted Total1001327302340168701100*106*10216213651*14810986*1001Weighted Total
4615819836242615453545Strongly agree5%5%3%6%5%5%2%4%2%3%11%zbcfgi8%3%3%5%5%
38510813213732314323934606815614730386Tend to agree38%33%44%zn40%19%45%zk32%37%33%37%50%zadfghi29%41%44%35%39%kn
26394649566150313125372513433521260Tend to disagree26%29%m21%28%m40%zj21%31%e29%24%23%19%25%29%32%e25%26%ejm
1405432514380151715291410121114138Strongly disagree14%16%m11%15%25%zj11%15%16%15%18%c10%20%c8%10%16%14%cj
1675765371912120162731149271216172Don't know17%17%l22%zl11%11%17%20%15%26%zbeh19%e10%18%19%11%18%17%bekl
43112314115740351344336658319665135431Agree43%38%47%n46%n24%50%zk34%40%35%40%61%zabcdfghi37%44%46%41%43%kn
40314796146109230464740663923554636398Disagree40%45%zm32%43%m65%zj33%46%e45%e39%40%e29%45%e37%42%e41%40%ejm
28-244511-69121-12-5-4*44-4114-133Net agree3%-7%15%zln3%-41%17%zk-12%-4%-4%*32%zabcdfghi-8%7%zadfgh4%adfg-1%3%adfghin
Public Perceptions of the NHS and Social CareFINAL PUBLIC
Table 221Q40. Please tell me whether on the whole you agree or disagree with each of the following statements:
- The NHS is doing everything it can to reduce waste and inefficiency -
Base : All respondents
Respondent type : General public aged 16+ Fieldwork dates : 14th November - 9th December 2011Source : Ipsos MORI (JN10-039262-01)Proportions/Means: Columns Tested (5% risk level) - z/a/b/c/d/e/f/g/h/i - z/j/k - z/l/m/n - z/oOverlap formulae used. * small base

UnwtdPrivate healthSatisfaction withImpact of NHS reformsGovernment has righttotalinsurancesocial careon patientsNHS policyNHS use in last year
SocialNHSDissatisficareWalk InChoicesPharmacistWtd.
NoYesedSatisfiedWorseBetterDisagreeAgreeservicesClinicwebsite/ChemistNHS DirectA&EOutpatientInpatientGPTotal(r)(q)(p)(o)(n)(m)(l)(k)(j)(i)(h)(g)(f)(e)(d)(c)(b)(a)(z)10018151704424938220040326945182553001772253931967801001Unweighted Total100181117544*24437920139327642*18856*3011832303761927731001Weighted Total
464042151616201639619101320103545Strongly agree5%5%2%4%6%4%8%z5%6%8%5%11%za6%5%6%5%5%5%5%
3853185881051308311415517701694678312472303386Tend to agree38%39%33%18%43%o34%41%29%56%zk42%37%29%31%37%36%33%37%39%cf39%cfkmo
263201571263108571365110521486444810449199260Tend to disagree26%25%33%zq27%26%28%28%35%zj18%25%28%25%29%d24%21%28%d26%26%26%dj
14010333142675218322928145135427036109138Strongly disagree14%13%19%zq32%zn11%20%zl10%21%zj8%21%15%25%za17%19%za18%z19%za19%z14%14%j
167148238355025403322965127445725127172Don't know17%18%13%18%15%13%12%10%12%4%15%10%17%i15%19%bi15%i13%16%i17%ijklm
431358621012014699134171217922113779614481338431Agree43%44%p36%22%49%zo39%49%m34%62%zk50%42%39%38%42%42%38%42%44%cf43%cfkmop
4033049026891837721972198028137809017585308398Disagree40%38%51%zq59%zn36%48%zl39%56%zj26%46%43%50%45%za44%39%46%zad44%40%40%jq
2854-28-1631-3721-84982-1-6-24-36-30-43033Net agree3%7%zp-16%-37%13%zo-10%11%z-21%36%zk4%h-1%-11%-8%-2%3%begh-8%-2%4%befgh3%bcefghop
Public Perceptions of the NHS and Social CareFINAL PUBLIC
Table 222Q40. Please tell me whether on the whole you agree or disagree with each of the following statements:
- The NHS is doing everything it can to reduce waste and inefficiency -
Base : All respondents
Respondent type : General public aged 16+ Fieldwork dates : 14th November - 9th December 2011Source : Ipsos MORI (JN10-039262-01)Proportions/Means: Columns Tested (5% risk level) - z/a/b/c/d/e/f/g/h/i - z/j/k - z/l/m - z/n/o - z/p/q - z/rOverlap formulae used. * small base

UnwtdtotalWork StatusSocial GradeAgeGender
Full/part-Wtd.OtherUnemployedRetiredtimeDEC2C1AB65+55-6435-5425-3416-24FemaleMaleTotal
(p)(o)(n)(m)(l)(k)(j)(i)(h)(g)(f)(e)(d)(c)(b)(a)(z)1001162612705082472013062472201693311581235274741001Unweighted Total100115758*2355512392013122491981433501671435154861001Weighted Total
72103164213821301113241310353671Strongly agree7%7%5%7%8%5%4%7%12%zijk6%9%7%7%7%7%7%7%j
4125630103221977612810989561426557222189410Tend to agree41%36%52%o44%40%41%38%41%44%45%39%41%39%40%43%39%41%
2855311631626364926950391034848142147289Tend to disagree28%34%n19%27%29%26%32%30%28%25%27%29%29%34%28%30%29%
15219536914433462931266125107477152Strongly disagree15%12%9%15%17%18%h16%15%12%16%c18%c17%c15%c7%14%16%15%c
801891735222223131610201617433780Don't know8%12%l15%zlm7%6%9%11%h7%5%8%7%6%9%12%e8%8%8%h
484673311926211084150138101691667868256225481Agree48%42%57%51%48%46%42%48%56%zjk51%48%48%46%47%50%46%48%j
437721699253107961399881641637458216224440Disagree44%46%n28%42%n46%n45%48%45%39%41%45%47%44%41%42%46%44%n
47-5172093-13114020534940141Net agree5%-3%29%zlmo9%zlo2%o1%-6%3%16%zijk10%zdef3%e1%2%7%e8%za*4%aejklo
Public Perceptions of the NHS and Social CareFINAL PUBLIC
Table 223Q41. Please tell me whether on the whole you agree or disagree with each of the following statements:
- It is possible to increase quality of care for patients whilst reducing NHS costs -
Base : All respondents
Respondent type : General public aged 16+ Fieldwork dates : 14th November - 9th December 2011Source : Ipsos MORI (JN10-039262-01)Proportions/Means: Columns Tested (5% risk level) - z/a/b - z/c/d/e/f/g - z/h/i/j/k - z/l/m/n/o - z/pOverlap formulae used. * small base

People aretreated with
Unwtddignity andtotalrespectNHS useHospital useEthnicityNHS/social care staffHousehold TypeHome Ownership
NotAdultshospitalHospitalInformalSocialwith
Non NHS/A&E/A&EsocialcareKnow NHSNHSdependentNon-Owner -PrivateSocialWtd.DisagreeAgreeuserNHS useruseruserMixedWhiteAsianBlackcarerworkerstaffstaffchildrenpensionerPensionerOtheroccupierrenterrenterTotal
(v)(u)(t)(s)(r)(q)(p)(o)(n)(m)(l)(k)(j)(i)(h)(g)(f)(e)(d)(c)(b)(a)(z)100130864710090145854310750741612543628951291461249106491691731001Unweighted Total1001304652104*89746853311**74778*15925038*29252*30547522110**6401781731001Weighted Total
722348764363415758213197213713-4320871Strongly agree7%8%7%6%7%8%6%9%8%7%5%8%9%6%14%7%8%6%-7%11%zac5%7%
412104294443661942162292417291141261413317710122736571410Tend to agree41%34%45%zu42%41%41%41%19%39%53%zn45%36%36%43%hk28%44%37%46%f18%43%37%41%41%fhnu
28589186312581401496221203978138818871435941855049289Tend to disagree28%29%29%29%29%30%28%52%30%26%24%31%33%30%35%29%30%27%40%29%28%28%29%
152647711141599311135324354583979342943026152Strongly disagree15%21%zt12%10%16%13%17%zq10%15%7%20%m17%13%15%14%13%17%15%20%15%17%15%15%mqt
8023471268394016469173145244015246121980Don't know8%8%7%11%8%8%8%10%9%8%5%7%9%5%9%8%8%7%21%7%7%11%8%i
4841273425143023125133494779112171452215421411323158578481Agree48%42%52%zu49%48%49%47%27%47%60%zn50%45%44%50%41%50%45%51%18%49%48%45%48%u
437153263423991982427334257112018133261272219262798075440Disagree44%51%zt40%40%44%42%45%62%45%m32%45%48%47%46%49%41%47%42%60%44%45%43%44%mt
47-2679931328-415218-8-112-428-821-4375341Net agree5%-9%12%zu9%zr4%7%zp2%-35%2%28%zln5%n-3%-3%4%hjk-8%9%zf-2%10%zf-42%6%za3%2%4%fhjknp
ru
Public Perceptions of the NHS and Social CareFINAL PUBLIC
Table 224Q41. Please tell me whether on the whole you agree or disagree with each of the following statements:
- It is possible to increase quality of care for patients whilst reducing NHS costs -
Base : All respondents
Respondent type : General public aged 16+ Fieldwork dates : 14th November - 9th December 2011Source : Ipsos MORI (JN10-039262-01)Proportions/Means: Columns Tested (5% risk level) - z/a/b/c/d - z/e/f/g - z/h/i/j/k - z/l/m/n/o - z/p/q - z/r/s - z/t/u - z/vOverlap formulae used. * small base; ** very small base (under 30) ineligible for sig testing

UnwtdtotalFuture of NHSSatisfaction with NHSGOR
DisYorkshire &WestEastWtd.WorseSameBettersatisfiedSatisfiedHumbersideMidlandsSouth-WestSouth-EastNorth-WestNorth-EastLondonEasternMidlandsTotal
(o)(n)(m)(l)(k)(j)(i)(h)(g)(f)(e)(d)(c)(b)(a)(z)1001328298343168703909910715413955143126881001Unweighted Total1001327302340168701100*106*10216213651*14810986*1001Weighted Total
72322118174728613145810571Strongly agree7%10%zl7%5%10%7%2%7%6%8%10%i10%i5%9%i6%7%
41212212615057307403443736919564036410Tend to agree41%37%42%44%34%44%zk40%32%42%45%h50%zbch38%38%37%41%41%k
285988210050202343631323014543820289Tend to disagree28%30%27%29%30%29%34%ef34%ef31%f20%22%28%36%zaef35%ef23%29%f
1525344513394182014311710151215152Strongly disagree15%16%14%15%19%13%18%18%14%19%c12%20%10%11%18%15%j
80222821125168813721691180Don't know8%7%9%6%7%7%6%8%8%8%5%4%11%8%12%8%
48415414816873354424249868225645140481Agree48%47%49%49%44%51%z42%40%48%53%h61%zabcghi48%43%46%47%48%
43715112615183296525545634725685035440Disagree44%46%42%44%49%42%52%ef52%ef44%39%34%48%46%e46%41%44%e
4732117-958-10-1332336*-41641Net agree5%1%7%zn5%n-5%8%zk-10%-12%3%14%zbcdghi26%zabcdfghi*-3%1%6%bc4%bchikn
Public Perceptions of the NHS and Social CareFINAL PUBLIC
Table 225Q41. Please tell me whether on the whole you agree or disagree with each of the following statements:
- It is possible to increase quality of care for patients whilst reducing NHS costs -
Base : All respondents
Respondent type : General public aged 16+ Fieldwork dates : 14th November - 9th December 2011Source : Ipsos MORI (JN10-039262-01)Proportions/Means: Columns Tested (5% risk level) - z/a/b/c/d/e/f/g/h/i - z/j/k - z/l/m/n - z/oOverlap formulae used. * small base

UnwtdPrivate healthSatisfaction withImpact of NHS reformsGovernment has righttotalinsurancesocial careon patientsNHS policyNHS use in last year
SocialNHSDissatisficareWalk InChoicesPharmacistWtd.
NoYesedSatisfiedWorseBetterDisagreeAgreeservicesClinicwebsite/ChemistNHS DirectA&EOutpatientInpatientGPTotal(r)(q)(p)(o)(n)(m)(l)(k)(j)(i)(h)(g)(f)(e)(d)(c)(b)(a)(z)10018151704424938220040326945182553001772253931967801001Unweighted Total100181117544*24437920139327642*18856*3011832303761927731001Weighted Total
725417624321328193141320191527125971Strongly agree7%7%9%12%10%z8%7%7%7%8%8%23%zabcdefh7%11%6%7%6%8%7%
i
412325781696134111142139197824123799515479315410Tend to agree41%40%45%35%39%35%55%zm36%50%zk44%42%42%41%43%41%41%41%41%41%km
28523849127112044118667431288496110348220289Tend to disagree28%29%28%26%29%32%l22%30%24%18%23%22%29%27%26%27%25%28%29%hjl
152127217347520833083965330416639123152Strongly disagree15%16%12%16%14%20%zl10%21%zj11%18%21%z11%18%16%18%17%20%z16%15%jl
8067104191913232251411651826135680Don't know8%8%6%10%8%5%6%6%8%12%e7%e2%5%3%8%e7%e7%e7%e8%ekm
48437995211201651241691582292371449811018192374481Agree48%47%54%48%49%44%62%zm43%57%zk53%49%65%zabcdfh48%54%48%48%48%48%48%km
437365711910519564201951581191417910216887343440Disagree44%45%40%43%43%51%zl32%51%zj35%36%43%33%47%g43%44%45%45%44%44%jl
471424215-3059-32637111831981353141Net agree5%2%14%zq5%6%-8%30%zm-8%23%zk17%zabcdfh6%f32%zabcdefh1%10%zabcdf3%f3%f3%4%f4%fkmq
Public Perceptions of the NHS and Social CareFINAL PUBLIC
Table 226Q41. Please tell me whether on the whole you agree or disagree with each of the following statements:
- It is possible to increase quality of care for patients whilst reducing NHS costs -
Base : All respondents
Respondent type : General public aged 16+ Fieldwork dates : 14th November - 9th December 2011Source : Ipsos MORI (JN10-039262-01)Proportions/Means: Columns Tested (5% risk level) - z/a/b/c/d/e/f/g/h/i - z/j/k - z/l/m - z/n/o - z/p/q - z/rOverlap formulae used. * small base

UnwtdtotalWork StatusSocial GradeAgeGender
Full/part-Wtd.OtherUnemployedRetiredtimeDEC2C1AB65+55-6435-5425-3416-24FemaleMaleTotal
(p)(o)(n)(m)(l)(k)(j)(i)(h)(g)(f)(e)(d)(c)(b)(a)(z)1001162612705082472013062472201693311581235274741001Unweighted Total100115758*2355512392013122491981433501671435154861001Weighted Total254382070120695369576338774030127120248Strongly agree25%24%34%l30%zl22%29%26%22%23%32%zce27%22%24%21%25%25%25%l
5819529136323137117185144112842069388288296583Tend to agree58%60%50%58%59%57%58%59%58%57%59%59%56%62%56%61%58%
11018616732113413815134627127142113Tend to disagree11%12%10%7%13%zm9%6%13%j15%zjk8%9%13%g16%zg8%14%za9%11%agjm
3121623211117371452151732Strongly disagree3%1%2%2%4%1%6%zk4%3%1%5%4%3%2%3%3%3%k
254371210763526211151126Don't know2%3%5%3%2%4%h4%2%1%3%1%2%1%8%zdefg3%2%3%
83513349207443205170254202175122283133118415416831Agree83%84%84%88%zl80%86%84%82%81%88%zde85%81%79%82%81%86%zb83%bl
14120621962324524518196132148658144Disagree14%13%11%9%17%zm10%12%17%k18%k9%13%17%g19%cg10%17%za12%14%agkm
69411242185347182146202157157103222101104329358687Net agree69%72%73%79%zl63%76%zhi72%h65%63%80%zde72%d63%60%73%d64%74%zb69%bdehl
Public Perceptions of the NHS and Social CareFINAL PUBLIC
Table 227Q42. Please tell me whether on the whole you agree or disagree with each of the following statements:
- GPs are best placed to understand which services their patients need -
Base : All respondents
Respondent type : General public aged 16+ Fieldwork dates : 14th November - 9th December 2011Source : Ipsos MORI (JN10-039262-01)Proportions/Means: Columns Tested (5% risk level) - z/a/b - z/c/d/e/f/g - z/h/i/j/k - z/l/m/n/o - z/pOverlap formulae used. * small base

People aretreated with
Unwtddignity andtotalrespectNHS useHospital useEthnicityNHS/social care staffHousehold TypeHome Ownership
NotAdultshospitalHospitalInformalSocialwith
Non NHS/A&E/A&EsocialcareKnow NHSNHSdependentNon-Owner -PrivateSocialWtd.DisagreeAgreeuserNHS useruseruserMixedWhiteAsianBlackcarerworkerstaffstaffchildrenpensionerPensionerOtheroccupierrenterrenterTotal
(v)(u)(t)(s)(r)(q)(p)(o)(n)(m)(l)(k)(j)(i)(h)(g)(f)(e)(d)(c)(b)(a)(z)100130864710090145854310750741612543628951291461249106491691731001Unweighted Total1001304652104*89746853311**74778*15925038*29252*30547522110**6401781731001Weighted Total25476165162321111374188143970117210761046821564148248Strongly agree25%25%25%15%26%zs24%26%38%25%18%24%28%28%24%20%25%22%31%zf21%24%23%28%25%s
5811613907251228629764265099134211762916929112473789999583Tend to agree58%53%60%u69%zr57%61%56%51%57%64%62%54%55%60%56%55%61%56%71%59%56%57%58%ru
1104762111024864-921292973484550171752018113Tend to disagree11%16%zt9%10%11%10%12%-12%l15%l6%12%17%12%15%15%ze11%8%8%12%11%10%11%elt
311317230922-23-712-8510165-1810332Strongly disagree3%4%3%2%3%2%4%-3%-5%5%-3%9%zi3%3%2%-3%6%z2%3%q
256194221412117255-3-5156-138526Don't know2%2%3%4%2%3%2%10%2%3%3%2%-1%-2%3%3%-2%5%3%3%i
83523755588743397434106156413820432247402443951929535140147831Agree83%78%85%zu84%83%85%81%90%82%82%86%82%83%85%76%80%83%87%g92%84%79%85%83%u
1416078131315887-115121740742135666231933021144Disagree14%20%zt12%12%15%12%16%-15%15%10%16%17%14%24%z18%ze14%10%8%14%17%12%14%et
69417747675612339348105005212116425205271893291699442110127687Net agree69%58%73%zu72%68%72%zp65%90%67%67%76%zn65%66%70%h52%62%69%g77%zfg85%69%62%73%b69%bghnp
u
Public Perceptions of the NHS and Social CareFINAL PUBLIC
Table 228Q42. Please tell me whether on the whole you agree or disagree with each of the following statements:
- GPs are best placed to understand which services their patients need -
Base : All respondents
Respondent type : General public aged 16+ Fieldwork dates : 14th November - 9th December 2011Source : Ipsos MORI (JN10-039262-01)Proportions/Means: Columns Tested (5% risk level) - z/a/b/c/d - z/e/f/g - z/h/i/j/k - z/l/m/n/o - z/p/q - z/r/s - z/t/u - z/vOverlap formulae used. * small base; ** very small base (under 30) ineligible for sig testing

UnwtdtotalFuture of NHSSatisfaction with NHSGOR
DisYorkshire &WestEastWtd.WorseSameBettersatisfiedSatisfiedHumbersideMidlandsSouth-WestSouth-EastNorth-WestNorth-EastLondonEasternMidlandsTotal
(o)(n)(m)(l)(k)(j)(i)(h)(g)(f)(e)(d)(c)(b)(a)(z)1001328298343168703909910715413955143126881001Unweighted Total1001327302340168701100*106*10216213651*14810986*1001Weighted Total25482758041177223124403921222918248Strongly agree25%25%25%24%24%25%22%29%c24%25%c29%c42%zabcfgi15%27%c20%25%c
5811841802008142451546510078231045652583Tend to agree58%56%60%59%48%60%zk51%51%64%d61%d57%45%70%zbdehi52%61%58%dk
11036274833651713715133171510113Tend to disagree11%11%9%14%zm20%zj9%17%g13%7%10%10%7%12%14%11%11%j
311510781783343215232Strongly disagree3%4%3%2%5%2%8%zce3%3%3%2%4%1%5%c3%3%cj
251010451914333143426Don't know2%3%3%1%3%3%1%3%3%2%2%2%2%3%5%3%l
835267255280122601738589140117441268570831Agree83%81%84%82%73%86%zk73%81%87%i86%i86%i87%85%i78%81%83%ik
141513756418225171020166182112144Disagree14%15%12%16%24%zj12%25%zcdefg16%10%12%12%11%12%19%14%14%j
69421621822581519486979120101391086558687Net agree69%66%72%66%48%74%zk48%65%i78%zbhi74%bi75%bi76%bi73%bi59%67%i69%bik
Public Perceptions of the NHS and Social CareFINAL PUBLIC
Table 229Q42. Please tell me whether on the whole you agree or disagree with each of the following statements:
- GPs are best placed to understand which services their patients need -
Base : All respondents
Respondent type : General public aged 16+ Fieldwork dates : 14th November - 9th December 2011Source : Ipsos MORI (JN10-039262-01)Proportions/Means: Columns Tested (5% risk level) - z/a/b/c/d/e/f/g/h/i - z/j/k - z/l/m/n - z/oOverlap formulae used. * small base

UnwtdPrivate healthSatisfaction withImpact of NHS reformsGovernment has righttotalinsurancesocial careon patientsNHS policyNHS use in last year
SocialNHSDissatisficareWalk InChoicesPharmacistWtd.
NoYesedSatisfiedWorseBetterDisagreeAgreeservicesClinicwebsite/ChemistNHS DirectA&EOutpatientInpatientGPTotal(r)(q)(p)(o)(n)(m)(l)(k)(j)(i)(h)(g)(f)(e)(d)(c)(b)(a)(z)10018151704424938220040326945182553001772253931967801001Unweighted Total100181117544*24437920139327642*18856*3011832303761927731001Weighted Total25421038136280581046411471276575410450204248Strongly agree25%26%22%29%26%21%29%m27%23%26%25%22%25%31%zd23%28%26%26%z25%m
58146810420142223113210166171173116092134202101438583Tend to agree58%58%59%45%58%59%56%53%60%41%62%bcefi56%53%50%58%ei54%53%57%i58%cefik
1108526828501857289147452327422988113Tend to disagree11%10%15%17%12%13%9%14%z10%22%zacdh7%13%15%zach13%h12%11%15%h11%11%31273392051884631581117102532Strongly disagree3%3%2%7%4%5%z2%5%3%9%za3%5%5%4%5%4%5%3%3%
252041376491425351131726Don't know2%2%2%2%1%2%3%1%3%k2%2%4%2%2%2%3%1%2%3%k
835678142322043031713142312816444235149188306151642831Agree83%84%81%74%84%80%85%80%83%67%87%bcfi78%78%81%i82%i82%i79%83%fi83%fikm
141112291137692375361320106031385938114144Disagree14%14%17%24%15%18%zl12%19%zj13%31%zacdeh10%18%20%zach17%h16%h16%20%zah15%14%
694566112221672341482401941514434175118150248112529687Net agree69%70%64%50%68%o62%74%m61%70%k37%77%zabcdef60%i58%i65%i65%fi66%bfi59%i68%bfi69%bfikmo
gi
Public Perceptions of the NHS and Social CareFINAL PUBLIC
Table 230Q42. Please tell me whether on the whole you agree or disagree with each of the following statements:
- GPs are best placed to understand which services their patients need -
Base : All respondents
Respondent type : General public aged 16+ Fieldwork dates : 14th November - 9th December 2011Source : Ipsos MORI (JN10-039262-01)Proportions/Means: Columns Tested (5% risk level) - z/a/b/c/d/e/f/g/h/i - z/j/k - z/l/m - z/n/o - z/p/q - z/rOverlap formulae used. * small base

Q.41 It ispossible toQ.37 NHS andQ.36 NHSQ.28
Q.42 GPs areincreaseQ.39 The NHSsocial carewaiting timesQ.34 PeopleQ.32 PeopleBritain'sbest placedquality ofQ.40 The NHSis changingQ.38 The NHSservices workfor non-Q.35 NHShaveare treatedQ.31 PeopleNational
to understandcare foris doingso it canwill face awell togetheremergencyhospitals areincreasingQ.33 The NHSwith dignityare treatedQ.30 If IQ.29 The NHSHealthwhichpatientseverything itprovide thesevereto givetreatment andgettingchoice aboutputs qualityand respectwith dignitywas very illprovides goodService is
serviceswhilstcan to reduceservice wefundingpeople co-care areinfectionstheirat the heartwhen they useand respectI would feelvalue forone of thetheirreducing NHSwaste andneed forproblem inordinatedgettinglike MRSAtreatment andof all itsocial carewhen they usesafe in anmoney tobest in the
patients needcostsinefficiencyyears to comethe futurecareshorterunder controlcaredoesservicesNHS servicesNHS hospitaltaxpayersworld100110011001100110011001100110011001100110011001100110011001Unweighted Total100110011001100110011001100110011001100110011001100110011001Weighted Total248714546422474874878874144275168238Strongly agree25%7%5%5%42%5%5%7%9%9%7%14%28%17%24%
583410386454413398296498543463371507466519486Tend to agree58%41%39%45%41%40%30%50%54%46%37%51%47%52%49%
11328926024971210267178207285196216145153136Tend to disagree11%29%26%25%7%21%27%18%21%28%20%22%14%15%14%321521388515931637648997588827653Strongly disagree3%15%14%9%2%9%16%8%5%10%8%9%8%8%5%
2680172166802522271741156628546328587Don't know3%8%17%17%8%25%23%17%12%7%28%5%3%9%9%
831481431501835445345573630552445652742687724Agree83%48%43%50%83%45%34%57%63%55%45%65%74%69%72%
14444039833486303429255256384271304227229190Disagree14%44%40%33%9%30%43%25%26%38%27%30%23%23%19%
6874133166749142-85318374168175348515459535Net agree69%4%3%17%75%14%-8%32%37%17%17%35%51%46%53%
Public Perceptions of the NHS and Social CareFINAL PUBLIC
Table 231Q28-42. Please tell me whether on the whole you agree or disagree with each of the following statements:
- Summary -
Base : All respondents
Respondent type : General public aged 16+ Fieldwork dates : 14th November - 9th December 2011Source : Ipsos MORI (JN10-039262-01)

UnwtdtotalWork StatusSocial GradeAgeGender
Full/part-Wtd.OtherUnemployedRetiredtimeDEC2C1AB65+55-6435-5425-3416-24FemaleMaleTotal
(p)(o)(n)(m)(l)(k)(j)(i)(h)(g)(f)(e)(d)(c)(b)(a)(z)1001162612705082472013062472201693311581235274741001Unweighted Total100115758*2355512392013122491981433501671435154861001Weighted Total13922619932321465013236029158258140Yes14%14%11%8%17%zm10%10%15%20%zjk7%16%g17%g17%g11%16%12%14%gkm
86213552216457216180266199185120290139128433427861No86%86%89%92%zl83%90%zh90%h85%80%93%zdef84%83%83%89%84%88%86%hl
Public Perceptions of the NHS and Social CareFINAL PUBLIC
Table 232Q43. Have you ever looked for information about how your local healthcare services are performing?
Base : All respondents
Respondent type : General public aged 16+ Fieldwork dates : 14th November - 9th December 2011Source : Ipsos MORI (JN10-039262-01)Proportions/Means: Columns Tested (5% risk level) - z/a/b - z/c/d/e/f/g - z/h/i/j/k - z/l/m/n/o - z/pOverlap formulae used. * small base

People aretreated with
Unwtddignity andtotalrespectNHS useHospital useEthnicityNHS/social care staffHousehold TypeHome Ownership
NotAdultshospitalHospitalInformalSocialwith
Non NHS/A&E/A&EsocialcareKnow NHSNHSdependentNon-Owner -PrivateSocialWtd.DisagreeAgreeuserNHS useruseruserMixedWhiteAsianBlackcarerworkerstaffstaffchildrenpensionerPensionerOtheroccupierrenterrenterTotal
(v)(u)(t)(s)(r)(q)(p)(o)(n)(m)(l)(k)(j)(i)(h)(g)(f)(e)(d)(c)(b)(a)(z)100130864710090145854310750741612543628951291461249106491691731001Unweighted Total1001304652104*89746853311**74778*15925038*29252*30547522110**6401781731001Weighted Total1394789413654861117111158750174579161902326140Yes14%16%14%4%15%zs12%16%zq11%16%zl14%7%23%zi19%17%32%zi15%e17%ze7%10%14%13%15%14%elqs
862256563101760414447106316714819231242352603952059550155147861No86%84%86%96%zr85%88%zp84%89%84%86%93%zn77%81%83%hk68%85%83%93%zfg90%86%87%85%86%fhknp
r
Public Perceptions of the NHS and Social CareFINAL PUBLIC
Table 233Q43. Have you ever looked for information about how your local healthcare services are performing?
Base : All respondents
Respondent type : General public aged 16+ Fieldwork dates : 14th November - 9th December 2011Source : Ipsos MORI (JN10-039262-01)Proportions/Means: Columns Tested (5% risk level) - z/a/b/c/d - z/e/f/g - z/h/i/j/k - z/l/m/n/o - z/p/q - z/r/s - z/t/u - z/vOverlap formulae used. * small base; ** very small base (under 30) ineligible for sig testing

UnwtdtotalFuture of NHSSatisfaction with NHSGOR
DisYorkshire &WestEastWtd.WorseSameBettersatisfiedSatisfiedHumbersideMidlandsSouth-WestSouth-EastNorth-WestNorth-EastLondonEasternMidlandsTotal
(o)(n)(m)(l)(k)(j)(i)(h)(g)(f)(e)(d)(c)(b)(a)(z)1001328298343168703909910715413955143126881001Unweighted Total1001327302340168701100*106*10216213651*14810986*1001Weighted Total1395532513490811823213302016140Yes14%17%m11%15%20%zj13%8%10%8%14%15%6%20%zdghi18%dgi18%dgi14%m
862273270290134612939694139115481188970861No86%83%89%zn85%80%87%k92%abc90%c92%abc86%85%94%abc80%82%82%86%ck
Public Perceptions of the NHS and Social CareFINAL PUBLIC
Table 234Q43. Have you ever looked for information about how your local healthcare services are performing?
Base : All respondents
Respondent type : General public aged 16+ Fieldwork dates : 14th November - 9th December 2011Source : Ipsos MORI (JN10-039262-01)Proportions/Means: Columns Tested (5% risk level) - z/a/b/c/d/e/f/g/h/i - z/j/k - z/l/m/n - z/oOverlap formulae used. * small base

UnwtdPrivate healthSatisfaction withImpact of NHS reformsGovernment has righttotalinsurancesocial careon patientsNHS policyNHS use in last year
SocialNHSDissatisficareWalk InChoicesPharmacistWtd.
NoYesedSatisfiedWorseBetterDisagreeAgreeservicesClinicwebsite/ChemistNHS DirectA&EOutpatientInpatientGPTotal(r)(q)(p)(o)(n)(m)(l)(k)(j)(i)(h)(g)(f)(e)(d)(c)(b)(a)(z)10018151704424938220040326945182553001772253931967801001Unweighted Total100181117544*24437920139327642*18856*3011832303761927731001Weighted Total139115231237683587301034196032356331124140Yes14%14%13%28%zn15%18%z18%22%zj11%25%z18%34%zabcdef20%za17%15%17%z16%16%z14%
h
862696153322073121653062463115437240151195312160649861No86%86%87%72%85%o82%82%78%89%k75%82%g66%80%g83%g85%g83%g84%g84%fg86%acfgikm
o
Public Perceptions of the NHS and Social CareFINAL PUBLIC
Table 235Q43. Have you ever looked for information about how your local healthcare services are performing?
Base : All respondents
Respondent type : General public aged 16+ Fieldwork dates : 14th November - 9th December 2011Source : Ipsos MORI (JN10-039262-01)Proportions/Means: Columns Tested (5% risk level) - z/a/b/c/d/e/f/g/h/i - z/j/k - z/l/m - z/n/o - z/p/q - z/rOverlap formulae used. * small base

UnwtdtotalWork StatusSocial GradeAgeGender
Full/part-Wtd.OtherUnemployedRetiredtimeDEC2C1AB65+55-6435-5425-3416-24FemaleMaleTotal
(p)(o)(n)(m)(l)(k)(j)(i)(h)(g)(f)(e)(d)(c)(b)(a)(z)13923722872322454915275727138158139Unweighted Total13922**6**19**93*23**21**46*50*13**23**60*29**15**82*58*140Weighted Total34624218998551382211334Very easy24%28%27%24%23%34%42%19%17%35%22%22%29%14%25%22%24%68941046792528512261510373269Fairly easy49%40%58%54%49%30%45%54%55%40%55%44%52%63%45%54%49%266-21953910231544171027Fairly difficult19%28%-9%21%23%14%20%19%12%12%25%15%23%21%17%19%10-1263-242261-7310Very difficult7%-15%13%7%13%-5%9%13%7%9%3%-9%5%7%-----------------Don't know-----------------11-----1--1----11Can't remember1%4%-----2%--4%----2%1%
10215614681518333610183923125845102Easy73%68%85%78%72%64%86%73%72%75%77%66%81%77%71%76%73%3661426831214342054241337Difficult26%28%15%22%28%36%14%25%28%25%19%34%19%23%29%22%26%66951042615222271319188343265Net47%40%70%56%45%28%73%47%44%50%59%32%63%54%41%54%47%e
Public Perceptions of the NHS and Social CareFINAL PUBLIC
Table 236Q44. How easy or difficult was it to find this information?
Base : All respondents who have ever looked for information about how their local healthcare services are performing
Respondent type : General public aged 16+ Fieldwork dates : 14th November - 9th December 2011Source : Ipsos MORI (JN10-039262-01)Proportions/Means: Columns Tested (5% risk level) - z/a/b - z/c/d/e/f/g - z/h/i/j/k - z/l/m/n/o - z/pOverlap formulae used. * small base; ** very small base (under 30) ineligible for sig testing

People aretreated with
Unwtddignity andtotalrespectNHS useHospital useEthnicityNHS/social care staffHousehold TypeHome Ownership
NotAdultshospitalHospitalInformalSocialwith
Non NHS/A&E/A&EsocialcareKnow NHSNHSdependentNon-Owner -PrivateSocialWtd.DisagreeAgreeuserNHS useruseruserMixedWhiteAsianBlackcarerworkerstaffstaffchildrenpensionerPensionerOtheroccupierrenterrenterTotal
(v)(u)(t)(s)(r)(q)(p)(o)(n)(m)(l)(k)(j)(i)(h)(g)(f)(e)(d)(c)(b)(a)(z)1394788413552871117111057750174378181922125139Unweighted Total13947*89*4**13654*86*1**11711**11**58*7**50*17**45*79*16**1**90*23**26**140Weighted Total345282321321-275214211412184-225734Very easy24%11%31%zu56%23%23%25%-23%44%18%24%33%23%23%27%22%23%-24%22%27%24%u
68204916826431593625329823387142161069Fairly easy49%42%55%25%50%47%50%100%50%28%52%43%39%58%k47%52%48%44%100%46%69%39%49%261410-271413-2232151937182-192627Fairly difficult19%29%t12%-20%26%15%-19%28%19%26%16%18%20%16%22%15%-21%9%22%19%t
10821928-9-14112253-7-310Very difficult7%17%zt2%19%7%4%9%-7%-11%7%13%2%10%5%6%19%-8%-12%7%it
-----------------------Don't know-----------------------11--1-1-1-------1--1--1Can't remember1%2%--1%-1%-1%-------1%--1%--1%
102257739938641858839540123556111632117102Easy73%52%86%zu81%73%70%75%100%73%72%70%67%72%80%k70%79%71%66%100%70%91%66%73%u
3622121361621-31331921059225-262937Difficult26%46%zt14%19%27%30%24%-26%28%30%33%i28%20%30%21%28%34%-29%9%34%26%t
663642632243155551933072634513719865Net47%7%72%zu61%46%40%51%100%47%45%41%34%44%60%zk40%58%43%33%100%41%81%32%47%ku
Public Perceptions of the NHS and Social CareFINAL PUBLIC
Table 237Q44. How easy or difficult was it to find this information?
Base : All respondents who have ever looked for information about how their local healthcare services are performing
Respondent type : General public aged 16+ Fieldwork dates : 14th November - 9th December 2011Source : Ipsos MORI (JN10-039262-01)Proportions/Means: Columns Tested (5% risk level) - z/a/b/c/d - z/e/f/g - z/h/i/j/k - z/l/m/n/o - z/p/q - z/r/s - z/t/u - z/vOverlap formulae used. * small base; ** very small base (under 30) ineligible for sig testing

UnwtdtotalFuture of NHSSatisfaction with NHSGOR
DisYorkshire &WestEastWtd.WorseSameBettersatisfiedSatisfiedHumbersideMidlandsSouth-WestSouth-EastNorth-WestNorth-EastLondonEasternMidlandsTotal
(o)(n)(m)(l)(k)(j)(i)(h)(g)(f)(e)(d)(c)(b)(a)(z)1395431513489610922213292316139Unweighted Total13955*32*51*34*90*8**11**8**23**21**3**30**20**16**140Weighted Total3414711326-2362-96534Very easy24%26%22%22%8%29%k-21%35%27%10%-30%29%33%24%k
6824172516495448103179869Fairly easy49%45%55%49%47%54%68%37%44%36%49%100%56%46%49%49%2612410111312149-33327Fairly difficult19%22%14%20%34%zj15%16%22%11%19%41%-11%17%18%19%10433421114--12-10Very difficult7%7%9%6%11%2%16%12%10%18%--3%8%-7%j
----------------Don't know----------------1--1---1-------1Can't remember1%--2%---8%-------1%
102392436197556615123261513102Easy73%71%77%72%56%83%zk68%58%79%63%59%100%86%75%82%73%k
3616713151524289-45337Difficult26%29%23%27%44%zj17%32%33%21%37%41%-14%25%18%26%j
6623172346033564322101065Net47%41%54%45%12%66%zk35%25%57%27%18%100%71%51%65%47%k
Public Perceptions of the NHS and Social CareFINAL PUBLIC
Table 238Q44. How easy or difficult was it to find this information?
Base : All respondents who have ever looked for information about how their local healthcare services are performing
Respondent type : General public aged 16+ Fieldwork dates : 14th November - 9th December 2011Source : Ipsos MORI (JN10-039262-01)Proportions/Means: Columns Tested (5% risk level) - z/a/b/c/d/e/f/g/h/i - z/j/k - z/l/m/n - z/oOverlap formulae used. * small base; ** very small base (under 30) ineligible for sig testing

UnwtdPrivate healthSatisfaction withImpact of NHS reformsGovernment has righttotalinsurancesocial careon patientsNHS policyNHS use in last year
SocialNHSDissatisficareWalk InChoicesPharmacistWtd.
NoYesedSatisfiedWorseBetterDisagreeAgreeservicesClinicwebsite/ChemistNHS DirectA&EOutpatientInpatientGPTotal(r)(q)(p)(o)(n)(m)(l)(k)(j)(i)(h)(g)(f)(e)(d)(c)(b)(a)(z)139114221237683587291132195931346631123139Unweighted Total13911523**12**37*68*35*87*30**10**34*19**60*32*35*63*31*124140Weighted Total3430211012161712483136101782934Very easy24%26%9%7%26%18%45%zm20%40%35%25%14%21%18%28%27%26%24%24%685412518341245125181030161730156269Fairly easy49%48%55%43%47%50%35%51%40%45%54%53%49%49%49%48%48%50%49%2622539163204-4412103952427Fairly difficult19%19%23%24%25%24%9%23%13%-12%22%19%30%cd8%15%17%19%19%107331646223261463910Very difficult7%6%13%26%2%8%12%7%7%20%9%11%10%4%12%9%9%7%7%-------------------Don't know-------------------11------------11--1Can't remember1%1%------------3%1%--1%
10285156274628622482613432127472391102Easy73%74%65%50%73%68%79%71%80%80%79%67%71%66%77%75%74%73%73%36298610227256276181171583337Difficult26%25%35%50%27%32%21%29%20%20%21%33%29%34%20%24%26%27%26%66567*1724213618619725102032155865Net47%49%29%-1%45%36%59%m42%59%59%57%e34%42%32%57%e51%e48%47%47%m
Public Perceptions of the NHS and Social CareFINAL PUBLIC
Table 239Q44. How easy or difficult was it to find this information?
Base : All respondents who have ever looked for information about how their local healthcare services are performing
Respondent type : General public aged 16+ Fieldwork dates : 14th November - 9th December 2011Source : Ipsos MORI (JN10-039262-01)Proportions/Means: Columns Tested (5% risk level) - z/a/b/c/d/e/f/g/h/i - z/j/k - z/l/m - z/n/o - z/p/q - z/rOverlap formulae used. * small base; ** very small base (under 30) ineligible for sig testing

UnwtdtotalWork StatusSocial GradeAgeGender
Full/part-Wtd.OtherUnemployedRetiredtimeDEC2C1AB65+55-6435-5425-3416-24FemaleMaleTotal
(p)(o)(n)(m)(l)(k)(j)(i)(h)(g)(f)(e)(d)(c)(b)(a)(z)1001162612705082472013062472201693311581235274741001Unweighted Total100115758*2355512392013122491981433501671435154861001Weighted Total
62651733912172312827112362561Yes6%4%8%7%6%4%6%5%9%zk6%c6%8%c6%c2%7%5%6%c
93915154218517230190295226186135322157141479461940No94%96%92%93%94%96%h94%95%91%94%94%92%94%98%zdeg93%95%94%h
Public Perceptions of the NHS and Social CareFINAL PUBLIC
Table 240Q45. Have you ever tried to get involved in decisions about how healthcare services are provided in your local area?
Base : All respondents
Respondent type : General public aged 16+ Fieldwork dates : 14th November - 9th December 2011Source : Ipsos MORI (JN10-039262-01)Proportions/Means: Columns Tested (5% risk level) - z/a/b - z/c/d/e/f/g - z/h/i/j/k - z/l/m/n/o - z/pOverlap formulae used. * small base

People aretreated with
Unwtddignity andtotalrespectNHS useHospital useEthnicityNHS/social care staffHousehold TypeHome Ownership
NotAdultshospitalHospitalInformalSocialwith
Non NHS/A&E/A&EsocialcareKnow NHSNHSdependentNon-Owner -PrivateSocialWtd.DisagreeAgreeuserNHS useruseruserMixedWhiteAsianBlackcarerworkerstaffstaffchildrenpensionerPensionerOtheroccupierrenterrenterTotal
(v)(u)(t)(s)(r)(q)(p)(o)(n)(m)(l)(k)(j)(i)(h)(g)(f)(e)(d)(c)(b)(a)(z)100130864710090145854310750741612543628951291461249106491691731001Unweighted Total1001304652104*89746853311**74778*15925038*29252*30547522110**6401781731001Weighted Total
6230283582140-504531825918291414091161Yes6%10%zt4%3%6%4%8%zq-7%5%3%13%z22%zi9%z17%zi6%6%6%8%6%5%6%6%qt
939273623101839448493116987415421830267432874462079600169162940No94%90%96%zu97%94%96%zp92%100%93%95%97%87%78%91%hj83%94%94%94%92%94%95%94%94%hijkp
u
Public Perceptions of the NHS and Social CareFINAL PUBLIC
Table 241Q45. Have you ever tried to get involved in decisions about how healthcare services are provided in your local area?
Base : All respondents
Respondent type : General public aged 16+ Fieldwork dates : 14th November - 9th December 2011Source : Ipsos MORI (JN10-039262-01)Proportions/Means: Columns Tested (5% risk level) - z/a/b/c/d - z/e/f/g - z/h/i/j/k - z/l/m/n/o - z/p/q - z/r/s - z/t/u - z/vOverlap formulae used. * small base; ** very small base (under 30) ineligible for sig testing

UnwtdtotalFuture of NHSSatisfaction with NHSGOR
DisYorkshire &WestEastWtd.WorseSameBettersatisfiedSatisfiedHumbersideMidlandsSouth-WestSouth-EastNorth-WestNorth-EastLondonEasternMidlandsTotal
(o)(n)(m)(l)(k)(j)(i)(h)(g)(f)(e)(d)(c)(b)(a)(z)1001328298343168703909910715413955143126881001Unweighted Total1001327302340168701100*106*10216213651*14810986*1001Weighted Total
622193013374661510358561Yes6%6%m3%9%zm8%5%4%5%5%9%7%7%3%7%5%6%m
93930729331015566596100971471264814310181940No94%94%97%zln91%92%95%96%95%95%91%93%93%97%93%95%94%l
Public Perceptions of the NHS and Social CareFINAL PUBLIC
Table 242Q45. Have you ever tried to get involved in decisions about how healthcare services are provided in your local area?
Base : All respondents
Respondent type : General public aged 16+ Fieldwork dates : 14th November - 9th December 2011Source : Ipsos MORI (JN10-039262-01)Proportions/Means: Columns Tested (5% risk level) - z/a/b/c/d/e/f/g/h/i - z/j/k - z/l/m/n - z/oOverlap formulae used. * small base

UnwtdPrivate healthSatisfaction withImpact of NHS reformsGovernment has righttotalinsurancesocial careon patientsNHS policyNHS use in last year
SocialNHSDissatisficareWalk InChoicesPharmacistWtd.
NoYesedSatisfiedWorseBetterDisagreeAgreeservicesClinicwebsite/ChemistNHS DirectA&EOutpatientInpatientGPTotal(r)(q)(p)(o)(n)(m)(l)(k)(j)(i)(h)(g)(f)(e)(d)(c)(b)(a)(z)10018151704424938220040326945182553001772253931967801001Unweighted Total100181117544*24437920139327642*18856*3011832303761927731001Weighted Total
625011618409378518522172031154861Yes6%6%6%14%z7%11%zl5%10%zj3%13%9%z9%7%9%9%8%z8%6%6%j
939761164382263391923562683617051278166210345177724940No94%94%94%86%93%89%95%m90%97%zk87%91%91%93%91%91%92%92%94%94%chkmo
Public Perceptions of the NHS and Social CareFINAL PUBLIC
Table 243Q45. Have you ever tried to get involved in decisions about how healthcare services are provided in your local area?
Base : All respondents
Respondent type : General public aged 16+ Fieldwork dates : 14th November - 9th December 2011Source : Ipsos MORI (JN10-039262-01)Proportions/Means: Columns Tested (5% risk level) - z/a/b/c/d/e/f/g/h/i - z/j/k - z/l/m - z/n/o - z/p/q - z/rOverlap formulae used. * small base

UnwtdtotalWork StatusSocial GradeAgeGender
Full/part-Wtd.OtherUnemployedRetiredtimeDEC2C1AB65+55-6435-5425-3416-24FemaleMaleTotal
(p)(o)(n)(m)(l)(k)(j)(i)(h)(g)(f)(e)(d)(c)(b)(a)(z)6265203110111823141026102372562Unweighted Total62*6**5**17**33*9**12**17**23**12**8**27**11**2**36*25**61*Weighted Total81-342123224--538Very easy
13%16%-16%12%20%11%11%12%15%20%15%--14%11%13%2741715231012451142141327Fairly easy44%68%21%39%46%20%30%58%51%35%61%40%41%100%39%51%44%17125833464273-12416Fairly difficult27%16%40%29%25%30%25%25%27%34%18%26%31%-34%16%26%10-23634122-53-5510Very difficult16%-39%17%17%31%35%6%10%16%-19%28%-13%22%17%
-----------------Don't know----------------------------------Can't remember-----------------
3551919451214671542191535Easy56%84%21%55%58%39%41%69%63%50%82%55%41%100%53%62%57%2714814675862126-17926Difficult44%16%79%45%42%61%59%31%37%50%18%45%59%-47%38%43%
84-325-2-276*53-22268Net13%68%-59%9%16%-21%-19%38%26%*63%10%-18%100%6%25%14%b
Public Perceptions of the NHS and Social CareFINAL PUBLIC
Table 244Q46. How easy or difficult did you find it to get involved in decisions about how healthcare services are provided in your local area?
Base : All respondents who have ever tried to get involved in decisions about how healthcare services are provided in their area
Respondent type : General public aged 16+ Fieldwork dates : 14th November - 9th December 2011Source : Ipsos MORI (JN10-039262-01)Proportions/Means: Columns Tested (5% risk level) - z/a/b - z/c/d/e/f/g - z/h/i/j/k - z/l/m/n/o - z/pOverlap formulae used. * small base; ** very small base (under 30) ineligible for sig testing

People aretreated with
Unwtddignity andtotalrespectNHS useHospital useEthnicityNHS/social care staffHousehold TypeHome Ownership
NotAdultshospitalHospitalInformalSocialwith
Non NHS/A&E/A&EsocialcareKnow NHSNHSdependentNon-Owner -PrivateSocialWtd.DisagreeAgreeuserNHS useruseruserMixedWhiteAsianBlackcarerworkerstaffstaffchildrenpensionerPensionerOtheroccupierrenterrenterTotal
(v)(u)(t)(s)(r)(q)(p)(o)(n)(m)(l)(k)(j)(i)(h)(g)(f)(e)(d)(c)(b)(a)(z)6231293592042-504632827918281614281162Unweighted Total62*30*28**3**58*21**40*-**50*4**5**31*8**25**9**18**29**14**1**40*9**11**61*Weighted Total834-826-6116124332-6118Very easy
13%10%13%-13%9%14%-12%21%17%18%15%7%40%16%10%13%-14%12%9%13%278182251017-211312314381361165427Fairly easy44%26%63%64%43%49%42%-43%29%65%38%38%56%35%42%46%44%100%40%63%40%44%u
17106-16511-142-7272754-112316Fairly difficult27%34%20%-28%25%27%-28%50%-24%21%29%25%38%18%29%-28%25%26%26%10911937-8-1622-172-7-310Very difficult16%30%z4%36%16%16%17%-17%-17%20%27%8%-5%25%14%-18%-26%17%
-----------------------Don't know----------------------------------------------Can't remember-----------------------
3511212331223-2724184167111681226535Easy56%36%76%64%56%58%56%-55%50%83%57%52%63%75%58%56%57%100%54%75%49%57%u
27197125918-2221144928126-182626Difficult44%64%z24%36%44%42%44%-45%50%17%43%48%37%25%42%44%43%-46%25%51%43%
8-815173505*34*75342144*8Net13%-28%52%28%13%17%12%0%10%-1%65%13%4%27%50%15%13%14%100%9%50%-3%14%
Public Perceptions of the NHS and Social CareFINAL PUBLIC
Table 245Q46. How easy or difficult did you find it to get involved in decisions about how healthcare services are provided in your local area?
Base : All respondents who have ever tried to get involved in decisions about how healthcare services are provided in their area
Respondent type : General public aged 16+ Fieldwork dates : 14th November - 9th December 2011Source : Ipsos MORI (JN10-039262-01)Proportions/Means: Columns Tested (5% risk level) - z/a/b/c/d - z/e/f/g - z/h/i/j/k - z/l/m/n/o - z/p/q - z/r/s - z/t/u - z/vOverlap formulae used. * small base; ** very small base (under 30) ineligible for sig testing

UnwtdtotalFuture of NHSSatisfaction with NHSGOR
DisYorkshire &WestEastWtd.WorseSameBettersatisfiedSatisfiedHumbersideMidlandsSouth-WestSouth-EastNorth-WestNorth-EastLondonEasternMidlandsTotal
(o)(n)(m)(l)(k)(j)(i)(h)(g)(f)(e)(d)(c)(b)(a)(z)622093213374561410459562Unweighted Total62*21**9**30*13**37*4**6**6**15**10**3**5**8**5**61*Weighted Total82152311-3--1118Very easy
13%11%11%15%13%8%21%21%-19%--18%13%19%13%27751452024363323227Fairly easy44%34%61%45%42%54%57%62%52%44%27%76%40%33%39%44%17619212--244113116Fairly difficult27%31%8%30%14%32%--32%30%40%24%22%43%18%26%105234211113-11110Very difficult16%25%21%10%31%6%22%17%16%8%33%-19%11%24%17%j
----------------Don't know--------------------------------Can't remember----------------
35961872235393333335Easy56%44%71%60%55%61%78%83%52%62%27%76%59%46%58%57%271221261411367124226Difficult44%56%29%40%45%39%22%17%48%38%73%24%41%54%42%43%
8-2461824*4-421-118Net13%-11%43%20%10%23%z55%66%4%25%-45%53%18%-8%16%14%
Public Perceptions of the NHS and Social CareFINAL PUBLIC
Table 246Q46. How easy or difficult did you find it to get involved in decisions about how healthcare services are provided in your local area?
Base : All respondents who have ever tried to get involved in decisions about how healthcare services are provided in their area
Respondent type : General public aged 16+ Fieldwork dates : 14th November - 9th December 2011Source : Ipsos MORI (JN10-039262-01)Proportions/Means: Columns Tested (5% risk level) - z/a/b/c/d/e/f/g/h/i - z/j/k - z/l/m/n - z/oOverlap formulae used. * small base; ** very small base (under 30) ineligible for sig testing

UnwtdPrivate healthSatisfaction withImpact of NHS reformsGovernment has righttotalinsurancesocial careon patientsNHS policyNHS use in last year
SocialNHSDissatisficareWalk InChoicesPharmacistWtd.
NoYesedSatisfiedWorseBetterDisagreeAgreeservicesClinicwebsite/ChemistNHS DirectA&EOutpatientInpatientGPTotal(r)(q)(p)(o)(n)(m)(l)(k)(j)(i)(h)(g)(f)(e)(d)(c)(b)(a)(z)
625111618409388617523172033155062Unweighted Total62*50*11**6**18**40*9**37*8**5**18**5**22**17**20**31*15**48*61*Weighted Total8621352511215235358Very easy
13%12%17%14%18%11%24%13%12%17%12%16%22%11%16%16%21%10%13%272341719317511027691472127Fairly easy44%46%34%15%41%46%31%45%63%17%54%38%30%37%44%44%46%42%44%171243311-11-152964941416Fairly difficult27%24%38%51%15%27%-29%-16%28%45%39%35%20%28%27%29%26%109115645231-23441910Very difficult16%18%11%20%26%15%45%14%25%49%6%-8%18%20%12%6%19%17%
-------------------Don't know--------------------------------------Can't remember-------------------
3529621123522621231281219102535Easy56%58%51%29%59%58%55%58%75%35%65%55%52%48%60%60%67%52%57%272154717416246211981252326Difficult44%42%49%71%41%42%45%42%25%65%35%45%48%52%40%40%33%48%43%
88*-336164-25*1-146528Net13%16%2%-42%17%15%10%15%49%-30%30%9%5%-5%19%20%a34%4%14%a
Public Perceptions of the NHS and Social CareFINAL PUBLIC
Table 247Q46. How easy or difficult did you find it to get involved in decisions about how healthcare services are provided in your local area?
Base : All respondents who have ever tried to get involved in decisions about how healthcare services are provided in their area
Respondent type : General public aged 16+ Fieldwork dates : 14th November - 9th December 2011Source : Ipsos MORI (JN10-039262-01)Proportions/Means: Columns Tested (5% risk level) - z/a/b/c/d/e/f/g/h/i - z/j/k - z/l/m - z/n/o - z/p/q - z/rOverlap formulae used. * small base; ** very small base (under 30) ineligible for sig testing

UnwtdtotalWork StatusSocial GradeAgeGender
Full/part-Wtd.OtherUnemployedRetiredtimeDEC2C1AB65+55-6435-5425-3416-24FemaleMaleTotal
(p)(o)(n)(m)(l)(k)(j)(i)(h)(g)(f)(e)(d)(c)(b)(a)(z)1001162612705082472013062472201693311581235274741001Unweighted Total100115758*2355512392013122491981433501671435154861001Weighted Total4745427117287109110142126106731617076-486486Male47%35%47%50%o52%zo45%55%i45%50%53%d51%46%42%53%-100%zb49%bo
527103311182641309117012492701889867515-515Female53%65%zlm53%50%48%55%45%55%j50%47%49%54%58%g47%100%za-51%al
Public Perceptions of the NHS and Social CareFINAL PUBLIC
Table 248Gender
Base : All respondents
Respondent type : General public aged 16+ Fieldwork dates : 14th November - 9th December 2011Source : Ipsos MORI (JN10-039262-01)Proportions/Means: Columns Tested (5% risk level) - z/a/b - z/c/d/e/f/g - z/h/i/j/k - z/l/m/n/o - z/pOverlap formulae used. * small base

People aretreated with
Unwtddignity andtotalrespectNHS useHospital useEthnicityNHS/social care staffHousehold TypeHome Ownership
NotAdultshospitalHospitalInformalSocialwith
Non NHS/A&E/A&EsocialcareKnow NHSNHSdependentNon-Owner -PrivateSocialWtd.DisagreeAgreeuserNHS useruseruserMixedWhiteAsianBlackcarerworkerstaffstaffchildrenpensionerPensionerOtheroccupierrenterrenterTotal
(v)(u)(t)(s)(r)(q)(p)(o)(n)(m)(l)(k)(j)(i)(h)(g)(f)(e)(d)(c)(b)(a)(z)100130864710090145854310750741612543628951291461249106491691731001Unweighted Total1001304652104*89746853311**74778*15925038*29252*30547522110**6401781731001Weighted Total4741233387141525223343584477114121371712125610883189168486Male47%40%52%zu68%zr46%54%zp44%41%48%56%48%46%32%47%h32%40%54%zg49%g82%50%a51%a40%49%aghjp
ru
52718131434482216299639034821352615635184219113232287104515Female53%60%zt48%32%54%zs46%56%zq59%52%44%52%54%68%z53%68%zi60%zef46%51%18%50%49%60%zbc51%fqst
Public Perceptions of the NHS and Social CareFINAL PUBLIC
Table 249Gender
Base : All respondents
Respondent type : General public aged 16+ Fieldwork dates : 14th November - 9th December 2011Source : Ipsos MORI (JN10-039262-01)Proportions/Means: Columns Tested (5% risk level) - z/a/b/c/d - z/e/f/g - z/h/i/j/k - z/l/m/n/o - z/p/q - z/r/s - z/t/u - z/vOverlap formulae used. * small base; ** very small base (under 30) ineligible for sig testing

UnwtdtotalFuture of NHSSatisfaction with NHSGOR
DisYorkshire &WestEastWtd.WorseSameBettersatisfiedSatisfiedHumbersideMidlandsSouth-WestSouth-EastNorth-WestNorth-EastLondonEasternMidlandsTotal
(o)(n)(m)(l)(k)(j)(i)(h)(g)(f)(e)(d)(c)(b)(a)(z)1001328298343168703909910715413955143126881001Unweighted Total1001327302340168701100*106*10216213651*14810986*1001Weighted Total47414715816774350485049746323755747486Male47%45%52%49%44%50%48%47%48%46%47%44%51%52%54%49%
52718014417394351525653887329735239515Female53%55%48%51%56%50%52%53%52%54%53%56%49%48%46%51%
Public Perceptions of the NHS and Social CareFINAL PUBLIC
Table 250Gender
Base : All respondents
Respondent type : General public aged 16+ Fieldwork dates : 14th November - 9th December 2011Source : Ipsos MORI (JN10-039262-01)Proportions/Means: Columns Tested (5% risk level) - z/a/b/c/d/e/f/g/h/i - z/j/k - z/l/m/n - z/oOverlap formulae used. * small base

UnwtdPrivate healthSatisfaction withImpact of NHS reformsGovernment has righttotalinsurancesocial careon patientsNHS policyNHS use in last year
SocialNHSDissatisficareWalk InChoicesPharmacistWtd.
NoYesedSatisfiedWorseBetterDisagreeAgreeservicesClinicwebsite/ChemistNHS DirectA&EOutpatientInpatientGPTotal(r)(q)(p)(o)(n)(m)(l)(k)(j)(i)(h)(g)(f)(e)(d)(c)(b)(a)(z)10018151704424938220040326945182553001772253931967801001Unweighted Total100181117544*24437920139327642*18856*3011832303761927731001Weighted Total4744027719109179971841411880151197011015885353486Male47%50%44%43%45%47%48%47%51%43%43%g26%39%g39%48%efg42%g45%g46%efg49%acefg
52740998251352001032091352410842182112120218106420515Female53%50%56%57%55%53%52%53%49%57%57%74%zabcdfh61%zad61%zad52%58%z55%54%z51%
Public Perceptions of the NHS and Social CareFINAL PUBLIC
Table 251Gender
Base : All respondents
Respondent type : General public aged 16+ Fieldwork dates : 14th November - 9th December 2011Source : Ipsos MORI (JN10-039262-01)Proportions/Means: Columns Tested (5% risk level) - z/a/b/c/d/e/f/g/h/i - z/j/k - z/l/m - z/n/o - z/p/q - z/rOverlap formulae used. * small base

UnwtdtotalWork StatusSocial GradeAgeGender
Full/part-Wtd.OtherUnemployedRetiredtimeDEC2C1AB65+55-6435-5425-3416-24FemaleMaleTotal
(p)(o)(n)(m)(l)(k)(j)(i)(h)(g)(f)(e)(d)(c)(b)(a)(z)1001162612705082472013062472201693311581235274741001Unweighted Total100115758*2355512392013122491981433501671435154861001Weighted Total123601616540315219----143677614316-2412%38%zlm28%zlm*12%m17%h15%h17%h8%----100%zdefg13%16%14%defghlm
1582912-12638326335---167-987016725-3416%19%m21%m-23%zm16%16%20%14%---100%zcefg-19%z14%17%cefgm
1672411214034235566--177--1067117735-4417%15%m19%m1%25%zmo14%11%18%26%zijk--51%zcdfg--21%za15%18%acdfgjm
1642011114135365448--172--829117245-5416%12%m19%m*26%zmo14%18%17%19%--49%zcdfg--16%19%17%cdfgm
74122104112172115-64---34316455-597%8%3%4%7%5%8%7%6%-45%zcdeg---7%6%6%cdeg
9596392515242416-79---36427960-649%6%10%16%zlo5%6%12%zhk8%6%-55%zcdeg---7%9%8%cdegl
1453-1181038272738131----696213165-7414%2%-50%zlno2%16%i13%9%15%i66%zcdef----13%13%13%cdefilno
75--6522711161267----23446775+7%--28%zlno*11%zhij6%5%5%34%zcdef----4%9%zb7%bcdeflno
-----------------Refused-----------------
Public Perceptions of the NHS and Social CareFINAL PUBLIC
Table 252Age
Base : All respondents
Respondent type : General public aged 16+ Fieldwork dates : 14th November - 9th December 2011Source : Ipsos MORI (JN10-039262-01)Proportions/Means: Columns Tested (5% risk level) - z/a/b - z/c/d/e/f/g - z/h/i/j/k - z/l/m/n/o - z/pOverlap formulae used. * small base

People aretreated with
Unwtddignity andtotalrespectNHS useHospital useEthnicityNHS/social care staffHousehold TypeHome Ownership
NotAdultshospitalHospitalInformalSocialwith
Non NHS/A&E/A&EsocialcareKnow NHSNHSdependentNon-Owner -PrivateSocialWtd.DisagreeAgreeuserNHS useruseruserMixedWhiteAsianBlackcarerworkerstaffstaffchildrenpensionerPensionerOtheroccupierrenterrenterTotal
(v)(u)(t)(s)(r)(q)(p)(o)(n)(m)(l)(k)(j)(i)(h)(g)(f)(e)(d)(c)(b)(a)(z)100130864710090145854310750741612543628951291461249106491691731001Unweighted Total1001304652104*89746853311**74778*15925038*29252*30547522110**6401781731001Weighted Total12326108181257766396202327345348941563443114316-2412%9%17%zu18%14%16%12%30%13%26%zln14%11%7%15%h5%16%e20%ze*45%10%25%zc18%c14%cehnu
1584012319148769221132032321149984794175583316725-3416%13%19%zu19%16%16%17%22%15%26%zn20%13%28%k17%16%28%zef17%e2%10%12%33%zac19%c17%cekn
167571121815993842123173448135915102741-112343217735-4417%19%17%17%18%20%16%20%16%22%21%19%33%zk20%29%z33%zef16%e*-17%19%18%18%e
164641012015290832132102756458136111011120183417245-5416%21%zt15%19%17%19%16%19%18%13%17%23%z11%20%26%20%e23%ze1%10%19%b10%20%b17%bet
7436279552737-533620218745731457116455-597%12%zt4%9%6%6%7%-7%4%4%8%5%6%12%1%12%zeg2%10%7%4%6%6%egt
9522519703148-61216214193451241588137960-649%7%8%8%8%7%9%-8%2%10%m9%9%7%6%1%11%zg11%zg8%9%b4%7%8%bg
145428471234882111151334333229120111351213165-7414%14%13%7%14%10%15%zq9%15%zlm6%8%13%h7%11%3%1%2%54%zfg8%18%zab3%7%13%abfghl
q
7516464642641-581812-121-166154486775+7%5%7%4%7%6%8%-8%zm1%5%5%-4%2%-*30%zfg10%8%zb2%4%7%bfgim
-----------------------Refused-----------------------
Public Perceptions of the NHS and Social CareFINAL PUBLIC
Table 253Age
Base : All respondents
Respondent type : General public aged 16+ Fieldwork dates : 14th November - 9th December 2011Source : Ipsos MORI (JN10-039262-01)Proportions/Means: Columns Tested (5% risk level) - z/a/b/c/d - z/e/f/g - z/h/i/j/k - z/l/m/n/o - z/p/q - z/r/s - z/t/u - z/vOverlap formulae used. * small base; ** very small base (under 30) ineligible for sig testing

UnwtdtotalFuture of NHSSatisfaction with NHSGOR
DisYorkshire &WestEastWtd.WorseSameBettersatisfiedSatisfiedHumbersideMidlandsSouth-WestSouth-EastNorth-WestNorth-EastLondonEasternMidlandsTotal
(o)(n)(m)(l)(k)(j)(i)(h)(g)(f)(e)(d)(c)(b)(a)(z)1001328298343168703909910715413955143126881001Unweighted Total1001327302340168701100*106*10216213651*14810986*1001Weighted Total1235145421211116111317221226141314316-2412%15%15%12%7%16%zk16%11%12%10%16%23%fh17%13%15%14%k
158456056291171812142425641131316725-3416%14%20%n17%17%17%18%11%14%15%18%11%28%zabdfgh12%15%17%
167585758361121917213416830191217735-4417%18%19%17%22%16%19%16%21%21%e12%16%20%18%14%18%j
1646049603211016162129201023191817245-5416%18%16%18%19%16%16%15%21%18%14%20%16%18%21%17%j
74241724163868612818796455-597%7%6%7%10%j5%6%8%6%7%6%2%5%6%11%d6%j
9530133416545127618481087960-649%9%m4%10%m10%8%5%11%f7%4%13%zcf7%5%9%10%8%fm
1453734542110112211526217615913165-7414%11%11%16%12%14%12%c20%zc14%c16%c15%c14%c4%14%c11%c13%c
75232813658986146361136775+7%7%9%zl4%3%8%zk9%7%6%9%5%6%4%10%4%7%kl
----------------Refused----------------
Public Perceptions of the NHS and Social CareFINAL PUBLIC
Table 254Age
Base : All respondents
Respondent type : General public aged 16+ Fieldwork dates : 14th November - 9th December 2011Source : Ipsos MORI (JN10-039262-01)Proportions/Means: Columns Tested (5% risk level) - z/a/b/c/d/e/f/g/h/i - z/j/k - z/l/m/n - z/oOverlap formulae used. * small base

UnwtdPrivate healthSatisfaction withImpact of NHS reformsGovernment has righttotalinsurancesocial careon patientsNHS policyNHS use in last year
SocialNHSDissatisficareWalk InChoicesPharmacistWtd.
NoYesedSatisfiedWorseBetterDisagreeAgreeservicesClinicwebsite/ChemistNHS DirectA&EOutpatientInpatientGPTotal(r)(q)(p)(o)(n)(m)(l)(k)(j)(i)(h)(g)(f)(e)(d)(c)(b)(a)(z)10018151704424938220040326945182553001772253931967801001Unweighted Total100181117544*24437920139327642*18856*3011832303761927731001Weighted Total12312613530383720644346372647302210014316-2412%16%zp7%11%12%10%18%m5%23%zk10%18%abcf11%12%c14%c20%zabcef8%12%13%c14%ackmp
158129383375933485133415585046494512616725-3416%16%21%7%15%16%17%12%18%k7%18%26%ci19%ci27%zacdfhi20%ci13%23%zaci16%c17%ck
1671225113427133824454915624241562313917735-4417%15%29%zq28%17%19%16%21%z16%13%26%zabcd26%bc21%bc23%bc18%b15%12%18%bc18%bq
164140311037743681328296513138612713417245-5416%17%18%24%15%19%18%21%zj11%19%16%11%17%17%16%16%14%17%17%j
7449153182812411451051810113310496455-597%6%9%6%7%7%6%11%zj5%12%5%8%6%5%5%9%zabd5%6%6%
9568922342942144142249154217657960-649%8%5%5%9%11%zl4%11%zj5%10%7%4%8%5%6%11%zade9%8%8%l
14511614739492457315117321224692610513165-7414%14%zp8%16%16%13%12%14%11%11%6%12%11%h7%10%18%zabdefh13%eh14%eh13%ehp
7561511819172126861183103522546775+7%7%zp3%2%8%5%8%5%9%19%zacdefgh3%1%6%e2%4%9%zadefgh11%zadefgh7%eh7%ehp
-------------------Refused-------------------
Public Perceptions of the NHS and Social CareFINAL PUBLIC
Table 255Age
Base : All respondents
Respondent type : General public aged 16+ Fieldwork dates : 14th November - 9th December 2011Source : Ipsos MORI (JN10-039262-01)Proportions/Means: Columns Tested (5% risk level) - z/a/b/c/d/e/f/g/h/i - z/j/k - z/l/m - z/n/o - z/p/q - z/rOverlap formulae used. * small base

UnwtdtotalWork StatusSocial GradeAgeGender
Full/part-Wtd.OtherUnemployedRetiredtimeDEC2C1AB65+55-6435-5425-3416-24FemaleMaleTotal
(p)(o)(n)(m)(l)(k)(j)(i)(h)(g)(f)(e)(d)(c)(b)(a)(z)1001162612705082472013062472201693311581235274741001Unweighted Total100115758*2355512392013122491981433501671435154861001Weighted Total
313-918---3094161-161430A3%2%-4%3%---12%zijk4%cd3%c5%cd1%-3%3%3%ijk
21621346149---2194226983419108111219B22%14%5%20%n27%zmno---88%zijk21%18%28%zcf20%14%21%23%22%cijkno
306421159201--312-43451086352170142312C131%27%18%25%36%zmno--100%zhjk-22%31%g31%g37%g37%g33%29%31%ghjkmn
20124846124-201--384159323191110201C220%15%13%20%22%o-100%zhik--19%29%zdeg17%19%22%18%23%20%bhik
1263193156127---25133826256859127D13%20%zl16%13%10%53%zhij---13%9%11%16%17%f13%12%13%hijl
1213728443112---41143011156350112E12%23%zl48%zlmo19%zl1%47%zhij---21%zcdef10%9%7%11%12%10%11%dhijl
Public Perceptions of the NHS and Social CareFINAL PUBLIC
Table 256Social grade
Base : All respondents
Respondent type : General public aged 16+ Fieldwork dates : 14th November - 9th December 2011Source : Ipsos MORI (JN10-039262-01)Proportions/Means: Columns Tested (5% risk level) - z/a/b - z/c/d/e/f/g - z/h/i/j/k - z/l/m/n/o - z/pOverlap formulae used. * small base

People aretreated with
Unwtddignity andtotalrespectNHS useHospital useEthnicityNHS/social care staffHousehold TypeHome Ownership
NotAdultshospitalHospitalInformalSocialwith
Non NHS/A&E/A&EsocialcareKnow NHSNHSdependentNon-Owner -PrivateSocialWtd.DisagreeAgreeuserNHS useruseruserMixedWhiteAsianBlackcarerworkerstaffstaffchildrenpensionerPensionerOtheroccupierrenterrenterTotal
(v)(u)(t)(s)(r)(q)(p)(o)(n)(m)(l)(k)(j)(i)(h)(g)(f)(e)(d)(c)(b)(a)(z)100130864710090145854310750741612543628951291461249106491691731001Unweighted Total1001304652104*89746853311**74778*15925038*29252*30547522110**6401781731001Weighted Total
31921327191112521811221299-273-30A3%3%3%3%3%4%2%10%3%3%1%3%2%4%5%4%2%4%-4%za2%-3%afl
21668139192009912041751920709742080914711812413219B22%22%21%18%22%21%23%38%23%l25%l12%28%z23%25%38%z26%zf19%21%10%28%zab13%8%22%abl
306992063727515216022322155691610424861705671857148312C131%33%32%35%31%32%30%21%31%27%34%27%42%36%k46%zk28%36%zeg25%70%29%40%zac28%31%ce
20164125331699610621501038501057563984011422929201C220%21%19%31%zr19%20%20%20%20%12%24%m20%26%h20%10%21%21%18%10%22%z16%17%20%r
126348671205968-84172529226-4260251613134127D13%11%13%7%13%12%13%-11%22%zn16%11%h5%9%h-14%13%11%10%10%17%c19%zc13%chin
121297561064567181920251181224744-432149112E12%10%11%6%12%10%13%10%11%11%13%10%i2%6%2%7%10%20%zfg-7%12%c28%zbc11%cghi
Public Perceptions of the NHS and Social CareFINAL PUBLIC
Table 257Social grade
Base : All respondents
Respondent type : General public aged 16+ Fieldwork dates : 14th November - 9th December 2011Source : Ipsos MORI (JN10-039262-01)Proportions/Means: Columns Tested (5% risk level) - z/a/b/c/d - z/e/f/g - z/h/i/j/k - z/l/m/n/o - z/p/q - z/r/s - z/t/u - z/vOverlap formulae used. * small base; ** very small base (under 30) ineligible for sig testing

UnwtdtotalFuture of NHSSatisfaction with NHSGOR
DisYorkshire &WestEastWtd.WorseSameBettersatisfiedSatisfiedHumbersideMidlandsSouth-WestSouth-EastNorth-WestNorth-EastLondonEasternMidlandsTotal
(o)(n)(m)(l)(k)(j)(i)(h)(g)(f)(e)(d)(c)(b)(a)(z)1001328298343168703909910715413955143126881001Unweighted Total1001327302340168701100*106*10216213651*14810986*1001Weighted Total
31911102231-812-136-30A3%3%4%3%1%3%1%-8%zacehi7%zacehi-2%2%5%aeh-3%e
21671747039153101721611810274015219B22%22%24%21%23%22%10%16%20%38%zacdeghi13%20%18%37%zacdeghi18%22%ei
3061168110754205513137373021552427312C131%35%zm27%32%32%29%51%zabcefgh29%36%bef23%22%40%bef37%bef22%31%31%befjm
20160676440139202919251811242531201C220%18%22%19%24%20%20%27%cef19%15%13%21%16%23%e36%zbcefgi20%e
1263736531710014206736421811127D13%11%12%16%10%14%z14%f19%zbfg6%5%26%zabcdfgi8%14%fg8%12%f13%fg
12134343616824912203551962112E12%11%11%11%10%12%4%8%11%a13%abi26%zabcdfghi10%13%abi5%3%11%abi
Public Perceptions of the NHS and Social CareFINAL PUBLIC
Table 258Social grade
Base : All respondents
Respondent type : General public aged 16+ Fieldwork dates : 14th November - 9th December 2011Source : Ipsos MORI (JN10-039262-01)Proportions/Means: Columns Tested (5% risk level) - z/a/b/c/d/e/f/g/h/i - z/j/k - z/l/m/n - z/oOverlap formulae used. * small base

UnwtdPrivate healthSatisfaction withImpact of NHS reformsGovernment has righttotalinsurancesocial careon patientsNHS policyNHS use in last year
SocialNHSDissatisficareWalk InChoicesPharmacistWtd.
NoYesedSatisfiedWorseBetterDisagreeAgreeservicesClinicwebsite/ChemistNHS DirectA&EOutpatientInpatientGPTotal(r)(q)(p)(o)(n)(m)(l)(k)(j)(i)(h)(g)(f)(e)(d)(c)(b)(a)(z)10018151704424938220040326945182553001772253931967801001Unweighted Total100181117544*24437920139327642*18856*3011832303761927731001Weighted Total
31191117107157-4110741042630A3%2%6%zq3%3%3%4%4%3%-2%1%3%4%2%3%2%3%3%q
21613880155092489965541217355538234181219B22%17%45%zq33%21%24%24%25%z23%11%22%37%zabcdfh24%bi30%zabcdhi23%i22%18%23%zbi22%q
i
306249551669117611247312562595677311559239312C131%31%32%36%28%31%30%31%26%30%30%45%zabcfh32%37%32%30%31%31%31%
2011851666085297053113824424477633137201C220%23%zp9%15%24%22%l14%18%19%27%efg20%eg3%15%g13%g20%efg20%efg17%g18%g20%aefglp
1261196227383245507285431629483498127D13%15%zp3%5%11%10%16%m11%18%zk17%15%e9%14%e9%13%13%17%zace13%13%p
1211027431372441296212361324462992112E12%13%zp4%8%13%10%12%10%10%15%11%4%12%e7%10%12%e15%eg12%e11%p
Public Perceptions of the NHS and Social CareFINAL PUBLIC
Table 259Social grade
Base : All respondents
Respondent type : General public aged 16+ Fieldwork dates : 14th November - 9th December 2011Source : Ipsos MORI (JN10-039262-01)Proportions/Means: Columns Tested (5% risk level) - z/a/b/c/d/e/f/g/h/i - z/j/k - z/l/m - z/n/o - z/p/q - z/rOverlap formulae used. * small base

UnwtdtotalWork StatusSocial GradeAgeGender
Full/part-Wtd.OtherUnemployedRetiredtimeDEC2C1AB65+55-6435-5425-3416-24FemaleMaleTotal
(p)(o)(n)(m)(l)(k)(j)(i)(h)(g)(f)(e)(d)(c)(b)(a)(z)1001162612705082472013062472201693311581235274741001Unweighted Total100115758*2355512392013122491981433501671435154861001Weighted Total63457331713761531172061601559823010746245391637Chief Income Earner63%36%56%o73%zno68%zo64%58%66%64%78%zcdef68%c66%c64%c32%48%81%zb64%bco
36710025641758584106894345119609727094364Not Chief Income Earner37%64%zlmn44%m27%32%36%42%34%36%22%32%g34%g36%g68%zdefg52%za19%36%aglm
Public Perceptions of the NHS and Social CareFINAL PUBLIC
Table 260Respondent is Chief Income Earner?
Base : All respondents
Respondent type : General public aged 16+ Fieldwork dates : 14th November - 9th December 2011Source : Ipsos MORI (JN10-039262-01)Proportions/Means: Columns Tested (5% risk level) - z/a/b - z/c/d/e/f/g - z/h/i/j/k - z/l/m/n/o - z/pOverlap formulae used. * small base

People aretreated with
Unwtddignity andtotalrespectNHS useHospital useEthnicityNHS/social care staffHousehold TypeHome Ownership
NotAdultshospitalHospitalInformalSocialwith
Non NHS/A&E/A&EsocialcareKnow NHSNHSdependentNon-Owner -PrivateSocialWtd.DisagreeAgreeuserNHS useruseruserMixedWhiteAsianBlackcarerworkerstaffstaffchildrenpensionerPensionerOtheroccupierrenterrenterTotal
(v)(u)(t)(s)(r)(q)(p)(o)(n)(m)(l)(k)(j)(i)(h)(g)(f)(e)(d)(c)(b)(a)(z)100130864710090145854310750741612543628951291461249106491691731001Unweighted Total1001304652104*89746853311**74778*15925038*29252*30547522110**6401781731001Weighted Total6341934207256430233474854110115727176341672991704383127123637Chief Income Earner63%64%64%69%63%65%63%62%65%m53%64%63%70%60%65%55%63%g77%zfg35%60%71%zc71%zc64%cgm
36711023132332166199426237589311117181381765172575150364Not Chief Income Earner37%36%36%31%37%35%37%38%35%47%zn36%37%30%40%35%45%zef37%e23%65%40%zab29%29%36%abe
Public Perceptions of the NHS and Social CareFINAL PUBLIC
Table 261Respondent is Chief Income Earner?
Base : All respondents
Respondent type : General public aged 16+ Fieldwork dates : 14th November - 9th December 2011Source : Ipsos MORI (JN10-039262-01)Proportions/Means: Columns Tested (5% risk level) - z/a/b/c/d - z/e/f/g - z/h/i/j/k - z/l/m/n/o - z/p/q - z/r/s - z/t/u - z/vOverlap formulae used. * small base; ** very small base (under 30) ineligible for sig testing

UnwtdtotalFuture of NHSSatisfaction with NHSGOR
DisYorkshire &WestEastWtd.WorseSameBettersatisfiedSatisfiedHumbersideMidlandsSouth-WestSouth-EastNorth-WestNorth-EastLondonEasternMidlandsTotal
(o)(n)(m)(l)(k)(j)(i)(h)(g)(f)(e)(d)(c)(b)(a)(z)1001328298343168703909910715413955143126881001Unweighted Total1001327302340168701100*106*10216213651*14810986*1001Weighted Total6342101902181054506671639793291036650637Chief Income Earner63%64%63%64%63%64%65%67%62%60%68%57%69%60%58%64%
36711711212263252353539654322464436364Not Chief Income Earner37%36%37%36%37%36%35%33%38%40%32%43%31%40%42%36%
Public Perceptions of the NHS and Social CareFINAL PUBLIC
Table 262Respondent is Chief Income Earner?
Base : All respondents
Respondent type : General public aged 16+ Fieldwork dates : 14th November - 9th December 2011Source : Ipsos MORI (JN10-039262-01)Proportions/Means: Columns Tested (5% risk level) - z/a/b/c/d/e/f/g/h/i - z/j/k - z/l/m/n - z/oOverlap formulae used. * small base

UnwtdPrivate healthSatisfaction withImpact of NHS reformsGovernment has righttotalinsurancesocial careon patientsNHS policyNHS use in last year
SocialNHSDissatisficareWalk InChoicesPharmacistWtd.
NoYesedSatisfiedWorseBetterDisagreeAgreeservicesClinicwebsite/ChemistNHS DirectA&EOutpatientInpatientGPTotal(r)(q)(p)(o)(n)(m)(l)(k)(j)(i)(h)(g)(f)(e)(d)(c)(b)(a)(z)10018151704424938220040326945182553001772253931967801001Unweighted Total100181117544*24437920139327642*18856*3011832303761927731001Weighted Total634532100261492511262531802911638177106138236118500637Chief Income Earner63%66%zp57%59%61%66%63%64%65%70%62%67%59%58%60%63%61%65%ef64%f
3672787518951287414097127118124779214074272364Not Chief Income Earner37%34%43%q41%39%34%37%36%35%30%38%33%41%za42%a40%37%39%35%36%q
Public Perceptions of the NHS and Social CareFINAL PUBLIC
Table 263Respondent is Chief Income Earner?
Base : All respondents
Respondent type : General public aged 16+ Fieldwork dates : 14th November - 9th December 2011Source : Ipsos MORI (JN10-039262-01)Proportions/Means: Columns Tested (5% risk level) - z/a/b/c/d/e/f/g/h/i - z/j/k - z/l/m - z/n/o - z/p/q - z/rOverlap formulae used. * small base

UnwtdtotalWork StatusSocial GradeAgeGender
Full/part-Wtd.OtherUnemployedRetiredtimeDEC2C1AB65+55-6435-5425-3416-24FemaleMaleTotal
(p)(o)(n)(m)(l)(k)(j)(i)(h)(g)(f)(e)(d)(c)(b)(a)(z)1001162612705082472013062472201693311581235274741001Unweighted Total100115758*2355512392013122491981433501671435154861001Weighted Total24971195186940565718628241113108221Pensioner only (ie no25%4%1%83%zlno3%29%zij20%18%23%94%zcdef19%cde1%3%1%22%22%22%cdeilnochildren or other
adults)46183343632210698170100101081847994219256475Non-pensioners (ie46%53%m58%m15%58%zm45%49%55%zhk40%5%75%zdeg53%zg47%g65%zdeg42%53%zb47%bghmadults/no dependent
children under 16)2916723421064638692281638448184121305Adults with dependent29%43%zm40%m2%38%zm27%31%28%37%zik1%6%g47%zcfg50%zcfg34%fg36%za25%30%afgmchild/ren under 16
Public Perceptions of the NHS and Social CareFINAL PUBLIC
Table 264Household is:
Base : All respondents
Respondent type : General public aged 16+ Fieldwork dates : 14th November - 9th December 2011Source : Ipsos MORI (JN10-039262-01)Proportions/Means: Columns Tested (5% risk level) - z/a/b - z/c/d/e/f/g - z/h/i/j/k - z/l/m/n/o - z/pOverlap formulae used. * small base

People aretreated with
Unwtddignity andtotalrespectNHS useHospital useEthnicityNHS/social care staffHousehold TypeHome Ownership
NotAdultshospitalHospitalInformalSocialwith
Non NHS/A&E/A&EsocialcareKnow NHSNHSdependentNon-Owner -PrivateSocialWtd.DisagreeAgreeuserNHS useruseruserMixedWhiteAsianBlackcarerworkerstaffstaffchildrenpensionerPensionerOtheroccupierrenterrenterTotal
(v)(u)(t)(s)(r)(q)(p)(o)(n)(m)(l)(k)(j)(i)(h)(g)(f)(e)(d)(c)(b)(a)(z)100130864710090145854310750741612543628951291461249106491691731001Unweighted Total1001304652104*89746853311**74778*15925038*29252*30547522110**6401781731001Weighted Total2496814111210841371185628526505--22111821325221Pensioner only (ie no25%22%22%11%23%zs18%26%zq9%25%zm8%18%21%h16%17%9%--100%zfg10%28%zab8%14%b22%abfghchildren or other
imqsadults)46114730559416237238736030741171815731-475-728010088475Non-pensioners (ie46%48%47%56%46%51%45%63%48%39%46%47%47%54%z59%-100%zeg-69%44%56%zc51%47%cegadults/no dependent
children under 16)29188206342711481583202415780158617305--21796559305Adults with dependent29%29%32%33%30%32%30%29%27%53%zln36%n32%38%29%32%100%zef--21%28%36%c34%30%cefnchild/ren under 16
Public Perceptions of the NHS and Social CareFINAL PUBLIC
Table 265Household is:
Base : All respondents
Respondent type : General public aged 16+ Fieldwork dates : 14th November - 9th December 2011Source : Ipsos MORI (JN10-039262-01)Proportions/Means: Columns Tested (5% risk level) - z/a/b/c/d - z/e/f/g - z/h/i/j/k - z/l/m/n/o - z/p/q - z/r/s - z/t/u - z/vOverlap formulae used. * small base; ** very small base (under 30) ineligible for sig testing

UnwtdtotalFuture of NHSSatisfaction with NHSGOR
DisYorkshire &WestEastWtd.WorseSameBettersatisfiedSatisfiedHumbersideMidlandsSouth-WestSouth-EastNorth-WestNorth-EastLondonEasternMidlandsTotal
(o)(n)(m)(l)(k)(j)(i)(h)(g)(f)(e)(d)(c)(b)(a)(z)1001328298343168703909910715413955143126881001Unweighted Total1001327302340168701100*106*10216213651*14810986*1001Weighted Total24971657330172212926423112143116221Pensioner only (ie no25%22%22%22%18%24%z21%c28%c26%c26%c23%c23%c9%28%c18%c22%cchildren or other
adults)46115513917476325555154586924883740475Non-pensioners (ie46%47%46%51%46%46%55%bf48%b52%bf36%51%bf47%59%zbf34%46%47%bfadults/no dependent
children under 16)291101989361204242622633615474131305Adults with dependent29%31%32%27%36%29%24%25%22%39%zeghi26%30%32%38%ghi36%g30%gchild/ren under 16
Public Perceptions of the NHS and Social CareFINAL PUBLIC
Table 266Household is:
Base : All respondents
Respondent type : General public aged 16+ Fieldwork dates : 14th November - 9th December 2011Source : Ipsos MORI (JN10-039262-01)Proportions/Means: Columns Tested (5% risk level) - z/a/b/c/d/e/f/g/h/i - z/j/k - z/l/m/n - z/oOverlap formulae used. * small base

UnwtdPrivate healthSatisfaction withImpact of NHS reformsGovernment has righttotalinsurancesocial careon patientsNHS policyNHS use in last year
SocialNHSDissatisficareWalk InChoicesPharmacistWtd.
NoYesedSatisfiedWorseBetterDisagreeAgreeservicesClinicwebsite/ChemistNHS DirectA&EOutpatientInpatientGPTotal(r)(q)(p)(o)(n)(m)(l)(k)(j)(i)(h)(g)(f)(e)(d)(c)(b)(a)(z)10018151704424938220040326945182553001772253931967801001Unweighted Total100181117544*24437920139327642*18856*3011832303761927731001Weighted Total249198211265814684621621658173811453183221Pensioner only (ie no25%24%zp12%26%27%21%23%21%23%37%zadefgh11%11%19%eh10%16%e30%zadefgh28%zdefgh24%zdefgh22%deghpchildren or other
adults)46138186171201811021901341396361408611116776357475Non-pensioners (ie46%47%49%38%49%48%51%48%48%30%51%bi64%zabcdef47%i47%i48%bi44%i40%46%bi47%biadults/no dependent
ichildren under 16)291232681660117531188014711410280819562233305Adults with dependent29%29%39%zq36%24%31%26%30%29%33%38%zac25%34%c43%zabcdfg35%c25%33%c30%c30%cnqchild/ren under 16
Public Perceptions of the NHS and Social CareFINAL PUBLIC
Table 267Household is:
Base : All respondents
Respondent type : General public aged 16+ Fieldwork dates : 14th November - 9th December 2011Source : Ipsos MORI (JN10-039262-01)Proportions/Means: Columns Tested (5% risk level) - z/a/b/c/d/e/f/g/h/i - z/j/k - z/l/m - z/n/o - z/p/q - z/rOverlap formulae used. * small base

UnwtdtotalWork StatusSocial GradeAgeGender
Full/part-Wtd.OtherUnemployedRetiredtimeDEC2C1AB65+55-6435-5425-3416-24FemaleMaleTotal
(p)(o)(n)(m)(l)(k)(j)(i)(h)(g)(f)(e)(d)(c)(b)(a)(z)1001162612705082472013062472201693311581235274741001Unweighted Total100115758*2355512392013122491981433501671435154861001Weighted Total
508---55159124201167126628112665264287551Working51%---100%zmno25%61%zk64%zk67%zk6%46%g80%zcfg75%zcfg46%g51%59%zb55%bcfgkmno
395---4454310215414684922911148186259445Working - Full time39%---81%zmno18%51%zk50%zk58%zik4%34%g66%zcfg66%zcfg33%g36%53%zb44%bcfgkmno(30+ hrs)
113---105162147214175214187728105Working - Part-time11%---19%zmno7%11%15%zhk8%2%12%g15%zg9%g12%g15%za6%11%agkmno(9-29 hrs)
61-58--378113-7221216312758Unemployed6%-100%zlmo--16%zhij4%3%1%-5%g6%g7%g11%zg6%6%6%ghilmo
38-36--21583-710712152136Unemployed - seeking4%-62%zlmo--9%zhij2%2%1%-5%g3%g4%g8%zeg3%4%4%ghlmowork
23-22--1633--1125516722Unemployed - not2%-38%zlmo--7%zhij1%1%--1%3%g3%g3%g3%1%2%ghlmseeking work
37395-235-12757776818567462210191139330Not working37%60%zln-100%zlno-53%zhij28%25%27%93%zcdef47%zcde13%13%7%37%za29%33%acdehiln
270--235-75465955183483-1118117235Not working - retired27%--100%zlno-31%zhi23%19%22%93%zcdef34%zcde1%-1%23%24%23%cdeilno
6561---2971411162621859261Not working - looking6%39%zlmn---12%zhij3%5%5%*4%g7%g13%zcfg5%g11%za*6%aglmnafter house/children
3834---244421131811142034Not working - invalid/4%21%zlmn---10%zhij2%1%1%*9%zcdg5%zcdg1%1%3%4%3%dghilmdisabled
5559---1413239-2-652273259Student5%38%zlmn---6%6%7%4%-1%e-3%eg36%zdefg5%7%6%efglm
44---1-1211-2-314Other*2%zlm---*-*1%*1%-1%-1%**-----------------Don't know-----------------
Public Perceptions of the NHS and Social CareFINAL PUBLIC
Table 268Working Status of Respondent:
Base : All respondents
Respondent type : General public aged 16+ Fieldwork dates : 14th November - 9th December 2011Source : Ipsos MORI (JN10-039262-01)Proportions/Means: Columns Tested (5% risk level) - z/a/b - z/c/d/e/f/g - z/h/i/j/k - z/l/m/n/o - z/pOverlap formulae used. * small base

People aretreated with
Unwtddignity andtotalrespectNHS useHospital useEthnicityNHS/social care staffHousehold TypeHome Ownership
NotAdultshospitalHospitalInformalSocialwith
Non NHS/A&E/A&EsocialcareKnow NHSNHSdependentNon-Owner -PrivateSocialWtd.DisagreeAgreeuserNHS useruseruserMixedWhiteAsianBlackcarerworkerstaffstaffchildrenpensionerPensionerOtheroccupierrenterrenterTotal
(v)(u)(t)(s)(r)(q)(p)(o)(n)(m)(l)(k)(j)(i)(h)(g)(f)(e)(d)(c)(b)(a)(z)100130864710090145854310750741612543628951291461249106491691731001Unweighted Total1001304652104*89746853311**74778*15925038*29252*30547522110**6401781731001Weighted Total
5081753577147928226974054394147361814721032218335711278551Working51%58%55%68%zr53%60%zp50%61%54%55%59%59%93%zik62%z89%zik69%ze68%ze8%30%56%a63%za45%55%aepr
395129301593872342126325347911530150381632681522919657445Working - Full time39%43%46%56%zr43%50%zp40%52%44%43%50%46%79%zik51%z72%zik53%ze56%ze7%20%45%a54%za33%44%aepr(30+ hrs)
113455612934857180915326319475441671621105Working - Part-time11%15%zt9%12%10%10%11%9%11%12%9%13%14%11%17%15%ze11%e2%10%10%9%12%11%et(9-29 hrs)
611540553263214341019-14123341-18132758Unemployed6%5%6%5%6%6%6%10%6%5%7%8%-5%2%8%e7%e*-3%7%c16%zbc6%ce
3812223331719126279-11114221-11111436Unemployed - seeking4%4%3%3%4%4%4%10%3%2%5%4%-4%2%4%e5%e*-2%6%c8%zc4%cework
23319220913-172310-3-1012--721322Unemployed - not2%1%3%2%2%2%2%-2%2%2%4%i-1%-3%e3%e--1%1%7%zbc2%ceuseeking work
3731082031931012620412591848793824537620032313759330Not working37%36%31%19%35%zs27%38%zq9%35%z24%30%31%hj7%28%hj7%18%16%90%zfg25%36%zb21%34%b33%bfghi
jqs
270731501222390145119463357358343619521911527235Not working - retired27%24%23%12%25%zs19%27%zq9%26%zm8%21%m23%hj7%20%h5%1%7%g88%zfg17%30%zab9%15%23%abfgh
jmqs
6521355562932-39111017-17144152129141761Not working - looking6%7%5%4%6%6%6%-5%14%zln6%7%-6%2%15%zef3%e1%8%4%8%10%zc6%cefafter house/children
381418331627-26164-7-5263-1171534Not working - invalid/4%5%3%3%3%1%5%zq-3%1%4%2%-2%-2%5%zeg2%-2%4%9%zc3%cgqdisabled
5564895034252371365-1511741153016959Student5%2%7%zu8%6%7%5%20%5%17%zln3%2%-5%k2%6%e9%ze*45%5%9%c5%6%ceknu
4-4-4-4-3-1--1-121-4--4Other*-1%-*-1%-*-1%--*-***-1%--*-----------------------Don't know-----------------------
Public Perceptions of the NHS and Social CareFINAL PUBLIC
Table 269Working Status of Respondent:
Base : All respondents
Respondent type : General public aged 16+ Fieldwork dates : 14th November - 9th December 2011Source : Ipsos MORI (JN10-039262-01)Proportions/Means: Columns Tested (5% risk level) - z/a/b/c/d - z/e/f/g - z/h/i/j/k - z/l/m/n/o - z/p/q - z/r/s - z/t/u - z/vOverlap formulae used. * small base; ** very small base (under 30) ineligible for sig testing

UnwtdtotalFuture of NHSSatisfaction with NHSGOR
DisYorkshire &WestEastWtd.WorseSameBettersatisfiedSatisfiedHumbersideMidlandsSouth-WestSouth-EastNorth-WestNorth-EastLondonEasternMidlandsTotal
(o)(n)(m)(l)(k)(j)(i)(h)(g)(f)(e)(d)(c)(b)(a)(z)1001328298343168703909910715413955143126881001Unweighted Total1001327302340168701100*106*10216213651*14810986*1001Weighted Total
50818317218398373645257975930855652551Working51%56%57%54%58%53%63%eh49%55%60%e43%58%57%e51%61%e55%e
39514814514481306544144754825704148445Working - Full time39%45%48%42%48%44%54%beh38%43%46%35%49%47%e38%56%zbeh44%e(30+ hrs)
1133527391767911132211515154105Working - Part-time11%11%9%11%10%10%9%11%13%14%a8%9%10%13%a5%11%(9-29 hrs)
61161921840547417395458Unemployed6%5%6%6%5%6%5%4%7%3%12%zabfh6%6%5%4%6%
3811111252623547255236Unemployed - seeking4%3%4%4%3%4%2%3%5%3%5%4%3%5%2%4%work
23689314312-1014-222Unemployed - not2%2%3%3%2%2%3%f1%2%-7%zbfh2%3%f-2%2%seeking work
3731029411957238284537525317344024330Not working37%31%31%35%34%34%28%43%zaci36%c32%39%c33%23%36%c28%33%c
27078668031183243125403913163117235Not working - retired27%24%22%24%18%26%zk24%c29%c24%c25%c29%c26%c11%28%c19%23%c
6514222115363871071157461Not working - looking6%4%7%6%9%5%3%7%7%6%5%2%10%zi6%5%6%after house/children
3810617111817527242334Not working - invalid/4%3%2%5%zm6%zj3%1%6%f5%1%5%5%2%2%4%3%jdisabled
55251616547451882199459Student5%8%5%5%3%7%4%5%1%5%6%4%13%zefghi8%g5%6%g
4121-4---1--1-24Other**1%*-1%---1%--1%-2%z*----------------Don't know----------------
Public Perceptions of the NHS and Social CareFINAL PUBLIC
Table 270Working Status of Respondent:
Base : All respondents
Respondent type : General public aged 16+ Fieldwork dates : 14th November - 9th December 2011Source : Ipsos MORI (JN10-039262-01)Proportions/Means: Columns Tested (5% risk level) - z/a/b/c/d/e/f/g/h/i - z/j/k - z/l/m/n - z/oOverlap formulae used. * small base

UnwtdPrivate healthSatisfaction withImpact of NHS reformsGovernment has righttotalinsurancesocial careon patientsNHS policyNHS use in last year
SocialNHSDissatisficareWalk InChoicesPharmacistWtd.
NoYesedSatisfiedWorseBetterDisagreeAgreeservicesClinicwebsite/ChemistNHS DirectA&EOutpatientInpatientGPTotal(r)(q)(p)(o)(n)(m)(l)(k)(j)(i)(h)(g)(f)(e)(d)(c)(b)(a)(z)10018151704424938220040326945182553001772253931967801001Unweighted Total100181117544*24437920139327642*18856*3011832303761927731001Weighted Total
50841812726122224105223151131154017013013417687414551Working51%52%73%zq59%50%59%52%57%55%31%62%abci71%zabcfi57%bci71%zabcdfh58%bci47%i45%54%bci55%bciq
i
3953331092198180821701309933313410211113472334445Working - Full time39%41%62%zq47%40%47%41%43%47%21%50%bci59%zabcfi45%ci56%zabcdfi48%bci36%i37%i43%ci44%bciq(30+ hrs)
1138518524442353214227362823421580105Working - Part-time11%11%10%12%10%11%11%13%zj7%10%12%12%12%15%zab10%11%8%10%11%(9-29 hrs)
6151551520171915516218101720124558Unemployed6%6%3%11%6%5%8%5%6%11%8%4%6%6%8%5%6%6%6%p
383312111581463121871110102836Unemployed - seeking4%4%p*4%5%4%4%4%2%7%7%zacf2%3%4%5%3%5%c4%4%pwork
2317434594923110371021722Unemployed - not2%2%2%6%2%1%5%zm1%3%4%2%2%3%b2%3%3%1%2%2%kseeking work
3732893512971226514282234512104376416587272330Not working37%36%zp20%28%40%z32%32%36%30%56%zadefgh24%22%35%degh20%28%e44%zadefgh45%zadefgh35%zdegh33%ehp
2702102110738945101621624767204312256194235Not working - retired27%26%zp12%24%30%z23%22%26%22%38%zdefgh13%12%22%eh11%19%e33%zadefgh29%zdefgh25%zdegh23%deghp
65461321117122119312425111120174961Not working - looking6%6%8%4%5%4%6%5%7%7%6%8%8%c6%5%5%9%cd6%6%after house/children
3833--1216821151011261023142934Not working - invalid/4%4%zp--5%4%4%5%zj*11%zadefg5%2%4%3%4%6%za7%za4%3%jpdisabled
555261101313826112174141153859Student5%6%3%3%4%3%7%2%9%zk2%6%bcef1%2%2%6%bcef3%3%5%cef6%abcefkm
413--1113--12214144Other**2%zq--***1%--2%1%1%*1%z***q-------------------Don't know-------------------
Public Perceptions of the NHS and Social CareFINAL PUBLIC
Table 271Working Status of Respondent:
Base : All respondents
Respondent type : General public aged 16+ Fieldwork dates : 14th November - 9th December 2011Source : Ipsos MORI (JN10-039262-01)Proportions/Means: Columns Tested (5% risk level) - z/a/b/c/d/e/f/g/h/i - z/j/k - z/l/m - z/n/o - z/p/q - z/rOverlap formulae used. * small base

UnwtdtotalWork StatusSocial GradeAgeGender
Full/part-Wtd.OtherUnemployedRetiredtimeDEC2C1AB65+55-6435-5425-3416-24FemaleMaleTotal
(p)(o)(n)(m)(l)(k)(j)(i)(h)(g)(f)(e)(d)(c)(b)(a)(z)1001162612705082472013062472201693311581235274741001Unweighted Total100115758*2355512392013122491981433501671435154861001Weighted Total53259151502971109514916912886219808249273522Married53%38%26%64%zlno54%no46%47%48%68%zijk64%zcd60%zcd63%zcd48%c6%48%56%zb52%bckno
2377431161327655853710176642119119134253Single24%47%zlm53%zlm7%24%m32%zh27%h27%h15%5%12%g19%fg25%fg83%zdefg23%28%25%efghm
74117133822141914924334-452469Separated/Divorced7%7%11%6%7%9%7%6%6%4%c17%zcdeg9%zcdg2%-9%za5%7%acd
73225392014201150951-422365Widowed7%1%3%23%zlno2%8%7%6%5%25%zcdef6%cde1%1%-8%za5%7%acdelo
841142741123391816264116593291Cohabiting8%7%m7%m1%13%zmo5%12%k12%zhk7%*4%g8%g24%zcefg11%fg11%za7%9%afgkm
11-----1--1---1-1Don't know/Refused*1%-----*--1%---*-*
Public Perceptions of the NHS and Social CareFINAL PUBLIC
Table 272QA. Marital status
Base : All respondents
Respondent type : General public aged 16+ Fieldwork dates : 14th November - 9th December 2011Source : Ipsos MORI (JN10-039262-01)Proportions/Means: Columns Tested (5% risk level) - z/a/b - z/c/d/e/f/g - z/h/i/j/k - z/l/m/n/o - z/pOverlap formulae used. * small base

People aretreated with
Unwtddignity andtotalrespectNHS useHospital useEthnicityNHS/social care staffHousehold TypeHome Ownership
NotAdultshospitalHospitalInformalSocialwith
Non NHS/A&E/A&EsocialcareKnow NHSNHSdependentNon-Owner -PrivateSocialWtd.DisagreeAgreeuserNHS useruseruserMixedWhiteAsianBlackcarerworkerstaffstaffchildrenpensionerPensionerOtheroccupierrenterrenterTotal
(v)(u)(t)(s)(r)(q)(p)(o)(n)(m)(l)(k)(j)(i)(h)(g)(f)(e)(d)(c)(b)(a)(z)100130864710090145854310750741612543628951291461249106491691731001Unweighted Total1001304652104*89746853311**74778*15925038*29252*30547522110**6401781731001Weighted Total5321543495147025027143785384141171513719019213944105553522Married53%51%54%49%52%53%51%38%51%68%zln53%57%43%52%71%zijk62%zf40%63%zf37%64%zab31%31%52%abf
237681713322013112241802543571076763175155998070253Single24%22%26%32%25%28%23%41%24%32%27%23%25%26%14%21%e37%zeg7%45%15%45%zc40%zc25%ceg
7429377622842159-10182163163816-31172169Separated/Divorced7%10%zt6%7%7%6%8%10%8%m-6%m7%5%6%5%5%8%7%-5%9%c12%zc7%cmt
7315451642144-56199-1233125014841265Widowed7%5%7%1%7%zs5%8%zq-7%zm1%6%4%-4%6%1%3%23%zfg10%8%b2%7%7%bfgikm
qs
84375011803754174-14241037233571-51231691Cohabiting8%12%zt8%10%9%8%10%11%10%m-9%m10%26%zhik13%z4%11%e12%ze*-8%13%10%9%emt
1--1-1--1-------1-1---1Don't know/Refused*--1%r-*--*-------*-8%---*
Public Perceptions of the NHS and Social CareFINAL PUBLIC
Table 273QA. Marital status
Base : All respondents
Respondent type : General public aged 16+ Fieldwork dates : 14th November - 9th December 2011Source : Ipsos MORI (JN10-039262-01)Proportions/Means: Columns Tested (5% risk level) - z/a/b/c/d - z/e/f/g - z/h/i/j/k - z/l/m/n/o - z/p/q - z/r/s - z/t/u - z/vOverlap formulae used. * small base; ** very small base (under 30) ineligible for sig testing

UnwtdtotalFuture of NHSSatisfaction with NHSGOR
DisYorkshire &WestEastWtd.WorseSameBettersatisfiedSatisfiedHumbersideMidlandsSouth-WestSouth-EastNorth-WestNorth-EastLondonEasternMidlandsTotal
(o)(n)(m)(l)(k)(j)(i)(h)(g)(f)(e)(d)(c)(b)(a)(z)1001328298343168703909910715413955143126881001Unweighted Total1001327302340168701100*106*10216213651*14810986*1001Weighted Total532180151173923684665511016322656345522Married53%55%50%51%55%53%46%62%cdei50%62%zcdei47%43%44%58%c53%52%c
23774759438177261926294515522121253Single24%23%25%28%23%25%26%18%25%18%33%zbfh30%35%zbfh19%24%25%f
7425252016467588831012869Separated/Divorced7%8%8%6%9%7%7%5%8%5%6%7%7%11%10%7%
731919247488851311376465Widowed7%6%6%7%4%7%8%8%5%8%8%6%5%6%5%7%
8427333116611481310107147891Cohabiting8%8%11%9%9%9%14%8%12%6%7%14%10%6%9%9%11---1---1-----1Don't know/Refused**---*---1%-----*
Public Perceptions of the NHS and Social CareFINAL PUBLIC
Table 274QA. Marital status
Base : All respondents
Respondent type : General public aged 16+ Fieldwork dates : 14th November - 9th December 2011Source : Ipsos MORI (JN10-039262-01)Proportions/Means: Columns Tested (5% risk level) - z/a/b/c/d/e/f/g/h/i - z/j/k - z/l/m/n - z/oOverlap formulae used. * small base

UnwtdPrivate healthSatisfaction withImpact of NHS reformsGovernment has righttotalinsurancesocial careon patientsNHS policyNHS use in last year
SocialNHSDissatisficareWalk InChoicesPharmacistWtd.
NoYesedSatisfiedWorseBetterDisagreeAgreeservicesClinicwebsite/ChemistNHS DirectA&EOutpatientInpatientGPTotal(r)(q)(p)(o)(n)(m)(l)(k)(j)(i)(h)(g)(f)(e)(d)(c)(b)(a)(z)10018151704424938220040326945182553001772253931967801001Unweighted Total100181117544*24437920139327642*18856*3011832303761927731001Weighted Total5324021122811920910822813724943117010311320798403522Married53%50%64%zq64%49%55%54%58%zj50%57%50%55%57%d56%49%55%51%52%52%q
23722522126183538076955105929696840186253Single24%28%zp13%26%25%22%26%20%28%k22%29%bcef17%19%16%30%abcefg18%21%24%cef25%cefkmp
7458111152614311441532181134165769Separated/Divorced7%7%6%2%6%7%7%8%5%9%8%6%7%4%5%9%de8%e7%7%
73594218241321223521751237145665Widowed7%7%zp3%6%7%6%7%5%8%8%3%3%6%3%5%10%zadefh7%eh7%eh7%ehp
846526131371232261181134382530247191Cohabiting8%8%15%zq2%13%zo10%6%8%10%3%9%20%zachi11%21%zabcdfh11%8%12%ci9%9%q
i
11----------------1Don't know/Refused**----------------*
Public Perceptions of the NHS and Social CareFINAL PUBLIC
Table 275QA. Marital status
Base : All respondents
Respondent type : General public aged 16+ Fieldwork dates : 14th November - 9th December 2011Source : Ipsos MORI (JN10-039262-01)Proportions/Means: Columns Tested (5% risk level) - z/a/b/c/d/e/f/g/h/i - z/j/k - z/l/m - z/n/o - z/p/q - z/rOverlap formulae used. * small base

UnwtdtotalWork StatusSocial GradeAgeGender
Full/part-Wtd.OtherUnemployedRetiredtimeDEC2C1AB65+55-6435-5425-3416-24FemaleMaleTotal
(p)(o)(n)(m)(l)(k)(j)(i)(h)(g)(f)(e)(d)(c)(b)(a)(z)1001162612705082472013062472201693311581235274741001Unweighted Total100115758*2355512392013122491981433501671435154861001Weighted Total81213641165482183166258216135106301148134420403823Other people81%87%mn70%70%87%zmn77%82%83%87%zk68%74%86%zfg88%zfg93%zefg82%83%82%fgkmn
187201770695536533363374819109383176Alone19%13%29%zlo30%zlo13%23%zh18%17%13%32%zcde26%zcde14%c12%7%18%17%18%cdehl
211--1-1--11--2-2Refused/Not stated*1%2%zlm--*-*--1%*--*-*
Public Perceptions of the NHS and Social CareFINAL PUBLIC
Table 276QB. Do you live alone or with other people?
Base : All respondents
Respondent type : General public aged 16+ Fieldwork dates : 14th November - 9th December 2011Source : Ipsos MORI (JN10-039262-01)Proportions/Means: Columns Tested (5% risk level) - z/a/b - z/c/d/e/f/g - z/h/i/j/k - z/l/m/n/o - z/pOverlap formulae used. * small base

People aretreated with
Unwtddignity andtotalrespectNHS useHospital useEthnicityNHS/social care staffHousehold TypeHome Ownership
NotAdultshospitalHospitalInformalSocialwith
Non NHS/A&E/A&EsocialcareKnow NHSNHSdependentNon-Owner -PrivateSocialWtd.DisagreeAgreeuserNHS useruseruserMixedWhiteAsianBlackcarerworkerstaffstaffchildrenpensionerPensionerOtheroccupierrenterrenterTotal
(v)(u)(t)(s)(r)(q)(p)(o)(n)(m)(l)(k)(j)(i)(h)(g)(f)(e)(d)(c)(b)(a)(z)100130864710090145854310750741612543628951291461249106491691731001Unweighted Total1001304652104*89746853311**74778*15925038*29252*30547522110**6401781731001Weighted Total8122455458773638843596027413221434245462963811469549141124823Other people81%81%84%83%82%83%82%80%81%95%zln83%86%90%84%87%97%zef80%e66%92%86%zab79%72%82%aen
18759106171607898214342735447799275-913649176Alone19%19%16%16%18%17%18%20%19%zm5%17%m14%10%16%13%3%19%g34%zfg-14%20%28%zc18%cgm
2-1112--2-------2-1-1-2Refused/Not stated*-*1%**--*-------*-8%-1%-*
Public Perceptions of the NHS and Social CareFINAL PUBLIC
Table 277QB. Do you live alone or with other people?
Base : All respondents
Respondent type : General public aged 16+ Fieldwork dates : 14th November - 9th December 2011Source : Ipsos MORI (JN10-039262-01)Proportions/Means: Columns Tested (5% risk level) - z/a/b/c/d - z/e/f/g - z/h/i/j/k - z/l/m/n/o - z/p/q - z/r/s - z/t/u - z/vOverlap formulae used. * small base; ** very small base (under 30) ineligible for sig testing

UnwtdtotalFuture of NHSSatisfaction with NHSGOR
DisYorkshire &WestEastWtd.WorseSameBettersatisfiedSatisfiedHumbersideMidlandsSouth-WestSouth-EastNorth-WestNorth-EastLondonEasternMidlandsTotal
(o)(n)(m)(l)(k)(j)(i)(h)(g)(f)(e)(d)(c)(b)(a)(z)1001328298343168703909910715413955143126881001Unweighted Total1001327302340168701100*106*10216213651*14810986*1001Weighted Total812277249271135580849278136105421249270823Other people81%85%82%80%81%83%84%86%77%84%77%81%84%85%82%82%
18750526933120161524243110241716176Alone19%15%17%20%19%17%16%14%23%15%23%19%16%15%18%18%211--2---2-----2Refused/Not stated***--*---1%z-----*
Public Perceptions of the NHS and Social CareFINAL PUBLIC
Table 278QB. Do you live alone or with other people?
Base : All respondents
Respondent type : General public aged 16+ Fieldwork dates : 14th November - 9th December 2011Source : Ipsos MORI (JN10-039262-01)Proportions/Means: Columns Tested (5% risk level) - z/a/b/c/d/e/f/g/h/i - z/j/k - z/l/m/n - z/oOverlap formulae used. * small base

UnwtdPrivate healthSatisfaction withImpact of NHS reformsGovernment has righttotalinsurancesocial careon patientsNHS policyNHS use in last year
SocialNHSDissatisficareWalk InChoicesPharmacistWtd.
NoYesedSatisfiedWorseBetterDisagreeAgreeservicesClinicwebsite/ChemistNHS DirectA&EOutpatientInpatientGPTotal(r)(q)(p)(o)(n)(m)(l)(k)(j)(i)(h)(g)(f)(e)(d)(c)(b)(a)(z)10018151704424938220040326945182553001772253931967801001Unweighted Total100181117544*24437920139327642*18856*3011832303761927731001Weighted Total812657153351913141623212333415847259166199298162623823Other people81%81%87%zq79%78%83%81%82%84%82%84%83%86%zac91%zabch86%ac79%84%c81%82%a
1871522295365397143728104217327830149176Alone19%19%13%21%22%17%19%18%16%18%15%e17%14%9%14%21%zbdef16%e19%zdef18%ef
22---1-1--1------12Refused/Not stated**---*-*--1%------**
Public Perceptions of the NHS and Social CareFINAL PUBLIC
Table 279QB. Do you live alone or with other people?
Base : All respondents
Respondent type : General public aged 16+ Fieldwork dates : 14th November - 9th December 2011Source : Ipsos MORI (JN10-039262-01)Proportions/Means: Columns Tested (5% risk level) - z/a/b/c/d/e/f/g/h/i - z/j/k - z/l/m - z/n/o - z/p/q - z/rOverlap formulae used. * small base

UnwtdtotalWork StatusSocial GradeAgeGender
Full/part-Wtd.OtherUnemployedRetiredtimeDEC2C1AB65+55-6435-5425-3416-24FemaleMaleTotal
(p)(o)(n)(m)(l)(k)(j)(i)(h)(g)(f)(e)(d)(c)(b)(a)(z)81213842189443186164249213149124284140115424388812Unweighted Total81213641*165482183166258216135106301148134420403823Weighted Total1851041114046373646915510457987165Yes, aged 60-7423%7%11%67%zlno8%25%i22%i14%21%i67%zcdef52%zcde3%3%4%19%22%20%cdeilo
451-37317671039-2--122841Yes, aged 75-846%1%-22%zlno1%9%zij4%3%5%29%zcdef-1%--3%7%zb5%bcdeflo
13-25544315411-5712Yes, aged 85+2%-4%o3%zlo1%2%2%1%*4%zce4%zce*1%-1%2%1%e
5771253519434117118216161746288143128329283612None aged 60+71%92%zm85%m11%90%zm64%71%84%zhjk75%k5%44%g96%zfg96%zfg96%zfg78%za70%74%afgkm
Public Perceptions of the NHS and Social CareFINAL PUBLIC
Table 280QC. Are there any elderly people in household?
Base : All respondents who live with other people
Respondent type : General public aged 16+ Fieldwork dates : 14th November - 9th December 2011Source : Ipsos MORI (JN10-039262-01)Proportions/Means: Columns Tested (5% risk level) - z/a/b - z/c/d/e/f/g - z/h/i/j/k - z/l/m/n/o - z/pOverlap formulae used. * small base

People aretreated with
Unwtddignity andtotalrespectNHS useHospital useEthnicityNHS/social care staffHousehold TypeHome Ownership
NotAdultshospitalHospitalInformalSocialwith
Non NHS/A&E/A&EsocialcareKnow NHSNHSdependentNon-Owner -PrivateSocialWtd.DisagreeAgreeuserNHS useruseruserMixedWhiteAsianBlackcarerworkerstaffstaffchildrenpensionerPensionerOtheroccupierrenterrenterTotal
(v)(u)(t)(s)(r)(q)(p)(o)(n)(m)(l)(k)(j)(i)(h)(g)(f)(e)(d)(c)(b)(a)(z)8122465338372937743585977013121732239442833661639551131121812Unweighted Total81224554587*7363884359**60274*13221434*24546*2963811469**549141124823Weighted Total185541041415263103112911245134161057992143812165Yes, aged 60-7423%22%19%16%21%16%24%zq11%21%15%18%24%i10%17%13%3%15%g68%zfg20%26%zab6%10%20%abfgq
4511282391328-37129111--437-333441Yes, aged 75-846%4%5%2%5%3%6%zq-6%zl1%1%4%3%4%--1%25%zfg-6%2%3%5%fglq
1311121074-10-262-1-47-111-12Yes, aged 85+2%*2%2%1%2%1%-2%-1%3%i6%zi-2%i-1%5%zfg-2%1%-1%g
577181406705433063078434621041482919739287316108368129108612None aged 60+71%74%75%80%74%79%zp71%89%72%84%n79%69%84%80%zk85%k97%zef83%ze7%80%67%92%zc87%zc74%ceknp
Public Perceptions of the NHS and Social CareFINAL PUBLIC
Table 281QC. Are there any elderly people in household?
Base : All respondents who live with other people
Respondent type : General public aged 16+ Fieldwork dates : 14th November - 9th December 2011Source : Ipsos MORI (JN10-039262-01)Proportions/Means: Columns Tested (5% risk level) - z/a/b/c/d - z/e/f/g - z/h/i/j/k - z/l/m/n/o - z/p/q - z/r/s - z/t/u - z/vOverlap formulae used. * small base; ** very small base (under 30) ineligible for sig testing

UnwtdtotalFuture of NHSSatisfaction with NHSGOR
DisYorkshire &WestEastWtd.WorseSameBettersatisfiedSatisfiedHumbersideMidlandsSouth-WestSouth-EastNorth-WestNorth-EastLondonEasternMidlandsTotal
(o)(n)(m)(l)(k)(j)(i)(h)(g)(f)(e)(d)(c)(b)(a)(z)8122732422711345737485811271064411910571812Unweighted Total81227724927113558084*92*78*13610542*1249270*823Weighted Total185554264251281426192630982112165Yes, aged 60-7423%20%17%23%19%22%z16%c28%zc24%c19%c28%zc23%c7%22%c17%c20%c
45151510831531124138341Yes, aged 75-846%6%6%4%6%5%6%3%1%9%zcg4%2%2%9%cg5%5%
13461-11-1223-3-212Yes, aged 85+2%2%3%l*-2%-1%2%1%3%-2%-3%1%l
5772051882001034166661579870321106454612None aged 60+71%74%75%74%76%72%79%67%73%72%66%77%89%zabefgh69%77%74%ej
Public Perceptions of the NHS and Social CareFINAL PUBLIC
Table 282QC. Are there any elderly people in household?
Base : All respondents who live with other people
Respondent type : General public aged 16+ Fieldwork dates : 14th November - 9th December 2011Source : Ipsos MORI (JN10-039262-01)Proportions/Means: Columns Tested (5% risk level) - z/a/b/c/d/e/f/g/h/i - z/j/k - z/l/m/n - z/oOverlap formulae used. * small base

UnwtdPrivate healthSatisfaction withImpact of NHS reformsGovernment has righttotalinsurancesocial careon patientsNHS policyNHS use in last year
SocialNHSDissatisficareWalk InChoicesPharmacistWtd.
NoYesedSatisfiedWorseBetterDisagreeAgreeservicesClinicwebsite/ChemistNHS DirectA&EOutpatientInpatientGPTotal(r)(q)(p)(o)(n)(m)(l)(k)(j)(i)(h)(g)(f)(e)(d)(c)(b)(a)(z)812651148341933121603262233615245255159192306163620812Unweighted Total81265715335*19131416232123334*15847*259166199298162623823Weighted Total1851462084672297539820124917358333130165Yes, aged 60-7423%22%zp13%23%24%23%18%23%17%22%e12%25%eh19%eh10%18%e28%zabdefh20%eh21%eh20%ehp
453541121512181246-123923143441Yes, aged 75-846%5%3%3%6%5%7%6%5%12%zdefgh3%-5%2%4%8%zaeh9%zdegh5%e5%e
1311--3122632-2-432812Yes, aged 85+2%2%--1%*1%1%3%k8%zabcdefh1%-1%-2%1%1%1%1%m
577471131261322281222281802013135199147154196115457612None aged 60+71%72%85%zq75%69%73%76%71%77%57%83%zabci75%77%ci89%zabcdfg78%ci66%71%73%ci74%ciq
i
Public Perceptions of the NHS and Social CareFINAL PUBLIC
Table 283QC. Are there any elderly people in household?
Base : All respondents who live with other people
Respondent type : General public aged 16+ Fieldwork dates : 14th November - 9th December 2011Source : Ipsos MORI (JN10-039262-01)Proportions/Means: Columns Tested (5% risk level) - z/a/b/c/d/e/f/g/h/i - z/j/k - z/l/m - z/n/o - z/p/q - z/rOverlap formulae used. * small base

UnwtdtotalWork StatusSocial GradeAgeGender
Full/part-Wtd.OtherUnemployedRetiredtimeDEC2C1AB65+55-6435-5425-3416-24FemaleMaleTotal
(p)(o)(n)(m)(l)(k)(j)(i)(h)(g)(f)(e)(d)(c)(b)(a)(z)81213842189443186164249213149124284140115424388812Unweighted Total81213641*165482183166258216135106301148134420403823Weighted Total144459-9736274642-249772310150151Yes, aged 0-418%33%zlm22%m-20%m20%17%18%19%-2%16%fg52%zcefg17%fg24%za12%18%afgm
158351441134520514923103431410263165Yes, aged 5-1219%26%m33%zm2%23%zm24%j12%20%j23%j1%3%34%zcfg29%zcfg10%fg24%za16%20%acfgjm
14444114943830394524968417577151Yes, aged 13-1718%32%zlm26%m2%19%m21%18%15%21%1%3%32%zdfg6%31%zdfg18%19%18%dfgm
465431615923999991451141321001164663207250457None under 1857%32%40%97%zlno50%o54%60%56%53%98%zcde94%zcde38%31%47%d49%62%zb56%bdelno
Public Perceptions of the NHS and Social CareFINAL PUBLIC
Table 284QD. Are there any young people in household?
Base : All respondents who live with other people
Respondent type : General public aged 16+ Fieldwork dates : 14th November - 9th December 2011Source : Ipsos MORI (JN10-039262-01)Proportions/Means: Columns Tested (5% risk level) - z/a/b - z/c/d/e/f/g - z/h/i/j/k - z/l/m/n/o - z/pOverlap formulae used. * small base

People aretreated with
Unwtddignity andtotalrespectNHS useHospital useEthnicityNHS/social care staffHousehold TypeHome Ownership
NotAdultshospitalHospitalInformalSocialwith
Non NHS/A&E/A&EsocialcareKnow NHSNHSdependentNon-Owner -PrivateSocialWtd.DisagreeAgreeuserNHS useruseruserMixedWhiteAsianBlackcarerworkerstaffstaffchildrenpensionerPensionerOtheroccupierrenterrenterTotal
(v)(u)(t)(s)(r)(q)(p)(o)(n)(m)(l)(k)(j)(i)(h)(g)(f)(e)(d)(c)(b)(a)(z)8122465338372937743585977013121732239442833661639551131121812Unweighted Total81224554587*7363884359**60274*13221434*24546*2963811469**549141124823Weighted Total1443810716135698211052024318471212922--804030151Yes, aged 0-418%16%20%18%18%18%19%12%17%26%18%14%22%19%26%k43%zef6%e--15%29%zc25%c18%cef
15851110191458481-107233434114112135264-1023231165Yes, aged 5-1219%21%20%22%20%22%19%-18%31%zn26%n16%33%ik17%25%45%zef7%3%-18%23%25%20%efn
14442100161357675210516294064381044713991831151Yes, aged 13-1718%17%18%19%18%20%17%24%17%21%22%18%16%18%17%35%zef12%e1%37%18%13%25%zb18%ef
465141298464112102486354286512715140201929714263286954457None under 1857%58%55%53%56%54%57%64%59%zm38%49%59%44%57%44%6%78%zg97%zfg63%60%zab49%44%56%agm
Public Perceptions of the NHS and Social CareFINAL PUBLIC
Table 285QD. Are there any young people in household?
Base : All respondents who live with other people
Respondent type : General public aged 16+ Fieldwork dates : 14th November - 9th December 2011Source : Ipsos MORI (JN10-039262-01)Proportions/Means: Columns Tested (5% risk level) - z/a/b/c/d - z/e/f/g - z/h/i/j/k - z/l/m/n/o - z/p/q - z/r/s - z/t/u - z/vOverlap formulae used. * small base; ** very small base (under 30) ineligible for sig testing

UnwtdtotalFuture of NHSSatisfaction with NHSGOR
DisYorkshire &WestEastWtd.WorseSameBettersatisfiedSatisfiedHumbersideMidlandsSouth-WestSouth-EastNorth-WestNorth-EastLondonEasternMidlandsTotal
(o)(n)(m)(l)(k)(j)(i)(h)(g)(f)(e)(d)(c)(b)(a)(z)8122732422711345737485811271064411910571812Unweighted Total81227724927113558084*92*78*13610542*1249270*823Weighted Total144464849341014131329215321815151Yes, aged 0-418%17%19%18%25%zj17%5%14%16%i22%i20%i12%26%zi19%i22%i18%i
158594952321082020152224828189165Yes, aged 5-1219%21%20%19%23%19%24%22%19%16%23%19%23%19%13%20%
1445350452410513151525208162318151Yes, aged 13-1718%19%20%17%18%18%16%16%19%19%19%20%13%25%c25%c18%
46515513215869330535744715625704931457None under 1857%56%53%58%51%57%63%a62%a57%53%53%61%56%53%45%56%
Public Perceptions of the NHS and Social CareFINAL PUBLIC
Table 286QD. Are there any young people in household?
Base : All respondents who live with other people
Respondent type : General public aged 16+ Fieldwork dates : 14th November - 9th December 2011Source : Ipsos MORI (JN10-039262-01)Proportions/Means: Columns Tested (5% risk level) - z/a/b/c/d/e/f/g/h/i - z/j/k - z/l/m/n - z/oOverlap formulae used. * small base

UnwtdPrivate healthSatisfaction withImpact of NHS reformsGovernment has righttotalinsurancesocial careon patientsNHS policyNHS use in last year
SocialNHSDissatisficareWalk InChoicesPharmacistWtd.
NoYesedSatisfiedWorseBetterDisagreeAgreeservicesClinicwebsite/ChemistNHS DirectA&EOutpatientInpatientGPTotal(r)(q)(p)(o)(n)(m)(l)(k)(j)(i)(h)(g)(f)(e)(d)(c)(b)(a)(z)812651148341933121603262233615245255159192306163620812Unweighted Total81265715335*19131416232123334*15847*259166199298162623823Weighted Total1441094052459265944737146448384745120151Yes, aged 0-418%17%26%zq16%13%19%16%18%19%21%23%c29%c25%zac29%zacd19%16%28%zacd19%c18%nq
1581233812297932684043595947434730119165Yes, aged 5-1219%19%25%34%zn15%25%z20%21%17%12%22%c19%23%c29%zabci22%c16%19%19%20%c
1441232572953276339433-3731404923116151Yes, aged 13-1718%19%16%20%15%17%17%20%17%12%g21%fg-14%g19%g20%fg16%g14%g19%fg18%fg
4653787217124172921771332081291347310318786348457None under 1857%58%zp47%49%65%z55%57%55%57%59%51%62%e52%e44%52%63%zabdefh53%e56%e56%ep
Public Perceptions of the NHS and Social CareFINAL PUBLIC
Table 287QD. Are there any young people in household?
Base : All respondents who live with other people
Respondent type : General public aged 16+ Fieldwork dates : 14th November - 9th December 2011Source : Ipsos MORI (JN10-039262-01)Proportions/Means: Columns Tested (5% risk level) - z/a/b/c/d/e/f/g/h/i - z/j/k - z/l/m - z/n/o - z/p/q - z/rOverlap formulae used. * small base

UnwtdtotalWork StatusSocial GradeAgeGender
Full/part-Wtd.OtherUnemployedRetiredtimeDEC2C1AB65+55-6435-5425-3416-24FemaleMaleTotal
(p)(o)(n)(m)(l)(k)(j)(i)(h)(g)(f)(e)(d)(c)(b)(a)(z)1001162612705082472013062472201693311581235274741001Unweighted Total100115758*2355512392013122491981433501671435154861001Weighted Total197371970587523483859356713109093184Yes, respondent20%24%l32%zl30%zl11%31%zhij12%15%15%30%zcde24%zcd19%cd8%7%18%19%18%cdjl
13424646544432272743193814176763130Yes, other household13%15%11%20%zl10%18%zhi16%i9%11%22%zcdef13%11%8%12%13%13%13%dilmember
6991033612944613214924119110793255141119370344714No70%65%m62%55%81%zmno55%74%k77%zk77%zk54%65%g73%g84%zefg83%zefg72%71%71%fgkm
Public Perceptions of the NHS and Social CareFINAL PUBLIC
Table 288QE. Do you, or anyone else in your household have any long-standing illness, disability or infirmity? If yes, is that you or someone in your household?
Base : All respondents
Respondent type : General public aged 16+ Fieldwork dates : 14th November - 9th December 2011Source : Ipsos MORI (JN10-039262-01)Proportions/Means: Columns Tested (5% risk level) - z/a/b - z/c/d/e/f/g - z/h/i/j/k - z/l/m/n/o - z/pOverlap formulae used. * small base

People aretreated with
Unwtddignity andtotalrespectNHS useHospital useEthnicityNHS/social care staffHousehold TypeHome Ownership
NotAdultshospitalHospitalInformalSocialwith
Non NHS/A&E/A&EsocialcareKnow NHSNHSdependentNon-Owner -PrivateSocialWtd.DisagreeAgreeuserNHS useruseruserMixedWhiteAsianBlackcarerworkerstaffstaffchildrenpensionerPensionerOtheroccupierrenterrenterTotal
(v)(u)(t)(s)(r)(q)(p)(o)(n)(m)(l)(k)(j)(i)(h)(g)(f)(e)(d)(c)(b)(a)(z)100130864710090145854310750741612543628951291461249106491691731001Unweighted Total1001304652104*89746853311**74778*15925038*29252*30547522110**6401781731001Weighted Total19765112817645139115841949361834836611112052184Yes, respondent20%21%17%8%20%zs10%26%zq10%21%zlm5%12%20%7%21%15%11%18%g30%zfg10%17%11%30%zbc18%bglmq
s
1344184151166268110312146753853351471931225130Yes, other household13%14%13%14%13%13%13%9%14%15%9%27%zhi13%13%10%11%11%21%zfg10%14%b7%14%b13%bfmember
6992054748462937134395086312914931203402423541188456149101714No70%68%73%81%zr70%79%zp64%81%68%81%n81%zn60%82%k70%k76%k79%ze75%ze53%80%71%a84%zac58%71%aeknp
r
Public Perceptions of the NHS and Social CareFINAL PUBLIC
Table 289QE. Do you, or anyone else in your household have any long-standing illness, disability or infirmity? If yes, is that you or someone in your household?
Base : All respondents
Respondent type : General public aged 16+ Fieldwork dates : 14th November - 9th December 2011Source : Ipsos MORI (JN10-039262-01)Proportions/Means: Columns Tested (5% risk level) - z/a/b/c/d - z/e/f/g - z/h/i/j/k - z/l/m/n/o - z/p/q - z/r/s - z/t/u - z/vOverlap formulae used. * small base; ** very small base (under 30) ineligible for sig testing

UnwtdtotalFuture of NHSSatisfaction with NHSGOR
DisYorkshire &WestEastWtd.WorseSameBettersatisfiedSatisfiedHumbersideMidlandsSouth-WestSouth-EastNorth-WestNorth-EastLondonEasternMidlandsTotal
(o)(n)(m)(l)(k)(j)(i)(h)(g)(f)(e)(d)(c)(b)(a)(z)1001328298343168703909910715413955143126881001Unweighted Total1001327302340168701100*106*10216213651*14810986*1001Weighted Total1975554703811616251921319182718184Yes, respondent20%17%18%21%22%17%16%23%cf19%13%23%cf18%12%25%zcf21%18%cj
134403851199291915222779149130Yes, other household13%12%12%15%11%13%9%18%c15%c14%c19%zci13%6%13%11%13%cmember
69924321722911551177667012085371257461714No70%74%l72%67%69%73%77%eh62%69%74%eh62%73%84%zabefgh68%71%71%ehl
Public Perceptions of the NHS and Social CareFINAL PUBLIC
Table 290QE. Do you, or anyone else in your household have any long-standing illness, disability or infirmity? If yes, is that you or someone in your household?
Base : All respondents
Respondent type : General public aged 16+ Fieldwork dates : 14th November - 9th December 2011Source : Ipsos MORI (JN10-039262-01)Proportions/Means: Columns Tested (5% risk level) - z/a/b/c/d/e/f/g/h/i - z/j/k - z/l/m/n - z/oOverlap formulae used. * small base

UnwtdPrivate healthSatisfaction withImpact of NHS reformsGovernment has righttotalinsurancesocial careon patientsNHS policyNHS use in last year
SocialNHSDissatisficareWalk InChoicesPharmacistWtd.
NoYesedSatisfiedWorseBetterDisagreeAgreeservicesClinicwebsite/ChemistNHS DirectA&EOutpatientInpatientGPTotal(r)(q)(p)(o)(n)(m)(l)(k)(j)(i)(h)(g)(f)(e)(d)(c)(b)(a)(z)10018151704424938220040326945182553001772253931967801001Unweighted Total100181117544*24437920139327642*18856*3011832303761927731001Weighted Total19715823115770321033118331167344611662159184Yes, respondent20%19%13%25%24%z18%16%26%zj11%43%zadefgh17%19%22%19%20%31%zadefh33%zadefgh21%z18%jp
134110186464827572511256472329562695130Yes, other household13%14%10%14%19%z13%13%15%j9%26%zabcdegh13%10%16%a13%13%15%13%12%13%jmember
699564139271532741472512231513442198130162220113542714No70%70%79%zq61%63%72%73%64%81%zk35%71%bci75%bci66%ci71%bci70%bci58%i59%i70%bci71%bcfiknq
Public Perceptions of the NHS and Social CareFINAL PUBLIC
Table 291QE. Do you, or anyone else in your household have any long-standing illness, disability or infirmity? If yes, is that you or someone in your household?
Base : All respondents
Respondent type : General public aged 16+ Fieldwork dates : 14th November - 9th December 2011Source : Ipsos MORI (JN10-039262-01)Proportions/Means: Columns Tested (5% risk level) - z/a/b/c/d/e/f/g/h/i - z/j/k - z/l/m - z/n/o - z/p/q - z/rOverlap formulae used. * small base

UnwtdtotalWork StatusSocial GradeAgeGender
Full/part-Wtd.OtherUnemployedRetiredtimeDEC2C1AB65+55-6435-5425-3416-24FemaleMaleTotal
(p)(o)(n)(m)(l)(k)(j)(i)(h)(g)(f)(e)(d)(c)(b)(a)(z)19741208155802651406742671299899197Unweighted Total19737*19**70*58*75*23**48*38*59*35*67*13**10**90*93*184Weighted Total18028186854641947375632591288583167Agree91%76%95%96%zo93%o86%83%98%zk97%95%92%88%93%78%93%89%91%o
179134104113381261116Disagree9%24%zlm5%4%7%14%i17%2%3%5%8%12%7%22%7%11%9%im
-----------------Don't know/Refused-----------------
Public Perceptions of the NHS and Social CareFINAL PUBLIC
Table 292QF. On the whole, do you agree or disagree with the following statement:
I know where to go for information to help me manage my condition.
Base : All respondents who have a long-standing illness, disability or infirmity
Respondent type : General public aged 16+ Fieldwork dates : 14th November - 9th December 2011Source : Ipsos MORI (JN10-039262-01)Proportions/Means: Columns Tested (5% risk level) - z/a/b - z/c/d/e/f/g - z/h/i/j/k - z/l/m/n/o - z/pOverlap formulae used. * small base; ** very small base (under 30) ineligible for sig testing

People aretreated with
Unwtddignity andtotalrespectNHS useHospital useEthnicityNHS/social care staffHousehold TypeHome Ownership
NotAdultshospitalHospitalInformalSocialwith
Non NHS/A&E/A&EsocialcareKnow NHSNHSdependentNon-Owner -PrivateSocialWtd.DisagreeAgreeuserNHS useruseruserMixedWhiteAsianBlackcarerworkerstaffstaffchildrenpensionerPensionerOtheroccupierrenterrenterTotal
(v)(u)(t)(s)(r)(q)(p)(o)(n)(m)(l)(k)(j)(i)(h)(g)(f)(e)(d)(c)(b)(a)(z)19770120818946151116942151366834877611192156197Unweighted Total19765*1128**17645*1391**1584**19**49*3**61*8**34*83*66*1**11120**52*184Weighted Total18054107815942126-14741547359730746311081345167Agree91%83%96%zu100%91%93%90%-93%z100%81%96%100%97%z86%88%89%95%100%97%za66%87%91%u
17115-16313111-42-21493-37716Disagree9%17%zt4%-9%7%10%100%7%-19%4%-3%14%12%11%5%-3%34%13%c9%cint
-----------------------Don't know/Refused-----------------------
Public Perceptions of the NHS and Social CareFINAL PUBLIC
Table 293QF. On the whole, do you agree or disagree with the following statement:
I know where to go for information to help me manage my condition.
Base : All respondents who have a long-standing illness, disability or infirmity
Respondent type : General public aged 16+ Fieldwork dates : 14th November - 9th December 2011Source : Ipsos MORI (JN10-039262-01)Proportions/Means: Columns Tested (5% risk level) - z/a/b/c/d - z/e/f/g - z/h/i/j/k - z/l/m/n/o - z/p/q - z/r/s - z/t/u - z/vOverlap formulae used. * small base; ** very small base (under 30) ineligible for sig testing

UnwtdtotalFuture of NHSSatisfaction with NHSGOR
DisYorkshire &WestEastWtd.WorseSameBettersatisfiedSatisfiedHumbersideMidlandsSouth-WestSouth-EastNorth-WestNorth-EastLondonEasternMidlandsTotal
(o)(n)(m)(l)(k)(j)(i)(h)(g)(f)(e)(d)(c)(b)(a)(z)19760567640125152521213411183220197Unweighted Total19755*54*70*38*11616**25**19**21**31*9**18**27*18**184Weighted Total1804851632711314231421279172517167Agree91%88%95%90%71%98%zk87%92%74%100%88%100%95%94%95%91%k
17737113225-4-12116Disagree9%12%5%10%29%zj2%13%8%26%-12%-5%6%5%9%j
----------------Don't know/Refused----------------
Public Perceptions of the NHS and Social CareFINAL PUBLIC
Table 294QF. On the whole, do you agree or disagree with the following statement:
I know where to go for information to help me manage my condition.
Base : All respondents who have a long-standing illness, disability or infirmity
Respondent type : General public aged 16+ Fieldwork dates : 14th November - 9th December 2011Source : Ipsos MORI (JN10-039262-01)Proportions/Means: Columns Tested (5% risk level) - z/a/b/c/d/e/f/g/h/i - z/j/k - z/l/m/n - z/oOverlap formulae used. * small base; ** very small base (under 30) ineligible for sig testing

UnwtdPrivate healthSatisfaction withImpact of NHS reformsGovernment has righttotalinsurancesocial careon patientsNHS policyNHS use in last year
SocialNHSDissatisficareWalk InChoicesPharmacistWtd.
NoYesedSatisfiedWorseBetterDisagreeAgreeservicesClinicwebsite/ChemistNHS DirectA&EOutpatientInpatientGPTotal(r)(q)(p)(o)(n)(m)(l)(k)(j)(i)(h)(g)(f)(e)(d)(c)(b)(a)(z)19716924126275351113320351171364912767171197Unweighted Total19715823**11**57*70*32*10331*18**33*11**67*34*46*11662*159184Weighted Total1801412310526427923016301163324010355142167Agree91%90%100%93%90%92%82%90%97%90%91%100%94%94%88%89%89%90%91%1716-166611123-4261371616Disagree9%10%-7%10%8%18%10%3%10%9%-6%6%12%11%11%10%9%-------------------Don't know/Refused-------------------
Public Perceptions of the NHS and Social CareFINAL PUBLIC
Table 295QF. On the whole, do you agree or disagree with the following statement:
I know where to go for information to help me manage my condition.
Base : All respondents who have a long-standing illness, disability or infirmity
Respondent type : General public aged 16+ Fieldwork dates : 14th November - 9th December 2011Source : Ipsos MORI (JN10-039262-01)Proportions/Means: Columns Tested (5% risk level) - z/a/b/c/d/e/f/g/h/i - z/j/k - z/l/m - z/n/o - z/p/q - z/rOverlap formulae used. * small base; ** very small base (under 30) ineligible for sig testing

UnwtdtotalWork StatusSocial GradeAgeGender
Full/part-Wtd.OtherUnemployedRetiredtimeDEC2C1AB65+55-6435-5425-3416-24FemaleMaleTotal
(p)(o)(n)(m)(l)(k)(j)(i)(h)(g)(f)(e)(d)(c)(b)(a)(z)1001162612705082472013062472201693311581235274741001Unweighted Total100115758*2355512392013122491981433501671435154861001Weighted Total3331812179987167759315870561113150157307Owned outright33%12%20%76%zlno18%30%34%i24%37%zi80%zcdef49%zcde16%d7%9%29%32%31%cdeilo
3165571325933751111159331766451172161333Buying on mortgage32%35%mn12%5%47%zmno14%37%k36%k46%zik5%23%g50%zcdfg38%fg35%fg33%33%33%fgkmn
822412143241172041110291616443882Rented from local8%15%zlm21%zlm6%6%17%zhij9%h6%h2%6%7%8%9%11%8%8%8%hlauthority
91171512474112299814371815613091Rented from Housing9%11%m26%zlmo5%8%17%zhij6%9%h4%4%9%g11%g10%g10%g12%za6%9%aghmAssociation
1693813151125129712710155158448791178Rented from private17%24%zm22%m6%20%zm22%h14%23%zhj11%5%10%g15%g35%zefg31%zefg17%19%18%fghmlandlord3--21-1112-1---33Other*--1%*-***1%-*---1%*75--21-6--2-15267Refused1%3%zlm--**-2%zhj--1%e-1%3%zeg*1%1%
Public Perceptions of the NHS and Social CareFINAL PUBLIC
Table 296QG. Which of these best describes the ownership of your home?
Base : All respondents
Respondent type : General public aged 16+ Fieldwork dates : 14th November - 9th December 2011Source : Ipsos MORI (JN10-039262-01)Proportions/Means: Columns Tested (5% risk level) - z/a/b - z/c/d/e/f/g - z/h/i/j/k - z/l/m/n/o - z/pOverlap formulae used. * small base

People aretreated with
Unwtddignity andtotalrespectNHS useHospital useEthnicityNHS/social care staffHousehold TypeHome Ownership
NotAdultshospitalHospitalInformalSocialwith
Non NHS/A&E/A&EsocialcareKnow NHSNHSdependentNon-Owner -PrivateSocialWtd.DisagreeAgreeuserNHS useruseruserMixedWhiteAsianBlackcarerworkerstaffstaffchildrenpensionerPensionerOtheroccupierrenterrenterTotal
(v)(u)(t)(s)(r)(q)(p)(o)(n)(m)(l)(k)(j)(i)(h)(g)(f)(e)(d)(c)(b)(a)(z)100130864710090145854310750741612543628951291461249106491691731001Unweighted Total1001304652104*89746853311**74778*15925038*29252*30547522110**6401781731001Weighted Total3339719120287129178125213398810821430107170-307--307Owned outright33%32%29%19%32%zs27%33%zq9%34%zlm17%25%35%i26%28%27%10%23%g77%zfg-48%zab--31%abfgmq
s
31698221492841731602245265881111162814917312-333--333Buying on mortgage32%32%34%47%zr32%37%zp30%19%33%33%36%33%29%40%zk53%zjk49%zef36%e5%-52%zab--33%abepr
8220557753844-52228192172264115---8282Rented from local8%6%8%7%8%8%8%-7%2%18%zmn8%5%6%4%8%9%7%---48%zbc8%bcnauthority
91296111804051170109267221344710---9191Rented from Housing9%10%9%11%9%9%9%10%9%13%6%10%17%h8%2%11%e10%e4%---52%zbc9%bceAssociation
16957117161628296712125243395376510013--178-178Rented from private17%19%18%15%18%18%18%62%16%32%zln15%13%23%18%14%21%e21%ze6%--100%zac-18%aceknlandlord3-3-312-3--1-1--213---3Other*-*-***-*--*-*--**27%---*7251752-4212-2-25-7---7Refused1%1%1%1%1%1%*-1%3%n1%1%-1%-1%1%-73%---1%c
Public Perceptions of the NHS and Social CareFINAL PUBLIC
Table 297QG. Which of these best describes the ownership of your home?
Base : All respondents
Respondent type : General public aged 16+ Fieldwork dates : 14th November - 9th December 2011Source : Ipsos MORI (JN10-039262-01)Proportions/Means: Columns Tested (5% risk level) - z/a/b/c/d - z/e/f/g - z/h/i/j/k - z/l/m/n/o - z/p/q - z/r/s - z/t/u - z/vOverlap formulae used. * small base; ** very small base (under 30) ineligible for sig testing

UnwtdtotalFuture of NHSSatisfaction with NHSGOR
DisYorkshire &WestEastWtd.WorseSameBettersatisfiedSatisfiedHumbersideMidlandsSouth-WestSouth-EastNorth-WestNorth-EastLondonEasternMidlandsTotal
(o)(n)(m)(l)(k)(j)(i)(h)(g)(f)(e)(d)(c)(b)(a)(z)1001328298343168703909910715413955143126881001Unweighted Total1001327302340168701100*106*10216213651*14810986*1001Weighted Total333939410742228275030494222203829307Owned outright33%28%31%31%25%33%27%c47%zcefgi29%c30%c31%c42%c14%35%c34%c31%c
31611110111562221332830673615394541333Buying on mortgage32%34%34%34%37%32%33%26%29%41%zceh26%30%26%41%ceh48%zcdegh33%c
82292825175661115532313682Rented from local8%9%9%7%10%8%6%10%bef14%zbdef3%2%3%21%zabdefhi3%7%8%befauthority
9127273220627391834-162291Rented from Housing9%8%9%9%12%9%7%d2%9%bdh11%abdh25%zabcdfghi-10%abdh2%3%9%abdhAssociation
1696549592712625131821221342196178Rented from private17%20%16%17%16%18%25%afh12%18%a13%16%25%afh28%zabefh17%a8%18%alandlord3-21-31------2-3Other*-1%*-*1%------2%z-*7312-6-2-3--1-17Refused1%1%*1%-1%-2%-2%--1%-1%1%
Public Perceptions of the NHS and Social CareFINAL PUBLIC
Table 298QG. Which of these best describes the ownership of your home?
Base : All respondents
Respondent type : General public aged 16+ Fieldwork dates : 14th November - 9th December 2011Source : Ipsos MORI (JN10-039262-01)Proportions/Means: Columns Tested (5% risk level) - z/a/b/c/d/e/f/g/h/i - z/j/k - z/l/m/n - z/oOverlap formulae used. * small base

UnwtdPrivate healthSatisfaction withImpact of NHS reformsGovernment has righttotalinsurancesocial careon patientsNHS policyNHS use in last year
SocialNHSDissatisficareWalk InChoicesPharmacistWtd.
NoYesedSatisfiedWorseBetterDisagreeAgreeservicesClinicwebsite/ChemistNHS DirectA&EOutpatientInpatientGPTotal(r)(q)(p)(o)(n)(m)(l)(k)(j)(i)(h)(g)(f)(e)(d)(c)(b)(a)(z)10018151704424938220040326945182553001772253931967801001Unweighted Total100181117544*24437920139327642*18856*3011832303761927731001Weighted Total333260431282125591218115371487375314659249307Owned outright33%32%zp24%28%34%33%30%31%29%36%deh19%24%29%eh20%23%39%zabdefg31%deh32%zdeh31%dehp
h
316234932276128661298756119104868010457251333Buying on mortgage32%29%53%zq49%zn31%34%33%33%32%12%33%i34%i34%ci47%zabcdfh35%ci28%i30%i32%ci33%ciq
i
8279251829222922101822282127206482Rented from local8%10%zp1%11%7%8%11%7%8%24%zabcdefg10%e4%7%5%9%e7%10%e8%e8%epauthority
h
91781232629193827625428192334226491Rented from Housing9%10%7%6%10%8%9%10%10%14%13%za6%9%11%10%9%11%8%9%Association
1691522424067357357646185933506134138178Rented from private17%19%14%5%16%18%17%19%21%14%24%zac32%zabcefi20%18%22%c16%17%18%18%olandlord33-----21-----12123Other**-----**-----*****751-21-22-1-1-11-67Refused1%1%1%-1%*-1%1%-1%-*-**-1%1%
Public Perceptions of the NHS and Social CareFINAL PUBLIC
Table 299QG. Which of these best describes the ownership of your home?
Base : All respondents
Respondent type : General public aged 16+ Fieldwork dates : 14th November - 9th December 2011Source : Ipsos MORI (JN10-039262-01)Proportions/Means: Columns Tested (5% risk level) - z/a/b/c/d/e/f/g/h/i - z/j/k - z/l/m - z/n/o - z/p/q - z/rOverlap formulae used. * small base

UnwtdtotalWork StatusSocial GradeAgeGender
Full/part-Wtd.OtherUnemployedRetiredtimeDEC2C1AB65+55-6435-5425-3416-24FemaleMaleTotal
(p)(o)(n)(m)(l)(k)(j)(i)(h)(g)(f)(e)(d)(c)(b)(a)(z)1001162612705082472013062472201693311581235274741001Unweighted Total100115758*2355512392013122491981433501671435154861001Weighted Total81513151210418221185249156177117262129126409402811No - No private81%84%l87%90%zl76%92%zhi92%zhi80%h63%89%zdef82%75%77%88%zde79%83%81%ehlinsurance
170225211271316559118248338139877175Yes - Have private17%14%8%9%23%zmno6%8%18%jk36%zijk9%17%g24%zcg22%cg9%19%16%17%cgjkmnhealth insurance1643355182335148715Refused/Not stated2%2%5%zl1%1%2%*2%1%1%2%1%1%3%2%1%2%
Public Perceptions of the NHS and Social CareFINAL PUBLIC
Table 300QH. Do you have private health insurance, in addition to the NHS?
Base : All respondents
Respondent type : General public aged 16+ Fieldwork dates : 14th November - 9th December 2011Source : Ipsos MORI (JN10-039262-01)Proportions/Means: Columns Tested (5% risk level) - z/a/b - z/c/d/e/f/g - z/h/i/j/k - z/l/m/n/o - z/pOverlap formulae used. * small base

People aretreated with
Unwtddignity andtotalrespectNHS useHospital useEthnicityNHS/social care staffHousehold TypeHome Ownership
NotAdultshospitalHospitalInformalSocialwith
Non NHS/A&E/A&EsocialcareKnow NHSNHSdependentNon-Owner -PrivateSocialWtd.DisagreeAgreeuserNHS useruseruserMixedWhiteAsianBlackcarerworkerstaffstaffchildrenpensionerPensionerOtheroccupierrenterrenterTotal
(v)(u)(t)(s)(r)(q)(p)(o)(n)(m)(l)(k)(j)(i)(h)(g)(f)(e)(d)(c)(b)(a)(z)100130864710090145854310750741612543628951291461249106491691731001Unweighted Total1001304652104*89746853311**74778*15925038*29252*30547522110**6401781731001Weighted Total8152355398173037943275946713720535225432323811988493152157811No - No private81%77%83%77%81%81%81%68%80%86%86%82%92%i77%83%76%80%89%zfg77%77%86%c91%zc81%cgininsurance
17066102221537996314391943365968862111352414175Yes - Have private17%22%zt16%21%17%17%18%32%19%zl11%12%17%8%22%zj17%22%ze18%e10%12%21%zab14%8%17%aelthealth insurance16311213105-10232-3-5831111215Refused/Not stated2%1%2%2%1%2%1%-1%3%2%1%-1%-2%2%1%11%2%1%1%2%
Public Perceptions of the NHS and Social CareFINAL PUBLIC
Table 301QH. Do you have private health insurance, in addition to the NHS?
Base : All respondents
Respondent type : General public aged 16+ Fieldwork dates : 14th November - 9th December 2011Source : Ipsos MORI (JN10-039262-01)Proportions/Means: Columns Tested (5% risk level) - z/a/b/c/d - z/e/f/g - z/h/i/j/k - z/l/m/n/o - z/p/q - z/r/s - z/t/u - z/vOverlap formulae used. * small base; ** very small base (under 30) ineligible for sig testing

UnwtdtotalFuture of NHSSatisfaction with NHSGOR
DisYorkshire &WestEastWtd.WorseSameBettersatisfiedSatisfiedHumbersideMidlandsSouth-WestSouth-EastNorth-WestNorth-EastLondonEasternMidlandsTotal
(o)(n)(m)(l)(k)(j)(i)(h)(g)(f)(e)(d)(c)(b)(a)(z)1001328298343168703909910715413955143126881001Unweighted Total1001327302340168701100*106*10216213651*14810986*1001Weighted Total815263250270134574838986113121431238172811No - No private81%80%83%79%80%82%83%f83%f85%f70%89%zbf83%83%f74%83%f81%bfinsurance
1706045673211717171548128202514175Yes - Have private17%18%15%20%19%17%17%16%14%30%zaceghi9%17%13%23%ce16%17%ehealth insurance16474210-1113-54115Refused/Not stated2%1%2%1%1%1%-1%1%1%2%-4%z3%1%2%
Public Perceptions of the NHS and Social CareFINAL PUBLIC
Table 302QH. Do you have private health insurance, in addition to the NHS?
Base : All respondents
Respondent type : General public aged 16+ Fieldwork dates : 14th November - 9th December 2011Source : Ipsos MORI (JN10-039262-01)Proportions/Means: Columns Tested (5% risk level) - z/a/b/c/d/e/f/g/h/i - z/j/k - z/l/m/n - z/oOverlap formulae used. * small base

UnwtdPrivate healthSatisfaction withImpact of NHS reformsGovernment has righttotalinsurancesocial careon patientsNHS policyNHS use in last year
SocialNHSDissatisficareWalk InChoicesPharmacistWtd.
NoYesedSatisfiedWorseBetterDisagreeAgreeservicesClinicwebsite/ChemistNHS DirectA&EOutpatientInpatientGPTotal(r)(q)(p)(o)(n)(m)(l)(k)(j)(i)(h)(g)(f)(e)(d)(c)(b)(a)(z)10018151704424938220040326945182553001772253931967801001Unweighted Total100181117544*24437920139327642*18856*3011832303761927731001Weighted Total815811-342053001613102233815336222124187307159623811No - No private81%100%zp-78%84%79%80%79%81%91%efg82%efg63%74%68%81%efg82%efg83%efg81%efg81%efgpinsurance
170-17593574367846232207656436431139175Yes - Have private17%-100%zq20%14%19%18%20%17%6%17%i35%zabcdhi25%zabcdhi31%zabcdhi19%i17%i16%i18%i17%iqhealth insurance16--146467221431521115Refused/Not stated2%--2%2%2%2%1%3%4%d1%2%1%1%*1%1%1%2%q
Public Perceptions of the NHS and Social CareFINAL PUBLIC
Table 303QH. Do you have private health insurance, in addition to the NHS?
Base : All respondents
Respondent type : General public aged 16+ Fieldwork dates : 14th November - 9th December 2011Source : Ipsos MORI (JN10-039262-01)Proportions/Means: Columns Tested (5% risk level) - z/a/b/c/d/e/f/g/h/i - z/j/k - z/l/m - z/n/o - z/p/q - z/rOverlap formulae used. * small base

UnwtdtotalWork StatusSocial GradeAgeGender
Full/part-Wtd.OtherUnemployedRetiredtimeDEC2C1AB65+55-6435-5425-3416-24FemaleMaleTotal
(p)(o)(n)(m)(l)(k)(j)(i)(h)(g)(f)(e)(d)(c)(b)(a)(z)1001162612705082472013062472201693311581235274741001Unweighted Total100115758*2355512392013122491981433501671435154861001Weighted Total
161221033944638552121226132238277159I am Black16%14%18%14%17%19%h19%h17%h8%11%16%17%g19%g16%16%16%16%gh
13017829723433421718224326186364127UK13%11%14%12%13%14%h17%h14%h7%9%15%12%15%13%12%13%13%h
18421127462-1105311819African2%3%m3%m*2%m3%2%2%1%-1%3%g3%g2%g2%2%2%gm
121-3841613-7118412Caribbean1%1%-1%2%2%*2%*1%-2%1%1%2%1%1%1---11-----1---11Other Black*---**-----*---**
742546432610212255272020344478I am Asian7%16%zlm6%3%8%m11%j5%7%9%3%4%8%g12%zfg14%zefg7%9%8%fgm
62--4--23-222-236UK1%1%--1%--1%1%-1%1%1%-*1%1%
173221273441-64791019Bangladeshi2%2%3%1%2%3%2%1%1%*-2%2%5%zfg2%2%2%
2151214625922105381422Indian2%3%2%1%3%3%1%2%3%1%1%3%3%2%2%3%2%m
2112118113432-67713922Pakistani2%8%zlm2%*1%5%zhi2%1%1%1%-2%4%fg5%zfg3%2%2%m
3---3-111--21--33Chinese*---1%-***--1%1%--1%*63-211-3212-12246Other Asian1%2%zl-1%**-1%1%*1%e-1%2%e*1%1%l
7501054319440516515023219917011425511396390358747I am White75%67%74%83%zlo74%69%75%75%80%zk86%zcde79%cd73%67%67%76%74%75%cdko
70193411903721531442151861661112419386354343697UK70%59%70%81%zlo68%64%71%69%75%k84%zcde77%zcd69%d56%60%69%71%70%cdko
4---41--31-12-224Irish*---1%*--1%*-*1%-***
185-31164432257215318Other White European2%3%-1%2%3%2%1%1%1%1%2%4%zg2%3%za1%2%a
277211962147128117191029Other White3%4%m4%m*3%m2%1%4%j3%*1%2%6%zefg5%g4%2%3%gm
10211712251-4236411I am mixed1%1%2%*1%*1%1%2%*-1%1%2%1%1%1%31--2-111--111213White and Black*1%--*-1%**--*1%1%***Caribbean
411-21-12--2-2224White and Black*1%2%m-**-*1%--1%-2%***African
Public Perceptions of the NHS and Social CareFINAL PUBLIC
Table 304QI. What ethnic origin on this card do you consider you belong to?
Base : All respondents
Respondent type : General public aged 16+ Fieldwork dates : 14th November - 9th December 2011Source : Ipsos MORI (JN10-039262-01)Proportions/Means: Columns Tested (5% risk level) - z/a/b - z/c/d/e/f/g - z/h/i/j/k - z/l/m/n/o - z/pOverlap formulae used. * small base

UnwtdtotalWork StatusSocial GradeAgeGender
Full/part-Wtd.OtherUnemployedRetiredtimeDEC2C1AB65+55-6435-5425-3416-24FemaleMaleTotal
(p)(o)(n)(m)(l)(k)(j)(i)(h)(g)(f)(e)(d)(c)(b)(a)(z)100115758*2355512392013122491981433501671435154861001Weighted Total
1---1-1----1---11White and Asian*---*-1%----*---**2--11---21--1-2-2Other Mixed*--**---1%*--1%-*-*32--11--2-11-1213Other*1%z--**--1%-1%*-1%***31-11-12-111--123Refused**-**-*1%-*1%*--***
Public Perceptions of the NHS and Social CareFINAL PUBLIC
Table 304QI. What ethnic origin on this card do you consider you belong to?
Base : All respondents
Respondent type : General public aged 16+ Fieldwork dates : 14th November - 9th December 2011Source : Ipsos MORI (JN10-039262-01)Proportions/Means: Columns Tested (5% risk level) - z/a/b - z/c/d/e/f/g - z/h/i/j/k - z/l/m/n/o - z/pOverlap formulae used. * small base

People aretreated with
Unwtddignity andtotalrespectNHS useHospital useEthnicityNHS/social care staffHousehold TypeHome Ownership
NotAdultshospitalHospitalInformalSocialwith
Non NHS/A&E/A&EsocialcareKnow NHSNHSdependentNon-Owner -PrivateSocialWtd.DisagreeAgreeuserNHS useruseruserMixedWhiteAsianBlackcarerworkerstaffstaffchildrenpensionerPensionerOtheroccupierrenterrenterTotal
(v)(u)(t)(s)(r)(q)(p)(o)(n)(m)(l)(k)(j)(i)(h)(g)(f)(e)(d)(c)(b)(a)(z)100130864710090145854310750741612543628951291461249106491691731001Unweighted Total1001304652104*89746853311**74778*15925038*29252*30547522110**6401781731001Weighted Total
16136118171428079---15936845125774281972437159I am Black16%12%18%zu17%16%17%15%---100%zmn14%20%15%23%19%16%13%12%15%14%21%z16%mnu
1303390171106166---127296345465625-912116127UK13%11%14%17%12%13%12%---80%zmn12%16%12%10%15%12%11%-14%12%9%13%mn
18217-19136---193-8591011311319African2%1%3%z-2%3%1%---12%zmn1%-3%9%zik3%e2%*12%1%1%8%zbc2%cenu
12210-1257---123132373-31812Caribbean1%1%2%-1%1%1%---8%zmn1%3%1%4%1%1%1%-*1%5%zbc1%cn
1-1-11----1-----1---1-1Other Black*-*-**----1%n-----*---1%c-*
74136211665127--78-15119441306239251278I am Asian7%4%9%zu11%7%11%zp5%--100%zln-6%3%7%8%13%zef6%e3%21%6%14%zac7%8%celnpu
6151523--6-3-31411-51-6UK1%*1%1%1%1%1%--7%zln-1%-1%2%1%**-1%*-1%n
17217316154--19-3-1-5121-68419Bangladeshi2%1%3%z2%2%3%zp1%--24%zln-1%-*-2%3%*-1%5%zc2%2%ceinpu
21714418184--22-316212921117222Indian2%2%2%4%2%4%zp1%--29%zln-1%3%2%4%4%ze2%1%10%2%4%1%2%np
21220121814--22-4-4-1642-107522Pakistani2%1%3%zu1%2%2%3%--28%zln-2%-2%-5%zef1%1%-2%4%3%2%cfnu
3-3-321--3-1-2-3---3--3Chinese*-1%-***--4%zln-*-1%-1%zf---1%--*6142451--6-1-31141132-6Other Asian1%*1%2%r*1%*--8%zln-*-1%2%*1%*11%*1%-1%npr
75024746175672330417-747--19730223342023601857497121122747I am White75%81%zt71%72%75%70%78%zq-100%zlm--79%h77%76%65%66%76%g84%zfg67%78%zb68%71%75%bglmq
t
70123342871626307390-697--1852621533179337180748297111697UK70%77%zt66%68%70%65%73%zq-93%zlm--74%69%73%63%59%71%g82%zfg67%75%zab54%64%70%bglmq
t
4-3-422-4--2-1-121-22-4Irish*-*-***-1%--1%-*-***-*1%-*
18511216810-18--31--981-97218Other White European2%2%2%2%2%2%2%-2%zl--1%3%i--3%e2%*-1%4%zc1%2%ei
279202271315-29--627113133-515929Other White3%3%3%2%3%3%3%-4%zl--3%6%3%2%4%e3%1%-1%9%zc5%c3%cl
10461105511---2-31371-37111I am mixed1%1%1%1%1%1%1%100%---1%-1%2%1%1%*-*4%zc1%1%cn
Public Perceptions of the NHS and Social CareFINAL PUBLIC
Table 305QI. What ethnic origin on this card do you consider you belong to?
Base : All respondents
Respondent type : General public aged 16+ Fieldwork dates : 14th November - 9th December 2011Source : Ipsos MORI (JN10-039262-01)Proportions/Means: Columns Tested (5% risk level) - z/a/b/c/d - z/e/f/g - z/h/i/j/k - z/l/m/n/o - z/p/q - z/r/s - z/t/u - z/vOverlap formulae used. * small base; ** very small base (under 30) ineligible for sig testing

People aretreated with
Unwtddignity andtotalrespectNHS useHospital useEthnicityNHS/social care staffHousehold TypeHome Ownership
NotAdultshospitalHospitalInformalSocialwith
Non NHS/A&E/A&EsocialcareKnow NHSNHSdependentNon-Owner -PrivateSocialWtd.DisagreeAgreeuserNHS useruseruserMixedWhiteAsianBlackcarerworkerstaffstaffchildrenpensionerPensionerOtheroccupierrenterrenterTotal
(v)(u)(t)(s)(r)(q)(p)(o)(n)(m)(l)(k)(j)(i)(h)(g)(f)(e)(d)(c)(b)(a)(z)1001304652104*89746853311**74778*15925038*29252*30547522110**6401781731001Weighted Total
321-3213-----2121--12-3White and Black*1%*-***31%-----1%2%k1%*--*1%c-*Caribbean
413-4224---1---13--1214White and Black***-***39%---*---*1%--*1%c1%*cAfrican
11-1-1-1-----1--1---1-1White and Asian**-1%zr-*-10%-----*--*---1%-*2-2-2-22---1----11-11-2Other Mixed*-*-*-*19%---*----**-*1%-*3-3-312------11-3--21-3Other*-*-***------*2%k-1%--*1%-*321-312------1-111-2-13Refused*1%*-***------*-***-*-1%*
Public Perceptions of the NHS and Social CareFINAL PUBLIC
Table 305QI. What ethnic origin on this card do you consider you belong to?
Base : All respondents
Respondent type : General public aged 16+ Fieldwork dates : 14th November - 9th December 2011Source : Ipsos MORI (JN10-039262-01)Proportions/Means: Columns Tested (5% risk level) - z/a/b/c/d - z/e/f/g - z/h/i/j/k - z/l/m/n/o - z/p/q - z/r/s - z/t/u - z/vOverlap formulae used. * small base; ** very small base (under 30) ineligible for sig testing

UnwtdtotalFuture of NHSSatisfaction with NHSGOR
DisYorkshire &WestEastWtd.WorseSameBettersatisfiedSatisfiedHumbersideMidlandsSouth-WestSouth-EastNorth-WestNorth-EastLondonEasternMidlandsTotal
(o)(n)(m)(l)(k)(j)(i)(h)(g)(f)(e)(d)(c)(b)(a)(z)1001328298343168703909910715413955143126881001Unweighted Total1001327302340168701100*106*10216213651*14810986*1001Weighted Total
1615046541812421625-2532271012159I am Black16%15%15%16%11%18%zk21%bfh6%f25%zbfh-19%bfh63%zabcefghi18%bfh9%f14%fh16%bfh
1303934451110019215-253211912127UK13%12%11%13%7%14%zk19%bcfh2%14%fh-19%zbcfh63%zabcefghi8%f8%fh14%fh13%cfhk
18882216116---101-19African2%2%3%1%1%2%1%1%5%zaef---7%zabefhi1%-2%l
1224657-25---5--12Caribbean1%1%1%2%3%z1%-2%5%zabefi---3%zef--1%11---1------1--1Other Black**---*------1%--*
741929261064382419-334578I am Asian7%6%10%8%6%9%z3%7%2%3%14%zbdfgi-22%zabdfghi3%6%8%bdfg
6-4215-211---2-6UK1%-1%n*1%1%-2%1%1%---1%-1%
17755414--1-6-11--19Bangladeshi2%2%2%2%3%2%--1%-5%zabfhi-8%zabdfghi--2%
2158821923-2--101322Indian2%2%3%2%1%3%2%3%-1%--7%zbefg1%4%eg2%
213108119-2--12-6-122Pakistani2%1%3%n2%1%3%-2%--9%zabdfghi-4%bfg-1%2%n
3-21-3------21-3Chinese*-1%*-*------2%z1%-*64-2231--1--3-16Other Asian1%1%-1%1%*1%--1%--2%z-1%1%
7502482242561375047493711549219859565747I am White75%76%74%75%81%zj72%74%cd87%zacdegi69%d95%zabcdeghi67%d37%57%d87%zacdegi76%cd75%cdej
7012372082361224787193681438918619163697UK70%72%69%69%73%68%71%cd87%zacdegi67%cd88%zacdegi65%cd35%41%83%zcdegi73%cd70%cd
4-1322------2114Irish*-*1%1%*------1%1%1%*
18277581-233-62118Other White European2%1%2%2%3%1%1%-2%2%2%-4%h2%1%2%jn
2798118151-17-1162129Other White3%3%3%3%5%2%1%-1%4%eh-2%11%zabdefghi2%1%3%ej
10523171-22--3-211I am mixed1%2%1%1%1%1%1%-2%1%--2%-3%1%321--21-1-----13White and Black*1%*--*1%-1%-----1%*Caribbean
421112--1---3--4White and Black*1%**1%*--1%---2%z--*African
Public Perceptions of the NHS and Social CareFINAL PUBLIC
Table 306QI. What ethnic origin on this card do you consider you belong to?
Base : All respondents
Respondent type : General public aged 16+ Fieldwork dates : 14th November - 9th December 2011Source : Ipsos MORI (JN10-039262-01)Proportions/Means: Columns Tested (5% risk level) - z/a/b/c/d/e/f/g/h/i - z/j/k - z/l/m/n - z/oOverlap formulae used. * small base

UnwtdtotalFuture of NHSSatisfaction with NHSGOR
DisYorkshire &WestEastWtd.WorseSameBettersatisfiedSatisfiedHumbersideMidlandsSouth-WestSouth-EastNorth-WestNorth-EastLondonEasternMidlandsTotal
(o)(n)(m)(l)(k)(j)(i)(h)(g)(f)(e)(d)(c)(b)(a)(z)1001327302340168701100*106*10216213651*14810986*1001Weighted Total
1--1----------11White and Asian*--*----------1%z*21-1-2---2-----2Other Mixed**-*-*---1%z-----*321--3--12-----3Other*1%*--*--1%1%z-----*32-12-1-1-----13Refused*1%-*1%j-1%-1%-----1%*
Public Perceptions of the NHS and Social CareFINAL PUBLIC
Table 306QI. What ethnic origin on this card do you consider you belong to?
Base : All respondents
Respondent type : General public aged 16+ Fieldwork dates : 14th November - 9th December 2011Source : Ipsos MORI (JN10-039262-01)Proportions/Means: Columns Tested (5% risk level) - z/a/b/c/d/e/f/g/h/i - z/j/k - z/l/m/n - z/oOverlap formulae used. * small base

UnwtdPrivate healthSatisfaction withImpact of NHS reformsGovernment has righttotalinsurancesocial careon patientsNHS policyNHS use in last year
SocialNHSDissatisficareWalk InChoicesPharmacistWtd.
NoYesedSatisfiedWorseBetterDisagreeAgreeservicesClinicwebsite/ChemistNHS DirectA&EOutpatientInpatientGPTotal(r)(q)(p)(o)(n)(m)(l)(k)(j)(i)(h)(g)(f)(e)(d)(c)(b)(a)(z)10018151704424938220040326945182553001772253931967801001Unweighted Total100181117544*24437920139327642*18856*3011832303761927731001Weighted Total
161137196295524674552154231415128122159I am Black16%17%11%13%12%14%12%17%16%11%11%8%14%17%h18%h14%14%16%16%h
13010618426461652395195332634462391127UK13%13%10%9%11%12%8%13%14%11%10%8%11%14%15%12%12%12%13%l
18181-17273-2-533221819African2%2%1%-*2%1%2%1%-1%-2%2%1%1%1%2%c2%cn
1212-222583---324321112Caribbean1%1%-5%z1%*3%m2%1%---1%1%2%1%1%1%1%11------1---1----11Other Black**------*---*----**
74679-1316291740-1611021013105178I am Asian7%8%5%-5%4%14%zm4%15%zk-9%cdefi1%3%e1%4%4%5%e7%cef8%acdefkm
642-31322---1-22-56UK1%*1%-1%*1%*1%---*-1%*-1%1%
17161-437310-4-1-2111319Bangladeshi2%2%1%-2%1%4%zm1%4%zk-2%cef-*-1%**2%c2%cfkm
21175-35688-5-521411522Indian2%2%3%-1%1%3%2%3%-3%-2%1%*1%1%2%2%cd
21211-239118-7-2-5671322Pakistani2%3%1%-1%1%5%zm*6%zk-4%acef-1%-2%1%4%acef2%2%efkm
33---21-1------1-33Chinese**---1%1%-*------*-**65---2232--11---136Other Asian1%1%---*1%1%1%--1%c*---**1%
750594143382003011453031843614749245148173305153585747I am White75%73%82%zq87%82%z79%z72%77%j67%86%78%87%z81%zad81%z75%81%zad80%76%75%jq
701554132361942821322891653313440229140161284147542697UK70%68%76%82%80%z74%zl66%74%zj60%80%71%70%76%zad77%za70%76%za77%za70%70%j
431--2121-2-11-2144Irish**1%--1%*1%*-1%-**-1%*1%*
18144-23548123625721318Other White European2%2%2%-1%1%3%1%3%2%1%5%b2%1%2%2%1%2%2%m
27245241478102969471132529Other White3%3%3%5%2%4%3%2%4%5%5%b11%zabcdef3%2%3%3%2%3%3%
1073-15234-211134-911I am mixed1%1%2%-*1%1%1%2%-1%2%b*1%2%1%-1%1%321--2-11--1-11--33White and Black**1%--1%-**--2%zbcf-1%1%--**Caribbean
44---1212-1---12-34White and Black*1%---*1%*1%-1%---*1%-**African
Public Perceptions of the NHS and Social CareFINAL PUBLIC
Table 307QI. What ethnic origin on this card do you consider you belong to?
Base : All respondents
Respondent type : General public aged 16+ Fieldwork dates : 14th November - 9th December 2011Source : Ipsos MORI (JN10-039262-01)Proportions/Means: Columns Tested (5% risk level) - z/a/b/c/d/e/f/g/h/i - z/j/k - z/l/m - z/n/o - z/p/q - z/rOverlap formulae used. * small base

UnwtdPrivate healthSatisfaction withImpact of NHS reformsGovernment has righttotalinsurancesocial careon patientsNHS policyNHS use in last year
SocialNHSDissatisficareWalk InChoicesPharmacistWtd.
NoYesedSatisfiedWorseBetterDisagreeAgreeservicesClinicwebsite/ChemistNHS DirectA&EOutpatientInpatientGPTotal(r)(q)(p)(o)(n)(m)(l)(k)(j)(i)(h)(g)(f)(e)(d)(c)(b)(a)(z)100181117544*24437920139327642*18856*3011832303761927731001Weighted Total
1-1--1------------1White and Asian*-1%q--*------------*211-11-11-1-1-12-22Other Mixed**1%-**-**-1%-*-1%1%-**321---1-2-111-21-33Other**1%---1%-1%-1%2%*-1%*-**33--12-3-1--1112133Refused**--**-1%-2%zh--*1%*****
Public Perceptions of the NHS and Social CareFINAL PUBLIC
Table 307QI. What ethnic origin on this card do you consider you belong to?
Base : All respondents
Respondent type : General public aged 16+ Fieldwork dates : 14th November - 9th December 2011Source : Ipsos MORI (JN10-039262-01)Proportions/Means: Columns Tested (5% risk level) - z/a/b/c/d/e/f/g/h/i - z/j/k - z/l/m - z/n/o - z/p/q - z/rOverlap formulae used. * small base

UnwtdtotalWork StatusSocial GradeAgeGender
Full/part-Wtd.OtherUnemployedRetiredtimeDEC2C1AB65+55-6435-5425-3416-24FemaleMaleTotal
(p)(o)(n)(m)(l)(k)(j)(i)(h)(g)(f)(e)(d)(c)(b)(a)(z)1001162612705082472013062472201693311581235274741001Unweighted Total100115758*2355512392013122491981433501671435154861001Weighted Total
51213471524223102993351752Yes - me personally5%1%2%1%8%zmo*2%8%zjk9%zjk1%7%cg8%zcg5%g2%7%za3%5%agjkmo
182285441083042585535256430319095185Yes - members of my18%18%8%19%20%n13%21%k19%22%k18%17%18%18%21%18%20%18%knfamily
13514916981620594211156725197860138Yes - friends13%9%16%m7%18%zmo7%10%19%zjk17%jk6%10%19%zfg15%g13%g15%12%14%gkmo
679117431753391941391921501529921611396336338674No68%74%zl74%75%zl62%81%zhij69%62%60%77%ze69%62%67%67%65%70%67%ehil
-----------------Don't know/Not sure-----------------
Public Perceptions of the NHS and Social CareFINAL PUBLIC
Table 308QJ. Do you personally, members of your family, or any of your friends work for the NHS in any capacity? IF YES - Is that you personally, a member of your family or a friend?
Base : All respondents
Respondent type : General public aged 16+ Fieldwork dates : 14th November - 9th December 2011Source : Ipsos MORI (JN10-039262-01)Proportions/Means: Columns Tested (5% risk level) - z/a/b - z/c/d/e/f/g - z/h/i/j/k - z/l/m/n/o - z/pOverlap formulae used. * small base

People aretreated with
Unwtddignity andtotalrespectNHS useHospital useEthnicityNHS/social care staffHousehold TypeHome Ownership
NotAdultshospitalHospitalInformalSocialwith
Non NHS/A&E/A&EsocialcareKnow NHSNHSdependentNon-Owner -PrivateSocialWtd.DisagreeAgreeuserNHS useruseruserMixedWhiteAsianBlackcarerworkerstaffstaffchildrenpensionerPensionerOtheroccupierrenterrenterTotal
(v)(u)(t)(s)(r)(q)(p)(o)(n)(m)(l)(k)(j)(i)(h)(g)(f)(e)(d)(c)(b)(a)(z)100130864710090145854310750741612543628951291461249106491691731001Unweighted Total1001304652104*89746853311**74778*15925038*29252*30547522110**6401781731001Weighted Total
5112396472725134412177185217315-427352Yes - me personally5%4%6%6%5%6%5%10%5%6%7%7%18%zik6%100%zijk5%6%e2%-7%za4%2%5%ae
182491281816783102214910236041851150963921303320185Yes - members of my18%16%20%17%19%18%19%20%20%z13%15%24%z11%63%zhjk21%16%20%18%22%20%a19%12%18%afamily
135311011312454832971323444138144679131892721138Yes - friends13%10%15%zu13%14%12%16%21%13%17%15%18%z11%47%zhjk27%z15%e17%ze6%8%14%15%12%14%eu
6792204247260332335164995710815124--2082981687415120132674No68%72%zt65%69%67%69%66%59%67%74%68%60%hi63%hi--68%63%76%zf71%65%67%76%zc67%cfhik
t
-----------------------Don't know/Not sure-----------------------
Public Perceptions of the NHS and Social CareFINAL PUBLIC
Table 309QJ. Do you personally, members of your family, or any of your friends work for the NHS in any capacity? IF YES - Is that you personally, a member of your family or a friend?
Base : All respondents
Respondent type : General public aged 16+ Fieldwork dates : 14th November - 9th December 2011Source : Ipsos MORI (JN10-039262-01)Proportions/Means: Columns Tested (5% risk level) - z/a/b/c/d - z/e/f/g - z/h/i/j/k - z/l/m/n/o - z/p/q - z/r/s - z/t/u - z/vOverlap formulae used. * small base; ** very small base (under 30) ineligible for sig testing

UnwtdtotalFuture of NHSSatisfaction with NHSGOR
DisYorkshire &WestEastWtd.WorseSameBettersatisfiedSatisfiedHumbersideMidlandsSouth-WestSouth-EastNorth-WestNorth-EastLondonEasternMidlandsTotal
(o)(n)(m)(l)(k)(j)(i)(h)(g)(f)(e)(d)(c)(b)(a)(z)1001328298343168703909910715413955143126881001Unweighted Total1001327302340168701100*106*10216213651*14810986*1001Weighted Total
51248201631645742671052Yes - me personally5%7%zm3%6%m9%zj4%6%4%5%4%3%4%4%7%12%zcef5%m
18265566027134351919232615161814185Yes - members of my18%20%19%18%16%19%35%zabcefgh18%19%14%19%29%zcf11%17%16%18%cfamily
13547414929881672317155202015138Yes - friends13%14%13%14%17%13%16%h7%22%zefh10%11%10%14%18%fh17%h14%h
67920920723211247355786412093291126954674No68%64%69%68%67%67%55%73%di63%74%di68%58%75%zabdgi63%63%67%i
----------------Don't know/Not sure----------------
Public Perceptions of the NHS and Social CareFINAL PUBLIC
Table 310QJ. Do you personally, members of your family, or any of your friends work for the NHS in any capacity? IF YES - Is that you personally, a member of your family or a friend?
Base : All respondents
Respondent type : General public aged 16+ Fieldwork dates : 14th November - 9th December 2011Source : Ipsos MORI (JN10-039262-01)Proportions/Means: Columns Tested (5% risk level) - z/a/b/c/d/e/f/g/h/i - z/j/k - z/l/m/n - z/oOverlap formulae used. * small base

UnwtdPrivate healthSatisfaction withImpact of NHS reformsGovernment has righttotalinsurancesocial careon patientsNHS policyNHS use in last year
SocialNHSDissatisficareWalk InChoicesPharmacistWtd.
NoYesedSatisfiedWorseBetterDisagreeAgreeservicesClinicwebsite/ChemistNHS DirectA&EOutpatientInpatientGPTotal(r)(q)(p)(o)(n)(m)(l)(k)(j)(i)(h)(g)(f)(e)(d)(c)(b)(a)(z)10018151704424938220040326945182553001772253931967801001Unweighted Total100181117544*24437920139327642*18856*3011832303761927731001Weighted Total
51439514275367559121191993952Yes - me personally5%5%5%11%6%7%zl2%9%zj2%11%dfh3%16%zabcdefh4%6%4%5%5%5%5%jl
1821434045977399239636106939387748139185Yes - members of my18%18%23%9%24%zo20%19%23%zj14%14%19%18%23%zad21%16%20%25%zad18%18%jfamily
1351043363752265833232174739435530108138Yes - friends13%13%19%zq14%15%14%13%15%12%4%17%i30%zabcdfh16%i21%zaci19%zai15%i16%i14%14%
i
679557104321502451412372013112326191108150247120522674No68%69%p60%72%62%65%70%60%73%zk75%eg65%g46%64%g59%65%g66%g63%g68%eg67%egknp
-------------------Don't know/Not sure-------------------
Public Perceptions of the NHS and Social CareFINAL PUBLIC
Table 311QJ. Do you personally, members of your family, or any of your friends work for the NHS in any capacity? IF YES - Is that you personally, a member of your family or a friend?
Base : All respondents
Respondent type : General public aged 16+ Fieldwork dates : 14th November - 9th December 2011Source : Ipsos MORI (JN10-039262-01)Proportions/Means: Columns Tested (5% risk level) - z/a/b/c/d/e/f/g/h/i - z/j/k - z/l/m - z/n/o - z/p/q - z/rOverlap formulae used. * small base

UnwtdtotalWork StatusSocial GradeAgeGender
Full/part-Wtd.OtherUnemployedRetiredtimeDEC2C1AB65+55-6435-5425-3416-24FemaleMaleTotal
(p)(o)(n)(m)(l)(k)(j)(i)(h)(g)(f)(e)(d)(c)(b)(a)(z)1001162612705082472013062472201693311581235274741001Unweighted Total100115758*2355512392013122491981433501671435154861001Weighted Total
36--33631016103517113261238Yes - me personally4%--1%6%zmno1%5%k5%k4%1%4%5%g6%g2%5%za2%4%agkmo
7899164622202613139341113285280Yes - members of my8%6%15%zmo7%8%9%10%8%5%7%7%10%6%9%5%11%zb8%bfamily
8784146416183123913381416523789Yes - friends9%5%6%6%12%zmo7%9%10%9%5%9%11%g8%11%g10%8%9%gmo
81214044202421195159247206173115272137111414393807No81%89%zln76%86%zln76%82%79%79%83%87%zce80%78%82%77%80%81%81%l
512-241---1-13325Don't know/Not sure*1%3%zlm-*2%zhi*---1%-1%2%zeg1%*1%
Public Perceptions of the NHS and Social CareFINAL PUBLIC
Table 312QK. Do you personally, members of your family, or any of your friends work in social care, for example in a residential home, for Meals on Wheels, for alocal authority social services department etc? IF YES - Is that you personally, a member of your family or a friend?
Base : All respondents
Respondent type : General public aged 16+ Fieldwork dates : 14th November - 9th December 2011Source : Ipsos MORI (JN10-039262-01)Proportions/Means: Columns Tested (5% risk level) - z/a/b - z/c/d/e/f/g - z/h/i/j/k - z/l/m/n/o - z/pOverlap formulae used. * small base

People aretreated with
Unwtddignity andtotalrespectNHS useHospital useEthnicityNHS/social care staffHousehold TypeHome Ownership
NotAdultshospitalHospitalInformalSocialwith
Non NHS/A&E/A&EsocialcareKnow NHSNHSdependentNon-Owner -PrivateSocialWtd.DisagreeAgreeuserNHS useruseruserMixedWhiteAsianBlackcarerworkerstaffstaffchildrenpensionerPensionerOtheroccupierrenterrenterTotal
(v)(u)(t)(s)(r)(q)(p)(o)(n)(m)(l)(k)(j)(i)(h)(g)(f)(e)(d)(c)(b)(a)(z)100130864710090145854310750741612543628951291461249106491691731001Unweighted Total1001304652104*89746853311**74778*15925038*29252*30547522110**6401781731001Weighted Total
3613234351821-301823387715186-219938Yes - me personally4%4%4%4%4%4%4%-4%2%5%9%zi100%zhik2%13%zi5%4%3%-3%5%5%4%
7824541367364416819252374244016-50181380Yes - members of my8%8%8%13%8%8%8%11%9%zm2%6%10%6%13%z8%8%8%7%-8%10%7%8%mfamily
8720657823356168513375595285011157131889Yes - friends9%7%10%7%9%7%11%zq11%9%7%8%15%z14%20%z10%9%11%e5%8%9%7%11%9%eq
812252519817263844231059670128172-202362403781889520146131807No81%83%80%78%81%82%79%89%80%90%zn81%69%j-69%j68%j79%80%85%z92%81%82%76%81%hijk
5-41441-3-21-2-14---145Don't know/Not sure*-1%1%*1%*-*-1%*-1%-*1%---*3%zc1%
Public Perceptions of the NHS and Social CareFINAL PUBLIC
Table 313QK. Do you personally, members of your family, or any of your friends work in social care, for example in a residential home, for Meals on Wheels, for alocal authority social services department etc? IF YES - Is that you personally, a member of your family or a friend?
Base : All respondents
Respondent type : General public aged 16+ Fieldwork dates : 14th November - 9th December 2011Source : Ipsos MORI (JN10-039262-01)Proportions/Means: Columns Tested (5% risk level) - z/a/b/c/d - z/e/f/g - z/h/i/j/k - z/l/m/n/o - z/p/q - z/r/s - z/t/u - z/vOverlap formulae used. * small base; ** very small base (under 30) ineligible for sig testing

UnwtdtotalFuture of NHSSatisfaction with NHSGOR
DisYorkshire &WestEastWtd.WorseSameBettersatisfiedSatisfiedHumbersideMidlandsSouth-WestSouth-EastNorth-WestNorth-EastLondonEasternMidlandsTotal
(o)(n)(m)(l)(k)(j)(i)(h)(g)(f)(e)(d)(c)(b)(a)(z)1001328298343168703909910715413955143126881001Unweighted Total1001327302340168701100*106*10216213651*14810986*1001Weighted Total
36141013122339375215338Yes - me personally4%4%3%4%7%zj3%3%8%zc3%4%4%4%1%4%4%4%c
7827262417551610101011537880Yes - members of my8%8%9%7%10%8%16%zbcf10%c10%c6%8%c9%c2%7%10%c8%cfamily
87312234185513315119610121089Yes - friends9%9%7%10%11%8%13%h3%15%zcefh7%6%11%h7%11%h11%h9%h
812259248275128574748472133113401368967807No81%79%82%81%76%82%74%79%70%82%g83%g77%92%zabdefghi81%78%81%g
522114--311----5Don't know/Not sure*1%1%*1%1%--3%zc1%1%----1%
Public Perceptions of the NHS and Social CareFINAL PUBLIC
Table 314QK. Do you personally, members of your family, or any of your friends work in social care, for example in a residential home, for Meals on Wheels, for alocal authority social services department etc? IF YES - Is that you personally, a member of your family or a friend?
Base : All respondents
Respondent type : General public aged 16+ Fieldwork dates : 14th November - 9th December 2011Source : Ipsos MORI (JN10-039262-01)Proportions/Means: Columns Tested (5% risk level) - z/a/b/c/d/e/f/g/h/i - z/j/k - z/l/m/n - z/oOverlap formulae used. * small base

UnwtdPrivate healthSatisfaction withImpact of NHS reformsGovernment has righttotalinsurancesocial careon patientsNHS policyNHS use in last year
SocialNHSDissatisficareWalk InChoicesPharmacistWtd.
NoYesedSatisfiedWorseBetterDisagreeAgreeservicesClinicwebsite/ChemistNHS DirectA&EOutpatientInpatientGPTotal(r)(q)(p)(o)(n)(m)(l)(k)(j)(i)(h)(g)(f)(e)(d)(c)(b)(a)(z)10018151704424938220040326945182553001772253931967801001Unweighted Total100181117544*24437920139327642*18856*3011832303761927731001Weighted Total
3635311016816122132119131492838Yes - me personally4%4%2%2%4%4%4%4%4%5%7%za3%4%5%5%4%4%4%4%
78641533135133416516930232331186180Yes - members of my8%8%8%6%13%z9%6%9%6%11%8%16%za10%12%za10%8%9%8%8%family
876918526331736244221035283237247089Yes - friends9%8%10%11%11%9%8%9%9%8%12%17%za12%15%zac14%za10%12%9%9%
812651144371833021663142303314241233131169300146624807No81%80%82%83%75%80%83%80%83%78%76%72%78%72%74%80%de76%81%de81%den
55----211---2-1--45Don't know/Not sure*1%----1%**---1%-*--1%1%
Public Perceptions of the NHS and Social CareFINAL PUBLIC
Table 315QK. Do you personally, members of your family, or any of your friends work in social care, for example in a residential home, for Meals on Wheels, for alocal authority social services department etc? IF YES - Is that you personally, a member of your family or a friend?
Base : All respondents
Respondent type : General public aged 16+ Fieldwork dates : 14th November - 9th December 2011Source : Ipsos MORI (JN10-039262-01)Proportions/Means: Columns Tested (5% risk level) - z/a/b/c/d/e/f/g/h/i - z/j/k - z/l/m - z/n/o - z/p/q - z/rOverlap formulae used. * small base

UnwtdtotalWork StatusSocial GradeAgeGender
Full/part-Wtd.OtherUnemployedRetiredtimeDEC2C1AB65+55-6435-5425-3416-24FemaleMaleTotal
(p)(o)(n)(m)(l)(k)(j)(i)(h)(g)(f)(e)(d)(c)(b)(a)(z)1001162612705082472013062472201693311581235274741001Unweighted Total100115758*2355512392013122491981433501671435154861001Weighted Total20421154711737425566373287242110595200Yes - for family20%14%25%o20%21%o16%21%17%27%zik19%22%25%zcd14%15%20%20%20%dko
2122216368523125-111022Yes - for friend2%1%3%1%3%m1%3%3%2%1%2%3%c3%c-2%2%2%m
2741713656967642151025Yes - for neighbour3%2%2%3%2%2%2%2%4%3%5%2%2%2%3%2%3%
213261111-834292514822Yes - for someone else2%2%3%2%2%4%zhj-3%j1%2%2%3%1%3%3%2%2%j
74513039178403184151242172152101244136116378371749No74%82%zln68%76%73%77%h75%78%h69%77%71%70%81%zef81%ef73%76%75%eh
21--11-1--11--2-2Don't know/Not sure*1%--**-*--1%*--*-*
Public Perceptions of the NHS and Social CareFINAL PUBLIC
Table 316QL. Do you look after, or give any help or support to family members, neighbours or others because of long term physical or mental ill health or disability, or problemsrelated to old age? Do not count anything you do as part of your paid employment. IF YES - Is that for a member of your family, a friend, a neighbour or for someone else?
Base : All respondents
Respondent type : General public aged 16+ Fieldwork dates : 14th November - 9th December 2011Source : Ipsos MORI (JN10-039262-01)Proportions/Means: Columns Tested (5% risk level) - z/a/b - z/c/d/e/f/g - z/h/i/j/k - z/l/m/n/o - z/pOverlap formulae used. * small base

People aretreated with
Unwtddignity andtotalrespectNHS useHospital useEthnicityNHS/social care staffHousehold TypeHome Ownership
NotAdultshospitalHospitalInformalSocialwith
Non NHS/A&E/A&EsocialcareKnow NHSNHSdependentNon-Owner -PrivateSocialWtd.DisagreeAgreeuserNHS useruseruserMixedWhiteAsianBlackcarerworkerstaffstaffchildrenpensionerPensionerOtheroccupierrenterrenterTotal
(v)(u)(t)(s)(r)(q)(p)(o)(n)(m)(l)(k)(j)(i)(h)(g)(f)(e)(d)(c)(b)(a)(z)100130864710090145854310750741612543628951291461249106491691731001Unweighted Total1001304652104*89746853311**74778*15925038*29252*30547522110**6401781731001Weighted Total2046912213188921082160112720015751262984031372535200Yes - for family20%23%19%12%21%zs20%20%20%21%14%17%80%zhij40%z26%z23%20%21%18%28%21%b14%20%20%bs
211010219912-18-322413181211152422Yes - for friend2%3%2%2%2%2%2%-2%-2%9%zi12%z4%z2%3%e3%e*8%2%1%2%2%e
279142231016-24-12521331087-176225Yes - for neighbour3%3%2%2%3%2%3%-3%z-*10%zi5%4%z5%3%2%3%-3%4%1%3%
21714-22814-1345224517951115422Yes - for someone else2%2%2%-2%2%3%-2%5%3%9%zi9%zi2%2%2%2%2%8%2%3%2%2%
74521749989660354395954863123-16199362243571697470145128749No74%72%77%85%zr74%76%74%80%73%81%78%-41%k68%jk68%jk73%75%76%63%73%82%zc74%75%ijkr
2-1112--2----1-11-11--2Don't know/Not sure*-*1%**--*----*-**-8%*--*
Public Perceptions of the NHS and Social CareFINAL PUBLIC
Table 317QL. Do you look after, or give any help or support to family members, neighbours or others because of long term physical or mental ill health or disability, or problemsrelated to old age? Do not count anything you do as part of your paid employment. IF YES - Is that for a member of your family, a friend, a neighbour or for someone else?
Base : All respondents
Respondent type : General public aged 16+ Fieldwork dates : 14th November - 9th December 2011Source : Ipsos MORI (JN10-039262-01)Proportions/Means: Columns Tested (5% risk level) - z/a/b/c/d - z/e/f/g - z/h/i/j/k - z/l/m/n/o - z/p/q - z/r/s - z/t/u - z/vOverlap formulae used. * small base; ** very small base (under 30) ineligible for sig testing

UnwtdtotalFuture of NHSSatisfaction with NHSGOR
DisYorkshire &WestEastWtd.WorseSameBettersatisfiedSatisfiedHumbersideMidlandsSouth-WestSouth-EastNorth-WestNorth-EastLondonEasternMidlandsTotal
(o)(n)(m)(l)(k)(j)(i)(h)(g)(f)(e)(d)(c)(b)(a)(z)1001328298343168703909910715413955143126881001Unweighted Total1001327302340168701100*106*10216213651*14810986*1001Weighted Total20472616443125181820322314193126200Yes - for family20%22%20%19%26%zj18%18%17%20%20%17%27%c13%28%zce30%zcehi20%cj
2196751143412-23222Yes - for friend2%3%2%2%3%2%4%3%4%1%2%-1%3%2%2%j
271041171622533116325Yes - for neighbour3%3%1%3%4%2%2%2%4%c2%2%1%1%5%zc3%3%
216510416232-8-51-22Yes - for someone else2%2%2%3%3%2%2%3%f2%-6%zaf-4%f1%-2%
74524123124911453977847412799371237355749No74%74%77%73%68%77%zk77%79%a73%78%ab73%72%83%zabe67%64%75%abk
21-1-2---11----2Don't know/Not sure**-*-*---1%1%----*
Public Perceptions of the NHS and Social CareFINAL PUBLIC
Table 318QL. Do you look after, or give any help or support to family members, neighbours or others because of long term physical or mental ill health or disability, or problemsrelated to old age? Do not count anything you do as part of your paid employment. IF YES - Is that for a member of your family, a friend, a neighbour or for someone else?
Base : All respondents
Respondent type : General public aged 16+ Fieldwork dates : 14th November - 9th December 2011Source : Ipsos MORI (JN10-039262-01)Proportions/Means: Columns Tested (5% risk level) - z/a/b/c/d/e/f/g/h/i - z/j/k - z/l/m/n - z/oOverlap formulae used. * small base

UnwtdPrivate healthSatisfaction withImpact of NHS reformsGovernment has righttotalinsurancesocial careon patientsNHS policyNHS use in last year
SocialNHSDissatisficareWalk InChoicesPharmacistWtd.
NoYesedSatisfiedWorseBetterDisagreeAgreeservicesClinicwebsite/ChemistNHS DirectA&EOutpatientInpatientGPTotal(r)(q)(p)(o)(n)(m)(l)(k)(j)(i)(h)(g)(f)(e)(d)(c)(b)(a)(z)10018151704424938220040326945182553001772253931967801001Unweighted Total100181117544*24437920139327642*18856*3011832303761927731001Weighted Total204162371886883998351139107342547537161200Yes - for family20%20%21%42%z35%z23%19%25%zj13%26%21%18%24%z23%24%20%19%21%20%j
21166-1210611628-7361151522Yes - for friend2%2%3%-5%z3%3%3%2%4%4%a-2%2%3%3%3%2%2%
27206261161261829851262225Yes - for neighbour3%2%3%4%3%3%3%3%2%2%5%3%3%4%2%3%3%3%3%
212011974811-51828941722Yes - for someone else2%3%1%2%4%z2%2%2%4%z-2%2%3%1%3%2%2%2%2%
745604132241412691512782193013243211132163279146570749No74%74%75%54%58%71%75%71%79%zk72%70%77%70%72%71%74%76%74%75%fkmno
22---------------12Don't know/Not sure**---------------**
Public Perceptions of the NHS and Social CareFINAL PUBLIC
Table 319QL. Do you look after, or give any help or support to family members, neighbours or others because of long term physical or mental ill health or disability, or problemsrelated to old age? Do not count anything you do as part of your paid employment. IF YES - Is that for a member of your family, a friend, a neighbour or for someone else?
Base : All respondents
Respondent type : General public aged 16+ Fieldwork dates : 14th November - 9th December 2011Source : Ipsos MORI (JN10-039262-01)Proportions/Means: Columns Tested (5% risk level) - z/a/b/c/d/e/f/g/h/i - z/j/k - z/l/m - z/n/o - z/p/q - z/rOverlap formulae used. * small base

UnwtdtotalWork StatusSocial GradeAgeGender
Full/part-Wtd.OtherUnemployedRetiredtimeDEC2C1AB65+55-6435-5425-3416-24FemaleMaleTotal
(p)(o)(n)(m)(l)(k)(j)(i)(h)(g)(f)(e)(d)(c)(b)(a)(z)254282067139555170785249993123139115254Unweighted Total25427**19**57*14754*50*69*77*46*41*104*32*27**135114250Weighted Total22322185412547476065433888272312198219Agree88%81%96%94%85%87%94%87%84%94%92%85%84%83%89%86%88%232-22043511121641111324Disagree9%7%-3%14%zm7%6%8%15%2%4%15%zg13%5%8%11%9%gm
831223-4122-13448Don't know/Refused3%11%4%3%1%6%-5%1%4%e4%e-3%12%3%3%3%l
Public Perceptions of the NHS and Social CareFINAL PUBLIC
Table 320QM. On the whole, do you agree or disagree with the following statement:
- I know where to go for information to help me care for this person/these people -
Base : All respondents who provide informal care
Respondent type : General public aged 16+ Fieldwork dates : 14th November - 9th December 2011Source : Ipsos MORI (JN10-039262-01)Proportions/Means: Columns Tested (5% risk level) - z/a/b - z/c/d/e/f/g - z/h/i/j/k - z/l/m/n/o - z/pOverlap formulae used. * small base; ** very small base (under 30) ineligible for sig testing

People aretreated with
Unwtddignity andtotalrespectNHS useHospital useEthnicityNHS/social care staffHousehold TypeHome Ownership
NotAdultshospitalHospitalInformalSocialwith
Non NHS/A&E/A&EsocialcareKnow NHSNHSdependentNon-Owner -PrivateSocialWtd.DisagreeAgreeuserNHS useruseruserMixedWhiteAsianBlackcarerworkerstaffstaffchildrenpensionerPensionerOtheroccupierrenterrenterTotal
(v)(u)(t)(s)(r)(q)(p)(o)(n)(m)(l)(k)(j)(i)(h)(g)(f)(e)(d)(c)(b)(a)(z)254871551523911414022001537254219217771176031763144254Unweighted Total25486*15215**2351121382**19715**36*25023**92*17**80*11752*3**16933*45*250Weighted Total223751361520410311621701334219237917681024921463041219Agree88%87%90%100%87%92%84%100%86%86%94%88%100%86%100%85%87%93%63%86%91%93%88%23813-24617-211224-12-10121-183224Disagree9%9%8%-10%6%13%-10%7%6%9%-13%-13%e11%e2%-11%9%5%9%e
843-835-61-8-1-23315-18Don't know/Refused3%4%2%-3%3%3%-3%7%-3%-1%-2%3%5%37%3%-2%3%
Public Perceptions of the NHS and Social CareFINAL PUBLIC
Table 321QM. On the whole, do you agree or disagree with the following statement:
- I know where to go for information to help me care for this person/these people -
Base : All respondents who provide informal care
Respondent type : General public aged 16+ Fieldwork dates : 14th November - 9th December 2011Source : Ipsos MORI (JN10-039262-01)Proportions/Means: Columns Tested (5% risk level) - z/a/b/c/d - z/e/f/g - z/h/i/j/k - z/l/m/n/o - z/p/q - z/r/s - z/t/u - z/vOverlap formulae used. * small base; ** very small base (under 30) ineligible for sig testing

UnwtdtotalFuture of NHSSatisfaction with NHSGOR
DisYorkshire &WestEastWtd.WorseSameBettersatisfiedSatisfiedHumbersideMidlandsSouth-WestSouth-EastNorth-WestNorth-EastLondonEasternMidlandsTotal
(o)(n)(m)(l)(k)(j)(i)(h)(g)(f)(e)(d)(c)(b)(a)(z)25487719255164212130323516254232254Unweighted Total25485*71*90*54*16023**22**28**34*36*14**25**36*31*250Weighted Total22370667842146212025332714232926219Agree88%82%94%zn87%78%91%zk89%90%89%96%be77%100%93%80%85%88%ek
23114891022216-16224Disagree9%13%6%9%17%zj6%11%10%8%4%17%-4%18%6%9%j
84-434--1-2-1138Don't know/Refused3%5%-4%5%2%--3%-6%-3%2%9%z3%
Public Perceptions of the NHS and Social CareFINAL PUBLIC
Table 322QM. On the whole, do you agree or disagree with the following statement:
- I know where to go for information to help me care for this person/these people -
Base : All respondents who provide informal care
Respondent type : General public aged 16+ Fieldwork dates : 14th November - 9th December 2011Source : Ipsos MORI (JN10-039262-01)Proportions/Means: Columns Tested (5% risk level) - z/a/b/c/d/e/f/g/h/i - z/j/k - z/l/m/n - z/oOverlap formulae used. * small base; ** very small base (under 30) ineligible for sig testing

UnwtdPrivate healthSatisfaction withImpact of NHS reformsGovernment has righttotalinsurancesocial careon patientsNHS policyNHS use in last year
SocialNHSDissatisficareWalk InChoicesPharmacistWtd.
NoYesedSatisfiedWorseBetterDisagreeAgreeservicesClinicwebsite/ChemistNHS DirectA&EOutpatientInpatientGPTotal(r)(q)(p)(o)(n)(m)(l)(k)(j)(i)(h)(g)(f)(e)(d)(c)(b)(a)(z)2542094320106110531175612531387506510146205254Unweighted Total25420543*20**10311050*11557*12**55*13**89*51*67*97*45*201250Weighted Total2231833518919546101481247117741578137176219Agree88%89%81%90%89%86%92%88%85%100%84%84%86%80%85%84%82%88%88%2315729103115-6211981371924Disagree9%8%17%10%8%9%6%10%10%-11%16%12%18%za12%14%16%10%9%q
861-35133-3-2123168Don't know/Refused3%3%3%-3%4%2%2%6%-5%-2%2%3%3%2%3%3%
Public Perceptions of the NHS and Social CareFINAL PUBLIC
Table 323QM. On the whole, do you agree or disagree with the following statement:
- I know where to go for information to help me care for this person/these people -
Base : All respondents who provide informal care
Respondent type : General public aged 16+ Fieldwork dates : 14th November - 9th December 2011Source : Ipsos MORI (JN10-039262-01)Proportions/Means: Columns Tested (5% risk level) - z/a/b/c/d/e/f/g/h/i - z/j/k - z/l/m - z/n/o - z/p/q - z/rOverlap formulae used. * small base; ** very small base (under 30) ineligible for sig testing

TotalWeightedUnweighted
10011001Unweighted Total10011001Weighted Total9781001Effective Base486474Male
48.52%47.35%515527Female
51.48%52.65%
Public Perceptions of the NHS and Social CareFINAL PUBLIC
Table 324Weight matrix: Gender
Base : All respondents
Respondent type : General public aged 16+ Fieldwork dates : 14th November - 9th December 2011Source : Ipsos MORI (JN10-039262-01)

TotalWeightedUnweighted
10011001Unweighted Total10011001Weighted Total9781001Effective Base14312316-24
14.30%12.29%16715825-34
16.71%15.78%35033135-54
34.92%33.07%14316955-64
14.30%16.88%19822065+
19.77%21.98%
Public Perceptions of the NHS and Social CareFINAL PUBLIC
Table 325Weight matrix: Age
Base : All respondents
Respondent type : General public aged 16+ Fieldwork dates : 14th November - 9th December 2011Source : Ipsos MORI (JN10-039262-01)
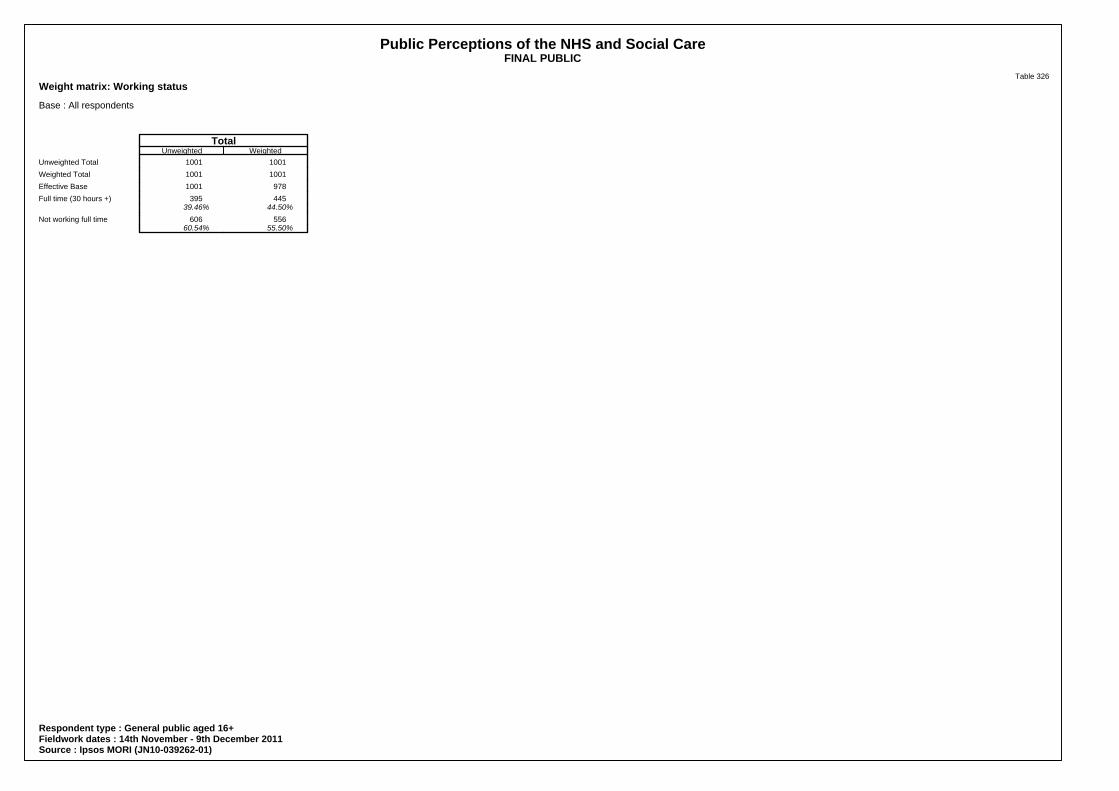
TotalWeightedUnweighted
10011001Unweighted Total10011001Weighted Total9781001Effective Base445395Full time (30 hours +)
44.50%39.46%556606Not working full time
55.50%60.54%
Public Perceptions of the NHS and Social CareFINAL PUBLIC
Table 326Weight matrix: Working status
Base : All respondents
Respondent type : General public aged 16+ Fieldwork dates : 14th November - 9th December 2011Source : Ipsos MORI (JN10-039262-01)

TotalWeightedUnweighted
10011001Unweighted Total10011001Weighted Total9781001Effective Base8688East Midlands
8.60%8.79%109126Eastern
10.90%12.59%148143London
14.80%14.29%5155North-East
5.10%5.49%136139North-West
13.60%13.89%162154South-East
16.20%15.38%102107South-West
10.20%10.69%10699West Midlands
10.60%9.89%10090Yorkshire & Humberside
10.00%8.99%
Public Perceptions of the NHS and Social CareFINAL PUBLIC
Table 327Weight matrix: GOR
Base : All respondents
Respondent type : General public aged 16+ Fieldwork dates : 14th November - 9th December 2011Source : Ipsos MORI (JN10-039262-01)