
Public perceptions of the local government: findings from ...
60
PUBLIC PERCEPTIONS of local government Findings from the 2010 Public Attitudes Survey Public Perceptions Series October 2011
Transcript of Public perceptions of the local government: findings from ...

PUBLIC
PERCEPTIONS
of local government
Findings from the 2010 Public Attitudes Survey
Public Perceptions Series
October 2011

CMC vision: That the CMC make a unique contribution to protecting Queenslanders from major crime, and promote a trustworthy public sector CMC mission: To combat crime and improve public sector integrity
© Crime and Misconduct Commission 2011
Apart from any fair dealing for the purpose of private study, research, criticism or review, as permitted under the Copyright Act 1968, no part may be reproduced by any process without permission. Inquiries should be made to the publisher, the Crime and Misconduct Commission.
Crime and Misconduct Commission Level 2, North Tower Green Square 515 St Pauls Terrace, Fortitude Valley, Qld 4006 GPO Box 3123 Brisbane Qld 4001 Tel: (07) 3360 6060 Fax: (07) 3360 6333 Email: [email protected] Note: This publication is accessible through the CMC website, www.cmc.qld.gov.au.

Contents
Foreword ................................................................................................................................... iv Acknowledgements .................................................................................................................... v List of abbreviations .................................................................................................................. vi Summary .................................................................................................................................... 1 Part A: Experiences with local government employees ............................................................ 5 Part B: General perceptions of local government employees ................................................ 19 Part C: Complaints processes .................................................................................................. 29 Conclusion ............................................................................................................................... 39 Appendix 1: Background to the survey ................................................................................... 41 Appendix 2: Survey method .................................................................................................... 44 Appendix 3: Respondent demographics ................................................................................. 46 Appendix 4: List of statistical terms, symbols and descriptions .............................................. 52 References ............................................................................................................................... 53

iv
Foreword
This report presents the results of the latest instalment in the CMC’s Public Perceptions series. In this series, the CMC periodically surveys a representative sample of the Queensland public to gauge its perceptions of the Queensland Police Service (QPS), public service agencies and local government. These surveys are conducted as part of the CMC’s monitoring function. They measure the extent to which public sector agencies and employees are meeting the Queensland public’s expectations of service delivery. We have conducted eight surveys of Queensland residents since 1991. This report summarises the public’s responses to the 2010 survey’s items about local governments and identifies some trends over time. The results from the 2010 survey show that the public has a positive view of local government employees’ behaviour. The public’s interactions with employees also tend to be positive, and the results continue to highlight the role that courtesy and respect play in shaping clients’ general perceptions of local government authorities. Nonetheless, some results indicated that public expectations about complaints handling are not being met. While the public believes that the likelihood of detection for local government misconduct has increased, their confidence in the quality of complaints processes has declined, and satisfaction with the complaints process has deteriorated. Compared to previous surveys, Queenslanders are also more likely to believe that they will suffer negative consequences if they complain about local government officials. Improvements to the quality of complaints handling processes and public education about the mechanisms in place for local governments to prevent, detect and investigate allegations of misconduct may help to reverse this trend. Martin Moynihan AO QC Chairperson

v
Acknowledgements
This report was prepared by Denise Foster, Jane Olsen and Patricia Ferguson of the Crime and Misconduct Commission’s (CMC) Research Unit. Dr Tanya Strub managed the administration of the 2010 Public Attitudes Survey, and Dr Margot Legosz provided advice on survey modifications. The Communications Unit of the CMC prepared the report for publication. We are grateful to Colmar Brunton for administering the survey. Finally, we would like to thank the people who responded to the survey. Without their support, this survey would not have been possible.

vi
List of abbreviations
CATI Computer Assisted Telephone Interviewing
CJC Criminal Justice Commission
CM Act Crime and Misconduct Act 2001 (Qld)
CMC Crime and Misconduct Commission
QCC Queensland Crime Commission
QPS Queensland Police Service

Public perceptions of local government 1
Summary
The Public Perceptions series The Crime and Misconduct Commission (CMC) — and its predecessor, the Criminal Justice Commission — has a long-standing interest in measuring the public’s perceptions of police officers, public servants and local government staff. We have now conducted eight surveys of Queensland residents: in July 1991, July 1993, June 1995, June 1999, June 2002, July 2005, June–July 2008 and June–July 2010. Since the first Public Attitudes Survey was conducted, there have been considerable changes within the public sector. There have also been changes in the way the CMC handles complaints about public service and local government employees, and how it monitors other integrity issues. The Public Perceptions series helps the CMC to assess changes in public opinion about the behaviour and integrity of people in these public sector roles, and the willingness to use complaints services. By performing this monitoring function, the CMC can recommend corrective action to the agency involved. This year, the CMC will publish three separate Public Perceptions reports. These can be accessed on the CMC’s website, www.cmc.qld.gov.au: • Public perceptions of the Queensland Police Service: findings from the 2010 public
attitudes survey
• Public perceptions of the public service: findings from the 2010 public attitudes survey
• Public perceptions of local government: findings from the 2010 public attitudes survey. We also use the Public Attitudes Survey to gather general information about public awareness of the CMC’s role and functions. Some of these results are reported in the Crime and Misconduct Commission Annual Report 2010–11.
This report This report presents the public’s current perceptions of Queensland local governments and their employees. It also examines changes in perceptions over the last 15 years. The results presented in this report are based on a random sample of 1529 people across Queensland. Where possible, the results of the 2010 survey are compared with those of previous surveys.
A note on data analysis: percentages and ‘valid responses’ All percentages presented in this report are based on valid responses. That is, any respondents who chose not to answer a question, indicated that they did not know enough to answer the question, or provided an unclear or unsuitable response were excluded from any analysis that included that survey item. Therefore, there are some small variations in the number of valid responses for different questions.

Public perceptions of local government 2
This report is divided into three main parts: • Part A presents respondents’ experiences with local government employees, both
satisfactory and unsatisfactory. • Part B presents the public’s general perceptions of local government employees,
including behaviour, integrity and misconduct. • Part C presents public opinion about and confidence in complaints processes.
The Appendixes to this report provide a range of background information about the Public Attitudes Survey and the CMC (see Appendix 1), the survey’s data collection method (see Appendix 2), demographic characteristics of the 2010 sample (see Appendix 3), and a list of statistical terms to assist with interpretation of the results (see Appendix 4).
Key changes in the 2010 Public Attitudes Survey Several minor changes were made to the survey in 2010 to increase our understanding of the public’s perceptions, while maintaining the capacity to examine trends over time. A number of changes were made to the order and wording of questions to minimise any potential bias. However, the most notable difference was that the 2010 survey was divided into two sections. The first section contained all items concerning the Queensland Police Service (QPS). The second section contained all items concerning the public service, local government and the CMC.
Key findings The key findings of the survey are: • Perceptions of local government employees are generally positive. Consistent with
previous surveys, the 2010 survey showed that most respondents believed that local government employees behave well (87%), and most believed that local government employees are honest (84%).
• Local government employees’ manner, competence and actions are important in interactions. The perceived manner and competence of the employee, and whether the respondent considered that the employee took the appropriate action, are important in determining whether the respondent had a positive or negative experience with a local government employee. Compared with the 2008 survey results, respondents in 2010 were more likely to report dissatisfaction as a result of the unfriendly, rude or arrogant manner of a local government employee, or the employee’s lack of concern, care or interest in the respondents’ issue. Few respondents in 2010 reported that their negative experiences were a result of serious misconduct by local government employees.
• Education, age and recent experience shape perceptions of local government. The education level and age of respondents, as well as whether respondents had a recent positive or negative experience with a local government employee, often help to explain respondents’ perceptions of local government and its employees. Specifically, people who were more educated and who reported a recent positive experience with a local government employee were more likely to have favourable perceptions of local government than people who were less educated or who reported a recent negative experience. The effect of age differed according to the survey item.

Public perceptions of local government 3
• Perceptions of corruption in local government are mixed. Consistent with previous surveys, most respondents (86%) believed there will always be some corruption in local government, and half the respondents (49%) believed that not enough is being done about corruption in local government. Positively, while an almost equal proportion of respondents agreed (49%) and disagreed (44%) that the chances of getting caught doing something corrupt in local government are slim, the proportion of respondents who disagreed with this statement has increased since 1999 (from 37% to 44%).
• The public supports investigation of complaints by independent bodies, but tends not to complain to independent bodies. Almost all respondents (90%) believed that complaints about local government should be investigated by an independent body. However, those respondents who actually made a complaint directed it to the relevant government agency (64%), and rarely to an independent body such as the Queensland Ombudsman (5%).
• Dissatisfaction with how complaints were handled has increased. Almost two-thirds of respondents who made a complaint (62%) were dissatisfied with how it was handled. This is an increase from 51 per cent in the 2008 survey.
• Confidence in proper complaints processing has declined. Respondents’ confidence in complaints being properly investigated by the Ombudsman, the CMC or the relevant local government body has declined since the 2008 survey. While most respondents complained to the agency itself, they were least confident in the ability of the relevant agency to properly investigate complaints about local government employees, and most confident in the Ombudsman.
• Perceptions about the consequences of making a complaint are mixed. Consistent with previous surveys, two-thirds of respondents (64%) disagreed with the statement ‘There is no point reporting corruption in local government because nothing useful will be done about it.’ However, the proportion of respondents who agreed that ‘people who complain about the local government are likely to suffer for it’ increased from 21 per cent in 2008 to 32 per cent.
Areas for improvement The 2010 Public Attitudes Survey identified two main areas for improvement. • The proportion of people who believed that ‘people who complain about local
government are likely to suffer for it’ has increased. More than half the respondents who made a complaint were dissatisfied with how it was handled, and the majority of respondents believed that complaints about local government should be handled by an independent body. It is not surprising, then, that around half the respondents said that not enough is being done about corruption in local governments. The survey results indicate that there are two ways local government can address this issue. First, public perceptions of complaints processing systems could be improved by informing the public about the internal mechanisms that councils have in place to prevent, detect and investigate misconduct. Second, public experiences of making a complaint could be improved by amending councils’ complaints processing systems and protocols.
• Employees’ manner and competence in interactions continue to be important factors in shaping public perceptions. This finding highlights an opportunity for improvement. If

Public perceptions of local government 4
employees consistently act in a courteous, professional and transparent manner, there is a greater chance that the Queensland public will have positive encounters with local government employees, and contribute to more positive general perceptions of local government employees, and government in general.
The CMC is working in partnership with local governments to implement improved integrity and complaints management systems. Through the Building Integrity Program, local governments will develop infrastructure and strategies to achieve these goals. By taking responsibility for building and maintaining a strong culture of integrity, managers and staff can reduce misconduct and improve complaints handling processes. This, in turn, will lead to improved public confidence in local governments.

Public perceptions of local government 5
Part A: Experiences with local government employees
The Australian population generally expects that encounters with government employees will be accessible, efficient and effective (Australian Public Service Commission 2003). Therefore, high-quality service delivery has been a priority for the government since the 1990s. To achieve client satisfaction, government employees aim to be responsive to their clients’ needs. Often, these client–employee interactions shape public perceptions of the government and its employees. Previous research shows that the quality of a single interaction, whether it is positive or negative, can shape a person’s perception about an entire organisation, or the government as a whole (Williams 2001). Similarly, recent studies show that the experiences of family, friends and work colleagues, called ‘vicarious experiences’, can also be important in shaping a person’s perceptions of government (Miller & Davis 2008; Rosenbaum et al. 2005; Weitzer & Tuch 2005). While the 2010 Public Attitudes Survey captured both personal and vicarious experiences, the proportion of respondents who reported recent unsatisfactory vicarious experiences was small (3%, n = 43) and therefore these will not be discussed in this report. As shown in previous Public Attitudes Surveys, the demographic characteristics of the client also have a role in shaping perceptions of the government. For this reason we test whether demographic identifiers such as a person’s age, gender or ethnicity helped to shape respondents’ perceptions of local government. This part examines: • the public’s experiences with local government employees • satisfactory experiences — who initiated contact, the reasons for contact and the
reasons for satisfaction • unsatisfactory experiences — who initiated contact, the reasons for contact and the
reasons for dissatisfaction.1
1 In the 1999, 2002 and 2005 Public Attitudes Surveys we asked respondents whether a Queensland local government employee had behaved improperly in a way that adversely affected either them or someone they knew. In the 2008 and 2010 surveys, however, we asked respondents if they had had an experience with a member of a Queensland local government that left them feeling dissatisfied. Given the change to the wording of these questions, we are unable to compare the 2008 and 2010 results to earlier years.
Public perceptions of local government 6
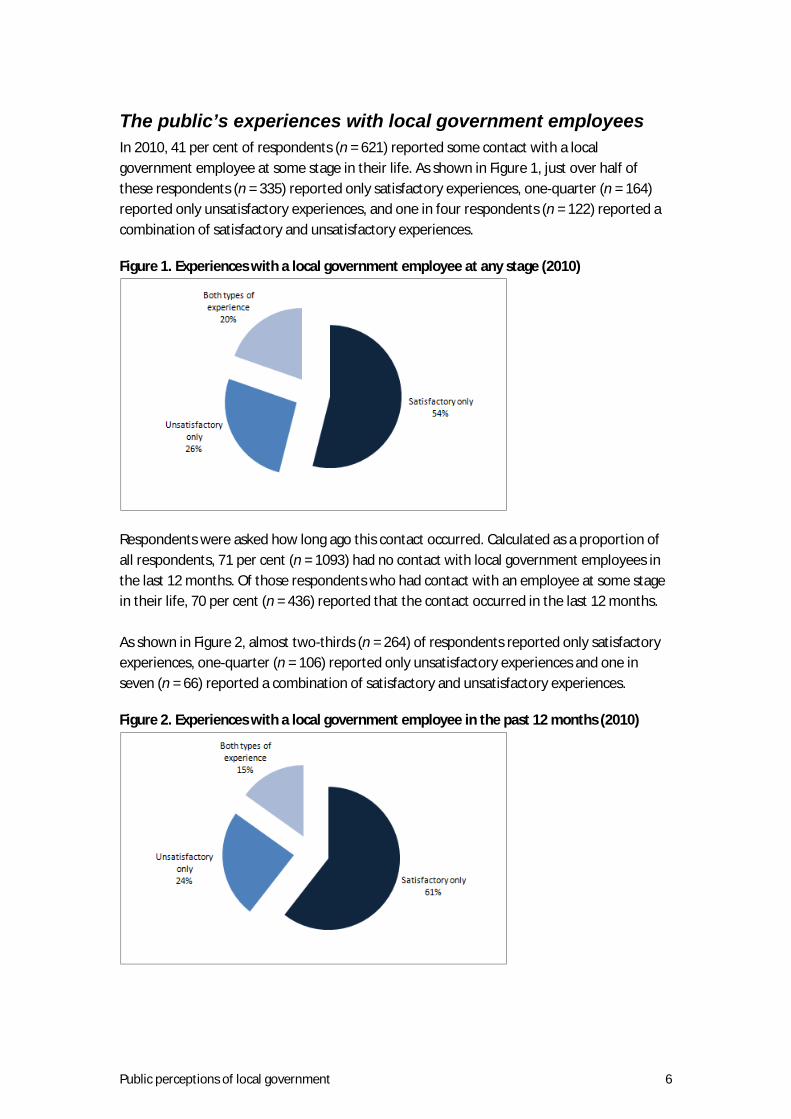
The public’s experiences with local government employees In 2010, 41 per cent of respondents (n = 621) reported some contact with a local government employee at some stage in their life. As shown in Figure 1, just over half of these respondents (n = 335) reported only satisfactory experiences, one-quarter (n = 164) reported only unsatisfactory experiences, and one in four respondents (n = 122) reported a combination of satisfactory and unsatisfactory experiences.
Figure 1. Experiences with a local government employee at any stage (2010)
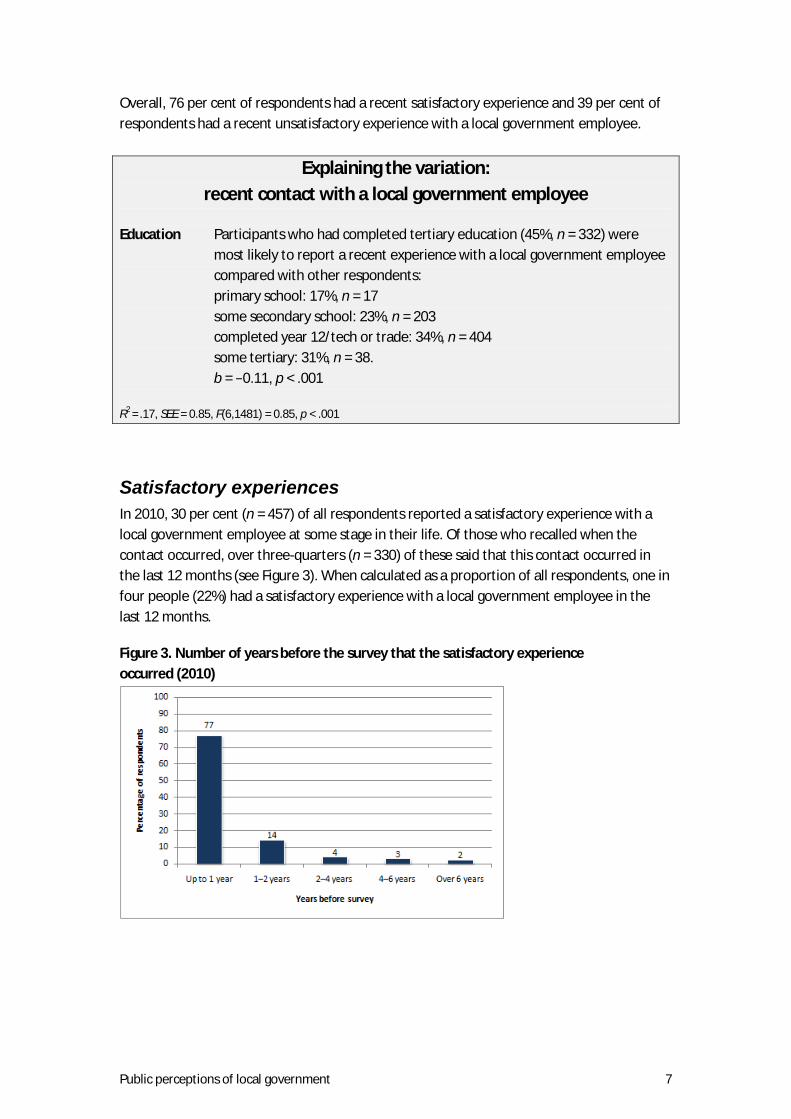
Respondents were asked how long ago this contact occurred. Calculated as a proportion of all respondents, 71 per cent (n = 1093) had no contact with local government employees in the last 12 months. Of those respondents who had contact with an employee at some stage in their life, 70 per cent (n = 436) reported that the contact occurred in the last 12 months. As shown in Figure 2, almost two-thirds (n = 264) of respondents reported only satisfactory experiences, one-quarter (n = 106) reported only unsatisfactory experiences and one in seven (n = 66) reported a combination of satisfactory and unsatisfactory experiences.
Figure 2. Experiences with a local government employee in the past 12 months (2010)
Public perceptions of local government 7
Overall, 76 per cent of respondents had a recent satisfactory experience and 39 per cent of respondents had a recent unsatisfactory experience with a local government employee.
Explaining the variation: recent contact with a local government employee
Education Participants who had completed tertiary education (45%, n = 332) were most likely to report a recent experience with a local government employee compared with other respondents: primary school: 17%, n = 17 some secondary school: 23%, n = 203 completed year 12/tech or trade: 34%, n = 404 some tertiary: 31%, n = 38. b = −0.11, p < .001
R2 = .17, SEE = 0.85, F(6,1481) = 0.85, p < .001
Satisfactory experiences In 2010, 30 per cent (n = 457) of all respondents reported a satisfactory experience with a local government employee at some stage in their life. Of those who recalled when the contact occurred, over three-quarters (n = 330) of these said that this contact occurred in the last 12 months (see Figure 3). When calculated as a proportion of all respondents, one in four people (22%) had a satisfactory experience with a local government employee in the last 12 months.
Figure 3. Number of years before the survey that the satisfactory experience occurred (2010)

Public perceptions of local government 8
Explaining the variation: recent satisfactory experiences
Age Respondents aged 45 to 54 years (30%, n = 75) were most likely to report a
satisfactory experience with a local government employee, compared with other respondents: 18 to 24 years: 20%, n = 45 25 to 34 years: 21%, n = 38 35 to 44 years: 22%, n = 65 55 to 64 years: 21%, n = 51 65 years and over: 17%, n = 56. b = −0.05, p < .01
Education Respondents who had completed tertiary education (35%, n = 115) were
most likely to report a satisfactory experience with a local government employee, while respondents who had completed primary (11%, n = 7) or some secondary school only (13%, n = 58) were least likely, compared with other respondents: completed year 12/tech or trade: 23%, n = 136 some tertiary: 20%, n = 13. b = 0.04, p < .05
R2 = .24, SEE = 0.44, F(6,447) = 4.39, p < .001

Public perceptions of local government 9
Initiation of contact Respondents who reported a recent satisfactory experience were asked who initiated contact. Most respondents (84%, n = 269) initiated the contact with the local government themselves, referred to as ‘self-initiated’ encounters. Sixteen per cent (n = 53) were initiated by local government, referred to as ‘employee-initiated’ encounters. Respondents who initiated contact were asked the main reason for contacting a local government authority. As Figure 4 shows, the main reasons for recent self-initiated contact reported by respondents in 2010 were: • to make an enquiry or seek information • to raise a concern or discuss an issue • to seek assistance or obtain help • to access a service. Compared with 2008, respondents in 2010 were more likely to report seeking assistance or obtaining help, and more likely to make contact to make a submission, but less likely to make contact to access a service.
Figure 4. Reasons for self-initiated contact with local government (2008 and 2010)
Public perceptions of local government 10
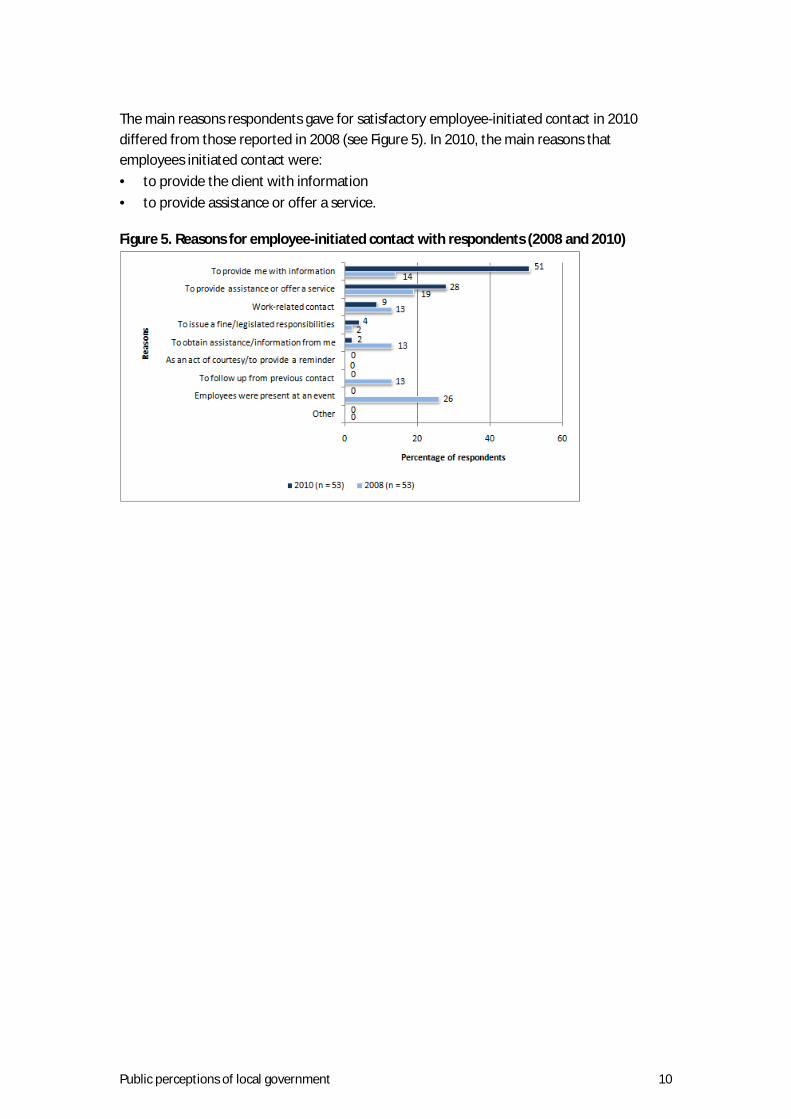
The main reasons respondents gave for satisfactory employee-initiated contact in 2010 differed from those reported in 2008 (see Figure 5). In 2010, the main reasons that employees initiated contact were: • to provide the client with information • to provide assistance or offer a service.
Figure 5. Reasons for employee-initiated contact with respondents (2008 and 2010)

Public perceptions of local government 11
Reasons for satisfaction Respondents who were satisfied with their recent contact with a local government employee were asked to report the reason for their satisfaction. Figure 6 shows that in 2010 the most common reasons were that the employee: • had a friendly, courteous or professional manner • took appropriate action • did the right thing or was competent. In general, respondents’ reasons for satisfaction in the 2008 and 2010 surveys were comparable.
Figure 6. Reasons for satisfaction with local government (2008 and 2010)
Public perceptions of local government 12
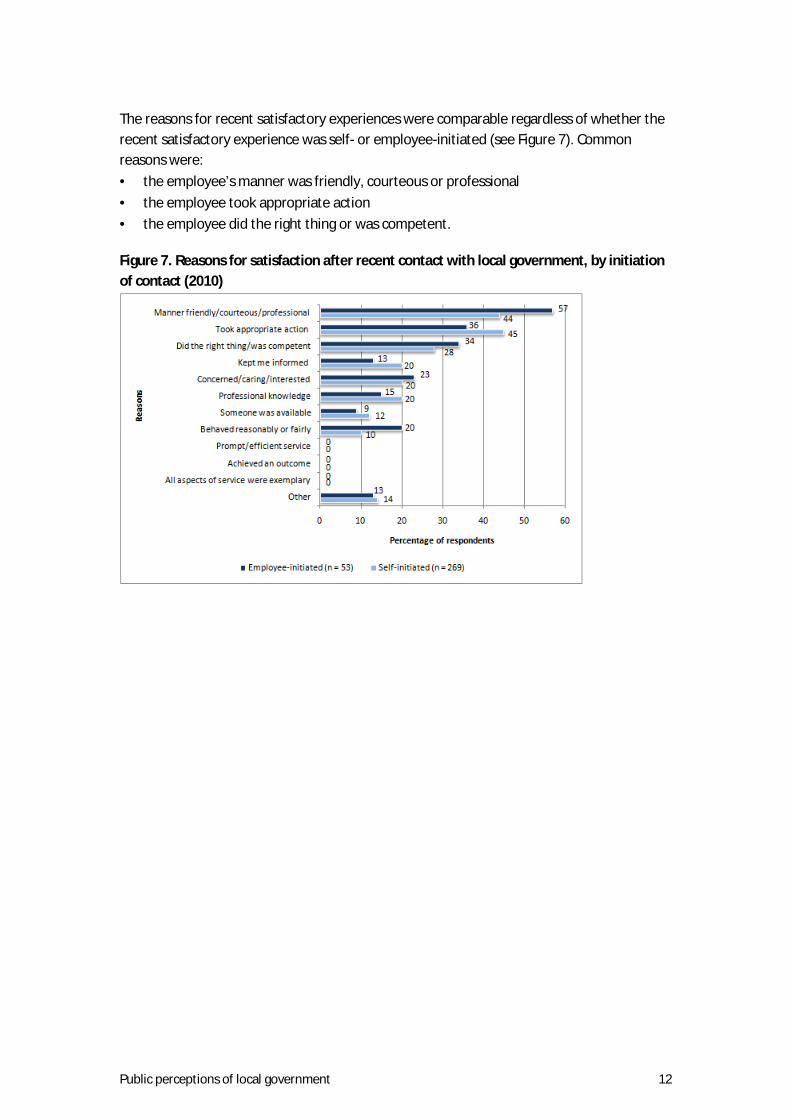
The reasons for recent satisfactory experiences were comparable regardless of whether the recent satisfactory experience was self- or employee-initiated (see Figure 7). Common reasons were: • the employee’s manner was friendly, courteous or professional • the employee took appropriate action • the employee did the right thing or was competent.
Figure 7. Reasons for satisfaction after recent contact with local government, by initiation of contact (2010)

Public perceptions of local government 13
Unsatisfactory experiences In the 2010 Public Attitudes Survey, one in five respondents (19%, n = 286) reported that they had an unsatisfactory experience with a local government employee at some stage in their life. As shown in Figure 8, of those who recalled when the contact occurred, almost two-thirds said these experiences (n = 172) occurred in the last year. These figures are comparable to those obtained from the 2008 survey, wherein 20 per cent (n = 307) reported ever having an unsatisfactory experience, and 53 per cent of these (n = 163) reported that it occurred during the previous 12 months.
Figure 8. Number of years before the survey that the unsatisfactory experience occurred (2010)

Public perceptions of local government 14
Explaining the variation: recent unsatisfactory experiences
Age Participants aged 18 to 24 years (87%, n = 26) were most likely to report a
recent unsatisfactory experience with a local government employee, while participants aged 65 years and older (43%, n = 25) were least likely, compared with other respondents: 25 to 34 years: 71%, n = 25 35 to 44 years: 64%, n = 33 45 to 54 years: 62%, n = 37 55 to 64 years: 51%, n = 26. b = −0.14, p < .001
Region Participants from Brisbane (69%, n = 71) were most likely to report a recent
unsatisfactory experience with local government, while participants from Central Queensland were least likely (49%, n = 17) compared with other respondents: South-East Queensland: 53%, n = 24 South-West Queensland: 62%, n = 31 North Queensland: 55%, n = 29. b = −0.08, p < .05
R2 = .32, SEE = 0.94, F(6,269) = 5.02, p < .001

Public perceptions of local government 15
Initiation of contact Respondents who reported a recent unsatisfactory experience were asked who initiated contact. Most contacts (82%, n = 133) were self-initiated, whereas 18 per cent (n = 29) were employee-initiated.2
As shown in Figure 9, people who initiated contact with a local government employee commonly reported that they made contact: • to make a complaint • to make an enquiry or seek information. Compared with the 2008 survey, people in 2010 were more likely to report dissatisfaction after making a complaint, seeking assistance from local government employees or making a submission. Respondents were less likely in 2010 to report dissatisfaction after raising a concern or discussing a community or personal issue.
Figure 9. Reasons for self-initiated contact with local government (2008 and 2010)
2 In addition to being self- or employee-initiated, 2 per cent (n = 4) of respondents indicated that someone else initiated their contact with a local government employee. These cases were not included in any further analysis about initiation of contact.

Public perceptions of local government 16
Figure 10 shows that dissatisfied respondents who said that their recent contact was initiated by a local government employee commonly reported that the employee contacted them: • to provide them with information • to provide assistance or offer a service. Compared with the 2008 survey, people in 2010 were more likely to report dissatisfaction after the employee provided them with information. Respondents were less likely in 2010 to report dissatisfaction after the employee obtained assistance or information from them.
Figure 10. Reasons for employee-initiated contact with respondents (2008 and 2010)
Public perceptions of local government 17
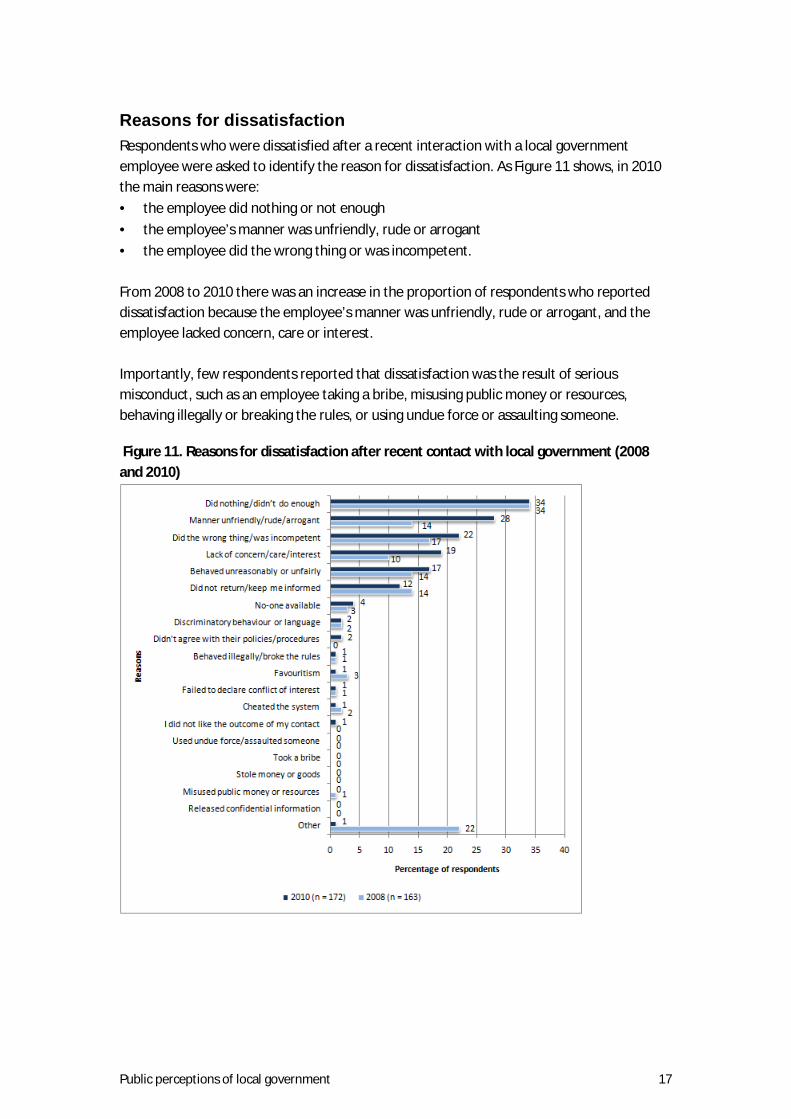
Reasons for dissatisfaction Respondents who were dissatisfied after a recent interaction with a local government employee were asked to identify the reason for dissatisfaction. As Figure 11 shows, in 2010 the main reasons were: • the employee did nothing or not enough • the employee’s manner was unfriendly, rude or arrogant • the employee did the wrong thing or was incompetent. From 2008 to 2010 there was an increase in the proportion of respondents who reported dissatisfaction because the employee’s manner was unfriendly, rude or arrogant, and the employee lacked concern, care or interest. Importantly, few respondents reported that dissatisfaction was the result of serious misconduct, such as an employee taking a bribe, misusing public money or resources, behaving illegally or breaking the rules, or using undue force or assaulting someone.
Figure 11. Reasons for dissatisfaction after recent contact with local government (2008 and 2010)

Public perceptions of local government 18
The survey examined whether the reasons for dissatisfaction differed depending on whether the unsatisfactory encounter was self- or employee-initiated (see Figure 12). In 2010, respondents who reported unsatisfactory self-initiated encounters were most likely to be dissatisfied because the employee did nothing or did not do enough. In employee-initiated encounters, respondents were most likely to be dissatisfied because the employee behaved unreasonably or unfairly.
Figure 12. Reasons for dissatisfaction after recent contact with local government, by initiation of contact (2010)

Public perceptions of local government 19
Part B: General perceptions of local government employees
Accountability and trust play a vital role in shaping perceptions of integrity. Therefore, all government employees are expected to operate according to high standards of behaviour (Aulich, Halligan & Nutley 2001). Recent research, however, has indicated that public trust of the government and its employees has declined (Head, Brown & Connors 2008; Provan & Milward 2001; Shepherd 2009; Van de Walle, Van Roosbroek & Bouckaert 2008). While many factors contribute to this decline, misconduct or corruption in government can have a particularly damaging impact on the public’s trust of government (Brown & Evans 2009; Goldsmith 2010). In the Public Attitudes Survey, we examined respondents’ perceptions of local government employee behaviour, honesty and misconduct.
Perceptions of behaviour The majority of respondents (87%, n = 1275) believed that local government employees generally or mostly behave well. One in ten respondents (10%, n = 150) said that there were roughly equal numbers of good and bad local government employees, and 3 per cent (n = 43) said that they were generally or mostly bad. Figure 13 shows that from 1999 to 2010 there has been a small but significant increase in the proportion of respondents who believed that local government employees mostly behave well (χ2 = 18.33, p < .001).
Figure 13. Perceptions of local government employees’ behaviour (1999–2010)

Public perceptions of local government 20
Explaining the variation: perceptions of local government employee behaviour
Age Respondents aged 55 to 64 years (90%, n = 206) were most likely to report
that local government employees generally behave well, while participants aged 18 to 24 years (83%, n = 245) were least likely, compared with other respondents: 25 to 34 years: 86%, n = 152 35 to 44 years: 87%, n = 251 45 to 54 years: 88%, n = 206 65 years and over: 87%, n = 270. b = −0.04, p < .001
Experience Respondents who reported a recent satisfactory experience with local with local government (89%, n = 190) were more likely than respondents who did not government report a recent satisfactory experience (86%, n = 385) to report that local employees government employees generally behave well (b = −0.20, p < .001).
Respondents who reported a recent unsatisfactory experience with local government (70%, n = 151) were less likely than respondents who did not report a recent unsatisfactory experience (90%, n = 1124) to believe that employees generally behave well (b = 0.23, p < .001).
R2 = .23, SEE = 0.79, F(8,2857) = 19.79, p < .001

Public perceptions of local government 21
Perceptions of employee honesty To examine the public’s perceptions of local government integrity, respondents were asked to what extent they agreed or disagreed with the statement ‘Most local government employees are honest.’ The majority of respondents believed that most local government employees are honest (84%, n = 1238), one in ten respondents disagreed (9%, n = 133), and the remainder neither agreed nor disagreed with this statement (7%, n = 105). Public attitudes to this item have remained stable over time (see Figure 14).
Figure 14. Attitudes to local government integrity: responses to the statement ‘Most local government employees are honest.’ (1999–2010)

Public perceptions of local government 22
Explaining the variation: agreement with the statement ‘Most local government employees are honest.’
Age Respondents aged 65 years and over (89%, n = 284) were most likely to
agree that local government employees are honest, while respondents aged 18 to 24 years (78%, n = 172) were least likely to agree, compared with other respondents: 25 to 34 years: 79%, n = 137 35 to 44 years: 80%, n = 239 45 to 54 years: 86%, n = 202 55 to 64 years: 86%, n = 202. b = −0.06, p < .001
Education Respondents who had some tertiary education (89%, n = 54) were most
likely to agree that local government employees are honest, while respondents who identified as finishing primary school only (79%, n = 49) were least likely to agree, compared with other respondents: some secondary school: 82%, n = 359 completed year 12/tech or trade: 83%, n = 484 completed tertiary: 88%, n = 278. b = −0.05, p < .001
Experience Respondents who reported a recent satisfactory experience with local with local government (89%, n = 289) were more likely than those who did not report government a recent satisfactory experience (83%, n = 949) to agree that local employees government employees are honest (b = −0.16, p < .001).
Respondents who reported a recent unsatisfactory experience with local government (73%, n = 154) were less likely than those who did not report a recent unsatisfactory experience (86%, n = 1084) to agree that local government employees are honest (b = 0.13, p < .001).
R2 = .22, SEE = 0.65, F(8,1430) = 9.39, p < .001
Public perceptions of local government 23
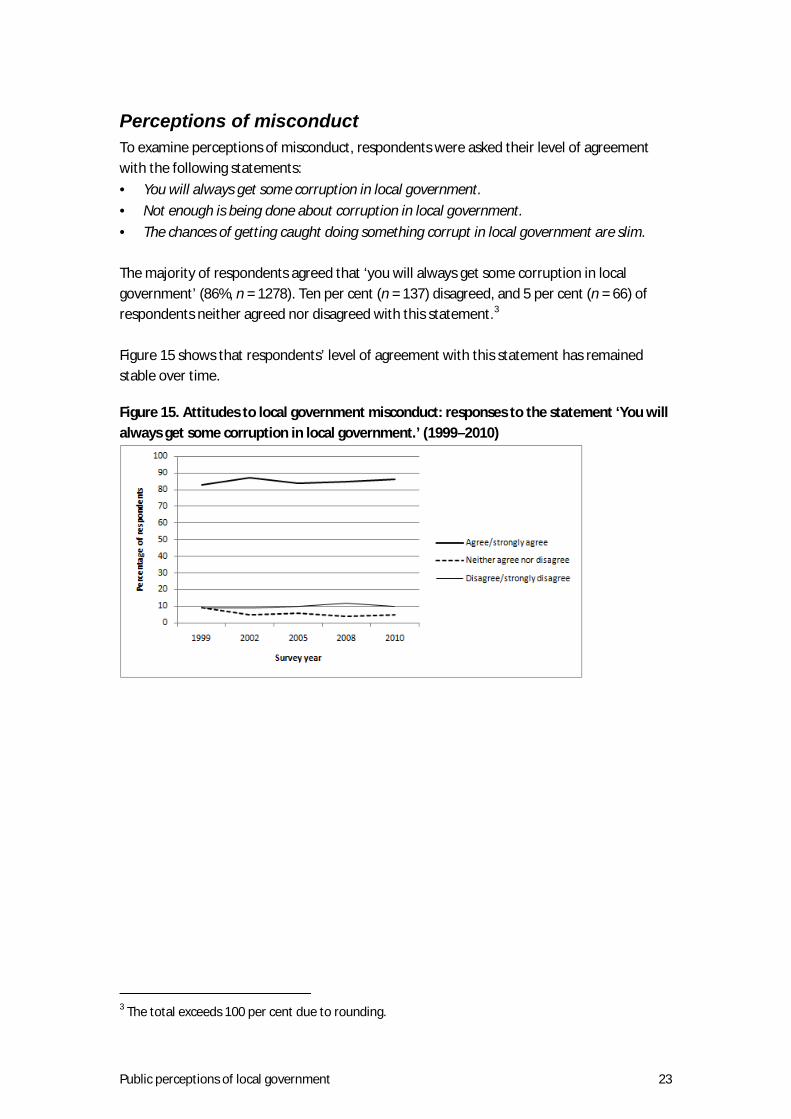
Perceptions of misconduct To examine perceptions of misconduct, respondents were asked their level of agreement with the following statements: • You will always get some corruption in local government. • Not enough is being done about corruption in local government. • The chances of getting caught doing something corrupt in local government are slim. The majority of respondents agreed that ‘you will always get some corruption in local government’ (86%, n = 1278). Ten per cent (n = 137) disagreed, and 5 per cent (n = 66) of respondents neither agreed nor disagreed with this statement.3
Figure 15 shows that respondents’ level of agreement with this statement has remained stable over time.
Figure 15. Attitudes to local government misconduct: responses to the statement ‘You will always get some corruption in local government.’ (1999–2010)
3 The total exceeds 100 per cent due to rounding.
Public perceptions of local government 24
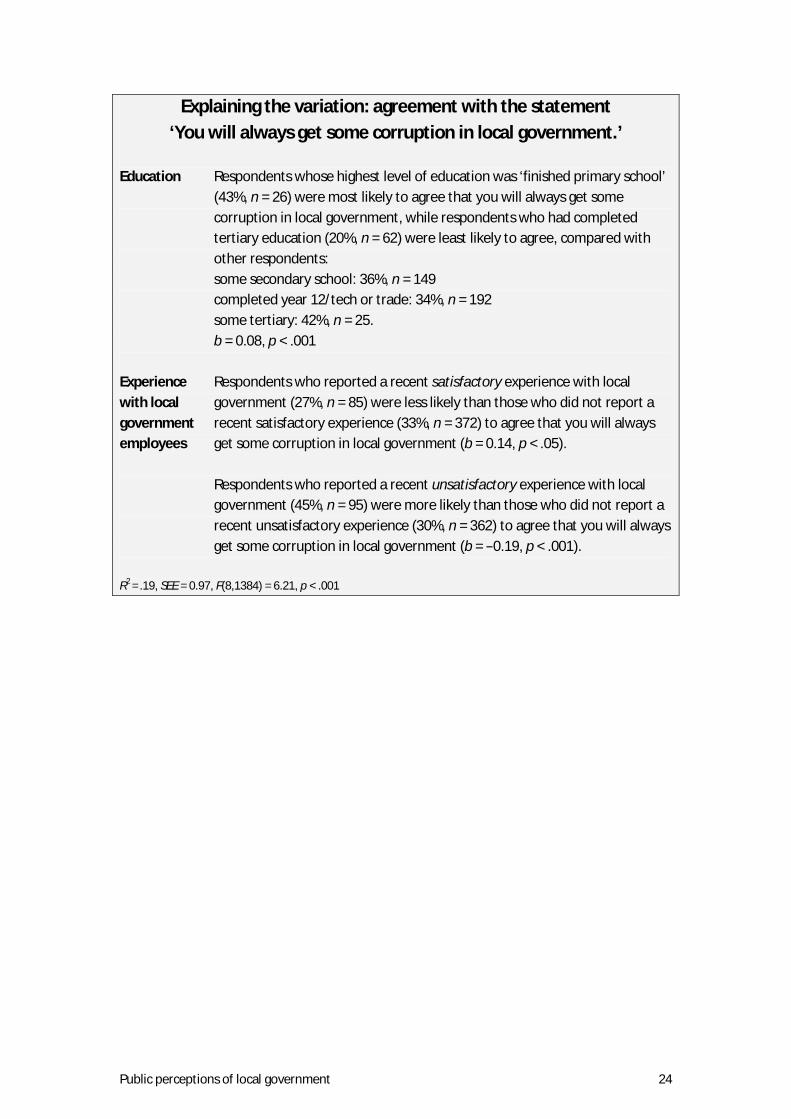
Explaining the variation: agreement with the statement ‘You will always get some corruption in local government.’
Education Respondents whose highest level of education was ‘finished primary school’
(43%, n = 26) were most likely to agree that you will always get some corruption in local government, while respondents who had completed tertiary education (20%, n = 62) were least likely to agree, compared with other respondents: some secondary school: 36%, n = 149 completed year 12/tech or trade: 34%, n = 192 some tertiary: 42%, n = 25. b = 0.08, p < .001
Experience Respondents who reported a recent satisfactory experience with local with local government (27%, n = 85) were less likely than those who did not report a government recent satisfactory experience (33%, n = 372) to agree that you will always employees get some corruption in local government (b = 0.14, p < .05).
Respondents who reported a recent unsatisfactory experience with local government (45%, n = 95) were more likely than those who did not report a recent unsatisfactory experience (30%, n = 362) to agree that you will always get some corruption in local government (b = −0.19, p < .001).
R2 = .19, SEE = 0.97, F(8,1384) = 6.21, p < .001

Public perceptions of local government 25
Half the respondents in 2010 (49%, n = 627) agreed that ‘not enough is being done about corruption in local government’, and one-third disagreed (35%, n = 456). Sixteen per cent (n = 211) neither agreed nor disagreed with this statement. As Figure 16 shows, over time more people agreed than disagreed with the statement ‘Not enough is being done about corruption in local government.’ Since the 2008 survey, there has been a small but significant increase in the proportion of respondents who agreed with this statement (χ2 = 14.11, p < .01).
Figure 16. Attitudes to local government misconduct: responses to the statement ‘Not enough is being done about corruption in local government.’ (1999–2010)

Public perceptions of local government 26
Explaining the variation: agreement with the statement ‘Not enough is being done about corruption in local government.’
Age Participants aged 65 years and older (93%, n = 289) were most likely to
agree that not enough is being done about corruption in local government, while those aged 18 to 24 years (78%, n = 176) were least likely to agree, compared with other respondents: 25 to 34 years: 83%, n = 147 35 to 44 years: 86%, n = 248 45 to 54 years: 85%, n = 200 55 to 64 years: 90%, n = 216. b = −0.05, p < .001
Experience Respondents who reported a recent unsatisfactory experience with a local with local government employee (91%, n = 195) were more likely than those who did government not report a recent unsatisfactory experience (86%, n = 1083) to agree that employees not enough is being done about corruption in local government (b = −0.10,
p < .001). R2 = .17, SEE = 0.68, F(8,1434) = 5.33, p < .001

Public perceptions of local government 27
An almost equal proportion of respondents agreed (49%, n = 682) and disagreed (44%, n = 613) that ‘the chances of getting caught doing something corrupt in local government are slim’. Eight per cent (n = 106) neither agreed nor disagreed with this statement (see Figure 17).4
While the proportion of respondents who agreed with this statement has remained stable since 1999, there has been a significant increase in the proportion of respondents who disagreed with this statement (χ2 = 28.51, p < .001). The proportion who disagreed in 2010, however, is not significantly different from the 2008 survey.
Figure 17. Attitudes to local government misconduct: responses to the statement ‘The chances of getting caught doing something corrupt in local government are slim.’ (1999–2010)
4 The total exceeds 100 per cent due to rounding.

Public perceptions of local government 28
Explaining the variation: agreement with the statement ‘The chances of getting caught doing something corrupt in local
government are slim.’ Education Respondents whose highest level of education was ‘finished primary school’
(67%, n = 33) were most likely to agree that the chances of getting caught doing something corrupt in local government are slim, while respondents who had completed tertiary education (36%, n = 100) were least likely, compared with other respondents: some secondary school: 57%, n = 216 completed year 12/tech or trade: 47%, n = 246 some tertiary: 39%, n = 20. b = −0.10, p < .001
Experience Respondents who reported a recent satisfactory experience with local with local government (40%, n = 120) were less likely than those who did not report a government recent satisfactory experience (51%, n = 562) to believe that the chances of employees getting caught doing something corrupt in local government are slim
(b = −0.26, p < .001).
Respondents who reported a recent unsatisfactory experience with local government (63%, n = 125) were more likely than those who did not report a recent unsatisfactory experience (46%, n = 502) to agree that the chances of getting caught doing something corrupt in local government are slim (b = −0.23, p < .001).
R2 = .25, SEE = 0.98, F(8,1241) = 9.97, p < .001
Public perceptions of local government 29
Part C: Complaints processes
Government agencies have an important role in complaints processing. In accordance with the Crime and Misconduct Act 2001 (the CM Act), the CMC may give authority to government agencies to start dealing with less serious complaints of official misconduct and to report within agreed timeframes.5
Furthermore, while the CMC retains primary responsibility for dealing with more serious complaints of misconduct, the CM Act requires the CMC to refer matters back to the relevant agency, as long as the public interest is safeguarded (see Appendix 1 for more information).
In this part, we present the public’s perceptions of how complaints about local government employees are handled, specifically: • respondents’ experiences of making a complaint following an unsatisfactory encounter
with a local government employee • reasons for not complaining about an unsatisfactory experience • confidence in how a complaint would be dealt with by the relevant government
department or agency, the Queensland Ombudsman or the CMC, regardless of whether there was any experience with the processes or with local government employees
• general perceptions of the complaints process, regardless of whether there was any experience with the processes or with local government employees.
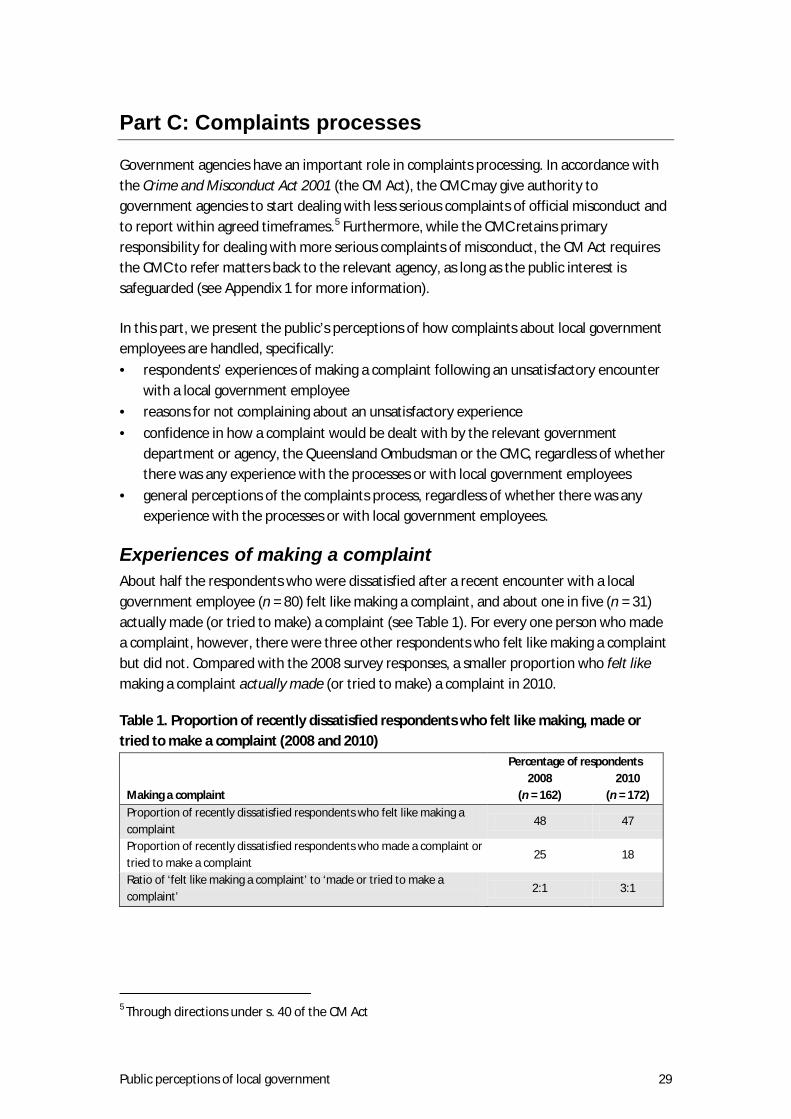
Experiences of making a complaint About half the respondents who were dissatisfied after a recent encounter with a local government employee (n = 80) felt like making a complaint, and about one in five (n = 31) actually made (or tried to make) a complaint (see Table 1). For every one person who made a complaint, however, there were three other respondents who felt like making a complaint but did not. Compared with the 2008 survey responses, a smaller proportion who felt like making a complaint actually made (or tried to make) a complaint in 2010.
Table 1. Proportion of recently dissatisfied respondents who felt like making, made or tried to make a complaint (2008 and 2010)
Percentage of respondents
Making a complaint 2008
(n = 162) 2010
(n = 172) Proportion of recently dissatisfied respondents who felt like making a complaint
48 47
Proportion of recently dissatisfied respondents who made a complaint or tried to make a complaint
25 18
Ratio of ‘felt like making a complaint’ to ‘made or tried to make a complaint’
2:1 3:1
5 Through directions under s. 40 of the CM Act

Public perceptions of local government 30
Respondents who made (or tried to make) a complaint after a recent unsatisfactory experience were asked to which agency they complained. Due to the small number of cases in this subset, these figures must be interpreted with caution. As shown in Table 2, more than half the respondents (n = 14) reported the matter to the local government council or body about which the complaint related. Overall, there are few differences between the 2008 and 2010 survey responses.
Table 2. Proportion of respondents who made or had tried to make a complaint, by agency (2008–2010)
Percentage of respondents
Agency respondent complained to 2008
(n = 40) 2010
(n = 22) Local government council or body itself 70 64 Another government agency 10 18 Member of parliament/local member 18 5 Queensland Ombudsman 3 5 CMC 3 0 QPS 0 0 Commission for Children and Young People and Child Guardian 0 0 Health Quality and Complaints Commission 0 0 Media 0 0 Queensland Audit Office 0 0 Relevant union 0 0 Attorney-General 0 0 Other 0 9
Note: Totals exceed 100 per cent because multiple responses were allowed. Where totals do not reach 100 per cent, some participants have not responded to the item.
Almost two-thirds of those who complained (or attempted to complain) were dissatisfied (62%, n = 13) with how the complaint about local government was handled. This is an increase from the 2008 survey results, which showed that 51 per cent (n = 19) were dissatisfied with how the complaint was handled. In 2010, 24 per cent (n = 5) of respondents were satisfied with how the complaint was handled, and 14 per cent (n = 3) were neither satisfied nor dissatisfied.

Public perceptions of local government 31
Reasons for not complaining Respondents who reported a recent unsatisfactory experience with a local government employee but had not made a complaint (n = 139) were asked why they had chosen not to do so. As Figure 18 shows, the proportion of respondents who believed that complaining would be too much trouble is higher than in all previous surveys, and was the main reason in 2010 that people did not complain. One in three respondents believed complaining ‘would not do any good’, one in five considered that the issue ‘was not serious enough’ to complain about, and one in 14 did not know how to make a complaint. Only 1 per cent of this subset felt that they ‘would not be believed’.
Figure 18. Reasons that respondents chose not to complain about local government employees (1999–2010)
Respondents who did not make a complaint because they believed it would not do any good (n = 32) were asked why they had felt this way. Once again, due to the small number of cases, caution should be taken when interpreting the results. The main reasons respondents gave for not complaining about an unsatisfactory experience with local government were because they believed: • ‘Complaining will not have an impact.’ (34%, n = 11) • ‘Government agencies/councils all stick together.’ (25%, n = 8) • ‘It would be their word against mine.’ (25%, n = 8) These findings are consistent with the findings of past Public Attitudes Surveys and previous research that show that people are reluctant to complain because they believe it won’t do any good (Smith 2009).

Public perceptions of local government 32
Confidence in the complaints process Respondents were asked to indicate their level of confidence in a complaint about a local government employee being properly investigated if made to the agency or local council itself, the CMC or the Queensland Ombudsman. The results from the 2010 survey reveal that most respondents would be either very or fairly confident that their complaint would be properly investigated if made to the Ombudsman (n = 1138) or the CMC (n = 1042). However, fewer respondents (n = 814) reported that they would be confident that their complaint would be properly investigated if made to the relevant agency or council (see Table 3).
Table 3. Level of confidence in local government complaints being properly investigated by agencies (2008 and 2010)
Percentage of respondents, 2008 Percentage of respondents, 2010
Agency Confident Neutral Not confident Confident Neutral Not confident χ2
Ombudsman 83 6 10 79 9 12 11.20** CMC 76 9 15 71 11 18 10.14** Relevant agency or council 58 10 32 55 15 31 14.14**
** p < .01
The 2010 results show that there has been a statistically significant decline in the public’s confidence that complaints would be properly investigated by all the agencies.
Explaining the variation: confidence in complaints investigations Age Respondents aged 18 to 24 years were the most confident (54%, n = 146)
that a complaint made to the relevant council would be investigated properly, compared with other respondents: 25 to 34 years: 46%, n = 93 35 to 44 years: 45%, n = 154 45 to 54 years: 49%, n = 131 55 to 64 years: 41%, n = 119 65 years and over: 45%, n = 170. b = 0.06, p < .001
Region Respondents from Far North Queensland (63%, n = 154) and Central Queensland (62%, n = 156) were more likely to be confident that the relevant council would investigate complaints properly than respondents from other regions: Brisbane: 52%, n = 250 South-East Queensland: 45%, n = 114 South-West Queensland: 58%, n = 140. b = 0.09, p < .001

Public perceptions of local government 33
Education Respondents who had some tertiary education showed the most confidence
in the CMC (81%, n = 47) and the Ombudsman (91%, n = 51) compared with other respondents: • CMC:
primary school: 63%, n = 40 some secondary school: 65%, n = 282 completed year 12/tech or trade: 75%, n = 433 completed tertiary: 75%, n = 232. b = 0.09, p < .001
• Ombudsman: primary school: 73%, n = 47 some secondary school: 76%, n = 333 completed year 12/tech or trade: 80%, n = 458 completed tertiary: 79%, n = 239. b = 0.06, p < .01
Experience Respondents who reported a recent satisfactory experience with local with local government were more likely to be confident in the ability of the CMC government (78%, n = 245; b = 0.24, p < .001), the Ombudsman (82%, n = 258; b = 0.21, employees p < .001) and the relevant council (63%, n = 197; b = 0.30, p < .001) to
investigate a complaint properly, compared with those who did not report a recent satisfactory experience (70%, n = 797; 77%, n = 880; 53%, n = 617, respectively).
Respondents who reported a recent unsatisfactory experience with local government were more likely to be confident in the ability of the CMC (75%, n = 937; b = 0.27, p < .001) and relevant council (58%, n = 736; b = 0.32, p < .001) to investigate a complaint properly, but less likely to be confident in the Ombudsman’s ability (65%, n = 133), compared with those who did not report a recent unsatisfactory experience (52%, n = 105; 37%, n = 78, 81%, n = 1005, respectively).
CMC: R2 = .25, SEE = 0.97, F(8,1414) = 11.49, p < .001 Ombudsman: R2 = .18, SEE = 0.92, F(8,1403) = 6.10, p < .001 Relevant council: R2 = .26, SEE = 1.11, F(8,1426) = 12.92, p < .001

Public perceptions of local government 34
General perceptions of complaints To explore general perceptions of complaints processes, respondents were asked their level of agreement with the following statements: • People who complain about local government employees are likely to suffer for it. • There is no point reporting corruption in local government because nothing useful will be
done about it. • Complaints about local government employees should be investigated by an oversight
body, not by the government. In 2010, 59 per cent (n = 839) of respondents disagreed with the statement ‘People who complain about local government are likely to suffer for it.’ Thirty-two per cent (n = 457) agreed, and 9 per cent (n = 135) neither agreed nor disagreed with this statement. As Figure 19 shows, responses to this question remained relatively steady from 1999 to 2008. In 2010, however, respondents were significantly more likely than they were in 2008 to agree that people who complain about local government are likely to suffer for it (χ2 = 62.09, p < .001).
Figure 19. Perceptions about complaints: responses to the statement ‘People who complain about local government employees are likely to suffer for it.’ (1999–2010)

Public perceptions of local government 35
Explaining the variation: agreement with the statement ‘People who complain about local government employees are
likely to suffer for it.’ Education Respondents whose highest level of education was primary school (43%,
n = 26) or who had undertaken some tertiary education (42%, n = 25) were most likely to agree that people who complain about local government are likely to suffer for it, while respondents who had completed tertiary education were least likely to agree (20%, n = 62), compared with other respondents: some secondary school: 36%, n = 149 completed year 12/tech or trade: 34%, n = 192. b = 0.83, p < .001
Experience Respondents who reported a recent satisfactory experience with local with local government (27%, n = 85) were less likely than those who did not report a government recent satisfactory experience (33%, n = 32) to agree that people who employees complain about local government are likely to suffer for it (b = 0.14, p < .05).
Respondents who reported a recent unsatisfactory experience with local government (45%, n = 95) were more likely than respondents who did not report a recent unsatisfactory experience (30%, n = 362) to agree that people who complain about local government are likely to suffer for it (b = −0.19, p < .001).
R2 = .19, SEE = 0.97, F(8,1384) = 6.21, p < .001

Public perceptions of local government 36
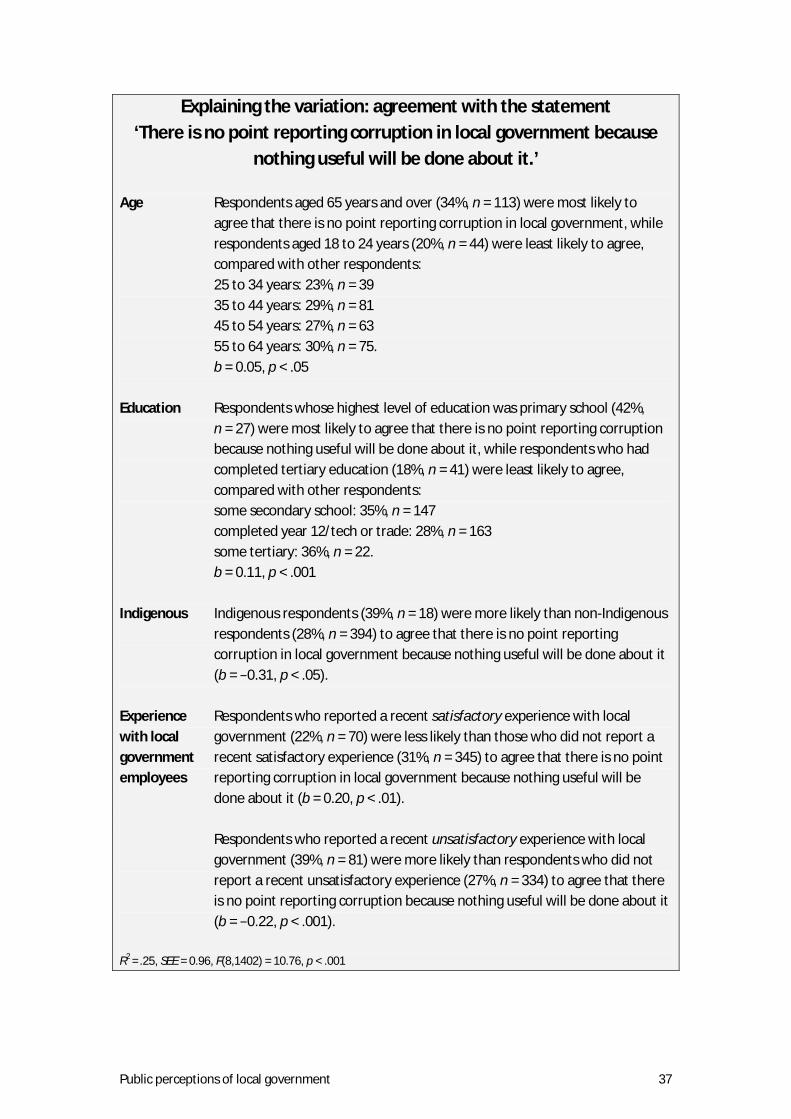
Two-thirds of respondents in 2010 disagreed (64%, n = 927) with the statement ‘There is no point reporting corruption in local government because nothing useful will be done about it.’ Twenty-nine per cent (n = 415) agreed with this statement, and 7 per cent (n = 106) neither agreed nor disagreed. Responses to this item have not changed substantially over time (see Figure 20).
Figure 20. Perceptions about complaints: responses to the statement ‘There is no point reporting corruption in local government because nothing useful will be done about it.’ (1999–2010)
Public perceptions of local government 37
Explaining the variation: agreement with the statement ‘There is no point reporting corruption in local government because
nothing useful will be done about it.’ Age Respondents aged 65 years and over (34%, n = 113) were most likely to
agree that there is no point reporting corruption in local government, while respondents aged 18 to 24 years (20%, n = 44) were least likely to agree, compared with other respondents: 25 to 34 years: 23%, n = 39 35 to 44 years: 29%, n = 81 45 to 54 years: 27%, n = 63 55 to 64 years: 30%, n = 75. b = 0.05, p < .05
Education Respondents whose highest level of education was primary school (42%,
n = 27) were most likely to agree that there is no point reporting corruption because nothing useful will be done about it, while respondents who had completed tertiary education (18%, n = 41) were least likely to agree, compared with other respondents: some secondary school: 35%, n = 147 completed year 12/tech or trade: 28%, n = 163 some tertiary: 36%, n = 22. b = 0.11, p < .001
Indigenous Indigenous respondents (39%, n = 18) were more likely than non-Indigenous
respondents (28%, n = 394) to agree that there is no point reporting corruption in local government because nothing useful will be done about it (b = −0.31, p < .05).
Experience Respondents who reported a recent satisfactory experience with local with local government (22%, n = 70) were less likely than those who did not report a government recent satisfactory experience (31%, n = 345) to agree that there is no point employees reporting corruption in local government because nothing useful will be
done about it (b = 0.20, p < .01).
Respondents who reported a recent unsatisfactory experience with local government (39%, n = 81) were more likely than respondents who did not report a recent unsatisfactory experience (27%, n = 334) to agree that there is no point reporting corruption because nothing useful will be done about it (b = −0.22, p < .001).
R2 = .25, SEE = 0.96, F(8,1402) = 10.76, p < .001

Public perceptions of local government 38
Respondents were asked for the first time in 2010 if complaints about local government should be investigated by an independent body rather than the government. Most respondents (n = 1353) agreed with this statement (see Figure 21).
Figure 21. Perceptions about complaints: responses to the statement ‘Complaints about local government employees should be investigated by an oversight body, not by the government.’ (2010)
Explaining the variation: agreement with the statement ‘Complaints about local government employees should be investigated
by an oversight body, not by the government.’ Experience Respondents who reported a recent satisfactory experience (84%, n = 272) with local were less likely than those who did not report a recent satisfactory government experience (92%, n = 1081) to agree that complaints about local government employees should be investigated by an independent body rather than the government
(b = −0.16, p < .001). Respondents who reported a recent unsatisfactory experience (94%, n = 203) were more likely than those who did not report a recent unsatisfactory experience (89%, n = 1150) to agree that complaints should be investigated by an independent body rather than government (b = −0.09, p < .001).
R2 = .14, SEE = 0.68, F(8,1454) = 3.78, p < .001

Public perceptions of local government 39
Conclusion
The 2010 Public Attitudes Survey shows that the Queensland public has positive perceptions of local government employees. Respondents generally believed that local government employees act honestly and are well behaved. In addition, most respondents who had contact with a local government employee in the last year reported that the interaction was satisfactory. Nonetheless, analysis showed that unsatisfactory experiences were related to negative perceptions of local government. Therefore, employee interactions with the public could still be improved. The results also showed that local governments fail to live up to the public’s expectations of complaints processing systems.
Interactions with the public The nature of an employee’s interactions with the public is clearly important in shaping public perceptions of local government employees. Specifically, perceptions can be improved if the employee has a friendly and professional manner, takes what the client considers to be appropriate action, and behaves in a way that the client considers to be competent.
Perceptions of corruption and complaints processing Several survey items indicate that the public’s perceptions of corruption and complaints processing in local government can be improved. Some of these — such as the beliefs that corruption will always exist in local government, and that not enough is being done to combat corruption in local government — continue an established trend. However, the 2010 Public Attitudes Survey results show that public confidence in key areas has declined. Respondents are less confident than they were in 2008 that their complaint will be handled properly, regardless of whether they make the complaint to the relevant local government body, or an oversight body such as the Ombudsman or the CMC. It is likely that this decline in confidence has led to an increase in the proportion of respondents who felt like making a complaint but did not. This result indicates that the number of lodged complaints substantially underestimates the prevalence of poor employee behaviour. As a consequence, this behaviour may go unchecked. Interestingly, while the public preferred that complaints be handled by an oversight body rather than the government, the public’s actual behaviour contradicts this view. Few of the respondents who made a complaint after a negative experience with a local government employee reported it to the Ombudsman, and none of the respondents complained to the CMC. Rather, the majority of respondents reported the matter directly to the local government involved. Taken together, the results show that the public’s confidence in the complaints process has declined since the last public survey was conducted in 2008. Public education about the capacity of local government agencies and oversight bodies to prevent, detect and adequately respond to allegations of misconduct may help to reverse this trend. The CMC’s

Public perceptions of local government 40
Building Integrity Program aims to develop sound integrity and complaints management systems in local government. By establishing and maintaining a strong culture of integrity, managers and staff are better placed to deliver services and handle customer complaints, thereby improving client perceptions and public confidence. The CMC will keep the public informed on this program via publications and website updates.
Public perceptions of local government 41
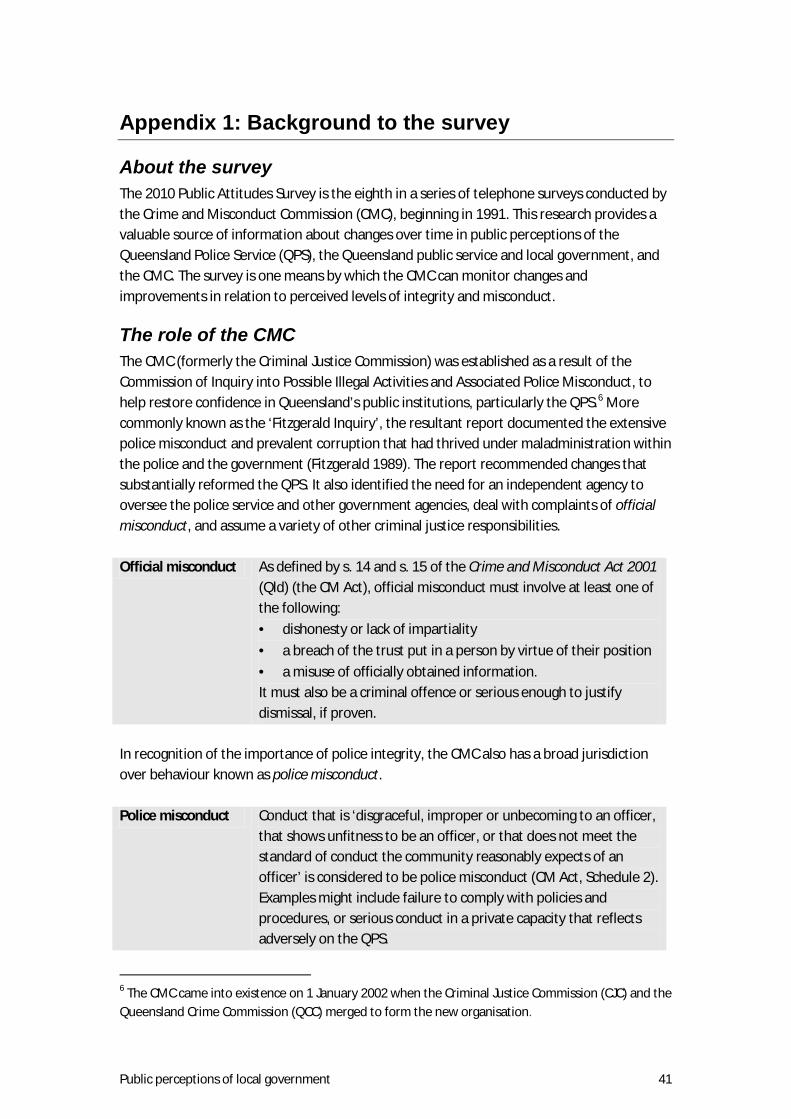
Appendix 1: Background to the survey
About the survey The 2010 Public Attitudes Survey is the eighth in a series of telephone surveys conducted by the Crime and Misconduct Commission (CMC), beginning in 1991. This research provides a valuable source of information about changes over time in public perceptions of the Queensland Police Service (QPS), the Queensland public service and local government, and the CMC. The survey is one means by which the CMC can monitor changes and improvements in relation to perceived levels of integrity and misconduct.
The role of the CMC The CMC (formerly the Criminal Justice Commission) was established as a result of the Commission of Inquiry into Possible Illegal Activities and Associated Police Misconduct, to help restore confidence in Queensland’s public institutions, particularly the QPS.6
More commonly known as the ‘Fitzgerald Inquiry’, the resultant report documented the extensive police misconduct and prevalent corruption that had thrived under maladministration within the police and the government (Fitzgerald 1989). The report recommended changes that substantially reformed the QPS. It also identified the need for an independent agency to oversee the police service and other government agencies, deal with complaints of official misconduct, and assume a variety of other criminal justice responsibilities.
Official misconduct As defined by s. 14 and s. 15 of the Crime and Misconduct Act 2001 (Qld) (the CM Act), official misconduct must involve at least one of the following: • dishonesty or lack of impartiality • a breach of the trust put in a person by virtue of their position • a misuse of officially obtained information. It must also be a criminal offence or serious enough to justify dismissal, if proven.
In recognition of the importance of police integrity, the CMC also has a broad jurisdiction over behaviour known as police misconduct. Police misconduct Conduct that is ‘disgraceful, improper or unbecoming to an officer,
that shows unfitness to be an officer, or that does not meet the standard of conduct the community reasonably expects of an officer’ is considered to be police misconduct (CM Act, Schedule 2). Examples might include failure to comply with policies and procedures, or serious conduct in a private capacity that reflects adversely on the QPS.
6 The CMC came into existence on 1 January 2002 when the Criminal Justice Commission (CJC) and the Queensland Crime Commission (QCC) merged to form the new organisation.

Public perceptions of local government 42
Further, while the terms misconduct and corruption are often used interchangeably, they have specific meanings in legislation. Corruption In this report corruption involves a breach of trust in the performance of
official duties and may fall within the category of official misconduct under s. 15 of the CM Act.
Misconduct Misconduct means official misconduct or police misconduct under
Schedule 2 of the CM Act.
Changes in complaints processing When the CM Act was passed in 2001, it introduced a new regime for handling complaints. While the CMC retains primary responsibility for dealing with complaints of official misconduct, the CM Act requires that it refers such matters to the agency to which the complaint relates, as long as the public interest is safeguarded. This is part of the principle of devolution. Devolution Action to prevent and deal with misconduct in a public sector agency
should, wherever possible, happen within the agency itself. As part of the devolution process, the CMC may give authority to the relevant agency to commence dealing with certain less serious complaints of official misconduct and to report within agreed timeframes.7
If a complaint is more serious, the CMC must decide whether it is appropriate to refer the matter to the agency. In making this decision, the CMC must consider the nature and seriousness of the complaint, the public interest, and the capacity of the agency to respond effectively.8
Measuring integrity
Most matters are not serious and are therefore appropriate for the agency to deal with. Nonetheless, the CMC monitors how well the agency is carrying out this responsibility. If it is identified that the agency is not carrying out this responsibility, the CMC may monitor the matter more closely or assume responsibility for the investigation.
The word ‘integrity’ is often used to describe moral excellence. It derives from the Latin integritas meaning ‘wholeness, entireness, completeness’. In the public sector, integrity describes the integration of factors such as operational systems, control strategies and ethical standards that influence how organisations operate. It encompasses values such as honesty, transparency, accountability and respect; and requires that organisations always act in the public interest.
7 Through directions under s. 40 of the CM Act 8 The CMC investigates serious matters, particularly if there is reason to believe the misconduct is prevalent or systemic, or where allegations involve serious criminal conduct that has the potential to undermine public confidence.

Public perceptions of local government 43
Perceptions of local government employee integrity can be shaped by numerous factors, including the nature of media reporting and citizens’ style of media consumption (Donlon-Cotton 2007; Edwards 2005; Weitzer & Tuch 2005). Such factors can have a substantial effect on public perceptions, but are unmeasured in the Public Attitudes Survey. The Public Attitudes Survey uses a number of measures of ‘integrity’ throughout this report. These include respondents’ level of agreement (or otherwise) with statements such as ‘Most government employees are honest’ or ‘Not enough is being done about corruption in local government’. We believe that, when combined, the responses to such questions give the reader a sense of the public’s views about public sector integrity.9
For a broader perspective of integrity, the reader is encouraged to access our website (www.cmc.qld.gov.au) for other CMC publications about local government performance and integrity.
9 This view is in line with other Australian research conducted on public perceptions, for example, the Australian Government Productivity Commission’s Report on government services series at <www.pc.gov.au>.

Public perceptions of local government 44
Appendix 2: Survey method
Survey administration The CMC, and formerly the CJC, has collected Public Attitudes Survey data regularly for 19 years.10
This allows for comparisons of public perceptions over time, and many trends are presented throughout the report. In assessing these trends, it is important to remember that significant changes have occurred during this period, which therefore has a substantial impact on public perceptions.
The survey was administered using a random sample drawn from the population of all Queensland residents aged 18 years and over who were the usual residents in a private dwelling with a landline telephone. Unlike previous years, the 2010 Public Attitudes Survey used a stratified random sampling technique. Stratified sampling ensures that the representation of particular sub-groups in the sample is proportionate to their representation in the population. The sample was stratified by age, gender and region of residence. Furthermore, quota sampling was used for the 18 to 24 age group because this group was substantially underrepresented in the 2008 survey. Unlike previous years where responses were not weighted, the use of quotas in the 2010 survey’s sampling strategy for the 18 to 24 age group necessitates the use of weighted data when examining changes over time. The sample was drawn from five Queensland statistical divisions — Brisbane, South East (excluding Brisbane), South West, Central and Far North.11 Telephone numbers were randomly selected from all telephone numbers in each division. One resident aged over 18 years was randomly selected from the household to complete the survey.12
The survey was undertaken by Computer Assisted Telephone Interviewing (CATI) in June–July 2010. The order in which participants completed the survey sections was varied (i.e. 51 per cent of participants completed the first section first; 49 per cent of participants completed the second section first). This was done in an effort to combat fatigue due to the length of the survey. A total of 1529 respondents participated in the 2010 survey, and the response rate was 29 per cent. This was lower than in previous years — 33 per cent in 2008, 43 per cent in 2005 and 48 per cent in 2002. The lower response rate could reflect further advancements in technology such as answering machines and caller identification, or it could simply reflect
10 This report only analyses trends over a 15-year period because the 1991 and 1993 survey data is not comparable due to changes in the questions. 11 The Queensland Government Office of Economic and Statistical Research and the Australian Bureau of Statistics define 13 regions. To ensure sufficient respondents from each region for statistical purposes, we combined several of these, and refer to five regions only. 12 To randomly select which member of the household would participate in the survey, the resident whose birthday was closest to the day of the survey was selected.

Public perceptions of local government 45
the wariness people have towards telephone solicitation (Calvert & Pope 2005; Kempf & Remington 2007; Vehovar, Berzelak & Manfreda 2010). The increase in the use of mobile phones poses a similar challenge for household telephone survey practitioners (Vehovar, Berzelak & Manfreda 2010) because mobile phones are gradually replacing residential landlines. Overall, the relatively poor response rate weakens our confidence in the ability to generalise the results to the Queensland public. In light of this, we will consider changing the survey method to improve the response rate in the future.
Data analysis Chi-square analysis, nominal regression and descriptive statistics were used to explore public perceptions of local government, to assess the relationship between demographic factors and survey responses from the 2010 Public Attitudes Survey, and to measure changes in responses over time. Appendix 4 provides a list of statistical notations and definitions to assist with an understanding of the statistical terms used within the report. The analyses and figures presented in this report exclude a small number of respondents who refused to answer the relevant question(s) or indicated that they did not know enough about the question to provide a response. Because of this, there are some minor variations from the figures presented in previous reports.
Survey limitations Quantitative surveys are the preferred method for gauging public opinion about a particular issue because you can draw inferences about the population from the responses of a relatively small sample (Roberts & Hough 2005). However, the results of this survey remain an estimate of the views of the population and are subject to sampling error. In particular, our method of surveying via landline telephones may lead to a sample bias. The concepts of ‘integrity’ and ‘confidence’ are complex, and are difficult to measure using structured responses to simple questions. Further, the complex nature of public attitudes and the diversity of attitudes among community members make this measurement difficult. Although regression analyses were used to explore the association between variables (i.e. the relationship between demographic characteristics and perceptions of local government employee honesty), these analyses do not imply causation; and the results should be treated as indicative rather than conclusive. There may also be important factors that could explain differences in perceptions that were not measured in the Public Attitudes Survey, such as sources of media consumption.

Public perceptions of local government 46
Appendix 3: Respondent demographics
Gender Figure A3.1 shows the proportion of male and female respondents to each survey. Given that the 2010 Public Attitudes Survey used stratified random sampling, the proportion of male (50%, n = 770) and female (50% n = 759) respondents is significantly different to a number of past years. The significantly higher proportion of females in 2008 and males in 2002 and in 1999 (χ2 = 129.50, p < .001) is a result of random sampling.
Figure A3.1. Survey respondents by gender (1995–2010)
Public perceptions of local government 47
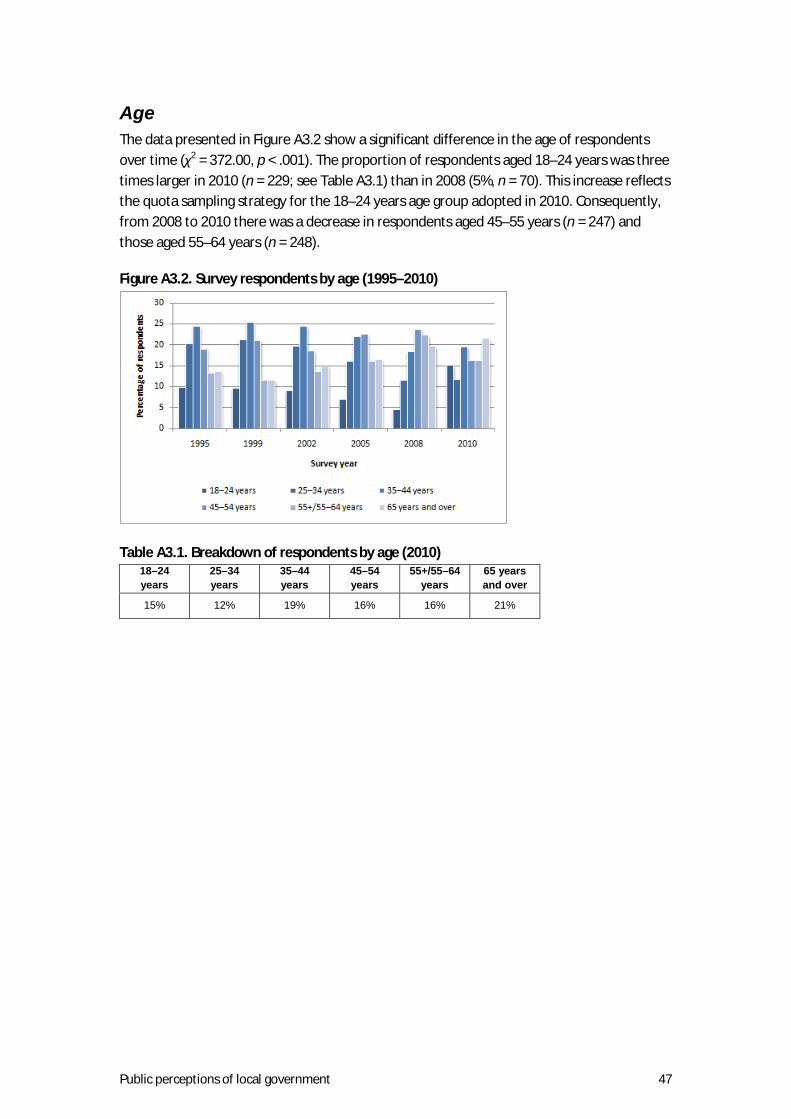
Age The data presented in Figure A3.2 show a significant difference in the age of respondents over time (χ2 = 372.00, p < .001). The proportion of respondents aged 18–24 years was three times larger in 2010 (n = 229; see Table A3.1) than in 2008 (5%, n = 70). This increase reflects the quota sampling strategy for the 18–24 years age group adopted in 2010. Consequently, from 2008 to 2010 there was a decrease in respondents aged 45–55 years (n = 247) and those aged 55–64 years (n = 248).
Figure A3.2. Survey respondents by age (1995–2010)
Table A3.1. Breakdown of respondents by age (2010) 18–24 years
25–34 years
35–44 years
45–54 years
55+/55–64 years
65 years and over
15% 12% 19% 16% 16% 21%

Public perceptions of local government 48
Employment status Figure A3.3 shows that the majority of respondents for each year were employed. There were only small differences in the employment status of respondents from 2008 to 2010.
Figure A3.3. Survey respondents by employment status (1995–2010)
Table A3.2. Breakdown of respondents by employment status (2010)
Employed Student Unemployed Home Duties Retired/ pension
61% 3% 3% 6% 27%

Public perceptions of local government 49
Education Respondents were asked to state their highest level of educational achievement. In 2010 there was a decrease in the proportion of respondents who had completed tertiary education (χ2 = 891.50, p < .001). See Figure A3.4.
Figure A3.4. Survey respondents by highest level of education (1995–2010)
Table A3.3. Breakdown of respondents by education level (2010)
No schooling
Primary school
Some secondary
school
Completed year 12/tech
or trade
Some tertiary
Completed tertiary
0% 4% 30% 40% 4% 21%

Public perceptions of local government 50
Ethnicity Respondents were asked if they identified with a particular ethnic or cultural group. Of the 1437 participants who responded to this question in 2010, the majority identified themselves as Australian (89%, n = 1286), while 11 per cent (n = 151) identified themselves as belonging to a culture other than ‘Australian’ or as ‘mixed ethnicity’.13
The most common ethnic or cultural groups that the respondents identified with were British (4%, n = 52), New Zealander (2%, n = 32) and Southern European (1%, n = 14). There was no significant difference in the ethnicity or culture of 2008 and 2010 respondents.
Of the respondents who reported their Indigenous status, the sample was twice as likely to identify as Aboriginal and/or Torres Strait Islander in 2010 (3%, n = 46) compared with 2008 (1%, n = 22). In 2010: • 35 respondents identified as Aboriginal • 6 identified as Torres Strait Islander • 5 identified as Aboriginal and Torres Strait Islander. The proportion of Aboriginal and/or Torres Strait Islander respondents was slightly less than the estimated Aboriginal and/or Torres Strait Islander population in Queensland (4%).14
13 A small number did not identify with an ethnic or cultural group.
14 The estimated proportion of resident population of Indigenous persons in Australia is 2.5 per cent. More than one-quarter (28%) of the national Indigenous population live in Queensland (Australian Bureau of Statistics 2008).

Public perceptions of local government 51
Region The data presented in Figure A3.5 display the breakdown of respondents by region. There has been no significant change in the proportion of respondents from each region since 1999. The data from 1995 differs significantly from other years because the sampling frame in that year was based on police regions rather than statistical divisions (χ2 = 193.80, p < .001).15
Figure A3.5. Survey respondents by region (1995–2010)
Table A3.4. Breakdown of respondents by region (2010)
Brisbane South-East Queensland
South-West Queensland
Central Queensland
North Queensland
33% 17% 17% 17% 17%
15 For comparisons, the 1995 data have been coded to approximate the Australian Bureau of Statistics statistical regions used in subsequent survey rounds.

Public perceptions of local government 52
Appendix 4: List of statistical terms, symbols and descriptions
Statistical term or symbol
Description
χ2
Chi-square is a statistical technique used to test the independence of two categorical variables. It compares the frequency of responses found in the various categories of one variable across the different categories of another variable (e.g. the proportion of respondents with a satisfactory experience in 2010 compared with 2008).
n Number of participants in a sub-sample
Nominal regression
Nominal logistic regression is the extension of the statistical technique logistic regression, where the categorical outcome variable has more than two levels. This means that while it is still used to predict the probability of an occurrence (like logistic regression), it allows for multiple outcomes (e.g. instead of predicting only dissatisfied or satisfied in logistic regression, there may be several groups — namely: strongly agree or agree; neither agree nor disagree; and strongly disagree or disagree).
p
p is the probability of obtaining the given result when the null hypothesis is true and any difference between groups or relationship between variables is due to chance alone. p values of less than .05 are described as statistically significant because there is a less than 5 per cent likelihood that the result occurred by chance.
R2 R squared is a descriptive measure between zero and one, indicating how good a variable is (or a set of variables are) at predicting another variable.
SEE The standard error of the estimate (SEE) is the difference between the actual values of the outcome variable and the values that are predicted by the regression model.
F The F-ratio is used to test the overall differences between three or more group means.
b
b indicates the strength of a relationship between an outcome variable and a predictor variable; for example, the relationship that gender (predictor variable) has on respondents’ satisfactory experience with local government (outcome variable).

Public perceptions of local government 53
References Aulich, C, Halligan, J and Nutley, S 2001, Australian handbook of public sector management,
Allen and Unwin, Sydney. Australian Bureau of Statistics 2008, National Aboriginal and Torres Strait Islanders social
survey, Australian Bureau of Statistics, Canberra. Australian Public Service Commission 2003 The Australian experience of public sector reform,
APSC, Canberra. Brown, R and Evans, E 2009, Public confidence in the police: a review of research, Association
of Police Authorities, Lincoln. Calvert, P and Pope, A 2005, ‘Telephone survey research for library managers’, Library
Management, vol. 26, no. 3, pp. 139–51. Donlon-Cotton, C 2007, ‘Critical incidents: dealing with the media’, Law and Order, vol. 55,
no. 9, pp. 24–8. Edwards, CJ 2005, Changing policing theories for 21st century societies, Federation Press,
Leichhardt. Fitzgerald, GE 1989, Report of a commission of inquiry pursuant to orders in Council,
Government Printer, Brisbane. Goldsmith, AJ 2010, ‘Policing’s new visibility’, British Journal of Criminology, vol. 50,
pp. 914–34. Head, B, Brown, A and Connors, C (eds) 2008, Promoting integrity: assessing and improving
public institutions, Ashgate, Aldershot. Kempf, AM and Remington PL 2007, ‘New challenges for telephone survey research in the
twenty-first century’, Public Health, vol. 28, pp. 113–26. Miller, J and Davis, RC 2008, ‘Unpacking public attitudes to the police: contrasting
perceptions of misconduct with traditional measures of satisfaction’, International Journal of Police Science and Management, vol. 10, pp. 9–22.
Provan, K and Milward, H 2001, ‘Do networks really work? A framework for evaluating public sector organizational networks’, Public Administration Review, vol. 61, no. 4, pp. 414–23.
Roberts, JV and Hough, M 2005, Understanding public attitudes to criminal justice, Open University Press, Berkshire.
Rosenbaum, DP, Schuck, AM, Costello, SK, Hawkins, DF and Ring, MK 2005, ‘Attitudes toward the police: the effects of direct and vicarious experience’, Police Quarterly, vol. 8, pp. 343–65.
Shepherd, RP 2009, ‘Departmental audit committees and governance: improving scrutiny or allaying public perceptions of poor management?’, paper presented to CPSA Annual Conference, Ottawa, 29 May 2009.
Smith, G 2009, ‘Why don’t more people complain against the police?’, European Journal of Criminology, vol. 6, no. 3, pp. 251–68.
Van de Walle, S, Van Roosbroek, S and Bouckaert, G 2008, ‘Trust in the public sector: is there any evidence for a long-term decline?’, International Review of Administrative Sciences, vol. 74, no. 1, pp. 47–64.

Public perceptions of local government 54
Vehovar, V, Berzelak, N and Manfreda, KL 2010, ‘Mobile phones in an environment of competing survey modes: applying metric for evaluation of costs and errors’, Social Science Computer Review, vol. 28, no. 3, pp. 303–18.
Weitzer, RJ and Tuch, SA 2005, ‘Racially biased policing: determinants of citizen perceptions’, Social Forces, vol. 83, no. 3, pp. 1009–30.
Williams, H 2001, ‘Perceptions and performance: the Australian public service experience’, International Review of Administrative Sciences, vol. 67, no. 1, pp. 49–64.
Legislation cited in this report: Crime and Misconduct Act 2001 (Qld)