PUBLIC OPINION AND NATIONAL DEFENCE - … opinion and national defence / October 2015 Estonian...
64
Pärnu mnt 102, A- korpus, 10116 Tallinn Tel: +372 585 29 700 [email protected] PUBLIC OPINION AND NATIONAL DEFENCE Ordered by: Estonian Ministry of Defence Juhan Kivirähk October 2015
Transcript of PUBLIC OPINION AND NATIONAL DEFENCE - … opinion and national defence / October 2015 Estonian...
Pärnu mnt 102, A- korpus, 10116 Tallinn Tel: +372 585 29 700 [email protected]
www.turu-uuringute.eu
PUBLIC OPINION AND NATIONAL
DEFENCE
Ordered by: Estonian Ministry of Defence
Juhan Kivirähk
October 2015
Public opinion and national defence / October 2015 Estonian Ministry of Defence
Turu-uuringute AS 2
TABLE OF CONTENTS
TABLE OF CONTENTS ...............................................................................................................2
SUMMARY ................................................................................................................................4
BACKGROUND OF THE SURVEY ................................................................................................9
1 Sample ....................................................................................................... 9
2 Survey ..................................................................................................... 10
3 Performers............................................................................................... 12
RESULTS OF THE SURVEY ......................................................................................................13
1 General attitudes towards life in Estonia and pride in Estonia ................. 13
2 Confidence in institutions ........................................................................ 16
2.1 General background ................................................................................................. 16
2.1 Defence structures ................................................................................................... 17
3 Security and threats ................................................................................ 19
3.1 Security in the world ................................................................................................ 19
3.2 Security in Estonia ................................................................................................... 20
3.3 Threats to world security .......................................................................................... 22
3.4 Threats to Estonia .................................................................................................... 24
3.5 Security guarantees ................................................................................................. 27
4 Defence willingness among the population of Estonia ............................. 28
4.1 Attitude towards the necessity of resistance ................................................................ 28
4.2 Willingness to participate in defence activities .............................................................. 30
4.3 Desire to leave Estonia in the event of a military threat ................................................ 32
4.4 Ability to act in the event of a potential attack ............................................................. 33
4.5 On which topics do you require more information? ....................................................... 33
5 Defence capability of Estonia ................................................................... 35
5.1 Assessment of the defence capability of Estonia ........................................................... 35
5.2 Views on the volume of defence expenditures .............................................................. 36
5.3 Preparedness for making a personal donation to national defence .................................. 37
5.4 Assessment of state activities in view of the development of national defence ................. 38
5.5 Assessments on the defence of the Estonian border ..................................................... 39
6 Organisation of Estonian national defence ............................................... 40
6.1 Attitude towards conscript service .............................................................................. 40
6.1 Attitudes towards the professional defence forces ........................................................ 45
6.2 Attitude towards the comprehensive approach to national defence ................................. 45
6.3 Tasks of the Defence League ..................................................................................... 46
6.4 Opinions on joining the Defence League ...................................................................... 48
7 NATO ....................................................................................................... 49
7.1 Attitude towards membership in NATO........................................................................ 49
7.1 NATO’s assistance in the event of a potential threat ..................................................... 50
7.2 Assessments on the actions of NATO .......................................................................... 51
8 International military operations ............................................................. 52
8.1 Attitude towards participation in international operations .............................................. 52
8.2 Arguments for participation in international operations ................................................. 53
8.3 Attitudes towards participation in NATO, EU and UN operations ..................................... 55
Public opinion and national defence / October 2015 Estonian Ministry of Defence
Turu-uuringute AS 3
9 Attitudes towards professional servicemen ............................................. 56
10 Veteran policy .......................................................................................... 58
11 Information related to national defence .................................................. 60
11.1 National defence instruction in schools ........................................................................ 60
11.2 Supplement Riigikaitse of the daily Postimees .............................................................. 60
12 Media consumption .................................................................................. 62
ANNEXES ...............................................................................................................................64
1 Questionnaire .......................................................................................... 64
2 Summary tables on responses ................................................................. 64
3 Frequency tables with the responses of Estonians ................................... 64
4 Frequency tables with the responses of non-Estonians ........................... 64
Public opinion and national defence / October 2015 Estonian Ministry of Defence
Turu-uuringute AS 4
SUMMARY
In October 2015, on the order of the Estonian Ministry of Defence, the Social and Market Research
Company Turu-uuringute AS conducted a public opinion survey on national defence during which
1,193 residents of Estonia from the age of 15+ were interviewed. This was already the thirty-eighth
survey in monitoring public opinion, which was started in 2000.
In Estonia as well as elsewhere in Europe, the political atmosphere of the survey period was
dominated by the question of refugees. The Parliament of Estonia discussed migration; protests
against the intake of refugees took place under the leadership of the Estonian Conservative People’s
Party (EKRE) and People’s Unity Party (RÜE).
The topic of MPs’ allowances for professional expenses provoked the public as well when it was
revealed how some MPs use the allowances for car leases. The government presented the
parliament with the Estonian-Russian Border Treaty for ratification. The City of Tallinn had to
manage without a mayor and the Centre Party became the grounds of a power struggle when Kadri
Simson decided to stand as a candidate for the party chairman.
The assessments given to changes that have taken place in Estonian life show an increase in the
number of the Estonian respondents who perceive no change in the situation, the proportion of
respondents who perceived positive changes has decreased. In March, 40 per cent of Estonians felt
that the situation is improving, whereas in October, the respective indicator was only 29 per cent;
the number of people who think the situation has remained the same has grown from 38 per cent
to 46 per cent. The assessments given to life in Estonia by Russian-speaking respondents have
remained unchanged throughout the last three surveys.
The survey measured people’s pride over living in the Republic of Estonia and its membership in the
European Union and NATO. 50% of all respondents, including 57% of Estonians and 36% of non-
Estonians, feel proud and happy over living in Estonia very often or often enough.
The membership in the European Union and NATO, however, are not as important to people: 32%
of the respondents are often proud to belong to the European Union and more than 35% are proud
to belong to NATO.
Based on whether a respondent is an Estonian or Russian speaker, there are significant differences
regarding their attitudes towards the membership in the European Union and NATO. 46% of the
Estonian-speaking residents are proud and happy to belong to NATO, whereas only 11% of
Russian-speaking residents feel the same. 37% of Estonian and 21% of Russian-speaking
respondents feel constantly or often enough proud over the membership in the European Union.
Of the ten institutions the reliability of which the respondents were asked to assess, the Rescue
Services rank the highest in trustworthiness (95% trusts them completely or rather trusts them).
This is followed by the Police (85%), the Defence Forces (78%), the Defence League (70%), NATO
and the European Union (both 60%), the President (59%). The confidence in the state’s political
institutions has declined: the trustworthiness of the Parliament and the Government has decreased
significantly, while still remaining positive, whereas the Prime Minister is trusted and mistrusted by
an equal number of people.
Estonian-speaking and Russian-speaking respondents’ trust in the state’s political and national
defence institutions differs considerably—at times, Russian-speaking respondents’ indicators are
almost half as low as those of Estonians. The greatest difference occurs in the confidence in NATO,
which is trusted by 78 per cent of Estonians, but only by 24% of Russian-speaking respondents;
the situation is similar with the confidence in the President (74% vs 28%).
Public opinion and national defence / October 2015 Estonian Ministry of Defence
Turu-uuringute AS 5
The number of people who believe that the world is going to become more unstable and the
likelihood of military conflicts will grow remains high—this opinion is held by 71% of the
respondents. Only 7 per cent believe that the world is going to become more secure in the coming
decade and 16% think that the situation will remain unchanged.
Respondents perceive the defence situation in Estonia to be somewhat more positive than that of
the world in general, yet even this assessment has become more negative compared to spring.
Only 23 per cent of respondents believe that in ten years, the residents of Estonia will be living in
more secure conditions than they do now. The proportion of those who presume that the situation
will remain unchanged and of those who predict an increase in insecurity is equally balanced at 31
per cent.
For a long time, Russia’s activities to restore its authority were perceived as the main threat to
world security, whereas the current survey deems the activities of the Islamic State (64%) and
international terrorist networks (59%) even more dangerous than Russia. Along with organised
crime (40%) Russia’s activities to restore its authority (39%) rank as low as the third and fourth
place. It is possible that the influence of the Russian factor decreased because the survey had a
special category for the armed conflict in Ukraine, which was considered a certain threat to world
security by 37% of the respondents.
While Estonian and Russian-speaking respondents assess many global threats similarly, there is a
fundamental difference in evaluating the activities of Russia. Estonians rank the threat of Russia as
third (53%), whereas Russian-speaking respondents rank it as last (7%).
Similarly to the preceding surveys, the most probable threats to Estonia are thought to be the
following three, the realisation of which in the following years is considered probable or quite
probable by more than half of the respondents: 69% of residents think that there may be an
organised attack against the Estonian state information systems (a so-called cyber-attack), 61%
believe that some foreign country may interfere in Estonian politics and economy in order to
influence these in their own interests and 50% think Estonia may face an extensive marine
pollution. The public has highlighted these three primary security threats for several years.
The number of those who believe that nationally or religiously motivated conflicts between
population groups are likely to occur has increased considerably compared to the preceding
surveys. In March, 34% of respondents held that opinion, whereas in the current survey, the rate is
45 per cent. This could be seen as the impact of the society’s fear of refugees.
The percentage of people regarding an extensive or limited military attack probable has decreased
compared to spring—this is deemed likely by 26 per cent of Estonians and by 14–15 per cent of
Russian-speaking respondents.
NATO membership continues to be considered the main security guarantee for Estonia (57%
mention it as one of the three most important factors). Similarly to the preceding surveys, the
development of Estonia’s independent defence capability holds 2nd place (42%), followed by
cooperation and good relations with Russia (29%), which are considered the primary security
guarantee mainly by Russian-language speakers (60%; only 15% of Estonians).
For Estonian-speaking respondents, the most important security guarantee is clearly the
membership in NATO (73%; 22% of Russian speakers), development of Estonia’s independent
defence capability is in 2nd place (45%; 34% of Russian speakers).
The proportion of people who consider armed resistance necessary in case of a military attack has
decreased by 4 per cent compared to spring, falling from 83 per cent to 79. Estonian-speaking
respondents consider armed resistance more necessary than non-Estonians (82% and 71%
respectively).
62% of Estonians and 42% of Russian-speaking respondents would be willing to participate in
defence activities to the best of their abilities and skills. 72% of male citizens would be willing to
participate in national defence. More than 80 per cent of male citizens under 35 years of age and
three fourths of male citizens under 50 years of age are willing to participate in national defence.
Public opinion and national defence / October 2015 Estonian Ministry of Defence
Turu-uuringute AS 6
In a situation where Estonia is under attack, every fifth person would consider leaving Estonia.
Women (25% certainly or probably) and younger people up to 39 years of age (more than a third)
are the most likely to leave Estonia. 32 per cent of Russian-speaking respondents and 16 per cent
of Estonians would probably leave.
The population’s awareness about behaving in an emergency situation is quite low: only 25% would
know what they could do to defend Estonia if there is a threat of attack by a foreign enemy,
whereas 69% do not regard that they are informed enough. People’s awareness has not risen since
spring 2014.
People would like to have more information on how to act in a conflict area as a civilian (40%), how
the public would be informed in case of a threat (42%) and how evacuation would be organised
(38%). Male respondents also show interest slightly greater than the average in questions related
to mobilisation and their responsibilities regarding the participation in national defence.
Assessments to Estonia’s national defence ability have not changed considerably since the last
survey: in the event of an attack by a foreign country, defending Estonia is considered certainly
possible or probably possible by 53 per cent of the respondents (61% of Estonians).
When assessing the volume of Estonian defence expenditures, 28 per cent of the respondents find
that defence spending must be increased and 19% that it should be decreased. The predominant
view is that defence expenditures should remain at the currently achieved level (44%). Estonians’
attitude towards defence expenditures is inversely proportional to that of the Russian-speaking
respondents: 33 per cent of Estonians are in favour of increasing defence expenditures whereas 45
per cent of Russian-speaking respondents support cuts.
35 per cent of Estonians and 13 per cent of Russian-speaking respondents would be certainly or
probably willing to make a financial contribution to support Estonian national defence.
71% of the population provided a positive assessment to the state’s activities regarding the
development of Estonian national defence. Estonians have a more positive attitude towards the
development of national defence than non-Estonians (80% and 51% respectively).
While in last autumn, the assessments given to the protection of the Estonian national border were
clearly negative, the number of positive and negative assessments is now equal. However, Estonian
respondents still tend to be the most critical. In last autumn, as many as two thirds of Estonians
gave a negative assessment to the protection of the Estonian external border; now, the proportion
of critical assessments has decreased to 49%. Only every fourth Russian-speaking respondent
perceives that there are problems with the defence of the eastern border.
People in Estonia have very favouring attitudes towards conscript service: as many as 93% of
respondents believe that young men need to undergo conscript service, with 59% finding it
certainly necessary. The majority of the respondents think that young men with minor health
disorders should undergo conscript service with an appropriate training load.
The majority of the population disapprove of the evasion of conscript service—25% condemn such
behaviour and 41% consider it negative. Younger age groups are more tolerant than average
towards the evasion of conscript service—more than 40% of people under 30 years of age take an
understanding stance.
In 2013, women were given the opportunity to undergo conscript service voluntarily and this has
been gaining increasingly more understanding in the society—more than half of the respondents
believe it to be certainly necessary or rather necessary. Estonians and younger respondents have a
more contemporary attitude towards the questions of gender equality than Russian-speaking and
older respondents. 60% of Estonians think it is necessary for women to have the opportunity of
undergoing conscript service, whereas only 33% of Russian-speaking respondents agree. More than
half of the respondents over 50 years of age think that it is not necessary for women to have the
opportunity of undergoing voluntary conscript service.
Public opinion and national defence / October 2015 Estonian Ministry of Defence
Turu-uuringute AS 7
Even though half of those who consider conscript service for women necessary believe that this
should be done based on a special programme, the proportion of people who believe that women
must undergo conscript service under the same conditions as men is gradually increasing (42 per
cent).
82% of the population prefer maintaining the current concept of national defence based on
professional defence forces together with reserve forces consisting of those who have undergone
conscript service. 11% support waiving compulsory military service and switching to a fully
professional army only.
76 per cent of the respondents (84 per cent of Estonians) believe that such a wider concept of
national defence, which states that national defence is not only the task of armed forces and the
Defence League but a common activity for most state institutions and the entire society, is certainly
suitable or probably suitable for Estonia.
According to the population of Estonia, the main task of the Defence League is to develop national
defence capability, which is marked as the most important task by 35% of respondents; 50% when
the three most important tasks are summarised. Participating in rescue activities in the event of
accidents and disasters is mentioned as first by 13% and among the three main tasks by 52%; the
willingness to defend the country and raising defence readiness among the population is seen as
the most important task by 13% of the respondents, whereas 42% see it as one of the three most
important tasks.
Five per cent of the respondents participate in the activities of the Defence League, 25% of the
respondents are connected to the Defence League through a family member or friend. Russian-
speaking respondents are not well-connected with the Defence League—only 8 per cent of the
respondents have a friend or a family member with a connection to the Defence League.
If respondents were to be presented with a proposal to join the Defence League or its associated
organisations, 5% would certainly join and 18% would probably join. The readiness to join is the
highest among younger respondents.
Attitudes towards Estonia’s membership in NATO have not changed compared to spring: 72% of the
population are in favour of it. 91% of Estonians and only 31 per cent of Russian-speaking
respondents support the membership in NATO.
45 per cent of the respondents (57% of Estonians and 19% of Russian-speaking respondents)
believe that NATO will provide direct military aid if Estonia should face a military threat. 15% think
that NATO would limit their help to political and diplomatic support. 19% believe that the
membership in NATO would help to avoid a military conflict and 10% think that NATO would not
help Estonia in any way.
The feeling of security towards NATO’s aid is supported by the steps that have already been taken
to ensure Estonian security and which are supported by the general population: 69 per cent of the
respondents (81% of Estonians) find that NATO has already done enough to ensure Estonia’s
security and 68% of the population (88% of Estonians, but only 24 per cent of the Russian-
speaking respondents) favour the presence of NATO’s allied forces in Estonia.
62% of the population believe that units of the Estonian Defence Forces should—in accordance with
their capabilities—participate in international operations in different conflict areas of the world.
Estonians favour the participation of the Estonian Defence Forces in military operations more than
Russian-speaking respondents (72% and 39% respectively). Participation in international military
operations is considered necessary primarily because it provides our soldiers with necessary real
combat experience (mentioned by 63% as one of three reasons) and guarantees NATO’s assistance
to Estonia in the event of potential threats (54%).
More than 60 per cent of the respondents support Estonia’s involvement in operations conducted
under the aegis of NATO, the European Union and UN. Russian-speaking respondents favour
involvement in the UN missions the most, this is followed by participation in the European Union
operations and, lastly, in missions as a part of NATO units.
Public opinion and national defence / October 2015 Estonian Ministry of Defence
Turu-uuringute AS 8
Attitudes towards professional servicemen were most recently explored in the survey conducted in
March 2014. The population’s attitudes have not changed since then: 68% of the respondents have
a very positive or generally positive attitude towards active servicemen, this includes as many as
three fourths of Estonian-speaking respondents.
Interest in the military field and patriotism are considered to be the main motives for becoming a
professional serviceman. Factors related to self-improvement are also important: it is seen as an
opportunity to receive training and maintain a good physical form. Salary holds the fourth place in
the ranking of importance. The lack of other jobs and long holidays are seen as less important.
In the mind of the society, the word “veteran” is strongly associated with the image of World War II
(53%), as many as 83 per cent of Russian-speaking respondents associate veterans with World
War II. Still, the proportion of respondents who associate the word “veteran” with the operations of
the Estonian Defence Forces is slowly growing—11 per cent in March has risen to 17 per cent today.
The majority (71%) of the respondents consider celebrating Veterans’ Day certainly necessary or
rather necessary. The Russian-speaking respondents’ awareness of the celebration is still limited,
but it is rising: in March, 43 per cent of the respondents did not know anything about this day or
could not say anything about it, whereas now the respective indicator is 32 per cent. For the first
time, the proportion of Russian-speaking respondents who deemed the celebration necessary
exceeded 50 per cent.
79 per cent of the respondents certainly or probably believe that all schools that offer secondary
education should provide the possibility to have national defence instruction. This figure has fallen
by eight per cent since March. National defence instruction is regarded more or less equally
important by both Estonian and Russian-speaking respondents.
The readership of the national defence themed supplement of the daily Postimees has not changed
since March—18 per cent of the respondents had read the supplement Riigikaitse, 5 per cent of
whom read it most of the time and 13 per cent had read it once or twice. Considering that the
readership of printed newspapers is in decline, it is difficult to expect a great increase here—more
effort should be put into distributing information on national defence online.
Public opinion and national defence / October 2015 Estonian Ministry of Defence
Turu-uuringute AS 9
BACKGROUND OF THE SURVEY
This report has been prepared on the basis of the results of the Omnibus 1000 survey carried out by
Turu-uuringute AS from 6 October till 27 October 2015 and similar earlier surveys. The report will be
submitted to the Estonian Ministry of Defence.
The purpose of the survey was to investigate:
General attitudes towards life in Estonia and pride in Estonia
Confidence in institutions (incl. defence structures) among the population
Residents’ assessments in connection with potential security risks in Estonia and the world
Attitudes in connection with Estonia’s participation in international military operations
Defence willingness among the population and estimated behaviour in the event of potential
threats endangering Estonia
Assessments on Estonia’s defence capability
Attitude towards NATO and its role in ensuring Estonian security
Attitudes both towards compulsory conscript service for men and voluntary conscript service for
women
Attitudes towards the Defence League and understanding its tasks;
Attitudes towards professional servicemen and opinions on the motives for becoming an active
serviceman
Attitudes towards initial national defence instruction in schools.
The first part of the report describes the methodology, the second part presents the results with figures
and comments; the Annex provides the used questionnaire and distribution tables by important
background characteristics.
1 Sample
The survey was carried out in the Omnibus 1000 environment. Omnibus 1000 is a regularly held survey
(following a specific schedule), whose sample comprises of the citizens of the Republic of Estonia with
the age above 15, which totals 1,107,791 people (Statistics Estonia, 01.01.2014).
The usual sample of the Omnibus 1000 is 1,000 respondents. The sample is formed according to the
proportional model of the general sample. This model is based on areas and settlement size
(number of residents), which are used for selecting 100 source addresses (sample points). Within each
area, the source address is selected randomly from the address list of the Population Register.
In addition to the main sample, this survey included an additional sample of 200 respondents to
ensure the better representation of the Russian-speaking population in the sample. Although the
linguistic composition of the population has been weighed according to the actual situation (i.e., by
increasing the effect of Estonian-speaking respondents and decreasing the effect of Russian-speaking
respondents), this additional sample allows to analyse the attitudes and opinions of single Russian-
speaking groups in detail.
The so-called principle of the young man was applied to the selection of respondents at the source
address. This means that at the address of the sample, the interview will be performed with the
household’s youngest male member in the age above 15 who is present at home; if no men are at
home, the interview will be performed with the youngest woman. Such a method grants additional
possibility for participating in the sample to the categories of respondents who are at home less often
(younger people, males) and adjusts the sample to correspond to the population’s actual gender and
age composition.
Public opinion and national defence / October 2015 Estonian Ministry of Defence
Turu-uuringute AS 10
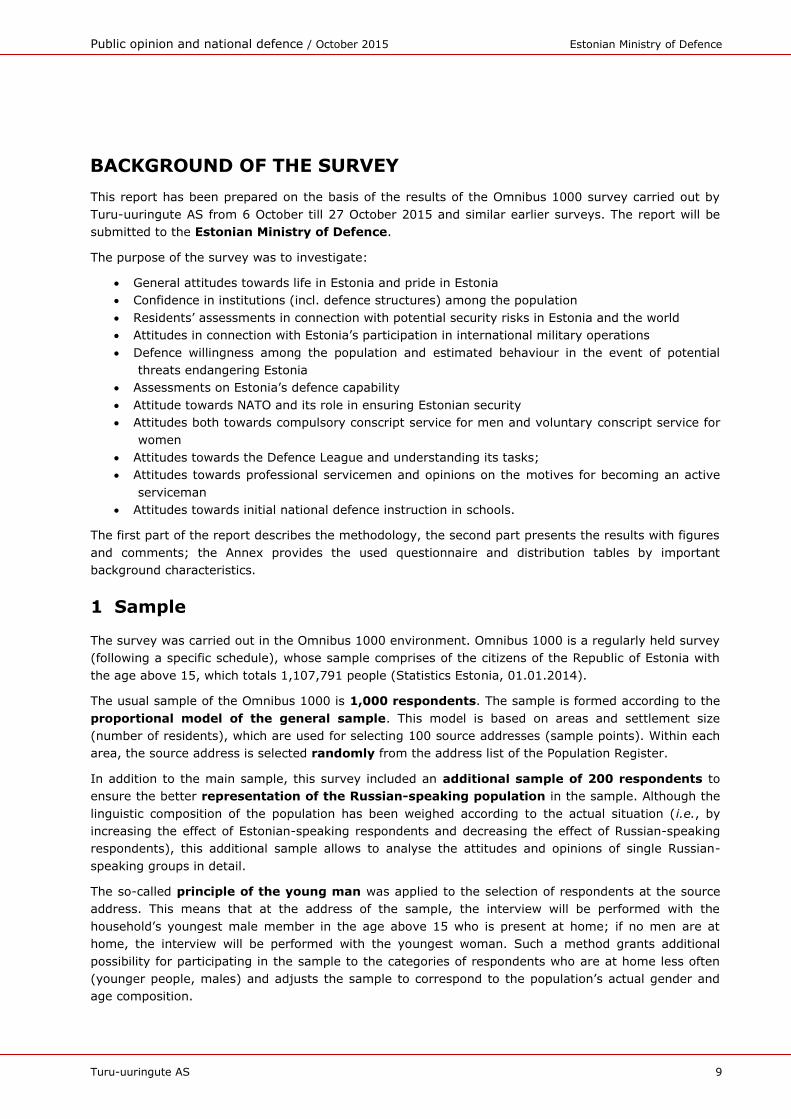
Use of the proportional model of the general sample ensures the representativeness of the
sample, in other words, it allows making generalisations about the whole same-age population of
Estonia. The maximum sampling error does not exceed ±3.10% in polling 1,000 persons, the error may
be bigger for smaller subgroups.
The following Table 1 provides sample error limitations at 95% confidence level in assessing the
proportion.
Table 1 Sampling error limitations
2 Survey
The survey method was personal interview, conducted on tablet computers in either Estonian or
Russian, depending on the respondent’s preference. A total of 58 pollers who had been given special
training by Turu-uuringute AS participated in carrying out the survey. A total of 1,193 interviews were
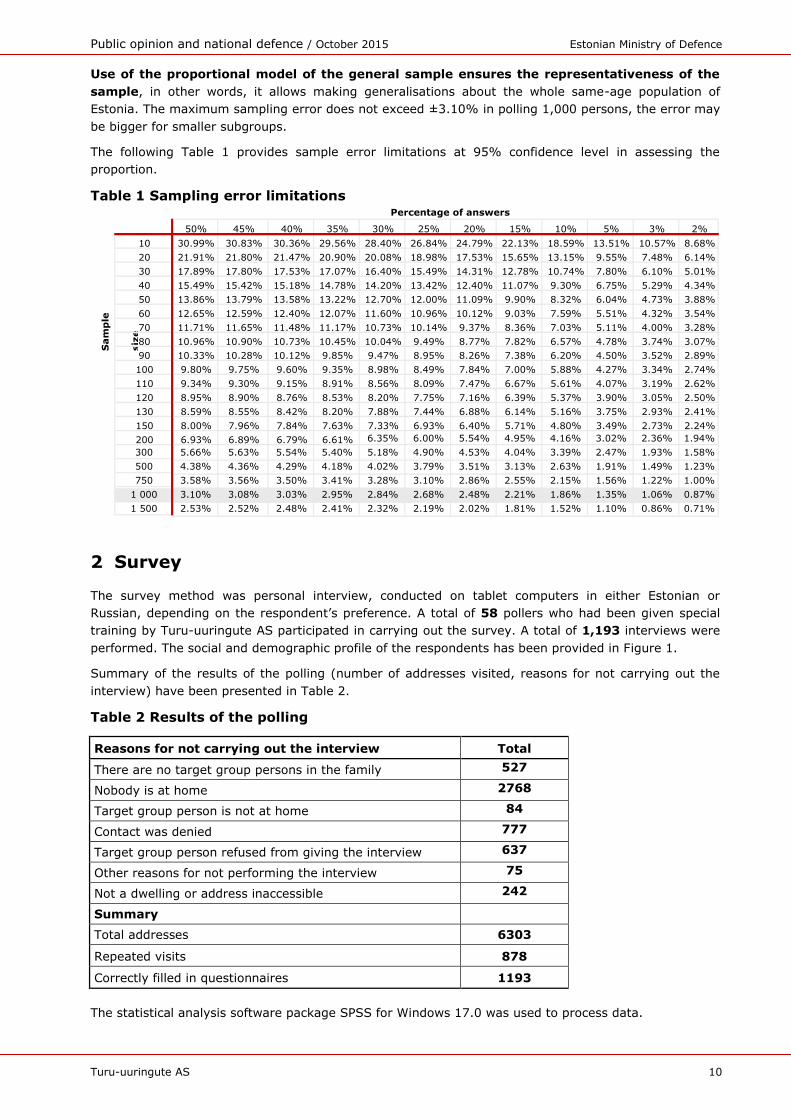
performed. The social and demographic profile of the respondents has been provided in Figure 1.
Summary of the results of the polling (number of addresses visited, reasons for not carrying out the
interview) have been presented in Table 2.
Table 2 Results of the polling
Reasons for not carrying out the interview Total
There are no target group persons in the family 527
Nobody is at home 2768
Target group person is not at home 84
Contact was denied 777
Target group person refused from giving the interview 637
Other reasons for not performing the interview 75
Not a dwelling or address inaccessible 242
Summary
Total addresses 6303
Repeated visits 878
Correctly filled in questionnaires 1193
The statistical analysis software package SPSS for Windows 17.0 was used to process data.
50% 45% 40% 35% 30% 25% 20% 15% 10% 5% 3% 2% 10 30.99% 30.83% 30.36% 29.56% 28.40% 26.84% 24.79% 22.13% 18.59% 13.51% 10.57% 8.68% 20 21.91% 21.80% 21.47% 20.90% 20.08% 18.98% 17.53% 15.65% 13.15% 9.55% 7.48% 6.14% 30 17.89% 17.80% 17.53% 17.07% 16.40% 15.49% 14.31% 12.78% 10.74% 7.80% 6.10% 5.01% 40 15.49% 15.42% 15.18% 14.78% 14.20% 13.42% 12.40% 11.07% 9.30% 6.75% 5.29% 4.34% 50 13.86% 13.79% 13.58% 13.22% 12.70% 12.00% 11.09% 9.90% 8.32% 6.04% 4.73% 3.88% 60 12.65% 12.59% 12.40% 12.07% 11.60% 10.96% 10.12% 9.03% 7.59% 5.51% 4.32% 3.54% 70 11.71% 11.65% 11.48% 11.17% 10.73% 10.14% 9.37% 8.36% 7.03% 5.11% 4.00% 3.28% 80 10.96% 10.90% 10.73% 10.45% 10.04% 9.49% 8.77% 7.82% 6.57% 4.78% 3.74% 3.07% 90 10.33% 10.28% 10.12% 9.85% 9.47% 8.95% 8.26% 7.38% 6.20% 4.50% 3.52% 2.89% 100 9.80% 9.75% 9.60% 9.35% 8.98% 8.49% 7.84% 7.00% 5.88% 4.27% 3.34% 2.74% 110 9.34% 9.30% 9.15% 8.91% 8.56% 8.09% 7.47% 6.67% 5.61% 4.07% 3.19% 2.62% 120 8.95% 8.90% 8.76% 8.53% 8.20% 7.75% 7.16% 6.39% 5.37% 3.90% 3.05% 2.50% 130 8.59% 8.55% 8.42% 8.20% 7.88% 7.44% 6.88% 6.14% 5.16% 3.75% 2.93% 2.41% 150 8.00% 7.96% 7.84% 7.63% 7.33% 6.93% 6.40% 5.71% 4.80% 3.49% 2.73% 2.24% 200 6.93% 6.89% 6.79% 6.61% 6.35% 6.00% 5.54% 4.95% 4.16% 3.02% 2.36% 1.94% 300 5.66% 5.63% 5.54% 5.40% 5.18% 4.90% 4.53% 4.04% 3.39% 2.47% 1.93% 1.58% 500 4.38% 4.36% 4.29% 4.18% 4.02% 3.79% 3.51% 3.13% 2.63% 1.91% 1.49% 1.23% 750 3.58% 3.56% 3.50% 3.41% 3.28% 3.10% 2.86% 2.55% 2.15% 1.56% 1.22% 1.00%
1 000 3.10% 3.08% 3.03% 2.95% 2.84% 2.68% 2.48% 2.21% 1.86% 1.35% 1.06% 0.87% 1 500 2.53% 2.52% 2.48% 2.41% 2.32% 2.19% 2.02% 1.81% 1.52% 1.10% 0.86% 0.71%
Percentage of answers
Sam
ple
siz
e
Public opinion and national defence / October 2015 Estonian Ministry of Defence
Turu-uuringute AS 11
Figure 1. Respondents’ social and demographic profile, %, n=1,193
46
54
69
31
83
8
9
6
16
16
17
18
17
10
15
59
26
69
31
5
10
24
18
17
27
15
20
18
5
7
25
10
32
16
12
11
7
22
0 20 40 60 80 100
GENDER
Male
Female
LANGUAGE OF COMMUNICATION
Estonian
Other
CITIZENSHIP
Estonian
Russian
Unspecified
AGE
15 - 19 a.
20 - 29 a.
30 - 39 a.
40 - 49 a.
50 - 59 a.
60 - 74 a.
75 and above
EDUCATION
Primary or basic
Secondary, vocational or secondary vocational
Higher
RESIDENCE
City
Rural area
NET INCOME PER MEMBER
less than 200 €
201-300 €
301-400 €
401-650 €
More than 650 €
Difiicult to say / Refused
MAIN ACTIVITY
Enterpreneur, manager, top specialist
Middle-level specialist, official, executive
Skilled worker, operator
Other employed persons
Pupil, student
Pensioner
Other unemployed
REGION
Tallinn
Northern Estonia
Ida-Viru County
Western Estonia
Central Estonia
Southern Estonia
Public opinion and national defence / October 2015 Estonian Ministry of Defence
Turu-uuringute AS 12
3 Performers
The persons responsible for various stages of the survey are:
Report, project management: Juhan Kivirähk
Sample/coordination of interviewing work: Kristel Merusk,
Kaja Södor,
Roman Vjazemski.
Data processing and tables: Reijo Pohl
Marina Karpištšenko
Customer’s contact person: Artur Jugaste
Contact information:
General phone: 585 29 700
E-mail: [email protected]
Web-page: www.turu-uuringute.ee
Address: Pärnu mnt. 102, Section A, 11312 Tallinn
Survey leader’s contact information:
Telephone: 5515200
E-mail: [email protected]
Public opinion and national defence / October 2015 Estonian Ministry of Defence
Turu-uuringute AS 13
RESULTS OF THE SURVEY
1 General attitudes towards life in Estonia and pride in Estonia
People’s attitudes towards different social questions, including national defence, are considerably
influenced by the positive or negative assessments given to life in Estonia in general.
In spring, people’s assessments given to life in Estonia showed signs of improvement when compared
to autumn 2014 (this was most likely influenced by the parliamentary elections, which tend to bring
along more hopeful and positive attitudes towards the society), however, the current survey shows a
decline. The number of people who think the situation has remained unchanged has grown and the
proportion of respondents who perceive positive changes has decreased.
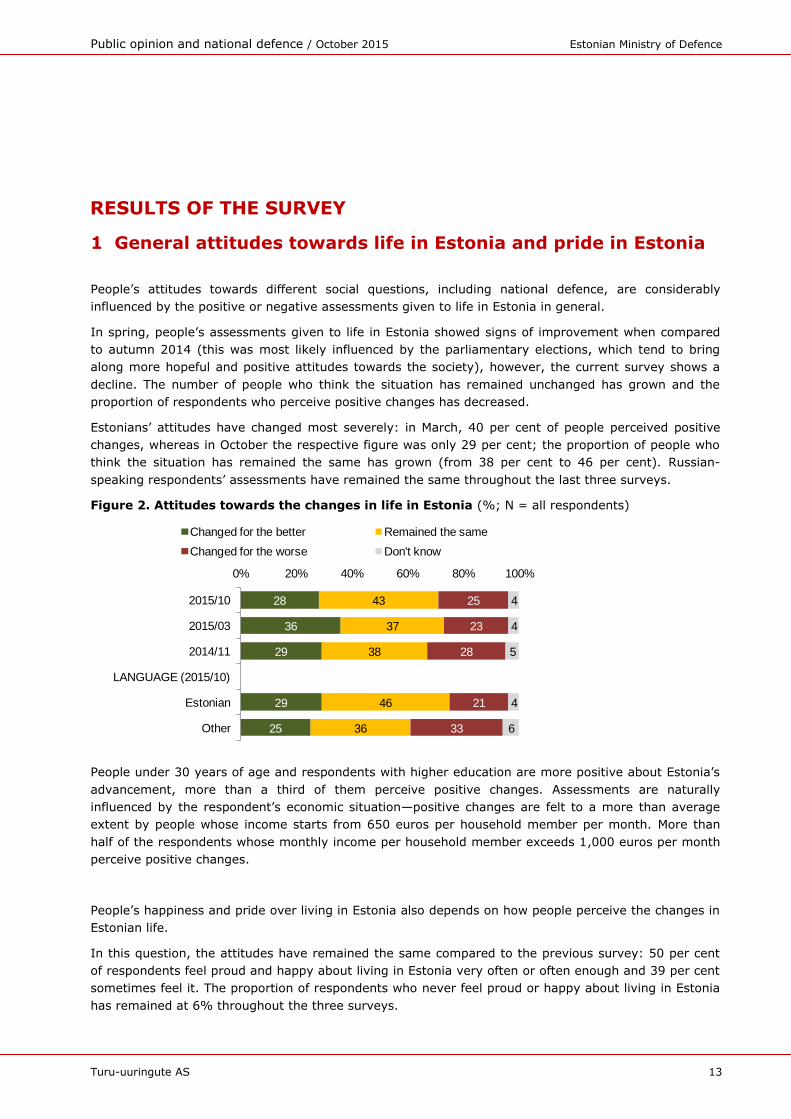
Estonians’ attitudes have changed most severely: in March, 40 per cent of people perceived positive
changes, whereas in October the respective figure was only 29 per cent; the proportion of people who
think the situation has remained the same has grown (from 38 per cent to 46 per cent). Russian-
speaking respondents’ assessments have remained the same throughout the last three surveys.
Figure 2. Attitudes towards the changes in life in Estonia (%; N = all respondents)
People under 30 years of age and respondents with higher education are more positive about Estonia’s
advancement, more than a third of them perceive positive changes. Assessments are naturally
influenced by the respondent’s economic situation—positive changes are felt to a more than average
extent by people whose income starts from 650 euros per household member per month. More than
half of the respondents whose monthly income per household member exceeds 1,000 euros per month
perceive positive changes.
People’s happiness and pride over living in Estonia also depends on how people perceive the changes in
Estonian life.
In this question, the attitudes have remained the same compared to the previous survey: 50 per cent
of respondents feel proud and happy about living in Estonia very often or often enough and 39 per cent
sometimes feel it. The proportion of respondents who never feel proud or happy about living in Estonia
has remained at 6% throughout the three surveys.
25
29
29
36
28
36
46
38
37
43
33
21
28
23
25
6
4
5
4
4
0% 20% 40% 60% 80% 100%
Other
Estonian
LANGUAGE (2015/10)
2014/11
2015/03
2015/10
Changed for the better Remained the same
Changed for the worse Don't know
Public opinion and national defence / October 2015 Estonian Ministry of Defence
Turu-uuringute AS 14
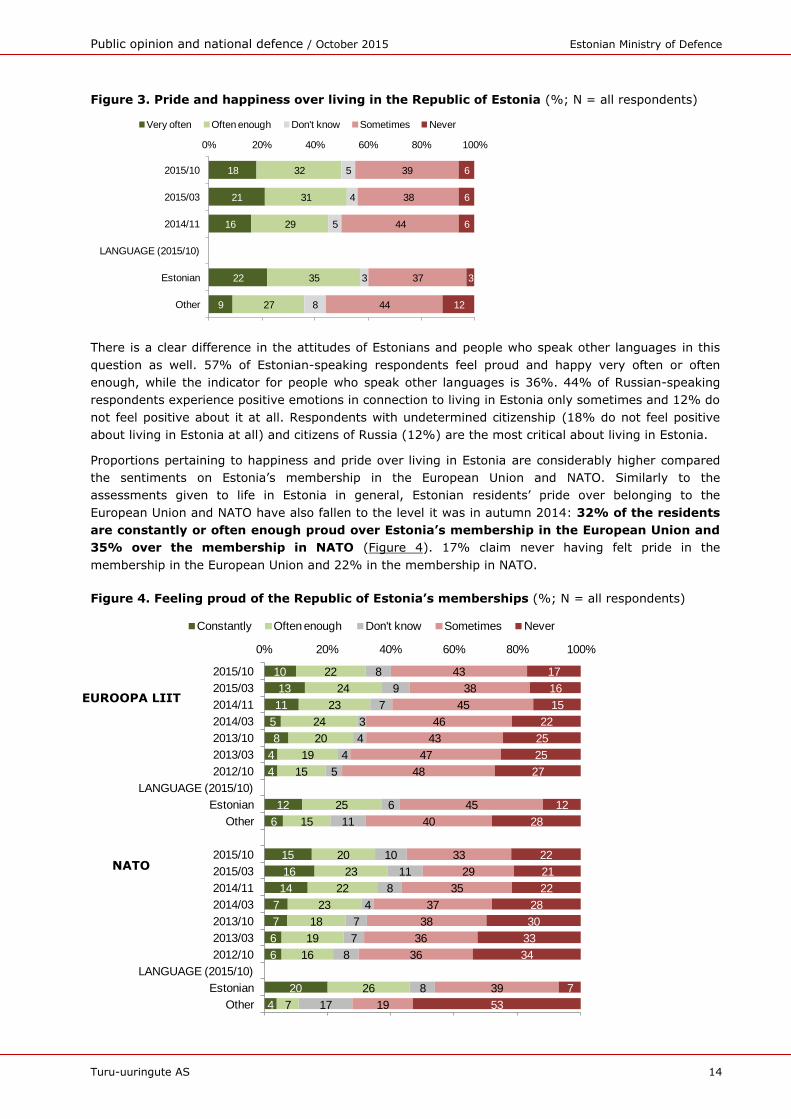
Figure 3. Pride and happiness over living in the Republic of Estonia (%; N = all respondents)
There is a clear difference in the attitudes of Estonians and people who speak other languages in this
question as well. 57% of Estonian-speaking respondents feel proud and happy very often or often
enough, while the indicator for people who speak other languages is 36%. 44% of Russian-speaking
respondents experience positive emotions in connection to living in Estonia only sometimes and 12% do
not feel positive about it at all. Respondents with undetermined citizenship (18% do not feel positive
about living in Estonia at all) and citizens of Russia (12%) are the most critical about living in Estonia.
Proportions pertaining to happiness and pride over living in Estonia are considerably higher compared
the sentiments on Estonia’s membership in the European Union and NATO. Similarly to the
assessments given to life in Estonia in general, Estonian residents’ pride over belonging to the
European Union and NATO have also fallen to the level it was in autumn 2014: 32% of the residents
are constantly or often enough proud over Estonia’s membership in the European Union and
35% over the membership in NATO (Figure 4). 17% claim never having felt pride in the
membership in the European Union and 22% in the membership in NATO.
Figure 4. Feeling proud of the Republic of Estonia’s memberships (%; N = all respondents)
9
22
16
21
18
27
35
29
31
32
8
3
5
4
5
44
37
44
38
39
12
3
6
6
6
0% 20% 40% 60% 80% 100%
Other
Estonian
LANGUAGE (2015/10)
2014/11
2015/03
2015/10
Very often Often enough Don't know Sometimes Never
4
20
6
6
7
7
14
16
15
6
12
4
4
8
5
11
13
10
7
26
16
19
18
23
22
23
20
15
25
15
19
20
24
23
24
22
17
8
8
7
7
4
8
11
10
11
6
5
4
4
3
7
9
8
19
39
36
36
38
37
35
29
33
40
45
48
47
43
46
45
38
43
53
7
34
33
30
28
22
21
22
28
12
27
25
25
22
15
16
17
0% 20% 40% 60% 80% 100%
Other
Estonian
LANGUAGE (2015/10)
2012/10
2013/03
2013/10
2014/03
2014/11
2015/03
2015/10
Other
Estonian
LANGUAGE (2015/10)
2012/10
2013/03
2013/10
2014/03
2014/11
2015/03
2015/10
Constantly Often enough Don't know Sometimes Never
EUROOPA LIIT
NATO
Public opinion and national defence / October 2015 Estonian Ministry of Defence
Turu-uuringute AS 15
Based on the language of communication, there are significant differences regarding the attitudes
towards the membership in the European Union and NATO. The differences are especially great for the
membership in NATO: 46% of Estonians feel proud and happy for it, while only 11% of the
Russian-speaking respondents feel the same. 53% of the speakers of other languages claim that
they have never felt proud over Estonia’s membership in NATO. Only 7% of Estonian-speaking
respondents agree.
37% of Estonian and 21% of Russian-speaking respondents are constantly or often enough
happy to belong to the European Union. The proportions of people who never feel happy about it
are 12% and 28% respectively.
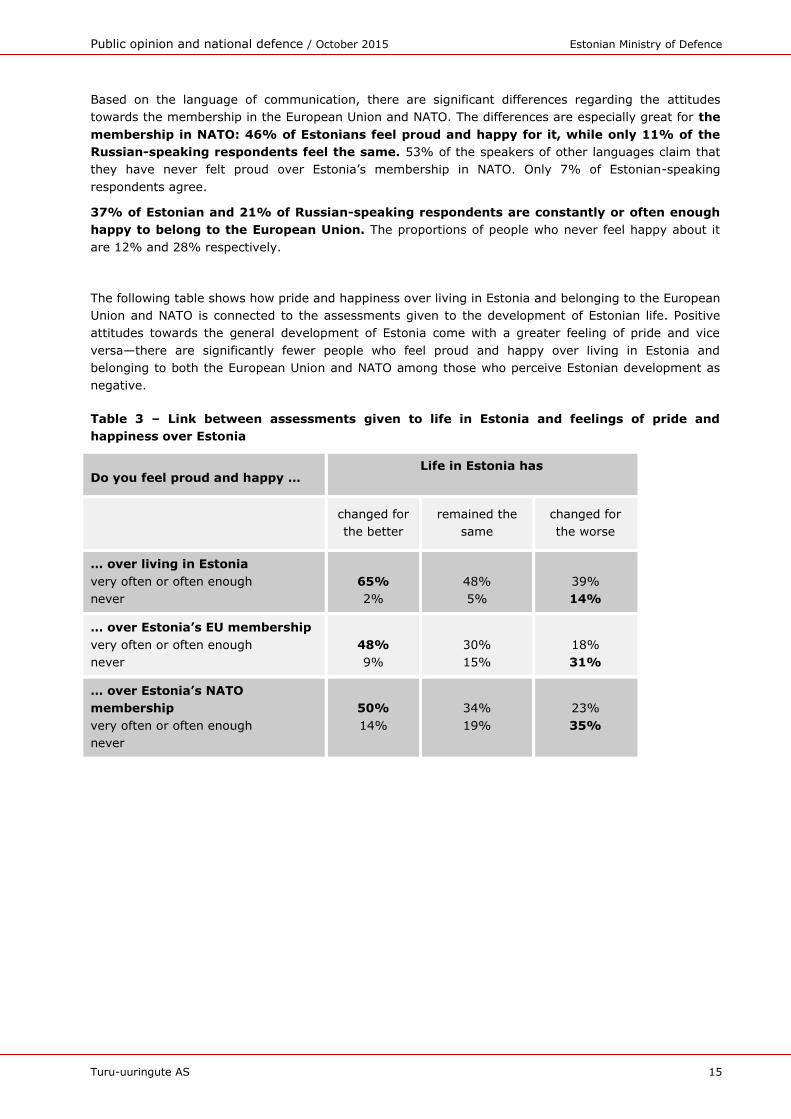
The following table shows how pride and happiness over living in Estonia and belonging to the European
Union and NATO is connected to the assessments given to the development of Estonian life. Positive
attitudes towards the general development of Estonia come with a greater feeling of pride and vice
versa—there are significantly fewer people who feel proud and happy over living in Estonia and
belonging to both the European Union and NATO among those who perceive Estonian development as
negative.
Table 3 – Link between assessments given to life in Estonia and feelings of pride and
happiness over Estonia
Do you feel proud and happy … Life in Estonia has
changed for
the better
remained the
same
changed for
the worse
… over living in Estonia
very often or often enough
never
65%
2%
48%
5%
39%
14%
… over Estonia’s EU membership
very often or often enough
never
48%
9%
30%
15%
18%
31%
… over Estonia’s NATO
membership
very often or often enough
never
50%
14%
34%
19%
23%
35%
Public opinion and national defence / October 2015 Estonian Ministry of Defence
Turu-uuringute AS 16
2 Confidence in institutions
The survey addresses the population’s confidence in several state and international institutions. The
selection of institutions is based on their important role in shaping, implementing or supporting the
Estonian security policy.
2.1 General background
Respondents evaluated the trustworthiness of the institutions using a scale with four categories:
completely trust, rather trust, rather do not trust, and do not trust at all. Of the ten institutions
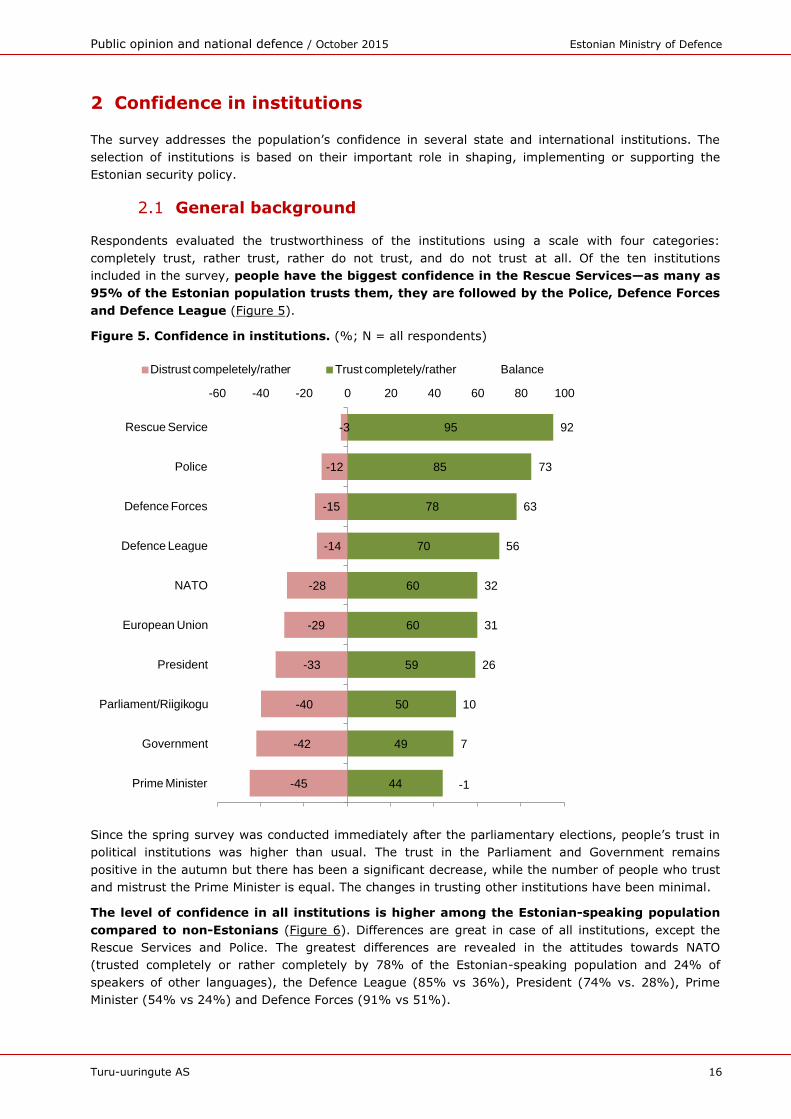
included in the survey, people have the biggest confidence in the Rescue Services—as many as
95% of the Estonian population trusts them, they are followed by the Police, Defence Forces
and Defence League (Figure 5).
Figure 5. Confidence in institutions. (%; N = all respondents)
Since the spring survey was conducted immediately after the parliamentary elections, people’s trust in
political institutions was higher than usual. The trust in the Parliament and Government remains
positive in the autumn but there has been a significant decrease, while the number of people who trust
and mistrust the Prime Minister is equal. The changes in trusting other institutions have been minimal.
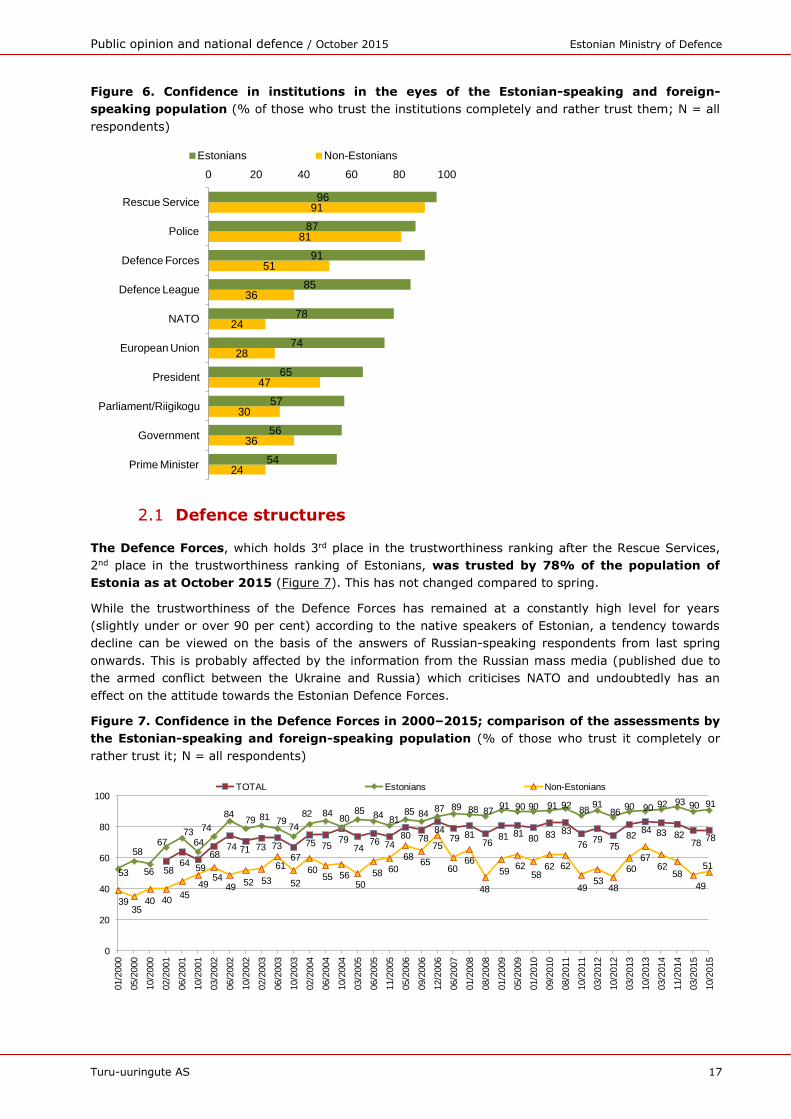
The level of confidence in all institutions is higher among the Estonian-speaking population
compared to non-Estonians (Figure 6). Differences are great in case of all institutions, except the
Rescue Services and Police. The greatest differences are revealed in the attitudes towards NATO
(trusted completely or rather completely by 78% of the Estonian-speaking population and 24% of
speakers of other languages), the Defence League (85% vs 36%), President (74% vs. 28%), Prime
Minister (54% vs 24%) and Defence Forces (91% vs 51%).
-45
-42
-40
-33
-29
-28
-14
-15
-12
-3
44
49
50
59
60
60
70
78
85
95
-1
7
10
26
31
32
56
63
73
92
-60 -40 -20 0 20 40 60 80 100
Prime Minister
Government
Parliament/Riigikogu
President
European Union
NATO
Defence League
Defence Forces
Police
Rescue Service
Distrust compeletely/rather Trust completely/rather Balance
Public opinion and national defence / October 2015 Estonian Ministry of Defence
Turu-uuringute AS 17
Figure 6. Confidence in institutions in the eyes of the Estonian-speaking and foreign-
speaking population (% of those who trust the institutions completely and rather trust them; N = all
respondents)
2.1 Defence structures
The Defence Forces, which holds 3rd place in the trustworthiness ranking after the Rescue Services,
2nd place in the trustworthiness ranking of Estonians, was trusted by 78% of the population of
Estonia as at October 2015 (Figure 7). This has not changed compared to spring.
While the trustworthiness of the Defence Forces has remained at a constantly high level for years
(slightly under or over 90 per cent) according to the native speakers of Estonian, a tendency towards
decline can be viewed on the basis of the answers of Russian-speaking respondents from last spring
onwards. This is probably affected by the information from the Russian mass media (published due to
the armed conflict between the Ukraine and Russia) which criticises NATO and undoubtedly has an
effect on the attitude towards the Estonian Defence Forces.
Figure 7. Confidence in the Defence Forces in 2000–2015; comparison of the assessments by
the Estonian-speaking and foreign-speaking population (% of those who trust it completely or
rather trust it; N = all respondents)
24
36
30
47
28
24
36
51
81
91
54
56
57
65
74
78
85
91
87
96
0 20 40 60 80 100
Prime Minister
Government
Parliament/Riigikogu
President
European Union
NATO
Defence League
Defence Forces
Police
Rescue Service
Estonians Non-Estonians
5864
59
6874 71 73 73
67
75 7579
7476 74
80 7884
79 8176
81 8180 83 83
7679
7582
84 83 8278
78
53
58
56
6773
64
74
8479 81 79
74
82 8480
85 8481
85 8487 89 88 87
91 90 90 91 9288
9186
90 90 92 93 90 91
3935
40 4045
4954
4952 53
61
52
6055 56
50
58 60
6865
75
6066
48
5962
5862 62
4953
48
60
6762
58
49
51
0
20
40
60
80
100
01/2
000
05/2
000
10/2
000
02/2
001
06/2
001
10/2
001
03/2
002
06/2
002
10/2
002
02/2
003
06/2
003
10/2
003
02/2
004
06/2
004
10/2
004
03/2
005
06/2
005
11/2
005
05/2
006
09/2
006
12/2
006
06/2
007
01/2
008
08/2
008
01/2
009
05/2
009
01/2
010
09/2
010
08/2
011
10/2
011
03/2
012
10/2
012
03/2
013
10/2
013
03/2
014
11/2
014
03/2
015
10/2
015
TOTAL Estonians Non-Estonians
Public opinion and national defence / October 2015 Estonian Ministry of Defence
Turu-uuringute AS 18
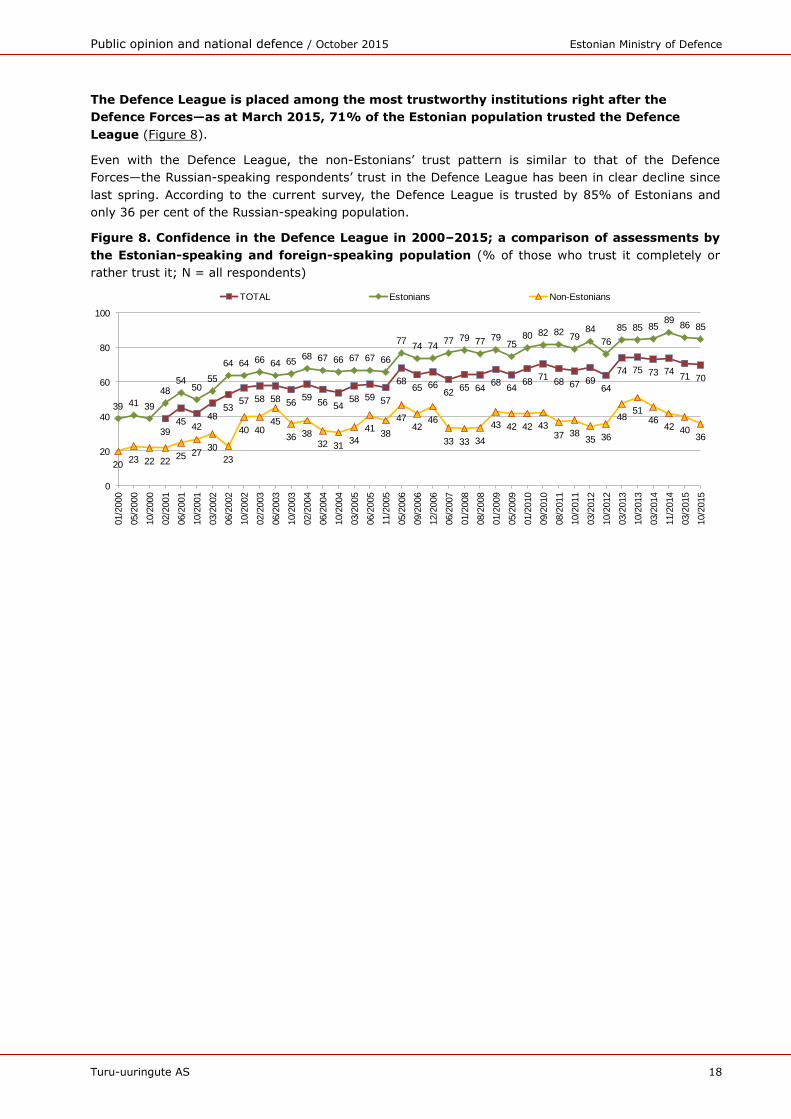
The Defence League is placed among the most trustworthy institutions right after the
Defence Forces—as at March 2015, 71% of the Estonian population trusted the Defence
League (Figure 8).
Even with the Defence League, the non-Estonians’ trust pattern is similar to that of the Defence
Forces—the Russian-speaking respondents’ trust in the Defence League has been in clear decline since
last spring. According to the current survey, the Defence League is trusted by 85% of Estonians and
only 36 per cent of the Russian-speaking population.
Figure 8. Confidence in the Defence League in 2000–2015; a comparison of assessments by
the Estonian-speaking and foreign-speaking population (% of those who trust it completely or
rather trust it; N = all respondents)
3945
4248
5357 58 58 56
5956 54
58 59 57
6865 66
6265 64
6864
6871
68 67 6964
74 75 73 7471 70
39 41 39
4854
5055
64 64 66 64 6568 67 66 67 67 66
7774 74
77 79 77 7975
80 82 8279
84
76
85 85 8589
86 85
2023 22 22
25 2730
23
40 4045
36 3832 31
34
4138
4742
46
33 33 34
43 42 42 4337 38
35 36
4851
4642 40
36
0
20
40
60
80
100
01/2
000
05/2
000
10/2
000
02/2
001
06/2
001
10/2
001
03/2
002
06/2
002
10/2
002
02/2
003
06/2
003
10/2
003
02/2
004
06/2
004
10/2
004
03/2
005
06/2
005
11/2
005
05/2
006
09/2
006
12/2
006
06/2
007
01/2
008
08/2
008
01/2
009
05/2
009
01/2
010
09/2
010
08/2
011
10/2
011
03/2
012
10/2
012
03/2
013
10/2
013
03/2
014
11/2
014
03/2
015
10/2
015
TOTAL Estonians Non-Estonians
Public opinion and national defence / October 2015 Estonian Ministry of Defence
Turu-uuringute AS 19
3 Security and threats
The third chapter provides an overview of security issues: what kind of situation is expected to occur in
the world and Estonia in the coming decade, which threats to Estonia are considered probable by the
population in the coming years, and what would help to ensure the security of Estonia.
3.1 Security in the world
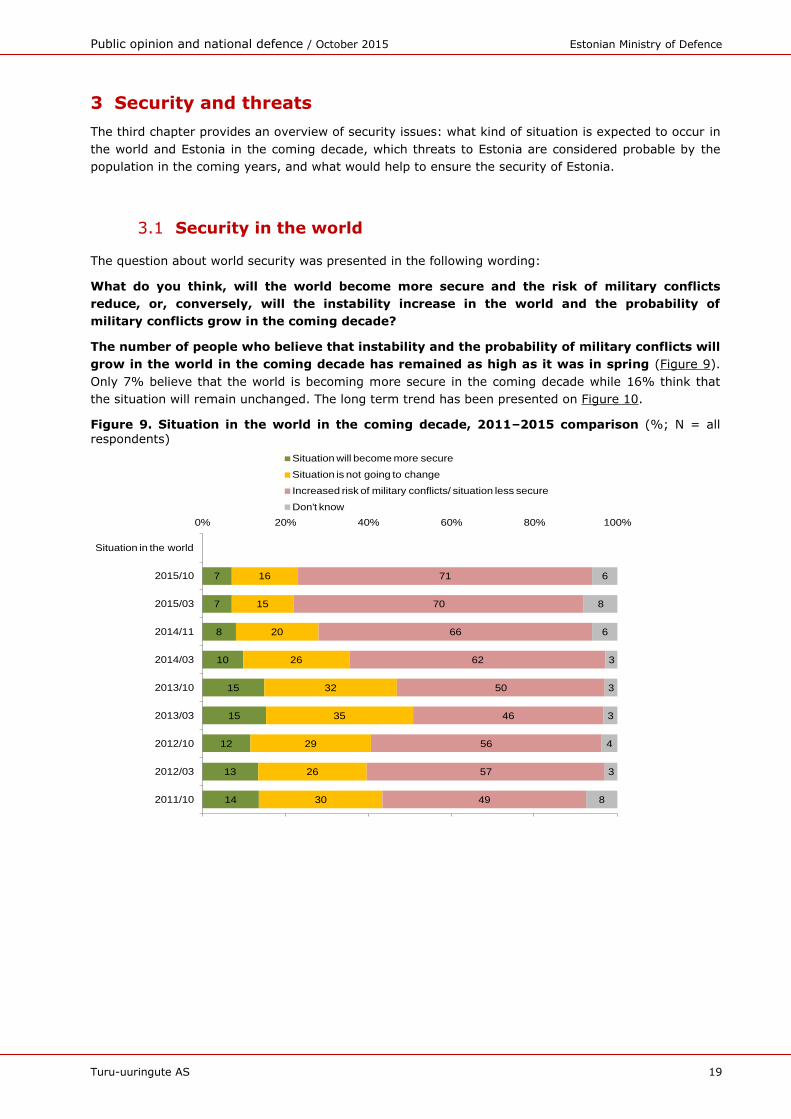
The question about world security was presented in the following wording:
What do you think, will the world become more secure and the risk of military conflicts
reduce, or, conversely, will the instability increase in the world and the probability of
military conflicts grow in the coming decade?
The number of people who believe that instability and the probability of military conflicts will
grow in the world in the coming decade has remained as high as it was in spring (Figure 9).
Only 7% believe that the world is becoming more secure in the coming decade while 16% think that
the situation will remain unchanged. The long term trend has been presented on Figure 10.
Figure 9. Situation in the world in the coming decade, 2011–2015 comparison (%; N = all respondents)
14
13
12
15
15
10
8
7
7
30
26
29
35
32
26
20
15
16
49
57
56
46
50
62
66
70
71
8
3
4
3
3
3
6
8
6
0% 20% 40% 60% 80% 100%
2011/10
2012/03
2012/10
2013/03
2013/10
2014/03
2014/11
2015/03
2015/10
Situation in the world
Situation will become more secure
Situation is not going to change
Increased risk of military conflicts/ situation less secure
Don't know
Public opinion and national defence / October 2015 Estonian Ministry of Defence
Turu-uuringute AS 20
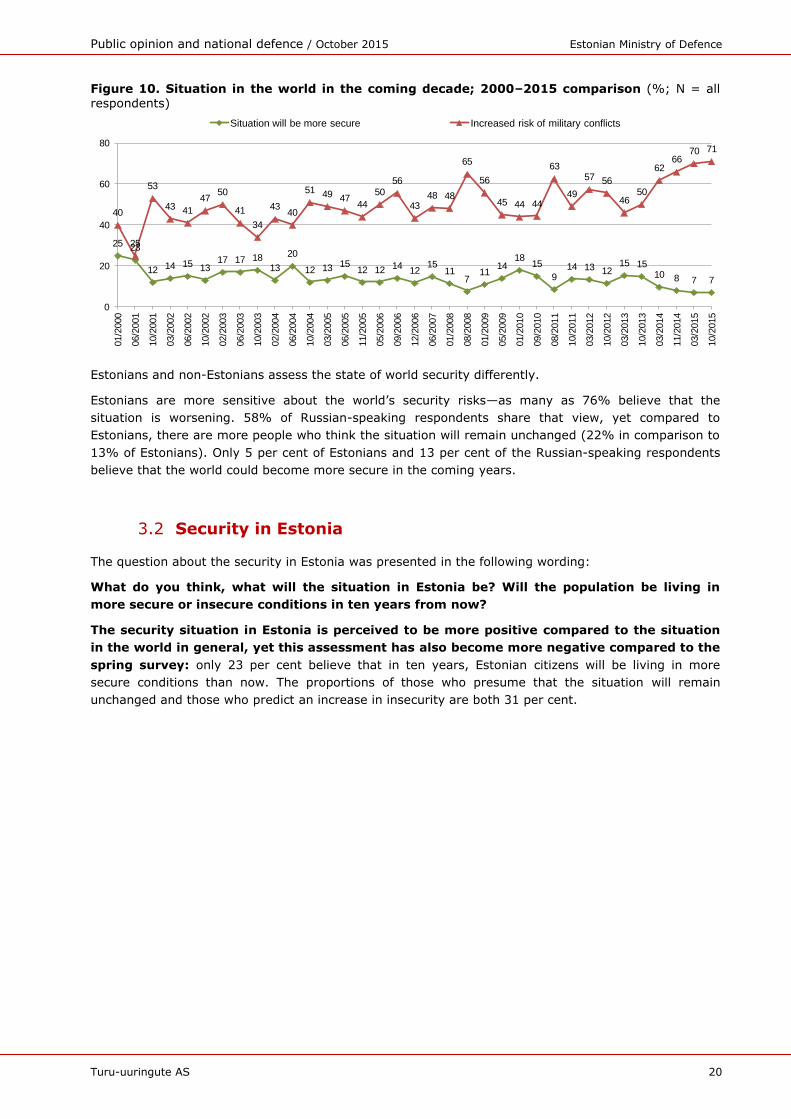
Figure 10. Situation in the world in the coming decade; 2000–2015 comparison (%; N = all respondents)
Estonians and non-Estonians assess the state of world security differently.
Estonians are more sensitive about the world’s security risks—as many as 76% believe that the
situation is worsening. 58% of Russian-speaking respondents share that view, yet compared to
Estonians, there are more people who think the situation will remain unchanged (22% in comparison to
13% of Estonians). Only 5 per cent of Estonians and 13 per cent of the Russian-speaking respondents
believe that the world could become more secure in the coming years.
3.2 Security in Estonia
The question about the security in Estonia was presented in the following wording:
What do you think, what will the situation in Estonia be? Will the population be living in
more secure or insecure conditions in ten years from now?
The security situation in Estonia is perceived to be more positive compared to the situation
in the world in general, yet this assessment has also become more negative compared to the
spring survey: only 23 per cent believe that in ten years, Estonian citizens will be living in more
secure conditions than now. The proportions of those who presume that the situation will remain
unchanged and those who predict an increase in insecurity are both 31 per cent.
25 23
12 14 15 1317 17 18
13
20
12 13 1512 12 14
1215
117
1114
1815
914 13 12
15 1510 8 7 7
40
25
53
43 41
4750
41
34
4340
51 49 4744
50
56
4348 48
65
56
45 44 44
63
49
57 56
4650
6266
70 71
0
20
40
60
80
01/2
000
06/2
001
10/2
001
03/2
002
06/2
002
10/2
002
02/2
003
06/2
003
10/2
003
02/2
004
06/2
004
10/2
004
03/2
005
06/2
005
11/2
005
05/2
006
09/2
006
12/2
006
06/2
007
01/2
008
08/2
008
01/2
009
05/2
009
01/2
010
09/2
010
08/2
011
10/2
011
03/2
012
10/2
012
03/2
013
10/2
013
03/2
014
11/2
014
03/2
015
10/2
015
Situation will be more secure Increased risk of military conflicts
Public opinion and national defence / October 2015 Estonian Ministry of Defence
Turu-uuringute AS 21
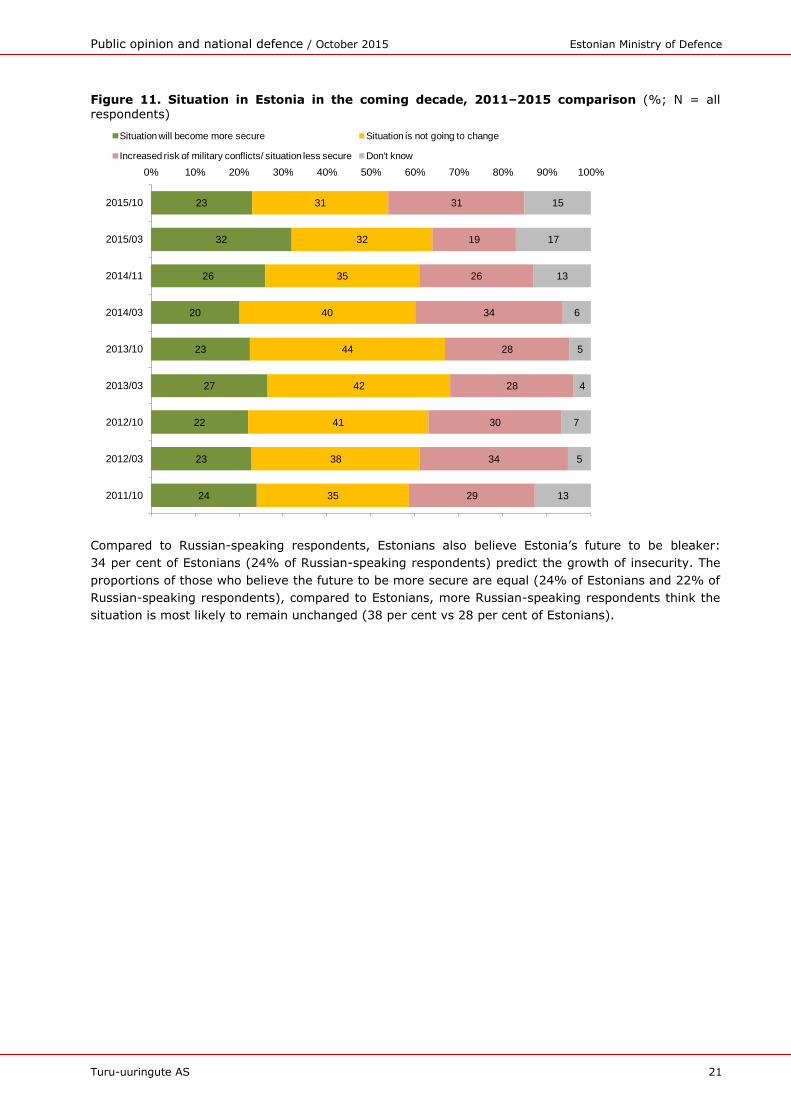
Figure 11. Situation in Estonia in the coming decade, 2011–2015 comparison (%; N = all respondents)
Compared to Russian-speaking respondents, Estonians also believe Estonia’s future to be bleaker:
34 per cent of Estonians (24% of Russian-speaking respondents) predict the growth of insecurity. The
proportions of those who believe the future to be more secure are equal (24% of Estonians and 22% of
Russian-speaking respondents), compared to Estonians, more Russian-speaking respondents think the
situation is most likely to remain unchanged (38 per cent vs 28 per cent of Estonians).
24
23
22
27
23
20
26
32
23
35
38
41
42
44
40
35
32
31
29
34
30
28
28
34
26
19
31
13
5
7
4
5
6
13
17
15
0% 10% 20% 30% 40% 50% 60% 70% 80% 90% 100%
2011/10
2012/03
2012/10
2013/03
2013/10
2014/03
2014/11
2015/03
2015/10
Situation will become more secure Situation is not going to change
Increased risk of military conflicts/ situation less secure Don't know
Public opinion and national defence / October 2015 Estonian Ministry of Defence
Turu-uuringute AS 22
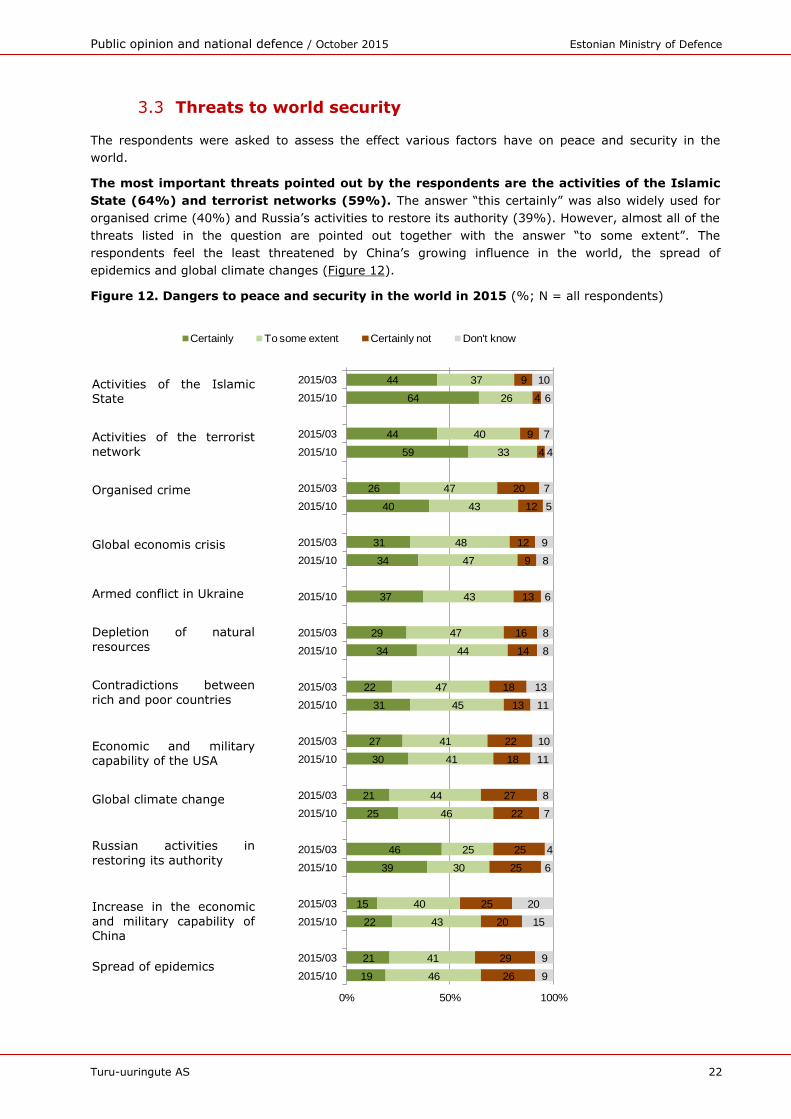
3.3 Threats to world security
The respondents were asked to assess the effect various factors have on peace and security in the
world.
The most important threats pointed out by the respondents are the activities of the Islamic
State (64%) and terrorist networks (59%). The answer “this certainly” was also widely used for
organised crime (40%) and Russia’s activities to restore its authority (39%). However, almost all of the
threats listed in the question are pointed out together with the answer “to some extent”. The
respondents feel the least threatened by China’s growing influence in the world, the spread of
epidemics and global climate changes (Figure 12).
Figure 12. Dangers to peace and security in the world in 2015 (%; N = all respondents)
44
64
44
59
26
40
31
34
37
29
34
22
31
27
30
21
25
46
39
15
22
21
19
37
26
40
33
47
43
48
47
43
47
44
47
45
41
41
44
46
25
30
40
43
41
46
9
4
9
4
20
12
12
9
13
16
14
18
13
22
18
27
22
25
25
25
20
29
26
10
6
7
4
7
5
9
8
6
8
8
13
11
10
11
8
7
4
6
20
15
9
9
0% 50% 100%
2015/03
2015/10
2015/03
2015/10
2015/03
2015/10
2015/03
2015/10
2015/10
2015/03
2015/10
2015/03
2015/10
2015/03
2015/10
2015/03
2015/10
2015/03
2015/10
2015/03
2015/10
2015/03
2015/10
Certainly To some extent Certainly not Don't know
Activities of the Islamic State
Activities of the terrorist
network
Organised crime
Global economis crisis
Armed conflict in Ukraine
Depletion of natural
resources
Contradictions between
rich and poor countries
Economic and military capability of the USA
Global climate change
Russian activities in
restoring its authority
Increase in the economic
and military capability of China
Spread of epidemics
Public opinion and national defence / October 2015 Estonian Ministry of Defence
Turu-uuringute AS 23
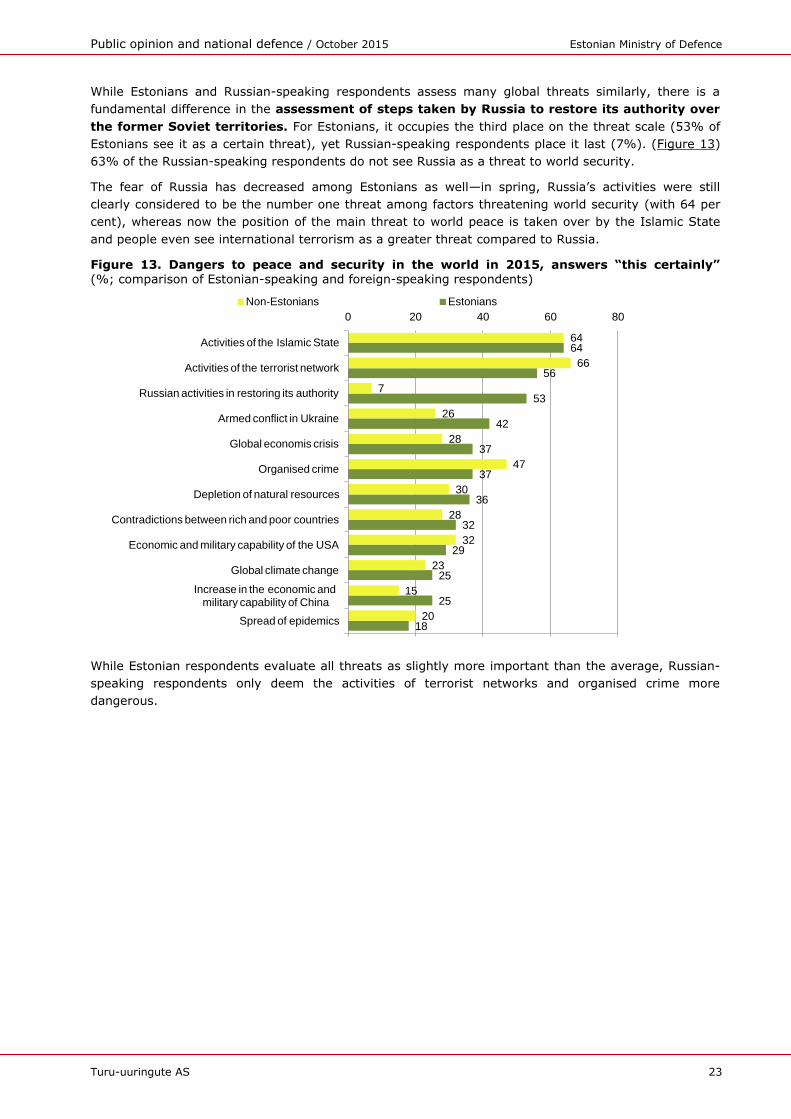
While Estonians and Russian-speaking respondents assess many global threats similarly, there is a
fundamental difference in the assessment of steps taken by Russia to restore its authority over
the former Soviet territories. For Estonians, it occupies the third place on the threat scale (53% of
Estonians see it as a certain threat), yet Russian-speaking respondents place it last (7%). (Figure 13)
63% of the Russian-speaking respondents do not see Russia as a threat to world security.
The fear of Russia has decreased among Estonians as well—in spring, Russia’s activities were still
clearly considered to be the number one threat among factors threatening world security (with 64 per
cent), whereas now the position of the main threat to world peace is taken over by the Islamic State
and people even see international terrorism as a greater threat compared to Russia.
Figure 13. Dangers to peace and security in the world in 2015, answers “this certainly” (%; comparison of Estonian-speaking and foreign-speaking respondents)
While Estonian respondents evaluate all threats as slightly more important than the average, Russian-
speaking respondents only deem the activities of terrorist networks and organised crime more
dangerous.
18
25
25
29
32
36
37
37
42
53
56
64
20
15
23
32
28
30
47
28
26
7
66
64
0 20 40 60 80
Spread of epidemics
Increase in the economic andmilitary capability of China
Global climate change
Economic and military capability of the USA
Contradictions between rich and poor countries
Depletion of natural resources
Organised crime
Global economis crisis
Armed conflict in Ukraine
Russian activities in restoring its authority
Activities of the terrorist network
Activities of the Islamic State
Non-Estonians Estonians
Public opinion and national defence / October 2015 Estonian Ministry of Defence
Turu-uuringute AS 24
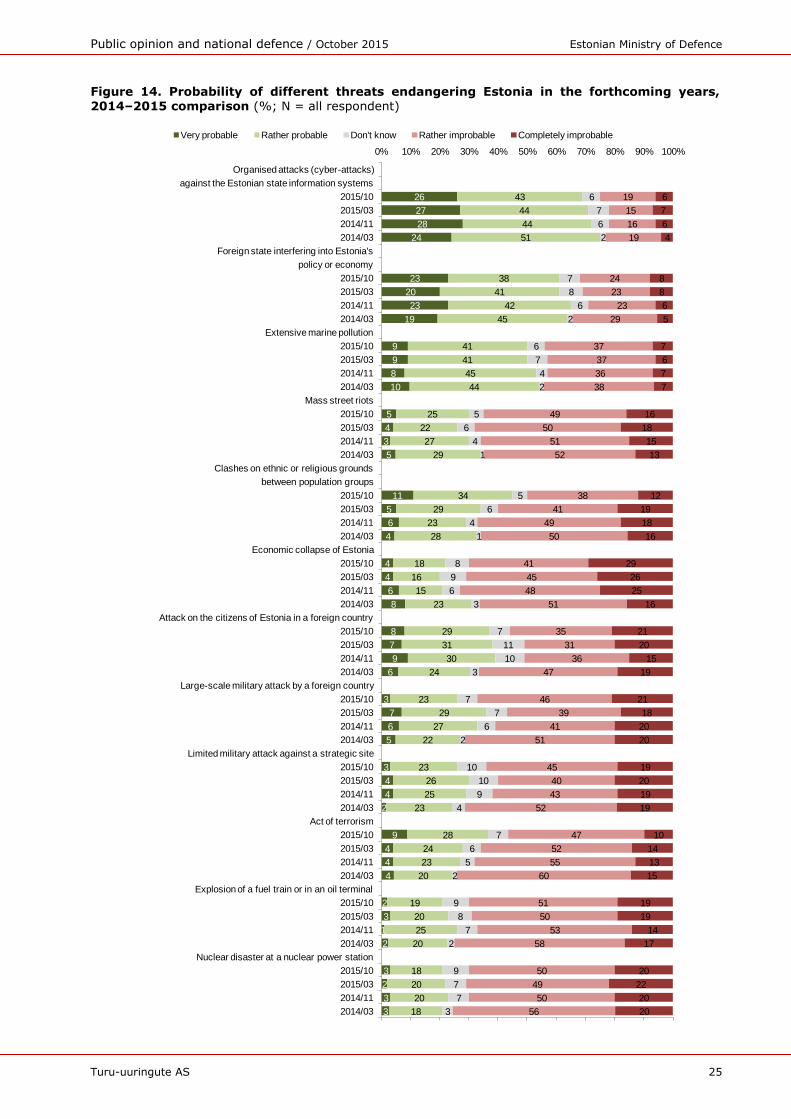
3.4 Threats to Estonia
The respondents were presented with 12 different potential threats and asked to assess the probability
of their occurrence in the forthcoming years (Figure 14).
There are three main threats, the occurrence of which more than a half of the respondents considered
very or rather probable in Estonia in the forthcoming years: 69% of people think there might be an
organised attack (a so-called cyber-attack) against the Estonian state information systems, 61%
believe that a foreign state may interfere in Estonia’s policy or economy in their own
interests, and 50% are of the opinion that the country may face an extensive marine pollution.
The public has highlighted these three security threats for several years.
Compared to the previous surveys, the number of people who think clashes on ethnic or religious
grounds and a large-scale military attack are probable has grown significantly. In March, 34% of
respondents shared that view, whereas the respective indicator was 45 per cent in the current survey.
Such a rise might be influenced by the expected arrival of refugees—many protests organised by
national-conservative forces give reason to fear possible clashes. 50% of the respondents believe such
conflicts to be improbable.
The proportion of respondents who consider an act of terror probable has also grown—from 28 per cent
in March to 57 per cent in October. However, the number of respondents who think an act of terror is
improbable is still greater—57 per cent of the respondents.
While in autumn 2013, 13 per cent of Estonians and 10 per cent of Russian-speaking respondents
considered a limited or large-scale military attack against Estonia probable, then by spring 2015, the
respective proportions had risen to 30 and 36 per cent respectively. Now, in October, the proportion of
people who consider a military attack probable has fallen to 26 per cent, which is approximately at the
same level as in spring 2014.
An attack on Estonian citizens in a foreign country is considered very or rather probable by 37%, large-
scale street riots by 30%, economic collapse of the Republic of Estonia by 22% and an explosion of an
oil train passing through Estonia or an explosion of an oil terminal and a nuclear disaster in a nuclear
power plant close to Estonia by 21%.
Public opinion and national defence / October 2015 Estonian Ministry of Defence
Turu-uuringute AS 25
Figure 14. Probability of different threats endangering Estonia in the forthcoming years, 2014–2015 comparison (%; N = all respondent)
3
3
2
3
2
1
3
2
4
4
4
9
2
4
4
3
5
6
7
3
6
9
7
8
8
6
4
4
4
6
5
11
5
3
4
5
10
8
9
9
19
23
20
23
24
28
27
26
18
20
20
18
20
25
20
19
20
23
24
28
23
25
26
23
22
27
29
23
24
30
31
29
23
15
16
18
28
23
29
34
29
27
22
25
44
45
41
41
45
42
41
38
51
44
44
43
3
7
7
9
2
7
8
9
2
5
6
7
4
9
10
10
2
6
7
7
3
10
11
7
3
6
9
8
1
4
6
5
1
4
6
5
2
4
7
6
2
6
8
7
2
6
7
6
56
50
49
50
58
53
50
51
60
55
52
47
52
43
40
45
51
41
39
46
47
36
31
35
51
48
45
41
50
49
41
38
52
51
50
49
38
36
37
37
29
23
23
24
19
16
15
19
20
20
22
20
17
14
19
19
15
13
14
10
19
19
20
19
20
20
18
21
19
15
20
21
16
25
26
29
16
18
19
12
13
15
18
16
7
7
6
7
5
6
8
8
4
6
7
6
0% 10% 20% 30% 40% 50% 60% 70% 80% 90% 100%
2014/03
2014/11
2015/03
2015/10
Nuclear disaster at a nuclear power station
2014/03
2014/11
2015/03
2015/10
Explosion of a fuel train or in an oil terminal
2014/03
2014/11
2015/03
2015/10
Act of terrorism
2014/03
2014/11
2015/03
2015/10
Limited military attack against a strategic site
2014/03
2014/11
2015/03
2015/10
Large-scale military attack by a foreign country
2014/03
2014/11
2015/03
2015/10
Attack on the citizens of Estonia in a foreign country
2014/03
2014/11
2015/03
2015/10
Economic collapse of Estonia
2014/03
2014/11
2015/03
2015/10
between population groups
Clashes on ethnic or religious grounds
2014/03
2014/11
2015/03
2015/10
Mass street riots
2014/03
2014/11
2015/03
2015/10
Extensive marine pollution
2014/03
2014/11
2015/03
2015/10
policy or economy
Foreign state interfering into Estonia's
2014/03
2014/11
2015/03
2015/10
against the Estonian state information systems
Organised attacks (cyber-attacks)
Very probable Rather probable Don't know Rather improbable Completely improbable
Public opinion and national defence / October 2015 Estonian Ministry of Defence
Turu-uuringute AS 26
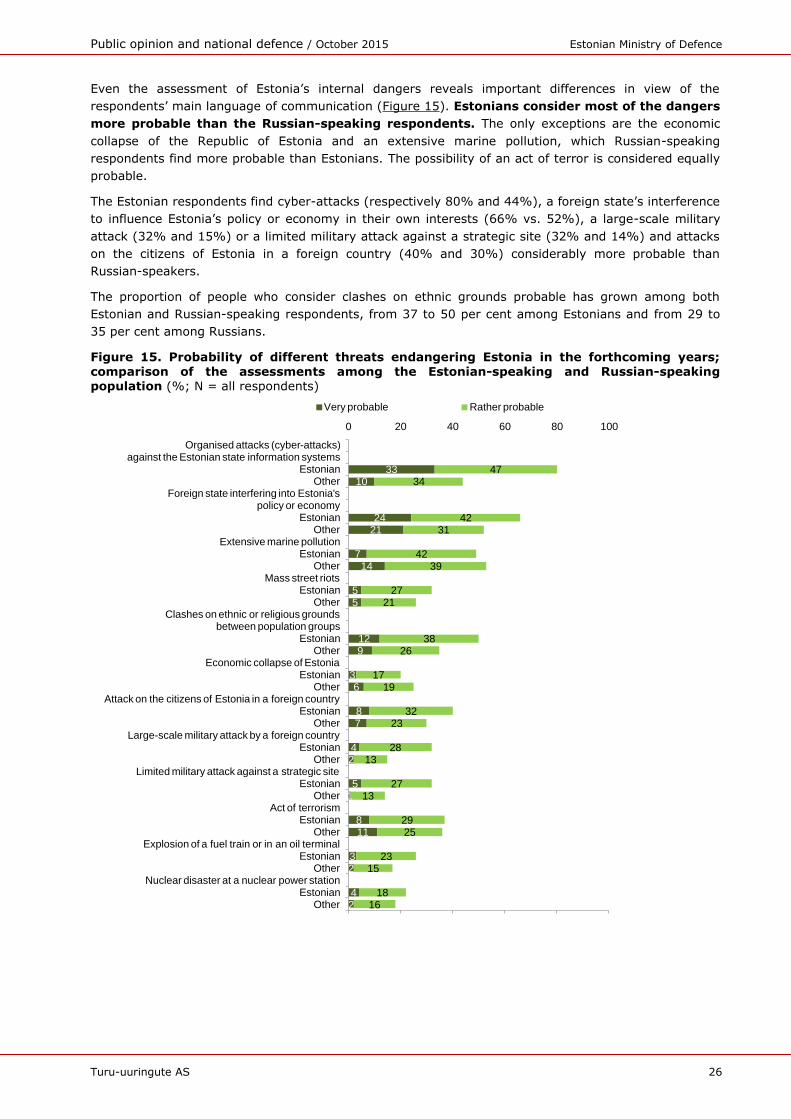
Even the assessment of Estonia’s internal dangers reveals important differences in view of the
respondents’ main language of communication (Figure 15). Estonians consider most of the dangers
more probable than the Russian-speaking respondents. The only exceptions are the economic
collapse of the Republic of Estonia and an extensive marine pollution, which Russian-speaking
respondents find more probable than Estonians. The possibility of an act of terror is considered equally
probable.
The Estonian respondents find cyber-attacks (respectively 80% and 44%), a foreign state’s interference
to influence Estonia’s policy or economy in their own interests (66% vs. 52%), a large-scale military
attack (32% and 15%) or a limited military attack against a strategic site (32% and 14%) and attacks
on the citizens of Estonia in a foreign country (40% and 30%) considerably more probable than
Russian-speakers.
The proportion of people who consider clashes on ethnic grounds probable has grown among both
Estonian and Russian-speaking respondents, from 37 to 50 per cent among Estonians and from 29 to
35 per cent among Russians.
Figure 15. Probability of different threats endangering Estonia in the forthcoming years;
comparison of the assessments among the Estonian-speaking and Russian-speaking population (%; N = all respondents)
24
23
118
15
24
78
63
912
55
147
2124
1033
1618
1523
2529
1327
1328
2332
1917
2638
2127
3942
3142
3447
0 20 40 60 80 100
OtherEstonian
Nuclear disaster at a nuclear power stationOther
EstonianExplosion of a fuel train or in an oil terminal
OtherEstonian
Act of terrorismOther
EstonianLimited military attack against a strategic site
OtherEstonian
Large-scale military attack by a foreign countryOther
EstonianAttack on the citizens of Estonia in a foreign country
OtherEstonian
Economic collapse of EstoniaOther
Estonianbetween population groups
Clashes on ethnic or religious groundsOther
EstonianMass street riots
OtherEstonian
Extensive marine pollutionOther
Estonianpolicy or economy
Foreign state interfering into Estonia'sOther
Estonianagainst the Estonian state information systems
Organised attacks (cyber-attacks)
Very probable Rather probable
Public opinion and national defence / October 2015 Estonian Ministry of Defence
Turu-uuringute AS 27
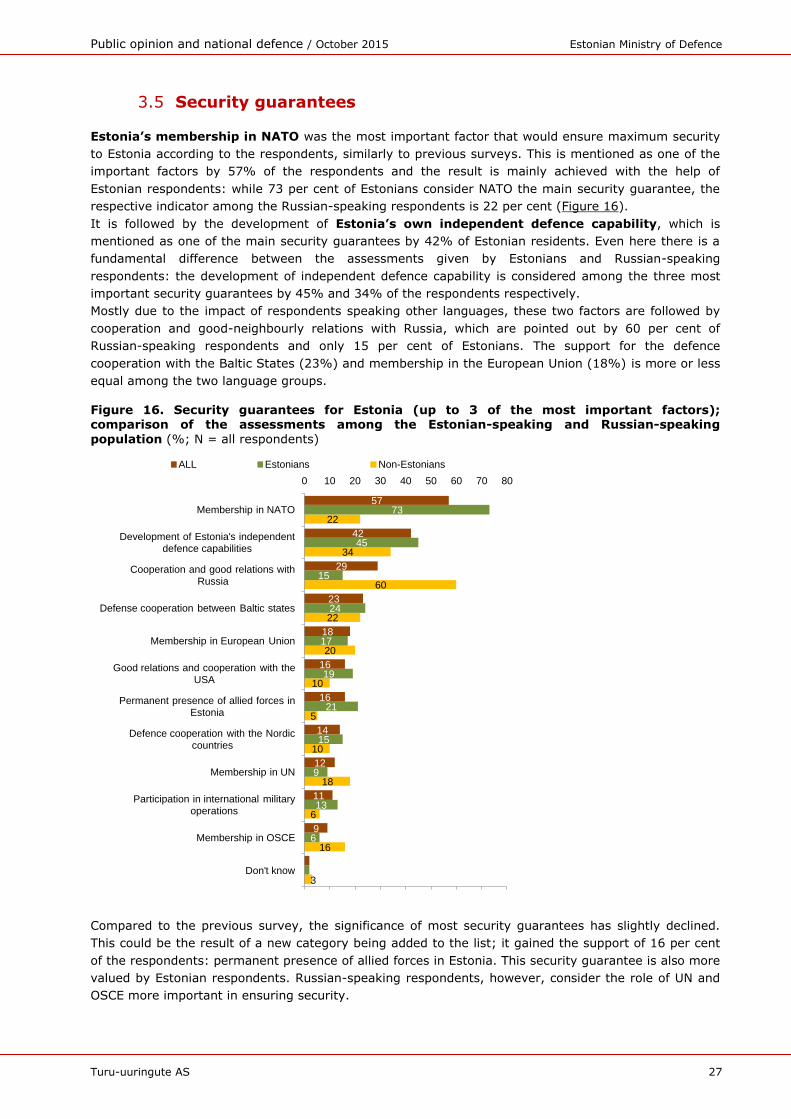
3.5 Security guarantees
Estonia’s membership in NATO was the most important factor that would ensure maximum security
to Estonia according to the respondents, similarly to previous surveys. This is mentioned as one of the
important factors by 57% of the respondents and the result is mainly achieved with the help of
Estonian respondents: while 73 per cent of Estonians consider NATO the main security guarantee, the
respective indicator among the Russian-speaking respondents is 22 per cent (Figure 16).
It is followed by the development of Estonia’s own independent defence capability, which is
mentioned as one of the main security guarantees by 42% of Estonian residents. Even here there is a
fundamental difference between the assessments given by Estonians and Russian-speaking
respondents: the development of independent defence capability is considered among the three most
important security guarantees by 45% and 34% of the respondents respectively.
Mostly due to the impact of respondents speaking other languages, these two factors are followed by
cooperation and good-neighbourly relations with Russia, which are pointed out by 60 per cent of
Russian-speaking respondents and only 15 per cent of Estonians. The support for the defence
cooperation with the Baltic States (23%) and membership in the European Union (18%) is more or less
equal among the two language groups.
Figure 16. Security guarantees for Estonia (up to 3 of the most important factors); comparison of the assessments among the Estonian-speaking and Russian-speaking
population (%; N = all respondents)
Compared to the previous survey, the significance of most security guarantees has slightly declined.
This could be the result of a new category being added to the list; it gained the support of 16 per cent
of the respondents: permanent presence of allied forces in Estonia. This security guarantee is also more
valued by Estonian respondents. Russian-speaking respondents, however, consider the role of UN and
OSCE more important in ensuring security.
3
16
6
18
10
5
10
20
22
60
34
22
2
6
13
9
15
21
19
17
24
15
45
73
2
9
11
12
14
16
16
18
23
29
42
57
0 10 20 30 40 50 60 70 80
Don't know
Membership in OSCE
Participation in international military operations
Membership in UN
Defence cooperation with the Nordic countries
Permanent presence of allied forces in Estonia
Good relations and cooperation with the USA
Membership in European Union
Defense cooperation between Baltic states
Cooperation and good relations with Russia
Development of Estonia's independent defence capabilities
Membership in NATO
ALL Estonians Non-Estonians
Public opinion and national defence / October 2015 Estonian Ministry of Defence
Turu-uuringute AS 28
4 Defence willingness among the population of Estonia
Defence willingness among the population of Estonia is measured with three questions. The so-called
passive defence willingness is expressed through the opinion on whether Estonia should be defended in
case a foreign enemy attacks (“If Estonia is attacked by any country, should we, in any case, provide
armed resistance, regardless of the attacker?”), active defence willingness is expressed through the
person’s willingness to participate in national defence with his/her own skills and competence (“If
Estonia is attacked, are you ready to participate in defence activities using your own competence and
skills?”). The proportion of those expressing the will to leave Estonia in case of an attack is also
mapped.
Defence willingness is also related to the topics of how much the people are informed about the ways in
which one can protect Estonia in the event of a possible attack.
4.1 Attitude towards the necessity of resistance
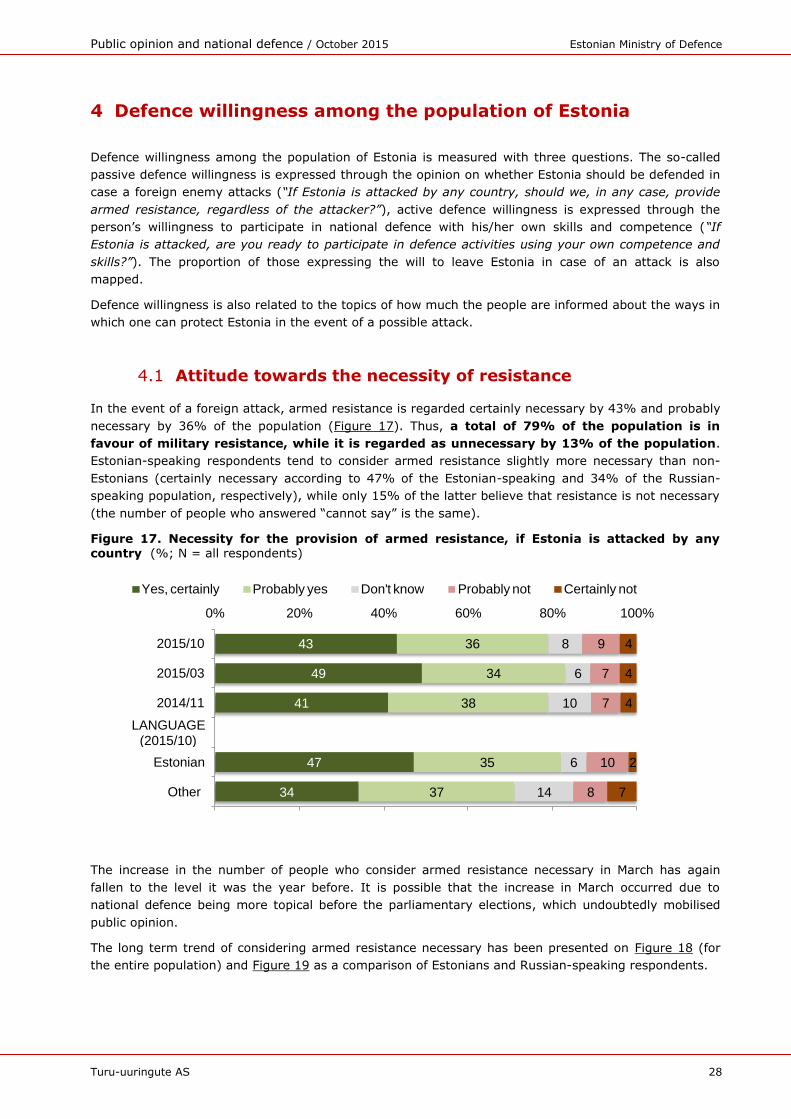
In the event of a foreign attack, armed resistance is regarded certainly necessary by 43% and probably
necessary by 36% of the population (Figure 17). Thus, a total of 79% of the population is in
favour of military resistance, while it is regarded as unnecessary by 13% of the population.
Estonian-speaking respondents tend to consider armed resistance slightly more necessary than non-
Estonians (certainly necessary according to 47% of the Estonian-speaking and 34% of the Russian-
speaking population, respectively), while only 15% of the latter believe that resistance is not necessary
(the number of people who answered “cannot say” is the same).
Figure 17. Necessity for the provision of armed resistance, if Estonia is attacked by any country (%; N = all respondents)
The increase in the number of people who consider armed resistance necessary in March has again
fallen to the level it was the year before. It is possible that the increase in March occurred due to
national defence being more topical before the parliamentary elections, which undoubtedly mobilised
public opinion.
The long term trend of considering armed resistance necessary has been presented on Figure 18 (for
the entire population) and Figure 19 as a comparison of Estonians and Russian-speaking respondents.
34
47
41
49
43
37
35
38
34
36
14
6
10
6
8
8
10
7
7
9
7
2
4
4
4
0% 20% 40% 60% 80% 100%
Other
Estonian
LANGUAGE (2015/10)
2014/11
2015/03
2015/10
Yes, certainly Probably yes Don't know Probably not Certainly not
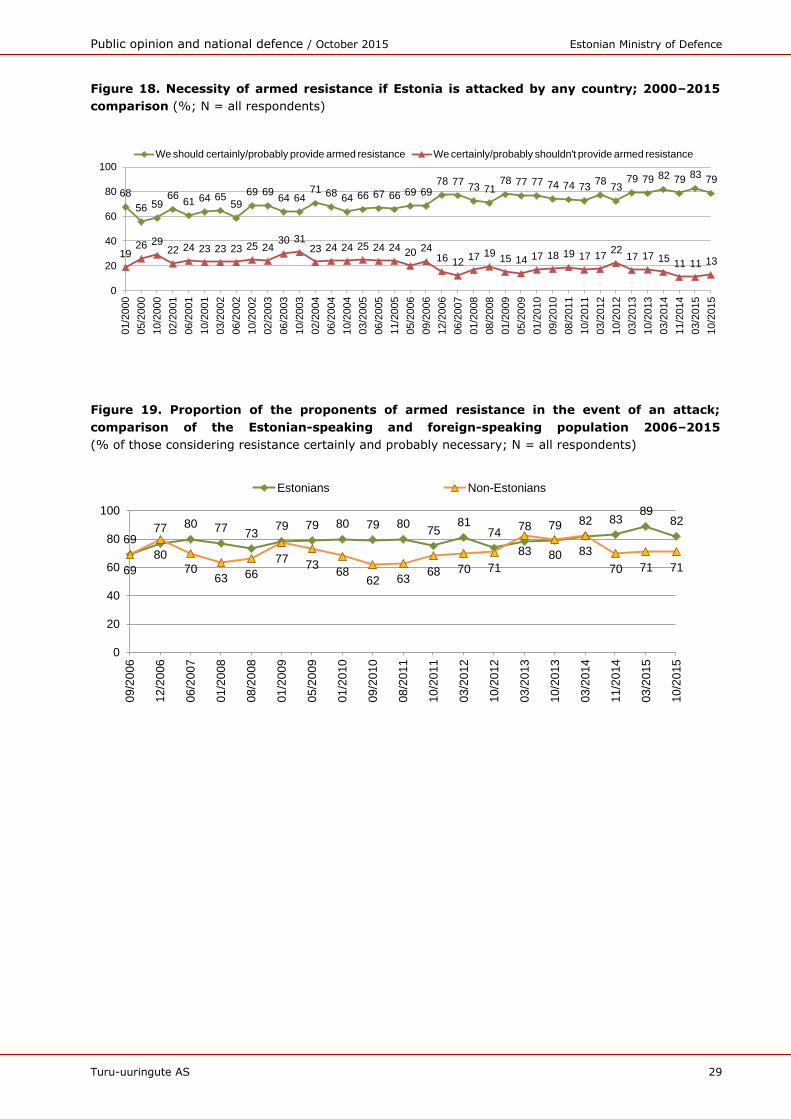
Public opinion and national defence / October 2015 Estonian Ministry of Defence
Turu-uuringute AS 29
Figure 18. Necessity of armed resistance if Estonia is attacked by any country; 2000–2015
comparison (%; N = all respondents)
Figure 19. Proportion of the proponents of armed resistance in the event of an attack;
comparison of the Estonian-speaking and foreign-speaking population 2006–2015
(% of those considering resistance certainly and probably necessary; N = all respondents)
68
56 5966
61 64 6559
69 6964 64
71 6864 66 67 66 69 69
78 7773 71
78 77 77 74 74 7378
7379 79 82 79
8379
1926 29
22 24 23 23 23 25 2430 31
23 24 24 25 24 24 20 2416 12
17 1915 14 17 18 19 17 17
2217 17 15
11 11 13
0
20
40
60
80
100
01/2
000
05/2
000
10/2
000
02/2
001
06/2
001
10/2
001
03/2
002
06/2
002
10/2
002
02/2
003
06/2
003
10/2
003
02/2
004
06/2
004
10/2
004
03/2
005
06/2
005
11/2
005
05/2
006
09/2
006
12/2
006
06/2
007
01/2
008
08/2
008
01/2
009
05/2
009
01/2
010
09/2
010
08/2
011
10/2
011
03/2
012
10/2
012
03/2
013
10/2
013
03/2
014
11/2
014
03/2
015
10/2
015
We should certainly/probably provide armed resistance We certainly/probably shouldn't provide armed resistance
6977 80 77 73
79 79 80 79 8075
8174
78 79 82 8389
82
69
80
7063 66
7773
6862 63
68 70 71
83 80 83
70 71 71
0
20
40
60
80
100
09
/20
06
12
/20
06
06
/20
07
01
/20
08
08
/20
08
01
/20
09
05
/20
09
01
/20
10
09
/20
10
08
/20
11
10
/20
11
03
/20
12
10
/20
12
03
/20
13
10
/20
13
03
/20
14
11
/20
14
03
/20
15
10
/20
15
Estonians Non-Estonians
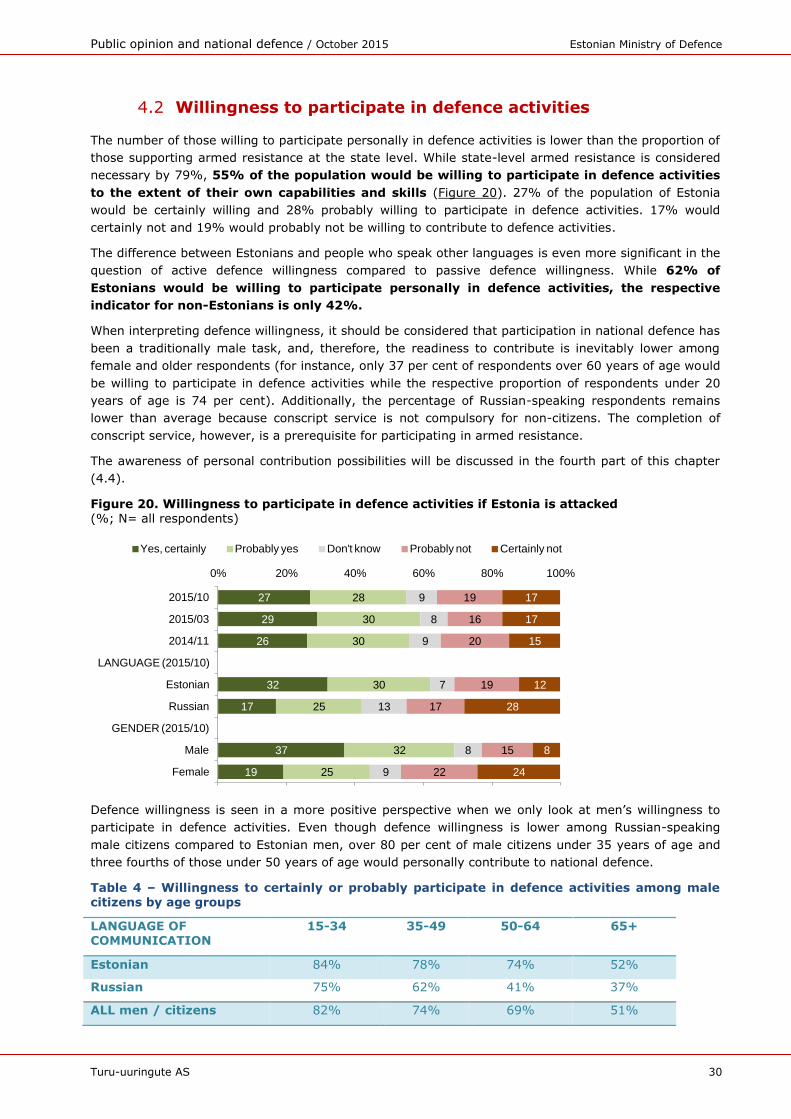
Public opinion and national defence / October 2015 Estonian Ministry of Defence
Turu-uuringute AS 30
4.2 Willingness to participate in defence activities
The number of those willing to participate personally in defence activities is lower than the proportion of
those supporting armed resistance at the state level. While state-level armed resistance is considered
necessary by 79%, 55% of the population would be willing to participate in defence activities
to the extent of their own capabilities and skills (Figure 20). 27% of the population of Estonia
would be certainly willing and 28% probably willing to participate in defence activities. 17% would
certainly not and 19% would probably not be willing to contribute to defence activities.
The difference between Estonians and people who speak other languages is even more significant in the
question of active defence willingness compared to passive defence willingness. While 62% of
Estonians would be willing to participate personally in defence activities, the respective
indicator for non-Estonians is only 42%.
When interpreting defence willingness, it should be considered that participation in national defence has
been a traditionally male task, and, therefore, the readiness to contribute is inevitably lower among
female and older respondents (for instance, only 37 per cent of respondents over 60 years of age would
be willing to participate in defence activities while the respective proportion of respondents under 20
years of age is 74 per cent). Additionally, the percentage of Russian-speaking respondents remains
lower than average because conscript service is not compulsory for non-citizens. The completion of
conscript service, however, is a prerequisite for participating in armed resistance.
The awareness of personal contribution possibilities will be discussed in the fourth part of this chapter
(4.4).
Figure 20. Willingness to participate in defence activities if Estonia is attacked (%; N= all respondents)
Defence willingness is seen in a more positive perspective when we only look at men’s willingness to
participate in defence activities. Even though defence willingness is lower among Russian-speaking
male citizens compared to Estonian men, over 80 per cent of male citizens under 35 years of age and
three fourths of those under 50 years of age would personally contribute to national defence.
Table 4 – Willingness to certainly or probably participate in defence activities among male citizens by age groups
LANGUAGE OF COMMUNICATION
15-34 35-49 50-64 65+
Estonian 84% 78% 74% 52%
Russian 75% 62% 41% 37%
ALL men / citizens 82% 74% 69% 51%
19
37
17
32
26
29
27
25
32
25
30
30
30
28
9
8
13
7
9
8
9
22
15
17
19
20
16
19
24
8
28
12
15
17
17
0% 20% 40% 60% 80% 100%
Female
Male
GENDER (2015/10)
Russian
Estonian
LANGUAGE (2015/10)
2014/11
2015/03
2015/10
Yes, certainly Probably yes Don't know Probably not Certainly not
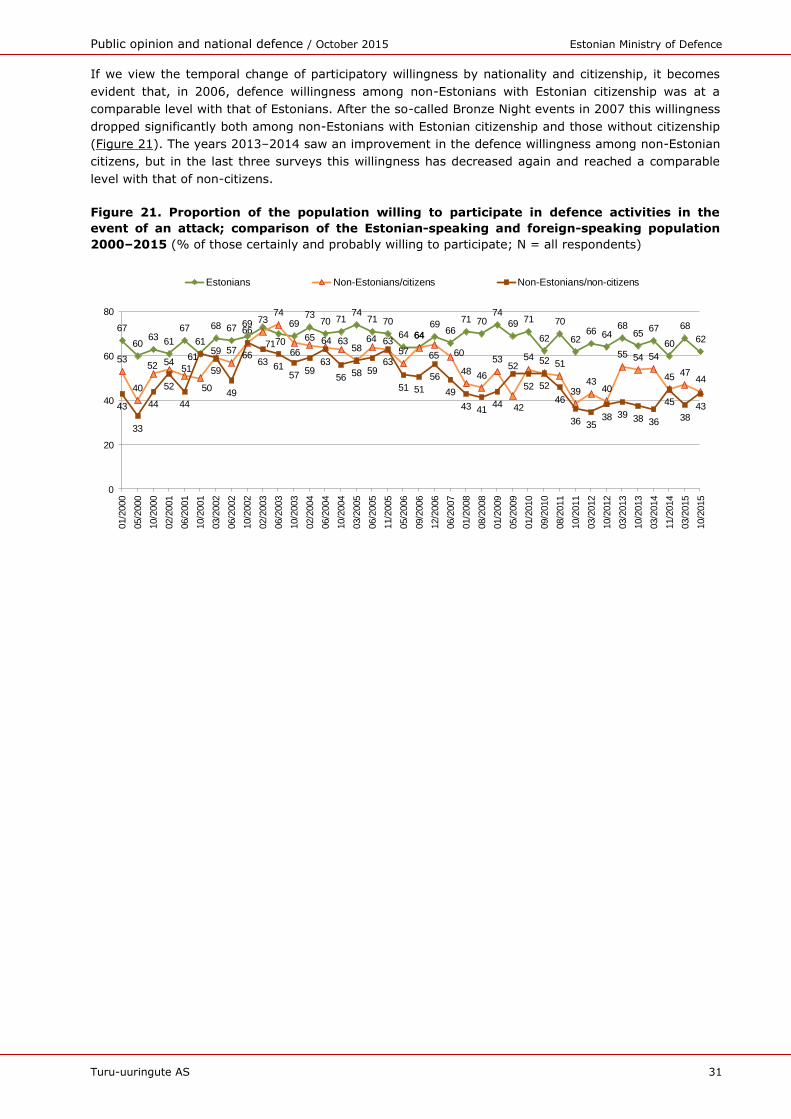
Public opinion and national defence / October 2015 Estonian Ministry of Defence
Turu-uuringute AS 31
If we view the temporal change of participatory willingness by nationality and citizenship, it becomes
evident that, in 2006, defence willingness among non-Estonians with Estonian citizenship was at a
comparable level with that of Estonians. After the so-called Bronze Night events in 2007 this willingness
dropped significantly both among non-Estonians with Estonian citizenship and those without citizenship
(Figure 21). The years 2013–2014 saw an improvement in the defence willingness among non-Estonian
citizens, but in the last three surveys this willingness has decreased again and reached a comparable
level with that of non-citizens.
Figure 21. Proportion of the population willing to participate in defence activities in the
event of an attack; comparison of the Estonian-speaking and foreign-speaking population
2000–2015 (% of those certainly and probably willing to participate; N = all respondents)
67
6063 61
67
61
68 67 69 73
70
6973
70 7174
71 70
64 6469
66
71 7074
69 71
62
70
6266 64
6865
67
60
68
62
53
40
52 5451
50
59 57
66
71
74
66
65 64 6358
64 6357
64
65 60
48 46
53
42
54 52 51
3943
40
55 54 54
45 4744
43
33
44
52
44
61
59
49
6663 61
57 5963
56 58 5963
51 51
56
49
43 4144
52
52 52
46
36 3538 39 38 36
45
3843
0
20
40
60
80
01/2
000
05/2
000
10/2
000
02/2
001
06/2
001
10/2
001
03/2
002
06/2
002
10/2
002
02/2
003
06/2
003
10/2
003
02/2
004
06/2
004
10/2
004
03/2
005
06/2
005
11/2
005
05/2
006
09/2
006
12/2
006
06/2
007
01/2
008
08/2
008
01/2
009
05/2
009
01/2
010
09/2
010
08/2
011
10/2
011
03/2
012
10/2
012
03/2
013
10/2
013
03/2
014
11/2
014
03/2
015
10/2
015
Estonians Non-Estonians/citizens Non-Estonians/non-citizens
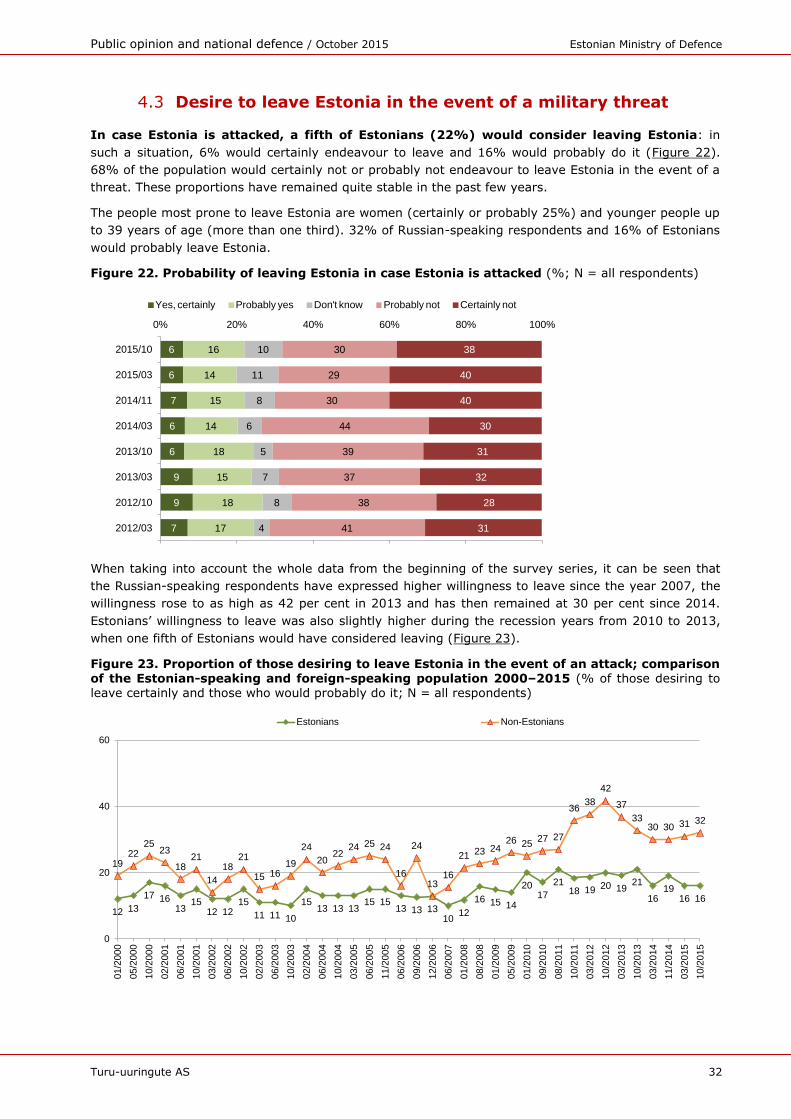
Public opinion and national defence / October 2015 Estonian Ministry of Defence
Turu-uuringute AS 32
4.3 Desire to leave Estonia in the event of a military threat
In case Estonia is attacked, a fifth of Estonians (22%) would consider leaving Estonia: in
such a situation, 6% would certainly endeavour to leave and 16% would probably do it (Figure 22).
68% of the population would certainly not or probably not endeavour to leave Estonia in the event of a
threat. These proportions have remained quite stable in the past few years.
The people most prone to leave Estonia are women (certainly or probably 25%) and younger people up
to 39 years of age (more than one third). 32% of Russian-speaking respondents and 16% of Estonians
would probably leave Estonia.
Figure 22. Probability of leaving Estonia in case Estonia is attacked (%; N = all respondents)
When taking into account the whole data from the beginning of the survey series, it can be seen that
the Russian-speaking respondents have expressed higher willingness to leave since the year 2007, the
willingness rose to as high as 42 per cent in 2013 and has then remained at 30 per cent since 2014.
Estonians’ willingness to leave was also slightly higher during the recession years from 2010 to 2013,
when one fifth of Estonians would have considered leaving (Figure 23).
Figure 23. Proportion of those desiring to leave Estonia in the event of an attack; comparison of the Estonian-speaking and foreign-speaking population 2000–2015 (% of those desiring to leave certainly and those who would probably do it; N = all respondents)
7
9
9
6
6
7
6
6
17
18
15
18
14
15
14
16
4
8
7
5
6
8
11
10
41
38
37
39
44
30
29
30
31
28
32
31
30
40
40
38
0% 20% 40% 60% 80% 100%
2012/03
2012/10
2013/03
2013/10
2014/03
2014/11
2015/03
2015/10
Yes, certainly Probably yes Don't know Probably not Certainly not
12 13
17 1613
1512 12
15
11 11 10
1513 13 13
15 1513 13 13
1012
16 15 14
2017
2118 19 20 19
21
1619
16 16
1922
2523
1821
14
1821
15 1619
24
2022
24 25 24
16
24
1316
21 23 2426 25
27 27
3638
42
37
3330 30 31 32
0
20
40
60
01/2
000
05/2
000
10/2
000
02/2
001
06/2
001
10/2
001
03/2
002
06/2
002
10/2
002
02/2
003
06/2
003
10/2
003
02/2
004
06/2
004
10/2
004
03/2
005
06/2
005
11/2
005
06/2
006
09/2
006
12/2
006
06/2
007
01/2
008
08/2
008
01/2
009
05/2
009
01/2
010
09/2
010
08/2
011
10/2
011
03/2
012
10/2
012
03/2
013
10/2
013
03/2
014
11/2
014
03/2
015
10/2
015
Estonians Non-Estonians
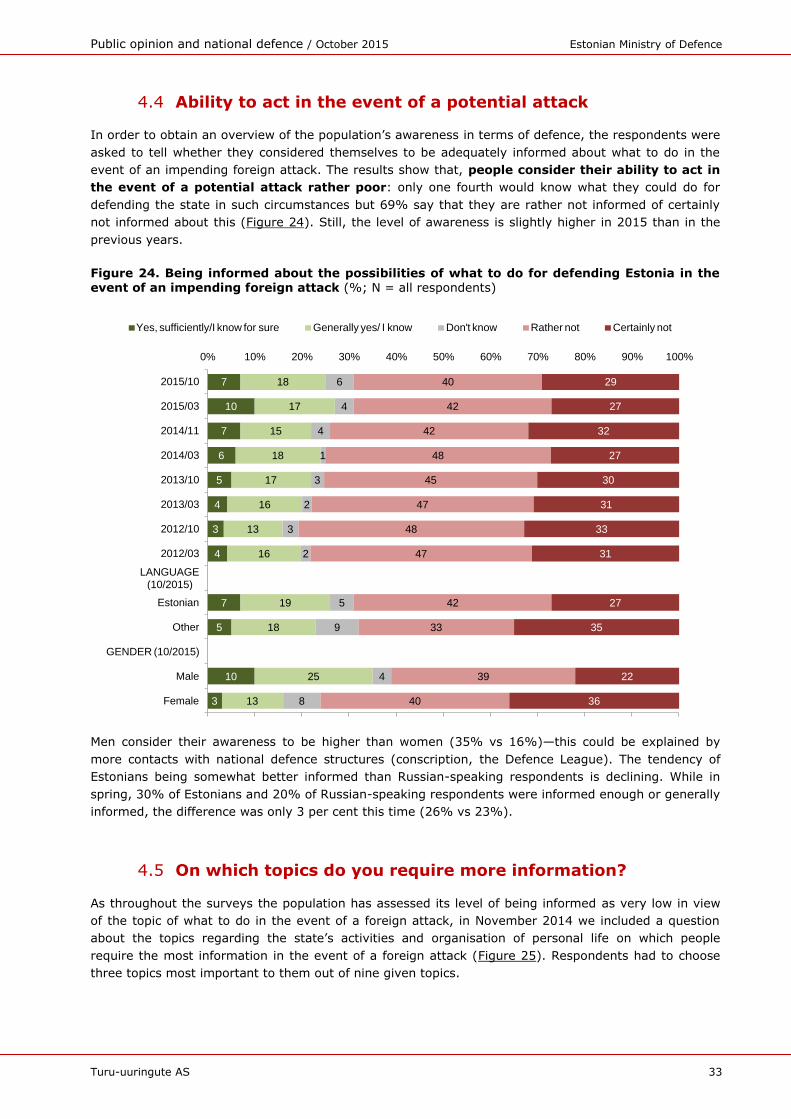
Public opinion and national defence / October 2015 Estonian Ministry of Defence
Turu-uuringute AS 33
4.4 Ability to act in the event of a potential attack
In order to obtain an overview of the population’s awareness in terms of defence, the respondents were
asked to tell whether they considered themselves to be adequately informed about what to do in the
event of an impending foreign attack. The results show that, people consider their ability to act in
the event of a potential attack rather poor: only one fourth would know what they could do for
defending the state in such circumstances but 69% say that they are rather not informed of certainly
not informed about this (Figure 24). Still, the level of awareness is slightly higher in 2015 than in the
previous years.
Figure 24. Being informed about the possibilities of what to do for defending Estonia in the event of an impending foreign attack (%; N = all respondents)
Men consider their awareness to be higher than women (35% vs 16%)—this could be explained by
more contacts with national defence structures (conscription, the Defence League). The tendency of
Estonians being somewhat better informed than Russian-speaking respondents is declining. While in
spring, 30% of Estonians and 20% of Russian-speaking respondents were informed enough or generally
informed, the difference was only 3 per cent this time (26% vs 23%).
4.5 On which topics do you require more information?
As throughout the surveys the population has assessed its level of being informed as very low in view
of the topic of what to do in the event of a foreign attack, in November 2014 we included a question
about the topics regarding the state’s activities and organisation of personal life on which people
require the most information in the event of a foreign attack (Figure 25). Respondents had to choose
three topics most important to them out of nine given topics.
3
10
5
7
4
3
4
5
6
7
10
7
13
25
18
19
16
13
16
17
18
15
17
18
8
4
9
5
2
3
2
3
1
4
4
6
40
39
33
42
47
48
47
45
48
42
42
40
36
22
35
27
31
33
31
30
27
32
27
29
0% 10% 20% 30% 40% 50% 60% 70% 80% 90% 100%
Female
Male
GENDER (10/2015)
Other
Estonian
LANGUAGE (10/2015)
2012/03
2012/10
2013/03
2013/10
2014/03
2014/11
2015/03
2015/10
Yes, sufficiently/I know for sure Generally yes/ I know Don't know Rather not Certainly not
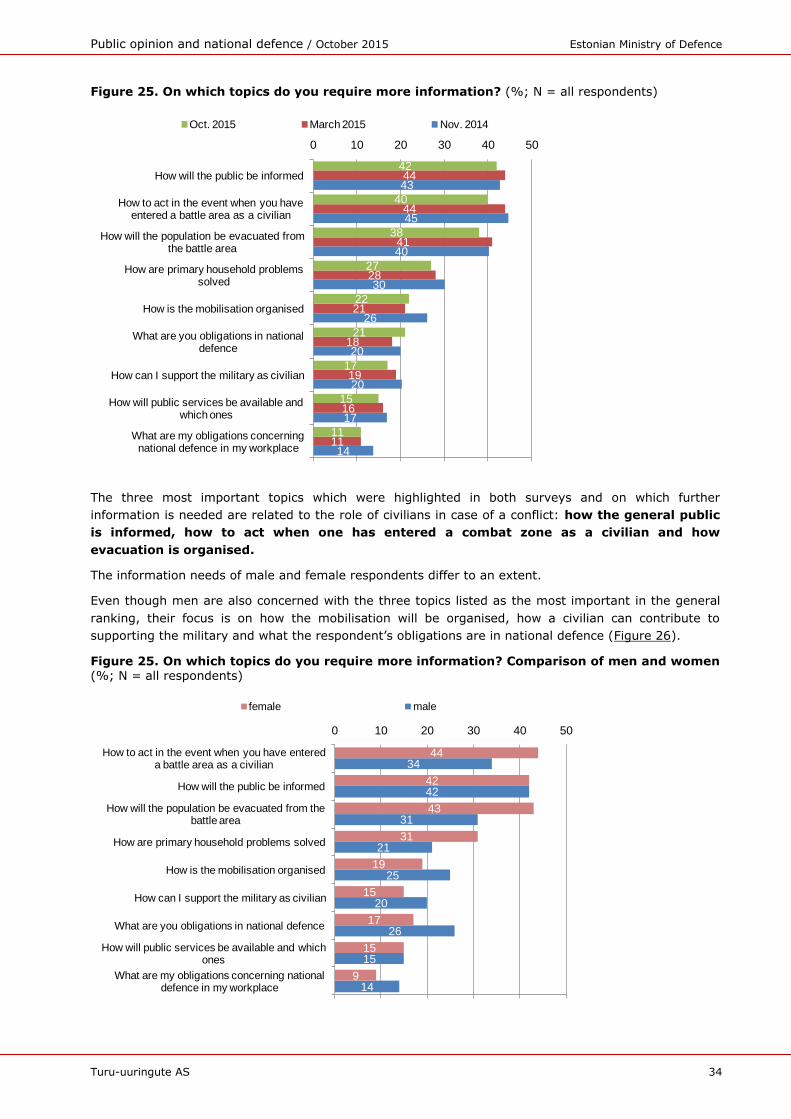
Public opinion and national defence / October 2015 Estonian Ministry of Defence
Turu-uuringute AS 34
Figure 25. On which topics do you require more information? (%; N = all respondents)
The three most important topics which were highlighted in both surveys and on which further
information is needed are related to the role of civilians in case of a conflict: how the general public
is informed, how to act when one has entered a combat zone as a civilian and how
evacuation is organised.
The information needs of male and female respondents differ to an extent.
Even though men are also concerned with the three topics listed as the most important in the general
ranking, their focus is on how the mobilisation will be organised, how a civilian can contribute to
supporting the military and what the respondent’s obligations are in national defence (Figure 26).
Figure 25. On which topics do you require more information? Comparison of men and women (%; N = all respondents)
14
17
20
20
26
30
40
45
43
11
16
19
18
21
28
41
44
44
11
15
17
21
22
27
38
40
42
0 10 20 30 40 50
What are my obligations concerning national defence in my workplace
How will public services be available and which ones
How can I support the military as civilian
What are you obligations in national defence
How is the mobilisation organised
How are primary household problems solved
How will the population be evacuated from the battle area
How to act in the event when you have entered a battle area as a civilian
How will the public be informed
Oct. 2015 March 2015 Nov. 2014
14
15
26
20
25
21
31
42
34
9
15
17
15
19
31
43
42
44
0 10 20 30 40 50
What are my obligations concerning national defence in my workplace
How will public services be available and which ones
What are you obligations in national defence
How can I support the military as civilian
How is the mobilisation organised
How are primary household problems solved
How will the population be evacuated from the battle area
How will the public be informed
How to act in the event when you have entered a battle area as a civilian
female male
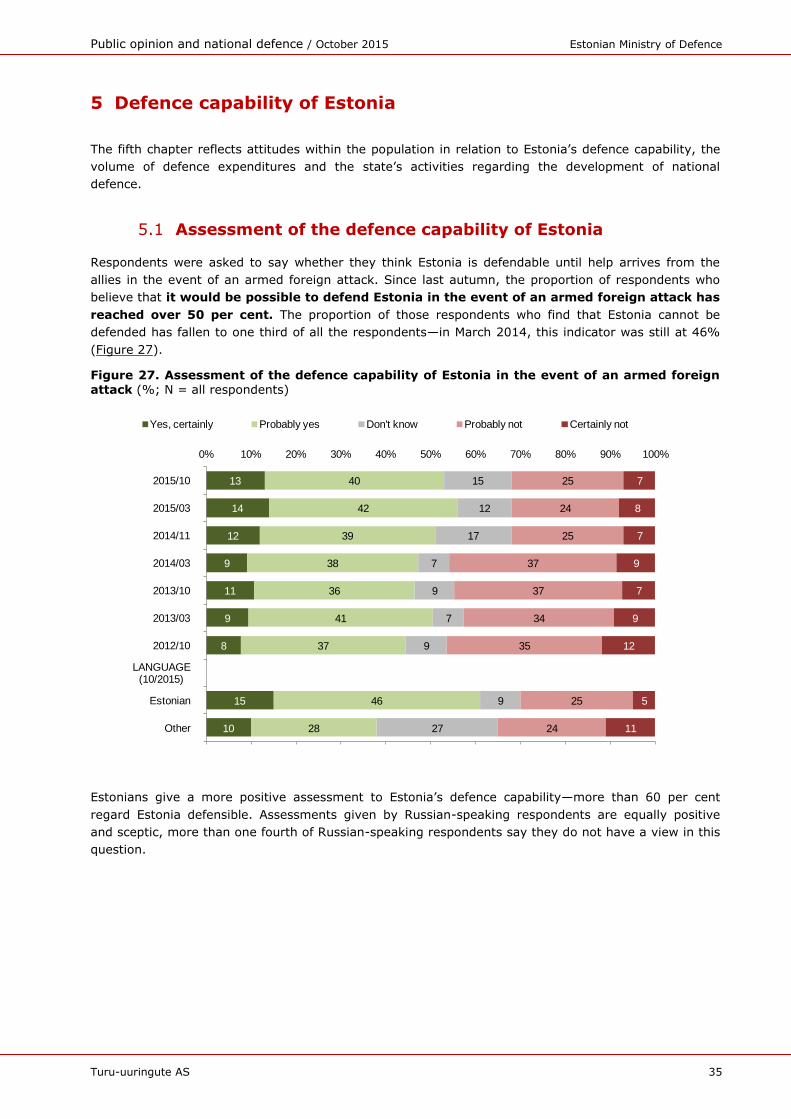
Public opinion and national defence / October 2015 Estonian Ministry of Defence
Turu-uuringute AS 35
5 Defence capability of Estonia
The fifth chapter reflects attitudes within the population in relation to Estonia’s defence capability, the
volume of defence expenditures and the state’s activities regarding the development of national
defence.
5.1 Assessment of the defence capability of Estonia
Respondents were asked to say whether they think Estonia is defendable until help arrives from the
allies in the event of an armed foreign attack. Since last autumn, the proportion of respondents who
believe that it would be possible to defend Estonia in the event of an armed foreign attack has
reached over 50 per cent. The proportion of those respondents who find that Estonia cannot be
defended has fallen to one third of all the respondents—in March 2014, this indicator was still at 46%
(Figure 27).
Figure 27. Assessment of the defence capability of Estonia in the event of an armed foreign attack (%; N = all respondents)
Estonians give a more positive assessment to Estonia’s defence capability—more than 60 per cent
regard Estonia defensible. Assessments given by Russian-speaking respondents are equally positive
and sceptic, more than one fourth of Russian-speaking respondents say they do not have a view in this
question.
10
15
8
9
11
9
12
14
13
28
46
37
41
36
38
39
42
40
27
9
9
7
9
7
17
12
15
24
25
35
34
37
37
25
24
25
11
5
12
9
7
9
7
8
7
0% 10% 20% 30% 40% 50% 60% 70% 80% 90% 100%
Other
Estonian
LANGUAGE (10/2015)
2012/10
2013/03
2013/10
2014/03
2014/11
2015/03
2015/10
Yes, certainly Probably yes Don't know Probably not Certainly not
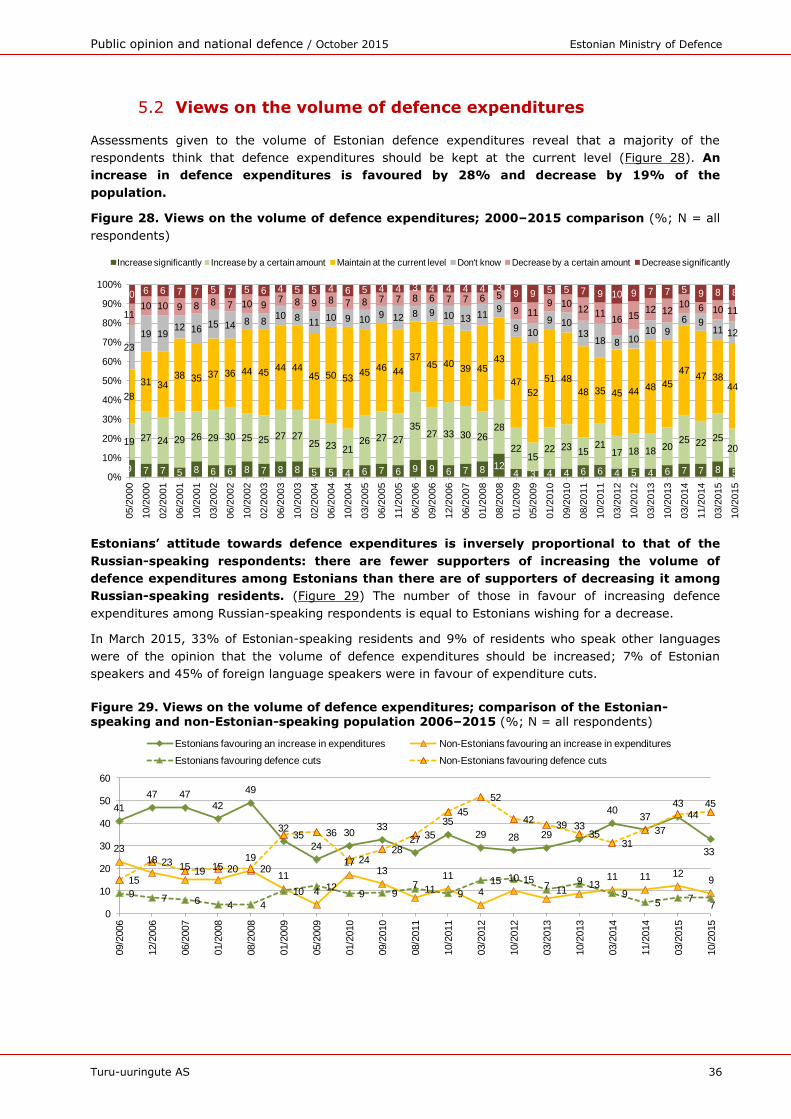
Public opinion and national defence / October 2015 Estonian Ministry of Defence
Turu-uuringute AS 36
5.2 Views on the volume of defence expenditures
Assessments given to the volume of Estonian defence expenditures reveal that a majority of the
respondents think that defence expenditures should be kept at the current level (Figure 28). An
increase in defence expenditures is favoured by 28% and decrease by 19% of the
population.
Figure 28. Views on the volume of defence expenditures; 2000–2015 comparison (%; N = all
respondents)
Estonians’ attitude towards defence expenditures is inversely proportional to that of the
Russian-speaking respondents: there are fewer supporters of increasing the volume of
defence expenditures among Estonians than there are of supporters of decreasing it among
Russian-speaking residents. (Figure 29) The number of those in favour of increasing defence
expenditures among Russian-speaking respondents is equal to Estonians wishing for a decrease.
In March 2015, 33% of Estonian-speaking residents and 9% of residents who speak other languages
were of the opinion that the volume of defence expenditures should be increased; 7% of Estonian
speakers and 45% of foreign language speakers were in favour of expenditure cuts.
Figure 29. Views on the volume of defence expenditures; comparison of the Estonian-speaking and non-Estonian-speaking population 2006–2015 (%; N = all respondents)
9 7 7 5 8 6 6 8 7 8 8 5 5 4 6 7 6 9 9 6 7 8 124 3 4 4 6 6 4 5 4 6 7 7 8 5
19 27 24 29 26 29 30 25 25 27 2725 23 21
26 27 27
3527 33 30 26
28
2215
22 2315
2117 18 18 20
25 2225
20
28
31 3438 35 37 36 44 45
44 4445 50 53
4546 44
3745 40
39 4543
4752
51 48
48 35 45 44 48 45
4747 38
44
23
19 1912 16
15 14 8 810 8
1110 9 10
9 12 8 9 10 13 119
9 10
9 1013
18 8 1010 9
6 911 12
1110 10 9 8 8 7 10 9
7 8 9 8 7 8 7 7 8 6 7 7 6 5
9 119 10
12 1116 15
12 1210 6 10 11
10 6 6 7 7 5 7 5 6 4 5 5 4 6 5 4 4 3 4 4 4 4 39 9 5 5 7 9 10 9 7 7 5 9 8 8
0%
10%
20%
30%
40%
50%
60%
70%
80%
90%
100%
05/2
000
10/2
000
02/2
001
06/2
001
10/2
001
03/2
002
06/2
002
10/2
002
02/2
003
06/2
003
10/2
003
02/2
004
06/2
004
10/2
004
03/2
005
06/2
005
11/2
005
06/2
006
09/2
006
12/2
006
06/2
007
01/2
008
08/2
008
01/2
009
05/2
009
01/2
010
09/2
010
08/2
011
10/2
011
03/2
012
10/2
012
03/2
013
10/2
013
03/2
014
11/2
014
03/2
015
10/2
015
Increase significantly Increase by a certain amount Maintain at the current level Don't know Decrease by a certain amount Decrease significantly
41
47 4742
49
32
24
3033
27
35
29 28 2933
4037
43
332318
15 1519
11
4
1713
711
4
107
9 11 11 129
9 7 6 4 4
10 129 9 11 9
15 1511
139
5 77
15
2319 20 20
35 36
2428
35
45
52
4239
3531
37
4445
0
10
20
30
40
50
60
09/2
006
12/2
006
06/2
007
01/2
008
08/2
008
01/2
009
05/2
009
01/2
010
09/2
010
08/2
011
10/2
011
03/2
012
10/2
012
03/2
013
10/2
013
03/2
014
11/2
014
03/2
015
10/2
015
Estonians favouring an increase in expenditures Non-Estonians favouring an increase in expenditures
Estonians favouring defence cuts Non-Estonians favouring defence cuts
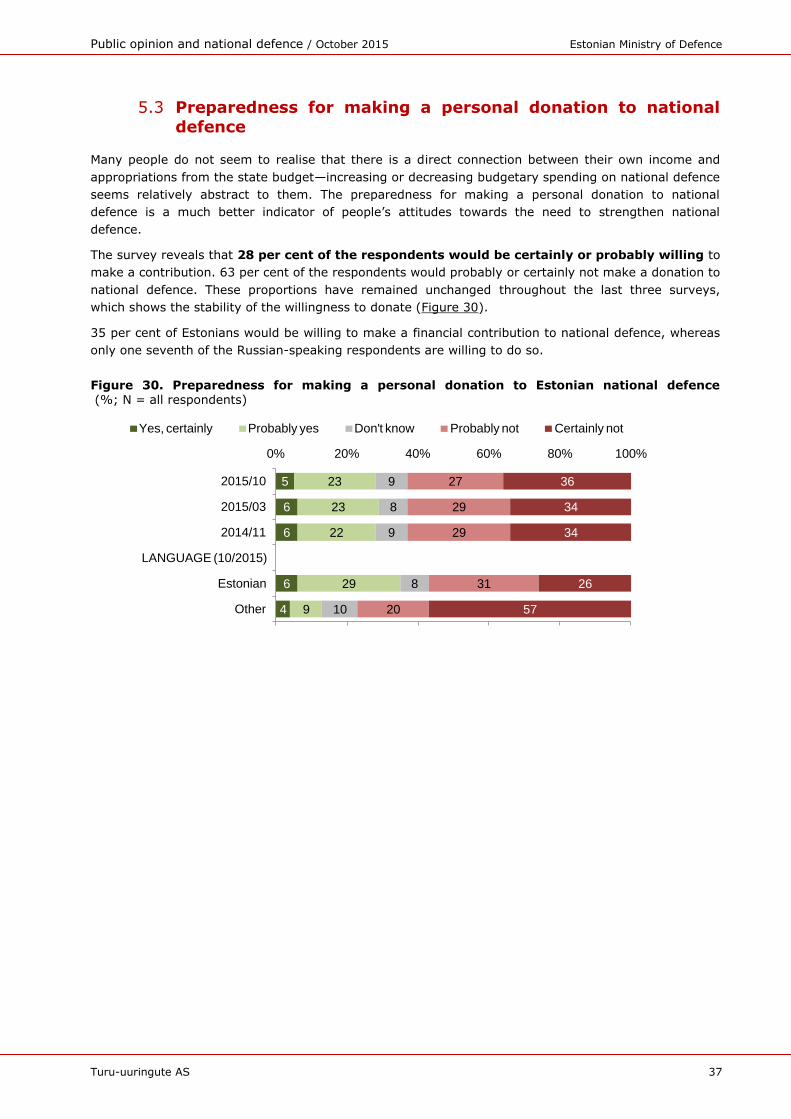
Public opinion and national defence / October 2015 Estonian Ministry of Defence
Turu-uuringute AS 37
5.3 Preparedness for making a personal donation to national
defence
Many people do not seem to realise that there is a direct connection between their own income and
appropriations from the state budget—increasing or decreasing budgetary spending on national defence
seems relatively abstract to them. The preparedness for making a personal donation to national
defence is a much better indicator of people’s attitudes towards the need to strengthen national
defence.
The survey reveals that 28 per cent of the respondents would be certainly or probably willing to
make a contribution. 63 per cent of the respondents would probably or certainly not make a donation to
national defence. These proportions have remained unchanged throughout the last three surveys,
which shows the stability of the willingness to donate (Figure 30).
35 per cent of Estonians would be willing to make a financial contribution to national defence, whereas
only one seventh of the Russian-speaking respondents are willing to do so.
Figure 30. Preparedness for making a personal donation to Estonian national defence (%; N = all respondents)
4
6
6
6
5
9
29
22
23
23
10
8
9
8
9
20
31
29
29
27
57
26
34
34
36
0% 20% 40% 60% 80% 100%
Other
Estonian
LANGUAGE (10/2015)
2014/11
2015/03
2015/10
Yes, certainly Probably yes Don't know Probably not Certainly not
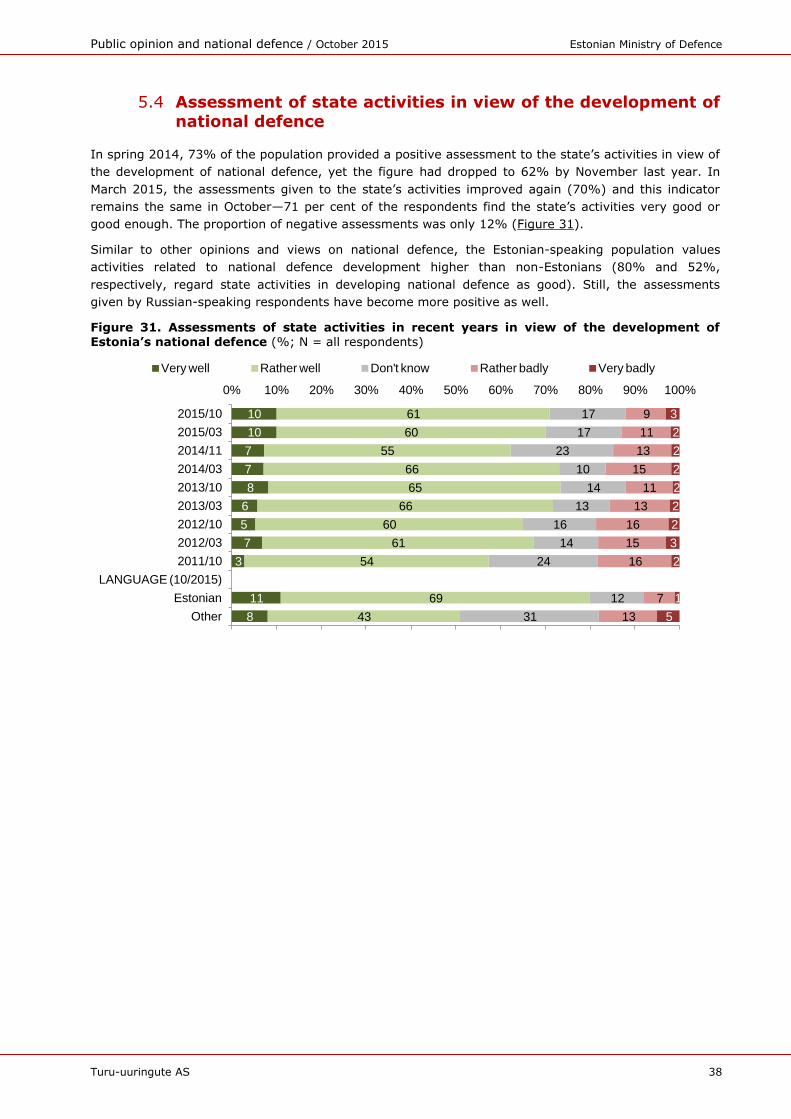
Public opinion and national defence / October 2015 Estonian Ministry of Defence
Turu-uuringute AS 38
5.4 Assessment of state activities in view of the development of national defence
In spring 2014, 73% of the population provided a positive assessment to the state’s activities in view of
the development of national defence, yet the figure had dropped to 62% by November last year. In
March 2015, the assessments given to the state’s activities improved again (70%) and this indicator
remains the same in October—71 per cent of the respondents find the state’s activities very good or
good enough. The proportion of negative assessments was only 12% (Figure 31).
Similar to other opinions and views on national defence, the Estonian-speaking population values
activities related to national defence development higher than non-Estonians (80% and 52%,
respectively, regard state activities in developing national defence as good). Still, the assessments
given by Russian-speaking respondents have become more positive as well.
Figure 31. Assessments of state activities in recent years in view of the development of Estonia’s national defence (%; N = all respondents)
8
11
3
7
5
6
8
7
7
10
10
43
69
54
61
60
66
65
66
55
60
61
31
12
24
14
16
13
14
10
23
17
17
13
7
16
15
16
13
11
15
13
11
9
5
1
2
3
2
2
2
2
2
2
3
0% 10% 20% 30% 40% 50% 60% 70% 80% 90% 100%
Other
Estonian
LANGUAGE (10/2015)
2011/10
2012/03
2012/10
2013/03
2013/10
2014/03
2014/11
2015/03
2015/10
Very well Rather well Don't know Rather badly Very badly
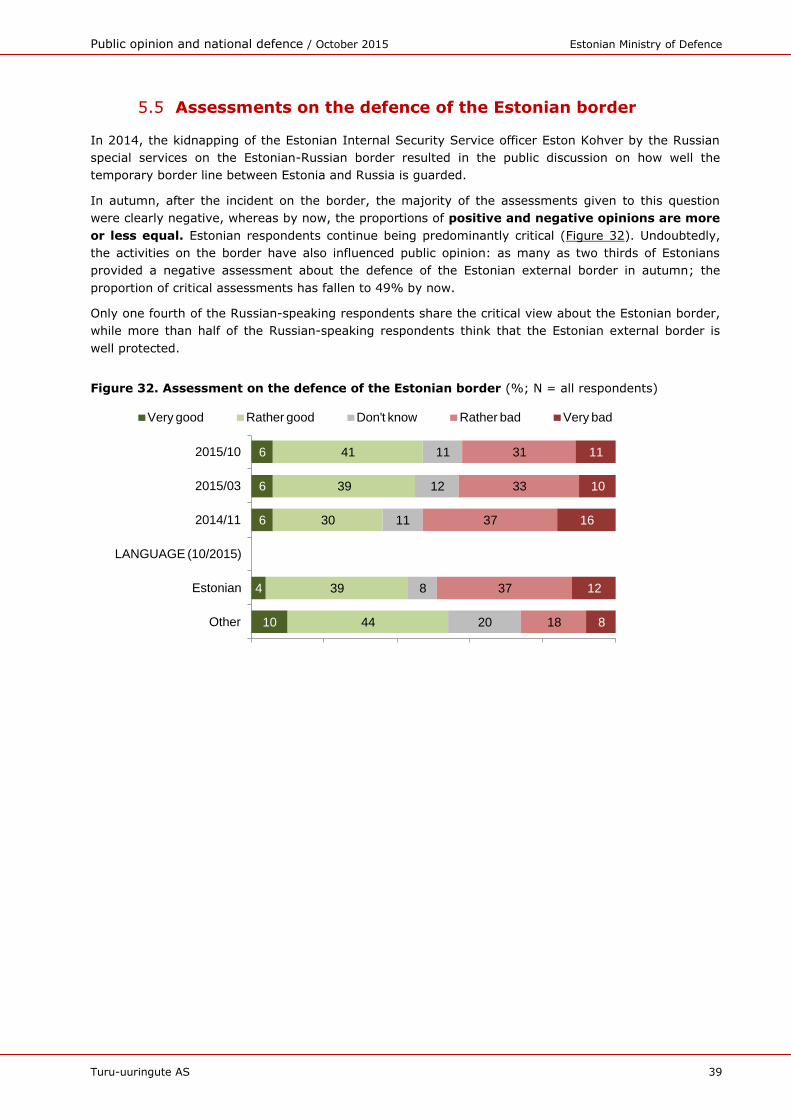
Public opinion and national defence / October 2015 Estonian Ministry of Defence
Turu-uuringute AS 39
5.5 Assessments on the defence of the Estonian border
In 2014, the kidnapping of the Estonian Internal Security Service officer Eston Kohver by the Russian
special services on the Estonian-Russian border resulted in the public discussion on how well the
temporary border line between Estonia and Russia is guarded.
In autumn, after the incident on the border, the majority of the assessments given to this question
were clearly negative, whereas by now, the proportions of positive and negative opinions are more
or less equal. Estonian respondents continue being predominantly critical (Figure 32). Undoubtedly,
the activities on the border have also influenced public opinion: as many as two thirds of Estonians
provided a negative assessment about the defence of the Estonian external border in autumn; the
proportion of critical assessments has fallen to 49% by now.
Only one fourth of the Russian-speaking respondents share the critical view about the Estonian border,
while more than half of the Russian-speaking respondents think that the Estonian external border is
well protected.
Figure 32. Assessment on the defence of the Estonian border (%; N = all respondents)
10
4
6
6
6
44
39
30
39
41
20
8
11
12
11
18
37
37
33
31
8
12
16
10
11
Other
Estonian
LANGUAGE (10/2015)
2014/11
2015/03
2015/10
Very good Rather good Don't know Rather bad Very bad
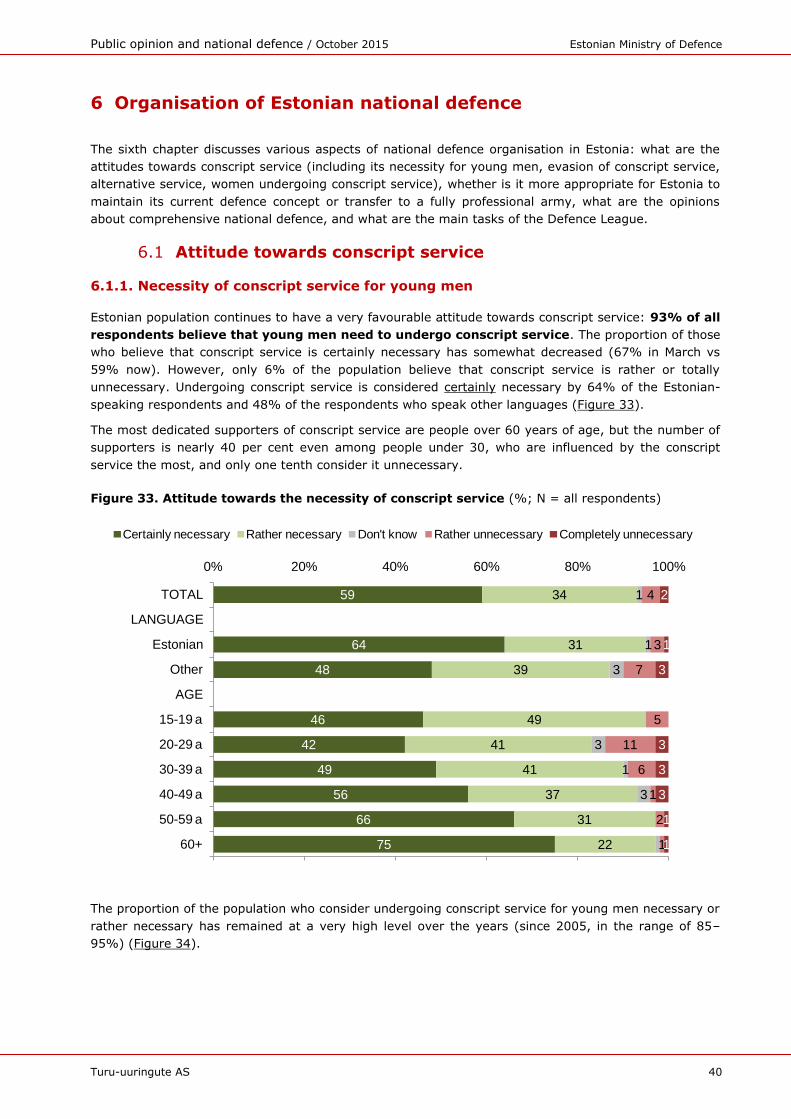
Public opinion and national defence / October 2015 Estonian Ministry of Defence
Turu-uuringute AS 40
6 Organisation of Estonian national defence
The sixth chapter discusses various aspects of national defence organisation in Estonia: what are the
attitudes towards conscript service (including its necessity for young men, evasion of conscript service,
alternative service, women undergoing conscript service), whether is it more appropriate for Estonia to
maintain its current defence concept or transfer to a fully professional army, what are the opinions
about comprehensive national defence, and what are the main tasks of the Defence League.
6.1 Attitude towards conscript service
6.1.1. Necessity of conscript service for young men
Estonian population continues to have a very favourable attitude towards conscript service: 93% of all
respondents believe that young men need to undergo conscript service. The proportion of those
who believe that conscript service is certainly necessary has somewhat decreased (67% in March vs
59% now). However, only 6% of the population believe that conscript service is rather or totally
unnecessary. Undergoing conscript service is considered certainly necessary by 64% of the Estonian-
speaking respondents and 48% of the respondents who speak other languages (Figure 33).
The most dedicated supporters of conscript service are people over 60 years of age, but the number of
supporters is nearly 40 per cent even among people under 30, who are influenced by the conscript
service the most, and only one tenth consider it unnecessary.
Figure 33. Attitude towards the necessity of conscript service (%; N = all respondents)
The proportion of the population who consider undergoing conscript service for young men necessary or
rather necessary has remained at a very high level over the years (since 2005, in the range of 85–
95%) (Figure 34).
75
66
56
49
42
46
48
64
59
22
31
37
41
41
49
39
31
34
3
1
3
3
1
1
1
2
1
6
11
5
7
3
4
1
1
3
3
3
3
1
2
0% 20% 40% 60% 80% 100%
60+
50-59 a
40-49 a
30-39 a
20-29 a
15-19 a
AGE
Other
Estonian
LANGUAGE
TOTAL
Certainly necessary Rather necessary Don't know Rather unnecessary Completely unnecessary
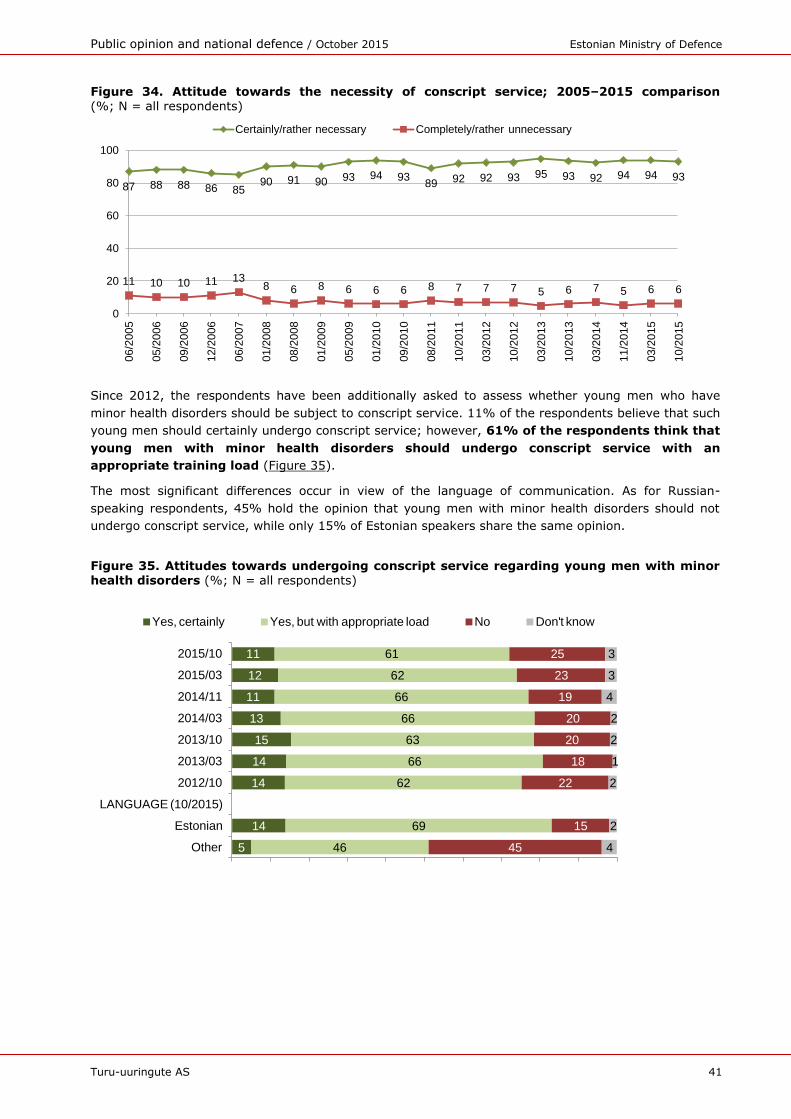
Public opinion and national defence / October 2015 Estonian Ministry of Defence
Turu-uuringute AS 41
Figure 34. Attitude towards the necessity of conscript service; 2005–2015 comparison (%; N = all respondents)
Since 2012, the respondents have been additionally asked to assess whether young men who have
minor health disorders should be subject to conscript service. 11% of the respondents believe that such
young men should certainly undergo conscript service; however, 61% of the respondents think that
young men with minor health disorders should undergo conscript service with an
appropriate training load (Figure 35).
The most significant differences occur in view of the language of communication. As for Russian-
speaking respondents, 45% hold the opinion that young men with minor health disorders should not
undergo conscript service, while only 15% of Estonian speakers share the same opinion.
Figure 35. Attitudes towards undergoing conscript service regarding young men with minor health disorders (%; N = all respondents)
87 88 88 86 8590 91 90 93 94 93
89 92 92 93 95 93 92 94 94 93
11 10 10 11 138 6 8 6 6 6 8 7 7 7 5 6 7 5 6 6
0
20
40
60
80
100
06
/20
05
05
/20
06
09
/20
06
12
/20
06
06
/20
07
01
/20
08
08
/20
08
01
/20
09
05
/20
09
01
/20
10
09
/20
10
08
/20
11
10
/20
11
03
/20
12
10
/20
12
03
/20
13
10
/20
13
03
/20
14
11
/20
14
03
/20
15
10
/20
15
Certainly/rather necessary Completely/rather unnecessary
5
14
14
14
15
13
11
12
11
46
69
62
66
63
66
66
62
61
45
15
22
18
20
20
19
23
25
4
2
2
1
2
2
4
3
3
Other
Estonian
LANGUAGE (10/2015)
2012/10
2013/03
2013/10
2014/03
2014/11
2015/03
2015/10
Yes, certainly Yes, but with appropriate load No Don't know
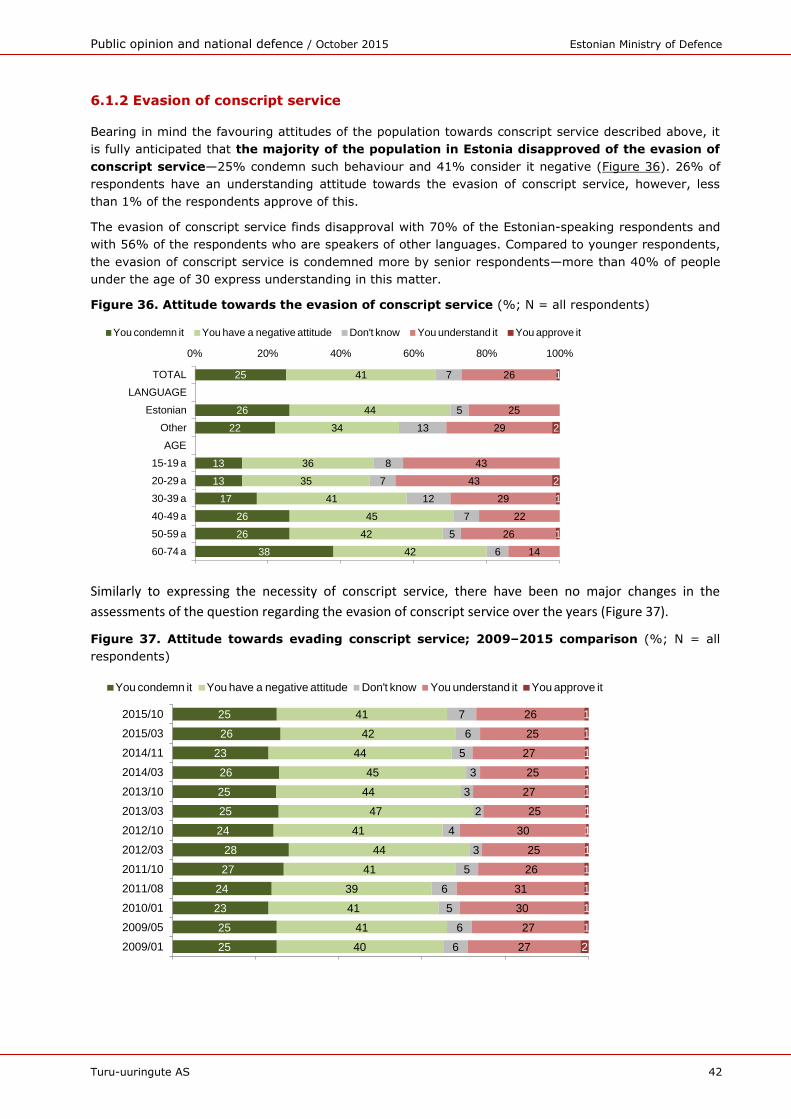
Public opinion and national defence / October 2015 Estonian Ministry of Defence
Turu-uuringute AS 42
6.1.2 Evasion of conscript service
Bearing in mind the favouring attitudes of the population towards conscript service described above, it
is fully anticipated that the majority of the population in Estonia disapproved of the evasion of
conscript service—25% condemn such behaviour and 41% consider it negative (Figure 36). 26% of
respondents have an understanding attitude towards the evasion of conscript service, however, less
than 1% of the respondents approve of this.
The evasion of conscript service finds disapproval with 70% of the Estonian-speaking respondents and
with 56% of the respondents who are speakers of other languages. Compared to younger respondents,
the evasion of conscript service is condemned more by senior respondents—more than 40% of people
under the age of 30 express understanding in this matter.
Figure 36. Attitude towards the evasion of conscript service (%; N = all respondents)
Similarly to expressing the necessity of conscript service, there have been no major changes in the
assessments of the question regarding the evasion of conscript service over the years (Figure 37).
Figure 37. Attitude towards evading conscript service; 2009–2015 comparison (%; N = all
respondents)
38
26
26
17
13
13
22
26
25
42
42
45
41
35
36
34
44
41
6
5
7
12
7
8
13
5
7
14
26
22
29
43
43
29
25
26
1
1
2
2
1
0% 20% 40% 60% 80% 100%
60-74 a
50-59 a
40-49 a
30-39 a
20-29 a
15-19 a
AGE
Other
Estonian
LANGUAGE
TOTAL
You condemn it You have a negative attitude Don't know You understand it You approve it
25
25
23
24
27
28
24
25
25
26
23
26
25
40
41
41
39
41
44
41
47
44
45
44
42
41
6
6
5
6
5
3
4
2
3
3
5
6
7
27
27
30
31
26
25
30
25
27
25
27
25
26
2
1
1
1
1
1
1
1
1
1
1
1
1
2009/01
2009/05
2010/01
2011/08
2011/10
2012/03
2012/10
2013/03
2013/10
2014/03
2014/11
2015/03
2015/10
You condemn it You have a negative attitude Don't know You understand it You approve it
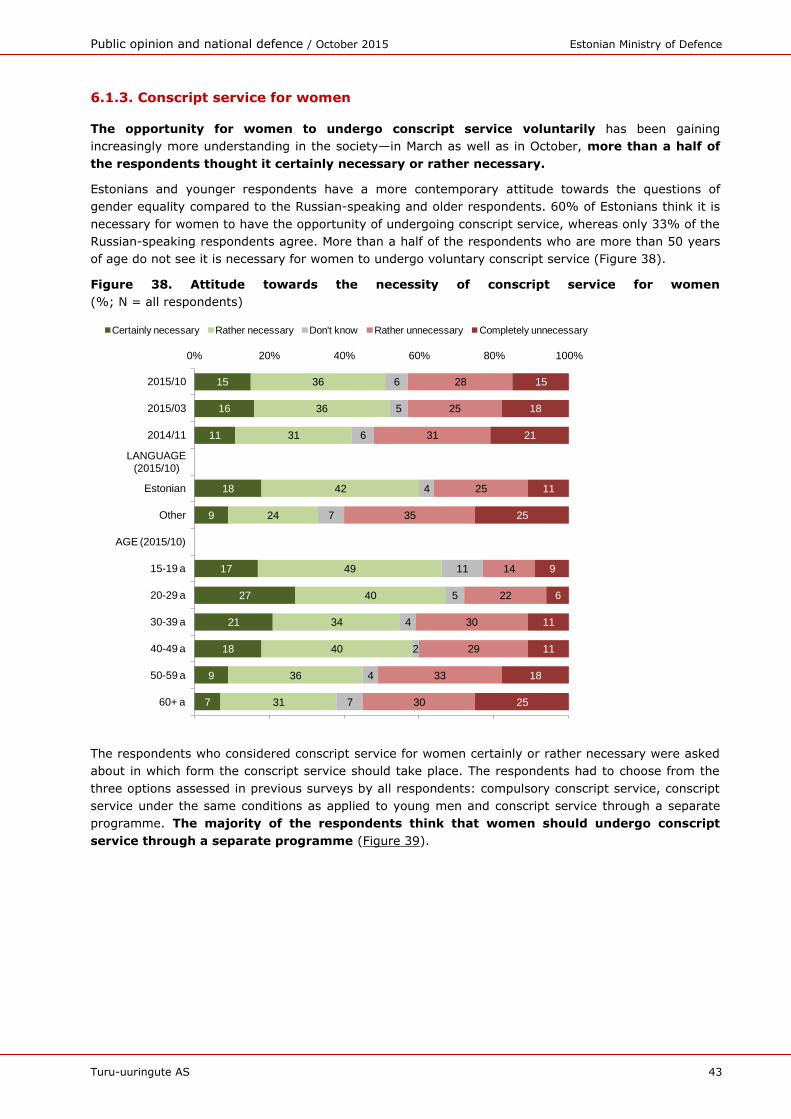
Public opinion and national defence / October 2015 Estonian Ministry of Defence
Turu-uuringute AS 43
6.1.3. Conscript service for women
The opportunity for women to undergo conscript service voluntarily has been gaining
increasingly more understanding in the society—in March as well as in October, more than a half of
the respondents thought it certainly necessary or rather necessary.
Estonians and younger respondents have a more contemporary attitude towards the questions of
gender equality compared to the Russian-speaking and older respondents. 60% of Estonians think it is
necessary for women to have the opportunity of undergoing conscript service, whereas only 33% of the
Russian-speaking respondents agree. More than a half of the respondents who are more than 50 years
of age do not see it is necessary for women to undergo voluntary conscript service (Figure 38).
Figure 38. Attitude towards the necessity of conscript service for women
(%; N = all respondents)
The respondents who considered conscript service for women certainly or rather necessary were asked
about in which form the conscript service should take place. The respondents had to choose from the
three options assessed in previous surveys by all respondents: compulsory conscript service, conscript
service under the same conditions as applied to young men and conscript service through a separate
programme. The majority of the respondents think that women should undergo conscript
service through a separate programme (Figure 39).
7
9
18
21
27
17
9
18
11
16
15
31
36
40
34
40
49
24
42
31
36
36
7
4
2
4
5
11
7
4
6
5
6
30
33
29
30
22
14
35
25
31
25
28
25
18
11
11
6
9
25
11
21
18
15
0% 20% 40% 60% 80% 100%
60+ a
50-59 a
40-49 a
30-39 a
20-29 a
15-19 a
AGE (2015/10)
Other
Estonian
LANGUAGE (2015/10)
2014/11
2015/03
2015/10
Certainly necessary Rather necessary Don't know Rather unnecessary Completely unnecessary
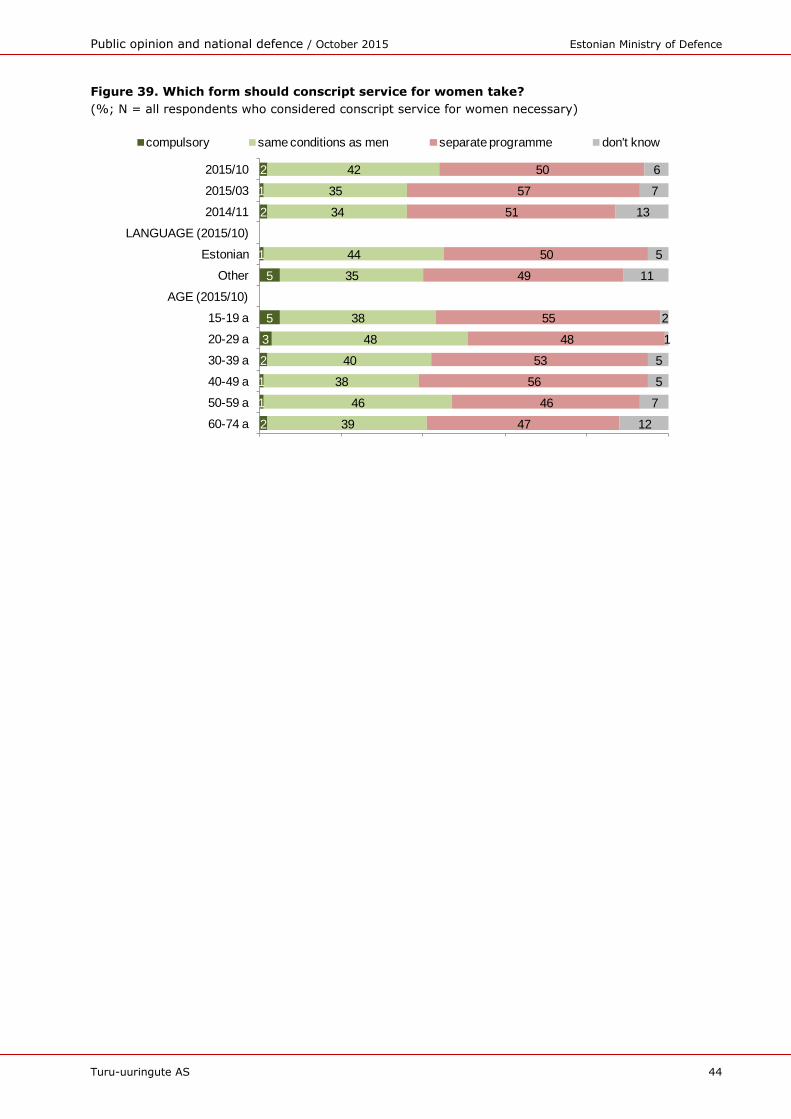
Public opinion and national defence / October 2015 Estonian Ministry of Defence
Turu-uuringute AS 44
Figure 39. Which form should conscript service for women take?
(%; N = all respondents who considered conscript service for women necessary)
2
1
1
2
3
5
5
1
2
1
2
39
46
38
40
48
38
35
44
34
35
42
47
46
56
53
48
55
49
50
51
57
50
12
7
5
5
1
2
11
5
13
7
6
60-74 a
50-59 a
40-49 a
30-39 a
20-29 a
15-19 a
AGE (2015/10)
Other
Estonian
LANGUAGE (2015/10)
2014/11
2015/03
2015/10
compulsory same conditions as men separate programme don't know
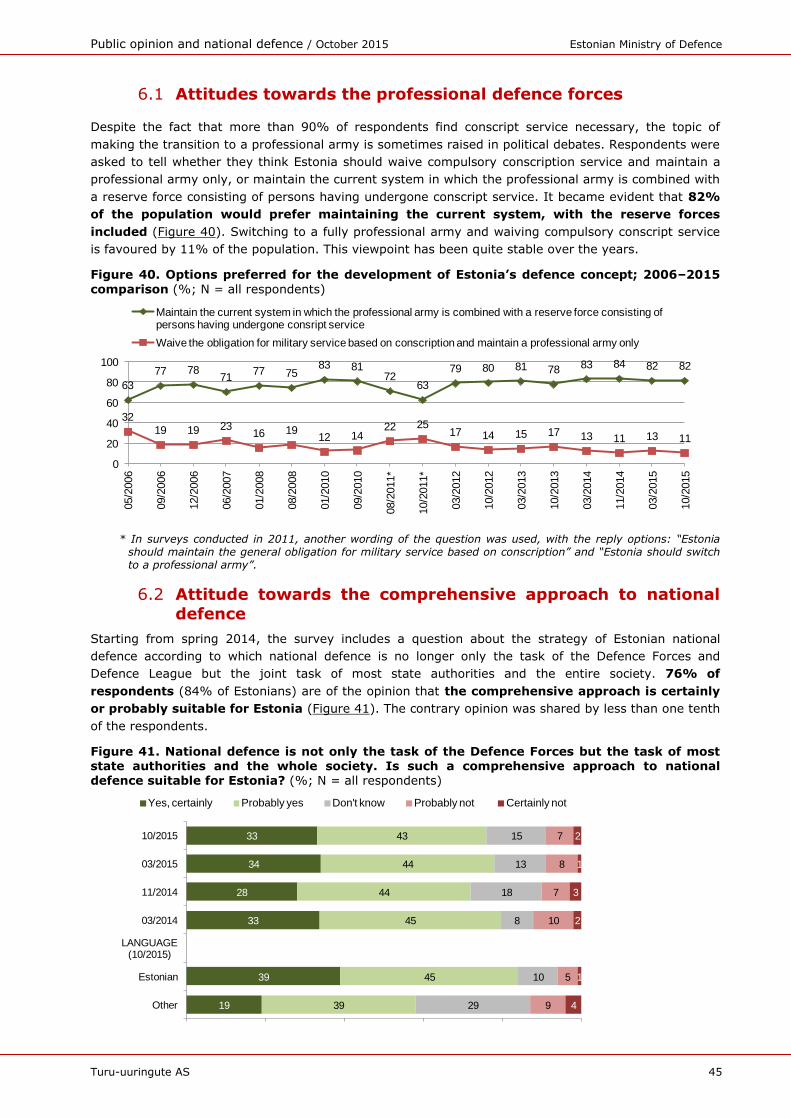
Public opinion and national defence / October 2015 Estonian Ministry of Defence
Turu-uuringute AS 45
6.1 Attitudes towards the professional defence forces
Despite the fact that more than 90% of respondents find conscript service necessary, the topic of
making the transition to a professional army is sometimes raised in political debates. Respondents were
asked to tell whether they think Estonia should waive compulsory conscription service and maintain a
professional army only, or maintain the current system in which the professional army is combined with
a reserve force consisting of persons having undergone conscript service. It became evident that 82%
of the population would prefer maintaining the current system, with the reserve forces
included (Figure 40). Switching to a fully professional army and waiving compulsory conscript service
is favoured by 11% of the population. This viewpoint has been quite stable over the years.
Figure 40. Options preferred for the development of Estonia’s defence concept; 2006–2015
comparison (%; N = all respondents)
* In surveys conducted in 2011, another wording of the question was used, with the reply options: “Estonia should maintain the general obligation for military service based on conscription” and “Estonia should switch to a professional army”.
6.2 Attitude towards the comprehensive approach to national
defence
Starting from spring 2014, the survey includes a question about the strategy of Estonian national
defence according to which national defence is no longer only the task of the Defence Forces and
Defence League but the joint task of most state authorities and the entire society. 76% of
respondents (84% of Estonians) are of the opinion that the comprehensive approach is certainly
or probably suitable for Estonia (Figure 41). The contrary opinion was shared by less than one tenth
of the respondents.
Figure 41. National defence is not only the task of the Defence Forces but the task of most state authorities and the whole society. Is such a comprehensive approach to national defence suitable for Estonia? (%; N = all respondents)
63
77 7871
77 7583 81
7263
79 80 81 78 83 84 82 82
32
19 19 2316 19
12 1422 25
17 14 15 17 13 11 13 11
0
20
40
60
80
100
05/2
006
09/2
006
12/2
006
06/2
007
01/2
008
08/2
008
01/2
010
09/2
010
08/2
011*
10/2
011*
03/2
012
10/2
012
03/2
013
10/2
013
03/2
014
11/2
014
03/2
015
10/2
015
Maintain the current system in which the professional army is combined with a reserve force consisting of persons having undergone consript service
Waive the obligation for military service based on conscription and maintain a professional army only
19
39
33
28
34
33
39
45
45
44
44
43
29
10
8
18
13
15
9
5
10
7
8
7
4
1
2
3
1
2
Other
Estonian
LANGUAGE (10/2015)
03/2014
11/2014
03/2015
10/2015
Yes, certainly Probably yes Don't know Probably not Certainly not
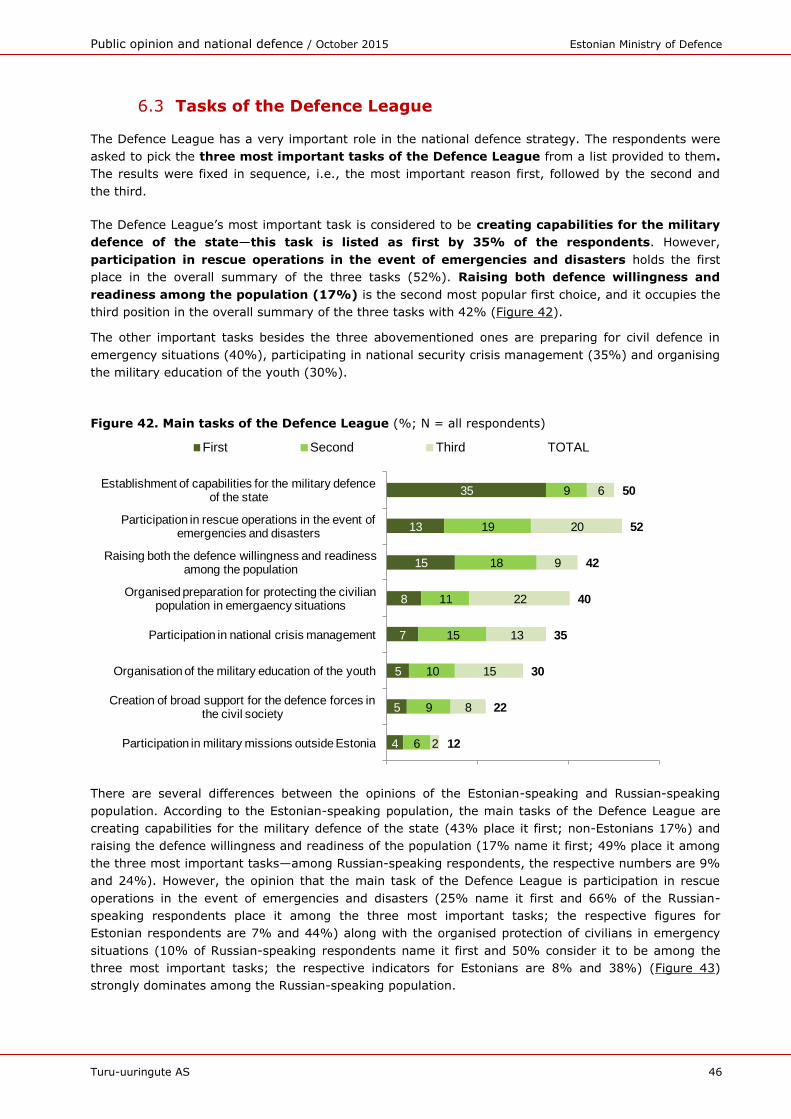
Public opinion and national defence / October 2015 Estonian Ministry of Defence
Turu-uuringute AS 46
6.3 Tasks of the Defence League
The Defence League has a very important role in the national defence strategy. The respondents were
asked to pick the three most important tasks of the Defence League from a list provided to them.
The results were fixed in sequence, i.e., the most important reason first, followed by the second and
the third.
The Defence League’s most important task is considered to be creating capabilities for the military
defence of the state—this task is listed as first by 35% of the respondents. However,
participation in rescue operations in the event of emergencies and disasters holds the first
place in the overall summary of the three tasks (52%). Raising both defence willingness and
readiness among the population (17%) is the second most popular first choice, and it occupies the
third position in the overall summary of the three tasks with 42% (Figure 42).
The other important tasks besides the three abovementioned ones are preparing for civil defence in
emergency situations (40%), participating in national security crisis management (35%) and organising
the military education of the youth (30%).
Figure 42. Main tasks of the Defence League (%; N = all respondents)
There are several differences between the opinions of the Estonian-speaking and Russian-speaking
population. According to the Estonian-speaking population, the main tasks of the Defence League are
creating capabilities for the military defence of the state (43% place it first; non-Estonians 17%) and
raising the defence willingness and readiness of the population (17% name it first; 49% place it among
the three most important tasks—among Russian-speaking respondents, the respective numbers are 9%
and 24%). However, the opinion that the main task of the Defence League is participation in rescue
operations in the event of emergencies and disasters (25% name it first and 66% of the Russian-
speaking respondents place it among the three most important tasks; the respective figures for
Estonian respondents are 7% and 44%) along with the organised protection of civilians in emergency
situations (10% of Russian-speaking respondents name it first and 50% consider it to be among the
three most important tasks; the respective indicators for Estonians are 8% and 38%) (Figure 43)
strongly dominates among the Russian-speaking population.
4
5
5
7
8
15
13
35
6
9
10
15
11
18
19
9
2
8
15
13
22
9
20
6
12
22
30
35
40
42
52
50
Participation in military missions outside Estonia
Creation of broad support for the defence forces in the civil society
Organisation of the military education of the youth
Participation in national crisis management
Organised preparation for protecting the civilian population in emergaency situations
Raising both the defence willingness and readiness among the population
Participation in rescue operations in the event of emergencies and disasters
Establishment of capabilities for the military defence of the state
First Second Third TOTAL
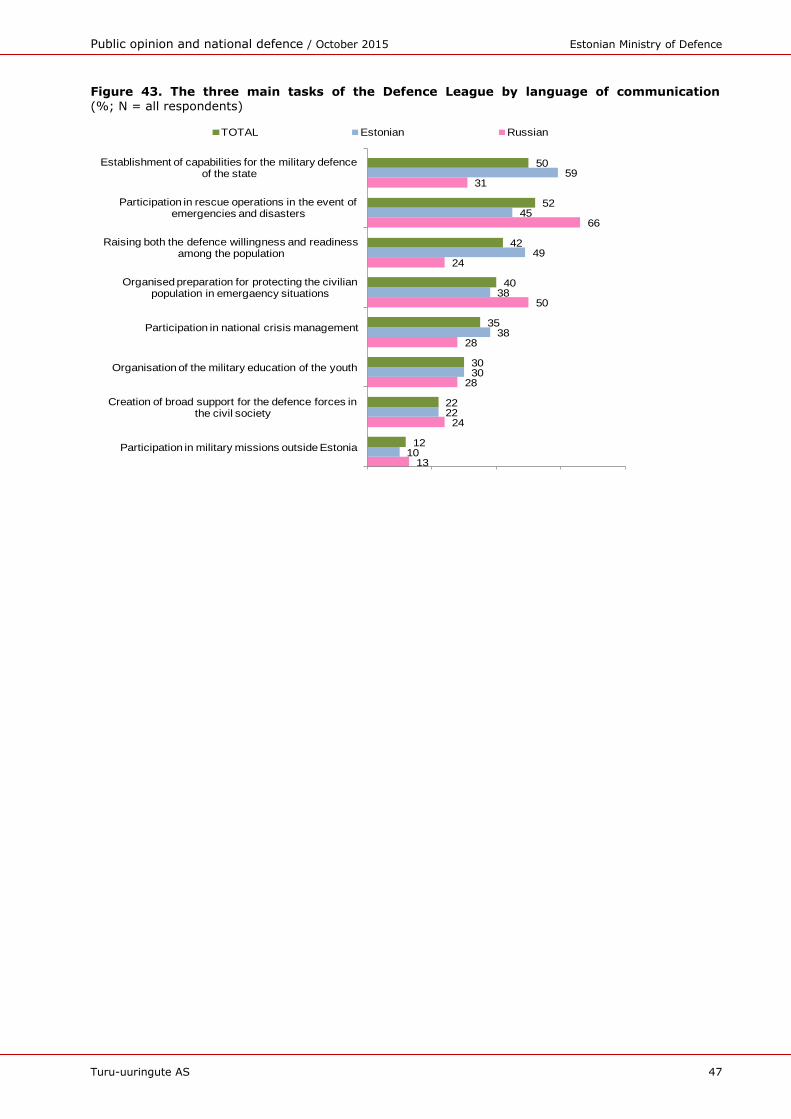
Public opinion and national defence / October 2015 Estonian Ministry of Defence
Turu-uuringute AS 47
Figure 43. The three main tasks of the Defence League by language of communication (%; N = all respondents)
13
24
28
28
50
24
66
31
10
22
30
38
38
49
45
59
12
22
30
35
40
42
52
50
Participation in military missions outside Estonia
Creation of broad support for the defence forces in the civil society
Organisation of the military education of the youth
Participation in national crisis management
Organised preparation for protecting the civilian population in emergaency situations
Raising both the defence willingness and readiness among the population
Participation in rescue operations in the event of emergencies and disasters
Establishment of capabilities for the military defence of the state
TOTAL Estonian Russian
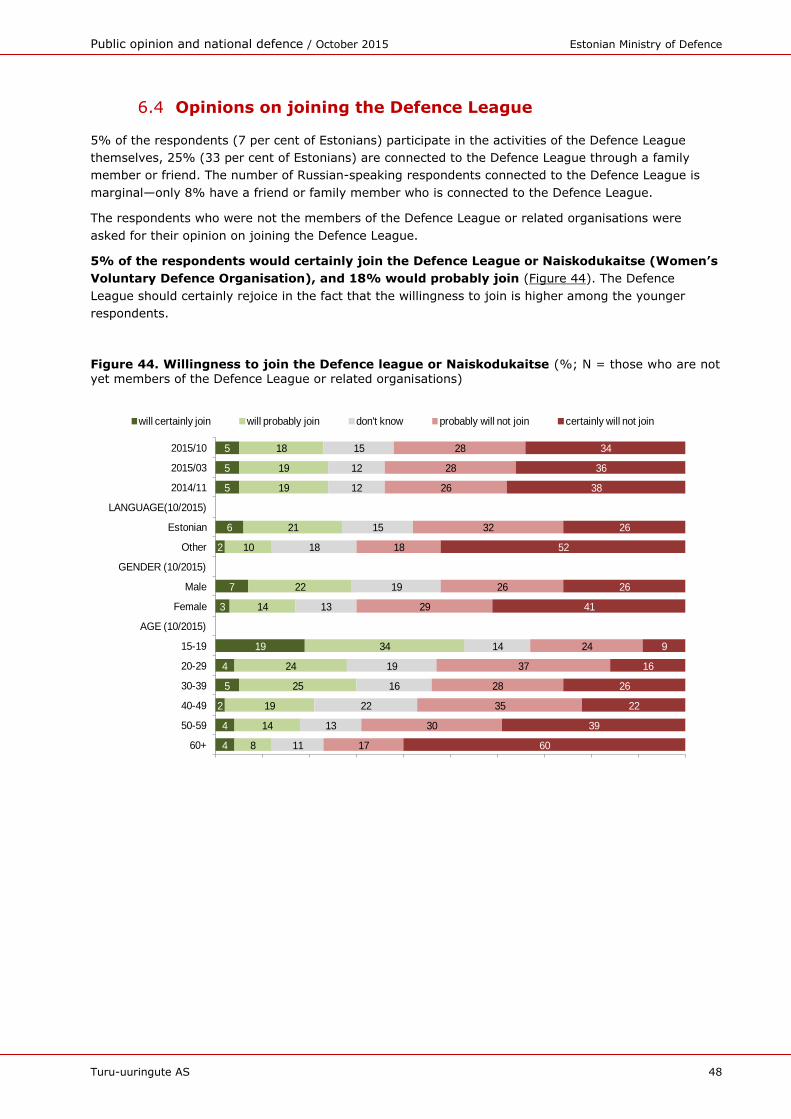
Public opinion and national defence / October 2015 Estonian Ministry of Defence
Turu-uuringute AS 48
6.4 Opinions on joining the Defence League
5% of the respondents (7 per cent of Estonians) participate in the activities of the Defence League
themselves, 25% (33 per cent of Estonians) are connected to the Defence League through a family
member or friend. The number of Russian-speaking respondents connected to the Defence League is
marginal—only 8% have a friend or family member who is connected to the Defence League.
The respondents who were not the members of the Defence League or related organisations were
asked for their opinion on joining the Defence League.
5% of the respondents would certainly join the Defence League or Naiskodukaitse (Women’s
Voluntary Defence Organisation), and 18% would probably join (Figure 44). The Defence
League should certainly rejoice in the fact that the willingness to join is higher among the younger
respondents.
Figure 44. Willingness to join the Defence league or Naiskodukaitse (%; N = those who are not
yet members of the Defence League or related organisations)
4
4
2
5
4
19
3
7
2
6
5
5
5
8
14
19
25
24
34
14
22
10
21
19
19
18
11
13
22
16
19
14
13
19
18
15
12
12
15
17
30
35
28
37
24
29
26
18
32
26
28
28
60
39
22
26
16
9
41
26
52
26
38
36
34
60+
50-59
40-49
30-39
20-29
15-19
AGE (10/2015)
Female
Male
GENDER (10/2015)
Other
Estonian
LANGUAGE(10/2015)
2014/11
2015/03
2015/10
will certainly join will probably join don't know probably will not join certainly will not join
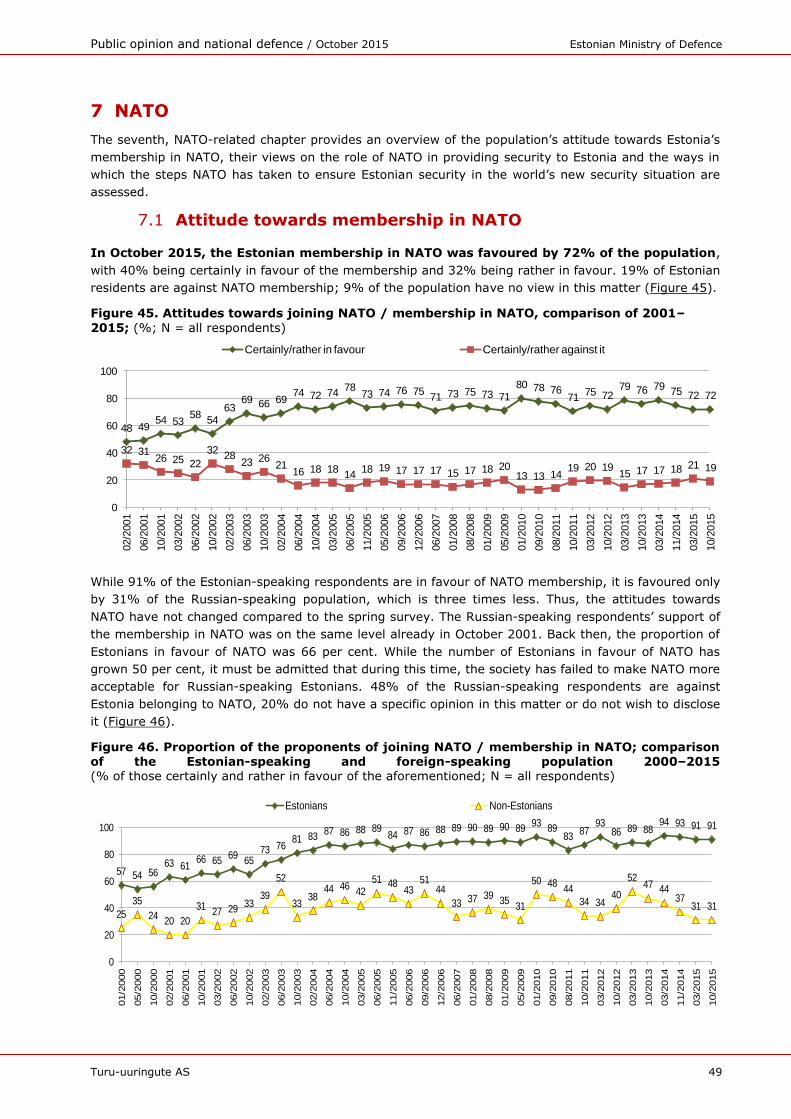
Public opinion and national defence / October 2015 Estonian Ministry of Defence
Turu-uuringute AS 49
7 NATO
The seventh, NATO-related chapter provides an overview of the population’s attitude towards Estonia’s
membership in NATO, their views on the role of NATO in providing security to Estonia and the ways in
which the steps NATO has taken to ensure Estonian security in the world’s new security situation are
assessed.
7.1 Attitude towards membership in NATO
In October 2015, the Estonian membership in NATO was favoured by 72% of the population,
with 40% being certainly in favour of the membership and 32% being rather in favour. 19% of Estonian
residents are against NATO membership; 9% of the population have no view in this matter (Figure 45).
Figure 45. Attitudes towards joining NATO / membership in NATO, comparison of 2001–
2015; (%; N = all respondents)
While 91% of the Estonian-speaking respondents are in favour of NATO membership, it is favoured only
by 31% of the Russian-speaking population, which is three times less. Thus, the attitudes towards
NATO have not changed compared to the spring survey. The Russian-speaking respondents’ support of
the membership in NATO was on the same level already in October 2001. Back then, the proportion of
Estonians in favour of NATO was 66 per cent. While the number of Estonians in favour of NATO has
grown 50 per cent, it must be admitted that during this time, the society has failed to make NATO more
acceptable for Russian-speaking Estonians. 48% of the Russian-speaking respondents are against
Estonia belonging to NATO, 20% do not have a specific opinion in this matter or do not wish to disclose
it (Figure 46).
Figure 46. Proportion of the proponents of joining NATO / membership in NATO; comparison of the Estonian-speaking and foreign-speaking population 2000–2015 (% of those certainly and rather in favour of the aforementioned; N = all respondents)
48 4954 53
5854
6369 66 69
74 72 7478
73 74 76 7571 73 75 73 71
80 78 7671
75 7279 76 79
75 72 72
32 3126 25 22
3228
23 2621
16 18 1814
18 19 17 17 17 15 17 18 2013 13 14
19 20 1915 17 17 18 21 19
0
20
40
60
80
100
02/2
001
06/2
001
10/2
001
03/2
002
06/2
002
10/2
002
02/2
003
06/2
003
10/2
003
02/2
004
06/2
004
10/2
004
03/2
005
06/2
005
11/2
005
05/2
006
09/2
006
12/2
006
06/2
007
01/2
008
08/2
008
01/2
009
05/2
009
01/2
010
09/2
010
08/2
011
10/2
011
03/2
012
10/2
012
03/2
013
10/2
013
03/2
014
11/2
014
03/2
015
10/2
015
Certainly/rather in favour Certainly/rather against it
57 54 5663 61
66 6569
6573 76
81 8387 86 88 89
84 87 86 88 89 90 89 90 8993
8983
8793
86 89 8894 93 91 91
25
35
2420 20
3127 29
3339
52
3338
44 4642
51 4843
5144
33 37 3935
31
50 4844
34 3440
5247 44
3731 31
0
20
40
60
80
100
01/2
000
05/2
000
10/2
000
02/2
001
06/2
001
10/2
001
03/2
002
06/2
002
10/2
002
02/2
003
06/2
003
10/2
003
02/2
004
06/2
004
10/2
004
03/2
005
06/2
005
11/2
005
06/2
006
09/2
006
12/2
006
06/2
007
01/2
008
08/2
008
01/2
009
05/2
009
01/2
010
09/2
010
08/2
011
10/2
011
03/2
012
10/2
012
03/2
013
10/2
013
03/2
014
11/2
014
03/2
015
10/2
015
Estonians Non-Estonians
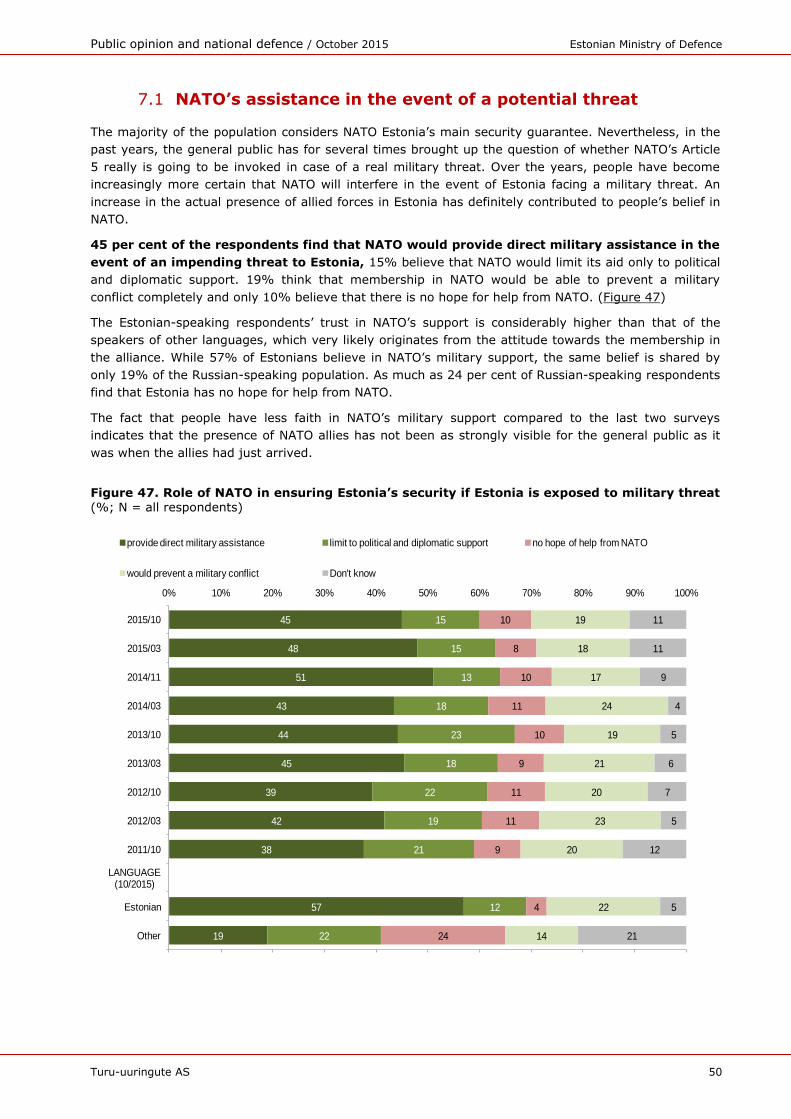
Public opinion and national defence / October 2015 Estonian Ministry of Defence
Turu-uuringute AS 50
7.1 NATO’s assistance in the event of a potential threat
The majority of the population considers NATO Estonia’s main security guarantee. Nevertheless, in the
past years, the general public has for several times brought up the question of whether NATO’s Article
5 really is going to be invoked in case of a real military threat. Over the years, people have become
increasingly more certain that NATO will interfere in the event of Estonia facing a military threat. An
increase in the actual presence of allied forces in Estonia has definitely contributed to people’s belief in
NATO.
45 per cent of the respondents find that NATO would provide direct military assistance in the
event of an impending threat to Estonia, 15% believe that NATO would limit its aid only to political
and diplomatic support. 19% think that membership in NATO would be able to prevent a military
conflict completely and only 10% believe that there is no hope for help from NATO. (Figure 47)
The Estonian-speaking respondents’ trust in NATO’s support is considerably higher than that of the
speakers of other languages, which very likely originates from the attitude towards the membership in
the alliance. While 57% of Estonians believe in NATO’s military support, the same belief is shared by
only 19% of the Russian-speaking population. As much as 24 per cent of Russian-speaking respondents
find that Estonia has no hope for help from NATO.
The fact that people have less faith in NATO’s military support compared to the last two surveys
indicates that the presence of NATO allies has not been as strongly visible for the general public as it
was when the allies had just arrived.
Figure 47. Role of NATO in ensuring Estonia’s security if Estonia is exposed to military threat (%; N = all respondents)
19
57
38
42
39
45
44
43
51
48
45
22
12
21
19
22
18
23
18
13
15
15
24
4
9
11
11
9
10
11
10
8
10
14
22
20
23
20
21
19
24
17
18
19
21
5
12
5
7
6
5
4
9
11
11
0% 10% 20% 30% 40% 50% 60% 70% 80% 90% 100%
Other
Estonian
LANGUAGE (10/2015)
2011/10
2012/03
2012/10
2013/03
2013/10
2014/03
2014/11
2015/03
2015/10
provide direct military assistance limit to political and diplomatic support no hope of help from NATO
would prevent a military conflict Don't know
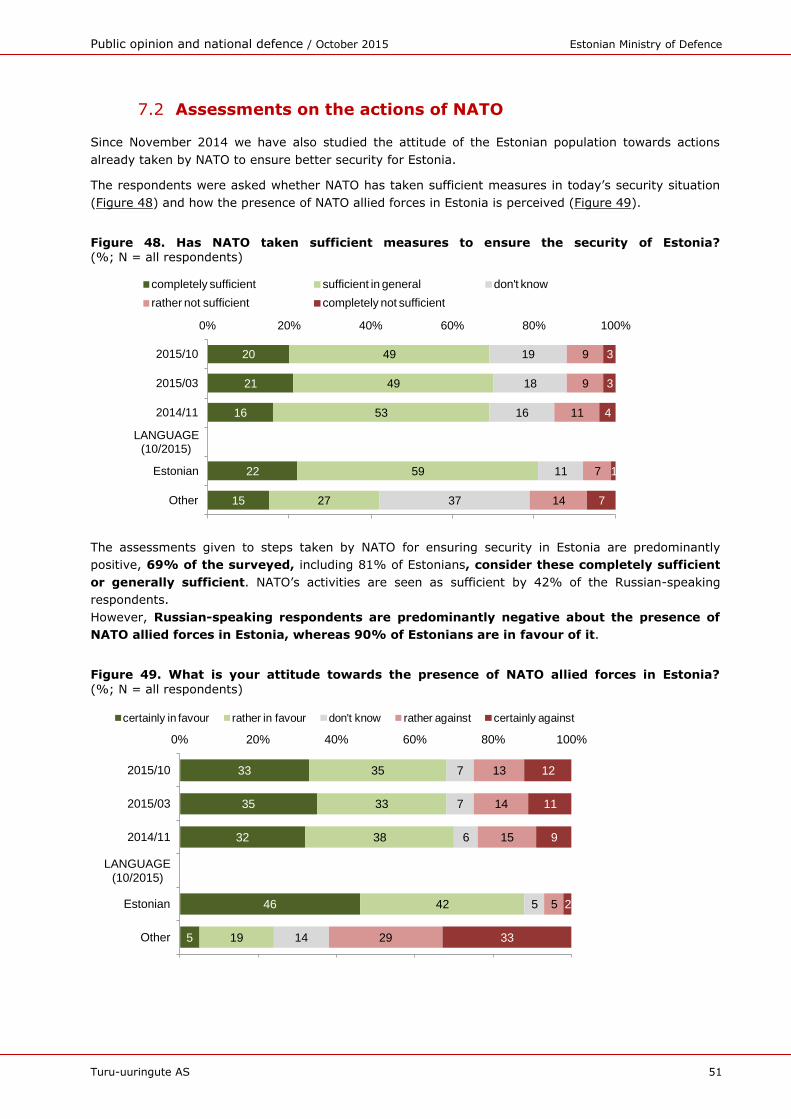
Public opinion and national defence / October 2015 Estonian Ministry of Defence
Turu-uuringute AS 51
7.2 Assessments on the actions of NATO
Since November 2014 we have also studied the attitude of the Estonian population towards actions
already taken by NATO to ensure better security for Estonia.
The respondents were asked whether NATO has taken sufficient measures in today’s security situation
(Figure 48) and how the presence of NATO allied forces in Estonia is perceived (Figure 49).
Figure 48. Has NATO taken sufficient measures to ensure the security of Estonia? (%; N = all respondents)
The assessments given to steps taken by NATO for ensuring security in Estonia are predominantly
positive, 69% of the surveyed, including 81% of Estonians, consider these completely sufficient
or generally sufficient. NATO’s activities are seen as sufficient by 42% of the Russian-speaking
respondents.
However, Russian-speaking respondents are predominantly negative about the presence of
NATO allied forces in Estonia, whereas 90% of Estonians are in favour of it.
Figure 49. What is your attitude towards the presence of NATO allied forces in Estonia?
(%; N = all respondents)
15
22
16
21
20
27
59
53
49
49
37
11
16
18
19
14
7
11
9
9
7
1
4
3
3
0% 20% 40% 60% 80% 100%
Other
Estonian
LANGUAGE (10/2015)
2014/11
2015/03
2015/10
completely sufficient sufficient in general don't know
rather not sufficient completely not sufficient
5
46
32
35
33
19
42
38
33
35
14
5
6
7
7
29
5
15
14
13
33
2
9
11
12
0% 20% 40% 60% 80% 100%
Other
Estonian
LANGUAGE (10/2015)
2014/11
2015/03
2015/10
certainly in favour rather in favour don't know rather against certainly against
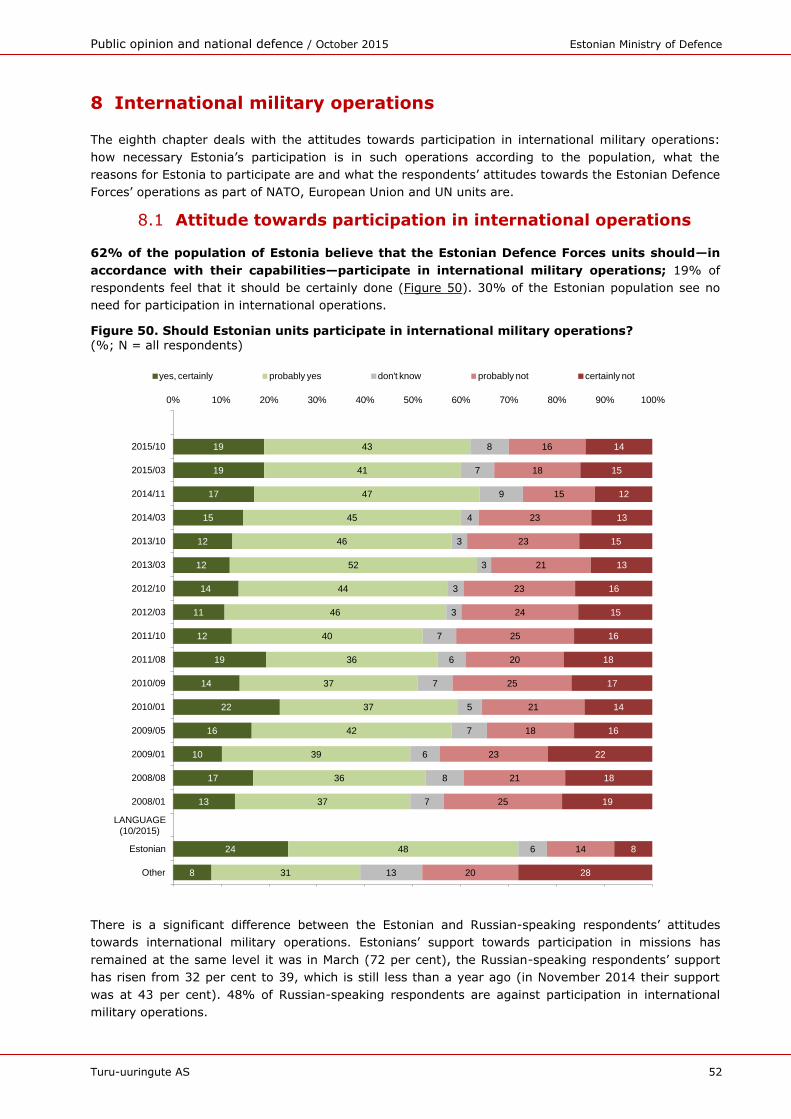
Public opinion and national defence / October 2015 Estonian Ministry of Defence
Turu-uuringute AS 52
8 International military operations
The eighth chapter deals with the attitudes towards participation in international military operations:
how necessary Estonia’s participation is in such operations according to the population, what the
reasons for Estonia to participate are and what the respondents’ attitudes towards the Estonian Defence
Forces’ operations as part of NATO, European Union and UN units are.
8.1 Attitude towards participation in international operations
62% of the population of Estonia believe that the Estonian Defence Forces units should—in
accordance with their capabilities—participate in international military operations; 19% of
respondents feel that it should be certainly done (Figure 50). 30% of the Estonian population see no
need for participation in international operations.
Figure 50. Should Estonian units participate in international military operations? (%; N = all respondents)
There is a significant difference between the Estonian and Russian-speaking respondents’ attitudes
towards international military operations. Estonians’ support towards participation in missions has
remained at the same level it was in March (72 per cent), the Russian-speaking respondents’ support
has risen from 32 per cent to 39, which is still less than a year ago (in November 2014 their support
was at 43 per cent). 48% of Russian-speaking respondents are against participation in international
military operations.
8
24
13
17
10
16
22
14
19
12
11
14
12
12
15
17
19
19
31
48
37
36
39
42
37
37
36
40
46
44
52
46
45
47
41
43
13
6
7
8
6
7
5
7
6
7
3
3
3
3
4
9
7
8
20
14
25
21
23
18
21
25
20
25
24
23
21
23
23
15
18
16
28
8
19
18
22
16
14
17
18
16
15
16
13
15
13
12
15
14
0% 10% 20% 30% 40% 50% 60% 70% 80% 90% 100%
Other
Estonian
LANGUAGE (10/2015)
2008/01
2008/08
2009/01
2009/05
2010/01
2010/09
2011/08
2011/10
2012/03
2012/10
2013/03
2013/10
2014/03
2014/11
2015/03
2015/10
yes, certainly probably yes don't know probably not certainly not
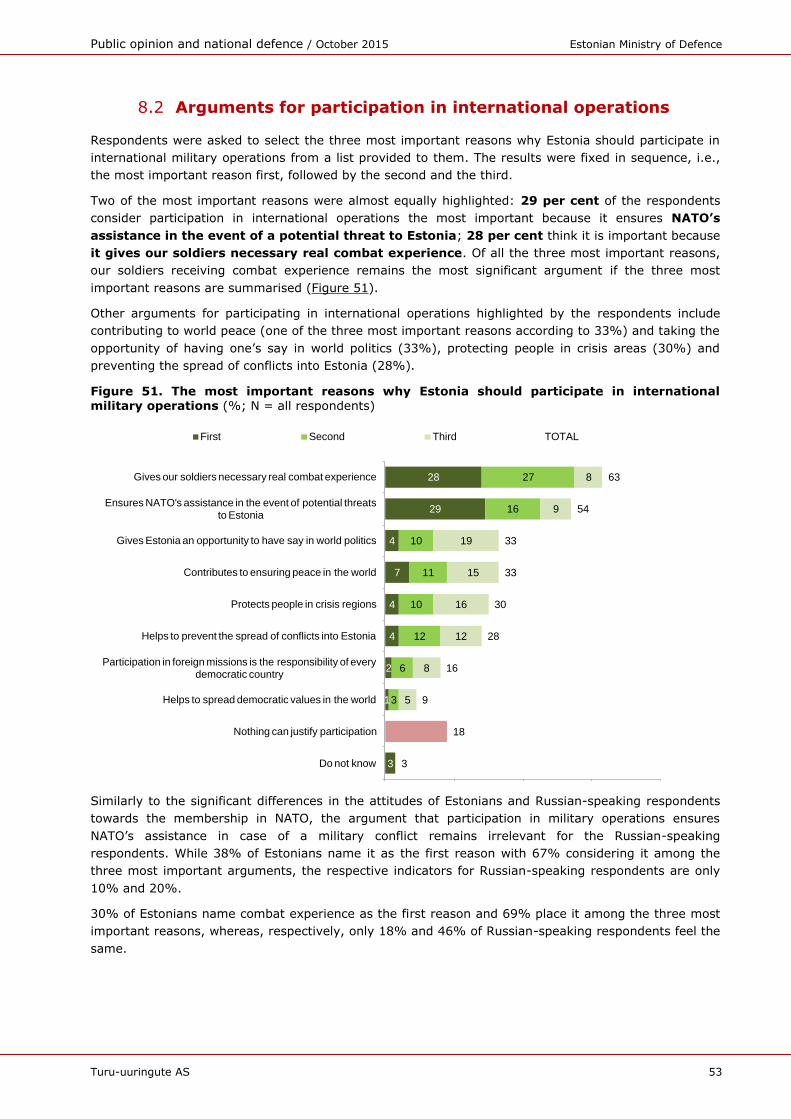
Public opinion and national defence / October 2015 Estonian Ministry of Defence
Turu-uuringute AS 53
8.2 Arguments for participation in international operations
Respondents were asked to select the three most important reasons why Estonia should participate in
international military operations from a list provided to them. The results were fixed in sequence, i.e.,
the most important reason first, followed by the second and the third.
Two of the most important reasons were almost equally highlighted: 29 per cent of the respondents
consider participation in international operations the most important because it ensures NATO’s
assistance in the event of a potential threat to Estonia; 28 per cent think it is important because
it gives our soldiers necessary real combat experience. Of all the three most important reasons,
our soldiers receiving combat experience remains the most significant argument if the three most
important reasons are summarised (Figure 51).
Other arguments for participating in international operations highlighted by the respondents include
contributing to world peace (one of the three most important reasons according to 33%) and taking the
opportunity of having one’s say in world politics (33%), protecting people in crisis areas (30%) and
preventing the spread of conflicts into Estonia (28%).
Figure 51. The most important reasons why Estonia should participate in international military operations (%; N = all respondents)
Similarly to the significant differences in the attitudes of Estonians and Russian-speaking respondents
towards the membership in NATO, the argument that participation in military operations ensures
NATO’s assistance in case of a military conflict remains irrelevant for the Russian-speaking
respondents. While 38% of Estonians name it as the first reason with 67% considering it among the
three most important arguments, the respective indicators for Russian-speaking respondents are only
10% and 20%.
30% of Estonians name combat experience as the first reason and 69% place it among the three most
important reasons, whereas, respectively, only 18% and 46% of Russian-speaking respondents feel the
same.
3
1
2
4
4
7
4
29
28
3
6
12
10
11
10
16
27
5
8
12
16
15
19
9
8
3
18
9
16
28
30
33
33
54
63
Do not know
Nothing can justify participation
Helps to spread democratic values in the world
Participation in foreign missions is the responsibility of every democratic country
Helps to prevent the spread of conflicts into Estonia
Protects people in crisis regions
Contributes to ensuring peace in the world
Gives Estonia an opportunity to have say in world politics
Ensures NATO's assistance in the event of potential threats to Estonia
Gives our soldiers necessary real combat experience
First Second Third TOTAL
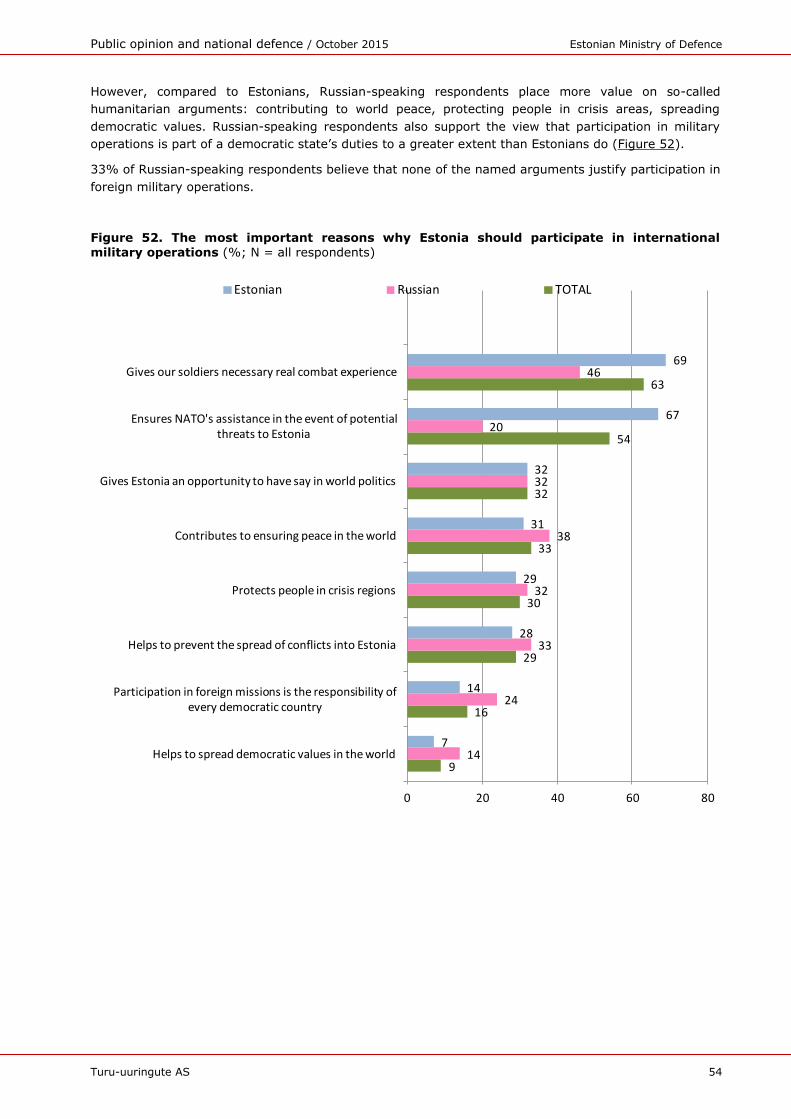
Public opinion and national defence / October 2015 Estonian Ministry of Defence
Turu-uuringute AS 54
However, compared to Estonians, Russian-speaking respondents place more value on so-called
humanitarian arguments: contributing to world peace, protecting people in crisis areas, spreading
democratic values. Russian-speaking respondents also support the view that participation in military
operations is part of a democratic state’s duties to a greater extent than Estonians do (Figure 52).
33% of Russian-speaking respondents believe that none of the named arguments justify participation in
foreign military operations.
Figure 52. The most important reasons why Estonia should participate in international
military operations (%; N = all respondents)
9
16
29
30
33
32
54
63
14
24
33
32
38
32
20
46
7
14
28
29
31
32
67
69
0 20 40 60 80
Helps to spread democratic values in the world
Participation in foreign missions is the responsibility of every democratic country
Helps to prevent the spread of conflicts into Estonia
Protects people in crisis regions
Contributes to ensuring peace in the world
Gives Estonia an opportunity to have say in world politics
Ensures NATO's assistance in the event of potential threats to Estonia
Gives our soldiers necessary real combat experience
Estonian Russian TOTAL
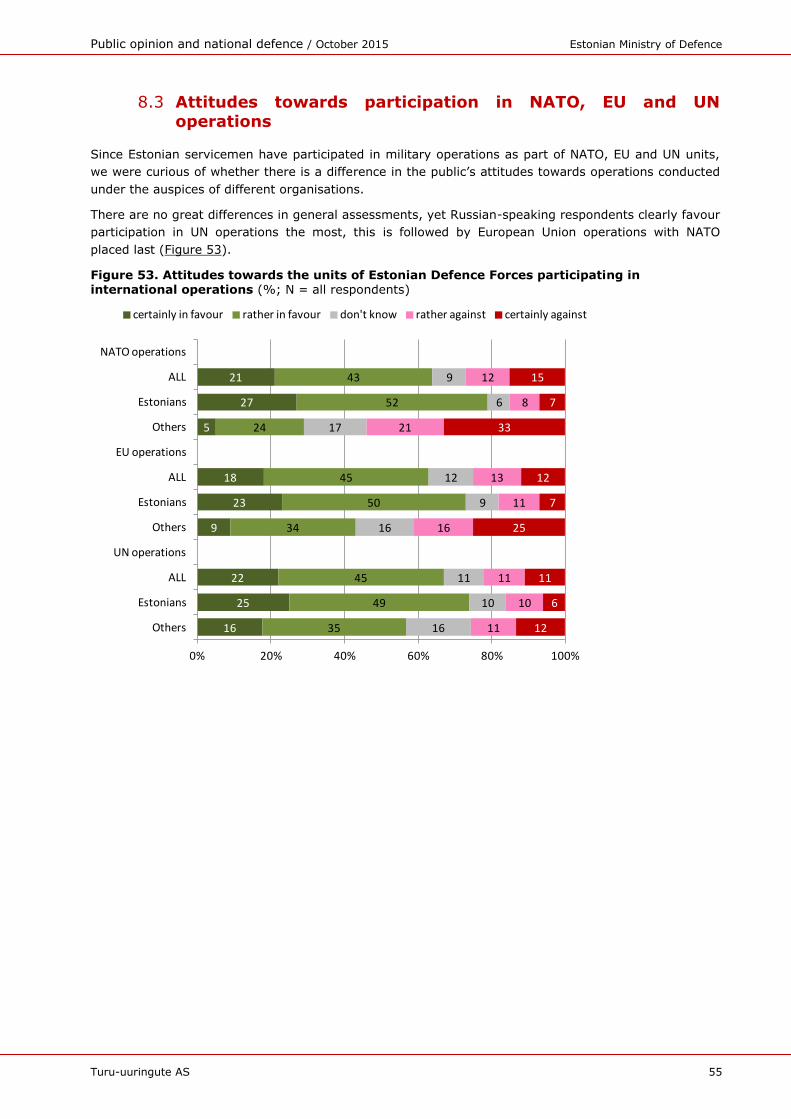
Public opinion and national defence / October 2015 Estonian Ministry of Defence
Turu-uuringute AS 55
8.3 Attitudes towards participation in NATO, EU and UN operations
Since Estonian servicemen have participated in military operations as part of NATO, EU and UN units,
we were curious of whether there is a difference in the public’s attitudes towards operations conducted
under the auspices of different organisations.
There are no great differences in general assessments, yet Russian-speaking respondents clearly favour
participation in UN operations the most, this is followed by European Union operations with NATO
placed last (Figure 53).
Figure 53. Attitudes towards the units of Estonian Defence Forces participating in international operations (%; N = all respondents)
16
25
22
9
23
18
5
27
21
35
49
45
34
50
45
24
52
43
16
10
11
16
9
12
17
6
9
11
10
11
16
11
13
21
8
12
12
6
11
25
7
12
33
7
15
0% 20% 40% 60% 80% 100%
Others
Estonians
ALL
UN operations
Others
Estonians
ALL
EU operations
Others
Estonians
ALL
NATO operations
certainly in favour rather in favour don't know rather against certainly against
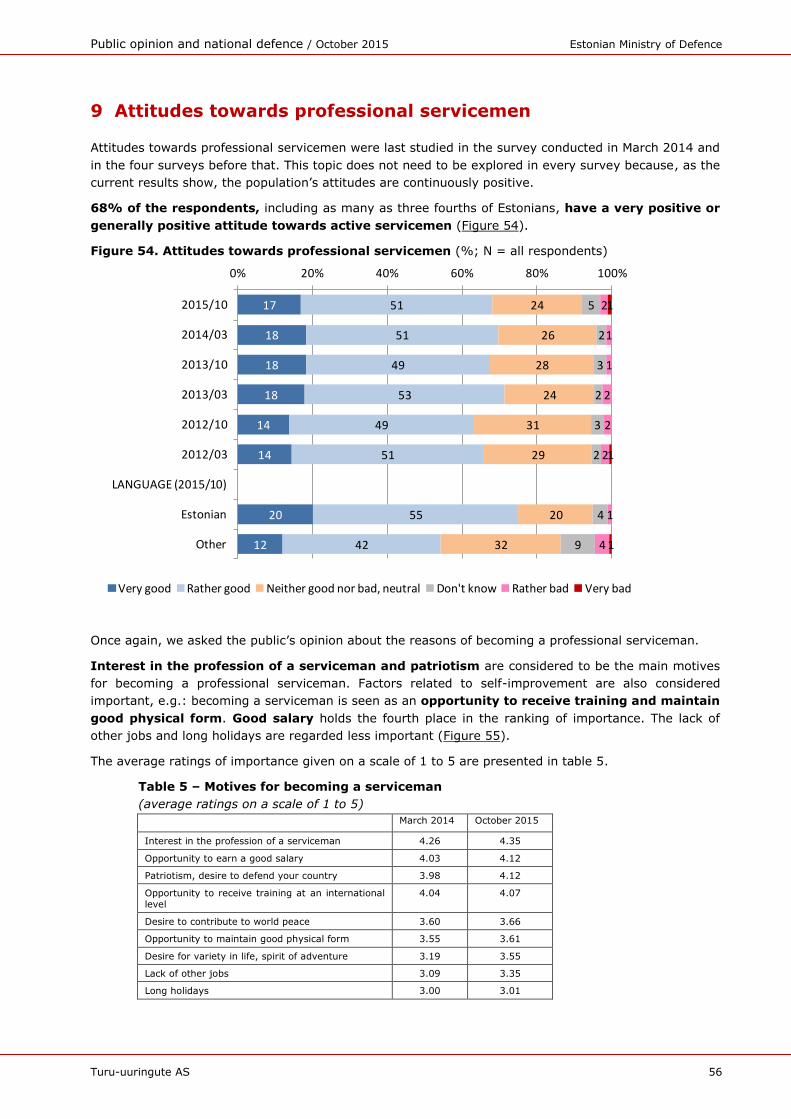
Public opinion and national defence / October 2015 Estonian Ministry of Defence
Turu-uuringute AS 56
9 Attitudes towards professional servicemen
Attitudes towards professional servicemen were last studied in the survey conducted in March 2014 and
in the four surveys before that. This topic does not need to be explored in every survey because, as the
current results show, the population’s attitudes are continuously positive.
68% of the respondents, including as many as three fourths of Estonians, have a very positive or
generally positive attitude towards active servicemen (Figure 54).
Figure 54. Attitudes towards professional servicemen (%; N = all respondents)
Once again, we asked the public’s opinion about the reasons of becoming a professional serviceman.
Interest in the profession of a serviceman and patriotism are considered to be the main motives
for becoming a professional serviceman. Factors related to self-improvement are also considered
important, e.g.: becoming a serviceman is seen as an opportunity to receive training and maintain
good physical form. Good salary holds the fourth place in the ranking of importance. The lack of
other jobs and long holidays are regarded less important (Figure 55).
The average ratings of importance given on a scale of 1 to 5 are presented in table 5.
Table 5 – Motives for becoming a serviceman
(average ratings on a scale of 1 to 5)
March 2014 October 2015
Interest in the profession of a serviceman 4.26 4.35
Opportunity to earn a good salary 4.03 4.12
Patriotism, desire to defend your country 3.98 4.12
Opportunity to receive training at an international level
4.04 4.07
Desire to contribute to world peace 3.60 3.66
Opportunity to maintain good physical form 3.55 3.61
Desire for variety in life, spirit of adventure 3.19 3.55
Lack of other jobs 3.09 3.35
Long holidays 3.00 3.01
17
18
18
18
14
14
20
12
51
51
49
53
49
51
55
42
24
26
28
24
31
29
20
32
5
2
3
2
3
2
4
9
2
1
1
2
2
2
1
4
1
1
1
0% 20% 40% 60% 80% 100%
2015/10
2014/03
2013/10
2013/03
2012/10
2012/03
LANGUAGE (2015/10)
Estonian
Other
Very good Rather good Neither good nor bad, neutral Don't know Rather bad Very bad
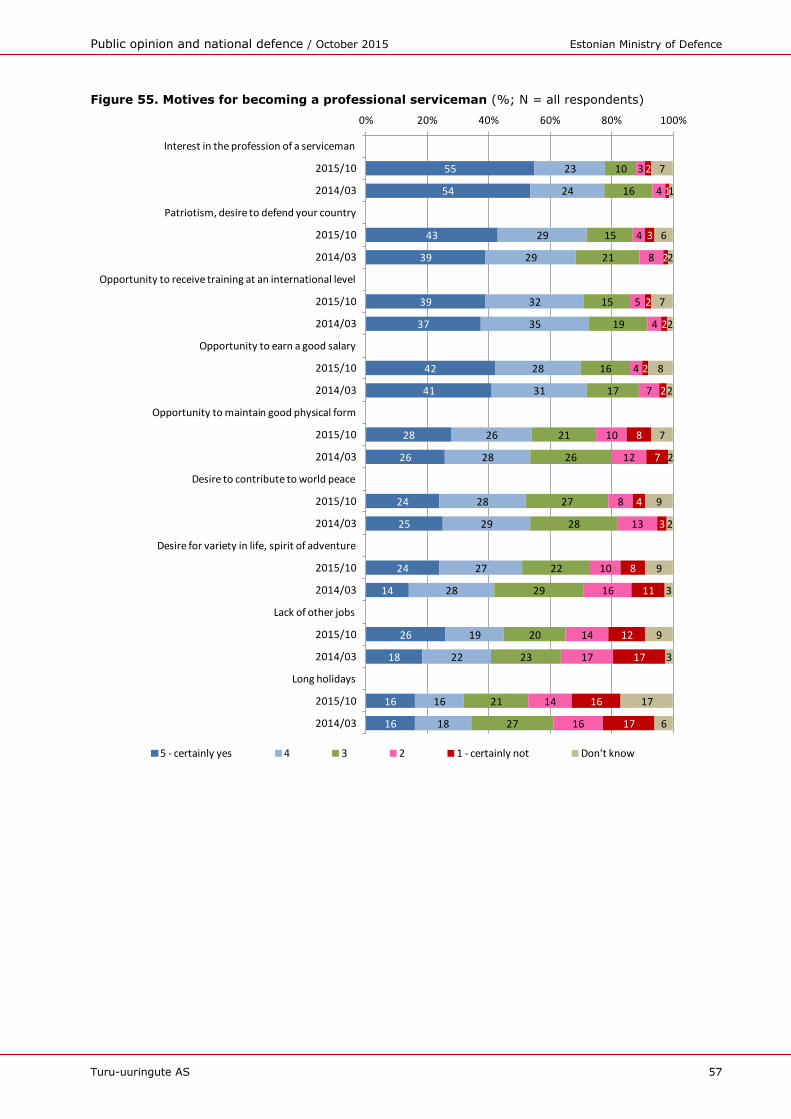
Public opinion and national defence / October 2015 Estonian Ministry of Defence
Turu-uuringute AS 57
Figure 55. Motives for becoming a professional serviceman (%; N = all respondents)
55
54
43
39
39
37
42
41
28
26
24
25
24
14
26
18
16
16
23
24
29
29
32
35
28
31
26
28
28
29
27
28
19
22
16
18
10
16
15
21
15
19
16
17
21
26
27
28
22
29
20
23
21
27
3
4
4
8
5
4
4
7
10
12
8
13
10
16
14
17
14
16
2
1
3
2
2
2
2
2
8
7
4
3
8
11
12
17
16
17
7
1
6
2
7
2
8
2
7
2
9
2
9
3
9
3
17
6
0% 20% 40% 60% 80% 100%
Interest in the profession of a serviceman
2015/10
2014/03
Patriotism, desire to defend your country
2015/10
2014/03
Opportunity to receive training at an international level
2015/10
2014/03
Opportunity to earn a good salary
2015/10
2014/03
Opportunity to maintain good physical form
2015/10
2014/03
Desire to contribute to world peace
2015/10
2014/03
Desire for variety in life, spirit of adventure
2015/10
2014/03
Lack of other jobs
2015/10
2014/03
Long holidays
2015/10
2014/03
5 - certainly yes 4 3 2 1 - certainly not Don't know
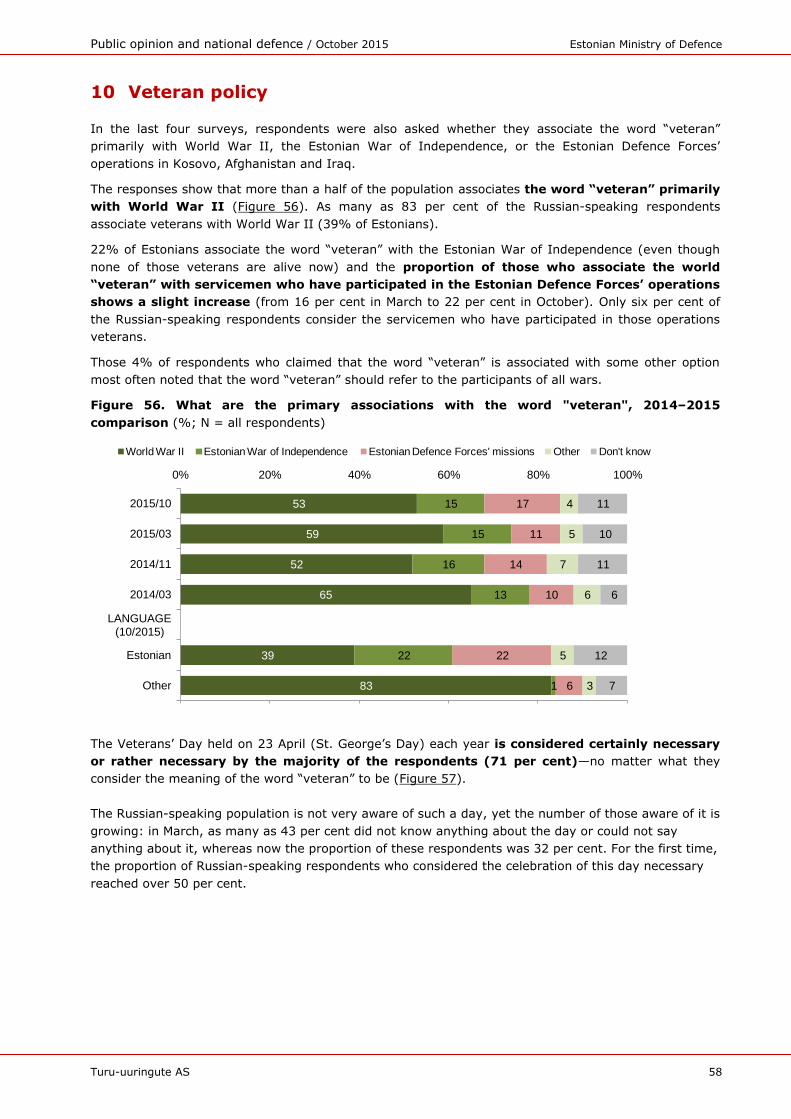
Public opinion and national defence / October 2015 Estonian Ministry of Defence
Turu-uuringute AS 58
10 Veteran policy
In the last four surveys, respondents were also asked whether they associate the word “veteran”
primarily with World War II, the Estonian War of Independence, or the Estonian Defence Forces’
operations in Kosovo, Afghanistan and Iraq.
The responses show that more than a half of the population associates the word “veteran” primarily
with World War II (Figure 56). As many as 83 per cent of the Russian-speaking respondents
associate veterans with World War II (39% of Estonians).
22% of Estonians associate the word “veteran” with the Estonian War of Independence (even though
none of those veterans are alive now) and the proportion of those who associate the world
“veteran” with servicemen who have participated in the Estonian Defence Forces’ operations
shows a slight increase (from 16 per cent in March to 22 per cent in October). Only six per cent of
the Russian-speaking respondents consider the servicemen who have participated in those operations
veterans.
Those 4% of respondents who claimed that the word “veteran” is associated with some other option
most often noted that the word “veteran” should refer to the participants of all wars.
Figure 56. What are the primary associations with the word "veteran", 2014–2015
comparison (%; N = all respondents)
The Veterans’ Day held on 23 April (St. George’s Day) each year is considered certainly necessary
or rather necessary by the majority of the respondents (71 per cent)—no matter what they
consider the meaning of the word “veteran” to be (Figure 57).
The Russian-speaking population is not very aware of such a day, yet the number of those aware of it is
growing: in March, as many as 43 per cent did not know anything about the day or could not say
anything about it, whereas now the proportion of these respondents was 32 per cent. For the first time,
the proportion of Russian-speaking respondents who considered the celebration of this day necessary
reached over 50 per cent.
83
39
65
52
59
53
1
22
13
16
15
15
6
22
10
14
11
17
3
5
6
7
5
4
7
12
6
11
10
11
0% 20% 40% 60% 80% 100%
Other
Estonian
LANGUAGE (10/2015)
2014/03
2014/11
2015/03
2015/10
World War II Estonian War of Independence Estonian Defence Forces' missions Other Don't know
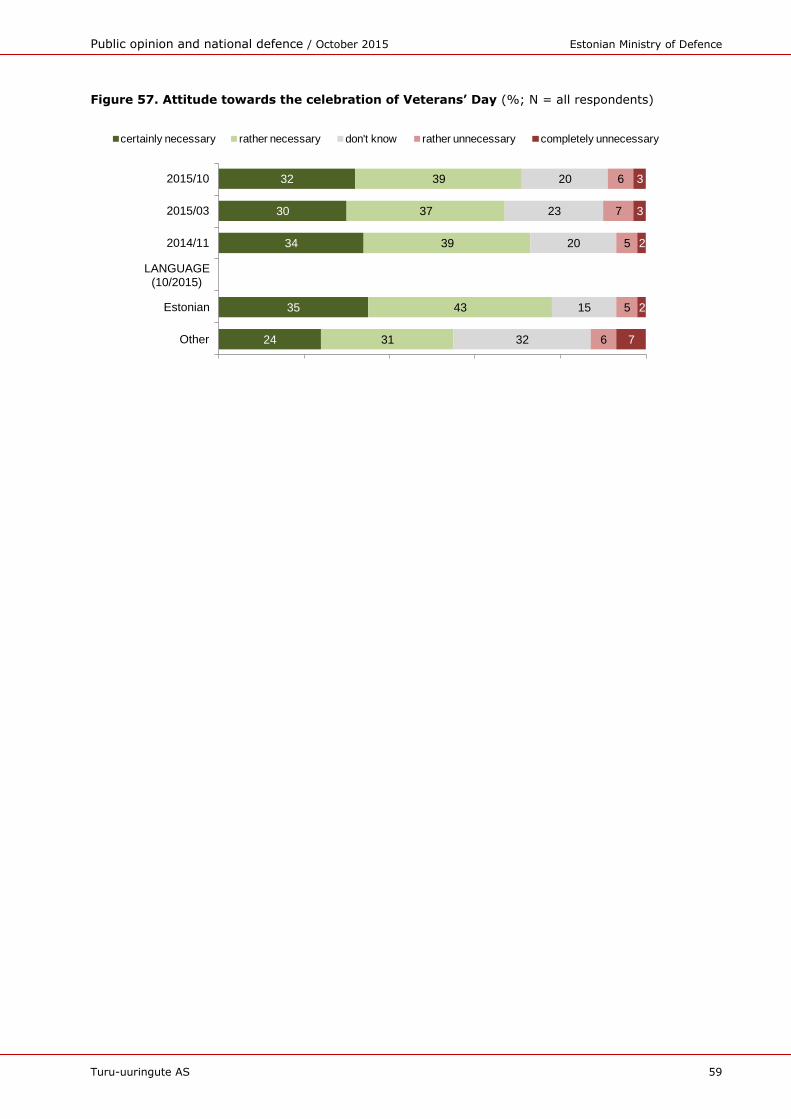
Public opinion and national defence / October 2015 Estonian Ministry of Defence
Turu-uuringute AS 59
Figure 57. Attitude towards the celebration of Veterans’ Day (%; N = all respondents)
24
35
34
30
32
31
43
39
37
39
32
15
20
23
20
6
5
5
7
6
7
2
2
3
3
Other
Estonian
LANGUAGE (10/2015)
2014/11
2015/03
2015/10
certainly necessary rather necessary don't know rather unnecessary completely unnecessary
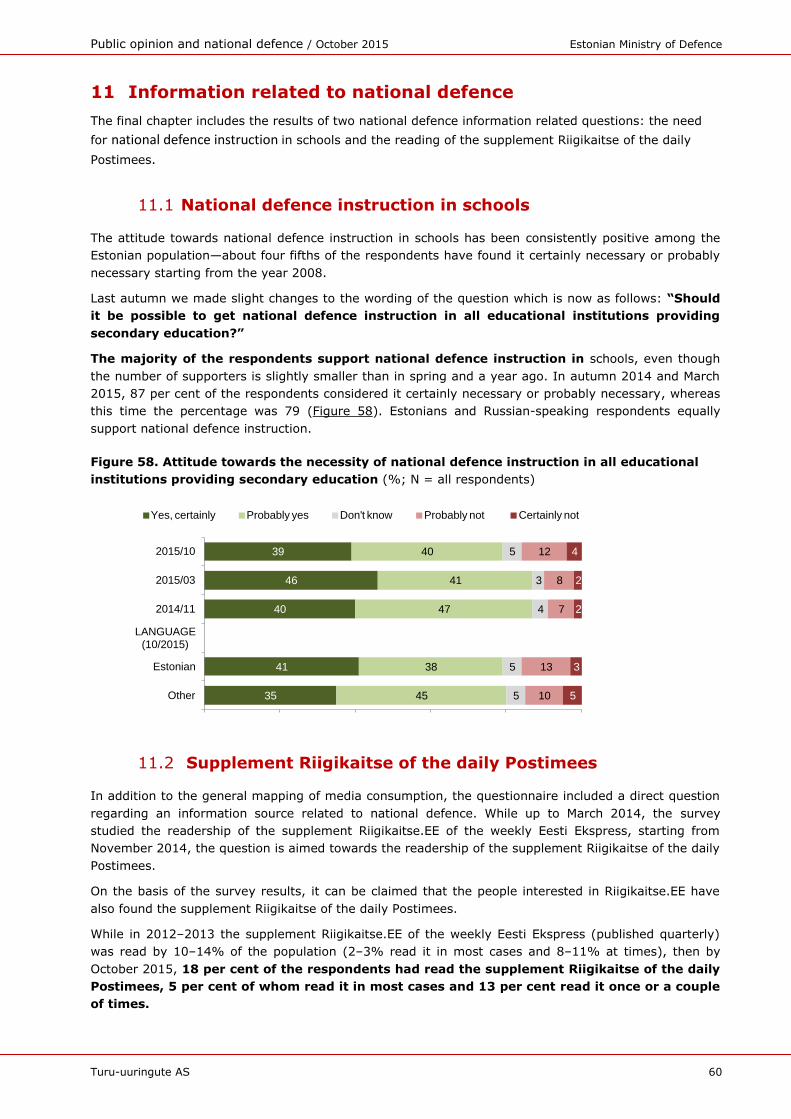
Public opinion and national defence / October 2015 Estonian Ministry of Defence
Turu-uuringute AS 60
11 Information related to national defence
The final chapter includes the results of two national defence information related questions: the need
for national defence instruction in schools and the reading of the supplement Riigikaitse of the daily
Postimees.
11.1 National defence instruction in schools
The attitude towards national defence instruction in schools has been consistently positive among the
Estonian population—about four fifths of the respondents have found it certainly necessary or probably
necessary starting from the year 2008.
Last autumn we made slight changes to the wording of the question which is now as follows: “Should
it be possible to get national defence instruction in all educational institutions providing
secondary education?”
The majority of the respondents support national defence instruction in schools, even though
the number of supporters is slightly smaller than in spring and a year ago. In autumn 2014 and March
2015, 87 per cent of the respondents considered it certainly necessary or probably necessary, whereas
this time the percentage was 79 (Figure 58). Estonians and Russian-speaking respondents equally
support national defence instruction.
Figure 58. Attitude towards the necessity of national defence instruction in all educational
institutions providing secondary education (%; N = all respondents)
11.2 Supplement Riigikaitse of the daily Postimees
In addition to the general mapping of media consumption, the questionnaire included a direct question
regarding an information source related to national defence. While up to March 2014, the survey
studied the readership of the supplement Riigikaitse.EE of the weekly Eesti Ekspress, starting from
November 2014, the question is aimed towards the readership of the supplement Riigikaitse of the daily
Postimees.
On the basis of the survey results, it can be claimed that the people interested in Riigikaitse.EE have
also found the supplement Riigikaitse of the daily Postimees.
While in 2012–2013 the supplement Riigikaitse.EE of the weekly Eesti Ekspress (published quarterly)
was read by 10–14% of the population (2–3% read it in most cases and 8–11% at times), then by
October 2015, 18 per cent of the respondents had read the supplement Riigikaitse of the daily
Postimees, 5 per cent of whom read it in most cases and 13 per cent read it once or a couple
of times.
35
41
40
46
39
45
38
47
41
40
5
5
4
3
5
10
13
7
8
12
5
3
2
2
4
Other
Estonian
LANGUAGE (10/2015)
2014/11
2015/03
2015/10
Yes, certainly Probably yes Don't know Probably not Certainly not
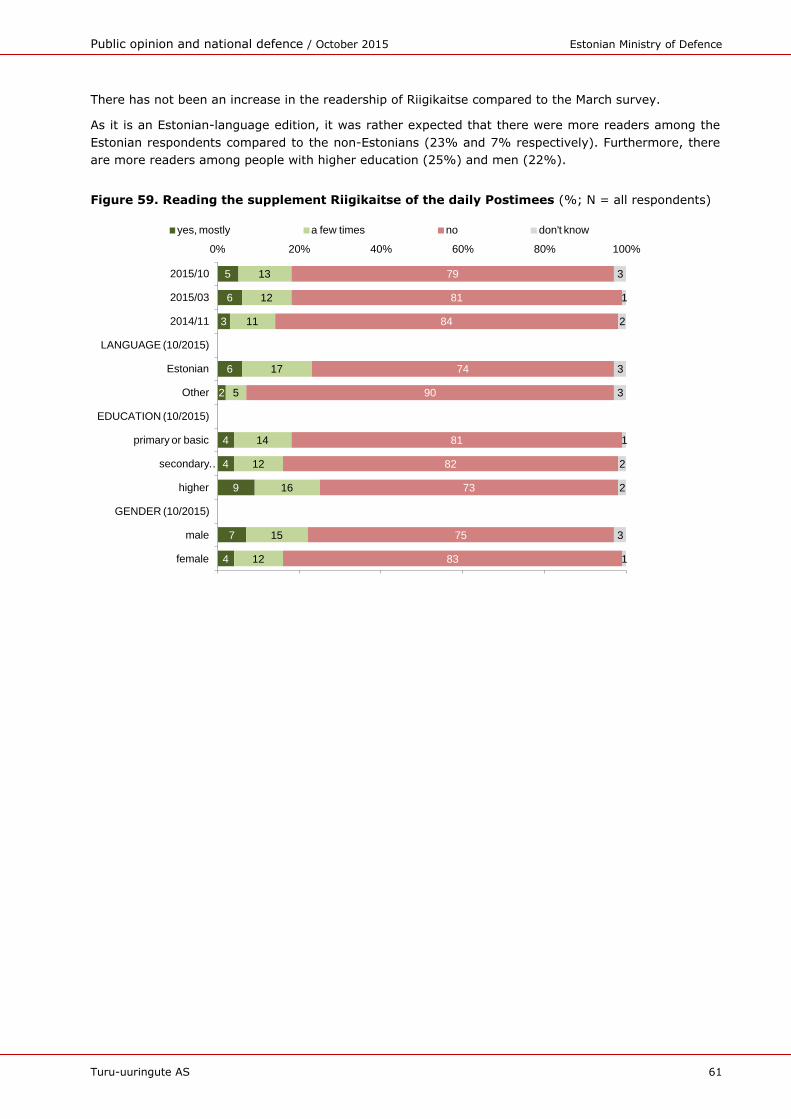
Public opinion and national defence / October 2015 Estonian Ministry of Defence
Turu-uuringute AS 61
There has not been an increase in the readership of Riigikaitse compared to the March survey.
As it is an Estonian-language edition, it was rather expected that there were more readers among the
Estonian respondents compared to the non-Estonians (23% and 7% respectively). Furthermore, there
are more readers among people with higher education (25%) and men (22%).
Figure 59. Reading the supplement Riigikaitse of the daily Postimees (%; N = all respondents)
4
7
9
4
4
2
6
3
6
5
12
15
16
12
14
5
17
11
12
13
83
75
73
82
81
90
74
84
81
79
1
3
2
2
1
3
3
2
1
3
0% 20% 40% 60% 80% 100%
female
male
GENDER (10/2015)
higher
secondary …
primary or basic
EDUCATION (10/2015)
Other
Estonian
LANGUAGE (10/2015)
2014/11
2015/03
2015/10
yes, mostly a few times no don't know
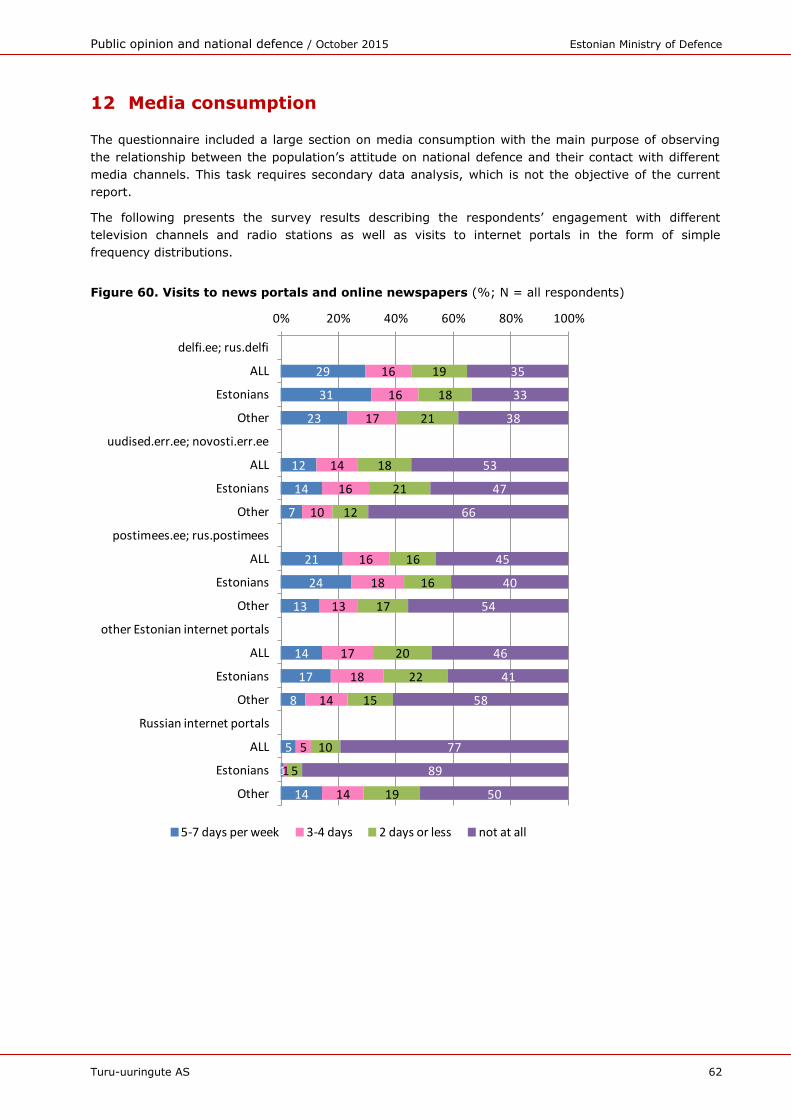
Public opinion and national defence / October 2015 Estonian Ministry of Defence
Turu-uuringute AS 62
12 Media consumption
The questionnaire included a large section on media consumption with the main purpose of observing
the relationship between the population’s attitude on national defence and their contact with different
media channels. This task requires secondary data analysis, which is not the objective of the current
report.
The following presents the survey results describing the respondents’ engagement with different
television channels and radio stations as well as visits to internet portals in the form of simple
frequency distributions.
Figure 60. Visits to news portals and online newspapers (%; N = all respondents)
29
31
23
12
14
7
21
24
13
14
17
8
5
1
14
16
16
17
14
16
10
16
18
13
17
18
14
5
1
14
19
18
21
18
21
12
16
16
17
20
22
15
10
5
19
35
33
38
53
47
66
45
40
54
46
41
58
77
89
50
0% 20% 40% 60% 80% 100%
delfi.ee; rus.delfi
ALL
Estonians
Other
uudised.err.ee; novosti.err.ee
ALL
Estonians
Other
postimees.ee; rus.postimees
ALL
Estonians
Other
other Estonian internet portals
ALL
Estonians
Other
Russian internet portals
ALL
Estonians
Other
5-7 days per week 3-4 days 2 days or less not at all
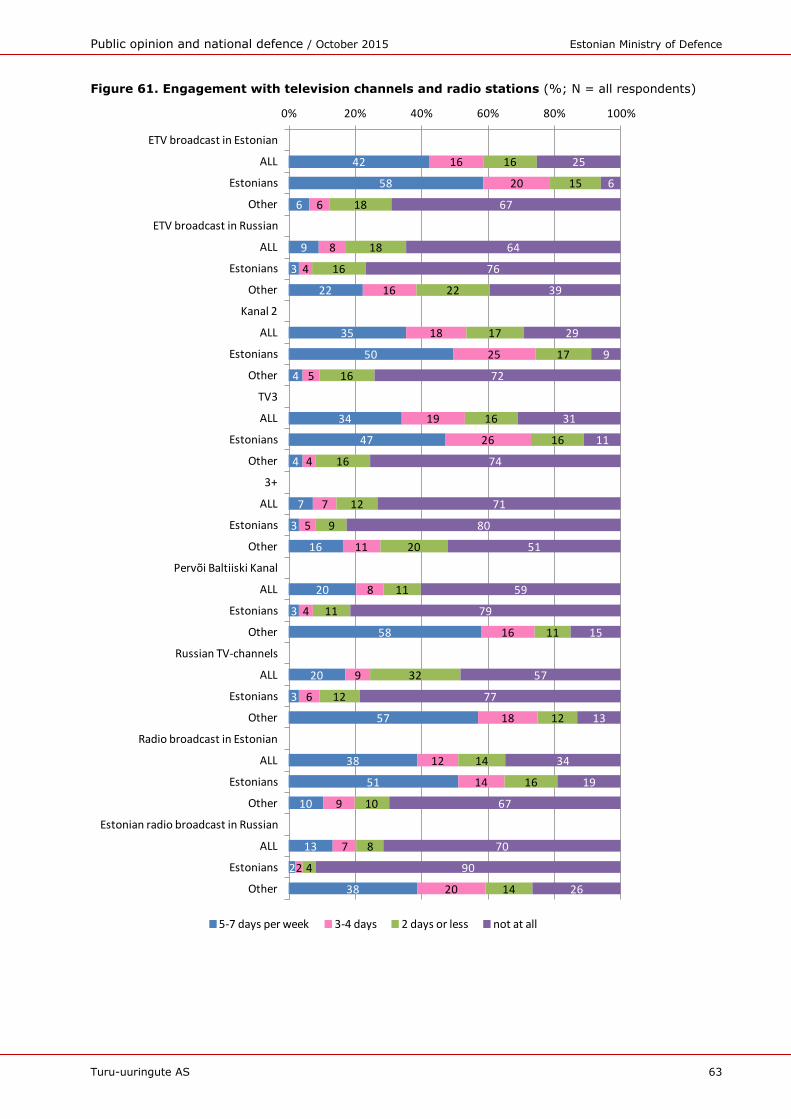
Public opinion and national defence / October 2015 Estonian Ministry of Defence
Turu-uuringute AS 63
Figure 61. Engagement with television channels and radio stations (%; N = all respondents)
42
58
6
9
3
22
35
50
4
34
47
4
7
3
16
20
3
58
20
3
57
38
51
10
13
2
38
16
20
6
8
4
16
18
25
5
19
26
4
7
5
11
8
4
16
9
6
18
12
14
9
7
2
20
16
15
18
18
16
22
17
17
16
16
16
16
12
9
20
11
11
11
32
12
12
14
16
10
8
4
14
25
6
67
64
76
39
29
9
72
31
11
74
71
80
51
59
79
15
57
77
13
34
19
67
70
90
26
0% 20% 40% 60% 80% 100%
ETV broadcast in Estonian
ALL
Estonians
Other
ETV broadcast in Russian
ALL
Estonians
Other
Kanal 2
ALL
Estonians
Other
TV3
ALL
Estonians
Other
3+
ALL
Estonians
Other
Pervõi Baltiiski Kanal
ALL
Estonians
Other
Russian TV-channels
ALL
Estonians
Other
Radio broadcast in Estonian
ALL
Estonians
Other
Estonian radio broadcast in Russian
ALL
Estonians
Other
5-7 days per week 3-4 days 2 days or less not at all
Public opinion and national defence / October 2015 Estonian Ministry of Defence
Turu-uuringute AS 64
ANNEXES
1 Questionnaire
2 Summary tables on responses
3 Frequency tables with the responses of Estonians
4 Frequency tables with the responses of non-Estonians