Public Health Surveillance: Policy Case Studies …...Public Health Surveillance: Policy Case...
59
Public Health Surveillance: Policy Case Studies July 2004 Lynn R. Goldman, MD, MPH
Transcript of Public Health Surveillance: Policy Case Studies …...Public Health Surveillance: Policy Case...

Public Health Surveillance: Policy Case Studies
July 2004
Lynn R. Goldman, MD, MPH

Why Track the Leading Indicators of Public Health?
• Monitor of status and trends of health and conditions that impact health
• Develop interventions to promote health
• Build core capacity to respond to problems

HEAT RELATED MORTALITY

Number of heat-related deaths, and heat index, by date — Chicago, July 11–27,
1995
MMWR: Vol. 44 / No. 31 , 1995

Rate of heat-related deaths, by age group — United States, 1979–1998
(CDC MMWR)

CHILDHOOD LEAD POISONING
Year
1974 1976 1978 1980 1982 1984 1986 1988 1990 1992
Mean bloodlead (μg/dL) Blood lead
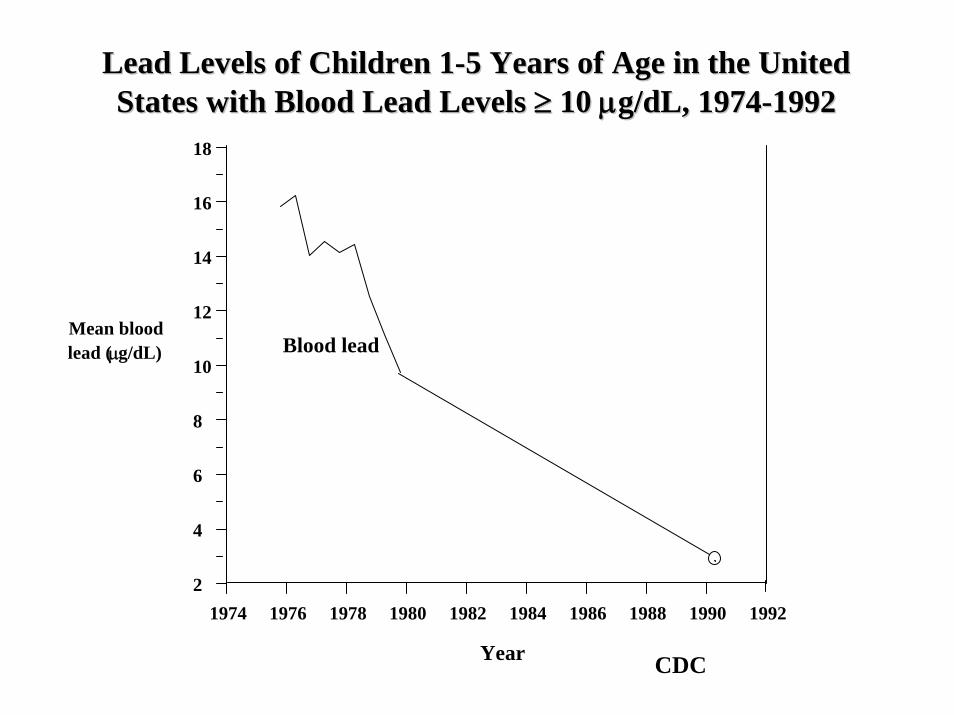
Lead Levels of Children 1Lead Levels of Children 1--5 Years of Age in the United 5 Years of Age in the United States with Blood Lead Levels States with Blood Lead Levels ≥≥ 10 10 μμg/dL, 1974g/dL, 1974--19921992
2
4
6
8
10
12
14
16
18
CDC

Prevalence of Childhood Lead Poisoning in the United Statesby Housing and Demographic Characteristics, 1991 - 1994
Before1946
1946 to1973
After1973
Black,non-
Hispanic
Mexican-American
White,non-
Hispanic
0
4
8
12
16
20
24
Year Housing Year Housing BuiltBuilt
Race/Ethnicity Race/Ethnicity forfor
Houses Built Houses Built Before 1946Before 1946
8.6
4.6
1.6
21.9
13.0
5.6
Perc
enta
ge o
f Chi
ldre
n 1
Perc
enta
ge o
f Chi
ldre
n 1 --
5 Y
ears
5 Y
ears
with
BL
Ls
with
BL
Ls ≥≥
1010μμ g
/dL
g/dL
Source: NHANES III, Phase 2

TOXIC SHOCK SYNDROME

Toxic Shock Syndrome CasesUnited States, 1979-1996
CDC

ASTHMA

Asthma• Rates have increased 75% since 1980
• Affects about 17 million people - including nearly 5 million children
• Cost the economy $14.5 billion last year

Asthma Prevalence and Mortality for Children and Young Adults, 1960-1995
0
1
2
3
4
5
6
7
8
1960
-196
2+
1963
-196
5
1966
-196
7
1968
-197
1+
1972
-197
4
1975
-197
8
1979
-198
0+
1981
-198
3
1984
-198
6
1987
-198
9
1990
-199
2
1993
-199
5
Dea
ths/
mill
ion
0
10
20
30
40
50
60
70
80
Prev
alen
ce/th
ousa
nd
Age 0-4 deaths Age 5-14 deaths Age 15-34 deathsAge 0-4 prev Age 5-34 prev Age 15-34 prev
National Health Interview Survey
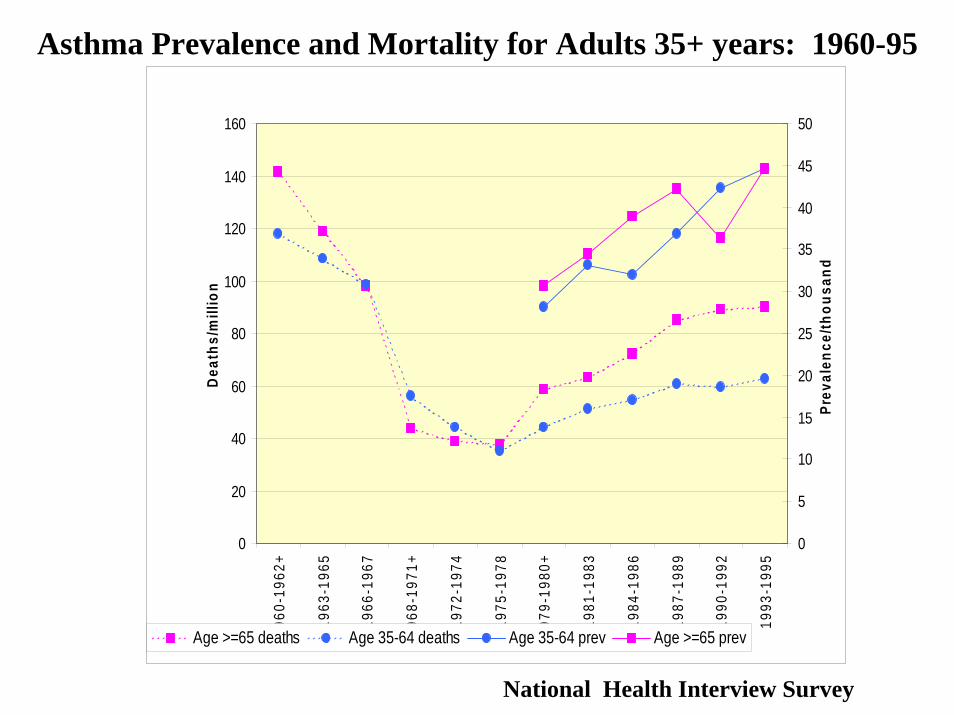
Asthma Prevalence and Mortality for Adults 35+ years: 1960-95
0
20
40
60
80
100
120
140
160
1960
-196
2+
1963
-196
5
1966
-196
7
1968
-197
1+
1972
-197
4
1975
-197
8
1979
-198
0+
1981
-198
3
1984
-198
6
1987
-198
9
1990
-199
2
1993
-199
5
Dea
ths/
mill
ion
0
5
10
15
20
25
30
35
40
45
50
Prev
alen
ce/th
ousa
nd
Age >=65 deaths Age 35-64 deaths Age 35-64 prev Age >=65 prev
National Health Interview Survey

Asthma projected rates of increase, 1995, 2010, 2020Projected increase in rate of self reported asthma: 1995-2020
0.00
0.02
0.04
0.06
0.08
0.10
0.12
0.14
0.16
0.18
0.20
<5 5 to 14 15-34 35-64 65-74 75+
Rat
e
199520102020
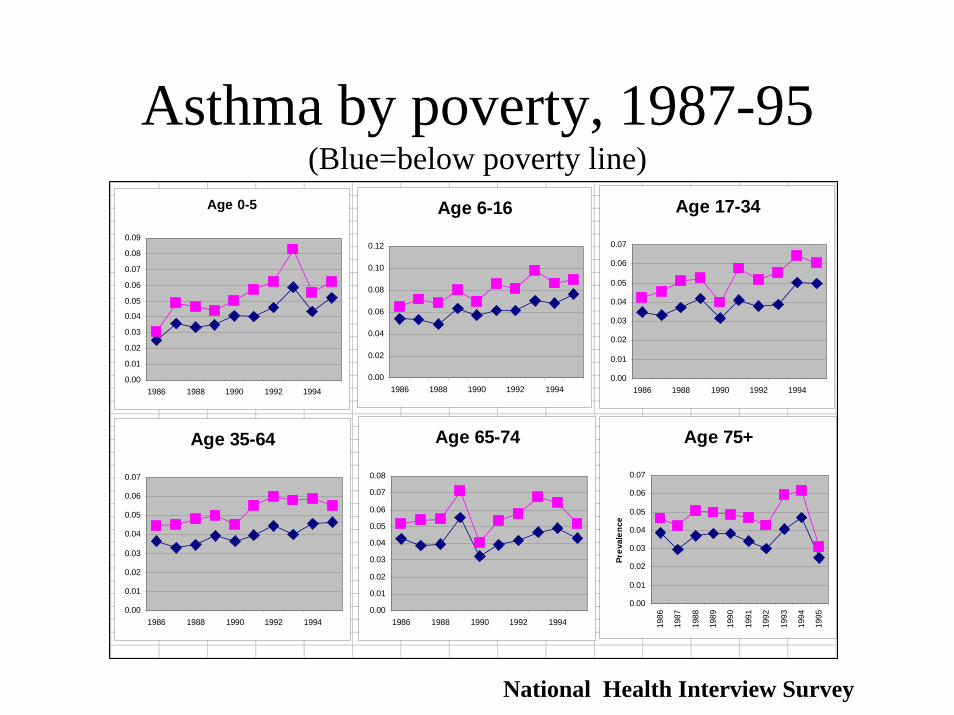
Asthma by poverty, 1987-95 (Blue=below poverty line)
Age 0-5
0.00
0.01
0.02
0.03
0.04
0.05
0.06
0.07
0.08
0.09
1986 1988 1990 1992 1994
Age 6-16
0.00
0.02
0.04
0.06
0.08
0.10
0.12
1986 1988 1990 1992 1994
Age 17-34
0.00
0.01
0.02
0.03
0.04
0.05
0.06
0.07
1986 1988 1990 1992 1994
Age 35-64
0.00
0.01
0.02
0.03
0.04
0.05
0.06
0.07
1986 1988 1990 1992 1994
Age 65-74
0.00
0.01
0.02
0.03
0.04
0.05
0.06
0.07
0.08
1986 1988 1990 1992 1994
Age 75+
0.00
0.01
0.02
0.03
0.04
0.05
0.06
0.07
1986
1987
1988
1989
1990
1991
1992
1993
1994
1995
Prev
alen
ce
National Health Interview Survey

Asthma NHIS Data (1987-95)Asthma Prevalence, Logistic Regression, Age 0-5
0.10
1.00
10.00
His
pani
c
Bla
ck
Oth
er
MS
A,o
ther
Non
-MS
A
Sou
thea
st
Mid
wes
t
Wes
t
Q2
Q3
Q4
Fem
ale
<Pov
erty
Age
Fam
size
< H
S
<Col
lege
Yea
r
Odd
s R
atio
and
95%
CL

DIABETES

Diabetes
Prevalence of Diabetes Among Adults, United States, BRFSS, 1990
<4% 4–6% >6%

Prevalence of Diabetes Among AdultsUnited States, BRFSS, 1993–1994
<4% 4–6% >6%

Prevalence of Diabetes Among AdultsUnited States, BRFSS, 1999
<4% 4–6% >6%

Why an increase in diabetes?
• Increased diagnosis• “Thrifty genotype” theory (e.g., “fat” mouse• Thrifty phenotype (low birthweight, early
deprivation, possibly arsenic and dioxins)• Epidemic of obesity and sedentary lifestyle (which
in turn relates to land use)• Environmental agents (dioxins and arsenic)
dz3

Slide 22
dz3 more verbagedzerbe, 1/20/2005

REYE’S SYNDROME
1974
1975
1976
1977
1978
1979
1980
1981
1982
1983
1984
1985
1986
1987
1988
1989
Year of Death
0
100
200
300
400
500
600
Dea
ths
repo
rted
0
0.1
0.2
0.3
0.4
0.5
0.6
0.7
0.8
0.9
1
Inci
denc
e pe
r 100
0
All Cases
+ Varicella
Incidence
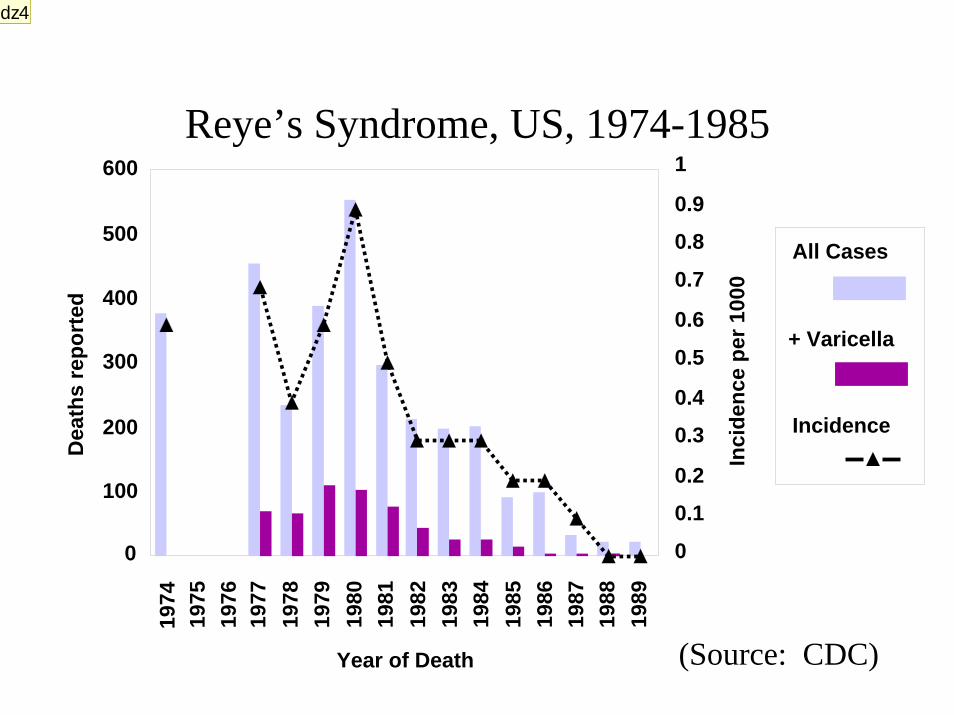
Reye’s Syndrome, US, 1974-1985
(Source: CDC)
dz4

Slide 24
dz4 I guess this is about giving children asperindzerbe, 1/20/2005

LOW BIRTHWEIGHT

NCHS data
Trends: Low Birthweight
• Since the 1980s, rates of low birthweight (LBW) and preterm birth have been increasing steadily in the US
• Among singleton births, LBW has increased 4% and very low birthweight (VLBW) 7% since 1989
• Among 20-34 year old mothers of singleton births, LBW increased 2.2% and VLBW 5.9% from 1990-97
Trends: Preterm Birth
• Among singleton births, rates of moderately preterm births (32-36 weeks) have increased 14% since 1989
• CDC reported that after taking into account a number of risk factors (age of mother, prenatal care, marital status) there was a 4.6% increase in preterm birth in white non-Hispanic infants between 1989-96
dz5

Slide 27
dz5 comments on whydzerbe, 1/20/2005

BIRTH DEFECTS
Trends: Birth Defects
• Atrial Septal Defect– Prevalence of ASD for all states
combined rose 148% from 1989 to 1996– Of the 13 states with at least four years of
data, nine showed statistically significant positive linear trends

Atrial Septal DefectATRIAL SEPTAL DEFECT
PR
EVAL
ENC
E pe
r 10,
000
YEAR
AK
0
50
100
150AR AZ CO GA
HI
0
50
100
150IA IL MA MO
NC
0
50
100
150NE NJ NM NY
89 90 91 92 93 94 9596OK
89 90 91 92 93 94 95960
50
100
150TN
89 90 91 92 93 94 9596
VA
89 90 91 92 93 94 9596
WI
89 90 91 92 93 94 9596

Trends: Birth Defects
• Obstructive Genitourinary Defect– Prevalence of OGD for all states combined rose
60% from 1989 to 1996.– Of the 14 states with at least four years of data,
eight showed statistically significant positive linear trends

Obstructive Genitourinary DefectOBSTRUCTIVE GENITOURINARY DEFECT
PREV
ALEN
CE
per
10,
000
YEAR
AK
0
10
20
30AR AZ CA CO
CT
0
10
20
30
GA HI IA IL
MA
0
10
20
30
MO NC NE NJ
NY
89 90 91 92 93 94 95960
10
20
30
OK
89 90 91 92 93 94 9596
TN
89 90 91 92 93 94 9596
VA
89 90 91 92 93 94 9596
WI
89 90 91 92 93 94 9596
What does it mean?
• Are these true increases or related improved ascertainment and diagnostic techniques or some other factors?
• Do the current surveillance systems in place give us the information to come up with an answer?

Surveillance Efforts
• No national system exists to track and report trends in birth defects
• As of 1999, 33 states had birth defects registries with different structures
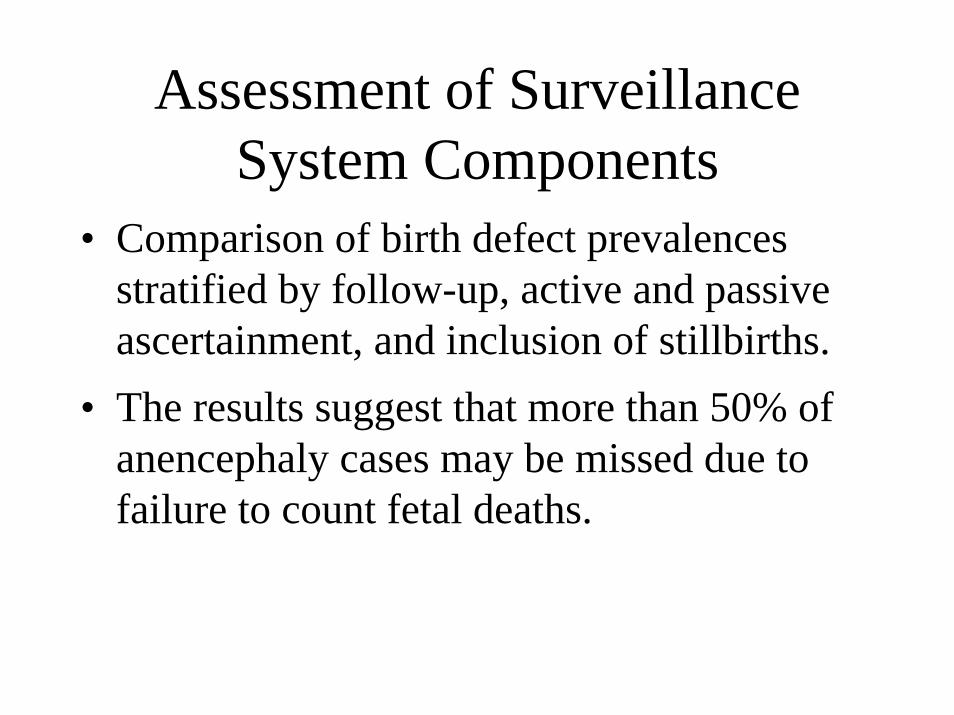
Assessment of Surveillance System Components
• Comparison of birth defect prevalencesstratified by follow-up, active and passive ascertainment, and inclusion of stillbirths.
• The results suggest that more than 50% of anencephaly cases may be missed due to failure to count fetal deaths.

Table 7: Average state birth defect rates (per 10,000 births) 1989-1996 byfollow-up category for selected birth defects.
Birth Defect Ascertainmentat birth
Follow-up pastbirth
Percentdifference
Down Syndrome 6.7 (n=4) 10.6 (n=25) +57%
Rectal and largeintestinalatresia/stenosis
1.4 (n=3) 4.2 (n=24) +206%
Renal agenesis/hypoplasia
1.8 (n=3) 4.6 (n=23) +159%
Spina bifida 2.4 (n=3) 4.3 (n=25) +79%
Note: Includes the three states with birth certificate data.
Follow-up

Active vs. PassiveTable 8: Average birth defect rates (per 10,000 births) 1989-1996 for states withpassive and active surveillance systems for selected birth defects.
Birth Defect Passive Active Percent difference
Anencephaly 1.7 (n=15) 2.8 (n=11) +62%
Obstructivegenitourinarydefect
12.0 (n=12) 16.0 (n=8) +33%
Renal agenesis 2.8 (n=14) 7.2 (n=10) +160%
Atrial septaldefect
23.6 (n=12) 45.7 (n=7) +94%
Transposition ofgreat arteries
3.0 (n=13) 4.3 (n=9) +45%
Tricuspid valveatresiaand stenosis
1.6 (n=13) 15.7 (n=7) +870%

Key Components of a Surveillance System
• Follow-up of the newborn past birth• Active vs. passive surveillance• Inclusion of stillbirths• Timeliness• Analytic capability• Comprehensiveness

CANCER

Trends in USA: 1973-1998
Based on Surveillance, Epidemiology and End Results (SEER) Data
Ann
ual I
ncid
ence
per
100
,000
Ann
ual I
ncid
ence
per
100
,000
Trend in age-adjusted annual incidence for NHLTrend in age-adjusted annual incidence for NHLYearYear
19701970 19801980 19901990 2000200000
55
1010
1515
2020
2525 All Males All Males
All Females All Females
dz6

Slide 40
dz6 Non Hodgkins Lymphomadzerbe, 1/20/2005

Clues for the Causes of the Rise
• Similar increasing pattern (3~4% annual increase) all over world
• Incidence higher in developed areas, e.g., USA and Europe
• The rise is real, as opposed to purely artifactual as a result of, e.g., – Increased detection– Change in classification
• Only a part of increase is due to HIV

NHL Mortality MAP for USA

www.Health-Track.org

www.Health-Track.org

Farming-related Exposures
• Higher incidence for mid-west states• Farming as occupation increases risk
(RR of 1.1 in a meta-analysis)• Farming related to various potentially
causal exposures to– Pesticides– Zoonotic viruses– Diesel exhaust – Sunlight– Hay/Dust– Healthy life style, etc

Pesticides
• Phenoxy herbicides (2,4-D, 2,4,5-T, etc)– Agent orange (largely negative)– Dioxin as a contaminant
• RR=2.6 in manufacturing workers• Increasing exposure-response relationship in farmers
• Triazine herbicides (largely negative)• Organochlorines
– Chlordane remains suspected– DDT & chlordane (effects diminishes after
considering other pesticides)

Other Persistent Chemicals
• Organophosphates & carbamates– Positive epidemiological studies– Immunotoxicity from animal studies
• PCB – mixed results w/ a positive study of high qual.
• PBB (one positive study)• Dioxins (Large Occup. Cohort, Seveso)• Polybrominated Diphenyl Ether (PBDE)
– Used as flame retardant for plastics and fabrics– one positive study

TEQ
(pg/
g fa
t)
Year
PB
DE
(pg/
g fa
t)
1970 1980 1990 20000
20
40
60
80100
0
1000
2000
3000
4000
DD
DDDD
D
D
D P
P
P
PP
PPP
Dioxins PBDE <===== ====>
Human breast milk monitoring results for Sweden reported by Noren & Meironyte (2000)
Polybrominated Diphenyl Ether (PBDE)

Other Environmental Exposures
• Solvents (mixed results)– trichloroethylene, tetrachloroethylene, benzene
(controversial), other solvents, painter as occupation
• Wood dusts & wood-related work– Potential roles of chlorinated phenol wood
preservatives
• Nitrate in groundwater– Connection with use of fertilizer
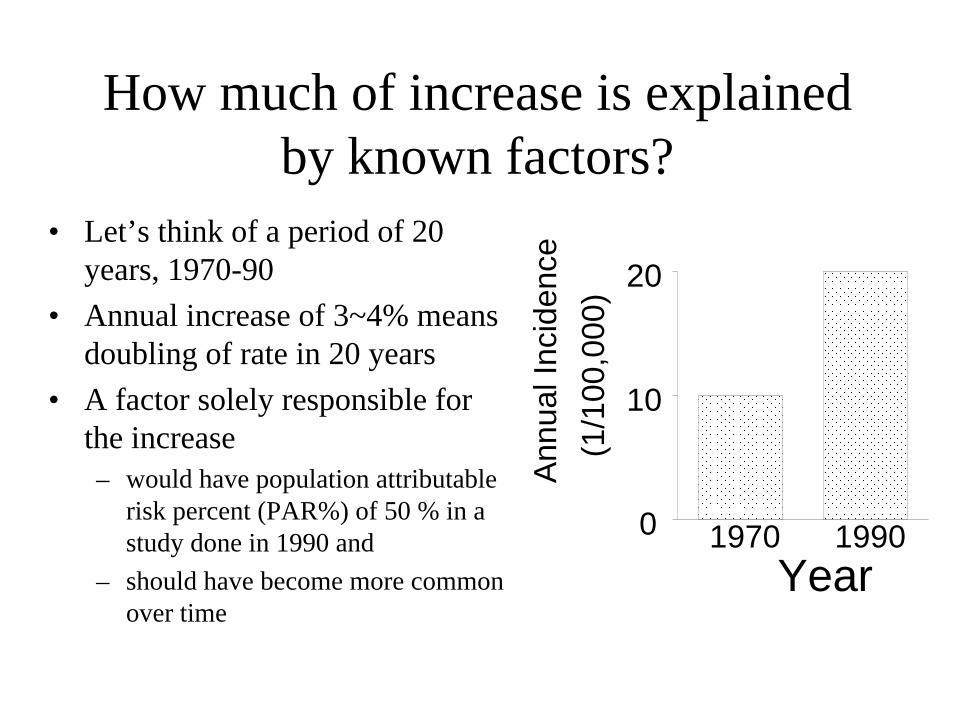
How much of increase is explained by known factors?
• Let’s think of a period of 20 years, 1970-90
• Annual increase of 3~4% means doubling of rate in 20 years
• A factor solely responsible for the increase– would have population attributable
risk percent (PAR%) of 50 % in a study done in 1990 and
– should have become more common over time
Ann
ual I
ncid
ence
(1/1
00,0
00)
Year0
10
20
1970 1990

How much of increase is explained by known factors? (cont’d)
• Some environmental exposures were consistently associated with NHL across studies
• Each of them accounts only up to about 10 % of the risk in each study
• In a single study, only one or a few of them considered
• Prevalence of some factors, e.g., farming, has decreased
• Taken together, the known/suspected factors can explain only a part of increase
Other aspects of suspected or known risk factors/exposures
• Disruption of immune system confer high risk– HIV(RR~200)– Immunosuppressive therapies (RR~50)– Involvement of Epstein-Barr virus (EBV)
• Some pesticide “suspects” also are immunotoxic
• Some agents found in occupational setting as well as in non-occupational setting, e.g.,– Persistent chemicals in diet– Herbicides for crops and lawn– Solvents

Policy issues• “Epidemic” detected• Policy development
– Identify and reduce toxic exposure – Some basis for reducing exposure, e.g., encourage IPM
→ FURTHER SEARCH FOR CAUSES• Once policies implemented → Assessment
– Have we been successful in reducing exposures?– Have we been successful in preventing disease?– Need to “track” changes
→ PREPARE FOR FUTURE ASSESSMENT
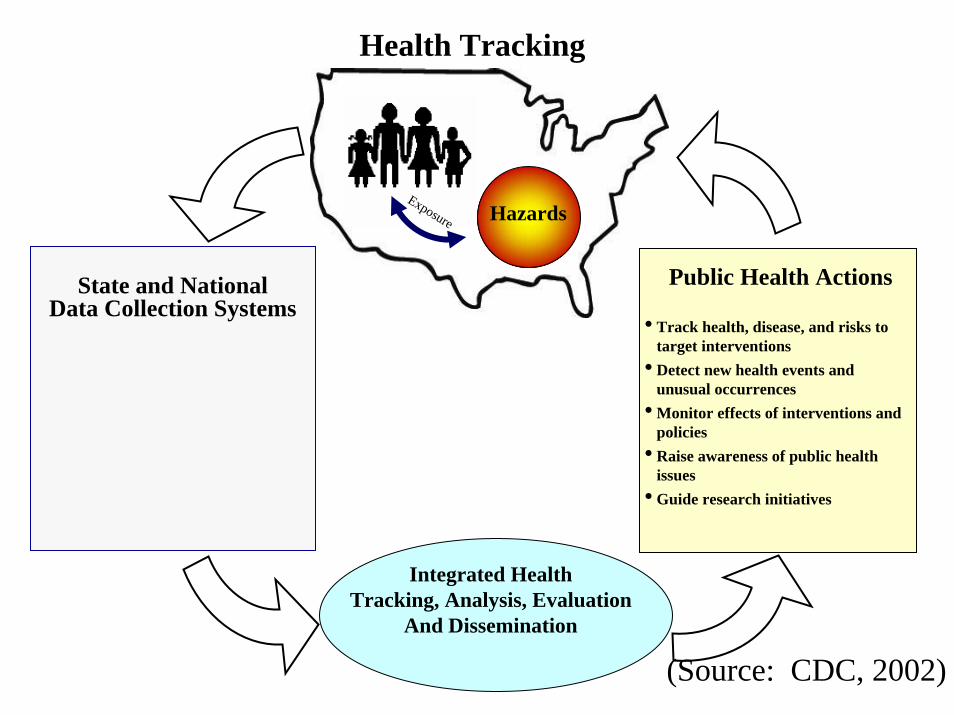
Health Tracking
State and National Data Collection Systems
Integrated HealthTracking, Analysis, Evaluation
And Dissemination
Exposure Hazards
• Track health, disease, and risks to target interventions
• Detect new health events and unusual occurrences
• Monitor effects of interventions and policies
• Raise awareness of public health issues
• Guide research initiatives
Public Health Actions
(Source: CDC, 2002)

“Chance Favors the Prepared Mind”
Louis Pasteur