Public health services and health care utilization in Viet Nam
27
Munich Personal RePEc Archive Public Health Services and Health Care Utilization in Viet Nam Nguyen Viet, Cuong Indochina Research Consulting 1 June 2010 Online at https://mpra.ub.uni-muenchen.de/33610/ MPRA Paper No. 33610, posted 22 Sep 2011 12:34 UTC
Transcript of Public health services and health care utilization in Viet Nam
Munich Personal RePEc Archive
Public Health Services and Health Care
Utilization in Viet Nam
Nguyen Viet, Cuong
Indochina Research Consulting
1 June 2010
Online at https://mpra.ub.uni-muenchen.de/33610/
MPRA Paper No. 33610, posted 22 Sep 2011 12:34 UTC

1
Public Health Services and Health Care
Utilization in Viet Nam
Nguyen Viet Cuong1
Abstract2
The main objectives of this paper are to review policies on health services and to provide
an assessment of public health facilities and the access of people to health care services in
Vietnam. Medical facilities and staffs in public establishments have been increasing.
Health insurance has been expanded rapidly in the recent years. It is very encouraging
that the poor and ethnic minority are more likely to be enrolled in health insurance than
other people. In addition, we find that health insurance helps the insured increase health
care utilization and reduce out-of-pocket spending. The density of medical staffs is also
positively correlated with outpatient health care utilization. However, the quality of
health care services and the access to health care services remain limited in poor, remote
and mountainous areas.
JEL Classifications: H15; I11; I18.
Keywords: Health policy, health insurance, health care, Vietnam.
1 Indochina Research and Consulting (IRC Vietnam). Email: [email protected]
2 This study is funded by United Nations Development Programme and Vietnamese Academy of Social
Sciences. I would like to thank James Chalmers, an anonymous referee, and participants in a HDI
workshop in Vietnamese Academy of Social Sciences in August for their helpful comments and
suggestions.
2
1. Introduction
Over the past decade, Vietnam has witnessed high economic growth and remarkable
improvement in living standard. Economic reforms initiated in the late 1980s
significantly changed the economy of Vietnam from severe crisis in the 1980s to high
growth with an average annual rate of Gross Domestic Product (GDP) per capita of
around 7 percent during the 1990s and 2000s. According to Vietnam Household Living
Standard Surveys (VHLSS), the poverty incidence decreased from 58 percent in 1993 to
29 percent in 2002, and continued to decrease to 14 percent in 2006.3 The incidence of
food poverty or ultra poverty decreased from 25 percent to 7 percent during the 1993-
2008 period.
Health of people has been increasingly improved. Vietnam have achieved better
health indicators than countries with a similar development level, and Vietnam continues
to improve at rates that equal or surpass those in most neighboring countries (Adams,
2005). Life expectancy is around 72. For Vietnamese women, the fife expectancy is 75
and around 10 years longer than would be expected given the country’s level of
development (WHO, 2003). The maternal mortality ratio was reduced from 130/100,000
live births in 1990 to 75/100,000 live births (WHO, 2009). The fraction of children with
low weight at birth decreased from 7.3% in 2000 to 5.1% in 2005. The percentage of
children under year olds with malnutrition was reduced from 33.8% in 2001 to 25.2% in
2005 (World Bank, 2007).
People tend to use more health care services in Vietnam. According to VHLSSs,
per capita expenditure on health increased from 504 thousand VND to 604 thousand
VND during the period 2004-2008 (at constant prices). During this period, the percentage
of people above 5 years old having health insurance increased from 39% to 53%. The
percentage of people insured by voluntary health insurance grew from 1% to 6%.
Improvements in health care are partly resulted from dramatic changes in the
health care system. Since the economic reform in the late 1980s, the health system
includes both public and private sectors. However, the public sectors have played a key
role in providing health care services, especially in policy, prevention, research and
training. The number of public hospitals increased from 835 in 2000 to 974 in 2008. The
number of doctors in public health establishments increased from 39200 to 57300 during
the period 2000-2008.
3 The poverty line is equivalent to the expenditure level that allows for nutritional needs with food
consumption securing 2100 calories per day per person and some essential non-food consumption such as
clothing and housing. This poverty line is estimated by General Statistics Office of Vietnam and World
Bank in Vietnam.

3
Vietnam has implemented a number of health programmes to improve the access
of people to health care services. For example, the national health support program for
the poor have provided free health insurance and free health card for around 21% of the
people above 5 years old. The National Strategy for People’s Health Care 2001–2010 has
been set and implemented with objectives to improve health statuses of the people.
Access to health care services is a key element to improve health of people.
Information on health care systems and people’s access to health care system is very
useful for policy makers as well as researchers to design health policies. The main
objectives of this paper are to review policies on health services and to provide an
assessment of the delivery of public health services and the health care utilization of
people in Vietnam. In addition, the paper also identifies the key healthcare challenges that
people face and propose several policy implications for health care.
The paper is structured into 5 sections. Section 2 introduces data sets used in this
study. Section 3 presents the assessment of provision of health care services and people’s
access to health care service. Section 4 presents some regressions which analyze factors
correlated with health insurance and the use of health care services. Finally section 5
concludes.
2. Data sets
The study uses data from the two recent Vietnam Household Living Standard Surveys
(VHLSS) in 2004 and 2008. These surveys were conducted by the General Statistics
Office of Vietnam (GSO) with technical support from the World Bank (WB). The 2004
and 2008 VHLSSs covered 9188 and 9189 households, respectively. The samples are
representative for the national, rural and urban, and regional levels.4
The surveys contain information on welfare of household and community.
Information on households includes basic demography, employment and labor force
participation, education, health, income, expenditure, housing, fixed assets and durable
goods, participation of households in poverty alleviation programs, and especially
information on credit, international remittances, private transfers, pensions and social
allowances that households had received during the 12 months before the interview.
Especially, the surveys contained data on household health including enrollment in health
insurance, health care utilization and health care spending.
4 There are also VHLSSs in 2002 and 2006. However, the 2002 VHLSS provides less information on heath
than VHLSSs in 2004, 2006 and 2008. We do not use the 2006 VHLSS, since it was conducted between
2004 and 2008 and the analysis of VHLSS 2004 and 2008 are sufficient to provide the trend in health
pattern between 2004 and 2008.
4
Information on commune characteristics was collected from 2280 rural
communes. This data can be linked with the household data. Commune data includes
demography, general economic conditions and aid programs, non-farm employment,
agriculture production, local infrastructure and transportation, education, health and
health facilities, and social problems.
In addition, data on public health facilities such as the number of health stations
and medical staffs are used. These data are available from Statistical Yearbooks which
are published by General Statistics Office of Vietnam.
3. Health care pattern in Vietnam
3.1. Provision of health care services
The health financing system in Vietnam includes subsidized state health services and
services based on payments from users. The Government has increased state budget
spending on health care for policy people, the poor, farmers, ethnic minorities, and people
living in disadvantaged regions. Two major public financial sources for health care in
Viet Nam are the budget which is allocated directly to service providers, through the
MoH and Provincial Health and Finance Departments, and the flow from the social health
insurance fund. In addition, households’ out-of-pocket payments on health care is also a
big source of health financing. Other financial flows can be ODA, private health
insurance, other private expenditure. In recent years, social mobilization of health
activities has been stimulated by the Government to mobilize all available resources in
the society. Social mobilization is the promotion and facilitation of the extensive
involvement of the people and entire society in the development of health.
The health services in Vietnam are provided by both public and private health
providers, in which the public one plays a key role in health care, especially in policy,
prevention, research and training (MOH, 2008). The private sector has grown steadily
during the past ten years, but mainly provides outpatient health service and is still much
smaller than the public sector.5 Vietnam has been developing the grassroots health
network. Health network at grassroots level decentralizes 3 levels at the hamlets/villages
level, the commune/ward/town level, and district level. Until 2008, health staffs were
5 In 2004, there were 77 private hospitals in the country, accounting for 6.86 % of the total number of
hospitals nationwide, with 5412 beds, accounting for 3.4% of the total number of hospital beds nationwide
(MOH, 2008).

5
available in 100% of communes and wards, including doctors in 65.1% of communes, a
midwife or obstetric/pediatric doctor’s assistant in 93.3% of communes, and health
workers in 86.8% of villages (MOH, 2008).
Figure 1: Public health establishments
The number of public hospitals The number of commune health centers
835
856
878
903
956
974
750
800
850
900
950
1000
2000 2004 2005 2006 2007 2008
10271
10516
1061310672
1085110917
9600
9900
10200
10500
10800
11100
2000 2004 2005 2006 2007 2008
Source: Statistical Yearbooks, GSO
The number of public health establishments has been increased overtime (Figure
1). During the period 2000-2008, the number of public hospitals increased from 835 to
974, around 17%. During this period, the number of commune health centers (also called
commune medical station) increased from 10271 to 10917. The number of patient beds in
public medical establishments also rose from 192 to 218.8 thousand. The number of
doctors and nurses in public medical hospitals and stations increased remarkably. Figure
4 shows that the number of doctors and nurses rose by around 46% and 41% during the
period 2000-2008, respectively. The growth rate of medical staffs is much higher than the
growth rate of population. As a result, there is a high increase in the number of doctors
and nurses per 100,000 people between 2000 and 2008.
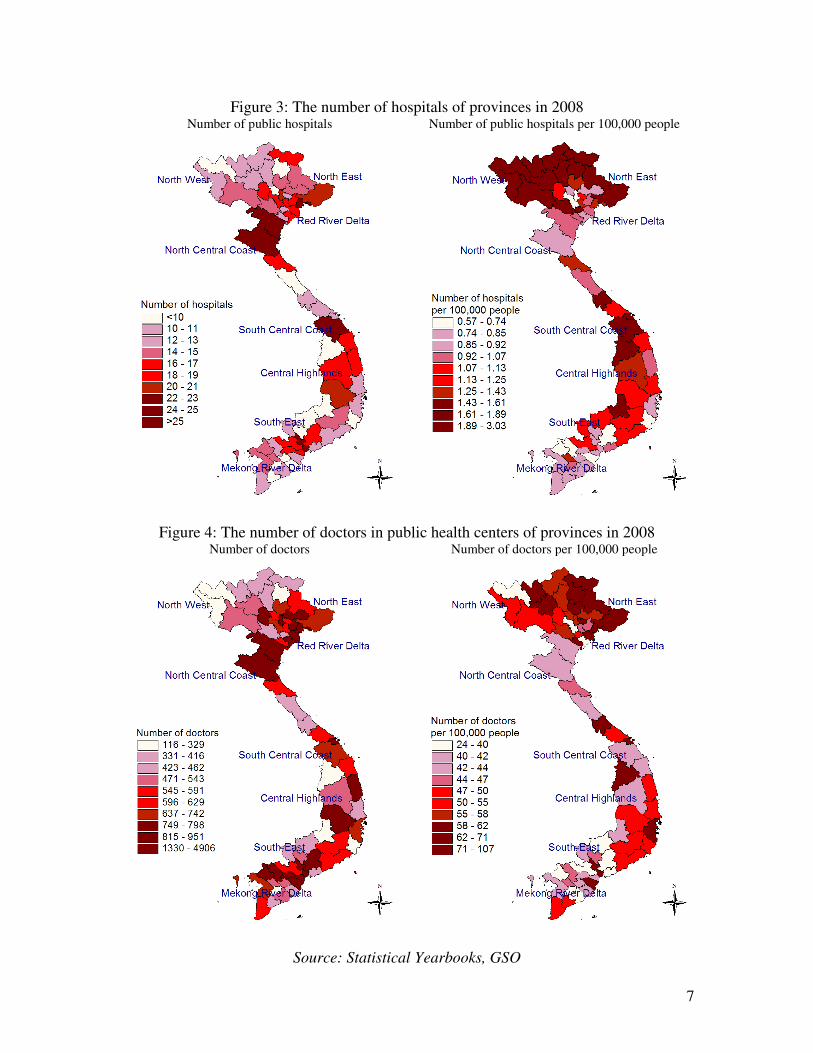
There is a variation in the number of public health establishments and medical
staffs across regions (Table 1). Although the number of public health establishments and
medical staffs is higher in regions with high population such as Red River Delta and
Mekong River Delta, the number of public health establishments and medical staffs per
100,000 people is higher in poor regions with low population such as North East and
North West. This reflects pressure on provision of health care service in regions with high
population density. Similar trends are also found at the provincial level (Figures 2, 3 and
4).

6
Table 1: Public health establishments and medical staffs in 2008
The number of public health establishments
and medical staffs
The number of public health establishments
and medical staffs per 100,000 people
Regions Com.
centers
Hospital Doctors
Nurses
Com.
centers
Hospital Doctors
Nurses
Red River Delta 2546 170 9764 23621 13.7 0.92 52.6 127.4
North East 2434 155 6160 17495 25.2 1.61 63.8 181.3
North West 736 46 1329 6263 27.6 1.73 49.9 235.0
North Central Coast 2043 108 4912 15871 18.9 1.00 45.5 147.0
South Central Coast 1023 88 3930 10741 14.1 1.21 54.2 148.1
Central Highlands 823 67 2402 7330 16.4 1.34 48.0 146.5
South East 1259 127 8288 20349 8.6 0.87 56.8 139.4
Mekong River Delta 1806 154 7886 23241 10.2 0.87 44.6 131.3
All Vietnam 12670 915 44671 124911 14.7 1.06 51.8 144.9
Source: Statistical Yearbooks, GSO
Figure 2: The number of public health establishments in 2008
Number of public health centers Number of public health centers per 100,000 people
Source: Statistical Yearbooks, GSO
7
Figure 3: The number of hospitals of provinces in 2008 Number of public hospitals Number of public hospitals per 100,000 people
Figure 4: The number of doctors in public health centers of provinces in 2008 Number of doctors Number of doctors per 100,000 people
Source: Statistical Yearbooks, GSO

8
Although the commune health centers are available in most the communes, health
service quality are very limited at this level (MOH, 2008). For better treatment, people
have to go to district and provincial hospitals. As a result, there is a problem of
overcrowding faced in provincial and central hospitals (MOH, 2008). The access to
district and province hospitals is more difficult for mountainous regions such as North
East and North West. Few communes have district and province hospitals (Table 2). For
communes without a hospital, people have to travel a long distance to get the nearest
hospital. Table 3 shows that the average distance from commune centers to the closest
district hospital in the rural areas is 13.3 km, 22.5 km and 15.6 km for North East, North
West and Central Highlands, respectively. Distance to the provincial hospital is much
longer.
Table 2: Percentage of rural communes having different health centers in 2008
Regions Commune
centers
Regional
Polyclinic
District
hospitals
Provincial
hospitals
Other
provinces
Red River Delta 100.0 4.8 1.7 0.6 3.4
North East 98.9 12.3 2.0 1.1 4.0
North West 100.0 16.9 5.9 0.8 0.0
North Central Coast 100.0 7.4 2.1 1.1 5.3
South Central Coast 98.4 9.8 4.7 1.0 3.6
Central Highlands 97.1 10.9 2.9 0.0 2.2
South East 98.5 10.7 4.9 0.5 5.4
Mekong River Delta 98.0 9.0 3.1 2.2 5.1
All Vietnam 99.0 9.2 2.9 1.1 4.0
Source: VHLSS 2008
Table 3: Average distance from rural communes to nearest health centers (km) in 2008
Regions Commune
centers
Regional
Polyclinic
District
hospitals
Provincial
hospitals
Other
provinces
Red River Delta - 5.7 7.5 24.5 48.4
North East 9.9 10.9 13.3 49.9 51.7
North West - 11.1 22.5 66.8 154.6
North Central Coast - 7.3 11.7 44.8 56.5
South Central Coast 5.0 8.0 10.5 32.7 37.3
Central Highlands 7.8 15.8 15.6 52.9 86.6
South East 7.0 8.6 12.1 39.3 34.2
Mekong River Delta 2.1 6.9 11.7 35.0 29.0
All Vietnam 5.4 8.3 11.8 39.3 52.1
Source: VHLSS 2008

9
One of the successful health policies is the increase in the health insurance
coverage. Positive impacts of health insurance on health utilization in Vietnam are found
in several empirical studies. Wagstaff and Pradhan (2005) measured impact of all types
of health insurance using Vietnam Living Standard Surveys 1993 and 1998. They found
that health insurance increased the probability of using health care services and the
number of hospital visits. Health insurance also helped reduction of annual out-of-pocket
health expenditures. Sepehri et al. (2004) also used the same data sets to measure impact
of health insurance on health care spending. They found that health insurance reduced the
out-of-pocket expenditures by around 36 to 45 percent. Jowett et al. (2003) measured
impact of health insurance using a small household survey in 1999. The findings were
that health insurance decreased the average out-of-pocket expenditures by approximately
200 percent. The impact of free health insurance for the poor was assessed in Bales et al.
(2007) and Wagstaff (2007) using data from VHLSSs 2002 and 2004. Wagstaff (2007)
found a positive impact of the health insurance on health care utilization, while Bales at
el. (2007) showed that health insurance helped the insured reduce the inpatient treatment
expenses.
Figure 5 shows that during the period 2004-2008, the percentage of people above
5 years old having health insurance increased from 39% to 53%. The percentage of
people insured by voluntary health insurance grew from 1% to 6%. In recent years, the
Government has increased State budget spending on the health care for policy people
such as those with merits to the nation, the poor, ethnic minority people, and people
living in disadvantaged regions (MOH, 2008). The percentage of people who are
provided free health insurance and healthcare cards increased from 15% in 2004 to 21%
in 2008.
Figure 5: Distribution of people above 5 years old by health insurance
2004
Student HI,
16%
Compulsory
HI, 6%
Free HI, 15%
Voluntary HI,
1%
No HI, 61%
2008
No HI, 47%
Voluntary HI,
6%
Free HI, 21%Compulsory
HI, 10%
Student HI,
16%
Source: VHLSSs 2004 and 2008

10
Tables 4 examine the health insurance coverage in 2008 by different groups and
areas. It is very encouraging that the health insurance coverage increased for all the
people groups as well as all the regions. In addition, the health insurance coverage is
much higher for ethnic minorities than Kinh and Hoa. In 2008, the fraction of insured
people is 49% and 76% for Kinh/Hoa and ethnic minorities, respectively. The poor are
more likely to have health insurance than the non-poor. The main health insurance type
for the poor and ethnic minorities are free health insurance. Rural people and people
living in poor and mountain regions tends to have a higher fraction of the insured people.
There is no gender difference in access to health insurance.
Table 4: Distribution of people above 5 years old by health insurance in 2008
Free HI Compulsory
HI
Student HI Voluntary
HI
No HI Total
All Vietnam 20.8 10.3 15.9 6.1 47.0 100
Age group
Below 15 23.3 0.4 56.7 0.9 18.7 100
16-60 18.0 12.5 9.1 6.1 54.4 100
Above 60 35.4 10.3 0.0 13.6 40.8 100
Gender
Male 20.9 11.1 16.6 4.9 46.6 100
Female 20.7 9.5 15.2 7.1 47.5 100
Ethnicity
Kinh and Hoa 14.1 11.1 17.6 6.7 50.5 100
Ethnic minorities 65.6 4.6 4.1 1.9 23.8 100
Poverty
Non-Poor 14.6 11.7 17.5 6.7 49.6 100
Poor 59.4 1.5 6.0 2.1 31.0 100
Urbanity
Urban 9.5 20.3 19.3 7.0 44.0 100
Rural 25.1 6.4 14.6 5.7 48.2 100
Region
Red River Delta 11.4 14.4 18.7 4.8 50.6 100
North East 38.5 12.0 11.4 4.1 34.0 100
North West 72.2 6.4 4.3 1.7 15.5 100
North Central Coast 30.3 7.1 18.0 5.6 39.1 100
South Central Coast 18.4 8.5 22.5 8.4 42.2 100
Central Highlands 36.1 8.9 13.6 3.0 38.5 100
South East 9.2 14.5 17.4 8.0 50.9 100
Mekong River Delta 13.4 4.9 12.4 7.7 61.6 100
Source: VHLSSs 2004 and 2008
3.2. Health care utilization
11
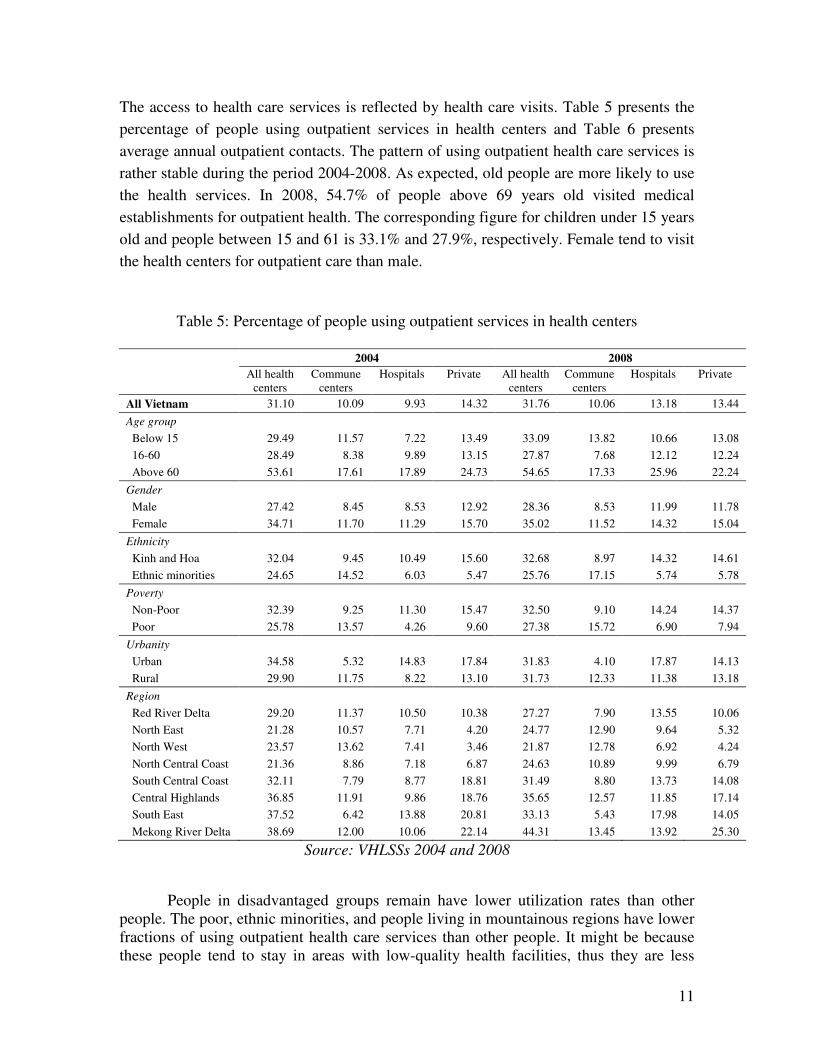
The access to health care services is reflected by health care visits. Table 5 presents the
percentage of people using outpatient services in health centers and Table 6 presents
average annual outpatient contacts. The pattern of using outpatient health care services is
rather stable during the period 2004-2008. As expected, old people are more likely to use
the health services. In 2008, 54.7% of people above 69 years old visited medical
establishments for outpatient health. The corresponding figure for children under 15 years
old and people between 15 and 61 is 33.1% and 27.9%, respectively. Female tend to visit
the health centers for outpatient care than male.
Table 5: Percentage of people using outpatient services in health centers
2004 2008
All health
centers
Commune
centers
Hospitals Private All health
centers
Commune
centers
Hospitals Private
All Vietnam 31.10 10.09 9.93 14.32 31.76 10.06 13.18 13.44
Age group
Below 15 29.49 11.57 7.22 13.49 33.09 13.82 10.66 13.08
16-60 28.49 8.38 9.89 13.15 27.87 7.68 12.12 12.24
Above 60 53.61 17.61 17.89 24.73 54.65 17.33 25.96 22.24
Gender
Male 27.42 8.45 8.53 12.92 28.36 8.53 11.99 11.78
Female 34.71 11.70 11.29 15.70 35.02 11.52 14.32 15.04
Ethnicity
Kinh and Hoa 32.04 9.45 10.49 15.60 32.68 8.97 14.32 14.61
Ethnic minorities 24.65 14.52 6.03 5.47 25.76 17.15 5.74 5.78
Poverty
Non-Poor 32.39 9.25 11.30 15.47 32.50 9.10 14.24 14.37
Poor 25.78 13.57 4.26 9.60 27.38 15.72 6.90 7.94
Urbanity
Urban 34.58 5.32 14.83 17.84 31.83 4.10 17.87 14.13
Rural 29.90 11.75 8.22 13.10 31.73 12.33 11.38 13.18
Region
Red River Delta 29.20 11.37 10.50 10.38 27.27 7.90 13.55 10.06
North East 21.28 10.57 7.71 4.20 24.77 12.90 9.64 5.32
North West 23.57 13.62 7.41 3.46 21.87 12.78 6.92 4.24
North Central Coast 21.36 8.86 7.18 6.87 24.63 10.89 9.99 6.79
South Central Coast 32.11 7.79 8.77 18.81 31.49 8.80 13.73 14.08
Central Highlands 36.85 11.91 9.86 18.76 35.65 12.57 11.85 17.14
South East 37.52 6.42 13.88 20.81 33.13 5.43 17.98 14.05
Mekong River Delta 38.69 12.00 10.06 22.14 44.31 13.45 13.92 25.30
Source: VHLSSs 2004 and 2008
People in disadvantaged groups remain have lower utilization rates than other
people. The poor, ethnic minorities, and people living in mountainous regions have lower
fractions of using outpatient health care services than other people. It might be because
these people tend to stay in areas with low-quality health facilities, thus they are less

12
likely to visit the health stations. In addition, they have a lower number of not-working
days and in-bed days.
Table 6: Average annual outpatient contacts (treatment) in health centers
2004 2008
All health
centers
Commune
centers
Hospitals Private All health
centers
Commune
centers
Hospitals Private
All Vietnam 1.055 0.256 0.265 0.535 1.177 0.296 0.380 0.502
Age group
Below 15 0.893 0.278 0.167 0.449 1.030 0.349 0.254 0.427
16-60 0.896 0.200 0.261 0.435 0.966 0.212 0.343 0.412
Above 60 2.606 0.570 0.570 1.466 2.916 0.731 0.911 1.274
Gender
Male 0.898 0.218 0.223 0.457 0.980 0.247 0.328 0.405
Female 1.210 0.293 0.305 0.611 1.367 0.342 0.429 0.595
Ethnicity
Kinh and Hoa 1.125 0.254 0.283 0.589 1.255 0.279 0.421 0.555
Ethnic minorities 0.573 0.269 0.142 0.162 0.666 0.401 0.109 0.156
Poverty
Non-Poor 1.151 0.245 0.308 0.598 1.246 0.279 0.416 0.551
Poor 0.660 0.297 0.088 0.274 0.771 0.396 0.163 0.212
Urbanity
Urban 1.327 0.153 0.453 0.720 1.308 0.149 0.606 0.553
Rural 0.961 0.291 0.199 0.471 1.127 0.351 0.293 0.482
Region
Red River Delta 0.766 0.247 0.237 0.283 0.784 0.200 0.302 0.282
North East 0.416 0.183 0.153 0.080 0.622 0.295 0.206 0.121
North West 0.419 0.222 0.130 0.067 0.467 0.268 0.122 0.077
North Central Coast 0.495 0.188 0.140 0.166 0.572 0.238 0.199 0.135
South Central Coast 0.956 0.205 0.203 0.548 0.957 0.208 0.340 0.409
Central Highlands 1.044 0.247 0.270 0.528 1.092 0.300 0.299 0.494
South East 1.675 0.210 0.496 0.970 1.456 0.179 0.698 0.579
Mekong River Delta 1.713 0.408 0.299 1.007 2.287 0.571 0.492 1.225
Source: VHLSSs 2004 and 2008
Out-of-pocket expenses per outpatient contact are examined in Table 7. The out-
of-pocket expenses, which are collected in VHLSSs, include all expenses related to each
health care visit including treatment fees, drugs, and spending on bonus, tip for doctors,
cost for travel, meal, accommodation. Overall, the poor, rural people, ethnic minorities,
and people living in mountainous regions have much lower out-of-pocket spending per
outpatient health care contact than the non-poor, urban people, Kinh/Hoa and people in
rich regions. There might be three possible explanations for this. Firstly, poor and ethnic
minority people are more likely to have health insurance, and health insurance can help
them reduce out-of-pocket health spending. Secondly, health care services in rural and
remote areas where the poor and ethnic minorities are mainly located can have lower

13
quality and lower cost than health care in urban and rich regions. Thirdly, with limited
budget, the poor tend to consume less on health care services.
Table 7: Average out-of-pocket spending per outpatient contact (thousand VND; in price
Jan 2008)
2004 2008
All health
centers
Commune
centers
Hospitals Private All health
centers
Commune
centers
Hospitals Private
All Vietnam 189.1 81.6 362.3 149.9 227.0 70.1 394.5 201.9
Age group
Below 15 96.7 47.9 210.0 78.3 107.8 39.9 198.8 104.8
16-60 220.4 89.7 409.0 166.0 260.3 67.0 409.5 238.3
Above 60 219.3 118.1 360.1 202.2 278.6 134.0 531.2 198.9
Gender
Male 196.2 78.5 386.5 151.2 241.3 58.5 405.4 209.2
Female 183.6 83.8 344.4 148.8 215.9 78.3 385.6 196.5
Ethnicity
Kinh and Hoa 199.5 89.2 375.1 151.5 239.8 78.0 401.4 201.9
Ethnic minorities 95.5 47.2 207.6 118.7 120.9 42.9 281.4 202.4
Poverty
Non-Poor 209.3 93.1 378.7 158.1 246.6 77.8 412.6 210.5
Poor 84.2 49.1 182.0 95.1 89.6 43.7 172.9 110.0
Urbanity
Urban 249.5 135.6 377.2 176.5 294.5 67.0 378.7 264.0
Rural 164.8 73.1 352.9 137.3 201.1 70.4 403.9 176.5
Region
Red River Delta 217.6 96.5 399.5 181.2 266.2 79.2 383.0 263.5
North East 200.8 72.2 306.2 340.8 196.6 53.5 340.9 309.7
North West 148.1 58.5 311.6 204.6 180.3 51.6 344.5 435.7
North Central Coast 256.3 112.6 470.2 215.4 247.4 69.6 447.8 289.2
South Central Coast 190.2 60.3 370.7 173.6 232.2 50.7 332.1 232.5
Central Highlands 163.9 49.3 276.6 179.0 223.9 38.5 378.6 254.1
South East 221.9 110.8 386.1 146.3 321.4 200.9 481.5 264.4
Mekong River Delta 125.5 63.4 297.6 88.7 147.9 46.7 344.9 95.5
Source: VHLSSs 2004 and 2008
The pattern of inpatient health care utilization is examined in Tables from 8 to 10.
The percentage of people using inpatient health care services in 2004 and 2008 was 6.9%
and 6.6%, respectively. Most of people used public services provided by hospitals, and
only a few people using private services. As expected, old people have much higher rates
of inpatient utilization than children and young people. Female are more likely to use the
inpatient health care service than male. Unlike outpatient care, the difference in inpatient
utilization rates between the poor and the non-poor, the urban and rural people, Kinh/Hoa
and ethnic minorities and among regions is quite small.

14
Table 84: Percentage of people using inpatient services in health centers
2004 2008
All health
centers
Commune
centers
Hospitals Private All health
centers
Commune
centers
Hospitals Private
All Vietnam 6.88 1.09 5.63 0.26 6.61 0.90 5.65 0.22
Age group
Below 15 4.17 0.68 3.39 0.15 5.02 1.05 3.98 0.08
16-60 6.65 1.12 5.38 0.23 5.95 0.78 5.06 0.25
Above 60 16.11 2.03 13.65 0.76 14.70 1.35 13.38 0.36
Gender
Male 6.24 0.83 5.25 0.23 5.97 0.71 5.18 0.24
Female 7.49 1.34 5.99 0.28 7.23 1.09 6.10 0.20
Ethnicity
Kinh and Hoa 6.88 0.96 5.75 0.27 6.54 0.74 5.68 0.24
Ethnic minorities 6.82 1.98 4.79 0.16 7.13 1.98 5.45 0.10
Poverty
Non-Poor 7.10 0.88 6.05 0.27 6.72 0.74 5.86 0.26
Poor 5.93 1.95 3.89 0.21 5.98 1.85 4.37 0.00
Urbanity
Urban 6.76 0.43 6.10 0.26 5.97 0.25 5.59 0.22
Rural 6.92 1.31 5.46 0.25 6.86 1.15 5.67 0.22
Region
Red River Delta 7.03 1.11 5.95 0.08 6.52 0.74 5.65 0.17
North East 6.82 1.50 5.23 0.17 7.73 1.55 6.33 0.11
North West 6.98 2.14 4.82 0.13 8.42 1.80 6.76 0.20
North Central Coast 8.07 1.65 6.35 0.21 6.94 1.11 5.77 0.24
South Central Coast 7.79 0.81 6.64 0.38 7.93 0.86 7.07 0.24
Central Highlands 7.14 0.61 5.83 0.76 6.47 0.72 5.28 0.78
South East 5.89 0.39 5.24 0.30 5.27 0.19 4.94 0.28
Mekong River Delta 6.29 1.11 5.00 0.31 6.20 1.10 5.11 0.10
Source: VHLSSs 2004 and 2008
Table 9: Average annual inpatient contacts (treatment) in health centers
2004 2008
All health
centers
Commune
centers
Hospitals Private All health
centers
Commune
centers
Hospitals Private
All Vietnam 0.094 0.013 0.077 0.004 0.092 0.012 0.077 0.003
Age group
Below 15 0.056 0.009 0.046 0.002 0.070 0.016 0.053 0.001
16-60 0.087 0.012 0.071 0.003 0.082 0.010 0.069 0.003
Above 60 0.252 0.030 0.209 0.014 0.217 0.020 0.191 0.006
Gender
Male 0.085 0.010 0.072 0.003 0.083 0.010 0.070 0.003
Female 0.103 0.016 0.083 0.005 0.101 0.014 0.085 0.002
Ethnicity
Kinh and Hoa 0.094 0.012 0.078 0.004 0.092 0.011 0.079 0.003
Ethnic minorities 0.096 0.022 0.072 0.002 0.093 0.022 0.070 0.001
Poverty
15
2004 2008
All health
centers
Commune
centers
Hospitals Private All health
centers
Commune
centers
Hospitals Private
All Vietnam 0.094 0.013 0.077 0.004 0.092 0.012 0.077 0.003
Non-Poor 0.099 0.011 0.084 0.004 0.095 0.011 0.081 0.003
Poor 0.073 0.021 0.050 0.002 0.080 0.021 0.059 0.000
Urbanity
Urban 0.091 0.006 0.082 0.004 0.087 0.004 0.079 0.004
Rural 0.095 0.016 0.076 0.004 0.095 0.015 0.077 0.002
Region
Red River Delta 0.092 0.013 0.078 0.001 0.087 0.009 0.076 0.003
North East 0.084 0.016 0.066 0.002 0.102 0.018 0.083 0.001
North West 0.116 0.022 0.093 0.001 0.111 0.018 0.091 0.002
North Central Coast 0.104 0.019 0.082 0.003 0.092 0.014 0.075 0.002
South Central Coast 0.109 0.009 0.095 0.005 0.112 0.012 0.097 0.003
Central Highlands 0.097 0.006 0.081 0.009 0.087 0.009 0.068 0.010
South East 0.078 0.005 0.069 0.004 0.078 0.003 0.072 0.003
Mekong River Delta 0.098 0.016 0.075 0.006 0.095 0.020 0.074 0.001
Source: VHLSSs 2004 and 2008
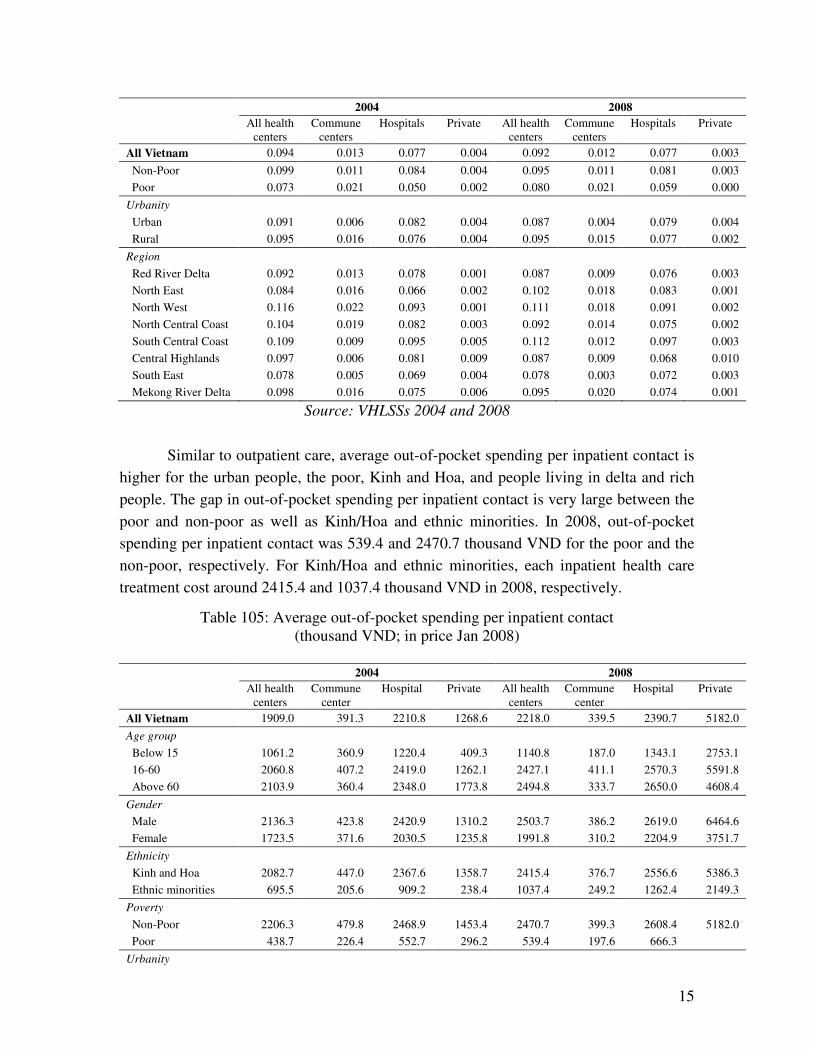
Similar to outpatient care, average out-of-pocket spending per inpatient contact is
higher for the urban people, the poor, Kinh and Hoa, and people living in delta and rich
people. The gap in out-of-pocket spending per inpatient contact is very large between the
poor and non-poor as well as Kinh/Hoa and ethnic minorities. In 2008, out-of-pocket
spending per inpatient contact was 539.4 and 2470.7 thousand VND for the poor and the
non-poor, respectively. For Kinh/Hoa and ethnic minorities, each inpatient health care
treatment cost around 2415.4 and 1037.4 thousand VND in 2008, respectively.
Table 105: Average out-of-pocket spending per inpatient contact
(thousand VND; in price Jan 2008)
2004 2008
All health
centers
Commune
center
Hospital Private All health
centers
Commune
center
Hospital Private
All Vietnam 1909.0 391.3 2210.8 1268.6 2218.0 339.5 2390.7 5182.0
Age group
Below 15 1061.2 360.9 1220.4 409.3 1140.8 187.0 1343.1 2753.1
16-60 2060.8 407.2 2419.0 1262.1 2427.1 411.1 2570.3 5591.8
Above 60 2103.9 360.4 2348.0 1773.8 2494.8 333.7 2650.0 4608.4
Gender
Male 2136.3 423.8 2420.9 1310.2 2503.7 386.2 2619.0 6464.6
Female 1723.5 371.6 2030.5 1235.8 1991.8 310.2 2204.9 3751.7
Ethnicity
Kinh and Hoa 2082.7 447.0 2367.6 1358.7 2415.4 376.7 2556.6 5386.3
Ethnic minorities 695.5 205.6 909.2 238.4 1037.4 249.2 1262.4 2149.3
Poverty
Non-Poor 2206.3 479.8 2468.9 1453.4 2470.7 399.3 2608.4 5182.0
Poor 438.7 226.4 552.7 296.2 539.4 197.6 666.3
Urbanity

16
2004 2008
All health
centers
Commune
center
Hospital Private All health
centers
Commune
center
Hospital Private
All Vietnam 1909.0 391.3 2210.8 1268.6 2218.0 339.5 2390.7 5182.0
Urban 2729.5 619.2 2909.2 1729.3 2813.4 304.4 2854.1 6055.8
Rural 1630.2 365.1 1939.7 1104.4 2020.3 342.5 2216.2 4854.9
Region
Red River Delta 1945.7 327.0 2242.4 238.9 2380.1 338.5 2613.0 3074.7
North East 1230.0 206.8 1535.7 510.5 1613.1 298.7 1878.1 2854.7
North West 1143.6 297.4 1539.4 265.1 1119.9 356.0 1185.8 4399.0
North Central Coast 1321.4 282.6 1583.2 1470.2 2259.4 367.0 2303.8 9440.9
South Central Coast 1655.7 362.6 1748.5 2700.0 1599.1 260.3 1692.1 2853.7
Central Highlands 1336.1 968.7 1442.4 727.0 2320.6 317.4 2328.6 5358.2
South East 3231.3 641.3 3487.8 2003.5 3521.7 841.8 3405.8 7300.5
Mekong River Delta 2215.0 576.0 2615.4 866.7 2050.0 311.4 2409.4 1153.6
Source: VHLSSs 2004 and 2008
Table 11 presents the total per capita expenditure on health cares which include
not only expenses of health care services but also expenses for self-treatment and drugs
without description, payment for health insurance and other payment on health at the
household level. For the whole country, per capita expenditure on health increases from
504 thousand VND in 2004 to 604 thousand VND in 2008. Health expenditure accounts
for 6.5% and 6.8% of the total expenditure in 2004 and 2008, respectively. The
proportion of households who have the share of health expenditure in total living
expenditure above 20% increased slightly from 7.5% in 2004 to 8.1% in 2008.
Table 11: Per capita out-of-pocket expenditure on health care
(thousand VND; in price Jan 2008)
2004 2008
Expenditure
on health
Share of
health exp. in
living
expenditure
(%)
% households
having the
share larger
than 20%
Expenditure
on health
Share of
health exp. in
living
expenditure
(%)
% households
having the
share larger
than 20%
All Vietnam 503.8 6.5 7.5 603.5 6.8 8.1
Ethnicity
Kinh and Hoa 540.1 6.7 7.9 650.8 7.1 8.6
Ethnic minorities 194.7 4.4 4.3 225.7 4.7 4.1
Poverty
Non-Poor 582.3 6.8 8.3 668.0 7.0 8.6
Poor 121.9 5.1 3.9 144.5 5.4 4.2
Urbanity
Urban 760.9 5.9 5.9 866.1 6.5 7.2
Rural 411.0 6.7 8.1 501.4 6.9 8.5
Region
Red River Delta 462.6 6.3 7.5 588.1 6.7 7.9

17
2004 2008
Expenditure
on health
Share of
health exp. in
living
expenditure
(%)
% households
having the
share larger
than 20%
Expenditure
on health
Share of
health exp. in
living
expenditure
(%)
% households
having the
share larger
than 20%
North East 271.8 4.5 5.0 424.0 5.8 7.1
North West 298.7 5.2 5.0 350.5 5.4 6.3
North Central Coast 374.3 6.7 7.6 462.7 6.8 8.5
South Central Coast 469.7 6.5 6.6 504.0 6.5 6.9
Central Highlands 419.1 7.2 9.0 606.9 6.9 7.8
South East 881.6 6.7 7.4 891.9 7.1 8.3
Mekong River Delta 534.7 7.6 9.3 653.9 7.5 9.2
Source: VHLSSs 2004 and 2008
3.3. Assessment of public health services
As presented above, positive effects of health insurance have been found in several
quantitative studies. The 2008 VHLSS contains information on how household assess the
quality of public health services. Table 12 presents the distribution of households by their
assessment of satisfaction with local public health services. The percentage of households
who have high and very high satisfaction with local public health is 37.8% and 3.5%.
Nearly half of the households have middle satisfaction with the health services. However,
there are around 1.2% and 9.3% of households feeling very lowly and lowly satisfied
with the local health services, respectively. There is not a large difference in the
satisfaction level across different people groups as well as different regions.
Table 12: Distribution of households by satisfaction with local public health services (%)
Level of satisfaction
Very low Low Middle High Very high Total
All Vietnam 1.2 9.3 48.2 37.9 3.5 100
Ethnicity
Kinh and Hoa 1.2 9.6 48.3 37.5 3.4 100
Ethnic minorities 1.3 7.2 47.2 40.4 3.9 100
Poverty
Non-Poor 1.1 9.7 48.0 37.9 3.3 100
Poor 1.5 6.4 49.6 37.8 4.8 100
Urbanity
Urban 0.9 13.4 49.3 33.7 2.8 100
Rural 1.3 8.0 47.8 39.2 3.7 100
Region
Red River Delta 1.6 10.4 56.5 30.3 1.3 100
North East 1.1 7.0 53.4 36.6 1.9 100
North West 1.0 6.6 49.1 36.8 6.5 100
North Central Coast 1.3 11.3 54.5 31.3 1.6 100

18
Level of satisfaction
Very low Low Middle High Very high Total
All Vietnam 1.2 9.3 48.2 37.9 3.5 100
South Central Coast 1.1 11.9 43.9 39.6 3.4 100
Central Highlands 1.1 14.0 45.9 37.1 2.0 100
South East 0.4 10.6 48.5 37.6 2.9 100
Mekong River Delta 1.3 4.7 32.1 53.0 9.0 100
Source: VHLSS 2008
Table 13 examines households’ opinion on the improvement in health care service
over the two years 2006-2008. Most of people think health care services were unchanged
(23.8%) and just improved a little (68.5%). It is reasonable since the quality of health
care services cannot be improved in the short period. The assessment opinion is rather
similar across different people groups.
Table 136: Distribution of households by opinions on health care services during the
period 2006-2008 (%)
Assessment
Deteriorated
a lot
Deteriorated
a little
No change Improved a
little
Improved a
lot Total
All Vietnam 0.5 1.8 23.8 68.5 5.3 100
Ethnicity
Kinh and Hoa 0.5 1.8 24.2 68.2 5.2 100
Ethnic minorities 0.8 1.7 20.6 70.8 6.2 100
Poverty
Non-Poor 0.5 1.9 24.4 68.2 5.0 100
Poor 1.0 1.1 19.5 70.5 8.0 100
Urbanity
Urban 0.2 3.0 30.8 61.8 4.3 100
Rural 0.7 1.3 21.3 71.0 5.7 100
Region
Red River Delta 1.0 2.8 28.4 64.5 3.3 100
North East 0.3 2.9 20.3 72.4 4.1 100
North West 0.8 2.6 14.8 74.6 7.1 100
North Central Coast 0.6 0.8 27.0 67.0 4.6 100
South Central Coast 0.2 0.9 22.9 70.9 5.0 100
Central Highlands 0.7 2.6 26.5 67.7 2.5 100
South East 0.4 1.2 28.8 65.6 4.0 100
Mekong River Delta 0.2 0.9 14.8 73.0 11.1 100
Source: VHLSS 2008
4. Determinants of health utilization and out-of-pocket expenditures

19
The previous section showed that the poor and ethnic minority people tend to have lower
health care utilization, especially outpatient health care than the non-poor and Kinh/Hoa.
Increased health insurance and heath care utilizations are important for people health.
This section investigates characteristics associated with health insurance enrollment and
the use of health care service using regression methods.
Table 14 presents the multinomial logit regression of health insurance enrollment
for people above 5 years old. There are four popular types of health insurance: (i) Free
health insurance and card, (ii) Compulsory health insurance, (ii) Student health insurance,
and (iv) Voluntary health insurance. The base outcome is ‘no health insurance’.
Independent variables include (i) individual characteristics which are age, gender,
ethnicity, education, (ii) household variables including household size and per capita
income, (iii) regional and urban dummy variables.
The fraction of people insured by free health insurance is higher for men than for
women. As expected, disadvantaged groups including old people, ethnic minorities and
people living in rural and mountains regions, low income people are more likely to have
free health insurance than young people, Kinh and Hoa, and people in delta and rich
region.
For compulsory health insurance, women are more likely to be insured than men.
It is very interesting that ethnic minorities have to more compulsory health insurance than
Kinh and Hoa people given the observed control variables. Age and education are
strongly corrected with compulsory health insurance. People with high age and high
education have higher probability of being enrolled in compulsory health insurance.
Kinh and Hoa students, urban students and those living in households with high
income and small household size are more likely to have student health insurance.
Finally, for voluntary health insurance, age and education are positively correlated with
enrollment.
Table 14: Multinomial logit regression of health insurance in 2008
Explanatory variables Coef. Std. Err. z P>z
Free health insurance and card
Male (yes = 1) 0.1288 0.0269 4.78 0.000
Age 0.0062 0.0013 4.90 0.000
Ethnic minorities (yes = 1) 1.4723 0.1305 11.28 0.000
Urban areas (yes =1 ) -0.1814 0.0903 -2.01 0.044
Red River Delta (Omitted)
North East 0.7900 0.1268 6.23 0.000
North West 1.6610 0.2722 6.10 0.000
North Central Coast 0.8988 0.1196 7.51 0.000

20
Explanatory variables Coef. Std. Err. z P>z
South Central Coast 0.3698 0.1297 2.85 0.004
Central Highlands 0.8454 0.1595 5.30 0.000
South East -0.1141 0.1416 -0.81 0.420
Mekong River Delta -0.3544 0.1107 -3.20 0.001
No education degree (Omitted)
Primary school degree -0.5624 0.0521 -10.80 0.000
Lower secondary school degree -0.7899 0.0628 -12.59 0.000
Upper secondary school degree -0.8989 0.0942 -9.54 0.000
Technical degree -0.5235 0.1094 -4.79 0.000
Post secondary degree 0.2261 0.2072 1.09 0.275
Per capita income (million VND) -0.0938 0.0093 -10.10 0.000
Household size -0.0932 0.0208 -4.47 0.000
_cons -0.0254 0.1635 -0.16 0.876
Compulsory health insurance
Male (yes = 1) -0.1078 0.0509 -2.12 0.034
Age 0.0211 0.0021 10.29 0.000
Ethnic minorities (yes = 1) 0.5487 0.2225 2.47 0.014
Urban areas (yes =1 ) 0.4167 0.0807 5.17 0.000
Red River Delta (Omitted)
North East 0.3367 0.1202 2.80 0.005
North West 0.3072 0.2458 1.25 0.211
North Central Coast -0.1989 0.1169 -1.70 0.089
South Central Coast -0.0104 0.1159 -0.09 0.929
Central Highlands 0.4162 0.2402 1.73 0.083
South East 0.2827 0.1280 2.21 0.027
Mekong River Delta -0.4467 0.1129 -3.96 0.000
No education degree (Omitted)
Primary school degree 0.6920 0.1828 3.78 0.000
Lower secondary school degree 1.3110 0.1810 7.25 0.000
Upper secondary school degree 2.1409 0.1931 11.08 0.000
Technical degree 3.5442 0.1850 19.16 0.000
Post secondary degree 4.9112 0.2053 23.92 0.000
Per capita income (million VND) 0.0026 0.0046 0.57 0.566
Household size -0.0119 0.0243 -0.49 0.623
_cons -4.4867 0.2687 -16.70 0.000
Student health insurance
Male (yes = 1) -0.0211 0.0456 -0.46 0.644
Age -0.3954 0.0088 -44.86 0.000
Ethnic minorities (yes = 1) -1.1579 0.1435 -8.07 0.000
Urban areas (yes =1 ) 0.5929 0.0804 7.38 0.000
Red River Delta (Omitted)
North East -0.0681 0.1167 -0.58 0.560
North West -0.2250 0.2924 -0.77 0.442
North Central Coast 0.1019 0.1210 0.84 0.399
South Central Coast 0.4681 0.1125 4.16 0.000
Central Highlands -0.5043 0.1536 -3.28 0.001
South East -0.2321 0.1187 -1.95 0.051
Mekong River Delta -0.5217 0.0957 -5.45 0.000
No education degree (Omitted)
Primary school degree 1.6399 0.0760 21.59 0.000
21
Explanatory variables Coef. Std. Err. z P>z
Lower secondary school degree 2.5211 0.1004 25.11 0.000
Upper secondary school degree 3.7837 0.1278 29.61 0.000
Technical degree 1.4076 0.2870 4.90 0.000
Post secondary degree 3.5270 0.3231 10.92 0.000
Per capita income (million VND) 0.0139 0.0055 2.50 0.012
Household size -0.0826 0.0205 -4.03 0.000
_cons 4.4269 0.1596 27.73 0.000
Voluntary health insurance
Male (yes = 1) -0.3214 0.0417 -7.71 0.000
Age 0.0300 0.0019 15.89 0.000
Ethnic minorities (yes = 1) -0.2032 0.3507 -0.58 0.562
Urban areas (yes =1 ) 0.0359 0.0938 0.38 0.702
Red River Delta (Omitted)
North East 0.4504 0.1612 2.79 0.005
North West 0.5700 0.3333 1.71 0.087
North Central Coast 0.5009 0.1927 2.60 0.009
South Central Coast 0.8922 0.1457 6.12 0.000
Central Highlands 0.1709 0.2035 0.84 0.401
South East 0.6117 0.1443 4.24 0.000
Mekong River Delta 0.5045 0.1196 4.22 0.000
No education degree (Omitted)
Primary school degree 0.0369 0.0853 0.43 0.665
Lower secondary school degree 0.2251 0.0966 2.33 0.020
Upper secondary school degree 0.4819 0.1228 3.93 0.000
Technical degree 0.6252 0.1289 4.85 0.000
Post secondary degree 0.9353 0.1999 4.68 0.000
Per capita income (million VND) 0.0071 0.0041 1.71 0.087
Household size 0.0096 0.0262 0.37 0.713
_cons -3.9509 0.1976 -20.00 0.000
Pseudo R2 0.331
Number of observation 35154
Source: VHLSS 2008
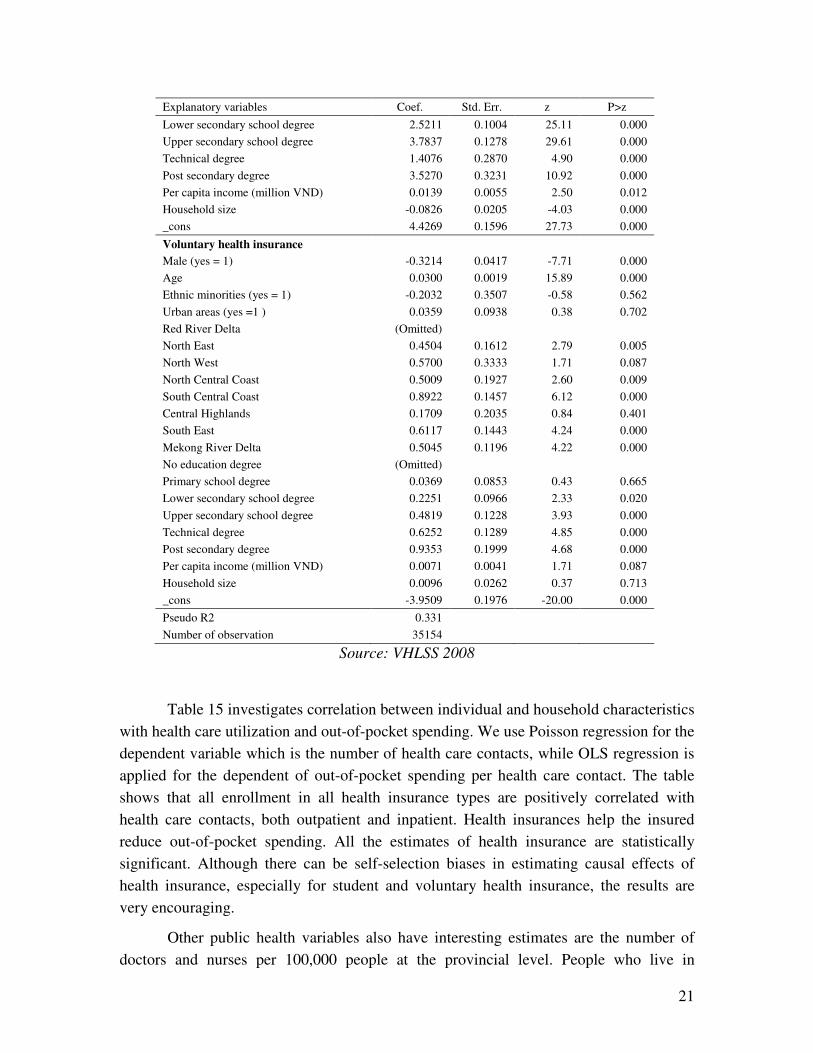
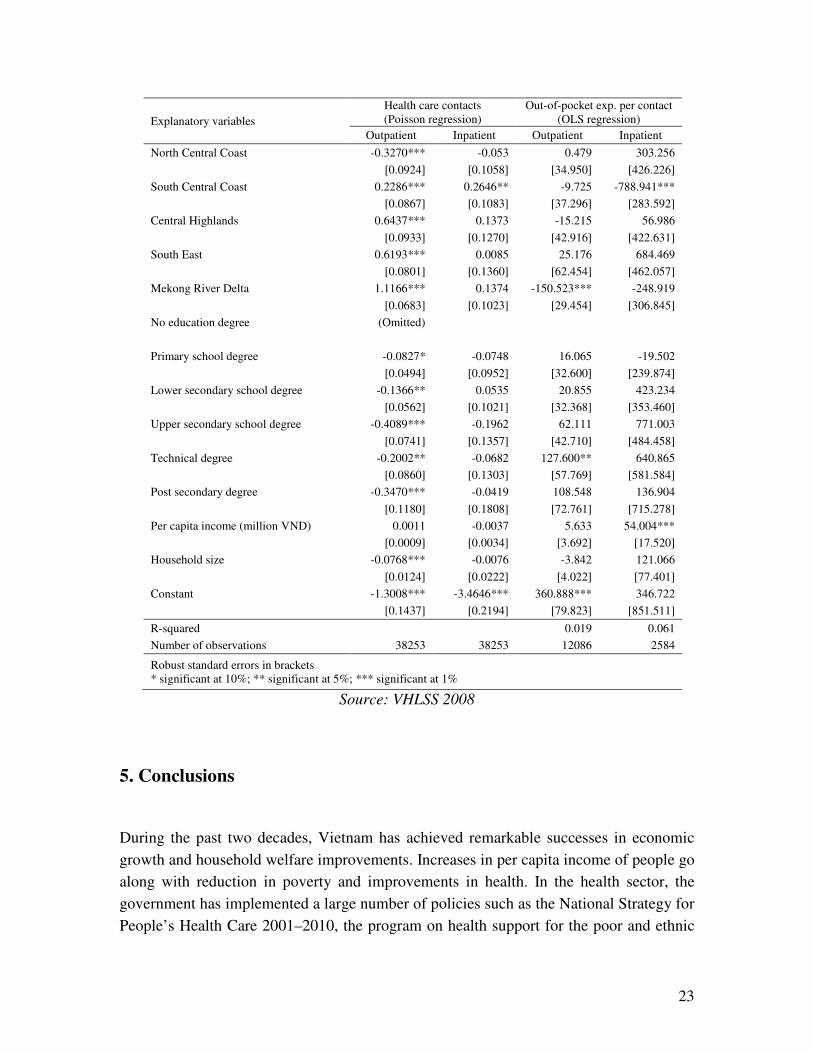
Table 15 investigates correlation between individual and household characteristics
with health care utilization and out-of-pocket spending. We use Poisson regression for the
dependent variable which is the number of health care contacts, while OLS regression is
applied for the dependent of out-of-pocket spending per health care contact. The table
shows that all enrollment in all health insurance types are positively correlated with
health care contacts, both outpatient and inpatient. Health insurances help the insured
reduce out-of-pocket spending. All the estimates of health insurance are statistically
significant. Although there can be self-selection biases in estimating causal effects of
health insurance, especially for student and voluntary health insurance, the results are
very encouraging.
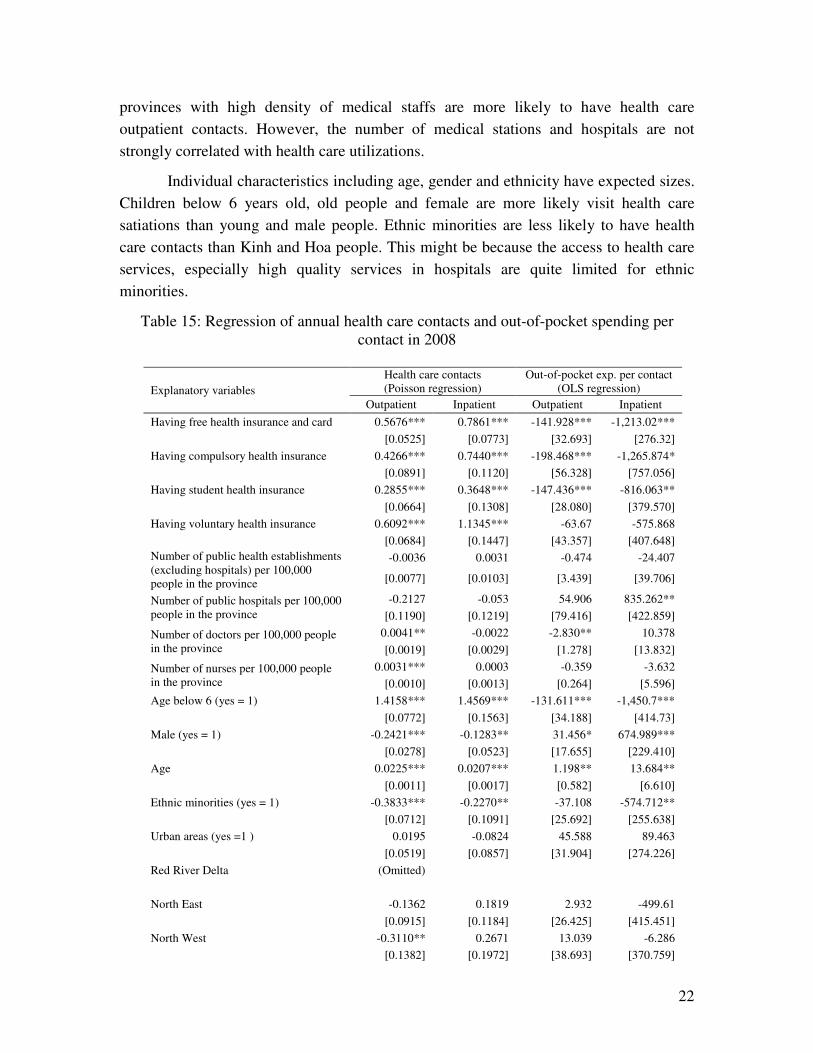
Other public health variables also have interesting estimates are the number of
doctors and nurses per 100,000 people at the provincial level. People who live in
22
provinces with high density of medical staffs are more likely to have health care
outpatient contacts. However, the number of medical stations and hospitals are not
strongly correlated with health care utilizations.
Individual characteristics including age, gender and ethnicity have expected sizes.
Children below 6 years old, old people and female are more likely visit health care
satiations than young and male people. Ethnic minorities are less likely to have health
care contacts than Kinh and Hoa people. This might be because the access to health care
services, especially high quality services in hospitals are quite limited for ethnic
minorities.
Table 15: Regression of annual health care contacts and out-of-pocket spending per
contact in 2008
Explanatory variables
Health care contacts
(Poisson regression)
Out-of-pocket exp. per contact
(OLS regression)
Outpatient Inpatient Outpatient Inpatient
Having free health insurance and card 0.5676*** 0.7861*** -141.928*** -1,213.02***
[0.0525] [0.0773] [32.693] [276.32]
Having compulsory health insurance 0.4266*** 0.7440*** -198.468*** -1,265.874*
[0.0891] [0.1120] [56.328] [757.056]
Having student health insurance 0.2855*** 0.3648*** -147.436*** -816.063**
[0.0664] [0.1308] [28.080] [379.570]
Having voluntary health insurance 0.6092*** 1.1345*** -63.67 -575.868
[0.0684] [0.1447] [43.357] [407.648]
Number of public health establishments
(excluding hospitals) per 100,000
people in the province
-0.0036 0.0031 -0.474 -24.407
[0.0077] [0.0103] [3.439] [39.706]
Number of public hospitals per 100,000
people in the province
-0.2127 -0.053 54.906 835.262**
[0.1190] [0.1219] [79.416] [422.859]
Number of doctors per 100,000 people
in the province
0.0041** -0.0022 -2.830** 10.378
[0.0019] [0.0029] [1.278] [13.832]
Number of nurses per 100,000 people
in the province
0.0031*** 0.0003 -0.359 -3.632
[0.0010] [0.0013] [0.264] [5.596]
Age below 6 (yes = 1) 1.4158*** 1.4569*** -131.611*** -1,450.7***
[0.0772] [0.1563] [34.188] [414.73]
Male (yes = 1) -0.2421*** -0.1283** 31.456* 674.989***
[0.0278] [0.0523] [17.655] [229.410]
Age 0.0225*** 0.0207*** 1.198** 13.684**
[0.0011] [0.0017] [0.582] [6.610]
Ethnic minorities (yes = 1) -0.3833*** -0.2270** -37.108 -574.712**
[0.0712] [0.1091] [25.692] [255.638]
Urban areas (yes =1 ) 0.0195 -0.0824 45.588 89.463
[0.0519] [0.0857] [31.904] [274.226]
Red River Delta (Omitted)
North East -0.1362 0.1819 2.932 -499.61
[0.0915] [0.1184] [26.425] [415.451]
North West -0.3110** 0.2671 13.039 -6.286
[0.1382] [0.1972] [38.693] [370.759]
23
Explanatory variables
Health care contacts
(Poisson regression)
Out-of-pocket exp. per contact
(OLS regression)
Outpatient Inpatient Outpatient Inpatient
North Central Coast -0.3270*** -0.053 0.479 303.256
[0.0924] [0.1058] [34.950] [426.226]
South Central Coast 0.2286*** 0.2646** -9.725 -788.941***
[0.0867] [0.1083] [37.296] [283.592]
Central Highlands 0.6437*** 0.1373 -15.215 56.986
[0.0933] [0.1270] [42.916] [422.631]
South East 0.6193*** 0.0085 25.176 684.469
[0.0801] [0.1360] [62.454] [462.057]
Mekong River Delta 1.1166*** 0.1374 -150.523*** -248.919
[0.0683] [0.1023] [29.454] [306.845]
No education degree (Omitted)
Primary school degree -0.0827* -0.0748 16.065 -19.502
[0.0494] [0.0952] [32.600] [239.874]
Lower secondary school degree -0.1366** 0.0535 20.855 423.234
[0.0562] [0.1021] [32.368] [353.460]
Upper secondary school degree -0.4089*** -0.1962 62.111 771.003
[0.0741] [0.1357] [42.710] [484.458]
Technical degree -0.2002** -0.0682 127.600** 640.865
[0.0860] [0.1303] [57.769] [581.584]
Post secondary degree -0.3470*** -0.0419 108.548 136.904
[0.1180] [0.1808] [72.761] [715.278]
Per capita income (million VND) 0.0011 -0.0037 5.633 54.004***
[0.0009] [0.0034] [3.692] [17.520]
Household size -0.0768*** -0.0076 -3.842 121.066
[0.0124] [0.0222] [4.022] [77.401]
Constant -1.3008*** -3.4646*** 360.888*** 346.722
[0.1437] [0.2194] [79.823] [851.511]
R-squared 0.019 0.061
Number of observations 38253 38253 12086 2584
Robust standard errors in brackets
* significant at 10%; ** significant at 5%; *** significant at 1%
Source: VHLSS 2008
5. Conclusions
During the past two decades, Vietnam has achieved remarkable successes in economic
growth and household welfare improvements. Increases in per capita income of people go
along with reduction in poverty and improvements in health. In the health sector, the
government has implemented a large number of policies such as the National Strategy for
People’s Health Care 2001–2010, the program on health support for the poor and ethnic
24
minorities. As a result, Vietnam has obtained a large number of achievements in health
care.
Vietnam have achieved better health indicators than countries with a similar
development level, and Vietnam continues to improve at rates that equal or surpass those
in most neighboring countries (Adams, 2005). Life expectancy is around 72. The
maternal mortality ratio was reduced from 130/100,000 live births in 1990 to
75.0/100,000 live births (WHO, 2009). The under-five mortality rate also fell from 55.4%
in 1990 to 25.9% by 2007 (WHO, 2009). The fraction of children with low weight at
birth decreased from 7.3% in 2000 to 5.1% in 2005. The percentage of children under
year olds with malnutrition was reduced from 33.8% in 2001 to 25.2% in 2005 (World
Bank, 2007).
Health care facilities, both private and public, increased remarkably over time.
The private sector has grown steadily during the past ten years. In 2004, there were 77
private hospitals in the country, accounting for 6.86 % of the total number of hospitals
nationwide, with 5412 beds, accounting for 3.4% of the total number of hospital beds
nationwide (MOH, 2008). The number of public hospitals, medical stations and medical
staffs has been increased. The grassroots health network is strengthened. Until 2008,
health staffs were available in 100% of communes and wards, including doctors in 65.1%
of communes, a midwife or obstetric/pediatric doctor’s assistant in 93.3% of communes,
and health workers in 86.8% of villages (MOH, 2008).
Health insurance is expanded remarkably. The percentage of people above 5 years
old having health insurance increased from 39% in 2004 to 53% in 2008. The percentage
of people who are provided free health insurance and healthcare cards increased from
15% in 2004 to 21% in 2008.
The regressions analysis shows that health insurance is positively correlated with
health care contacts, both outpatient and inpatient. In addition, health insurances help the
insured reduce out-of-pocket spending. The number of doctors and nurses per 100,000
people at the provincial level also have positive impact of health care utilization. People
who live in provinces with high density of medical staffs are more likely to have health
care outpatient contacts.
However, there are still a number of challenges to health care in Vietnam. Access
to health care services, especially health care services provided by hospitals remains
limited for the poor, the ethnic minorities and those living in mountainous regions. The
access to district and province hospitals is more difficult for mountainous regions such as
North East and North West. There is a long distance from rural commune to a nearest
district hospital in mountainous regions. The average distance from commune centers to
the closest district hospital in the rural areas is 13.3 km, 22.5 km and 15.6 km for North

25
East, North West and Central Highlands, respectively. Distance to the provincial hospital
is even much longer. When people need high quality health care services, they have to go
to cities. As a result, hospitals in cities are often overwhelmed.
The number of health care contacts especially outpatient health care is low for the
poor and ethnic minorities. Although the poor and ethnic minorities report a smaller
number of not-working days and in-bed days due to sickness than the non-poor and
Kinh/Hoa, the low health care contact would be resulted from limited access to health
care services.
The health system is slow to renew and has not adapted itself to the development
of a socialist-oriented market economy and changes in disease patterns (MOH, 2009).
Pharmaceutical production and supply capacity remains weak. The price of
pharmaceuticals remains very high for a developing country (MOH, 2009). The pace for
revising or amending health policies that are no longer appropriate has been slow. The
health management information systems are not internally consistent, and as a result there
are often many overlaps (MOH, 2008).
26
References
Adams, Susan J. (2005), “Vietnam’s Health Care System: A Macroeconomic
Perspective”, Paper Prepared for the International Symposium on Health Care Systems in
Asia, Hitotsubashi University, Tokyo.
Bales, S., J. Knowles, H. Axelson, P. D. Minh, D. H. Luong, and T. T. M. Oanh (2007),
“The Early Impact of Decision 139 in Vietnam: An Application of Propensity Score
Matching”, Report to the Ministry of Health of Vietnam.
Government of Vietnam (2009), “The National Targeted Program on Poverty Reduction
2006-2010”, Project document.
Jowett, M., P. Contoyannis and N. D. Vinh (2003), "The Impact of Public Voluntary
Health Insurance on Private Health Expenditures in Vietnam", Social Science and
Medicine 56(2), 333-342.
MOH (2008), “Joint Annual Health Review 2008: Health Financing in Viet Nam”,
Ministry of Health, Hanoi, November 2008.
Sepehri, A., S. Sarma, W. Simpson (2004), “Does Non-profit Health Insurance Reduce
Financial Burden? Evidence from the Vietnam Living Standards Survey Panel”, Paper to
be presented at the 38th Annual Meetings of the CEA at Ryerson University, Toronto,
June 4-6, 2004.
Wagstaff, A. (2007), “Health Insurance for the Poor: Initial Impacts of Vietnam’s Health
Care Fund for the Poor”, Impact Evaluation Series No. 11, the World Bank, Washington
DC, USA
Wagstaff, A. and M. Pradhan (2005), “Health Insurance Impacts on Health and
Nonmedical Consumption in a Developing Country”, World Bank Policy Research
Working Paper 3563, April 2005.
WHO (2003), “WHO Country Cooperation Strategy 2003 – 2006: Vietnam”, World
Health Organization.
WHO (2009), “Vietnam Country Profile”, World Health Organization.
World Bank (2007), “Vietnam Development Report 2008: Social Protection”, World
Bank.