Public Distribution System in India: Implications for...
41
1 Public Distribution System in India: Implications for Poverty and Food Security Anjani Kumar International Food Policy Research Institute, New Delhi-12 E-mail: [email protected] Shinoj Parappurathu National Centre for Agricultural Economics and Policy Research, New Delhi-12 E-mail: [email protected] M C S Bantilan International Crops Research Institute for the Semi-Arid Tropics, Patancheru 24, E-mail: [email protected] P K Joshi International Food Policy Research Institute, New Delhi-12 E-mail: [email protected]
Transcript of Public Distribution System in India: Implications for...
1
Public Distribution System in India: Implications for Poverty
and Food Security
Anjani Kumar
International Food Policy Research Institute, New Delhi-12
E-mail: [email protected]
Shinoj Parappurathu National Centre for Agricultural Economics and Policy Research, New Delhi-12
E-mail: [email protected]
M C S Bantilan International Crops Research Institute for the Semi-Arid Tropics, Patancheru 24,
E-mail: [email protected]
P K Joshi
International Food Policy Research Institute, New Delhi-12
E-mail: [email protected]

2
Abstract
This paper investigates the effect of food subsidy through Public Distribution
System (PDS) on poverty and food security in India. The study used fiscal
transfer method to estimate the subsidy transfer through PDS and its indirect
benefits as a window for the poor to escape poverty and improve food
security. The robustness of the results was checked based on propensity score
matching (PSM) technique. The study established that, the effectiveness of
PDS has improved over time and PDS emerged as an effective tool in
targeting the twin problems of poverty and under-nourishment in the country.
Key words: PDS, Poverty, Food security, Nutrition security, India

3
Acknowledgements
We are grateful to National Centre for Agricultural Economics and Policy Research, New
Delhi; International Crops Research Institute for the Semi-Arid Tropics, Hyderabad and
International Food Policy Research Institute, South Asia Office, New Delhi for providing
institutional, infrastructural and intellectual support for conducting this study.
4
Introduction
The enactment of National Food Security Act (NFSA) in August, 2013 in
India has renewed the deliberations on food security and consequently,
functioning of Public Distribution System (PDS) became one of the intensely
debated issues in the country. PDS is one of the most important public
intervention programs to enhance food security in India and therefore, the
success of NFSA will critically depend upon efficient functioning of PDS.
PDS provides rationed amount of basic food items and other non-food items at
subsidized prices to consumers through a network of “fair price shops”. The
coverage and functioning of PDS underwent several changes overtime but it
essentially remained an instrument to augment food security. The access to
PDS was universal till 1992 (at least in theory). Rampant corruption and high
operational costs led to repackaging the program as Revamped Public
Distribution System (RPDS) with focus in tribal, arid, hill and remote areas in
1992 and then to a Targeted Public Distribution System (TPDS) in 1997. The
aim of the TPDS was to target the poorest households by differentiating the
access quantities and prices at which one is allowed to buy. The differentiation
was achieved by classifying the beneficiaries into Above Poverty Line (APL),
Below Poverty Line (BPL) or Antyodaya households based their economic
status, assessed based on the state-specific poverty lines. Antyodaya cards,
5
which enjoy a larger subsidy than BPL households, are meant for the poorest
of the poor.
In spite of the extensive coverage of PDS and its important role in
ensuring food security, its relevance and effectiveness in reducing poverty and
improving food security has been questioned frequently in policy discourse on
food transfers in India. A number of studies related to PDS have pointed out
anomalies such as inclusion and exclusion errors (Swaminathan and Misra,
2001; Hirway, 2003; Khera, 2008; Mahamalik and Sahu, 2011), large scale
leakages (Jha and Ramaswami, 2010; Himanshu and Sen, 2011; Khera, 2011;
Kumar et al, 2012; among others) and so on. On the other hand, the role
played by PDS in poverty alleviation and improving food security were
highlighted in a few other studies (e.g. Radhakrishna et al, 1997; Dreze and
Khera, 2013; Tritah, 2003, Himanshu and Sen, 2013). This paper is an attempt
in similar direction with focus on assessing the impact of PDS on poverty
alleviation as well as improving food security of the beneficiaries. The
analysis covers temporal as well as spatial dimensions of the transformation
that PDS brought about in the country in terms of income gains, poverty
reduction and nutritional enhancements that is gauged through a mix of
traditional as well as recent advances in methodology.
Data and Methodology
The study is based on the unit level data from 50th
(1993-94), 61st (2004-05),
66th
(2009-10) and 68th
(2011-12) rounds of the Consumption and Expenditure

6
Survey conducted by the National Sample Survey Organization (NSSO), of
the government of India (GoI). Each survey contains detailed information on
values and quantities of household consumption along with other household
specific information. The Planning Commission, GOI relies on these surveys
to estimate poverty lines on a regular basis. The household data were used to
compute the average per capita consumption expenditure. The calorie intake
was computed by using the nutrient charts provided by the NSSO for each
commodity (NSSO, 2012). The questionnaires used by the NSSO for data
collection distinguishes consumption from the PDS and from other sources. It
is therefore possible to estimate the price paid at the PDS and at the open
market if both sources of provision have been used by the households. Thus, it
allows estimating the share of PDS in consumption expenditure and calorie
intake of each household.
Impact of PDS on food security and poverty
Traditionally, the impact of PDS is assessed based on fiscal transfer method,
where, expenditure gains accruing out of subsidized food transfers and
consequent reduction in poverty is estimated through direct calculations. Apart
from this, the recent advances in impact evaluation methodologies allow
estimating the net gain by considering the counterfactuals of beneficiaries of a
program. This includes propensity score matching (PSM) method that assesses
the real impact of an intervention by comparing the target population with
their counterfactuals through matching techniques (Rosenbaum and Robin,

7
1983; Heckman et al., 1997, 1998; Jalan and Ravallion, 2003; Dehejia and
Wahba, 2002). The utility of this approach in understanding the net gains from
India‟s PDS program was well demonstrated by Tritah (2003). Therefore, this
paper makes use of the fiscal transfer method to assess the income
(expenditure) gains, nutritional enhancement and poverty reduction arising out
of PDS participation and subsequently checks the robustness of the results by
using PSM by taking the case of changes in food expenditure as well as
nutritional outcomes that could be attributed to PDS.
Fiscal Transfer Method
The precise impact of PDS on poverty and food security is an important but a
complex question. The question is difficult to be answered as the impact of
PDS is pervasive in the Indian economy and have implications for the
livelihood at all levels. The fiscal transfer method assesses the direct benefit
impact of PDS as a distributive mechanism on poverty and food security. The
approach has been widely used in estimating benefit impact of fiscal
distribution. It has been by Radhakrishna et al (1997), Tritah (2003),
Himanshu and Sen (2013 a & b) to assess the impact of PDS.
The subsidy transfer or income gain due to PDS is defined as the additional
expenditure that the household would have incurred in the absence of PDS. It
is estimated by multiplying the quantity of purchases from PDS with the
difference between open market price and PDS price. The income gain ( )
given to a household is defined as:

8
)
Where and are the open market and subsidized price. is the quantity
purchased from the PDS. The open market and subsidized prices are estimated
from NSS survey data on quantities and values of expenditure.
Official Poverty lines provided by the Planning Commission, GoI have been
used to assess the impact of PDS on poverty in this study. The extent of
poverty has been measured as head count ratio (HCR) in the total population
and the depth of poverty is measured by the poverty gap index (PGI) which is
constructed based on the following formula (Grusky and Kanbur (2006)):
∑
Where, is the total population, is the population who are living at or
below poverty line, is the poverty line and is the income of the poor
individual i. PGI by definition ranges between 0 and 100 per cent and is a
measure to sense how poor the poor are?.
Similarly, the impact of PDS on calorie intake was estimated by assuming that
without access to PDS, the household‟s budget allocation would have been the
same. The quantity has been recalculated that the household would have
bought in the absence of PDS. The adjusted quantity was then used to re-
estimate the calorie consumption of the same household. This provides the
average calorie consumption of the households without access to PDS. The
9
difference between the two gives the gain in calorie intake ( , which is
defined as follows;
Where and are the actual (including from PDS) and estimated
(without PDS) per capita calorie intake. In the paper, the extent of calorie
deficiency has been measured by head count ratio in the total population and
the depth of deficiency is measured by the Deficiency Gap Ratio (DGR)1. The
minimum (threshold) food-energy requirement was taken as 1800
kcal/person/day for rural households and 1575 kcal for the urban households.
They represented 75 per cent of the recommended values, 2400
kcal/person/day for rural and 2100 kcal/person/day for urban [for more
information, see Dandekar 1996]. The households consuming below this level
were treated as undernourished or deficient in calorie intake.
Propensity Score Matching Method
PSM is an innovative technique, wherein the impact of an intervention (here,
participation in PDS) is assessed by comparing how outcomes differ for
participants in relation to observationally similar non-participants. Based on
the theoretical foundation laid by Rosenbaum and Rubin (1983), PSM uses
information from a pool of units that do not participate in the intervention to
identify what would have happened to participating units in the absence of
intervention (Heinrich et al, 2010). The above method seeks to assess the
1 Estimated with the same approach as used in the case of PGI.
10
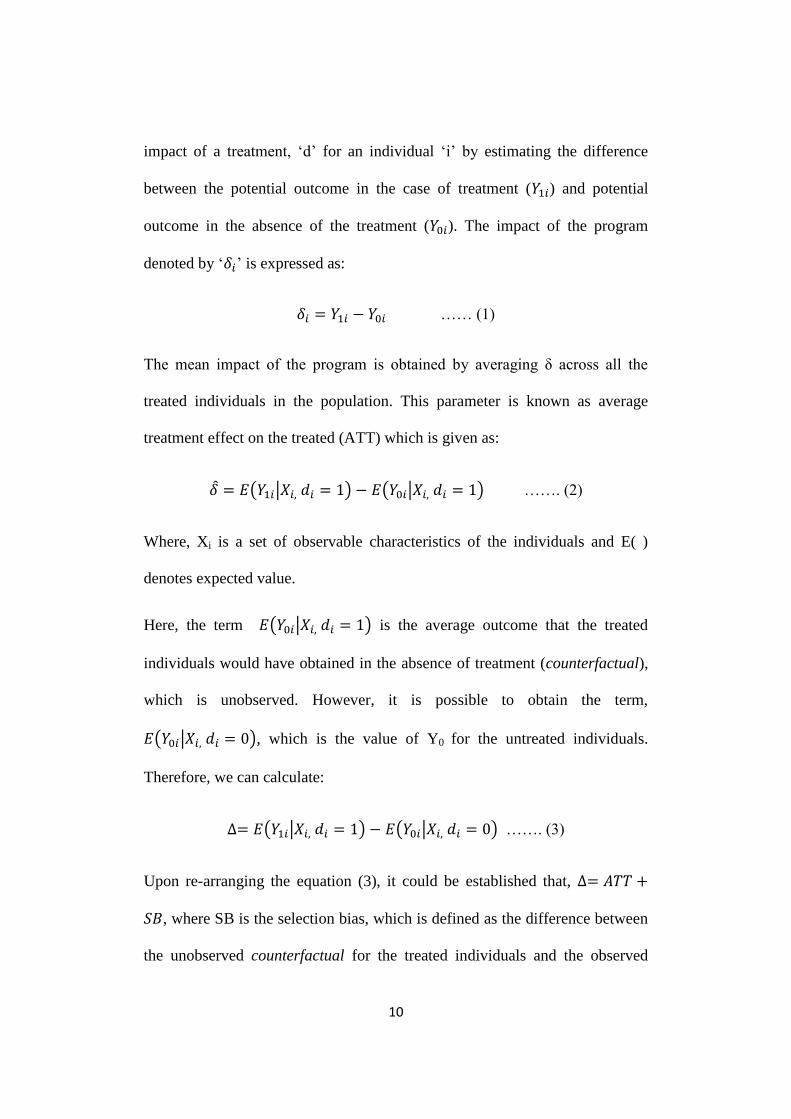
impact of a treatment, „d‟ for an individual „i‟ by estimating the difference
between the potential outcome in the case of treatment ( ) and potential
outcome in the absence of the treatment ( ). The impact of the program
denoted by „ ‟ is expressed as:
…… (1)
The mean impact of the program is obtained by averaging δ across all the
treated individuals in the population. This parameter is known as average
treatment effect on the treated (ATT) which is given as:
( | ) ( | ) ……. (2)
Where, Xi is a set of observable characteristics of the individuals and E( )
denotes expected value.
Here, the term ( | ) is the average outcome that the treated
individuals would have obtained in the absence of treatment (counterfactual),
which is unobserved. However, it is possible to obtain the term,
( | ), which is the value of Y0 for the untreated individuals.
Therefore, we can calculate:
( | ) ( | ) ……. (3)
Upon re-arranging the equation (3), it could be established that,
, where SB is the selection bias, which is defined as the difference between
the unobserved counterfactual for the treated individuals and the observed
11
outcome for the treated individuals. If SB = 0, then ATT can be estimated by
taking the mean observed outcomes for the treated and the untreated. In the
past literature on this topic, there is a consensus that, by randomly assigning
units into treatment and control groups, one can minimize the selection bias.
However, participation in most socio-economic programs being non-random
and conditional based on X, an alternative approach called „matching‟ can be
followed that helps in obtaining unbiased estimator of ATT. Matching
essentially helps in pairing a participant unit with an observationally similar
non-participant so that, the difference in their outcomes is as good as the
difference between the treatment outcome and its counterfactual. With no
underlying selection bias, this difference can be interpreted as the effect of the
program (Smith and Todd, 2005).
Among the various matching techniques, PSM is a methodologically superior
technique, wherein, treated and untreated units are matched based on the
estimated probability P(X), called propensity score. It is the probability that a
unit in the combined sample of the treated and untreated receives the
treatment, given a set of observable characteristics. Rosenbaum and Rubin
(1983) who proposed the underlying theory has established that, under certain
qualifying assumptions, matching on propensity score is as good as matching
on X. PSM rests on two basic assumptions:
Conditional independence or unconfoundedness assumption: This assumption
holds that, after conditioning on the observables (X), treatment group would

12
have the same outcome Y0, as the control group members in the absence of the
treatment.
Common support or overlap assumption: For each possible value of the vector
of covariates X, there must be appositive probability of finding both a treated
and untreated unit, so that valid matches could be found for all d=1.
Propensity score is generally estimated by fitting a probit or logit model with
participation in the program as the dichotomous dependent variable (d=1 if
participant; d=0 if not). All observed characteristics that the researcher finds as
determining factors for participation in the program, thereby impacting the
outcome variable Y, are included as explanatory variables. Necessary
balancing tests have to be conducted to ascertain that the average propensity
score and mean of X variables are the same within propensity score
distribution quintiles. Several alternative algorithms are used to match the
treated units with that of control. Commonly employed matching algorithms
include nearest neighbor matching, radius matching, stratification matching,
kernel matching, etc. (See Heinrich et al. (2010) for details). After matching,
ATT and associated standard errors are estimated and compared to assess the
impact of the program.
In this paper, PSM was applied to assess the income gains as well as
nutritional impact of participation of the below poverty line (BPL) households
in PDS. The food consumption expenditure and calorie consumption levels of
participants and non-participants were compared to assess whether PDS is

13
enhancing their economic and nutrition status. The study used the 68th
round
data of the NSSO pertaining to the year 2011-12, for this purpose. The sample
was categorized into BPL and non-BPL households based on the officially
accepted income criteria for various states. The analysis was limited to the
BPL households, though those above poverty line also participated in the PDS.
A probit model was fitted with PDS participation as the dependent variable
and several demographic and socio-economic determinants as explanatory
variables. The functional form of the fitted model is given in Equation 1 as
below:
PDS_BEN = f (CONST, AGE_HEAD, EDU_HEAD, EDU_SQ, MPCE,
MPCE_SQ, CHILDREN, F_HEAD, SC_ST, RURAL, NO_CARD)
….……… (1)
Where,
PDS_BEN = Dichotomous variable for participation in PDS (1 if
beneficiary and 0 if non- beneficiary)
CONST = Constant term
AGE_HEAD = Age of head of the household in years
EDU_HEAD = Maximum education of the head of the household in number
of years
EDU_SQ = Square term of EDU_HEAD
MPCE = Monthly per capita income of the household in Rupees
MPCE_SQ = Square term of MPCE_SQ
14
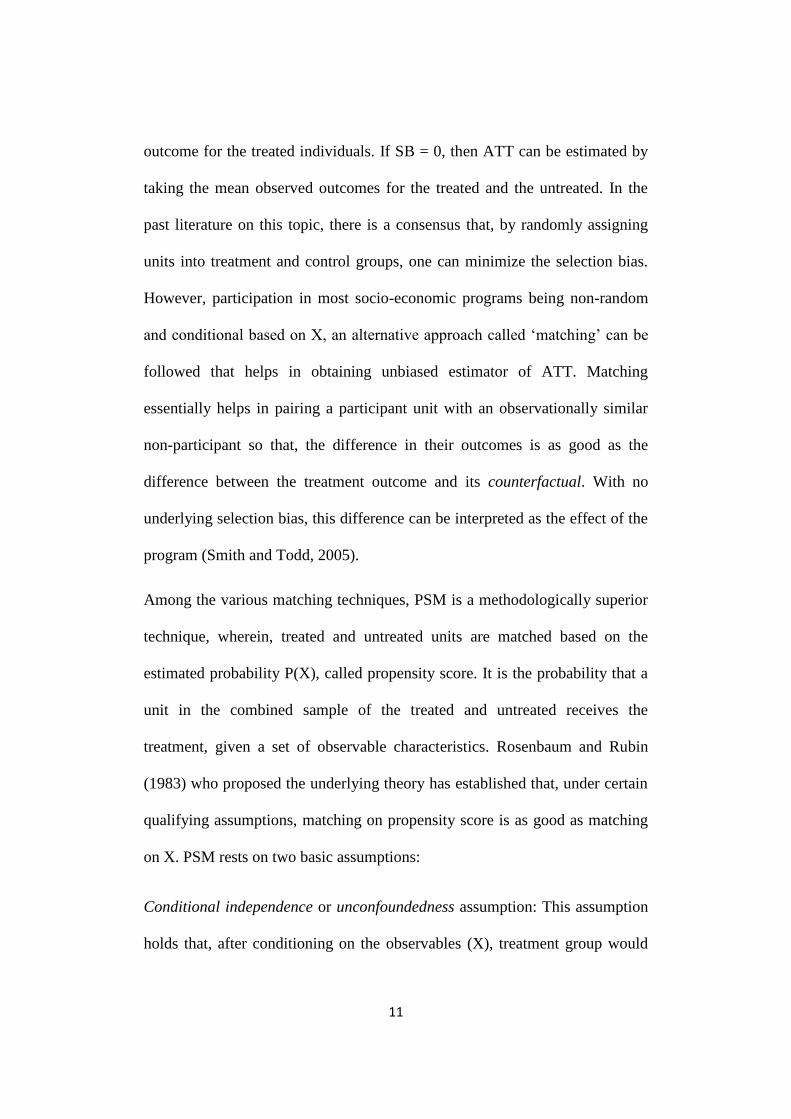
CHILDREN = Number of the children under the age of 14 in the household
F_HEAD = Dummy variable for female-headed household
SC_ST = Dummy variable for households of scheduled caste or
scheduled tribe
RURAL = Dummy variable for households belonging to rural areas
NO_CARD = Dummy variable for households not possessing PDS ration
card.
The estimation of the probit model and subsequent computations on
propensity scores were carried out using the „pscore.ado‟2 module in the
STATA software. Subsequently, the ATT estimates based on nearest neighbor
matching was obtained and presented.
Results and Discussion
Access to PDS
Table 1 provides a snapshot of the reach of people to PDS foodgrains
during 1993-94, 2004-05, 2009-10 and 2011-12. The PDS reach shrunk
between 1993-94 and 2004-05, during which, the percentage of households
accessing PDS cereals fell from 27.7 per cent to 23.3 per cent. The shrinkage
was sharp in urban areas from 29.8 per cent to 14.7 per cent, whereas, the
decline in rural area was negligible. This shrinkage may be attributed to the
2 This module was developed by Becker and Ichino (2002) and is available for
download at http://sobecker.userweb.mwn.de/pscore.html.
15
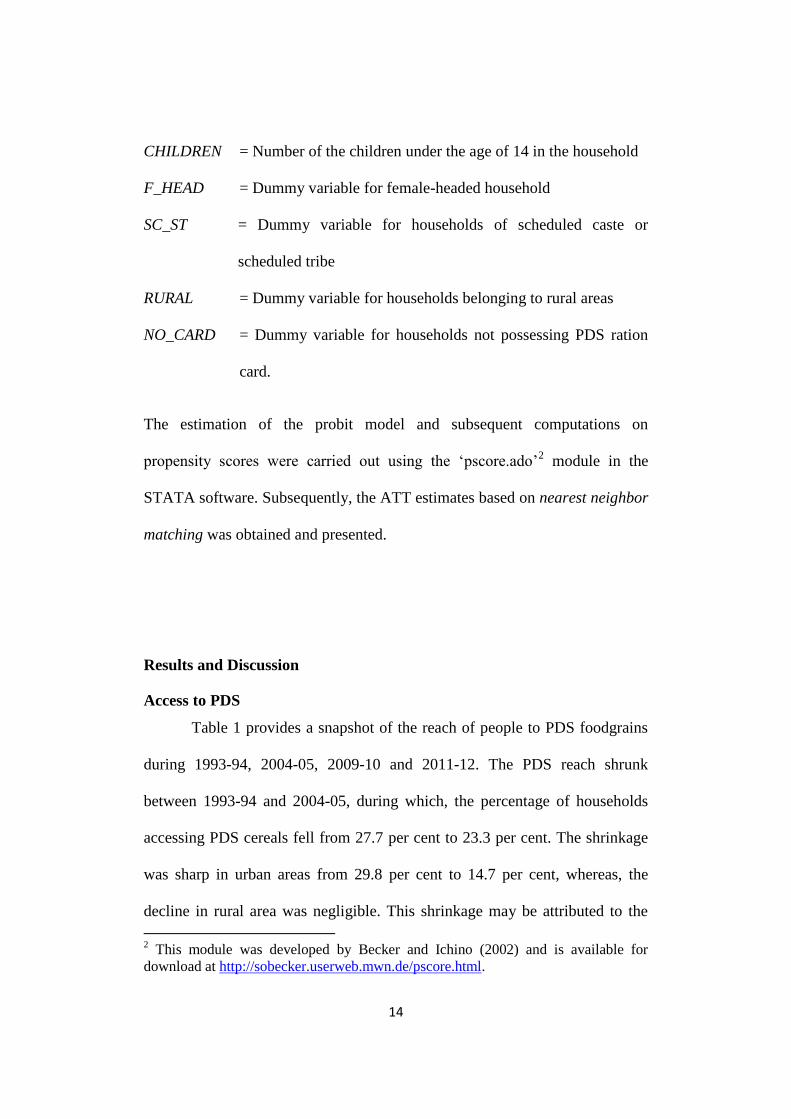
shift from universal to TPDS in 1997 along with sharp increase in issue prices
for APL households. This eliminated the existing urban bias to a great extent,
but appeared to have increased exclusion errors significantly (Himanshu and
Sen, 2013). But, the share of PDS in consumption of cereals increased slightly
from 8.5 per cent to 9.8 per cent during this period and the increase was
confined to rural households only (from 7.7% to 10.6%). In urban households,
it declined from 11.4 per cent to 7.3 per cent.
Table 1: Contribution of PDS in household consumption of foodgrains
Year
Households accessing PDS for cereals
(%)
Share of PDS in cereal consumption
(%)
Rural Urban All Rural Urban All
1993-94 26.6 29.1 27.3 7.7 11.4 8.5
2004-05 26.6 14.7 23.3 10.6 7.3 9.8
2009-10 44.9 26.2 39.4 19.3 13.2 17.8
2011-12 52.1 28.5 44.8 21.7 13.9 19.7
Source: Authors‟ estimates based on unit level data from NSSO surveys
The subsequent period after 2004-05 saw a reversal of the earlier
shrinkage in terms of access to PDS. The percentage of people who accessed
PDS cereals in 2011-12 was much higher than that in 2004-05 and 1993-94. In
2011-12, 44.7 per cent of the households accessed PDS for purchase of
cereals, with 52.1 per cent in rural areas and 28.5 per cent in urban areas. In
terms of quantity also, this increase was explicitly evident. PDS accounted for
about one-fifth (19.7%) of the total consumption of rice and wheat in 2011-12,
with 21.7 per cent in rural areas and 13.9 per cent in urban areas. The
expansion PDS access was widespread and improvement was recorded in most
of the Indian states. By 2009-10, a majority of households were accessing
16
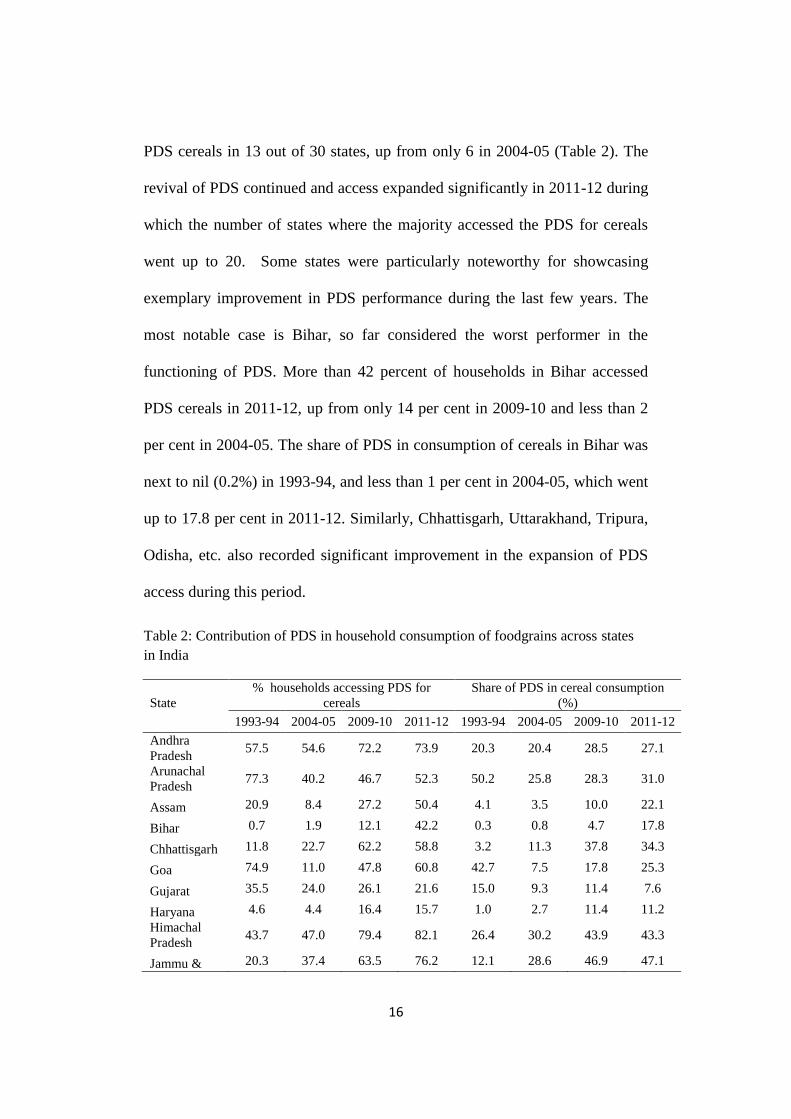
PDS cereals in 13 out of 30 states, up from only 6 in 2004-05 (Table 2). The
revival of PDS continued and access expanded significantly in 2011-12 during
which the number of states where the majority accessed the PDS for cereals
went up to 20. Some states were particularly noteworthy for showcasing
exemplary improvement in PDS performance during the last few years. The
most notable case is Bihar, so far considered the worst performer in the
functioning of PDS. More than 42 percent of households in Bihar accessed
PDS cereals in 2011-12, up from only 14 per cent in 2009-10 and less than 2
per cent in 2004-05. The share of PDS in consumption of cereals in Bihar was
next to nil (0.2%) in 1993-94, and less than 1 per cent in 2004-05, which went
up to 17.8 per cent in 2011-12. Similarly, Chhattisgarh, Uttarakhand, Tripura,
Odisha, etc. also recorded significant improvement in the expansion of PDS
access during this period.
Table 2: Contribution of PDS in household consumption of foodgrains across states
in India
State
% households accessing PDS for
cereals
Share of PDS in cereal consumption
(%)
1993-94 2004-05 2009-10 2011-12 1993-94 2004-05 2009-10 2011-12
Andhra
Pradesh 57.5 54.6 72.2 73.9 20.3 20.4 28.5 27.1
Arunachal
Pradesh 77.3 40.2 46.7 52.3 50.2 25.8 28.3 31.0
Assam 20.9 8.4 27.2 50.4 4.1 3.5 10.0 22.1
Bihar 0.7 1.9 12.1 42.2 0.3 0.8 4.7 17.8
Chhattisgarh 11.8 22.7 62.2 58.8 3.2 11.3 37.8 34.3
Goa 74.9 11.0 47.8 60.8 42.7 7.5 17.8 25.3
Gujarat 35.5 24.0 26.1 21.6 15.0 9.3 11.4 7.6
Haryana 4.6 4.4 16.4 15.7 1.0 2.7 11.4 11.2
Himachal
Pradesh 43.7 47.0 79.4 82.1 26.4 30.2 43.9 43.3
Jammu & 20.3 37.4 63.5 76.2 12.1 28.6 46.9 47.1

17
Kashmir
Jharkhand 12.7 5.5 23.7 27.6 2.6 2.0 13.5 15.0
Karnataka 54.6 47.1 56.4 60.3 17.1 34.5 32.9 26.0
Kerala 78.3 36.7 57.1 76.8 44.8 18.7 26.3 34.0
Madhya
Pradesh 11.2 20.9 42.3 35.6 3.3 11.2 19.2 16.6
Maharashtra 32.5 21.1 33.1 31.3 12.4 15.4 21.8 17.6
Manipur 3.7 0.5 8.5 5.3 2.1 0.3 2.4 1.4
Meghalaya 60.8 19.0 54.0 60.6 20.8 10.3 26.1 27.0
Mizoram 91.9 63.5 90.8 92.6 54.5 37.2 41.5 46.9
Nagaland 4.2 0.2 0.0 13.8 3.1 0.0 0.0 5.4
Odisha 6.4 19.4 49.9 58.3 1.2 6.0 22.3 27.2
Punjab 1.5 0.4 18.8 17.4 0.8 0.3 11.5 10.1
Rajasthan 14.2 10.1 16.4 26.0 10.6 8.1 9.0 10.4
Sikkim 47.1 38.4 38.5 45.9 47.9 28.7 31.3 36.5
Tamil Nadu 65.7 68.2 84.2 82.6 19.3 35.1 47.9 47.8
Tripura 57.0 33.7 72.0 81.3 19.8 20.7 31.9 40.1
Uttar
Pradesh 1.6 5.7 21.5 24.7 0.6 2.4 10.0 12.4
Uttarakhand 56.3 20.3 28.3 63.4 44.1 13.1 16.0 25.9
West Bengal 16.4 12.7 32.2 43.4 3.9 2.9 8.3 12.3
All India 27.3 23.3 39.4 44.7 8.5 9.8 17.8 19.7
Source: Same as in Table 1
The impressive advances discussed above could be partly attributed to
the sharp increase in food inflation, which made PDS more attractive. Also, in
recent years, many states have taken several initiatives to revive PDS
infrastructure and to plug the rampant leakages in PDS grains distribution. A
number of studies report improvements in the functioning of PDS and
reduction in leakages (for example, Khera, 2011a and 2011b; Himanshu and
Sen, 2011; Kumar et al., 2012). The estimated proportions of cereals diverted
from PDS in 1993-94, 2004-05, 2009-10 and 2011-12 are depicted in Table 33.
3 Using NSS data on per capita monthly purchase of wheat and rice from the PDS, the
aggregate purchase of PDS cereals in each state has been estimated. This total purchase by the
consumers has been compared with the corresponding „offtake‟ figure for that state. The
18
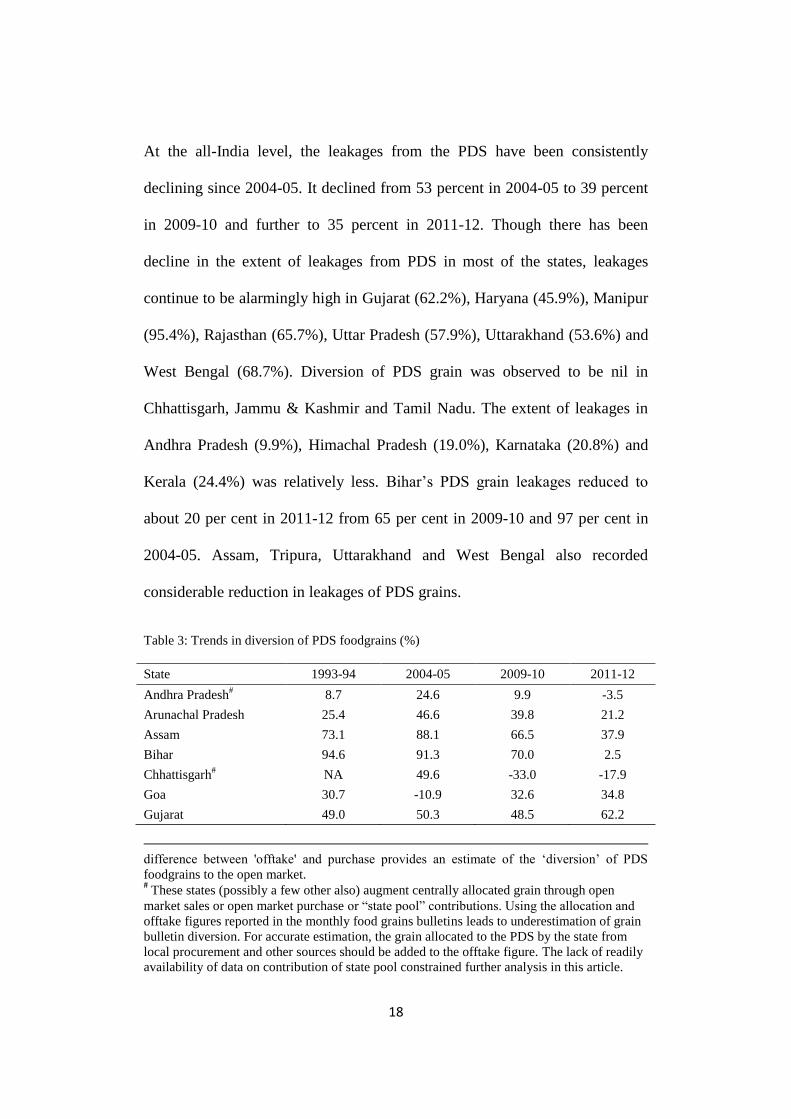
At the all-India level, the leakages from the PDS have been consistently
declining since 2004-05. It declined from 53 percent in 2004-05 to 39 percent
in 2009-10 and further to 35 percent in 2011-12. Though there has been
decline in the extent of leakages from PDS in most of the states, leakages
continue to be alarmingly high in Gujarat (62.2%), Haryana (45.9%), Manipur
(95.4%), Rajasthan (65.7%), Uttar Pradesh (57.9%), Uttarakhand (53.6%) and
West Bengal (68.7%). Diversion of PDS grain was observed to be nil in
Chhattisgarh, Jammu & Kashmir and Tamil Nadu. The extent of leakages in
Andhra Pradesh (9.9%), Himachal Pradesh (19.0%), Karnataka (20.8%) and
Kerala (24.4%) was relatively less. Bihar‟s PDS grain leakages reduced to
about 20 per cent in 2011-12 from 65 per cent in 2009-10 and 97 per cent in
2004-05. Assam, Tripura, Uttarakhand and West Bengal also recorded
considerable reduction in leakages of PDS grains.
Table 3: Trends in diversion of PDS foodgrains (%)
State 1993-94 2004-05 2009-10 2011-12
Andhra Pradesh# 8.7 24.6 9.9 -3.5
Arunachal Pradesh 25.4 46.6 39.8 21.2
Assam 73.1 88.1 66.5 37.9
Bihar 94.6 91.3 70.0 2.5
Chhattisgarh#
NA 49.6 -33.0 -17.9
Goa 30.7 -10.9 32.6 34.8
Gujarat 49.0 50.3 48.5 62.2
difference between 'offtake' and purchase provides an estimate of the „diversion‟ of PDS
foodgrains to the open market. # These states (possibly a few other also) augment centrally allocated grain through open
market sales or open market purchase or “state pool” contributions. Using the allocation and
offtake figures reported in the monthly food grains bulletins leads to underestimation of grain
bulletin diversion. For accurate estimation, the grain allocated to the PDS by the state from
local procurement and other sources should be added to the offtake figure. The lack of readily
availability of data on contribution of state pool constrained further analysis in this article.

19
Haryana 91.2 83.5 35.5 45.9
Himachal Pradesh 56.0 24.4 19.0 17.3
Jammu & Kashmir# 83.9 17.3 -12.0 -21.2
Jharkhand NA 84.2 41.7 30.9
Karnataka 40.3 27.4 20.8 17.6
Kerala 20.9 24.9 24.4 18.6
Madhya Pradesh 50.0 46.4 43.7 37.8
Maharashtra 56.6 47.6 39.1 37.1
Manipur 88.3 98.0 91.2 95.4
Meghalaya 61.7 64.9 35.6 45.5
Mizoram# 43.4 45.0 11.6 -18.0
Nagaland 94.4 100.0 100.0 87.8
Odisha 85.8 73.4 27.4 11.4
Punjab 84.6 94.2 65.0 55.7
Rajasthan 97.9 55.3 65.7 52.6
Sikkim 47.7 42.3 46.4 38.2
Tamil Nadu# -12.6 -4.6 0.5 -3.4
Tripura 49.9 44.9 32.3 11.2
Uttar Pradesh 59.8 83.7 57.9 50.0
Uttaranchal NA 19.5 53.6 16.8
West Bengal 80.8 84.5 68.7 53.1
India 46.7 52.9 39.3 28.5
Note: NA denotes „not available‟ Source: Same as in Table 1
The trends in increasing contribution of PDS in foodgrains
consumption and reducing PDS leakages clearly indicate that wider PDS
access reduces PDS leakages. This has been observed earlier by Himanshu and
Sen (2011) and Kumar et al. (2012). The correlation across states between
access and leakage was found negative and significant.
Trends in Income Transfers through PDS
Table 4 presents the value of in-kind food transfers through PDS. The
value of per capita PDS food transfers is calculated as the excess, if any, of the
market cost of PDS purchases over what was actually incurred as out of
pocket expenditure on them. To maintain the temporal comparability, the PDS
20
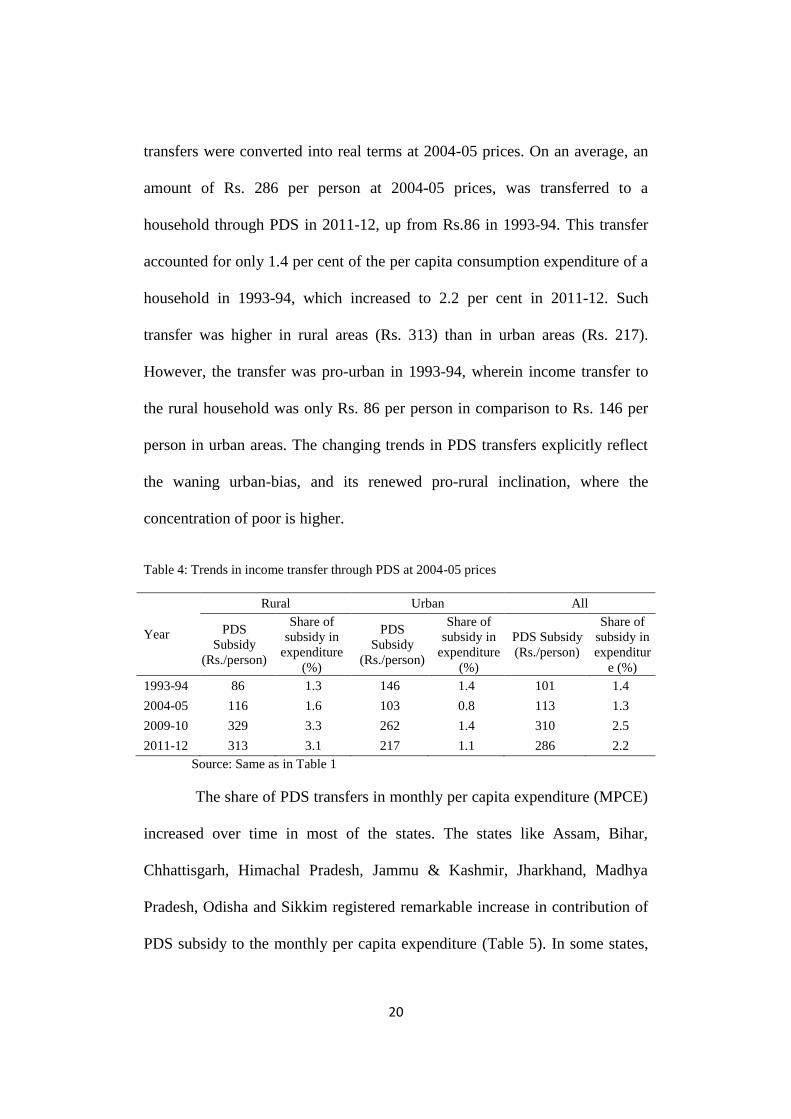
transfers were converted into real terms at 2004-05 prices. On an average, an
amount of Rs. 286 per person at 2004-05 prices, was transferred to a
household through PDS in 2011-12, up from Rs.86 in 1993-94. This transfer
accounted for only 1.4 per cent of the per capita consumption expenditure of a
household in 1993-94, which increased to 2.2 per cent in 2011-12. Such
transfer was higher in rural areas (Rs. 313) than in urban areas (Rs. 217).
However, the transfer was pro-urban in 1993-94, wherein income transfer to
the rural household was only Rs. 86 per person in comparison to Rs. 146 per
person in urban areas. The changing trends in PDS transfers explicitly reflect
the waning urban-bias, and its renewed pro-rural inclination, where the
concentration of poor is higher.
Table 4: Trends in income transfer through PDS at 2004-05 prices
Year
Rural Urban All
PDS
Subsidy
(Rs./person)
Share of
subsidy in
expenditure
(%)
PDS
Subsidy
(Rs./person)
Share of
subsidy in
expenditure
(%)
PDS Subsidy
(Rs./person)
Share of
subsidy in
expenditur
e (%)
1993-94 86 1.3 146 1.4 101 1.4
2004-05 116 1.6 103 0.8 113 1.3
2009-10 329 3.3 262 1.4 310 2.5
2011-12 313 3.1 217 1.1 286 2.2
Source: Same as in Table 1
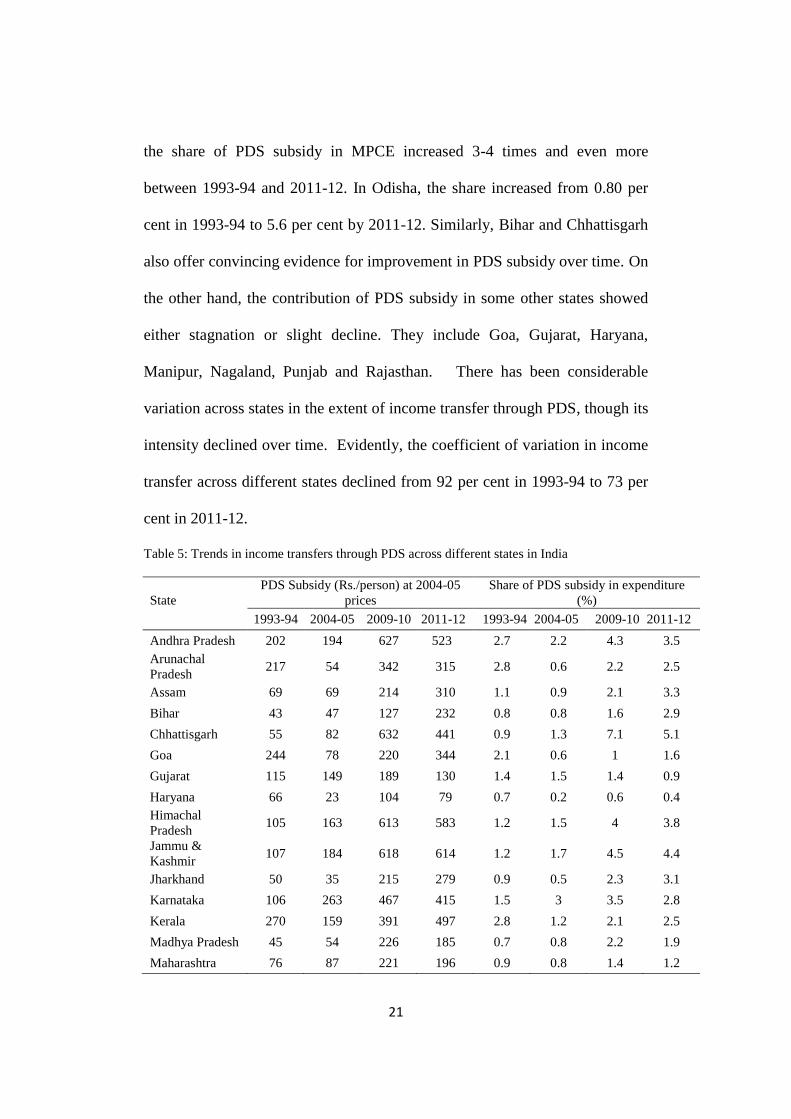
The share of PDS transfers in monthly per capita expenditure (MPCE)
increased over time in most of the states. The states like Assam, Bihar,
Chhattisgarh, Himachal Pradesh, Jammu & Kashmir, Jharkhand, Madhya
Pradesh, Odisha and Sikkim registered remarkable increase in contribution of
PDS subsidy to the monthly per capita expenditure (Table 5). In some states,
21
the share of PDS subsidy in MPCE increased 3-4 times and even more
between 1993-94 and 2011-12. In Odisha, the share increased from 0.80 per
cent in 1993-94 to 5.6 per cent by 2011-12. Similarly, Bihar and Chhattisgarh
also offer convincing evidence for improvement in PDS subsidy over time. On
the other hand, the contribution of PDS subsidy in some other states showed
either stagnation or slight decline. They include Goa, Gujarat, Haryana,
Manipur, Nagaland, Punjab and Rajasthan. There has been considerable
variation across states in the extent of income transfer through PDS, though its
intensity declined over time. Evidently, the coefficient of variation in income
transfer across different states declined from 92 per cent in 1993-94 to 73 per
cent in 2011-12.
Table 5: Trends in income transfers through PDS across different states in India
State
PDS Subsidy (Rs./person) at 2004-05
prices
Share of PDS subsidy in expenditure
(%)
1993-94 2004-05 2009-10 2011-12 1993-94 2004-05 2009-10 2011-12
Andhra Pradesh 202 194 627 523 2.7 2.2 4.3 3.5
Arunachal
Pradesh 217 54 342 315 2.8 0.6 2.2 2.5
Assam 69 69 214 310 1.1 0.9 2.1 3.3
Bihar 43 47 127 232 0.8 0.8 1.6 2.9
Chhattisgarh 55 82 632 441 0.9 1.3 7.1 5.1
Goa 244 78 220 344 2.1 0.6 1 1.6
Gujarat 115 149 189 130 1.4 1.5 1.4 0.9
Haryana 66 23 104 79 0.7 0.2 0.6 0.4
Himachal
Pradesh 105 163 613 583 1.2 1.5 4 3.8
Jammu &
Kashmir 107 184 618 614 1.2 1.7 4.5 4.4
Jharkhand 50 35 215 279 0.9 0.5 2.3 3.1
Karnataka 106 263 467 415 1.5 3 3.5 2.8
Kerala 270 159 391 497 2.8 1.2 2.1 2.5
Madhya Pradesh 45 54 226 185 0.7 0.8 2.2 1.9
Maharashtra 76 87 221 196 0.9 0.8 1.4 1.2

22
Manipur 21 15 81 43 0.3 0.2 0.8 0.4
Meghalaya 138 67 294 281 1.6 0.7 2.6 2.3
Mizoram 387 217 544 736 3.8 1.8 3.7 5
Nagaland 51 0 0 58 0.5 0 0 0.4
Odisha 43 60 399 468 0.8 1 4.6 5.6
Punjab 50 8 108 80 0.5 0.1 0.6 0.4
Rajasthan 53 48 104 115 0.7 0.6 0.8 0.9
Sikkim 71 245 467 578 1 2.6 3.5 4.4
Tamil Nadu 262 474 1095 740 3.3 4.8 7.6 4.7
Tripura 213 203 562 599 2.6 2.9 4.6 5.7
Uttar Pradesh 37 49 164 145 0.5 0.7 1.7 1.4
Uttaranchal 271 98 222 450 3.4 1.1 1.3 3.2
West Bengal 99 93 197 238 1.3 1.1 1.7 2
India 101 113 310 286 1.4 1.3 2.5 2.2
Source: Same as in Table 1
Impact of PDS on Poverty
The increased access to PDS has also played a role in reducing the
poverty and enhancing the food security in the country. The PDS contributed
to overall reduction in poverty by 3.5 per cent points in 2011-12, with 4.2 per
cent points in rural areas and 1.7 per cent points in urban areas (Table 6).
Though in percentage terms the change look small, in absolute terms, it
amounts to around 40 million people who came out of poverty. It was also
worth noting that, the impact of PDS transfers to poverty reduction has
increased over time. The contribution of PDS transfers to poverty reduction
was only 1.5 per cent points in 1993-94, which rose to 3.5 per cent points in
2011-12. Further, the contribution of PDS transfers in poverty reduction was
more in rural areas than in urban areas, except in 1993-94. The impact of PDS
transfers is also visible in reducing the poverty gap index. The poverty gap
index was found declining over time with similar trends as that in the case of
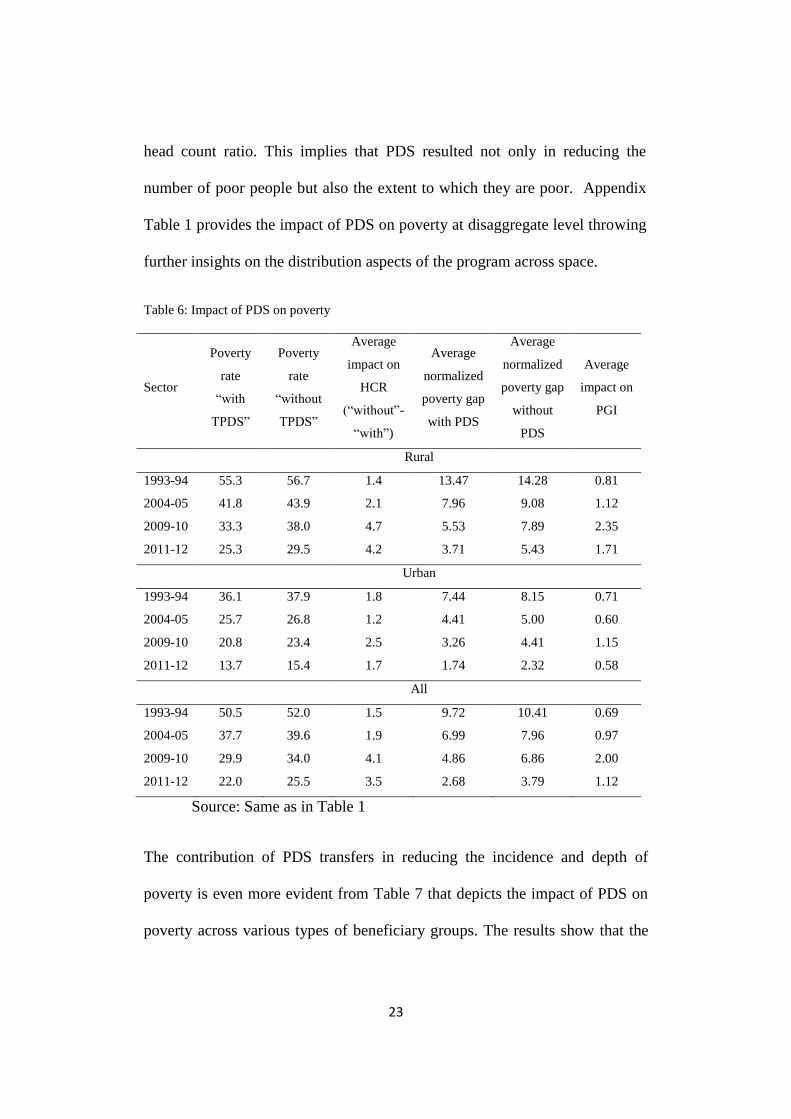
23
head count ratio. This implies that PDS resulted not only in reducing the
number of poor people but also the extent to which they are poor. Appendix
Table 1 provides the impact of PDS on poverty at disaggregate level throwing
further insights on the distribution aspects of the program across space.
Table 6: Impact of PDS on poverty
Sector
Poverty
rate
“with
TPDS”
Poverty
rate
“without
TPDS”
Average
impact on
HCR
(“without”-
“with”)
Average
normalized
poverty gap
with PDS
Average
normalized
poverty gap
without
PDS
Average
impact on
PGI
Rural
1993-94 55.3 56.7 1.4 13.47 14.28 0.81
2004-05 41.8 43.9 2.1 7.96 9.08 1.12
2009-10 33.3 38.0 4.7 5.53 7.89 2.35
2011-12 25.3 29.5 4.2 3.71 5.43 1.71
Urban
1993-94 36.1 37.9 1.8 7.44 8.15 0.71
2004-05 25.7 26.8 1.2 4.41 5.00 0.60
2009-10 20.8 23.4 2.5 3.26 4.41 1.15
2011-12 13.7 15.4 1.7 1.74 2.32 0.58
All
1993-94 50.5 52.0 1.5 9.72 10.41 0.69
2004-05 37.7 39.6 1.9 6.99 7.96 0.97
2009-10 29.9 34.0 4.1 4.86 6.86 2.00
2011-12 22.0 25.5 3.5 2.68 3.79 1.12
Source: Same as in Table 1
The contribution of PDS transfers in reducing the incidence and depth of
poverty is even more evident from Table 7 that depicts the impact of PDS on
poverty across various types of beneficiary groups. The results show that the
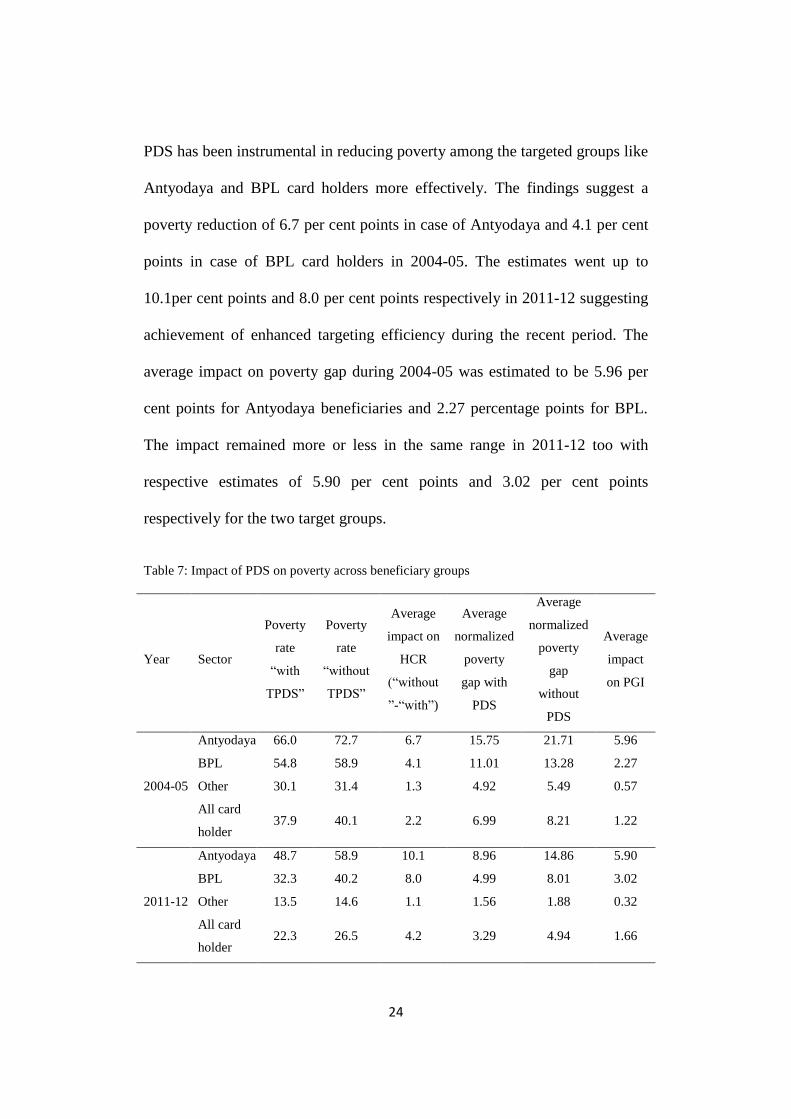
24
PDS has been instrumental in reducing poverty among the targeted groups like
Antyodaya and BPL card holders more effectively. The findings suggest a
poverty reduction of 6.7 per cent points in case of Antyodaya and 4.1 per cent
points in case of BPL card holders in 2004-05. The estimates went up to
10.1per cent points and 8.0 per cent points respectively in 2011-12 suggesting
achievement of enhanced targeting efficiency during the recent period. The
average impact on poverty gap during 2004-05 was estimated to be 5.96 per
cent points for Antyodaya beneficiaries and 2.27 percentage points for BPL.
The impact remained more or less in the same range in 2011-12 too with
respective estimates of 5.90 per cent points and 3.02 per cent points
respectively for the two target groups.
Table 7: Impact of PDS on poverty across beneficiary groups
Year Sector
Poverty
rate
“with
TPDS”
Poverty
rate
“without
TPDS”
Average
impact on
HCR
(“without
”-“with”)
Average
normalized
poverty
gap with
PDS
Average
normalized
poverty
gap
without
PDS
Average
impact
on PGI
2004-05
Antyodaya 66.0 72.7 6.7 15.75 21.71 5.96
BPL 54.8 58.9 4.1 11.01 13.28 2.27
Other 30.1 31.4 1.3 4.92 5.49 0.57
All card
holder 37.9 40.1 2.2 6.99 8.21 1.22
2011-12
Antyodaya 48.7 58.9 10.1 8.96 14.86 5.90
BPL 32.3 40.2 8.0 4.99 8.01 3.02
Other 13.5 14.6 1.1 1.56 1.88 0.32
All card
holder 22.3 26.5 4.2 3.29 4.94 1.66
25
Source: Same as in Table 1
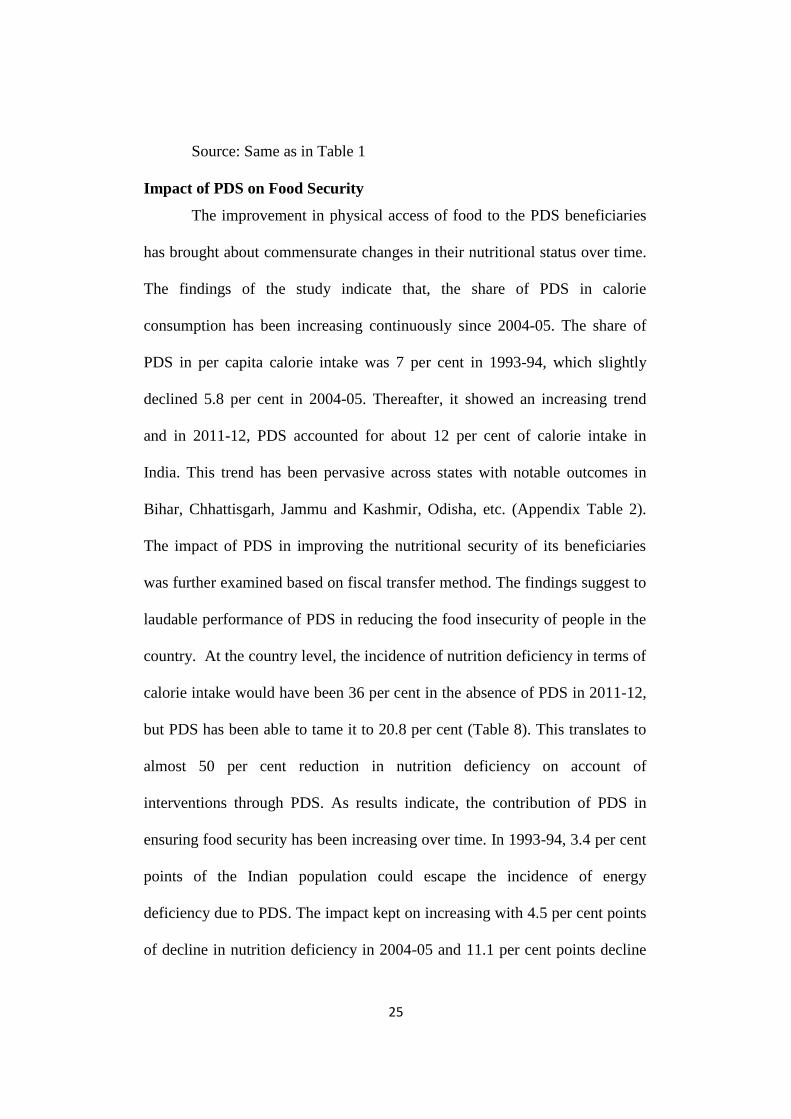
Impact of PDS on Food Security
The improvement in physical access of food to the PDS beneficiaries
has brought about commensurate changes in their nutritional status over time.
The findings of the study indicate that, the share of PDS in calorie
consumption has been increasing continuously since 2004-05. The share of
PDS in per capita calorie intake was 7 per cent in 1993-94, which slightly
declined 5.8 per cent in 2004-05. Thereafter, it showed an increasing trend
and in 2011-12, PDS accounted for about 12 per cent of calorie intake in
India. This trend has been pervasive across states with notable outcomes in
Bihar, Chhattisgarh, Jammu and Kashmir, Odisha, etc. (Appendix Table 2).
The impact of PDS in improving the nutritional security of its beneficiaries
was further examined based on fiscal transfer method. The findings suggest to
laudable performance of PDS in reducing the food insecurity of people in the
country. At the country level, the incidence of nutrition deficiency in terms of
calorie intake would have been 36 per cent in the absence of PDS in 2011-12,
but PDS has been able to tame it to 20.8 per cent (Table 8). This translates to
almost 50 per cent reduction in nutrition deficiency on account of
interventions through PDS. As results indicate, the contribution of PDS in
ensuring food security has been increasing over time. In 1993-94, 3.4 per cent
points of the Indian population could escape the incidence of energy
deficiency due to PDS. The impact kept on increasing with 4.5 per cent points
of decline in nutrition deficiency in 2004-05 and 11.1 per cent points decline

26
in 2009-10, and further by 15.4 per cent points in 2011-12, the latest in the
series. On similar lines, the depth of nutrition deficiency as measured by NGI
also kept on decreasing over years, with the average impact increasing for
successive rounds of data. With increased access in rural areas, the impact of
PDS on food security has been more than their counterparts in urban areas
during all years under study except 1993-94.
Table 8: Impact of PDS on food security
Sector
Nutrition
deficiency
“with
TPDS”
Nutrition
deficiency
“without
TPDS”
Average
impact on
nutrition
deficiency
(“without”-
“with”
Average
normalized
nutrition
gap with
PDS
Average
normalized
nutrition
gap
without
PDS
Average
impact
on NGI
Rural
1993-94 31.2 34.2 3.1 4.97 5.96 0.99
2004-05 31.2 35.9 4.7 4.46 6.84 2.39
2009-10 27.4 39.4 12.0 3.17 7.86 4.69
2011-12 24.2 42.0 17.8 2.66 8.37 5.70
Urban
1993-94 19.1 23.3 4.2 2.96 3.77 0.81
2004-05 11.1 14.9 3.8 1.63 2.35 0.72
2009-10 16.1 24.6 8.5 1.72 3.83 2.11
2011-12 12.3 21.8 9.5 1.06 3.03 1.98
All
1993-94 28.2 31.5 3.4 3.66 4.53 0.86
2004-05 26.1 30.6 4.5 3.68 5.61 1.93
2009-10 24.3 35.4 11.1 2.74 6.67 3.93
2011-12 20.8 36.2 15.4 1.93 5.91 3.98
Source: Same as in Table 1

27
The role of PDS in taming nutrition deficiency seems to be more
critical among the Antyodaya and BPL cardholders. A little less than half of
Antyodaya cardholders (45.2%) and one-third of BPL card holders could get
adequate calorie only because of the PDS in 2011-12 (Table 9). Though
relatively lower in terms of impact, the contribution of PDS in improving
nutritional intake of Antyodaya and BPL in 2004-05 was also appreciable. A
similar analysis across states proves that the nutrition enhancing impact of
PDS has been widespread through the country though the effects were
disproportionate across states (Appendix Table 3). These evidences clearly
suggest that food transfers through PDS have considerable impact on
improving food security and thus should be further strengthened.
Table 9: Impact of PDS on food security across beneficiary groups
Year Sector
Nutrition
deficiency
“with
TPDS”
Nutrition
deficiency
“without
TPDS”
Average
impact on
nutrition
deficiency
(“without”-
“with”)
Average
normalized
nutrition
gap with
PDS
Average
normalized
nutrition
gap without
PDS
Average
impact on
NGI
2004-05
Antyodaya 38.6 65.0 26.4 5.03 17.85 12.81
BPL 37.0 49.4 12.4 5.20 10.05 4.85
Other 20.9 22.8 1.9 2.42 3.38 0.96
All card
holder 25.8 31.3 5.5 3.29 5.72 2.43
2011-12
Antyodaya 27.4 72.6 45.2 2.82 20.48 17.66
BPL 24.5 58.8 34.3 2.61 12.48 9.87
Other 17.0 22.2 5.2 1.70 3.13 1.43
All card
holder 20.4 38.5 18.1 2.11 7.66 5.55
Source: Same as in Table 1
28
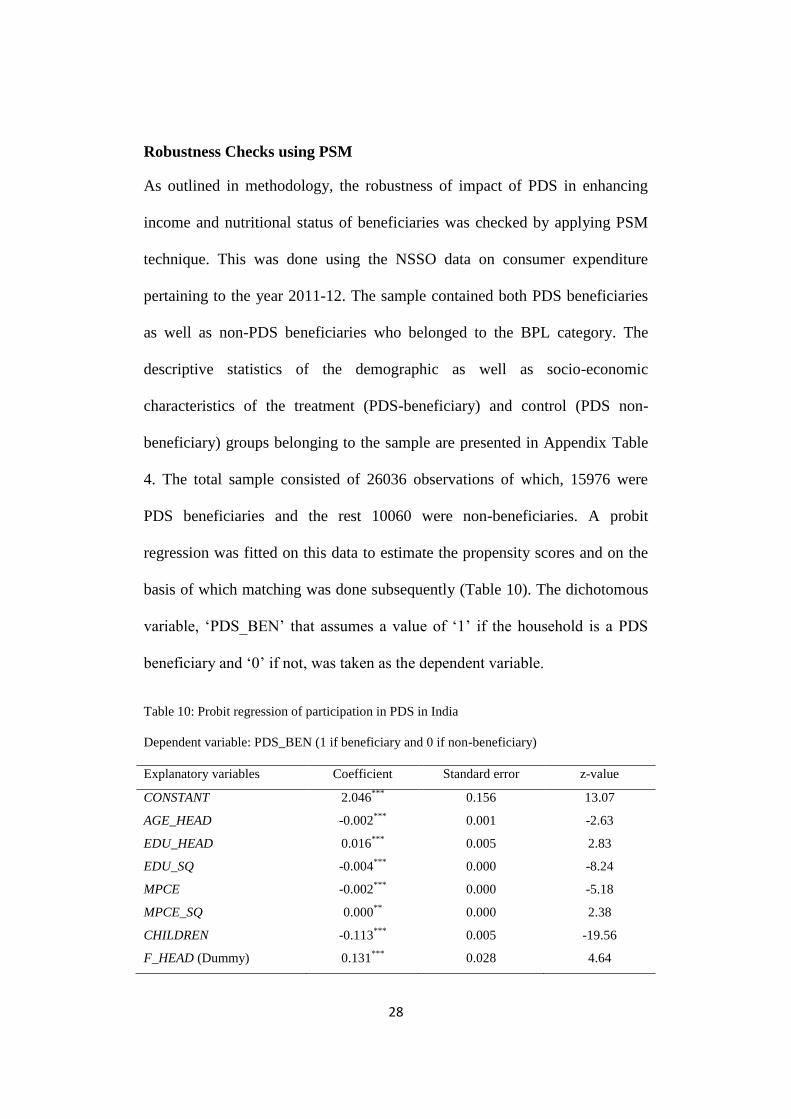
Robustness Checks using PSM
As outlined in methodology, the robustness of impact of PDS in enhancing
income and nutritional status of beneficiaries was checked by applying PSM
technique. This was done using the NSSO data on consumer expenditure
pertaining to the year 2011-12. The sample contained both PDS beneficiaries
as well as non-PDS beneficiaries who belonged to the BPL category. The
descriptive statistics of the demographic as well as socio-economic
characteristics of the treatment (PDS-beneficiary) and control (PDS non-
beneficiary) groups belonging to the sample are presented in Appendix Table
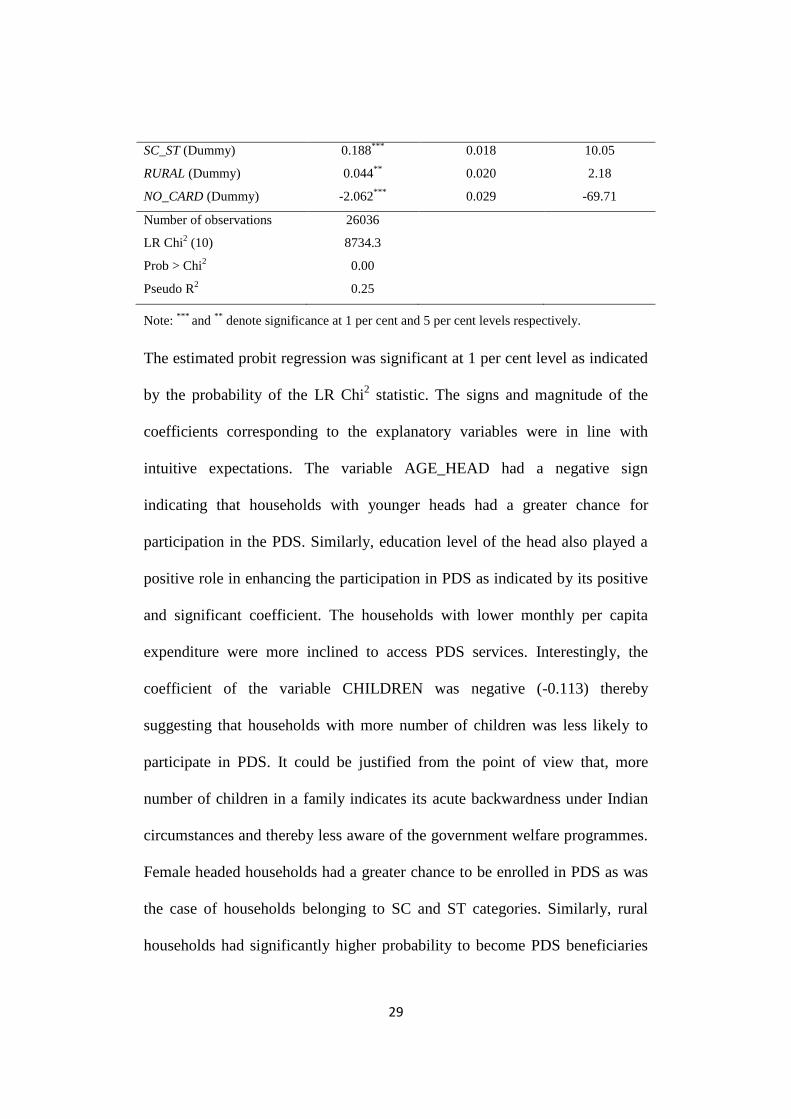
4. The total sample consisted of 26036 observations of which, 15976 were
PDS beneficiaries and the rest 10060 were non-beneficiaries. A probit
regression was fitted on this data to estimate the propensity scores and on the
basis of which matching was done subsequently (Table 10). The dichotomous
variable, „PDS_BEN‟ that assumes a value of „1‟ if the household is a PDS
beneficiary and „0‟ if not, was taken as the dependent variable.
Table 10: Probit regression of participation in PDS in India
Dependent variable: PDS_BEN (1 if beneficiary and 0 if non-beneficiary)
Explanatory variables Coefficient Standard error z-value
CONSTANT 2.046***
0.156 13.07
AGE_HEAD -0.002***
0.001 -2.63
EDU_HEAD 0.016***
0.005 2.83
EDU_SQ -0.004***
0.000 -8.24
MPCE -0.002***
0.000 -5.18
MPCE_SQ 0.000**
0.000 2.38
CHILDREN -0.113***
0.005 -19.56
F_HEAD (Dummy) 0.131***
0.028 4.64
29
SC_ST (Dummy) 0.188***
0.018 10.05
RURAL (Dummy) 0.044**
0.020 2.18
NO_CARD (Dummy) -2.062***
0.029 -69.71
Number of observations 26036
LR Chi2 (10) 8734.3
Prob > Chi2 0.00
Pseudo R2 0.25
Note: ***
and **
denote significance at 1 per cent and 5 per cent levels respectively.
The estimated probit regression was significant at 1 per cent level as indicated
by the probability of the LR Chi2 statistic. The signs and magnitude of the
coefficients corresponding to the explanatory variables were in line with
intuitive expectations. The variable AGE_HEAD had a negative sign
indicating that households with younger heads had a greater chance for
participation in the PDS. Similarly, education level of the head also played a
positive role in enhancing the participation in PDS as indicated by its positive
and significant coefficient. The households with lower monthly per capita
expenditure were more inclined to access PDS services. Interestingly, the
coefficient of the variable CHILDREN was negative (-0.113) thereby
suggesting that households with more number of children was less likely to
participate in PDS. It could be justified from the point of view that, more
number of children in a family indicates its acute backwardness under Indian
circumstances and thereby less aware of the government welfare programmes.
Female headed households had a greater chance to be enrolled in PDS as was
the case of households belonging to SC and ST categories. Similarly, rural
households had significantly higher probability to become PDS beneficiaries

30
in relation to their urban counterparts. As possession of a ration card is the
basic criterion that determines access to the PDS services, the variable
NO_CARD had a very high negative and significant coefficient (-2.06). This
clearly suggests that, non-possession of ration card is a defining factor that
renders a household inaccessible to the PDS. The above results vividly bring
out the fact that targeting has been successful to a great extent in India.
Evidently, female-headed households, backward caste households, lower
income households, etc. find greater chances to be able to participate in the
subsidized PDS services. However, those households with younger and better
educated heads were more likely to get themselves enrolled to the government
sponsored welfare program.
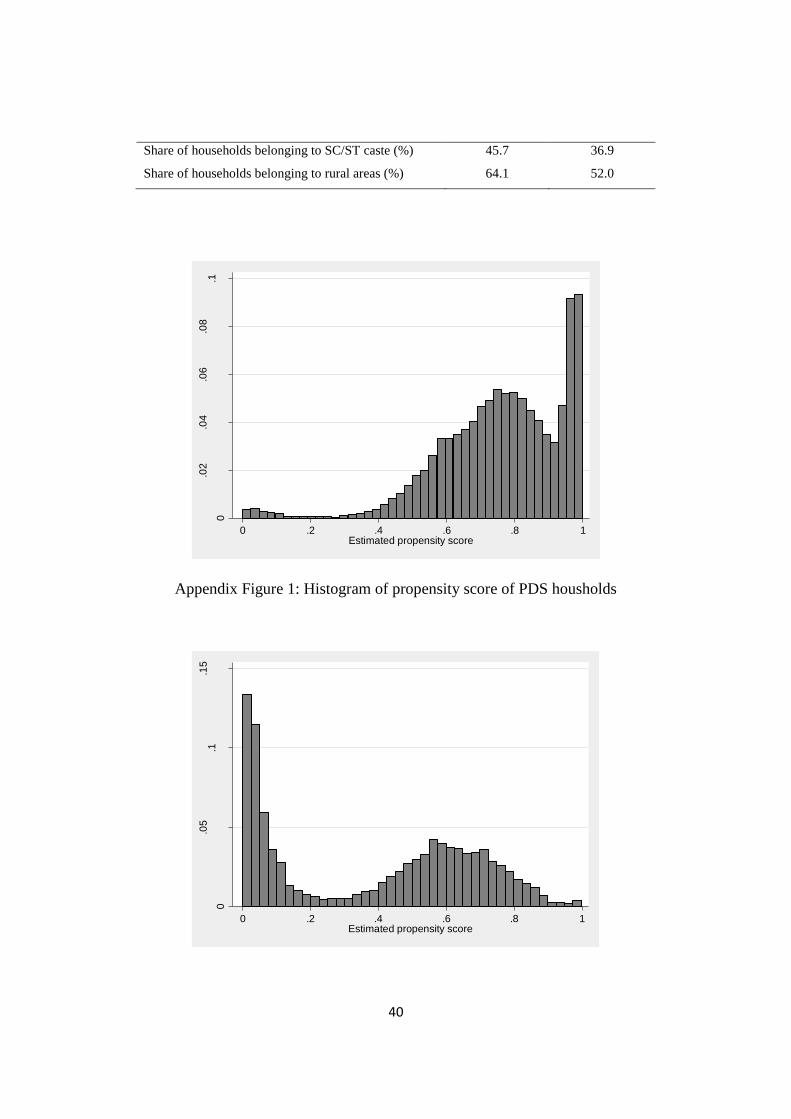
Based on the observable variables that were included in the probit regression,
the propensity scores for the treatment as well as control groups of households
were estimated. The histograms of the propensity scores corresponding to the
PDS and non-PDS households are presented in Appendix Figures 1 and 2
respectively. Within the region of common support, the mean value of the
estimated propensity score was 0.61 with a standard deviation of 0.26. The
final number of blocks was 14, into which the estimated propensity scores
were categorized. This ensures that, the mean propensity score in each block
for the treatment and control groups is not different so that matching could be
done with minimum bias. The balancing property was satisfied thereby
warranting that treatment is independent of unit characteristics after

31
conditioning on the observed variables. The ATT estimates that corresponds to
the changes in household food expenditure, food share in total expenditure as
well as net gains in calorie consumption from participation in PDS based on
matching algorithms are presented in Table 11.
Table 11: ATT estimates (nearest neighbor) corresponding to food expenditure, food share in
total expenditure and calorie consumption of sample households
Mean effects on the parameter ATT Standard error t-value
Monthly food expenditure (Rs.) -152.4***
26.4 -5.78
Average share of food in total expenditure (%) -1.79***
0.19 -9.42
Calorie consumption (K Cal/day) 79.39***
7.42 10.70
*** denote significance at 1 per cent level. Source: Same as in Table 1
The ATT estimates pertaining to all three parameters were found to be
significant at 1 per cent level. Based on nearest neighbor matching, the
monthly household food expenditure of the treatment group was found to be
lower than the control group by Rs. 152.4 with a standard error of 26.4. This
suggests that PDS participation lowers the food expenditure of the
beneficiaries on account of the subsidy component associated with the food
transfers. Further, the share of food in total expenditure of the PDS
beneficiaries was observed to be lower than the counterfactuals by 1.79 per
cent, thereby allowing the households to spend a greater share of their income
on other non-food necessities. These findings reinforce the earlier findings of
the study that, PDS enhances the economic status of the households thereby
enabling them to escape from the poverty trap. On the nutrition front, the
calorie gain that could be attributed to PDS participation was estimated to be

32
79.39 KCal/day with a standard error of 7.42. This clearly underscores the
benefits of PDS in enhancing nutritional intake of BPL households in India. In
nutshell, the results of the PSM analysis conclusively proves the income
augmentation and nutrition enhancement effects of India‟s PDS thereby
attributing a part of the success of poverty alleviation as well as malnutrition
eradication efforts undertaken in the country to this well acclaimed program
that has been a part of India‟s development story over decades.
Conclusions and Policy Implications
PDS in India is one of the largest welfare programmes in the world with the
primary aim of improving food and nutrition security of the socially and
economically deprived sections in the country. Though it managed to survive
through the innumerous challenges over decades, PDS is facing intense
scrutiny in the midst of neo-liberal ideas of replacing it with alternatives such
as food stamps, cash transfers, etc. In this context, this paper attempts to assess
the impact of PDS in improving the economic access of the poor to essential
food grains and consequent nutritional outcomes over the past decade and half.
The study used fiscal transfer method to estimate the subsidy transfer through
PDS and its indirect benefits as a window for the poor to escape poverty.
Through this the average impact of PDS on head count ratio of poverty as well
as poverty gap index were worked out. The findings suggest that at All India
level, poverty rate reduced by around 3.5 per cent points in 2011-12 on
33
account of PDS subsidy transfers. Such impact was pervasive across
rural/urban and regional divide across the country. The effectiveness of PDS
as a tool to alleviate poverty was found to deepen over the years with observed
maximum impact in 2011-12. The effectiveness of the program was also
reflected in terms of decreasing the depth of poverty as measured by poverty
gap index. In addition to taming poverty, PDS also contributed substantially in
improving nutrition intake of the beneficiaries. The study observed that, the
decrease in nutrition deficiency at all India level was as high as 15.4 per cent
points in 2011-12. The impact of PDS in tackling under-nutrition was found to
deepen across successive rounds of the survey. The robustness of the results
was checked based on PSM technique wherein, the PDS beneficiaries that
belonged to BPL category were compared against the BPL non-beneficiaries
as counterfactuals. The results of PSM analysis confirmed the impact of PDS
in augmenting the incomes as well as improving nutrition security of the
beneficiaries. With the above findings, the study draws strong conclusions in
favour of PDS as an effective tool in targeting the twin problems of poverty
and under-nourishment in the country. The study also established that, the
effectiveness of PDS has improved over time. However, persisting
imperfections in the system still pose substantial challenges to be tackled from
time to time. This necessitates proactive and systematic attempts to
continually improve the functioning, so that one among the largest welfare
programmes in the world maintain its glory in times to come.
34
References
Becker, S. O., & Ichino, A. (2002). Estimation of average treatment effects
based on propensity scores. The Stata Journal, 2(4), 358-377.
Dandekar, V.M. (1996). Population, poverty and employment. The Indian
Economy -Vol. II. Sage Publications, New Delhi
Dehejia, R., & Wahba, S. (2002). Propensity score matching methods for non-
experimental casual studies. The Review of Economics and Statistics, 84 (1),
151-161.
Dreze, J., & Khera, R. (2013). Rural Poverty and the Public Distribution
System. Economic and Political Weekly, 48(45-46), 55-60.
Grusky , D. B., & Kanbur, R. (2006). Poverty and Inequality. Stanford:
Stanford University Press.
Heckman, J., Ichimura, H., & Todd, P. (1997). Characterizing selection bias
using experimental data. Econometrica, 66, 1017-1099.
Heckman, J., Ichimura, H., & Todd, P. (1998). Matching as an econometric
evaluation estimator. The Review of Economic Studies, 65 (2), 261-294.
35
Heinrich, C., Maffioli, A., & Vazques, G. (2010). A primer for applying
propensity score matching, Impact Evaluation Technical Notes No. IDB-TN-
161, Office of Strategic Planning and Development Effectiveness, Inter-
American Development Bank, Washington, D.C., USA.
Himanshu, & Sen, A. (2011). Why not a universal food security legislation.
Economic & Political Weekly, 46(12), 38-47.
Himanshu, & Sen, A. (2013) In-Kind Food Transfers – II, Impact on nutrition
and implications for food security and its costs. Economic and Political
Weekly, 48(47), 60-73.
Himanshu, & Sen, A. (2013). In-kind food transfers – I: Impact on poverty.
Economic and Political Weekly, 48(45-46), 46-54.
Hirway, I. (2003). Identification of BPL house-holds for poverty alleviation
programmes. Economic and Political Weekly, 38(45), 4803-4808.
Jalan, J., & Ravallion, M. (2003). Estimating the benefit incidence of an anti-
poverty program by propensity score matching. Journal of Business and
Economic Statistics, 21 (1), 19-30.
Jha, S., & Ramaswami, B. (2010). How can food subsidies work better?
Answers from India and the Philippines. Working Paper 221. Manila: Asian
Development Bank.
Khera, R (2011a). Trends in diversion of grain from the public distribution
system. Economic & Political Weekly, 46(21), 106-114.
Khera, R (2011b). Revival of the public distribution system: Evidence and
explanations. Economic and Political Weekly, 46(44, 45), 36-50.
Khera, R. (2008). Access to the targeted public distribution system: A case
study in Rajasthan. Economic and Political Weekly 43(44), 51-56.
Khera, R. (2011). India‟s public distribution system: Utilisation and impact.
The Journal of Development Studies, 47(7), 1038-60.
Kumar, A., Bantilan, M. C. S., Kumar, P., Kumar, S., & Shiv Jee (2012). Food
security in India: Trends, patterns and determinants. Indian Journal of
Agricultural Economics, 67(3), 445-63.
Mahamallik, M., & Sahu, G. B. (2011). Identification of the poor: Errors of
exclusion and inclusion. Economic and Political Weekly, 46(9), 71-77.

36
Radhakrishna, R., Subbarao, K., Indrakant, S., & Ravi C. (1997). India’s PDS:
A national and international perspective. World Bank Discussion Paper 380.
Washington DC: World Bank.
Rosenbaum & Rubin (1983). The central role of propensity score in
observational studies for casual effects. Biometrika, 70 (1), 41-55.
Smith, J., & Todd, P. (2005). Does matching over Lalonde‟s critique of non-
experimental estimators?. Journal of Econometrics, 125 (1-2), 305-353.
Swaminathan, M., & Misra, N. (2001). Errors of targeting. Economic and
Political Weekly, 36(26), 2447-2454.
Tritah, A. (2003). The public distribution system in India: Counting the poor
from making the poor count. GREMAQ, Universit‟e des Sciences Sociales,
Toulouse, France, July 7
Appendix Table 1: Impact of PDS on poverty across states in India based on fiscal
benefit method
State
Average impact on HCR (“without”-
“with”) Average impact on PGI
1993-94 2004-05 2009-10 2011-12 1993-94 2004-05 2009-10 2011-12
Andhra
Pradesh 3.2 3.3 6.86 3.92 1.93 1.39 1.73 0.96
Arunachal
Pradesh 1.85 0.71 1.68 2.03 1.04 0.26 0.84 1.23
Assam 1.63 1.1 2.39 6.12 0.69 0.51 1.24 1.87
Bihar 0.94 0.58 1.96 4.89 0.4 0.49 0.82 1.72
Chhattisgarh 0.78 1.5 8.81 8.98 0.5 1.09 6.08 4.51
Delhi 3.37 0.5 0.00 0.71 0.76 0.14 0.10 0.08
Goa 2.97 0.41 0.76 1.8 0.92 0.6 0.35 0.31
Gujarat 2.16 2.68 3.16 1.27 0.77 0.96 0.69 0.51
Haryana 0.89 0.52 1.22 0.6 0.38 0.15 0.38 0.3
Himachal
Pradesh 1.38 2.07 2.50 6.16 0.57 0.85 0.63 0.82
Jammu &
Kashmir 2.5 3.15 3.17 4.73 0.52 0.5 0.85 1.04
Jharkhand 1.23 0.82 3.93 3.8 0.51 0.47 1.80 2.8
Karnataka 1.44 4.88 7.62 4.81 0.81 2.22 1.75 1.36
Kerala 3.41 1.85 2.83 3.31 1.49 0.77 0.78 0.88
Madhya
Pradesh 0.85 0.88 3.43 2.42 0.31 0.81 1.97 1.71
Maharashtra 0.76 1.11 2.75 2.32 0.44 0.74 0.86 0.9
Manipur 0.3 0.38 1.43 0.85 0.19 0.07 0.35 0.18

37
Meghalaya 2.27 2.09 4.36 3.18 0.68 0.23 0.41 0.73
Mizoram 5.45 2.77 4.09 9.07 0.92 0.62 1.20 2.53
Nagaland 0.57 0 0.00 0.63 0.16 0 0.00 0.1
Odisha 0.72 0.85 6.49 7.72 0.4 1.03 3.34 4.67
Punjab 0.53 0.05 0.87 0.6 0.18 0.02 0.29 0.14
Rajasthan 0.62 0.89 1.25 1.13 0.39 0.38 0.38 0.51
Sikkim 1.26 5.87 6.56 7.5 0.46 1.78 1.31 1.12
Tamil Nadu 3.37 8.38 9.06 6.93 2.12 3.54 3.20 1.88
Tripura 3.51 3.7 5.73 9.39 1.18 2.56 0.98 2.34
Uttar Pradesh 0.63 0.89 2.64 2.18 0.26 0.46 1.13 1.02
Uttaranchal 4.06 1.49 3.47 5.67 1.85 0.71 0.61 1.02
West Bengal 1.68 1.32 3.13 3.72 0.58 0.55 0.83 1.22
India 1.5 1.87 3.80 3.52 0.69 0.97 1.42 1.12
Appendix Table 2: Per capita calorie consumption and share of PDS across
states in India
State Per capita calorie consumption
(KCal/person/day)
Share of PDS in total calorie
consumption (%)
1993-94 2004-05 2009-10 2011-12 1993-94 2004-05 2009-10 2011-12
Andhra
Pradesh 2068 2083 2520 2256 15.4 13 13.9 16.3
Arunachal
Pradesh 2238 2399 2787 2020 36.4 17.7 14.7 23.5
Assam 2012 2241 2208 2088 5.1 3.2 6.8 16.9
Bihar 2168 2186 2085 2141 1.8 0.5 3.1 11.4
Chhattisgarh 2132 2019 2204 2123 4.6 8.7 23.3 23.4
Delhi 2434 2205 2033 2144 14.3 2 2.9 3
Goa 1935 1808 2453 2069 28.1 4.1 7.5 12.4
Gujarat 2025 2073 2037 2031 8.4 3.8 4.2 4.1
Haryana 2423 2349 2446 2324 2.7 1.3 5.1 5.3
Himachal
Pradesh 2343 2390 2726 2560 15.2 18.5 19.1 25.8
Jammu &
Kashmir 2489 2467 2456 2423 8.6 18.3 27.2 30.6
Jharkhand 2067 2208 2209 2105 3.3 1.3 8.2 9.6
Karnataka 2073 1945 2156 2104 8.5 13.8 12.2 14.3
Kerala 1989 2142 2427 2077 29.2 9.6 10.7 16.5
Madhya
Pradesh 2184 2005 2218 2159 3.9 6.8 10.1 10.6
Maharashtra 1986 2009 2216 2157 6.8 6 8.5 8.9
Manipur 2139 2453 2004 2026 2.5 0.3 2.0 1.3

38
Meghalaya 2008 2109 1894 1762 16.2 6.7 16.6 19.5
Mizoram 2140 2686 2184 2216 38.5 22 27.7 33.4
Nagaland 2214 2433 2089 2018 3.3 0 0.3 4.1
Odisha 2218 2182 2288 2179 2.4 4.4 15.3 19.5
Punjab 2344 2364 2541 2354 1.9 0.2 4.7 4.4
Rajasthan 2419 2316 2387 2290 6.4 3.6 4.0 6
Sikkim 1915 2195 2284 2059 32.8 17.4 16.6 23
Tamil Nadu 1928 2039 2216 2026 14.5 22.1 23.8 27.6
Tripura 1945 2039 2510 2327 16.3 16.3 20.0 29.5
Uttar Pradesh 2274 2362 2169 2140 1.8 1.5 6.2 7.7
Uttaranchal 2334 2351 2350 2453 29.7 9.1 7.8 16.5
West Bengal 2202 2283 2069 2128 4.5 2.1 5.0 7.7
India 2152 2179 2233 2158 7 5.8 9.3 11.8
Appendix Table 3: Impact of PDS on nutrition across states in India based on
fiscal benefit method
State
Average impact on nutrition
deficiency (“without”-“with”) Average impact on NGI
1993-94 2004-05 2009-10 2011-12 1993-94 2004-05 2009-10 2011-12
Andhra
Pradesh 11.07 12.53 22.24 27.20 2.91 3.32 5.57 5.26
Arunachal
Pradesh 7.45 1.33 7.75 11.70 1.63 0.59 3.48 5.27
Assam 1.37 0.76 6.35 21.00 0.63 0.40 2.40 5.59
Bihar 0.43 -0.34 2.89 13.30 0.07 0.12 1.06 4.01
Chhattisgarh 2.31 3.44 26.80 31.50 0.38 2.21 14.10 14.05
Delhi 7.22 0.77 1.57 3.90 0.98 0.07 0.46 0.55
Goa 9.51 2.29 11.46 13.40 3.66 1.65 1.36 3.56
Gujarat 3.76 3.74 3.94 6.40 0.81 1.34 1.56 1.50
Haryana 1.55 0.82 6.52 6.40 0.13 0.26 2.23 1.62
Himachal
Pradesh 2.96 9.76 15.49 22.40 0.67 1.74 2.34 3.08
Jammu &
Kashmir 1.64 6.81 22.22 27.20 0.27 1.07 3.61 4.85
Jharkhand 1.49 0.56 6.24 14.50 0.23 0.55 2.92 6.21
Karnataka 3.55 14.08 17.52 21.70 1.01 5.68 5.40 5.30
Kerala 10.63 4.72 10.47 20.30 3.30 2.55 4.50 7.25
Madhya
Pradesh 0.64 3.20 10.86 12.60 0.24 1.89 4.48 4.45
Maharashtra 2.48 3.35 9.39 10.90 0.54 1.71 2.28 2.98
Manipur 0.14 -0.08 0.91 1.00 0.03 0.01 0.17 0.26
Meghalaya 8.22 3.73 9.93 13.00 1.24 1.57 7.19 8.51

39
Mizoram 14.80 7.24 21.09 29.90 2.55 1.36 5.16 9.68
Nagaland 1.96 -0.08 -0.71 4.40 0.28 0.00 0.00 0.80
Odisha 0.83 2.35 20.48 31.70 0.16 1.30 7.30 10.78
Punjab 0.87 -0.49 6.15 6.00 0.11 0.00 1.42 0.97
Rajasthan 1.74 2.12 3.32 8.30 0.29 0.57 1.10 2.61
Sikkim 2.42 19.33 19.79 37.60 0.87 4.26 8.03 10.55
Tamil Nadu 9.07 22.02 33.76 30.50 3.15 8.18 12.45 9.07
Tripura 6.85 12.24 19.24 28.30 1.93 5.08 3.87 7.62
Uttar Pradesh 0.60 0.82 6.40 9.90 0.08 0.40 2.10 2.74
Uttaranchal 13.56 5.03 8.65 17.90 2.02 0.99 1.36 3.31
West Bengal 1.81 0.98 6.65 11.00 0.28 0.34 1.91 2.86
India 3.35 4.49 11.06 15.40 0.86 1.93 3.93 3.98
Appendix Table 4: Descriptive statistics of treatment and control groups of
households
Variable PDS
Households
Non-PDS
households
Sample size (No.) 15976 10060
Mean family size (No.) 5.6 5.9
Mean age of the head of the household (years) 47.1 44.6
Mean education of head of the household (years) 3.2 4.4
Average monthly per capita expenditure (Rs.) 733.0 785.2
Average monthly per capita expenditure on food (Rs.) 430.4 468.6
Average monthly expenditure on food from PDS (Rs.) 141.5 0.0
Average land owned by the household (ha) 0.32 0.37
Average land cultivated by the household (ha) 0.28 0.33
Share of households not owning any land (%) 8.6 14.4
Share of households possessing ration card (%) 100.0 56.6
Share of ration card possessing households with
Antyodaya card (%)
13.4 2.7
Share of ration card possessing households with BPL
card (%)
67.7 17.8
Share of ration card possessing households with other
types of card (%)
18.9 79.5
Share of households with male head (%) 86.2 89.8
40
Share of households belonging to SC/ST caste (%) 45.7 36.9
Share of households belonging to rural areas (%) 64.1 52.0
Appendix Figure 1: Histogram of propensity score of PDS housholds
0
.02
.04
.06
.08
.1
Fra
ction
0 .2 .4 .6 .8 1Estimated propensity score
0
.05
.1.1
5
Fra
ction
0 .2 .4 .6 .8 1Estimated propensity score

41
Appendix Figure 2: Histogram of propensity score of non-PDS housholds