
Public Disclosure Authorized Restructuring Why Going...
29
Restructuring Uganda’s Coffee Industry: Why Going Back to the Basics Matters JOHN BAFFES DEVELOPMENT PROSPECTS GROUP THE WORLD BANK 1818 H Street, NW Washington, D.C. 20433 Tel: (202) 458‐1880 Fax: (202) 522‐1151 Email: [email protected] ABSTRACT: After experiencing a boom during the mid‐1990s, the performance of Uganda’s coffee in‐ dustry has been disappointing. Most existing analyses see the sector’s problems as quality deterioration, poor marketing position in the global market, weak regulatory framework, and poor infrastructure. Rec‐ ommendations range from setting up a coffee auction to increasing the share of specialty coffees. This pa‐ per concludes that such advice has been largely inconsistent with the stylized facts of the Ugandan coffee industry. It argues that the coffee wilt disease and the effectiveness of the coffee replanting program are the two key issues on which policy makers and the donor community should focus their activities and al‐ locate their resources. JEL: D24, F14, L33 KEY WORDS: Uganda; Coffee Industry; Policy Reforms World Bank Policy Research Working Paper 4020, October 2006 The Policy Research Working Paper Series disseminates the findings of work in progress to encourage the exchange of ideas about development issues. An objective of the series is to get the findings out quickly, even if the presenta- tions are less than fully polished. The papers carry the names of the authors and should be cited accordingly. The findings, interpretations, and conclusions expressed in this paper are entirely those of the authors. They do not nec- essarily represent the view of the World Bank, its Executive Directors, or the countries they represent. Policy Re- search Working Papers are available online at http://econ.worldbank.org. An earlier version served as a background paper for the Uganda Diagnostic Trade Integration Study (DTIS). I would like to thank Helena Tang for her thoughtful comments and suggestions on earlier drafts. Ata‐ man Aksoy, Burcu Duygan, and Donald Mitchell provided valuable comments on earlier drafts. Informa‐ tion and material obtained during interviews with Clayton Arinaye, David Barry, Frank Bibby, Jason Green, Andrew Falconer, Martin Fowler, David Kiwanuka, and James Ogwang is greatly appreciated. WPS4020 Public Disclosure Authorized Public Disclosure Authorized Public Disclosure Authorized Public Disclosure Authorized Public Disclosure Authorized Public Disclosure Authorized Public Disclosure Authorized Public Disclosure Authorized
Transcript of Public Disclosure Authorized Restructuring Why Going...

Restructuring Uganda’s Coffee Industry: Why Going Back to the Basics Matters
JOHN BAFFES DEVELOPMENT PROSPECTS GROUP
THE WORLD BANK 1818 H Street, NW
Washington, D.C. 20433 Tel: (202) 458‐1880 Fax: (202) 522‐1151
Email: [email protected] ABSTRACT: After experiencing a boom during the mid‐1990s, the performance of Uganda’s coffee in‐dustry has been disappointing. Most existing analyses see the sector’s problems as quality deterioration, poor marketing position in the global market, weak regulatory framework, and poor infrastructure. Rec‐ommendations range from setting up a coffee auction to increasing the share of specialty coffees. This pa‐per concludes that such advice has been largely inconsistent with the stylized facts of the Ugandan coffee industry. It argues that the coffee wilt disease and the effectiveness of the coffee replanting program are the two key issues on which policy makers and the donor community should focus their activities and al‐locate their resources.
JEL: D24, F14, L33
KEY WORDS: Uganda; Coffee Industry; Policy Reforms World Bank Policy Research Working Paper 4020, October 2006 The Policy Research Working Paper Series disseminates the findings of work in progress to encourage the exchange of ideas about development issues. An objective of the series is to get the findings out quickly, even if the presenta-tions are less than fully polished. The papers carry the names of the authors and should be cited accordingly. The findings, interpretations, and conclusions expressed in this paper are entirely those of the authors. They do not nec-essarily represent the view of the World Bank, its Executive Directors, or the countries they represent. Policy Re-search Working Papers are available online at http://econ.worldbank.org.
An earlier version served as a background paper for the Uganda Diagnostic Trade Integration Study (DTIS). I would like to thank Helena Tang for her thoughtful comments and suggestions on earlier drafts. Ata‐man Aksoy, Burcu Duygan, and Donald Mitchell provided valuable comments on earlier drafts. Informa‐tion and material obtained during interviews with Clayton Arinaye, David Barry, Frank Bibby, Jason Green, Andrew Falconer, Martin Fowler, David Kiwanuka, and James Ogwang is greatly appreciated.
WPS4020
Pub
lic D
iscl
osur
e A
utho
rized
Pub
lic D
iscl
osur
e A
utho
rized
Pub
lic D
iscl
osur
e A
utho
rized
Pub
lic D
iscl
osur
e A
utho
rized
Pub
lic D
iscl
osur
e A
utho
rized
Pub
lic D
iscl
osur
e A
utho
rized
Pub
lic D
iscl
osur
e A
utho
rized
Pub
lic D
iscl
osur
e A
utho
rized

— 1 —
1. Introduction
Uganda’s economy suffered numerous setbacks during the 1970s with severe destabiliz‐ing effects. Some were of global or regional nature, but the most serious ones were of domestic origin, namely political instability and poor policy choices. The reform pro‐gram that Uganda embarked on since 1987 addressed both macro and sectoral issues, and figured prominently in agriculture, especially in the export crop sector, including coffee, which during the early 1990s accounted for most of merchandise exports (Collier and Reinikka 2001). This paper analyzes the developments in the coffee sector during the last decade and identifies institutional or policy impediments and investment op‐portunities that could enhance its competitiveness. In doing so, the paper takes a look at the advice that policy makers have received from public, private, and donor agencies. The paper concludes that such advice has been largely inconsistent with the stylized facts of the coffee industry.
Uganda’s coffee industry consists of low input‐intensity smallholders with an average farm size of 0.2 hectares and is the main source of income to an estimated 500,000 households. Following its introduction earlier in the 20th century, the industry expanded considerably, especially during the 1950s and 1960s. However, the sector ex‐perienced a huge setback due to the civil strife of the 1970s, when output halved within a 5‐year period (1972‐77). During the late 1980s, the sector went through a liberalization process, which coupled with high world prices, led to considerable supply response, with exports exceeding 4 million bags in two consecutive years (1995 and 1996), the only time in the sector’s history. By all accounts, the reforms have been successful. Pro‐ducers’ share of export prices doubled and growers receive payments promptly. Entre‐preneurial activity has increased enormously. Most importantly, there has been a well‐documented poverty reduction impact on households of the coffee‐growing regions. There has been no backtracking of reforms.
The post‐1997 coffee price decline has had a negative effect on production. How‐ever, production kept declining even when prices recovered after 2002. It is currently estimated that for the 2005/06 season, Uganda’s coffee output will be about 2.5 million bags, the lowest level since the reforms. Although coffee contributed as much as $400 million to total merchandise exports during the mid‐1990s, it currently contributes less than $150 million (equivalent to one‐quarter of merchandise exports and 2 percent of GDP). Understandably, the sector’s poor performance raised concerns among policy makers.
Most existing analyses see the sector’s problems as quality deterioration, poor marketing position in the global market, weak regulatory framework, and poor infra‐structure, among other reasons. Recommendations range from setting up a coffee auc‐tion to increasing the share of specialty coffees and opening promotion offices in coffee consuming countries. Yet, two important issues, namely the coffee wilt disease that may have caused an estimated export revenue loss between $40 and $50 million per annum
— 2 —
(almost one‐third of recent coffee export revenues) and the effectiveness of the coffee replanting program that was designed to replace the aging tree population with newer high yielding varieties, have received much less attention, especially considering their poverty implications to Uganda’s rural households. Not surprisingly, the issues have not been placed high enough in the policy making agenda.
The remainder of this paper proceeds as follows. The next section sets the stage by examining the history of Uganda’s coffee industry. Section 3 discusses policy devel‐opments and their impact on the sector. Section 4 examines the stylized facts of the in‐dustry. Section 5 reviews recommendations regarding value addition and coffee promo‐tions strategies. Section 6 analyzes the key problems of the industry, namely the wilt disease and the replanting program. The last section concludes.
2. Brief History of Uganda’s Coffee Industry
Coffee was introduced in Uganda in 1900 as an arabica estate crop. However, poorly performing seeds (originally imported from Malawi) along with the spread of diseases discouraged its expansion. In parallel to the arabica decline there was an increase in ro‐busta by smallholders, a less input‐intensive crop that could be grown in lower eleva‐tions with better access to transportation facilities. Uganda’s coffee sector became exclu‐sively smallholder, with the typical farm size ranging between 0.1 and 0.5 hectares, a structure that has remained the same today. By 1925 coffee accounted for 1 percent of Uganda’s merchandise exports. Responding to government extension services and bet‐ter varieties, coffee production kept increasing, becoming an important source of in‐come to rural households and a major contributor to the country’s foreign exchange earnings. By 1958 coffee overtook cotton as the country’s chief export crop. In the early 1970s, coffee accounted for most of total merchandise exports averaging about three million 60‐kg bags, 4 percent of global coffee supplies.
On the policy side, Uganda’s coffee industry went through the typical ups and downs of many African commodity subsectors.1 The first coffee‐related institution, the Coffee Industry Board, was established in 1930 to address quality control issues. The Department of Crops was created in 1946 whose main responsibility was to encourage the expansion of robusta coffee. In 1953, the functions of the Industry Board were ex‐panded to include price setting responsibilities while in 1959 its responsibilities (this time under a new name, Coffee Marketing Board) were further expanded to include marketing activities including coffee buying. Following independence in 1962, the Cof‐fee Board assumed full control of the robusta coffee industry. In 1969, under the gov‐ernment of Milton Obote, a coffee act was passed that gave the Coffee Board full re‐sponsibility of all aspects of the coffee industry, including a monopoly in exports. This marketing structure remained virtually unchanged until 1990, when the coffee sector was subjected to policy reforms.
For most of the time, especially after independence, the coffee sector was heavily

— 3 —
taxed. In some years coffee growers received just a small fraction of export prices. That was especially the case in the 1970s and the early 1980s, when Uganda coffee growers completely missed the benefits of the high coffee prices; in some years the coffee grow‐ers’ share of export prices was as low as 15 percent (Bibangambah 1995). The govern‐ment‐owned railway system had a monopoly on coffee transportation to ensure that no coffee was marketed outside official channels. Furthermore, to retain a firm grip on for‐eign exchange earnings, the government introduced the practice of selling coffee at f.o.t. (free on truck) Kampala instead of f.o.b. Mombasa, thereby requiring international buy‐ers to undertake the risk of transporting coffee to Mombasa, a practice that has contin‐ued until the present. Finally, the level of taxation was further increased by the intro‐duction of a dual exchange rate system.
Despite all marketing and trade distortions, the coffee industry did not fare as poorly as the other industries (or the entire economy, for that matter). During the Idi Amin regime (1971‐79) the assets of foreign‐owned companies were confiscated, includ‐ing tea factories and cotton ginneries, leading to the collapse of the respective sectors. The coffee industry, however, escaped collapse, primarily for three reasons. First, about one quarter of the coffee output was marketed through neighboring coffee‐producing countries outside the official channels (Henstridge (1996), cited in Collier (1997)). It was therefore profitable for coffee growers to incur high taxation for most of the crop given that they were receiving “fair” price for some of their crop. Second, because coffee re‐quires only limited purchased inputs, the collapse of the input market did not have a major impact on the sector. Third, coffee does not require primary processing quickly (as, for instance, is the case with tea which needs to be processed within a few hours af‐ter it is picked), implying that it could go out of the country unprocessed. Nevertheless the sector performed far below its full potential and it became evident that policy re‐forms were the only feasible alternative.
3. Policy Reforms and the Coffee Boom
The seeds for reforms were planted in the mid‐1980s, during the implementation of an IDA Agricultural Rehabilitation Project when the government begun preparing propos‐als for coffee marketing reforms (World Bank 1983). The chief objectives of the $70 mil‐lion project ($22 of which went to the coffee sector) were to increase marketing effi‐ciency, rehabilitate processing facilities, and assist the government to implement mar‐keting reforms and formulate sector development strategies. However, restructuring the coffee marketing chain or reducing the Coffee Board’s responsibilities was not part in the project. It appears that the issue was quite sensitive, as can be inferred by the ap‐praisal report (p. 21): ”The importance of coffee to the Ugandan economy is paramount and changes in the Coffee Marketing Board’s structure or marketing policies must be approached cautiously so as to not risk the diversion of foreign exchange earnings from official channels or to undermine Government revenue derived from coffee.”
— 4 —
Comprehensive reforms begun in 1990 as part of a structural adjustment pro‐gram (Akiyama 2001). In January 1991, the Coffee Board was split into two entities: The Coffee Marketing Board, Ltd., which assumed the trading and processing functions of the former Board and the Uganda Coffee Development Authority (UCDA) with respon‐sibilities of monitoring and regulating the industry and advising the government on policy issues. Further reforms were undertaken in 1992 by unifying the exchange re‐gime. The Board gradually liquidated all its assets and withdrew form the industry marking the end of government’s involvement in marketing and trade activities.
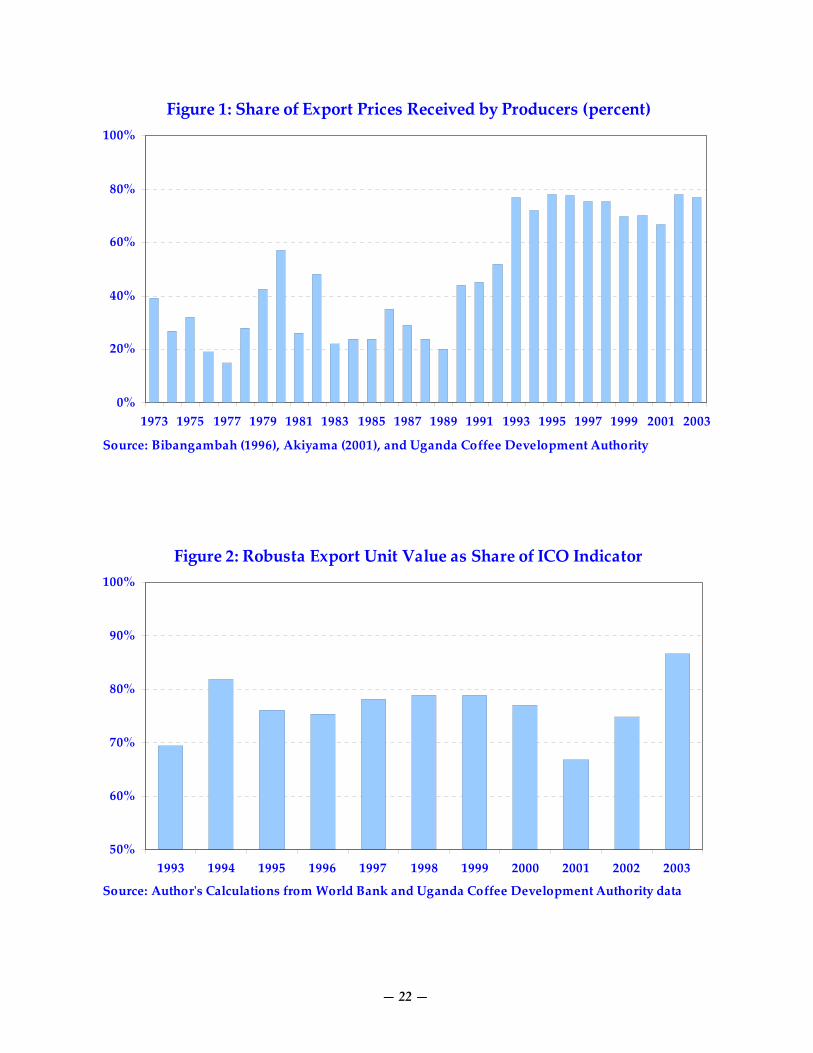
By all accounts the reforms have been successful. Producers’ share of export prices doubled and growers receive payments promptly. For example, prior to 1990, producers’ share of export prices was less than 30 percent while following reforms the share reached 70 percent (see figure 1). This evidence is also corroborated by Akiyama (2001) and Krivonos (2003). Entrepreneurial activity increased enormously as the num‐ber of active exporters reached more than 70 just 4 years after the reforms, while thou‐sands of small traders entered the industry. The supply response, in part aided by the price boom of 1994/95, was spectacular with Uganda surpassing 4‐million bags of coffee for two years in a row—global coffee production during this period was 100 million bags. Most importantly, numerous authors have reported a well‐documented poverty reduction impact on households in the coffee‐growing regions (Deininger and Okidi 2003, Bussolo et al. 2005, Kappel el al. 2005).
Although during the initial stages of the reform process it was reported that cof‐fee quality deteriorated, it appears that this was the case only temporarily as quality later recovered without leading to a loss of reputation (Ponte and Kawuma 2003, p. 45).2 No backtracking of the reforms has taken place. Exception to this was the brief re‐introduction of the export tax during the second half of 1994, which amounted to 17 percent of coffee earnings. However, in July 1995 the tax rate was substantially reduced and in July 1996 it was removed from the statute books thereby enabling coffee growers to enjoy the benefits of the price boom (Henstridge and Kasekende 2001).
Currently, UCDA is in charge of all regulatory aspects of the industry including monitoring quality, enforcing regulations, collecting statistics, undertaking promotion efforts, and managing the coffee replanting program. Often, UCDA’s functions are car‐ried out in corroboration with other institutions with broader mandates (table 1). UCDA is financed by a 1 percent levy imposed on all coffee exports.
4. Stylized Facts of Uganda’s Coffee Industry
When coffee prices started declining in 1997, so did production. However, production kept declining even when prices recovered. For example, between 2001 and 2005, the ICO robusta indicator increased 79 percent (from $0.61/kg to $1.09/kg) while the arabica indicator increased 88 percent (from $1.37/kg to $2.58/kg).3 Yet, Uganda’s coffee exports declined by 21 percent, from 3.15 to 2.50 million bags. Even more worryingly, the ongo‐

— 5 —
ing decline has taken place in spite of an aggressive replanting program designed to re‐place Uganda’s ageing tree population with high yielding varieties as well as the intro‐duction of coffee cultivation to new areas.
The problems of Uganda’s coffee industry are commonly seen as poor marketing position in the global market, weak regulatory framework, domestic marketing ineffi‐ciencies, and quality deterioration, with the latter two figuring prominently in virtually all reports. A telling example can be found in the terms of reference given to the Coffee Sector Restructuring Taskforce (2003), a group of experts assembled to articulate the government’s coffee strategy. The section entitled “The Problem” begins as follows (p. 74): “Uganda’s coffee sub‐sector has largely been characterized by poor market posi‐tioning (including poor and inadequate promotion), weak and poorly organized private sector, and poorly defined institutional roles and regulation, resulting in a very low level of competitiveness on the global market.” Two recurrent themes embedded in the terms of reference—common to most reports on the Ugandan coffee industry—are dete‐rioration of coffee quality and domestic marketing structure inefficiencies. The rest of this section elaborates on these two issues.
4.1 Has Coffee Quality Deteriorated?
Researchers have argued often that one of the negative consequences of liberalization undertaken during the mid‐1990s was deterioration of quality in commodities (see, for example, Gibbon (1999), Shepherd and Farolfi (1999), and Larsen (2003)). The standard argument goes that following liberalization, inspection and quality control services de‐clined while the numerous inexperienced traders that entered the liberalized market did not (or did not know how to) reward quality. Not surprisingly, the view that reforms may jeopardize quality has been used as a way to resist policy reforms (see Akiyama (2001) for the case of coffee market reforms in Togo). However, only a few studies have taken a systematic look at the issue of quality. Baffes (2004) who looked at cotton in Tanzania and Tollens and Gilbert (2003) who examined cocoa in Cameroon found no evidence of post‐reform quality decline.
Virtually all reports on the Ugandan coffee sector have taken for granted that quality of coffee has deteriorated and, not surprisingly, their conclusions and recom‐mendations are based on that assumption. Consider, for example, the following sample of quotations: “this disastrous trend in quality” (Rosetti 1998, p. 35); “decrease the overall quality of coffee” (COMPETE 2001, p. 15); “the serious issues of coffee quality decline” (Nsi‐birwa 2002, p. 54); “Quality is a key factor” (You and Bolwig 2003, p. 7); “There has been a quality loss” (Fafchamps et al. 2003, p. 7); “Chronic quality deterioration” (Coffee Sector Re‐structuring Taskforce 2003, p. 74); “There is a problem of quality” (MFPED 2004, p. 24); “Liberalization … killed the quality of coffee” (UCTF Annual Report 2004/05, p. 21); “low product quality” (Coulter and Laker‐Ojok 2005, p. 9); “Deterioration in the quality” (SCOPE 2005, p. 21). Moreover, none of these reports appears to have undertaken any detailed

— 6 —
quantitative analysis in order to establish whether quality has actually declined. Two questions need to be considered to determine whether the quality of Ugan‐
dan has declined. First, consider coffee bought by the exporters. While data that would reflect an exact measure of quality do not exist, industry representatives and exporters agree that prior to the reforms about 95 percent of coffee delivered to the exporters’ processing facilities was clean coffee while the remaining 5 percent consisted of foreign matter such as bean defects, husks, leaves, pieces of wood, and stones. Following re‐forms and the subsequent entry of numerous coffee traders and middlemen, foreign matter content increased considerably, again according to industry representatives. It is believed that currently, foreign matter content of coffee entering the exporter’s ware‐houses exceeds 10 percent and is attributed mostly to middlemen and not farmers. This is not surprising since small traders who deal directly with coffee growers buy very small quantities that can be easily monitored. However, monitoring quality at the mid‐dleman level becomes more costly because larger quantities of coffee are involved (see box 1 for an example of how middlemen cheat).
The second (and more relevant) question is whether there has been a decline in quality of coffee that exporters ship to importing countries. There are several ways to examine this issue. First is the comparison of the price of Uganda robusta coffee with the relevant world comparator, that is, the ICO robusta indicator. Two measures of the Ugandan coffee prices are: (i) the export unit value (total export robusta earnings di‐vided by the quantity exported) and (ii) the Kampala f.o.t. grade SC 15, the grade that accounts for two thirds of Uganda’s robusta exports. Quality deterioration would be re‐flected in downward trends of these two measures taken as shares of the ICO indicator, but that did not happen in either case (see figure 2 and penultimate column of table 2).
Another measure of quality is the share of low quality beans. Information on the composition of Uganda’s coffee production by quality and type indicates that the share of low quality beans produced had actually been declining (see column with heading ‘SC 15 >’ in table 3). To sum up, neither price data nor the share of low quality beans support the view that coffee quality has deteriorated in Uganda.
Lastly, the coffee referred for reprocessing during pre‐shipment inspection (an‐other indicator of quality) has been declining. During the 1997/98 season, 424,660 bags were reprocessed while during 2003/04, only 54,197 bags were reprocessed (an 87 per‐cent decline). To quote UCDA 2002/03 Annual Report (p. 32): “The quantity referred to reprocessing had continued to decline … a reflection of improved quality awareness along the supply chain” [emphasis added]. Therefore, the evidence overwhelmingly shows that the quality of coffee exported from Uganda has not deteriorated.
4.2 Is Uganda’s Coffee Marketing Chain Poorly Structured?
It has often been claimed that Uganda’s marketing chain is poorly structured, including the decreasing number of coffee exporting firms which may have led to oligopsonistic

— 7 —
behavior, and the large number of small coffee traders which is viewed as an unneces‐sary layer of trading activity. From only one exporter in 1990 (the Coffee Board), within a 3‐year period, 55 exporters were active in the sector, and a high of 78 were reached in 1995 (figure 3). More recently this number has declined to about 25, which has been at‐tributed to as indicative of oligopsonistic behavior. However, most of the exporting firms that exited the industry represented only a small share of exports.4 A Herfindahl index of market concentration constructed for the post‐1993 period shows a very low level of market concentration for most years (the index being well below 10 percent), and also no evidence of any upward trend (figure 4). This finding is consistent with an earlier study which examined coffee export concentration issues in Uganda in a more comprehensive manner (Nsibirwa 2002).
The large number of small traders involved in the sector is viewed by some as an unnecessary layer of trading activity which adds excessive costs to the industry. How‐ever, this is unavoidable since the Ugandan coffee sector consists primarily of small‐holders, thus necessitating several levels of aggregation before adequate coffee quanti‐ties are collected to reach exporters’ processing facilities.5
Robusta growers usually sun‐dry their red cherry coffee on the farm and then sell it in small quantities to the so‐called kiboko traders who transport it to coffee mills for hulling (each kiboko trader brings one to two bags of coffee to the milling factory). Most mills provide hulling services to kiboko traders at a fixed fee. After milling, kiboko traders sell the green beans to larger traders, the so‐called FAQ (fair average quality) traders, who sell it to exporters after accumulating larger quantities. Typically, export‐ers require a minimum of 10 bags of coffee delivered to them, which explains the two layers of middlemen between farmers and exporters. To summarize, kiboko and “FAQ” traders connect the 500,000 coffee growers—each of whom produces an average of 5‐6 bags of coffee—with the 15 exporters that account for 95 percent of Uganda’s coffee ex‐ports—each of whom handles an average of 160,000 bags of coffee. (Prior to reforms the functions of kiboko and “F.A.Q.” traders were performed by the cooperatives and the Coffee Board.)
5. Proposed Strategies
A series of coffee expansion and promotion efforts have been proposed under the cabi‐net‐approved Strategic Exports Program (SEP) initiative and by various donors. The SEP initiative envisaged considerable expansion of coffee production as well as in‐creased investment in value addition enterprises, including product differentiation and access to new markets. One of the Program’s targets was to increase coffee production and exports from 3.15 million bags in 2001/02 to 12 million bags by the year 2007/08 (MFPED 2004, p. 15).
The most often proposed strategies are specialty coffee expansion, value addi‐tion, coffee promotion, domestic consumption, and the establishment of a coffee auc‐

— 8 —
tion. While some of these recommendations have merit, particularly with respect to employment generation, they exhibit a number of limitations, especially in the context of the global environment and with respect to whether the likely outcomes will improve the livelihoods of coffee growers. The rest of this section elaborates on these limitations.
5.1 Expanding Specialty Coffee
The last decade has witnessed the emergence of a number of non‐traditional marketing channels in the global coffee market (Lewin et al 2004). These new “coffees” come under a variety of names such as organic, fair trade, eco‐friendly (shade‐grown or bird‐friendly), traceable, sustainable. The expansion of such coffees has two dimensions (Baffes et al 2005). First is the sustainability dimension which is primarily driven by so‐cial concerns, including higher prices received by coffee growers (fair trade) and effects on the environment (sustainable, shade‐grown coffee). Second is the preference dimen‐sion typically associated with geographic indications of origin as well as gourmet and specialty coffee; consumers’ willingness to pay a premium reflects the superior charac‐teristics of such coffees. Quite often these two dimensions overlap in the sense that con‐sumers may demand specialty coffee that also satisfies certain social criteria.
About 1,200 bags of specialty coffee were first marketed in Uganda during the 1995/96 season.6 During the 2003/04 season, 7,692 bags of specialty coffee were mar‐keted, accounting for 0.3 percent of Ugandan coffee exports (see figure 5). Of these, 1,828 bags were organic robusta and 1,110 bags were organic arabica. Notwithstanding some modest growth, only 0.21 percent of Ugandan coffee output went through spe‐cialty marketing channels (half of which were organic) during the 9‐year period 1995‐2003, which is very low compared to the world average of 6‐8 percent. This should not be surprising for at least three reasons. First, specialty coffee channels are more of a characteristic of the arabica market and less so of the robusta market, in which Uganda has a comparative advantage. Second, Uganda produces the world’s best robusta, which in itself may be viewed a niche market. Third, the competition in specialty mar‐kets is much more intense than traditional markets since virtually all coffee producers are attempting to capture part of this (likely saturated) market. This is supported by the fact that specialty premia have declined considerably in the last few years and they are expected to drop even further (Kilian et al 2006). These reasons may explain why the Ugandan coffee industry has chosen to stay largely within the existing marketing chan‐nels rather than pursue new ones.
Organic premia over traditional coffee accruing to coffee traders averaged 27 and 21 percent of robusta and arabica, respectively, of Kampala f.o.t. over the last five sea‐sons (table 4). However, farmgate premia have been much lower. Interviews with ara‐bica organic growers indicated that during the 2004/05 season Bugisu regular arabica was traded at Ush 1,850/kg while organic arabica was purchased at Ush 2,000/kg, equivalent to an 8 percent premium. Ponte and Kawuma (2003) report that during the

— 9 —
2003/04 season, regular arabica from Bugisu sold at Ush 1,150/kg while organic arabica fetched Ush 1,350/kg, a 17 percent premium. The 2003/04 UCDA Annual Report cited farmgate premia in the order of 4 and 10 percent for robusta and arabica organic for the 2003/04 season.
Lastly, it is important to emphasize that the way in which statistics on specialty coffee are presented may misguide (often unintentionally) the policy making process. First, several reports present percentage changes without explicitly stating that the starting base is very low. For example, Uganda’s sales to specialty markets grew by 153 percent between 1999/2000 and 2000/01, but this staggering growth rate represents a change from 4,010 to 10,136 bags only, compared with 3.07 million bags of total coffee exports. Second is the stage in which the premia are calculated and presented. While specialty premia can be as high as 100 (or even 200) percent at retail level, their farmgate counterparts are nowhere near these levels, as discussed in the preceding paragraph. Third is selective presentation. For example, the 2003/04 UCDA Annual Re‐port cited premia up to $0.42/kg for specialty coffees (p. 18), but only $0.03/kg (robusta) and $0.11/kg (arabica) when it came to organic coffee (p. 19), which accounts for half of Uganda’s specialty coffee sales.
5.2 Introducing Value Addition
The objective behind the proposal for value added activities such as roasting and in‐stant coffee manufacturing is to add income through employment generation. On a few occasions, though, the objective has been stated in terms of increasing prices received by growers through the direct relationship between growers and roasters. The attain‐ment of these objectives, however, is questionable on several fronts. The first has to do with Uganda’s competitiveness with respect to value‐added coffee. Most roasted coffee requires blends with types of coffee not necessarily produced in Uganda. Therefore, for a successful blending and roasting industry, coffee must be imported from other coun‐tries, thus subjecting the industry to the same problems currently faced by the export market (in particular delays at the port of Mombasa and higher transport cost due to Uganda’s landlocked status). Moreover, roasted coffee must be consumed quickly, a major impediment for a country where it takes green coffee as much as four (and often six) weeks to reach the port of Mombasa.
Second, development of instant coffee faces a number of difficulties since this type of coffee is typically promoted by large companies with their own trademarks and advertising campaigns. Instant coffee development strategies undertaken by Latin America coffee producers, while they led to some increase in instant coffee exports, evi‐dence shows that the companies did not use large amounts of local labor force while most of the machinery was imported, thus making the impact to the local economy very limited (Talbot 1997). Hence, Uganda would need to focus on the regional market in light of the extremely competitive nature of the international market. However, even in

— 10 —
the regional market, Uganda is likely to face intense competition from neighboring countries, most of which are coffee producers with similar ambitions and marketing strategies.
Third, pursuing value‐added activities in coffee is unlikely to have any effect on the welfare of coffee growers because roasters and instant coffee producers will pay the same price as exporters, so farmers are unlikely to receive a higher price simply because their coffee will undergo some transformation domestically.
5.3 Undertaking Coffee Promotion Activities
There are proposals for Ugandan coffee to target the less‐contested markets of Korea, China, Japan, Middle East, Russia, and East Europe where there is evidence of market opportunities and good price history for Ugandan coffee (Giovannucci 2002, p. 14). Yet, the top destinations for Uganda’s coffee is the EU which along with Switzerland ac‐counts for more than 80 percent of its coffee exports, followed by Sudan with 15 per‐cent. Less than five percent of coffee goes to other destinations. Moreover, industry rep‐resentatives believe that Uganda may export up to 4.5 million bags of robusta without jeopardizing its premium (this is more than twice the robusta that Uganda currently exports).
Through Uganda missions to exhibitions and conferences, numerous attempts have been undertaken to build strategic alliances with international coffee roasters with the ultimate objective to introduce new marketing channels to Uganda brands. These al‐liances include a joint venture with the Beijing North Star Corporation to promote the consumption of Ugandan coffee in China. That company operates a roasting facility and a number of coffee shops. The same promotion strategy was undertaken with an Egyp‐tian company where a roasting facility along with coffee shops was expected to operate in Egypt. It appears, however, that the alliance with the Chinese company did not pro‐ceed as smoothly as expected. It was reported in a Ugandan newspaper on September 14, 2005 that “… their core business is not coffee. They sold their shares [to UCDA] and they have gone back to real estate business” (The New Vision, p. 31).
The costs of such activities can be quite high. For example, according to the 2002/03 Income and Expenditures Statement of UCDA, of the Ush 4.73 billion (US$2.5 million) that the government released for poverty alleviation in coffee areas, Ush 4.28 billion ($2.3 million) went to the replanting program, Ush 0.34 billion ($183,000) went to the coffee promotion component, while only Ush 0.10 billion ($54,000) was allocated for coffee research.
5.4 Increasing Domestic Consumption
Promotion of domestic consumption has figured prominently in various reports as well, such as the UCTF 2004/05 Annual Report where domestic consumption was mentioned on at least 5 occasions: “If Uganda could consume at least 20% of its coffee production, it

— 11 —
would be a very big boast to the industry” (p. 5). “We must join the rest of the coffee world on increasing the domestic consumption at the origins” (p. 7). “Promote coffee consumption in pro‐ducing countries” (p. 42). ”… create public awareness and boost the domestic consumption” (p. 48). “Other critical program features include … increasing the domestic consumption of coffee” (p. 63).
If the objective of increasing domestic consumption (currently estimated at about 100,000 bags) is to enhance rural incomes, this is unlikely to be achieved because, as mentioned earlier, domestic coffee processors will pay the same price as exporters and hence producers will receive the same price regardless of whether their coffee is con‐sumed in Kampala, Rome or Beijing.
On the other hand, if the objective is to counter declines in international prices of coffee by reducing Uganda’s supply to the international market, attainment of that ob‐jective is also questionable. Given Uganda’s relatively small market, even large in‐creases in domestic coffee consumption will not have any discernable impact on global consumption and hence no effect on world price. To see this, consider the most often cited cases: Brazil (world’s largest coffee supplier) and the US (world’s largest coffee consumer), both of which have per capita coffee consumption of about 4 kgs. With a population of a little over 24 million, even under a 5 percent annual growth assumption, it will take Uganda more than half a century to reach the per capita coffee consumption of Brazil or the US. Under this scenario Uganda will consume 1.6 million bags of coffee, unlikely to make any difference in the global market, as this would represent less than 1.5 percent of global consumption. (For comparison, consider that the combined coffee consumption of Brazil and the US is 36 million bags out of 120 million bags of global consumption, equivalent to a 30 percent share.)
Moreover, since coffee is expensive for the average Ugandan, it is highly unlikely that a 5 percent annual growth (assumed in the above scenario) will be achieved. The domestic consumption survey conducted by UCDA in conjunction with the Uganda Coffee Roasters Association found that the key reasons for the low domestic coffee con‐sumption in Uganda was the high price of coffee compared to close substitutes like tea (UCDA 2003/04 Annual Report, p. 12). According to the same survey, a cup of coffee in Uganda costs, on average, Ush 500, which is equivalent to almost a quarter of an un‐skilled worker’s daily earnings. Further, any increase in coffee consumption is likely to come at the expense of tea (the preferred drink in Uganda according to the survey).
5.5 Establishing a Coffee Auction
The introduction of a coffee auction has been often argued as a way to increase market‐ing efficiency, especially price transparency. Given that an auction would be owned and managed by the private sector, the key issue is whether there are policy‐related im‐pediments preventing the private sector from introducing it. It appears that such im‐pediments do not exist. The coffee auctions of Moshi (Tanzania) and Nairobi (Kenya)

— 12 —
are often cited as successful cases; both, however, have the requirement that all coffee must be marketed through them. Because of this, they have been subjected to requests for reforms (i.e. eliminate their mandatory nature, which may imply their eventual de‐mise).
Furthermore, the basic role of auctions—price discovery—is served very well by the two coffee futures exchanges, the New York Board of Trade (NYBOT) that trades Arabica futures contracts and the London International Financial Futures Exchange (LIFFE) that trades Robusta futures contracts. In a study that examined the efficiency of the Moshi coffee auction, for example, Temu et al. (2001) found that the auction prices, in effect, mimic the NYBOT arabica futures prices. The Mombasa tea auction is another often cited success case. Its success, however, reflects the fact that it is the only tea auc‐tion in the world trading tea in US$, the currency in which the NYBOT and LIFFE con‐tracts are traded. On the other hand, the success of tea auctions in general reflects that fact that tea is traded only at auctions everywhere in the world—there are no tea futures markets so tea auctions are the only price discovery mechanisms.
6. Back to the Basics?
It has been shown that, despite what various reports have argued, the quality of coffee in Uganda has not deteriorated while the marketing structure of the industry appears to be performing quite well. Not surprisingly, the proposed recommendations discussed in the previous section, which were based largely on the assumption of quality decline and poor marketing performance, do not address the industry’s fundamental problem, i.e., that coffee output has been declining despite increasing coffee prices. The remain‐der of this section discusses the two likely reasons behind such decline: the spread of the coffee wilt disease and the ineffectiveness of the coffee replanting program.
6.1 The Coffee Wilt Disease
The coffee wilt disease (CWD), scientifically known as Tracheomycosis, is caused by a fungus that blocks water and nutrients from traveling to other parts of the coffee plant from the roots, in turn causing wilting and eventually death. The disease, which affects only robusta varieties, was first reported in the Central Africa Republic in 1927. Be‐tween 1944 and 1950 it spread to Côte d’Ivoire, Liberia, and Cameroon. It last recurred in Eastern Congo (DRC) between 1988 and the early 1990s from where it is believed to have spread to Uganda. Belgian researchers who worked on the disease in DRC rec‐ommended eradication through distraction of affected coffee trees. Subsequently, a re‐gional working group was established and outlined an action plan but the parastatals in charge of coffee marketing in the region did not act.
The disease affects coffee plants of any age and spreads by wind, water, move‐ment of infected soil, movement of material from infected fields (for example firewood), and use of contaminated tools. These findings are consistent with the way the disease

— 13 —
spread during the earlier outbreaks in DRC and West Africa. Control measures cur‐rently in use aim at reducing the spread of the disease through burning infected coffee trees on site, delaying replanting at least by one to two seasons, and restricting move‐ment of infected material and soil.
The wilt disease, which was first confirmed in Uganda in 1993, has been moni‐tored through field reports and numerous scientific surveys. The disease was the sub‐ject of a workshop (hosted by the Government of Uganda in July 1997), attended by 60 participants from most East and Central Africa coffee producing countries (Sewaya 1999, p. 37). The workshop’s resolutions were: (i) immediate action should be taken to contain the disease; (ii) a project proposal should be presented to the ICO and EU for funding; and (iii) Uganda and DRC should take the lead in the investigations. In terms of research, however, it appears that no immediate progress was made. A few years later, for example, Lutakome (2001, p. 66) noted that “Research work will be intensified to develop a resistant coffee cultivar. Epidemiological study results on the disease will also be made available to farmers.”
The latest UCDA survey confirmed that all robusta‐producing districts have been affected by the disease. In some cases entire coffee fields have been destroyed. Al‐though precise estimates on the impact of the disease are not available, one can gauge the effects of the disease based on the 2003 review study which estimated that of the to‐tal of 240,000 hectares in all 21 robusta‐growing (traditional) districts, 122,400 hectares have been infected (equivalent to about 136 million robusta trees), representing a 51 percent cumulative infection rate (UCDA, 2003/04 Annual Report, p. 29). There is consid‐erable variation among districts with infection rates ranging from a low of 12 percent (Rakai) to a high of 67.2 percent (Mukono, the district accounting for 22 percent of Uganda’s robusta area).
The impact of the coffee disease is enormous. UCDA estimated a loss equivalent to 61,200 tons (1.02 million bags) of coffee, which is around 40 percent of the output in recent years. This corresponds to $42.8 million in export revenue loss per annum at 2003/04 prices (Ush 1,090/kg). Under different assumptions regarding production (88,240 tons) and prices (Ush 1,200/kg), UCTF put the annual losses at $51 million. Note that the wilt disease had been identified as the key problem of Uganda’s coffee industry by Ponte (2002, p. 260): “Uganda’s falling production and changing roaster’s blends may marginalize it in the future vis‐à‐vis cheaper origins, unless coffee wilt disease is tackled” [emphasis added].
Obviously, the only long‐term solution is the development of wilt disease‐resistant coffee varieties. Although some progress has been made towards that end, de‐tails are still unclear. For example, UCDA (2003/04 Annual Report, p. 37) reports that: “Steady progress has been made in the development of robusta coffee lines resistant to the disease. Sustained screening programme has to date identified 593 coffee wilt resis‐tant robusta coffee clones. These were identified among seedlings of germplasm collec‐

— 14 —
tion at Coffee Research Institute (CORI) and have been planted in mother gardens. 143 out of the 593 have been planted out in‐station in a CWD infected garden for field evaluation.” It is not clear, however, how many of these varieties will withstand the disease in infected areas. Furthermore, even under the assumption of complete success, producing plantlets at large quantities and finding effective ways to distribute them to coffee growers will be a monumental task, especially in view of the limitations of the ex‐isting replanting program (see next section).
6.2 The Coffee Replanting Program
The replanting program was introduced in 1992/93 with the objective to enhance the productivity of the sector by replacing old robusta coffee trees with newer, high yield‐ing varieties (free of charge) at the rate of 5 percent per annum, and to expand the area under arabica. The program has been administered by UCDA, which contracted out the production and delivery of seedlings to about 900 private nurseries. During the last 12 years, a total of 135 million trees have been distributed—101 million robusta and 34 mil‐lion arabica. The program peaked during the 2002/03 season when almost 30 million trees were distributed.
While there have been numerous reports from the public and private sectors as‐sessing the progress of the program, there has been no thorough independent evalua‐tion of the program, despite the resources that have been spent on it. These reports have questioned the effectiveness of the program, with the most important problem being the low survival rate of new plantlets, believed to have been in the order of 50 to 60 percent. The main reasons for such low rate include poor growing conditions at the nurseries (hence low quality of plantlets) and distribution during the wrong season. In turn, this has been attributed to delays in reimbursing nursery operators; on some occasions nurseries have not been paid at all and they have abandoned their operations. The most recent estimate is that UCDA owes nurseries some Ush 5‐7 billion (equivalent to US $2.7‐3.8 million). Further, it appears that the new trees are affected by the wilt disease at the same rate as the old trees, which may explain why despite the fact that 101 million of robusta trees have been distributed under the program, an estimated 136 million ro‐busta trees have been destroyed by the wilt disease.
The 2005 UCDA/MAAIF Monitoring and Evaluation Report (p. 21) argued that poor seedling production at the nurseries may have contributed to the incidence of the wilt disease. It also argued that only coffee specific programs such as the former Farm‐ing System Support Programme and Coffee Rehabilitation Programme should be en‐couraged to solve the problems of the coffee industry since it is difficult for other cur‐rent programs such as the Area Based Agricultural Modernization Programme and Na‐tional Agricultural Advisory Services (NAADS) to address coffee problems due to their divergent objectives. Interestingly, most of NAADS activities appeared to be ineffective according to the earlier evaluation (UCDA/MAAIF 2004, p. 11), because they only con‐

— 15 —
sisted of giving seminars, something that coffee growers did not really need. The future of the coffee replanting program, at least in its current form, is unclear.
In its 2004/05 Annual Report, UCTF noted that (p. 21) “According to UCDA notice of May 2004 … government will no longer buy coffee seedlings. UCDA has advised the nursery operators that the seedlings should be planted on demand basis.” Given that free distribution of trees was a key element of the program, one may argue that, in ef‐fect, the replanting program was terminated in May 2004.
7. Conclusion
Responding partly to high prices and partly to efficiency gains from the policy reforms, Uganda’s coffee industry boomed during the mid‐1990s with exports exceeding 4 mil‐lion 60‐kg bags—the highest level in the country’s history. By all accounts, such growth was a key contributor to the poverty reduction documented in rural areas. When coffee prices started declining in 1997, so did coffee production. However, production kept declining even when prices recovered. Even more worryingly, the ongoing decline has taken place in spite of an aggressive replanting program designed to replace Uganda’s ageing tree population with newer varieties. Such decline, which has been accelerated by the spread of the coffee wilt disease, understandably raised concerns among policy makers and prompted a flurry of reports by public, private, and donor agencies.
Most reports identify declining coffee quality and Uganda’s poor market posi‐tion as the industry’s key problems. The evidence presented here, however, overwhelm‐ingly showed that the quality of coffee has not deteriorated. With respect to marketing and regulation, the findings of the present paper largely echo those of the FOODNET (2002, p. 56) report which argued that Uganda’s coffee industry supply chain is com‐petitive and efficient while there is not much to be done to reduce marketing and proc‐essing costs. On the other hand, there are no policy, regulatory, or institutional con‐straints within the marketing chain. As one coffee exporter put it, “Uganda must be do‐ing something right for all these traders from neighboring countries to want to trade their coffee through our marketing system.”7 Further, UCDA is playing a useful role in terms of regulation, inspection, collecting and disseminating statistics, being one of a few commodity organizations in Sub‐Saharan Africa that publishes an Annual Report with very useful statistics, analysis of current issues, and, most importantly, an audited account of its finances. The one percent fee charged on all exports to support its budget is also not high, especially at current volumes and prices. However, at least two of the UCDA’s activities must be reexamined (or, perhaps, removed from its mandate), namely its involvement in coffee promotion activities and its capacity to run the re‐planting program.
Strategies to increase specialty coffee have been proposed very often. During the past nine years only 0.21 percent of Ugandan coffee output was marketed as specialty coffee, very low compared to the world average of 6‐8 percent. This should not be sur‐

— 16 —
prising since Uganda already receives a premium for its robusta. On the other hand, ef‐forts to increase domestic consumption to enhance rural incomes are unlikely to bear any fruit. Similarly, efforts to expand activities such as roasting and instant coffee may add some income (mainly through employment generation) but they are unlikely to have any effect on prices received by growers. The cost effectiveness of promotional ac‐tivities designed to increase consumption of Uganda’s coffee in emerging markets such as China and Middle Eastern countries is questionable. Finally, the recommendation to introduce a coffee auction is also based on assumptions not consistent with the realities of the global coffee market.
The two key issues that policy makers and the donor community should focus their activities on and allocate their resources to at this critical juncture are as follows. First, combating the coffee wilt disease that may have caused the sector losses in the or‐der of $40‐50 million annually and second, undertaking a thorough evaluation of the coffee replanting program. More information is needed on how tree replacement was taking place prior to the replanting program and whether the infection rate of new trees is as high as the old trees. After all, Uganda surpassed 4 million bags of coffee in the mid‐1990s with the old tree stock. Also, an independent evaluation (and audit) of the replanting program should be undertaken to identify potential lessons. With respect to the wilt disease, the earlier outbreaks in the region along with their containment should be documented. Furthermore, intensification and acceleration of research activities for the development of wilt‐resistant varieties should receive attention. While this is not a novel recommendation, strengthening the research capabilities of the Coffee Research Institute should be the top priority.
There are a number of other issues, especially infrastructure‐related, that this pa‐per did not address. This, by no means, implies that they are not important. Rather, in‐frastructure issues must be considered at a higher level of policy making (not sectoral‐level) so that they can be ranked properly. Certainly, developing clean water sources for wet mills, expanding availability power for rural wet mills, and developing a Uganda set aside area at the Port of Mombasa, as recommended by COMPETE (2001, pp. 33‐35), would improve the performance of the coffee sector. However, similar claims can be made by any other sector of the economy.

— 17 —
ENDNOTES 1 See Akiyama et al (2001) for a review of the commodity reform experience in Africa. 2 This is not unusual. Baffes (2005) reports that following every major restructuring of the Tanzanian cof‐fee sector, coffee quality suffered initially but it quickly returned to earlier levels. 3 The ICO price indicators are daily averages obtained by the International Coffee Organization (ICO). They are defined as: Arabica, ICO indicator price, other mild Arabicas, average New York and Brem‐men/Humburg markets, ex‐dock. Robusta, ICO indicator price, Robustas, average New York and Le Havre/Marseilles markets, ex‐dock. Both are quoted in $US. 4 The key reason behind the exit of most coffee exporters was the lack of hedging. When coffee prices were rising, exporters who did not hedge were in a better position compared to those that hedged, because in addition to buying low and selling high, they did not incur hedging fees. However, when prices declined, they were buying high and selling low, which combined with the absence of hedging drove them out of business. 5 Exception to this is a new 1,840‐hectare robusta estate (Kaweri Coffee Plantation LTD, member of the Nuemann Kaffe Gruppe.) The estate, which employs about 2,000 workers, is expected to reach between 80,000 and 100,000 bags of coffee at its peak, to be marketed under the sustainable/traceable trademark. Contrary to what has been reported, however, the estate will not be associated with any outgrower scheme (author’s interview, September 17, 2005). For example, MFPED (2004, p. 24), reported that “the Kaweri Coffee farmers Alliance is to nucleate as out‐growers with the Kaweri Coffee Plantation … and feed the plantation with red cherries as an out‐grower scheme.” 6 See Gibbon (2006) for an overview of the certified organic export sector in Uganda. 7 Personal communication (September 22, 2005).
— 18 —
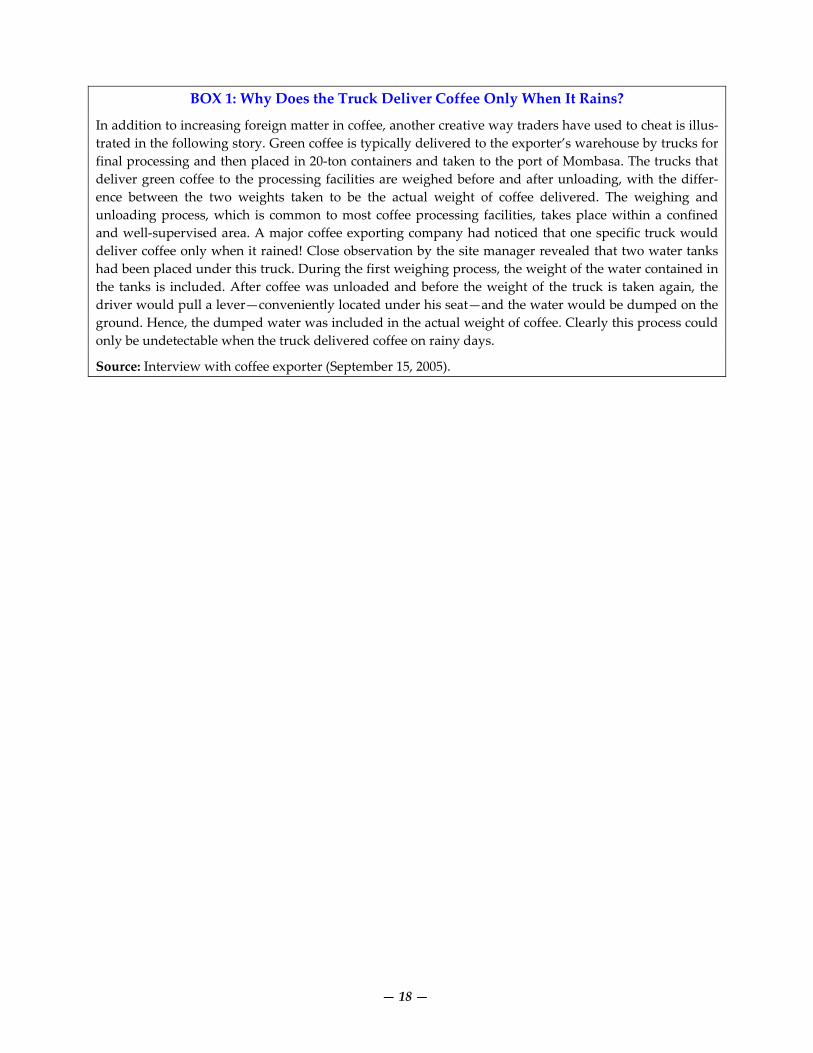
BOX 1: Why Does the Truck Deliver Coffee Only When It Rains?
In addition to increasing foreign matter in coffee, another creative way traders have used to cheat is illus‐trated in the following story. Green coffee is typically delivered to the exporter’s warehouse by trucks for final processing and then placed in 20‐ton containers and taken to the port of Mombasa. The trucks that deliver green coffee to the processing facilities are weighed before and after unloading, with the differ‐ence between the two weights taken to be the actual weight of coffee delivered. The weighing and unloading process, which is common to most coffee processing facilities, takes place within a confined and well‐supervised area. A major coffee exporting company had noticed that one specific truck would deliver coffee only when it rained! Close observation by the site manager revealed that two water tanks had been placed under this truck. During the first weighing process, the weight of the water contained in the tanks is included. After coffee was unloaded and before the weight of the truck is taken again, the driver would pull a lever—conveniently located under his seat—and the water would be dumped on the ground. Hence, the dumped water was included in the actual weight of coffee. Clearly this process could only be undetectable when the truck delivered coffee on rainy days.
Source: Interview with coffee exporter (September 15, 2005).

— 19 —
TABLE 1: KEY INSTITUTIONS IN THE UGANDAN COFFEE INDUSTRY INSTITUTION/ENTITY STATUS MAIN FUNCTIONS AND RESPONSIBILITIES Uganda Coffee Devel‐opment Authority (UCDA)
Statutory Body It was established by the Uganda Coffee Development Authority Stat‐ute of 1991 and took over some of the functions of the Coffee Market‐ing Board. Its objective is to “promote and oversee the coffee industry as a whole by developing research and controlling the quality and im‐proving the marketing of coffee …” It is financed by a one percent cess imposed on all coffee exports.
Coffee Research Institute (CORI)
Statutory Body Headquartered at Kituza in Mukono, about 40 kilometers East of Kam‐pala, its mandate is to “conduct research necessary to solve priority constraints that limit the production of arabica coffee, robusta coffee, oil palm, cocoa, and tea.” The Institute is part of NARO which, along with the donors, are the main sources of its funding.
Uganda Coffee Trade Federation (UCTF)
Private sector Established in 1996 in order to “protect, promote and safeguard the business interests of persons engaged in the coffee trade and industry (whether as growers, processors, agents, brokers, roasters, or export‐ers) and persons connected with the industry in Uganda.” It is fi‐nanced by its members.
National Union of Coffee Agribusiness and Farm Enterprises (NUCAFE)
Private Sector Founded in 1995 as the Ugandan Coffee Farmers Association, it changed its name and mandate in 2003 as a result of strategic planning carried out in 2003 with the support of a USAID‐funded project. Its mission is to “establish a sustainable and profitable farmer operated organization for the benefit of coffee farmers.”
Uganda Coffee Roasters Association (UCRA)
Private Sector Represents the interests of Ugandan Roasters who supply the local market. Uganda consumes some 100,000 bags per annum, accounting for 3 percent of Uganda’s output.
National Organic Agri‐cultural Movement of Uganda (NOAGMU)
Private Sector Created in 2001, its objective is to promote organic farming through training, development of standards, promotion (local and interna‐tional), and lobbying and advocating.
National Agricultural Advisory Services (NAADS)
Statutory Body Established by the National Agricultural Advisory Services Act of 2001 as a statutory corporation, its mission is to promote market‐oriented agriculture through provision of extension services.
Ministry of Agriculture, Animal Industry and Fisheries (MAAIF)
Government Its mandate it to promote, support, and guide the agricultural sector. Most of its coffee‐related activities are performed through NARO and CORI.
Ministry of Finance, Planning and Economic Development (MFPED)
Government It oversees the planning of national strategic development initiatives in order to facilitate growth, efficiency, stability, and poverty eradication. It also mobilizes resources for public expenditure programs.
Ministry of Tourism, Trade, and Industry (MTTI)
Government Three departments within Ministry (Trade, Cooperatives, and Indus‐try) deal with coffee‐policy issues such as export promotion, value ad‐dition, enhancement of competitiveness, and extension services.
Source: Coffee Sector Restructuring Taskforce (2003); Uganda Trade Coffee Federation; and author’s in‐terviews.

— 20 —
TABLE 2: ROBUSTA COFFEE PRICES IN UGANDA Average Price Producers SC 15 as Exchange F.A.Q. SC 15 Share ICO Robusta Indicator ICO Share Rate (Ush/kg) (Ush/kg) (percent) (US$/kg) (Ush/kg) (percent) (US$/Ush)
1991/92 420 927 45 0.95 1,005 92 1,058 1992/93 568 1,092 52 1.08 1,300 84 1,204 1993/94 1,292 1,684 77 2.12 2,203 76 1,039 1994/95 1,685 2,343 72 3.02 2,842 82 941 1995/96 1,254 1,606 78 2.01 2,082 77 1,036 1996/97 1,146 1,480 77 1.69 1,800 82 1,065 1997/98 1,430 1,900 75 1.80 2,142 89 1,190 1998/99 1,433 1,899 75 1.59 2,250 84 1,415 1999/2000 1,100 1,580 70 1.08 1,691 93 1,566 2000/01 700 997 70 0.66 1,173 85 1,778 2001/02 520 778 67 0.59 1,045 74 1,771 2002/03 1,080 1,386 78 0.82 1,583 88 1,930 2003/04 1,090 1,420 77 0.80 1,495 95 1,869
Notes: F.A.Q. refers to fair average quality and represents the price paid by exporters to the “F.A.Q.” traders. SC 15 refers to screen 1500, the grade accounting for two thirds of Uganda’s robusta output; these are the prices received by exporters (f.o.t. Kampala). Producers share is the ratio of F.A.Q. over SC 15 (i.e. 1090/1420 = 77%). In reality, producers receive a smaller share when marketing costs are accounted for. All variables reflect October‐September averages. Source: Uganda Coffee Development Authority, 2003/04 Annual Report (Table 2.9, p. 9), World Bank, Commodity Price Data, and International Monetary Fund, International Financial Statistics.
TABLE 3: COMPOSITION OF COFFEE PRODUCTION BY TYPE AND QUALITY (PERCENT) ARABICA ROBUSTA > SC 15 SC 15 SC 15 > OTHERS 1997/98 11 89 12 63 20 5 1998/99 10 90 6 56 32 5 1999/2000 18 82 9 63 24 4 2000/01 15 85 12 60 23 6 2001/02 14 86 14 60 21 5 2002/03 17 83 13 56 23 8 2003/04 19 81 14 58 16 12
Notes: The shares of arabica and robusta refer to total coffee and add to 100; the remaining 4 shares refer to robusta coffee and they also add to 100. ‘> SC 15’ corresponds to quality greater than screen 1,500, the highest robusta quality. ‘SC 15’ is the average quality, while ‘SC 15 >’ corresponds to lower quality ro‐busta, less than screen 1,500. Others include various other grades including specialty/organic coffee. Source: UCDA

— 21 —
TABLE 4: UGANDA’S ORGANIC COFFEE STATISTICS 1999/2000 2000/01 2001/02 2002/03 2003/04
ROBUSTA Exports, total (60‐kg bags) 2,390,682 2,617,777 2,716,955 2,220,440 2,039,482 Exports, organic (60‐kg bags) 2,540 5,020 1,440 2,500 1,828 Share of organic exports 0.11% 0.19% 0.05% 0.11% 0.09% Value, total (US$) 121,864,609 79,847,671 64,496,820 81,813,846 82,608,487 Value, organic (US$) 136,173 232,137 48,937 120,723 77,337 Share of organic value 0.11% 0.29% 0.08% 0.15% 0.09% Unit price, total ($/kg) 0.85 0.51 0.40 0.61 0.68 Unit price, organic ($/kg) 0.89 0.77 0.57 0.80 0.71 Organic premium 5% 52% 43% 31% 4% ICO robusta indicator ($/kg) 1.08 0.66 0.59 0.82 0.80
ARABICA Exports, total (60‐kg bags) 526,575 456,996 430,426 442,448 483,610 Exports, organic (60‐kg bags) — 620 4,180 4,380 1,110 Share of organic exports — 0.14% 0.97% 0.99% 0.23% Value, total (US$) 42,899,183 24,928,755 19,440,132 22,973,248 33,093,283 Value, organic (US$) — 36,375 223,428 339,947 83,283 Share of organic value — 0.15% 1.15% 1.48% 0.25% Unit price, total ($/kg) 1.36 0.91 0.75 0.87 1.14 Unit price, organic ($/kg) — 0.98 1.06 1.29 1.25 Organic premium — 8% 18% 49% 10% ICO arabica indicator ($/kg) 2.14 1.45 1.31 1.43 1.62
Notes: Years reflect October‐September averages. Unit prices have been calculated as value (US$) over exports (bags*60). Source: Author’s calculations based on data from the UCDA Annual Reports.
— 22 —
Figure 1: Share of Export Prices Received by Producers (percent)
0%
20%
40%
60%
80%
100%
1973 1975 1977 1979 1981 1983 1985 1987 1989 1991 1993 1995 1997 1999 2001 2003
Source: Bibangambah (1996), Akiyama (2001), and Uganda Coffee Development Authority
Figure 2: Robusta Export Unit Value as Share of ICO Indicator
50%
60%
70%
80%
90%
100%
1993 1994 1995 1996 1997 1998 1999 2000 2001 2002 2003
Source: Authorʹs Calculations from World Bank and Uganda Coffee Development Authority data

— 23 —
Figure 3: Number of Active Coffee Exporting Firms
0
20
40
60
80
100
1990 1991 1992 1993 1994 1995 1996 1997 1998 1999 2000 2001 2002 2003
Source: Uganda Coffee Development Authority
Figure 4: Herfindahl Concentration Index of Coffee Exporters
0%
2%
4%
6%
8%
10%
12%
1993 1994 1995 1996 1997 1998 1999 2000 2001 2002 2003
Source: Authorʹs Calculations based on Uganda Coffee Development Authority data

— 24 —
Figure 5: Coffee Sales through Specialty Channels (60‐kg bags)
0
3,000
6,000
9,000
12,000
15,000
18,000
1995 1996 1997 1998 1999 2000 2001 2002 2003
Source: Uganda Coffee Development Authority

— 25 —
REFERENCES
Akiyama, Takamasa, John Baffes, Donald Larson, and Panos Varangis (2003). “Com‐modity Market Reform in Africa: Some Recent Experience.” Economic Systems, vol. 27, no.1, pp. 83‐115.
Akiyama, Takamasa (2001). “Coffee Market Liberalization since 1990.” In Commodity Market Reforms: Lessons from Two Decades, ed. Takamasa Akiyama, John Baffes, Don‐ald Larson, and Panos Varangis. Regional and Sectoral Studies. The World Bank, Washington, DC.
Baffes, John (2005). “Tanzania’s Coffee Sector: Constraints and Challenges.” Journal of International Development, vol. 17, no. 1, pp. 21‐43.
Baffes, John (2004). “Tanzania’s Cotton Sector: Reforms, Constraints, and Challenges.” Development Policy Review, vol. 22, no.1, pp. 75‐96.
Baffes, John, Bryan Lewin, and Panos Varangis (2005). “Coffee: Market Setting and Poli‐cies.” In Global Agricultural Trade and Developing Countries, pp. 297‐310, ed. M. Ataman Aksoy and John C. Beghin. The World Bank, Washington, D.C.
Bibangambah, Jossy Rwakishana (1996). Marketing Smallholder Crops in Uganda. Fountain Publishers, Ltd. Kampala, Uganda.
Bussolo, Maurizio, Olivier Godart, Jann Lay, and Rainer Thiele (2005). “Impact of Commodity Price Changes on Rural Households: The Case of Coffee in Uganda.” Mimeo, Development Prospects Group, World Bank, Washington, D.C.
Coffee Sector Restructuring Taskforce (2003). “Enhancing Coffee Sector Competitive‐ness: Realigning the Institutional Structure, Supervisory and Regulatory Functions.” Final Report submitted to the PMA Steering Committee. Kampala, Uganda.
Collier, Paul (1997). “Trade Policy Review of Uganda.” World Economy, vol. 20, no. 5, pp. 649‐664.
Collier, Paul and Ritva Reinikka (2001). “Reconstruction and Liberalization: An Over‐view.” In Uganda’s Recovery: The Role of farms, Firms, and Government, ed. Ritva Re‐inikka and Paul Collier. Regional and Sectoral Studies. The World Bank, Washing‐ton, DC.
COMPETE (2001). “The Path Forward in Uganda’s Coffee Sector.” Report prepared by the COMPETE Project for the Presidential Conference on Export Competitiveness. Kampala, Uganda.
Coulter, Jonathan and Rita Laker‐Ojok (2005). “Scoping Study on Agricultural Input and Output Markets.” Report prepared for the UK Department of International De‐velopment (DFID) and the Swedish International Development Agency (SIDA). Natural Resources Institute, Chatham, UK and AT Uganda, Kampala.
Deininger, Klaus and John Okidi (2003). “Growth and Poverty reduction inn Uganda, 1990‐2000: Panel Data Evidence.” Development Policy Review, vol. 21, no. 3, pp. 481‐

— 26 —
509. Fafchamps, Marcel, Ruth Vargas Hill, Aliziki Kaudha, and Robert Nsibirwa (2003). “The
Transmission of International Commodity Prices to Domestic Producers.” Working Paper no. 2003‐04. Centre for the Study of African Economies, University of Oxford. Oxford, UK.
FOODNET (2002). “Transaction Costs Analysis, Final Report.” Report prepared for the Plan for the Modernization of Agriculture. The Natural Resources Institute and the International Institute of Tropical Agriculture.
Gibbon, Peter (2006). “An Overview of the Certified Organic Export Sector in Uganda.” Mimeo. Trade and Development Group, Danish Institute for International Studies, Copenhagen, Denmark.
Gibbon, Peter (1999). “Free Competition without Sustainable Development? Tanzanian Cotton Sector Liberalization, 1994/95 to 1997/98.” Journal of Development Studies, vol. 36, no.1, pp. 128‐50.
Giovannucci, Daniele P. (2002). “Uganda Coffee Strategy.” Report prepared for the Pri‐vate Sector Foundation. Kampala, Uganda.
Henstridge, Mark (1996). “Coffee and Money in Uganda: An Econometric Analysis.” PhD. Dissertation. Oxford University, Oxford, U.K.
Henstridge, Mark and Louis Kasekende (2001). “Exchange Reforms, Stabilization, and Fiscal Management.” In Uganda’s Recovery: The Role of farms, Firms, and Government, ed. Ritva Reinikka and Paul Collier. Regional and Sectoral Studies. The World Bank, Washington, DC.
Kappel, Robert, Jann Lay, and Susan Steiner (2005). “Uganda: No More Pro‐Poor Growth?” Development Policy Review, vol. 23, no. 1, pp. 27‐53.
Kilian, Bernard, Connie Jones, Lawrence Pratt, and Andrès Villalobos (2006). “Is Sus‐tainable Agriculture a Viable Strategy to Improve Farm Income in Central America? A Case Study on Coffee.” Journal of Business Research, vol. 59, no. 3, 322‐330.
Krivonos, Ekaterina (2003). “The Impact of Coffee Market Reforms on Producers Prices and Price Transmission.” Policy Research Working Paper, no. 3358. The World Bank, Washington, DC.
Larsen, Marianne Nylandsted (2003). “Quality Standard‐Setting in the Global Cotton Chain and Cotton Sector Reforms in Sub‐Saharan Africa.” Working Paper 03.7. Insti‐tute for International Studies, Copenhagen.
Lutakome, Edward Sentamu (2001). “Coffee Wilt Disease.” The 2000/01 Coffee Yearbook, Uganda Coffee Trade Federation, pp. 64‐66. Kampala, Uganda.
Lewin, Bryan, Daniele Giovannucci, and Panos Varangis (2004). “Coffee Markets: New Paradigms in Global Supply and Demand.” Agriculture and Rural Development In‐ternal Report. The World Bank, Washington, D.C.

— 27 —
MFPED , Ministry of Finance, Planning and Economic Development (2004). “Value for Money Study of the Strategic Export Program (SEP).” Report prepared by Develop‐ment Consultants International Limited and submitted to the National Coordinator, Medium Term Competitiveness Secretariat. Kampala, Uganda.
New Vision (2005). “Chinese Coffee Investor Pulls Out.” September 24, p. 31. Nsibirwa, Robert (2002). “Emerging Concentration in the Coffee Export Sector in
Uganda.” The 2001/02 Coffee Yearbook, Uganda Coffee Trade Federation, pp. 50‐54. Kampala, Uganda.
Ponte, Stefano (2002). “Brewing a Bitter Cup? Deregulation, Quality and the Reorgani‐zation of Coffee Marketing in East Africa.” Journal of Agrarian Change, vol. 2, no. 2, pp. 248‐273.
Ponte, Stefano and Fred Kawuma (2003). “Coffee Certification in Uganda: Feasibility Study.” Final Report, Version 2. Institute of International Studies, Denmark and Eastern African Fine Coffees Association, Kampala, Uganda.
Rosetti, Nabbumba (1998). “Promoting Productivity and Competitiveness of African Agriculture: A Profile on Ugandan Agriculture.” Mimeo, Economic Policy Research Center, Kampala, Uganda.
SCOPE (2005). “Building Uganda’s Global Competitiveness in Agribusiness, 2005‐2010: Uganda’s Coffee Competitive Plan.” Working Draft. Kampala, Uganda.
Sewaya, Frederick M. (1999). “Conference on Coffee Wilt Disease.” The 1998/99 Coffee Yearbook, Uganda Coffee Trade Federation, p. 37. Kampala, Uganda.
Shepherd, Andrew W. and Stefano Farolfi (1999). Export Crop Liberalization in Africa: A Review. FAO Agricultural Services Bulletin 135. Rome: Food and Agriculture Or‐ganization.
Talbot, John M. (1977). “The Struggle for Control of a Commodity Chain: Instant Coffee from Latin America.” Latin America Research Review, vol. 32, no. 1, pp. 117‐135.
Temu, Anna, Alex Winter‐Nelson, and Philip Garcia (2001). “Market Liberalization, Vertical Integration, and Price Behavior in Tanzania’s Coffee Auction.” Development Policy Review, vol. 19, no.2, pp. 205‐222.
Tollens, Eric F. and Christopher L. Gilbert (2003). “Does Market Liberalization Jeopard‐ize Export Quality? Cameroonian Cocoa, 1988‐2000.” Journal of African Economics, vol. 12, no. 3, pp. 303‐342.
UCDA/MAAIF, Uganda Coffee Development Authority/Ministry of Agriculture, Ani‐mal Industries and Fisheries (2004 & 2005). “Monitoring and Evaluation on the Cof‐fee replanting—Strategic Exports Programme (SEP).” Kampala, Uganda.
UCDA, Uganda Coffee Development Authority (various issues). Annual Reports, Kam‐pala, Uganda.
UCTF, Uganda Coffee Trade Federation (various issues). Annual Reports, Kampala,

— 28 —
Uganda. World Bank (1983). “Uganda: Agricultural Rehabilitation Project.” Staff Appraisal Re‐
port, no 4150‐UG. Washington, D.C. World Bank. Commodity Price Data. Various Issues. Washington, D.C. You, Liangzhi and Simon Bolwig (2003). “Alternative Growth Scenarios for Ugandan
Coffee to 2020.” EPTD Discussion Paper no. 98. Environment and Production Tech‐nology Division, International Food Policy research Institute, Washington, D.C.


