Public Disclosure Authorized PrivateMector · There is full text in HTML format ... publication and...
50
0U B L I C P 0 L I C Y F 0 R T H E SEPTEMBER 1998 PrivateMector 5 The East Asian Financial Crisis - Fallout for Private Power Projects P David Gray anidJohn Schuster 13 Contingent Liabilities for Infrastructure Projects- Implementing a Risk Management Framework for Governments CbristopbernM. aleGs aed Ashoka MIodv 17 Risk Management Systems to Improve Contract Design and Monitoring Cbristopber M. Lewis and Asboka Modv 21 Financing Water and Sanitation Projects-The Unique Risks David HaarmLyer and Ashoka M4ody 25 Pooling Water Projects to Mlave beyond Project Finance David Haarmeyer and Ashoka-Mody 29 International Gas Trade- The Bolivia-Brazil Gas Pipeline Peter L. Lau, ad Nelson de Franca 33 Promoting Regional Power Trade-The Southern African Power Pool Donal T. 0 Leart', Jeanz-Pierre Charpentier. and DianefMinogue 37 Why Performance Contracts far State-Owned Enterprises Haven't Worked fary Shirley 41 Private Participation in the Water and Sewerage Sector- Recent Trends Gisele Silva, Nicola Ty1nan,as 1s Yesim Yilmaz The WlBnGu inraScr FILE COPY 1 ~~~~~~~The World Bank Group * Finance. Private Sector, and Infrastructure Netvvork Public Disclosure Authorized Public Disclosure Authorized Public Disclosure Authorized Public Disclosure Authorized Public Disclosure Authorized Public Disclosure Authorized Public Disclosure Authorized Public Disclosure Authorized
Transcript of Public Disclosure Authorized PrivateMector · There is full text in HTML format ... publication and...

0U B L I C P 0 L I C Y F 0 R T H E SEPTEMBER 1998
PrivateMector5 The East Asian Financial Crisis -
Fallout for Private Power ProjectsP David Gray anidJohn Schuster
13 Contingent Liabilities forInfrastructure Projects-Implementing a Risk ManagementFramework for GovernmentsCbristopbernM. aleGs aedAshoka MIodv
17 Risk Management Systemsto Improve Contract Designand MonitoringCbristopber M. Lewis andAsboka Modv
21 Financing Water and SanitationProjects-The Unique RisksDavid HaarmLyer andAshoka M4ody
25 Pooling Water Projects to Mlavebeyond Project FinanceDavid Haarmeyer andAshoka-Mody
29 International Gas Trade-The Bolivia-Brazil Gas PipelinePeter L. Lau, ad Nelson de Franca
33 Promoting Regional PowerTrade-The Southern AfricanPower PoolDonal T. 0 Leart', Jeanz-PierreCharpentier. and DianefMinogue
37 Why Performance Contractsfar State-Owned EnterprisesHaven't Workedfary Shirley
41 Private Participation in theWater and Sewerage Sector-Recent TrendsGisele Silva, Nicola Ty1nan, as 1sYesim Yilmaz
The WlBnGu inraScr FILE COPY1 ~~~~~~~The World Bank Group * Finance. Private Sector, and Infrastructure Netvvork
Pub
lic D
iscl
osur
e A
utho
rized
Pub
lic D
iscl
osur
e A
utho
rized
Pub
lic D
iscl
osur
e A
utho
rized
Pub
lic D
iscl
osur
e A
utho
rized
Pub
lic D
iscl
osur
e A
utho
rized
Pub
lic D
iscl
osur
e A
utho
rized
Pub
lic D
iscl
osur
e A
utho
rized
Pub
lic D
iscl
osur
e A
utho
rized

Private Sector is an open forum intended toencourage dissemination of and debate onideas, innovations, and best practices for ex-panding the private sector. The views pub-lished are those of the authors and should notbe attributed to the World Bank or any of itsaffiliated organizations. Nor do any of the con-clusions represent official policy of the WorldBank or of its Executive Directors or the coun-tries they represent.
Private Sector is a quarterly publication dis-tributed free of charge. To subscribe, pleasesend your name, mailing address, telephonenumber, and fax number to the editor (SuzanneSmith, The World Bank, 1818 H Street, NW,Washington, D.C. 20433, email: [email protected], fax: 202 522 2961, telephone:202 458 1111).
Most Notes from Private Sector are also avail-able on-line. There is full text in HTML formatfor on-screen viewing or a downloadable file inAdobe's PDF format (http://www.worldbank.org/html/fpd/notes/notelist.html).

F In this issue
*, ' -. * s / ................ The financial crisis that erupted in East Asia in^ *.s * 1';. ,, 'jtt~ ' - -mid-1997 has led to sharp drops in currencies,
1C_- j........* .t; * ....... * . . stock markets, and other asset prices. One vear; .p * e , < * on, the crisis is starting to have a dramatic ef-
fect on the IPP industry in Asia, which hasb *, ; ¢ ,,/ * dominated the global market for private power
' * ,j,,. 3rX et s projects. In this issue we review the implica-tions for power sector reform.
b~~~l
N * t '-. ', . We also review the trends in private participa-tion in water projects in developing countries,
; ' ' . * . with an update from the World Bank's private' _ _ infrastructure project database. Future issues
will review projects in other sectors: power, tele-communications. and transport.
Finally, we would like to update our subscriberdatabase. Please revalidate your subscriptionby filling out the enclosed form. If we do nothear from you, we will drop your name fromouir mailing list.
Suzanne SmithManaging Editor
tt-
;, ~~~~~4£
VtW .t4 s1w
b sW;\'*X
$> 1,'** .o W~~~~

~~~~~~~~~~~~~~~, , - , ,~ ' ~ .~
* PrivatesectorQuarterlv No. 14, September 1998
The East Asian Financial Crisis-Fallout for Private Power Projects 5R. David Gray and John Schuster discuss the impact of the East Asian financial crisis on the power sectors offotir of the most severely affected economies-Indonesia, Malaysia, the Philippines, and Thailand. For each
country thic authors examine the impact of the crisis on the cost of private power and the knock-on effects on
retail tariffs. They also assess the sustainability of ctIrrent private power programs, xvhich hinges on the level of
governtnent risk exposure, the method used in awarding contracts, and the changed capacity needs in the wake
of sloxving or negative GDIP grow-th.
Contingent Liabilities for Infrastructure Projects-Implementing a Risk Management Frameworkfor Governments 13To manage their exposure arising from gguarantees to infrastructure projects, governments needl to adopt modern risk
management techniques. Christopher Lewis and Ashoka Mody introduce an integrated risk management system
that draws on recent advances in the private sector, Adapted for use in the public sector, the system enables
governments to budget for expected losses and to set aside reserves against unexpected losses, thus avoiding the
Lbudgetary stress associated with redirecting scarce public resources to cover a sudden increase in costs.
Risk Management Systems for Contingent Infrastructure Liabilities-Applications to ImproveContract Design and Monitoring 17Government guarantees for private infrastructure projects represent real liabilities, and their costs can average as
much as a third of the amount guaranteed. Christopher Lewis and Ashoka Mody show how governments can
use a risk valtiation process to analyze the distribution of risks, decide which risks they should bear and which
shoukl be borne by the private sector, and reduce the frequency and size of calls on guarantees.
. C Financing Water and Sanitation Projects-The Unique Risks 21A project finance structure allows water projects with attractive cash flows and risk profiles to secure long-term
private capital. Buit even in industrial countries the credit strength of off-taking municipal governments and the
sector's traditional monopoly structure expose lenders to potentiallv significant credit, regLilatory, and political
risks. These risks, combined with the sLink, hiighly specific, and non-redeployable nattire of water infrastructureinvestments, mean that lenders and investors are vtilnerable to opportunistic contracting problems and expropria-
C<fe : 4 d ;X X<, tion. Reviewing some recent innovative water and sanitation projects, David Haarmeyer and Ashoka Modyshow that private capital participation on a limited recourse or nonrecourse basis has required support by third
parties-stich as multilaterals and federal government agencies-to absorb noncommercial risks.
Pooling Water Projects to Move beyond Project Finance 25To date most private sector water projects have been financed on a limited recourse basis, that is, with project cashflows and assets as the main security for lenders. The move from project to corporate (balance sheet) financing is
occurring in stages. Financing project debt from the sponsor company's balance sheet exposes that company tosignificant risk and thus requires a strong and large balance sheet. Designed in part to shield a company's balance

sheet, innovative financing strLuctures and instrLuments are emerging. Ultimately, the goal is for water utilities to
raise debt and equity from capital markets on the basis of their own balance sheets, strengthened by a diversified
and stable rate-paying customer hase. David Haarmeyer and Ashoka Mody review the new trends.
International Gas Trade-The Bolivia-Brazil Gas Pipeline 29
The Bolivia-B3razil natural gas pipeline, which will transport natural gas more than 3.000 kilometers, will cost
US$2. 1 billion to construct. Despite the substantial benefits for b)oth Bolivia and Brazil and the involvement of
reputable private partners. the perceived risks and complexities of this large project made financing it a major
challenge. Peter Law and Nelson de Franco explain the historical factors that shaped the project, how the
financing package came together, and the role the pipeline will plav in liberalizing the Brazilian hydrocarbon sector.
Promoting Regional Power Trade-The Southern African Power Pool 33
The Southern African Power Pool (SAPP), the first formal international pool to be set up outside North America
and Western Europe, was inaugurated in 1995. While the utilities of southern Africa have been importing and
exporting electricity fir four decades, these trades occurred through bilateral contracts that were complex and
often difficult to administer. The objective of shifting to the pool is to create a more efficient regional market.
Although physically the pool is still embryonic and trade volumes average roughly 3 percent of production,
confidence in the market and mutual trust between the members are being strengthened and sector coordination
is dramatically improved. Donal O'Leary, Jean-Pierre Charpentier, and Diane Minogue review the factors that
have eased the way for the pool agreements and the challenges that remain in getting the multilateral trading
operation under xway.
Why Performance Contracts for State-Owned Enterprises Haven't Worked 37rt
When privatization is not feasible or palatable, developing country governments seeking to improve the perfor- l
mance of state enterprises are often negotiating performance contracts with their managers. Many of these con-
tracts have been put in place with WXorld Bank assistance. Research shows that they rarely work. Mary Shirley
summarizes the rationale for performance contracts and the evidence against them and explores the reasons wh 'X
they haven't worked. She concludes that since a well-designed and carefully enforced performance contract can
be as politically costly as a well-designed privatization, performance contracts are not likely to be successful in
countries that lack the political will to privatize.
Private Participation in the Water and Sewerage Sector-Recent Trends 41 C $7
Analysis of the World Bank's private participation in infrastructure database shows that by the end of 1997,
private companies operating in developing countries had reached financial closure on US$25 billion of g. Sinvesmient in water and sewerage projects and had taken on the management, operations, rehabilitation, or
construction risk of ninety-seven projects in thirty-five developing countries. The database shows an over-
whelming dominance of concession contracts compared with divestitires, greenfield projects, and management
contracts, and that there are still only a few international companies sponsoring and operating most contracts.
r-* p 4s*Wi

4
_ o <( 3LJIFC PO1.I C y F ORKT
For a free subscription toP rivate sector1 Fill out and mail this card to Suzanne Smith, Managing Editor, The World Bank,
1818 H Street NW, Washington, D.C. 20433, or fax it to 202 522 2961
FIRST NAME Ml LAST NAME Topics ofinterest
JOB TITLE COMPANY D Banking andcapital markets
STREET ADDRESS D Privatization
El CompetitionSTATE POSTAL CODE and regulation
El Telecoms andCOUNTRY EMAIL technology
L_jEnergyW1ORK PHONE FAX
LI Transport
2 Call 202 458 1111 to record this information : Water
Managing Editor: 3 Email this information to ssmith7Iworldbank.org D AllSuzanne SmithThe World Bank1818 H Street, NWWashington, D.C, 20433
Telephone: 202 458 7281Fax: 202 522 2961Email: [email protected]
Cover illustration byRuth Sofair Ketler.Photos on pages 1, 2,3, and 12 by FPG _ International.,I
The entire contents of
Private Sector © 1998rva esc oWorld Bank. You areauthorized toreproduce, duplicate,and disseminate all orpart of this publicationan long as you include l R tmtngadPrvo wthe name of the 7
publication and the UK F Sppl -k It V t Iname of the respectiveauthor.Youmaynot, 4however, modify, alter,or otherwise change . ERRSOEO©, 10 b,t £
any part of this AiSSX X:1S .publication or sell,S
transfer, oruotherw"ise k*t*1kfdisseminate any part afthe publication forprofit.
/ Printed on recycled Most Notes are now available on-line in full-text HTML format or in downloadable Adobe PDFpaper. format (http://www.worldbank.org/html/fpd/notes/notelist.html).

5
The East Asian Financial Crisis-Fallout for PrivatePower ProjectsR. David Gray and John Schuster
Countries around the world have increasingly country's single buyer. The single buyer entersturned to the private sector to finance and build into long-term power purchase agreementsnew power projects. This trend has been es- (PPAs) in which the buyer agrees to take powerpecially pronounced in Asia, which accounts at specified rates from private power produc-for nearly 60 percent of all new private gen- ers for periods ranging from ten to thirty years.eration capacity financed in the developingworld. But the East Asian financial crisis that While the full extent of the crisis and its fallout inbegan in mid-1997, triggering dramatic stock these four countries is not yet known, informationmarket and currency slides and stalling eco- available to date shows that the effects vary widelynomic growth in the region, has already had a among the countries. To varying degrees theirprofound effect on investment in infrastructure. private power programs have been affected by:This Note discusses the impact of the crisis in * Increased cost of power.the power sectors of four of the most severely * Threats of contract defaults and renegotiations.affecled economies-Indonesia, Malaysia, the * Contraction of the market for private power.Philippines, and Thailand. All have major pri-vate investments in power generation, but their As the following analysis will show, the diver-power sectors are still dominated by vertically gences in the management and impact of theintegrated public utilities that act as the crisis suggest a number of important lessons for
TABLE 1 CRISIS-RELATED FACTORS AFFECTING THE IMPACT OF IPP COSTS ON RETAIL TARIFFS
Dimensions I Project 11Country of crisis -- I Mvintage tariffs _1 11
Indonesia QMalaysia 0 0 0 00 0Philippines c C C/O
Thailand a@0 cCO /o
C Little impact E Some impact Severe impact

6 The East Asian Financial Crisis-Fallout for Private Power Projects
power reform and the role of independent tricity rates will need to increase only slightlypower producers (JPPs) in that process. in Malaysia and Thailand to cover increased
IPP costs-though rates may have to increaseIncreased cost of power further for other reasons.
A currency depreciation of the magnitude of Dimensions of the economic crisisthose in East Asia increases the cost of mostgoods and services, including electric power. All four countries have suffered severe economicThe extent of the rise in power costs attribut- setbacks since mid-1997, and the Internationalable to private power has varied among the Monetary Fund has forecast a significant slow-countries, depending on such factors as: down in economic growth in 1998.1 By early* The dimensions of the economic crisis. June 1998 Malaysia, the Philippines, and Thai-* The origin of the fuel supply. land had experienced currency depreciations of* The currency denomination of the wholesale around 35 percent, and interest rates in Malay-
tariffs. sia and the Philippines had risen 50 percent from* The extent of domestic financing for projects. a year earlier. Interest rates in Thailand are nearly* The amount and timing of private power twice the previous year's level. The drop in the
purchases. value of currencies was accompanied by de-* Wholesale and retail tariffs. clines in regional stock markets. The Malaysian
market index fell by more than 50 percent inEach of these factors is examined below, and local currency terms between early June 1997table 1 sums the aggregate implications for tar- and 1998, while the Philippines and Thailandiffs. This analysis suggests that the crisis will suffered slides of 30 and 40 percent. Indonesiahave the most severe impact in the Indonesian has been hit hardest-the rupiah has droppedpower sector, where retail tariffs may need to 80 percent in value in the past year, increasingrise by up to 70 percent to pay for the increased the local cost of imports by a factor of five. In-cost of private power. In contrast, retail elec- terest rates are more than three times higher
FIGURE 1 PRIVATE POWER CAPACITY, MARCH 1998
Megawatts In construction6,000 _ In operation
5,000
4,000
3,000
2.000
1,000
Indonesia Malaysia Philippines Thailand
Source: Hagler Bailly IIP Knowledge Base.

The World Bank Group 7
than before the crisis, the stock market has fallen Democratic Republic, payments to private power
by more than 40 percent, and growth is pro- projects are denominated in baht. Nonetheless,
jected to turn sharply negative this year. the depreciation of the baht made plannedprojects unfinanceable under the existing power
Many regional utilities have high levels of for- purchase agreements. EGAT reopened negotia-
eign debt, and the depreciation has led to heavy tions with sponsors to ensure the financial vi-
foreign exchange losses in servicing that debt, ability of projects needed to reduce the country's
eroding their financial positions. The cost of capi- power shortages. The utility pegged part of the
tal for new projects is likely to rise sharply as private power tariff to the U.S. dollar and as-
investors assess additional premiums to com- sumed some currency risk by agreeing to pay
pensate for higher perceived risk. The skyrock- IPPs at an exchange rate of 27 baht per dollar,
eting domestic interest rates also make financing close to the precrisis rate of about 25 baht per
new projects costlier. dollar. In early June the baht traded at 40 to 42per dollar.
Origin of fuel supplyExtent of domestic financing for projects
Fuel costs, a pass-through for power off-takersunder most private power contracts in Asia and Projects attracting high levels of domestic financeihroughout the developing world, can repre- are less susceptible to exchange rate volatility
sent about a third of the life-cycle cost of a (although they may be vulnerable to interest
coal project and about three-quarters of the rate hikes). Malaysia and Thailand both have
life-cycle cost of oil and gas projects.2 If fuel is high levels of local debt financing for IPPs (90
imported, a depreciation of the size of those in percent and 75 percent), which help to mitigate
East Asia significantly increases the local cur- the impact of the currency depreciation. Do-
rency costs of both public and private power. mestic financing is negligible in the other two
In the Philippines and Thailand most private countries-14 percent in Indonesia and just 3
projects import fuel-at prices about 50 per- percent in the Philippines-leaving them more
cent higher in 1998 than in 1997. exposed to the mismatch between project rev-enues denominated in local currency, and hard
Currency of wholesale tariffs currency obligations to project lenders.
The currency denomination of payments for Amount and timing of private power purchasesprivate power is one of the most important dif-ferentiating factors in the impact of the crisis Indonesia, Malaysia, and the Philippines are
on those payments. In Indonesia and the Phil- among the developing world's largest markets
ippines, where wholesale electricity tariffs for for private power with limited recourse financ-
IPPs have been denominated in hard curren- ing.3 Each has nearly 5 gigawatts (GW) of pri-
cies, the local currency cost of utilities' off-take vate power capacity in operation or under
obligations has ballooned. In Malaysia, where construction (figure 1). Private power now ac-
power purchase payments are denominated in counts for more than half of all generation in
local currency and interest rates have risen com- Malaysia and the Philippines. It has played a
paratively less, the cost of private power has smaller role in Thailand. But once all the nearly
risen by less than 10 percent. 2 GW of private generating capacity now underconstruction in Thailand becomes commercial-
Thailand's national utility, the Electricity Gener- ized, private power will account for about 10 to
ating Authority of Thailand (EGAT), has been 15 percent of the country's electricity.partly insulated from currency exchange risksbecause, with the exception of purchases from The four countries differ in the timing of their
a private power project in the Lao People's private purchases. Malaysia and the Philippines

8 The East Asian Financial Crisis-Fallout for Private Power Projects
began their private power programs early and Wholesale and retail tariffsnow account for about 80 percent of the com-mercial private power capacity in operation in A rational system of wholesale IPP tariffs andthe four countries. The financial crisis is likely retail consumer tariffs is a prerequisite for ato have a large impact on electricity costs in successful private power program. Wholesalethe Philippines, which must make dollar pay- power costs should on average be about two-ments to several operating IPPs. But in both thirds of retail rates, which must also coverMalaysia and the Philippines relatively little new nongeneration costs (such as transmission,private power is expected to be commercial distribution, administration, and customer ser-by 2001. The fact that relatively little new pri- vice). Wholesale IPP tariffs in Malaysia andvate capacity is coming on line, along with the Thailand range from 3¢ to 4¢ per kilowatt-hoursubstantial payments for private power made (kWh), while retail tariffs are substantiallybefore the crisis, will help mitigate the short- greater, suggesting that utilities in these coun-term impact of the crisis in these two countries. tries have adequate margins to pay nongener-The longer-term impact of the crisis will de- ation expenses.pend on the cost and timing of developmentafter 2001. Currently, the Philippines plans to The relationship between retail and wholesalecommercialize substantial gas and hydroelectric power tariffs in Indonesia and the Philippinescapacity starting in about 2002. implies a less stable financial situation. Whole-
sale power tariffs in the Philippines are rela-The crisis will have the largest impact in Indo- tively high, and retail rates may not be sufficientnesia, which accounts for nearly half the new to cover the cost of operations by the nationalIPP capacity due to begin operation in these power utility, Napocor. The increase in inter-countries in 1998-2001. In all, more than 9,000 est costs on foreign debt and in fuel and othermegawatts (MW) of capacity is under construc- costs in the wake of the crisis has further erodedtion or at an advanced stage of development Napocor's financial position. Rates should risein Indonesia (figure 2). substantially as a result of automatic tariff ad-
FIGURE 2 CUMULATIVE DEVELOPMENT OF PRIVATE POWERCAPACITY, 1991-2001
Megawatts12,000
10,000 Indonesia
8,000Philippines/
6,000
4,000 Malaysia
2,000 d
1991 1992 1993 1994 1995 1996 1997 1998' 1999' 2000' 2001'
a. Projected.Source: Hagler Bailly IIP Knowledge Base.

The World Bank Group 9
justments and will need to rise even more ifNapocor is to cover its costs.
TABLE2 EFFECT OF THE CRISIS ON EXPECTED NEWIn Indonesia Perusahaan Listrik Negara's (PLN) GREENFIELD PROJECT DEVELOPMENT, 1998-2001financial situation appears even more critical. GigawaftsEven before the crisis retail tariffs appearedinadequate relative to costs. While wholesale ,
tariffs for private power ranged from 5.4q to8.5¢ per kWh, retail tariffs were just over 7¢ Precrisisper kWh, implying that margins were inad- Country projectionsequate to pay for nongeneration expenses.When the rupiah fell from roughly 2,500 per Indonesia 7.3 3.8 4.0U.S. dollar to more than 10,000, PLN's position Malaysia IA 0.1 0.5deteriorated. Even with price hikes in March Philippines 3.6 2.8 3.3and May 1998 totaling more than 30 percent, Thailand 3.8 0.2 2.0retail tariffs remained below 3¢ per kWh. Toal 18 0.2 9.0
Total 16.1 6.9 9.8Some of the region's utilities will need massivecash infusions from either government trans- Soce:Hegler8aillyPKnowledgeBase.
fers or privatization to meet their debt obliga-tions. As a rcsult, their ratings by internationalcredit agencies have been downgraded, and an interest in reviewing agreements that maysome are now considered technically bankrupt. lead to an unsustainable situation. Many factors
affect the sustainability of IPP programs, includ-Threats of contract defaults and ing (as outlined below) the appropriateness ofrenegotiations government support for private projects, the use
of competitive procurement procedures forThe public utilities' worsening situation has in- projects, and the need for power. Analysis ofcreased pressures to renegotiate contracts. Sev- such factors in the four countries predicts sus-eral planned projects with signed PPAs have been tained government commitment to privatereviewed or postponed. Governments have also projects in most countries. But it also points tosought to modify contracts for projects already a high risk of breach of contract by the govern-in operation. Indonesia, the most heavily exposed ment or public utilities in some cases.country, hias called on project sponsors to lowerpower prices and has tried to negotiate lower Government risk sharingpurchase obligations. In February 1998 PLN issuedletters to three IPPs unilaterally setting an ex- Governments have assumed some risk forchange rate for its payments to the private projects private power projects in all four countries.of 2,450 rupiah per dollar (the rupiah was then Such support may take the form of govern-trading below 8,450), in violation of the existing ment guarantees backstopping the obligationsPPAs. PLN later backed away from this position, of the power purchasing utilities or financialpromising eventual full payment in dollars. But participation in the projects. While direct sup-international rating agencies have assessed an port to projects can serve as an indicator ofincreased risk of default for several projects. government commitment, excessive liabilities
that are likely to come due when governmentsRenegotiating or defaulting on contracts can be can least afford them (such as during a finan-costly to governments as well as to sponsors cial crisis) can undermine the sustainability ofand investors. Countries that have breached con- private investment programs, leading to defaulttracts will deter investors. But all parties have and renegotiation.

10 The East Asian Financial Crisis-Fallout for Private Power Projects
In Malaysia and Thailand the central govern- ters of comfort" in which it agreed to supportments have assumed some risk, but have the discharge of PLN's responsibilities. Thesegranted no guarantees or other direct official letters do not amount to a guarantee, however.forms of support. They have provided no spe- Project sponsors assumed some fuel supply andcial foreign exchange protections for private other risks.power projects beyond those granted to allforeign investors. Government fuel suppliers Competitive biddinghave provided similar levels of security toprojects as would be provided under commer- Recent experiences such as Enron's Dabholcial fuel supply contracts. In manv projects project in India have shown that governmentsgovernments have assumed risks mainly by pro- may face pressure to renegotiate projects thatviding loans through government pension have not had to undergo the scrutiny of a for-funds, state banks, or other public sources of mal competitive bidding process. Both Malay-funds, thus assuming similar commercial risk sia and Thailand procured new generationas other lenders. using competitive bidding-one reason for the
lower wholesale tariffs in these two countries-In contrast, the government of the Philippines while most IPP projects in Indonesia and manyassumed fairly substantial risks through sover- of the early projects in the Philippines wereeign guarantees, including all fuel supply, in- concluded through direct negotiation withflation, and foreign exchange risks.' Its project sponsors. The Philippines has sincewillingness to assume these risks was impor- adopted international competitive bidding totant to the successful financing of several early increase transparency and lower costs.projects. Now that the market is fairly mature,the Philippines has recently reduced the guar- Need for powerantees offered to new projects, and some arebeing financed with no sovereign guarantees. The primary motivation in seeking private powerThe Indonesian government assumed fewer was the dire need for more generation capac-risks for projects, but it granted projects "let- ity. Widespread power shortages and blackouts
TABLE 3 FACTORS AFFECTING THE SUSTAINABILITY OF CURRENT PRIVATE POWER PROGRAMS
|~~~~~~~~~~ I .I * i .1 I1L *: .1L . :l "
Indonesia C 0 0 0/c
Malaysia Q/ C &
Philippines * I
Thailand 0 * t °/#i
Q Low t\Low to medium )Medium to high High

The World Bank Group 11
are a costly drag on private investment and eco- most equipment and construction costs are innomic growth. As long as this need persists, it hard currency.creates powerful incentives for governments toremain committed to private power projects. Implications for private power policy
There is a long-term need for power in all four While no one could easily have predicted thecountries. While there is currently excess capa- dimensions of the crisis or have designed acity in the Philippines and Thailand, future de- power policy to protect projects from the eco-mand growth should eliminate these surpluses nomic shocks, analysis of the effects offers les-and create a need for new projects. The future sons for Asia and the rest of the developingbalance of supply and demand depends on the world. Countries such as Malaysia and Thailandpace of new capacity additions. Excess capac- have adopted power policies that appear to haveity is expected to materialize in parts of the In- left them less exposed than other countries (tabledonesian power system as large plants now 3). Price reform, domestic financing, competi-under construction become operational. Exces- tive bidding, and appropriate government sup-sive surpluses could lead to pressures to break port mechanisms mitigate the effects of the crisisagreements on new projects. Thailand has taken on the cost of power and the sustainability ofsteps to avoid surpluses by delaying power investment programs. The timing of project de-projects for two years. velopment also appears to be a major factor in
the severity with which the crisis has affectedA shrinking market for private power regional power programs.
The economic slowdown and the higher prices The Philippines and Thailand are pushing aheadfor many basic goods have reduced demand with plans to privatize their national utility com-for electricity, restricting future private power panies, despite the more difficult environmentopportunities. It is estimated that total new for privatization in the wake of the crisis. Butprivate power development in the region could unlike many countries in Latin America, no Asianfall from around 16 GW to less than 7 over the countries have yet undertaken fundamentalperiod 1998-2001 (table 2). In Indonesia alone restructuring and privatization of their powernew private power development could decline sectors to reduce the burden of public sectorby 3.5 GW, and near-term markets for new liabilities and put the whole power industry onprojects in Malaysia and Thailand could all but a more sustainable footing.disappear. In the Philippines the crisis is ex-pected to have a modest impact on new project The market for private power in Asia appearscommercialization through 2001. both smaller and more fraught with uncertainty
than before the crisis. In this new environmentThe financial crisis has stalled many new con- investors will scrutinize projects more closely,struction projects, both public and private, as and governments will need to manage powerthe construction costs have soared in local cur- programs judiciously to continue to attractrency terms. PLN has canceled sixteen IPP investment. They need to strike a balance inprojects, many of which had signed contracts. providing support to the industry, shoring upPlans for a 1,000-MW private power project in private projects in the near term while avoid-Malaysia have reportedly been shelved because ing burdensome, open-ended commitmentsthe drop in the exchange rate increased the that could hamper the longer-term prospectsproject's prospective costs by more than 1 for reform.billion ringgits (about US$260 million). Depre-ciation poses a greater challenge to countriesstil in th eal hsso p eeomn This text wvas finalized in late June.still in the early phases of IPP development, l InternationalMonetaryFund, WordEconomicOiutlook(Washington,
when construction risks are important, since D.C., May 1998).

2 Power off-takers accept fuel risks in most projects with power pur-
chase agreements. Banks generally helieve that power off-takers
are hetter ahle to take these risks than other project participants
hecause of their ahility to pass fuel price increases along to
consumers. See Suman Bahhao and John Schuster. "Power ProjectFinance: Experience in Developinig Countries' (RMC Discussion
Paper 119, World Bank, Resource Mohilization and CofinancingVice Presidency, Washington, D.C., 1998).
See Suand n Babhar and John Schuster, 'Poer Project Finance: Ex-perience in Developing Countries" (RMNC Discussion Paper 119.
WVorld Bank. Resource Mohilization and Cofinanci~ng Vice Presi-
dency. Washington, D.C., 1998).See David Baughman and Manhew Buresch, "Mohilizing Private
Capital for the Power Sector: Experience in Asia and LUtin America"(U.S. Agency for Initernational Developmenit and World Bank, W8a.sh-
ington, D.C., 1994).
R. David Gray ([email protected] consult-
ant, Private Sector Development Department,and jobn Schutster ()[email protected]),manager, Hag/er Bailly Consulting

13
Contingent Liabilities for Infrastructure ProjectsImplementing a risk management framework for governments
Cbristopher M. Leuis anid Ashoka Mody
To manage their exposure arising from guarantees to infrastructure projects, governments need
to adopt modern risk management techniques. Because guarantees come due only if particular
events occur and involve no immediate cost to the government, they rarely appear in the
government accounts or have funds budgeted to cover them. This Note introduces an integrated
risk management system that draws on recent advances in the private sector. The system,
adapted for use in the public sector, enables governments to budget for expected losses and to
set aside reserves against unexpected losses, thus avoiding the budgetary stress associated with
redirecting scarce public resources to cover a sudden increase in costs.
Over the past several years many large multi- * Assessing the government's tolerance fornational firms, including Bankers Trust, Chase bearing risk.Manhattan, and Microsoft, have implemented * Using the government's risk tolerance as aenterprisewide systems for risk management. basis for establishing policies and proceduresFor each risk identified as important, these firms for structuring reserves against unexpecteddetermine the best approach for improving their losses.management of exposure, whether by insur- * Implementing risk mitigation and controling, transferring, mitigating, or retaining the mechanisms to prevent unintended losses onrisk. The goal is not just to hedge a fixed set of those risks and establishing systems to contin-risk exposures, but to determine the areas and ually monitor and reassess the government'slines of business in which a company is will- risk exposure over time (see page 17).ing to retain risks in order to generate targetreturns. As in the private sector, these steps should be
applied to four general categories of risk:Adapted to the public sector environment- financial, operational, business, and event risk.and customized to reflect the government'sbudgetary and regulatory processes, the legis- Measuring risklative and legal environments, and the risksbeing evaluated-this approach can be used A government's exposure to loss can arise fromto manage a government's exposure to risk, a wide variety of events, and attempting to ac-particularly contingent liability risk. The model count for every source of exposure is not fea-involves six main steps: sible. A better approach, and that followed in* Identifying the government's risk exposures. the private sector model, is to first examine gen-* Measuring or quantifying expected and unex- eral categories of risk and then focus on the
pected exposures. areas of highest risk (see figure 1 for a lattice of* Provisioning for expected costs in the bud- generic risks). The next step is to value the ex-
getary process. pected and unexpected losses (see box 1 for a

14 Contingent Liabilities for Infrastructure Projects
FIGURE 1 RISK IDENTIFICATION LATTICE
C:~~~~~~~~~~~~~~~~~~~~~~k
definition of expected and unexpected losses). on a present value basis, most government bod-The valuation techniques used will depend on ies account for credit and insurance productsthe type of risk being analyzed and the data using a simple cash-based system of budgeting.available. Actuarial and econometric models can Cash-based budgeting misrepresents and masksbe used to estimate exposures, but both tech- the aggregate exposure associated with loanniques require substantial data on the perfor- guarantees and government insurance programsmance of a program (or on a comparable and creates perverse incentives for selecting oneprogram). For project finance, where deals are form of financing assistance over another.' Byunique and data records often missing or of low failing to align the budgetary impact of directquality, more advanced modeling approaches loans, loan guarantees, insurance, and grant pro-are required. The most powerful are those com- grams with their true economic costs at the timemonly used to value options in financial mar- commitments are made, a simple cash budgetkets; these can be applied to value direct loans, creates an intertemporal myopia, moral hazard,loan guarantees, and insurance contracts granted or both. Only by enforcing budgetary controlsto support infrastructure liabilities. at the time the financial assistance is committed
can the budgetary incentives be realigned toBudgeting for expected costs-the eliminate this effect.accounting challenge
Many governments face significant legal, regula-Armed with a measure of risk exposure for tory, and political hurdles in moving fromexpected costs, a government can use the infor- current budgetary practices to a full account-mation as a budgetary control mechanism and ing of the risks of contingent liabilities. Oftenwork out how to improve the budgetary process governments prefer incremental changes or in-to provide stronger incentives for risk man- terim steps to smooth the transition. Implement-agement. The government could publish its risk ing risk-adjusted performance measures allowsexposure in the national budget, use it to estab- governments to manage their exposures to con-lish exposure limits or credit limits, or use it to tingent liabilities even if an immediate change
develop risk-adjusted performance measures. in national budgetary policy is not feasible.(Such measures could be applied to reward pro- Nonbudgetary control mechanisms for contin-grams that deliver social benefits with the least gent liabilities (publishing information, estab-risk to the public budget.) lishing credit quotas or exposure limits, and
earmarking future funds to cover guaranteeThe nmain impediment to implementing these costs) also could be used during a transition tooptions is the cash budget accounting system a new budgetary system. And they could beused by most governments. While private insti- used on a permanent basis for liabilitiestutions compute virtually all investment deci- grandfathered during a change in budgetarysions, expenditures, plans, and budget forecasts policy or as a permanent management solu-

The World Bank Group 15
BOX 1 DEFINING EXPECTED AND UNEXPECTED LOSSES
Consider a government loan guarantee program Probability Exposurecharacterized by the following very simple (percent) (millions of U.S. dollars)probability distribution. While the expected 5 0costs of the program (the mean of the distribu- 5 2tion) are US$10. losses will exceed this 15 5expectation 35 percent of the time. That means 15 8that if the government sets reserves only to cover -expected losses, it will have to request 15 12additional funds in 35 percent of all possible 5 14outcomes of the guarantee. For a portfolio of 5 16thirty similar programs and with five-year 5 18guarantees, the central government would 2.5 20have to go to the legislature tNice a year for 2.5 30additional funds.
tion if the government fails to enact a change how often the executive wants to go to the legis-in the budget law. lature for funds. Once the proper valuation tools
are in place, the government can set reserveReserving for unexpected costs policy based on an assessment of its aversion to
making frequent funding requests. The govern-In addition to budgeting for the full expected ment's leverage considerations will also be dif-present value of costs, governments need to set ferent from those in the private sector. Holdingaside reserves against unexpected losses. For a more funds in reserve increases the liquidity ofprivate firm with multiple lines of business, de- the guarantees that the reserve supports, increas-termining the appropriate level of capital or re- ing their value and allowing the government toserves is a complex procedure that takes into leverage more private funding in the guaranteeaccount both the variability of losses for each program. But reserving funds in a separate ac-product line and the correlation between prod- count reduces the money available for other pub-uct returns and the opportunity cost of capital. lic sector projects and services. If the net benefits
of additional public spending exceed the liquid-A private firn must also weigh the expecta- ity benefits of adding to the guarantee reserve,tions of shareholders and stakeholders, rating the government may want to direct additionalagencies, and business partners in determining funds toward public spending.2
the optimal level of capital. The capital or re-serves held by an enterprise reflect its relative Setting reservesrisk aversion and its ability to withstand a spe-cific level of unexpected losses. Thus a firm Having assessed which risks and what level ofseeking a AAA rating will hold considerably loss it is willing to bear, the government can set itsmore capital against unexpected losses (say, reserves against unexpected losses ("risk capital")capital to cover a 99 percentile event over a in its credit and insurance programs. But first itone-year period) than a firm seeking an A rat- needs to determine whether reserves will be seting (capital to cover a 90 percentile event). based on the additive unexpected loss exposure
of each guarantee or on a portfolio value-at-riskSimilar pressures come into play in assessing approach to account for portfolio diversifica-government tolerance for risk. But the assess- tion, what the investment policy of the reservesment must also consider the unique question of will be, and where the reserves should reside.

16 Contingent Liabilities for Infrastructure Projects
Under an additive reserve standard the govern- ing the reserve offshore to circumvent convert-ment calculates the unexpected loss exposure ibility risk issues. This strategy would greatlyof each of its contingent liabilities indepen- enhance the market value of the guarantees anddently (that is, examines the sensitivity of each provide the government with greater leverageguarantee valuation to changes in the underly- from the guarantee program. However, decisionsing factors). Then, for a given confidence level on the location of the reserves must be made inand time interval, it determines the amount of the context of the government's broader for-unexpected loss it wishes to cover for each eign currency risk management program.guarantee, taking into consideration the op-portunity cost of capital. It then identifies the Next stepaverage cash reserve required to fund theseunexpected losses. Finally, it aggregates the in- This approach to risk management provides adividual cash reserve balances to arrive at a mechanism for governments to critically assesstotal unexpected loss reserve. the distribution of risks within a loan guaran-
tee or insurance program and come up withThe problem with the additive approach is that better designed contracts and fewer and smallerit fails to account for portfolio diversification- calls on guarantees. And as risks change overthe fact that pooling imperfectly correlated risks time, the framework provides a basis for easywill reduce the variance in the expected loss reestimation and quick adjustments to the bud-of a portfolio. As a result the risk of the overall getary and reserve system. A companion Noteportfolio will be overstated, and more protec- on page 17 shows how.tion against unexpected losses provided thanoriginally sought by the government. The al- This Note is based on a longer paper by the authors in Timothy Irwin,
ternative is to calculate the aggregate loss dis- Michael Klein, Guillermo E. Perry. and Mateen Thobani, eds., Dealing
tribution of the government's portfolio of risks, with Public Risk in Pr-ivate Infrastructure (Latin American and Carih-using a value-at-risk approach that incorporates bean Studies. Washington, D.C.: World Bank, 1998).
1 To see how these incentives skew decisionmaking, consider the
cross-correlations between guarantee expo- different ways in which a government could help finance a US$100
sures, and then set reserves to cover unex- loan to a private infrastructure provider If the govemnient pro-
pected losses based on the unexpected loss vides a 10 percent loan subsidv, the cash budget cost would heUS$10 in year one. If it prtovides the loan directly, the cash budget
profile of the entire portfolio. cost in year one would be US$100-the full face value of the loan.
And if it agrees to guarantee a loan by a private bank, the budget-
Investing reserves ary cost would be zero (or negative if a guarantee fee is collected)in the first year. Thus while the economic and financial values of
the three form.s of financial assistance are equal, a legislative hody
The objective in investing the reserve funds would favor the guarantee option.
should be to maximize the value of the assets 2 When a private company assesses the tradeoff between holdingreserves and investing in oUtier programis, it USoially has a targetedwhen the costs to the government increase- economic return that helps guide its capital policy. For a govern-
that is, to invest the reserve funids in assets that ment the comparable concept is social return. Calculating socialreturn requires a comnplete asset-liability management program that
provide the best hedge against the government'sgoes beyondJ the valuation of infra.strucmure liabilities or other forms
cost for a given return. In doing this, the gov- of direct loan.s, loan guarantees, and insurance. This Note focuses
ernment may achieve better results by manag- on reserving against contingent liabilities without considering a
ing its assets and liabilities at the balance sheet broader asset-liability management policy.
level rather than on a program basis.ChristopherM. Lewis, Ernst &9 Young, and
The government also needs to decide whether Ashoka Mody ([email protected]), Projectto hold its reserves offshore, in a foreign cur- Finance and Guarantees Departmentrency, or domestically, in the domestic currency.If the guarantees are denominated in dollars,the government should consider investing thereserve fund in dollar assets and possibly keep-

17
Risk Management Systems for ContingentInfrastructure LiabilitiesApplications to improve contract design and monitoring
Christopher M. Lewis and Asboka Mody
Government guarantees for private infrastructure projects represent real liabilities, and their
costs can average as much as a third of the amount guaranteed. Most governments do not know
the full extent of these liabilities, because they have made no attempt to systematically estimate
them. A companion Note proposes a new framework for identifying government exposures,
valuing expected and unexpected risks, and budgeting for expected risks and reserving for
unexpected ones. This Note shows how governments can use the valuation process to analyze
the distribution of risks, decide which risks they should bear and which should be borne by the
private sector, and reduce the frequency and size of calls on guarantees.
In what may be the first time that a sophisti- the government assessed a number of risk ex-cated contingent valuation method was applied posures: market risk (relating to market volumesto government infrastructure projects, the World and prices), construction risk (from cost andBank and the Colombian government collabo- schedule overruns), counterparty risk (opera-rated to estimate the government's exposure tions risk and risk of failure of participatingin three infrastructure finance projects: companies), currency risk (relating to exchange* The US$20 million El Cortijo-El Vino toll road rates and liquidity), force majeure, termination
project, where the government guarantees risk (risk of contract buyout, possibly includ-construction costs and traffic volumes. ing penalties), and regulatory risk (the risk of
* A joint venture telecommunications project adverse regulatory changes).between Telecom S.A. and Siemens, whereSiemens will supply switching equipment and The assessment for the El Cortijo-El Vino tollcables for more than 80,000 new lines and road project showed that the greatest exposuresthe government guarantees annual minimum for the government are from the market riskcash returns to Siemens in the period after associated with traffic volatility and the risk ofconstruction. construction cost overruns. The total expected
• A US$755 million privately sponsored power loss to the government under these two guar-project to supply a government-owned dis- antees was estimated at about US$4.2 milliontribution company, where the government (table 1). The assessment of the telecommuni-provides guarantees for the power purchase cations project identified regulatory and marketagreement (box 1). risk and construction risk as the largest risks.
Regulatory and market risk exposure-stemmingThe valuation of the government's exposure from Colombia's deregulation of telecommuni-in these three projects used a technique called cations, which ended the monopoly held bystochastic simulation to identify the net ex- Telecom S.A.-was estimated at US$10 million.pected loss. In keeping with the lattice of risks Construction risk was estimated at US$9.8 mil-outlined in a companion Note (see page 14), lion, but whether this risk is borne by Telecom
18 Risk Management Systems for Contingent Infrastructure Liabilities
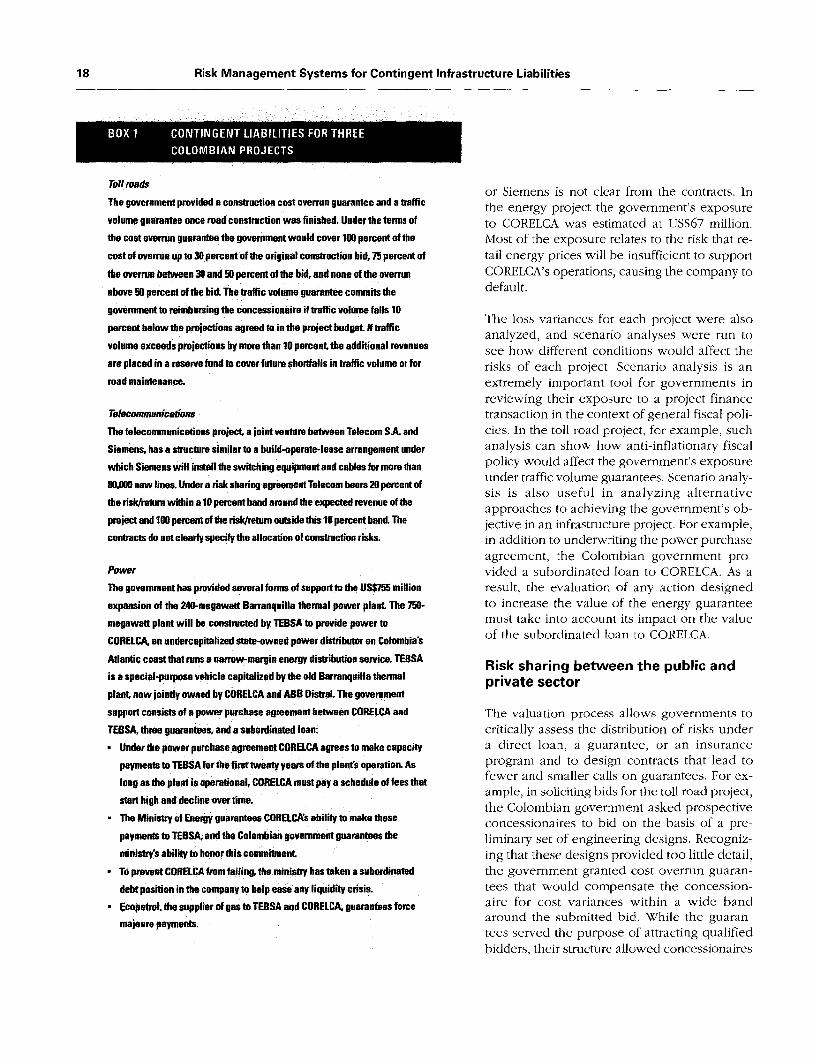
Tollroadsor Siemens is not clear from the contracts. In
The government provided a construction cost overrun guarantee and a traffic the energy project the government's exposure
volume guarantee once road construction was finished. Underthe terms of to CORELCA was estimated at US$67 million.
the cost overrun guarantee the government would cover 10) percent of the Most of the exposure relates to the risk that re-
costof overrun up to 30percent of the original construction bid, 75 percent of tail energy prices will be insufficient to support
the overrun between 31 and 50 percent of the bid, and none of the overrun CORELCA's operations, causing the company to
above 50 percent of the bid. The traffic volume guarantee commits the default.
government to reimbursing the concessionaire if traffic volume falls 10The loss variances for each project were also
percent below the projections agreed to in the project budgiet. H traffic analyzed, and scenario analyses were run tovolume exceeds projections by more than 10 percent the additional revenues see how different conditions would affect the
areplacedinareservefundtocoverfutureshortfallsintrafficvolumeorfor risks of each project, Scenario analysis is an
road maintenance. extremely important tool for governments in
reviewing their exposure to a project financeTelecommunications transaction in the context of general fiscal poli-Thetelecommunicationsproject,a jointventurebetweenTelecomS.A.and cies. In the toll road project, for example, such
Siemens, hasastructure similartoabuild-operate-lease arrangement under analysis can show how anti-inflationary fiscal
which Siemens wiW install the switching equipmentand cables for more than policy would affect the government's exposure
MM Dnew lines. Under a risk sharing agreement Telecom beers 20 percent of under traffic volume guarantees. Scenario analy-therisk/retumwina10pent band around the expected revenue of the sis is also useful in analyzing alternative
approaches to achieving the government's ob-projectand 10[percentoftherisk/retumoutsidethis 1perentband.The jective in an infrastructure project. For example,
contracts do not clearly specifythe allocation of construction risks. in addition to underwriting the power purchase
agreement, the Colombian government pro-Power vided a subordinated loan to CORELCA. As aThe government has provided several forms of supportto the US$755 million result, the evaluation of any action designed
expansion of the 240-megawatt Barranqeilla thermal power plant The 75- to increase the value of the energy guarantee
megawatt plant will be constructed by TEBSA to provide power to must take into account its impact on the value
CORELCA, an undercapiftalized state-owned power distributor on Colombia's of the subordinated loan to CORELCA.
Atlantic coast that runs a narrow-margin energy distribution serice. TEBSA Risk sharing between the public andis a special-purpose vehicle capitalized bythe old Barranquilia thermal private sectorplant now jointly owned by CODRELCA and ABB Distral. The government
support consists of a power purchase agreement between CORELCA and The valuation process allows governments to
TEBSA, three guarantees, and a subordinated loan: critically assess the distribution of risks under
* UnderthepowerpurchaseagreementCORELCAagreesto makecapacity a direct loan, a guarantee, or an insurance
paymentstoTEBSAforthefirsttwentyearsoftfheplantsoperation.As program and to design contracts that lead to
long as the plant is eperational, CORELCA must pay a schedule of fees that fewer and smaller calls on guarantees. For ex-
start high and decline overtime. ample, in soliciting bids for the toll road project,the Colombian government asked prospective
* The Ministry of Energy guarantees CEAs ability to make these concessionaires to bid on the basis of a pre-
paymentstoTEBSA,andtheColosmbiangovernmentguaranteesthe liminary set of engineering designs. Recogniz-
ministysabilitytohonorthiscommibment ing that these designs provided too little detail,
* To prevent CORELCA from failing, the ministy has taken a subordinated the government granted cost overrun guaran-
debtpositioninthecompanyto helpeaseanyliquiditycrisis. tees that would compensate the concession-
* EcopetroL thesupplierofgastoTEBSAandCORELCA.guaranteesforce aire for cost variances within a wide bandmajeure payments. around the submitted bid. While the guaran-
tees served the purpose of attracting qualifiedbidders, their structure allowed concessionaires

The World Bank Group 19
TABLE I EXPECTED GOVERNMENT LOSSES IN COLOMBIAN INFRASTRUCTURE PROJECTSMillions of U.S. dollars
El Corti jo-El Vino Telecom S.A.-Siemens CORELCAType of risk toll road project joint venture energy guarantees
Market 3.1 2.5 52.0Construction 1.1 9.8' 0
Counterpartv 03 0.1 5sCurrency 0 -1.3 20Force majeure 02 0.3 7.0
Termination -02 02 1.0Regulatory 0 101 0Total 4.5 213 67.0
a. t is unclear from the conracts whether thi risk is borne by Tetecom or Siemens.Source:Timothy Irwin, Michael Klein uillermo E Perry, ansd Mateen Thbani, edse. Dealing with PrWic Risk in Prtvsfe lnfrastnuture(Ltin American and Caribbean Studies. Washingtn, O.C.: World Sa. 199I).
to extract a near-certain rent from the govern- effectively monitor and control the risks orment of about 35 percent of the original bid. whether a private servicer should be employed
to service the loans. Where the governmentAfter assessing the risk transfer associated with delegates servicing, it must have systems forthe toll road project and quantifying the risks in monitoring the performance of the servicers.the project, the government changed its toll roadguarantee program. It now commissions more Even if the government has the best access todetailed engineering studies before it solicits bids information on a risk, it might choose to provideto limit the uncertainty in the bidding process, assistance through a guarantee targeted at a spe-and provides a narrow guarantee. The new cific layer rather than through direct credit. Thepolicy is less expensive than the old one but reason is that a contingent guarantee can beprovides the same benefit to the concession- more narrowly focused on the market failure,aires. The change made the Colombian toll road as in the switch from providing a broad guar-program more efficient-achieving a higher risk- antee to funding engineering reports in theadjusted rate of return by reducing the govern- Colombian toll road concessions. Because guar-ment's risk of delivering a fixed benefit. antees and insurance can be narrowly targeted,
they can be used to get the private sector toThe valuation process enables a government absorb as much risk as possible.to assess how efficiently risks have been allo-cated and derive lessons from its findings. To Where the private sector is better able to under-do this the government must first assess which write and service the underlying risks but someparty (public or private) has the best access to government assistance is needed, public-privatethe information needed to objectively and most risk sharing is often the best solution. In thisaccurately evaluate the underlying risks. It must case pro rata guarantees and insurance underthen assess which party is in the best position which the private sector and the governmentto monitor, control, and service the risks once share all losses on a risk equally are often thethey are underwritten. If the government is in best form of assistance. Risk sharing gives thethe best position to underwrite the risks di- private entity an incentive to price the cover-rectly, it should consider providing direct credit, age appropriately, ensuring that it will not shifttargeting the credit to the area of concern. The additional risks to the government. Other riskgovernment should then determine whether it sharing mechanisms within and between classesalso has the information and skills to most of risk are also feasible. But they usually require

20 Risk Management Systems for Contingent Infrastructure Liabilities
more government oversight and more govern- anteed party, to ensure that their value is unim-ment underwriting expertise. paired during periods in which a loss event is
likely. They can structure their support to pro-Managing federal-state partnerships mote pro rata risk sharing, where a private party
shares risk equally with the government for someRisk management tools and techniques are also or all types of loss. Since the private party inhelpful in analyzing the structure of government this transaction would then bear the same riskprograms that share responsibilities between the per dollar of exposure as the government, thefederal and state levels. Such programs can government can benefit from the private sector'scombine the national government's ability to pricing of risks. Finally, governments can levyredistribute resources across economically risk-based guarantee fees that both reduce thediverse regions with the ability of state and lo- budgetary cost of issuing guarantees and im-cal governments to identify investment needs prove the alignment of incentives between theat the local level. The national government funds guaranteed party and the central government.the program, while state and local governmentsprovide the underwriting and administrative Conclusionfunction. A potentially powerful combination,this type of federal-state partnership is analo- Allocating risks efficiently and limiting the abil-gous to a parent company's providing a guar- ity of private agents to shift additional losses toanteed source of financing to a subsidiary the government reduces the budgetary costs ofestablished to perform a particular service. issuing guarantees and improves the allocation
of scarce budgetary resources. But techniquesSuch federal-state partnerships are not without for assessing risk are only as good as the infor-risks, however. If the federal government does mation on which the models are based, and overnot retain oversight of the underwriting func- time institutions change, markets evolve, andtion, the national budget remains at risk. But if new information on risk exposures emerges. Ait is overly prescriptive in setting regulations series of loss events can reveal risks that werefor the program, it reduces the flexibility of previously unknown or unquantifiable, leadingthe state and local governments to identify to radical changes in risk assessment. Using theneeds in the local community. The goal is to risk management framework outlined in this andreach the optimal tradeoff between delegation a companion Note, governments can quicklyof project selection and federal oversight of incorporate new information on risk exposuresstate underwriting performance. into their pricing of new contingent liabilities
and reestimate the expected costs of previouslyMinimizing the loss shifting issued liabilities.
need to implement strong risk This Note is based on a longer paper by the autbors in Timnotby Irwin,Governments need to implement strong risk Miha Klein, uilleo E. Perry, and MateenThiobani, eds., Dealing
management programs to limit their contingent with Public Risk in Private Infrastructure (Latin American and Carib-
liability exposure to additional loss shifting by bean Studies, Washington, D.C.: World Banrk, 1998).
the guaranteed party. The valuation processprovides a basis for determining the best strat- ChristopherM. Lewis, Ernst& Young, andegy for limiting such exposure. Governments Ashokla Mody ([email protected]), Projectcan require the guaranteed party to hold a cer- Finance and Guarantees Departmenttain amount of capital or collateral to serve as afirst-loss protection barrier for the project,thereby aligning the guaranteed party's incen-tives to remain vested in the project with thegovernment. They can place restrictions on theuse and investment of reserves held by the guar-

21
Financing Water and Sanitation Projects-The Unique RisksDavid Haarmeyer and Ashoka Mody
A project finance structure allows water projects with attractive cash flows and risk profiles to
secure long-term private capital. This structure provides a direct link between a project's cash
flow and its funding to give project sponsors, investors, and lenders strong incentives to ensure
that projects are structured and operated to generate stable revenue streams. But even in
industrial countries the credit strength of off-taking municipal governments and the sector's
traditional monopoly structure expose lenders to potentially significant credit, regulatory, and
political risks. These risks, combined with the sunk, highly specific, and non-redeployable nature
of water investments, mean that lenders and investors are vulnerable to government
opportunism and expropriation. Reviewing some recent innovative projects, this Note shows
that private participation on a limited recourse or nonrecourse basis has required support from
multilaterals and federal government agencies to absorb noncommercial risks.
Private sector participation in water and sani- tures. As one of the last monopoly utility sec-tation has most often taken the form of special- tors, water and sanitation can be especiallypurpose build-operate-transfer (BOT) projects attractive to long-term private investors. Butfollowing the project finance or limited recourse financing water and sanitation projects hasmodel. These are self-contained projects that been a special challenge because of theiraddress the need for more water and sanita- unique risks:tion. Although these bulk suppliers can allevi- Expensive to transport but cheap to store,ate immediate shortages, they have virtually water is essentially a local service and sub-no effect on systemwide revenue problems (for ject to control by local government, whichexample, leakage and tax collection) or labor can be more politicized and have weakercost problems. These long-term problems are credit than state or federal government.sometimes tackled incrementally through leases * With most of the assets underground, theirand management contracts. An increasing num- condition is hard to assess. That makes invest-ber of countries have gone further by award- ment planning difficult, posing risks for con-ing operating concessions for entire systems, tract renegotiations.which require investment commitments from - Inadequate provision is associated withthe concessionaire. Beyond such concessions health and environmental risks, so govern-lies full privatization of assets, which facilitates ment has a strong interest in extending ac-financing by creating collateral. cess to service, regardless of ability to pay.
* Significant currency risk arises because cus-The promise of steady-if not growing-long- tomers pay in domestic currency that doesterm future cash flows is the basis of the not match the currency of international debtprivate sector's interest in financing these ven- and equity financing.

22 Financing Water and Sanitation Projects-The Unique Risks
* There has so far been little scope to intro- entity in a BOT or BOO project. For the BOT induce direct competition in treatment, trans- Chihuahua, Mexico, for example, Banobras, themission, and distribution. domestic development bank, provided credit
support to the local government entity. In IzmitThe risk profile of a project is also influenced the Turkish government stands behind the lo-by its type and by its stage of development. cal government's water purchase agreement. InGreenfield projects with a build-operate-transfer Sydney the state government guarantees the pay-or build-own-operate (BOO) structure, because ment of the city water utility (Sydney Waterthey involve a period of construction before rev- Corp.) to the private project company evenenues are generated, generally expose lenders though the utility's debt is rated AAA by Stan-to greater credit, political, and regulatory risks dard & Poor's. In Buenos Aires the Argentinethan concessions for infrastructure services that government's guarantee to pay compensation ifare up and running. Similarly, older and more the concession is terminated early provides theefficiently run systems with longer operating his- chief form of security for lenders.tories tend to have more secure and predictablecash flows and mature investment profiles, and Sources of debtthus expose lenders and investors to fewer risks.
In countries with weak sovereign credit rat-The water and sanitation sector's exposure to ings financing has been provided by multilat-risks that are often difficult and costly to cover eral and export credit agencies. These agencieshas two important ramifications: are generally in the best position to shoulder* Fewer projects have been successfully financed political and regulatory risk and thus provide
with private capital than in other infrastructure long-term finance at reasonable rates. The US$9sectors, such as power and telecornmunications. million Chase Manhattan Bank loan to the Chi-
* Projects financed with private capital have huahua BOT project, which received no multi-tended to involve direct financial or credit lateral or bilateral funding but did receive grantsupport from government or third parties and credit support from Banobras, is a rare casesuch as bilateral, multilateral, and export of commercial bank participation. In a similarcredit agencies. BOT project in Puerto Vallarta, Mexico, the In-
ternational Finance Corporation provided debtCase studies in finance finance backed by a revolving and irrevocable
letter of credit from Banobras.The experience of six water and sanitationprojects and one set of utilities in accessing In countries with high sovereign credit ratingsand structuring private finance illustrates the projects have been financed by domestic com-level of government or third-party support mercial bank loans. The BOT project in Johor,(table 1). All the projects follow the standard Malaysia, and the BOO project in Sydney, Aus-project finance structure except for the more tralia, were financecl by commercial debt. As amature English and Welsh water companies, result of the project structure (existing cash flows)which rely on corporate finance. and Malaysia's highly developed capital market
and relatively low interest rates, the Johor projectOnly the BOT project in Johor, Malaysia, was was financed entirely with local debt. The Sydneyfinanced on a nonrecourse basis with no spon- project had both local and offshore financing.sor or third-party support to cover risk of non-payment. All other projects were financed on a The limited capital market financing of waterlimited recourse basis. The recourse was gener- and sanitation indicates that individual inves-ally provided by payment guarantees to the par- tors are not in a position to accurately evaluateties off-taking the service (buying bulk water or and mitigate the risks. But as the experience ofwastewater services), such as a local government the English and Welsh water companies shows,

The World Bank Group 23
TABLE 1 FUNDING FOR SELECTED WATER AND SANITATION PROJECTS
Debt/ =i1TmlIwX
Project site, type, and date Project cost rating SoLurce and maturity of debt
Malaysia US$2A billion 75/25 A+ Government soft loans due to
Concession 11993) (about US$500 million severe tariff collection problems
in first 2 years)
Buenos Aires, Argentina US$4 billion 60/40 BB- 10-year IFC A-loan,
Concession (1993) (US$300 million 12-year IFC B-loan
in first 2 years) (recourse to Argentinegovemment in event of
early termination)
lkmit Turkey US$800 million 85/15 8 13-year export credit agency loans,
BOT (1995) 7-year MITI" loan,7-year commercial bank loan
(recourse to Turkish govemnent)
Chihuahua, Mexico US$17 million 53/15/32h BB 15-year commercial bank loan
ROT (1994) with limited recourse to Banobras
Johor, Malaysia US$284 million 50/N A+ 10-year project finance loan
BOT (1992) from Public Bank Bhd
(nonrecourse)
Sydney, Australia A$230 million 80/20 AAA 15-year commercial loans
800 (1993) (State govemment stands behind
Sydney Water Corp. payment)
England and Wales US$5.24 billion 25175 AAA Capital markets, corporate finance,
Full privatization (1989) European Investment Bank and
other sources
a. Ministry of International Trade and Industry of Japan.b. Debt/equity/grantSource: Haarmeyer and Mody 193.
projects can be expected to access capital mar- issue priced at just fifty-three basis points over
kets as their cash flows to support debt service U.K. Treasury gilts due November 2006. Stan-
become more stable and certain and indepen- dard & Poor's based its AA rating of the £150
dent regulatory agencies are established. million Eurobond on Anglian's "robust financialprofile and stable operating environment," which
The English and Welsh companies have drawn "should provide the company with a fair degree
on a variety of financing sources, including the of insulation from the impact of key regulatory
bond markets. Anglian Water, one of the ten and political risks going forward." The English
privatized water companies, reflects the low risk and Welsh companies have also taken advantage
profile of more mature water utilities. In 1990 of low-cost loans from the quasi-governmental
the company floated a twenty-four-year bond European Investment Bank.

24 Financing Water and Sanitation Projects-The Unique Risks
Equity financing lator, these returns are expected to fall asthe water companies become more estab-
Although debt is generally cheaper than equity, lished and capital expenditures decline.a long-term equity stake by the sponsor (whichis sometimes also the operator) ensures that To compensate for the greater country and po-management has a long-term interest in the litical risks, required returns in most develop-project and that cash flow growth leads to capi- ing country projects are likely to be significantlytal appreciation. Equity also reduces the debt higher and closer to those in other infrastruc-service burden on the cash flow, which can be ture sectors. For a sample of power projects inespecially important in a projects early devel- Asia and Latin America Baughman and Bureschopment phase. (1994) estimated the equity return at between
18 and 25 percent. And for privately financedEquity has been provided largely by sponsors. toll roads Fishbein and Babbar (1996) foundFor large projects especially, equity, like debt, that investors expect annual returns to rangeis often sourced from multiple consortium between 15 and 30 percent.members, both international developers andlocal investors. The Buenos Aires concession, Conclusionfor example, has four international sharehold-ers and four local shareholders (including the The challenge for the future is in mitigating theutility's employees). noncommercial risks that characterize the sec-
tor and moving beyond the limited capacity ofLenders like to see sponsors achieve a reason- third parties. Part of the solution lies in generat-able return on their investment, to ensure that ing better information about these risks so thatsponsors have adequate incentive to maintain they are more transparent and their costs aresupport for the project, at least through the life more fully recognized by parties that can miti-of the loans. Equity holders partially shield lend- gate them. Two tracks to achieve this end areers, because the lower priority of their claims independent regulatory agencies and competi-on a project's revenues means that they will tion-for the market and for rights to supplyabsorb unexpected shortfalls in revenue. In full individual customers, as in England and Wales.concessions and privately owned utility com-panies internal cash generation can provide an Referencesimportant source of equity for financinginvestment. Baughmnan, David, and Matthew Buresch. 1994. "Mobilizing Private
Capital for the Power Sector: Experience in Asia and Latin America."
U.S. Agency for International Development and W'orld Bank, Wash-
Although information on the return on equity ington, D.C.
for project sponsors is not widely available, the Fishbein, Gregory. and Sumiiani Babbar. 1996. "Private Financing of Tollfor pjtp oin wdyRoads." RMC Discussion Paper 117. World Bank, Resource Mobili-return can be expected to vary with project risk zation and Cofinancing Vice Presidency, Washington, D.C.
and cash flow profiles. In two of the cases dis- Haarmeyer, David, and Ashoka Mvody. 1998. "Tapping the Private Sec-
cussed here returns to investors are regulated' tor: Approaches to Managing Risk in W'ater and Sanitation." RNICDiscussion Paper 122. World Bank, Resource Mobilization and
* The Malaysian government has guaranteed re- Cofinancing Vice Presidency, Washington, D.C.
turns of 14 to 18 percent on investment in thenational sewerage project; actual returns are cur- David Haarmeyer (david.baarmeyer@rently at 12 percent because the concessionaire stoneweb.com), Stone & Webster Consultants,failed to achieve a 90 percent tariff collection rate. Boston, and Ashoka Mody (amody@worldbank.
* For the English and Welsh water companies org), Project Finance and Guaranteesthe returns on regulatory capital (the assets Departmentof the core business) were 11.5 percent in1995-96 and 12 percent in 1994-95. Accord-ing to Ofwat, the U.K. water company regu-
25
Pooling Water Projects to Move beyondProject FinanceDavid Haarmeyer an d Asboka Mody
Many commercial banks have had little interest in water and sanitation projects not only because
of noncommercial political and regulatory risks, but also the small size, weak local government
credit, and high transactions costs (the legal, consulting, and financial costs of structuring). Most
projects have been financed on a limited recourse basis, that is, with project cash flows and
assets as the main security for lenders. The move from project to corporate (balance sheet)
financing is occurring in stages. Financing project debt frorn the sponsor company's balance
sheet exposes that company to significant risk and thus requires a strong and large balance
sheet. Designed in part to shield a company's balance sheet, innovative structures and financial
instruments are emerging. Ultimately, the goal is for water utilities to raise debt and equity from
capital markets on the basis of their own balance sheets, strengthened by a diversified and
stable rate-paying customer base. This Note reviews the new trends.
In the transition from government to private fi- * Integration of water and sanitation utilitiesnancing, projects in the water and sanitation sec- with other utilities (such as natural gas dis-tor require a heavy focus on risk allocation and tribution or power generation and distribu-mitigation, which has often implied drawn-out tion entities) to form holding companies withnegotiations before and sometimes after finan- stronger balance sheets.cial closure. To address noncommercial risk,many projects have required some form of on- Corporate finance and capital marketsgoing government or third-party support (seepage 21). To transform themselves into economi- Corporate finance can simplify the transitioncally viable enterprises, projects must mitigate to capital market financing because the risk ofcommercial risks and gain credit strength (sig- a project's debt is absorbed in part by othernificant cash for investments and the ability to corporate activities. As in other sectors, projectsraise funds from capital markets). Risk pooling in water and sanitation have been financed withstructures and asset aggregating instruments may some ("limited") recourse to a sponsor's bal-be one way to achieve the funding objectives: ance sheet. For example, the Buenos Aires* Financing of project debt on the basis of the project protects the balance sheets of its cor-
sponsor's balance sheet, or corporate finance porate sponsors (see page 23).(pooling risks with the corporation's otheractivities). Increasing balance sheet financing may require
* Equity funds to leverage sponsors' equity and significant industry restructuring, such as con-attract a larger group of investors. solidating the ownership and operation of water
* Bundling of water and sanitation projects to utilities in a region or encouraging the integra-form economically viable entities that can be tion of different utility sectors (box 1). Suchattractive to lenders. restructuring is already happening. Malaysia has

26 Pooling Water Projects to Move beyond Project Finance
bundled its entire sewerage system under one The use of bond financing by privately financedconcession, a case of project pooling. While water projects and utilities is relatively new.this project has forgone the benefits of com- Leading the way, the English and Welsh utili-parative competition achieved when systems ties have used bond financing based on theiroperate side by side, it creates the potential balance sheets. In most developing countries,for securing revenue streams to finance a large however, the development both of bond mar-number of small investments that would not kets and of economically viable water utilitiesbe commercially viable on their own. is at an incipient stage. The United States has
the most mature bond market for municipalIn the long term, however, achieving financial and infrastructure; its development has been aidedoperational sustainability will require a utility to by tax exemptions and credit enhancementsfinance investments from internal cash and long- (see the discussion below on state revolvingterm bond issues. As the English and Welsh water funds). Although the funds are used primarilycompanies demonstrate, water projects have the by utilities owned by local governments, thispotential to do this. Once established, they can "municipal" bond market taps private financing.
produce stable revenues that not only permit in-
ternal financing but also allow access to a much Equity fundsbroader class of investors through bond issues.
Among developing country projects, only Aguas Over the past few years infrastructure equity
Argentinas has moved significantly in this direc- funds have provided a means by which devel-
tion: internal cash generation accounted for 9 per- opers can raise financing for infrastructure
cent of financing in the first three years and was projects and investors can participate in this
expected to rise to 30 percent in the next three. emerging market. Such funds can be particu-
larly attractive to infrastructure developers
because they allow them to leverage their con-
tributions with those of other investors and thus
to spread their capital. For investors, equity funds
mitigate project and country risk by creating aNew investments in the water and wastewater sector tend to be portfolio of projects under one company.
much smaller than those in other infrastructure sectors because ofthe market's fragmentation. Municipalities are in charge of water and The French water and sanitation company
sanitation,soinvestmentsinfacilitiesreflectdemandonlywithin Lyonnaise des Eaux, for example, introduced
their jurisdictions. The Mexican wastewater program, for example, an infrastructure equity fund in Asia in 1995, aUS$300 million w ater fund. Besides Lyonnaise,will build many small wastewater plants, with an average cost of cont ior tote fund incldes L nsurcontributors to the fund include Allstate Insur-
about US$25 million to US$30 million. Even where large investments ance Company, the Employees Provident Fund
are expected, they are spread overtime, keeping pace with growth in Board of Malaysia, and the Lend Lease Corpo-
demand. The massive Buenos Aires concession is expected to make ration of Australia. Investors are expected to
investments worth a few billion dollars over its lifetime, but the initial benefit from the water company's significant
financing was for less than US$200 million. Similarly, the Manila market position and deal flow in the region.. . . ~~~~The fund refinances the equity of the originalconcessions are expected to invest about US$5 billion over thirty Th us itac es soo equity for
sponsors. Thus it conserves sponsor equity foryears, butthe initial round of financing pobablywill notexceed the riskier development phase; sponsors ap-
US$350 million. This pattern of small, incremental investments ply their expertise in the early phase to get
contrasts with that of power and transportation projects, which projects started and can then move on to other
typically require large investments over a short period and gain the projects. Investors in the fund expect to re-
attention, and often the support, of national governments. ceive steady. utility-like returns and potentiallystand to gain significantly if the fund or a por-
tion of it is publicly listed.

The World Bank Group 27
Houston-based Enron Corporation used a similar State revolving fundsstrategy, though the fund took the form of a pub-licly listed company. In 1994 Enron packaged its In the United States the federal government
emerging market power plants and natural gas has supported state and local governments in
pipelines in a new company that it floated on financing the construction of wastewater treat-
the New York Stock Exchange. Capitalized at ment plants since the 1950s. In 1987, in an ef-
about US$165 million, Global Power and Pipe- fort to delegate more responsibility to state and
lines (GPP) included the assets of two power local governments, the U.S. Congress replaced
plants in the Philippines, a power plant in Gua- the existing grant funding with a program to
temala, and a natural gas pipeline system in Ar- capitalize state revolving funds (SRFs). States
gentina. Enron retained a 50 percent share of the are required to contribute an amount equal to
company and sold the rest to investors. GPP has at least 20 percent of the federal capitalization
the right to buy into projects developed by Enron funding. The program is aimed at leveraging
at favorable prices, providing Enron an ensured federal resources and creating a renewable and
exit mechanism to free up capital for high-risk, perpetual source of financial assistance for
high-return development opportunities. wastewater infrastructure. Unlike with grantfunding, the need to repay SRF loans intro-
EBRD's private multiproject financing duces an important element of accountability,facility as well as a basis for new loans.
To mobilize private investment in Eastern Eu- The structure of each state's revolving fund pro-
rope, the European Bank for Reconstruction gram depends primarily on the state's needs and
and Development (EBRD) has developed a circumstances (such as its borrowing limit and
multiproject financing facility (MPF) that pro- ability to repay loans). Some states use program
vides a framework for financing a series of funds to provide direct loans to local govern-
projects that may be too small to be consid- ments of up to 100 percent of a project's cost at
ered individually. The MPF is made available below-market rates. Others provide excess re-
to a private company, which uses the facility serves or excess debt payment coverage that
to make equity investments in and loans to pri- helps secure bonds backed by the revenues of
vate water and sanitation projects. Under this a wastewater facility. Program funds may be used
arrangement the company largely takes on the as collateral to borrow new resources; because
task of due diligence, which helps to reduce several jurisdictions borrow on the basis of the
the transactions costs for each project financed. same collateral, spreading the risks, the overallcosts of borrowing are lowered.
EBRD signed its first MPF in July 1995-a US$90million equity and loan facility with Lyonnaise The large, diversified pools of municipal bor-
des Eaux. The company was recently awarded rowers created under SRF programs are attrac-
a project that could be the first to access the tive to lenders because they spread the risks
facility, a US$41 million, twenty-five-year BOT of debt payment interruption or default. Pool-
(build-operate-transfer) wastewater treatment ing projects for financing on a statewide basis
project in Maribor, Slovenia (population also makes it more economical for credit rat-
150,000). In 1996 the second MPF was signed, ing agencies to evaluate credit risks. While a
with three Austrian companies. The agreement single project might not be large enough to
involves a S 700 million (approximately US$140 justify a credit assessment, a large group of
million) equity and loan facility to support an projects will be attractive. Credit rating agen-
investment program of S 2 billion. The Austrian cies provide important information to prospec-
companies will also receive financial support in tive lenders about the creditworthiness of SRF
the form of a guarantee from the East-West Fund programs by, for example, assessing and moni-
of the Austrian Finanzierungsgarantie GmbH. toring reserve fund and debt coverage levels and

28 Pooling Water Projects to Move beyond Project Finance
evaluating the size and composition of the bor- awarded in Casablanca and Gabon and is be-rower pool. Size and diversity matter. Rating agen- ing considered for water and power projectscies have found that smaller pools (20-100 in the Republic of Congo. However, the impli-borrowers) generally face more stringent credit cations for the concentration of monopolyrequirements from lenders than larger pools be- power are a concern. Chile recently passed acause the behavior of individual borrowers has law prohibiting owners of water utilities froman amplified effect. For pools with fewer than simultaneously owning power distribution ortwenty borrowers the weakest borrower tends to telephone service in the same area.determine the credit rating.
ConclusionThe revolving nature of the funds has had asignificant effect on purchasing power. Accord- As a utility matures and its revenues becomeing to the U.S. Environmental Protection Agency, increasingly predictable and secure, its financ-funds invested in the SRFs provide about four ing structure can be expected to shift to corpo-times the purchasing power over twenty years rate finance or greater balance sheet support.than funds used to make grants. Even so, the Internally generated revenues are an importantfunds represent only a fraction of the invest- source of funding for water projects that havement needed to upgrade municipal plants. In achieved a stable and diversified customer base.1997 states were expected to make SRF loans of And strong balance sheets permit utilities toUS$3 billion, compared with US$11 billion in obtain external financing by issuing long-termtotal capital investment in wastewater infrastruc- debt to a broader class of investors. As a resultture from all sources (federal, state, and local). of high political risk and shallow or nonexistent
capital markets, in developing countries theMultiutilities work of building stronger balance sheets and
tapping capital markets generally takes time,Deregulation and increasing competition in in- however.dustrial countries are creating pressures for dif-ferent utility sectors to combine. By combining, New financing techniques in other sectors andutilities hope to achieve not only economies their early applications in water and sanitationof scope but also larger balance sheets and suggest that pooling projects may be a way toincreased credit strength (through diversity) to move beyond project finance, particularly forattract long-term private financing. The trend the many small projects that need financing.has been most pronounced in the United Multiutilities, entities that deliver multiple infra-Kingdom but is growing elsewhere. United structure services such as water and electricity,Utilities and ScottishPower, two of the three offer another approach to attracting private capi-U.K. multiutilities, provide utility services that tal. These multiutilities can gain credit strengthrun the gamut-principally electricity genera- through a diversified revenue base that enhancestion and distribution and water and sanitation, the prospects for corporate finance.but also gas distribution and telecommunica-tions services.
The Note is based on a longer paper by the authors, "Tapping thePrivate Sector: Approaches to Managing Risk in Water and Sanitation"
Multiutilities in developing countries may soon (RMC Discussion Paper 122, World Bank, Resource Mobilization and
play a growing role. Argentina and Slovenia Cofinancing Vice Presidency, Washington, D.C., 1998).
have combined gas and water utilities. In Coted'lvoire the project company developing the David Haarmeyer (david.haarmeyer@water supply concession went on to develop stoneweb.com), Stone & Webster Consultants,the electricity distribution system and a power Boston, and Asboka Mody ([email protected] project. This multiutility approach org), Project Finance and Guaranteesis being adopted in the concessions recently Department

29
International Gas Trade-The Bolivia-BrazilGas PipelinePeter L. Law and Nelson de Franco
The Bolivia-Brazil natural gas pipeline, which will transport natural gas more than 3,000
kilometers, will cost US$2.1 billion to construct. Despite the substantial benefits for both Bolivia
and Brazil and the involvement of reputable private partners, the perceived risks and
complexities of this large project made financing it a major challenge. The pipeline will link
supply in one country to a potential market in another. Neither of these countries has a tradition
of independent regulation or economic pricing of fuels. And the pipeline will be the first major
gas infrastructure project involving the private sector in Brazil, where the natural gas market is
underdeveloped and the gas distribution infrastructure still very limited. This Note explains the
historical factors that shaped the project, how the financing package came together, and the role
the pipeline will play in liberalizing the Brazilian hydrocarbon sector.
When the pipeline project started to get offthe ground in the early 1990s, the Brazilianhydrocarbon sector was dominated by govern- FIGURE 1 THE BOLIVIA-BRAZIL NATURAL GAS PIPELINEment-owned entities and prices were heavilyregulated. At the federal level the oil and gas - Xw pipelinecompany Petrobras, the main player in the A Exitinre pripelone
project, still had a monopoly on exploration,exploitation, refining, and maritime and pipe-line transportation. Natural gas distribution was
reserved for state-owned distribution compa-nies, although petroleum distribution was opento foreign investors. Prices were equalizedacross regions, and the prices of liquefied pe- Janeiro
troleum gas (LPG) and fuel oil were subsidized.For Petrobras, exploiting Brazil's modest natu-ral gas reserves had been secondary to pro-ducing oil, and the share of natural gas in the . 4 l
/)_ ~~Sup* l"vcr lrPFB{8ivald,energy market in the early 1990s was a mere 2 Pa tIC PbM ll)percent. Petrobras had introduced natural gasonly in 1988, supplying small quantities to the "l"Siet B _N, Uow.41buI .existing Sao Paulo distribution network as as- s 8 b b
sociated gas from local oil fields.' But with _is_ c_sp.rdsv.
Brazil forecasting strong growth in energy

30 International Gas Trade-The Bolivia-Brazil Gas Pipeline
demand, natural gas gained appeal as a means tion of the pipeline. YPFB was being preparedto offset increasing dependence on more for capitalization and sale by international tender.expensive fuels. Meanwhile, Bolivia needed to A hydrocarbon law passed in 1996 committedfind a new market for gas exports. The country Bolivian reserves to the export project and de-had been exporting gas by pipeline to Argen- fined a diminished (but still critical) role for YPFBtina since the 1970s, with these export sales rep- as the aggregator and shipper of future gas ex-resenting some 80 percent of Bolivia's total gas ports to Brazil. The capitalization of YPFB fol-production, but new discoveries in Argentina lowed shortly after, and two private explorationgave notice that this was no longer tenable. The and production companies and one oil and gasidea of natural gas trade between Bolivia and transportation company eventually won the in-Brazil had been around since the 1930s, and in ternational competitive tender. The Bolivian1990 the two governments decided to give a transportation company, Gas Transboliviano S.A.gas export pipeline another serious look. After (GTB), was formed for the gas export project asa preliminary feasibility study the two state mo- a private joint venture among Enron, Shell, andnopolies, Petrobras in Brazil and Yacimientos Bolivian pension funds.Petroliferos Fiscales Bolivianos (YPFB) in Bo-livia, signed a gas sales contract in 1993. The project structure allowed a degree of cross-
border ownership by each sponsor group, andPrivate investors emerge special committees were formed with repre-
sentation from all sponsors to resolve techni-Neither government was in a position to fund cal and financial issues and ensure cross-borderthe pipeline project. As a first step to raise pri- harmonization of the project. These commit-vate finance, Petrobras embarked on a series tecs provcd effcctive in helping to speed upof road shows in 1994 to choose private equity project development.partners for a new pipeline company on theBrazilian side. Petrobras ultimately selected the A financing plan takes shapeBTB consortium, comprising British Gas,Tenneco (now El Paso Energy), and Broken In 1997 the project still lacked a firm financingHill Proprietary, to form the Brazilian trans- plan. The project required a large, bulky, up-port company (Transportadora Brasileira front investment with a gradual buildup of tar-Gasoduto Bolivia-Brasil, S.A. [TBG]). This com- iff revenues, and a final gas price that wouldpany, with an initial 51 percent ownership by provide incentives for a speedy uptake of gasPetrobras, would own the Brazilian part of the by potential customers-industrial users andpipeline. However, the private partners began power plants. Market soundings had indicatedto signal to the government that fair access to a lack of capacity for long-term commercialdownstream markets and market-based pric- funding. Commercial debt would be high costing policies would be important for the real- with short maturities (eight to ten years) be-ization of the project-policies in line with cause of perceived Brazilian country risk, regu-those recommended earlier by the World Bank latory risk, and supply risks, resulting in debtto the Brazilian government as key for the de- service difficulties and a final gas price thatvelopment of the hydrocarbon sector. In late could severely limit market penetration during1995 an amendment to the Brazilian constitu- the critical initial years. (Commercial lenderstion removed the Petrobras monopoly, subject perceived some supply risks because knownto an implementation law that was approved Bolivian reserves were only sufficient to meetby Brazil's Congress in August 1997. 80 percent of the gas sales contract. But in the
World Bank's view the risks were likely to beOn the Bolivian side an agreement of associa- small because the capitalization of YPFB hadtion was reached between Enron and YPFB that attracted some US$1 billion of private capitalincluded the development of the Bolivian sec- for further exploration and development.)

The World Bank Group 31
FIGURE 2 THE BOLIVIA-BRAZIL PIPELINE-TAKE (AND SHIP) OR PAY FRAMEWORK
Gas is transferred from YPFB toPetrobras at the border.
BOLIVIAN YPFB GTB TOG BRAZILIAN GASDISTRIBUTION
PRODUCERS -w tasot I TGtasot OPNEYPFB collects gas GTB transports TB6 transports Petrobras sells COMPANIES
-~ - -- -from producers and gas to the border gas to states for gas to distribution -
delivers it to the for YPFB. Petrobras. companies.pipeline.
In 1997 the World Bank and its multilateral coun- government, realizing that this threatened to de-
terparts, convinced that both countries were se- lay the project until a new government was
rious about opening their hydrocarbon sectors elected, urged Petrobras to quickly seek a solu-
to competition and private participation, decided tion. Petrobras responded through two mecha-to appraise the project on the understanding nisms. First, it agreed to finance a fixed price
that transmission tariffs (and private investor turnkey construction contract for the Bolivian
rates of return) would be regulated to ensure section of the pipeline, with repayment to be
that any benefits of extended maturities result- made through the waiver of future transportation
ing from their loans and guarantees would be fees. Second, it agreed to prepurchase part of
passed on to final consumers. A World Bank the uncommitted upside capacity of the pipe-analysis showed the project to be economically line on both sides of the border, an arrange-
viable and the best of several alternatives, in- ment that became known as the transportcluding using different pipeline routes from capacity option.Bolivia, constructing a pipeline from Argentinato Brazil, and constructing large gas-fired power Who takes the risks?plants in Bolivia and transporting the power toBrazil using high-voltage transmission lines. (The Petrobras bears most of the project risk on both
final pipeline route was selected to minimize sides of the border. YPFB will collect gas from
environmental impact, and the project includes the producers, and the gas will be transportedfull measures to protect the interests of indig- to the border under a ship-or-pay contract withenous people living near the pipeline.) On the GTB (figure 2). Here, Petrobras will take own-Brazilian side multilateral lending and partial ership of the gas for delivery to the five Brazil-
credit guarantees offered the prospect of longer ian state gas distribution companies underloan maturities and a gas price just right to pen- similar transportation arrangements with TBG.
etrate the market. Thus the World Bank agreedin December 1997 to provide a direct loan of The supply risk on the Bolivian side falls on
US$130 million and to continue preparing a YPFB. But this risk is small because of addi-
partial credit guarantee of US$180 million to tional supply likely to become available fromTBG. Other multilaterals, including the Inter- new discoveries in southern Bolivia and possi-American Development Bank, provided financ- bly northern Argentina. The biggest risk lies in
ing totaling US$380 million. The multilateral the market in Brazil. Four of the five distribu-
financing covered 40 percent of the financing tion companies are paper companies with asrequirements as senior debt, Petrobras provided yet no pipes in the ground, and gas will have toanother 40 percent sourced from bilateral agen- penetrate a market dominated by high-sulfur fuelcies, and the equity sponsors provided the rest. oil. (Petrobras has an equity stake of about one-
third in several of the distribution companies.) 2
On the Bolivian side only 20 percent of financ- Although the ultimate market risk lies with theing was available from shareholder equity. With distribution companies, it is Petrobras that is
the Bolivian government unprepared to provide contractually obligated to pay YPFB for the gas
sovereign guarantees, little progress was being and the transportation companies for theirmade to close the financing gap. The Brazilian transportation services.

32 International Gas Trade-The Bolivia-Brazil Gas Pipeline
Moreover, through its turnkey construction con- fore submit a plan for eventual reduction oftract, Petrobras takes the construction risk on Petrobras's shareholding in a way that will en-the Bolivian side. And if the pipeline in Brazil sure the best chances for commercial success.is not built on time, it is Petrobras that willincur financial penalties payable to YPFB and As part of the agreements reached with thethe distribution companies. World Bank, the Brazilian government has de-
veloped a plan to phase out fuel price subsi-Toward sector liberalization dies and deregulate petroleum product prices
within a three-year transition period (fromThe size and scope of the pipeline give it the August 1997). The concept of distance-basedleverage to play a key role in opening the Bra- transport tariffs, a departure from the traditionalzilian hydrocarbon sector to competition and pricing mechanisms, will encourage use of theprivate participation. The project and accom- best fuel supply option in each area of Brazil.panying policy reforms will establish the prin- Open access to transmission systems, combinedciples of unbundling and transparent pricing with increased private participation in upstreamin transactions between gas supply, transpor- development, will be a major force in control-tation, and distribution. The pipeline will help ling extraction costs and increasing suppliespromote interfuel competition in Brazil by al- of domestic gas in Brazil. It will ultimately leadlowing a large increase in gas supply, and in- to wider choices for consumers, allowing largecrease the number of players in the market by consumers to negotiate directly with produc-making the upside capacity of the pipeline ers and importers for the best commercial terms.available to shippers other than Petrobras.
ConclusionDuring the project preparation stage it was stillunclear to what extent Brazil's hydrocarbon sec- Many prospective international gas pipelinetor would be opened to competition, as the hy- projects are under consideration-projects indrocarbon law was not passed until later. The Central and South Asia and projects proposingWorld Bank therefore sought to include good pipelines from Russia to China and from Tur-practice policy principles relating to open ac- key to Eastern Europe. Given the large invest-cess, ownership, and pricing in the authoriza- ments required, the main challenge is to designtion agreement between the government of financing schemes that work. There are fewBrazil and TBG that sets out the parameters blueprints to draw on. The World Bank canunder which the pipeline will eventually oper- play a key transitional role in such projects.ate. These policies include nondiscriminatory But there needs to be demonstrable commit-third-party access, the adoption of distance- ment to opening the natural gas industry torelated transmission tariffs for the uncommitted competition and private investment and estab-upside capacity of the pipeline, and the require- lishing sound regulatory and pricing policies.ment that TBG would act only as a gas trans-porter and not engage in gas trading or upstream lThe Sao Paulo distribution network was originally constructed toor downstream cross-ownership. Although distribute ranufactured gas.
Petrobras will be the dominant shareholder of 2To counter Petrobras's bargaining power, the distribution compa-nlies used collective negotiations to achieve acceptable price and
the Brazilian transportation company for a tran- take-or-pay conditions, an approach that proved highly effective.sition period, the Brazilian government hasagreed with the World Bank to eventually maxi- Peter L. Law (plaw@worldbank. org),mize private participation in the project. To ini- Energy Specialist, Oil and Gas Division, andtiate this too quickly would risk unraveling the Nelson de Franco ([email protected]),many complex project agreements already Principal Power Engineer, Latin America andreached and fail to maximize the value of the the Caribbean Regional OfficePetrobras shares. The government will there-

33
Promoting Regional Power Trade-The Southern African Power PoolDonal T O'Leary, Jean-Pierre Cbarpentier, and Diane Minogue
The Southern African Power Pool (SAPP), the first formal international pool to be set up outside
North America and Western Europe, was inaugurated in 1995. While the utilities of southern
Africa have been importing and exporting electricity for four decades, these trades occurred
through bilateral contracts that were complex and often difficult to administer. The objective of
shifting to the pool is to create a more efficient regional market. Although physically the pool is
still embryonic and trade volumes average roughly 3 percent of production, confidence in the
market and mutual trust between the members are being strengthened and sector coordination
is dramatically improved. This Note reviews the factors that have eased the way for the pool
agreements and the challenges that remain in getting the multilateral trading operation under way.
Power exchange first arose because of the dis-tribution of power sources in the region: a large FIGURE 1 SOUTHERN AFRICAN POWER POOLreserve of low-cost hydroelectricity in the north-ern part (especially the Inga Reservoir in theDemocratic Republic of Congo and the CahoraBassa Reservoir in Mozambique), large reservesof cheap coal in South Africa, and the KaribaDam (on the border between Zambia and Zim- 1 rbabwe), which. being in the middle of the re-Ogional system, can play the "buffer" role (figure1). As the network has been reinforced and ex-tended, many arrangements have arisen for the MIWsale and wheeling of electrical power betweencountries in the region. 0AIE
The new pool agreements cover about 9 millionsquare kilometers and 200 million people. Thenumber of customers of the interconnected ora ssanational systems has been estimated at more than4.1 million, though this figure understates the totalnumber of retail customers because some of thecustomers are distribution companies. SWUND
The SAPP members agreed to develop their Existingpooling operations as a `loose pool" along the orplwanedlines of NORDEL/NordPool (Scandinavia),UCPTE (Western Europe), and such U.S. pools

34 Promoting Regional Power Trade-The Southern African Power Pool
SAPP members and as the Midcontinent Area Power Pool before the a majority of the SADC members. The memo-their utilities 1996 restructuring of the U.S. electricity market. randum of understanding and its subsidiary
Angola Loose pools emphasize the constant exchange agreements-the Inter-Utility Memorandum of
Empresa of information in order to maximize both the Understanding, the Agreement between Oper-
National de economic and reliability benefits from trading ating Members, and the Operating GuidelinesElectricidade (ENE) and system autonomy. These pools do not use -have now been signed by all the SADC mem-
central dispatch of power plants, often relying bers and their national power utilities.Botswana instead on long-term bilateral contracts for elec-Botswana PowerCorporation (BPC) tricity supply between generators and custom- The SAPP agreements state that the purpose of
ers. These contracts are supplemented with the pool is to allow its members to coordinate
Democratic short-term contracts and other deals under the the planning and operation of their systemsRepublic of Congo overall agreement. Loose pools may provide cen- while maintaining reliability, autonomy, andSocictr Nationale tral selvices, however, including producing con- self-sufficiency, and to share in the benefits ofdElectricit6 (SNEL) tinuous, real-time data to match generation and operating the pool. The agreements incorpo-
Lesotho demand, developing indicative expansion plans, rate the SADC treaty, the SADC Dispute Reso-Lesotho Electricity and implementing emergency procedures. Loose lution Tribunal, the SADC energy ministers, andCommission (LEC) pools also establish detailed common design and the Technical and Administrative Unit. The
Malawi operational standards to ensure system security Inter-Governmental Memorandum of Under-Malawi Electricity and reliability and to facilitate trades. standing establishes that the SAPP agreementsSupply Commission must be interpreted in a manner consistent with(ESCOM) In the SAPP full membcrship is limitcd to the the SADC treaty and that the final and binding
national utilities. Most are still vertically integrated, dispute resolution forum is the SADC Dispute
Electricidade de with a primary mandate of ensuring the autonomy Resolution Tribunal. The energy ministers are
Mozambique (EDM) and self-sufficiency of the domestic system. The responsible for resolving major policy issuesbenefits of the pool include reductions or post- in the SAPP and for admitting new members to
Namibia ponements in new requirements for generating the pool. The Technical and Administrative UnitNamibia Power capacity and reserves, reductions in fuel costs, provides secretariat and other services to the
(NAMPOWEB) and more efficient use of hydroelectricity. To es- SAPP executive committee, acts as liaison to
South Africa timate the potential gains, a Southern African De- the SADC, and seeks funding according to theElectricity Supply velopment Community (SADC) electric power recommendations of the executive committee.Commission (ESKOM) study conducted in 1990-92 compared the costs
of integrated regional development with those The SAPP is organized under the executiveSwaziland of independent development, in which each committee, which acts as the board of direc-Swaziland Electricity country follows a strategy of self-sufficiency. The tors of the pool, and a management commit-
study showed savings of US$785 million (1992 tee, which oversees the administration of the
Tanzania prices), or 20 percent, over 1995-2010. Because pool. Three subcommittees serve under theTanzania Electricity the Democratic Republic of Congo and South Af- direction of the management committee: the
Supply Company rica were not members of the SADC at the time planning subcommittee (which focuses on re-
(TANESCO) of the study, the comparison did not include their viewing wheeling rates annually and develop-
Zambia system expansion plans, though it did account ing an indicative SAPP expansion plan everyZambian Electricity for energy trade opportunities. Including these two years), the operating subcommittee andSupply Corporation two countries boosts the benefits significantly. its associated coordination center, and the en-(ZESCO) vironmental subcommittee. The coordination
Zimbabwe The agreements center, which is still being set up, will be re-Zimbabwe Electricity sponsible for such tasks as undertaking mostSupply Authority The Southern African Power Pool is based on pool monitoring activities, carrying out oper-(ZESA) agreements rather than on law. The pool was ating and planning studies, determining trans-
inaugurated after the Inter-Governmental fer limits on tie-lines, administering a regional
Memorandum of Understanding was signed by database, disseminating maintenance sched-
The World Bank Group 35
ules, providing technical advice, and seeking The experience of the SAPP shows that in mov-funding for its needs. ing from pool agreements to implementation, it
is possible for some participants to move inEach member must meet its Accredited Capac- smaller, incremental steps toward the overall goalsity Obligation, a requirement that each utility set by the agreements. While all participants musthave sufficient capacity to cover the forecast take consistent steps, they do not need to movemonthly peak. Each member is also obligated at the same pace. And while all participants haveto supply emergency energy for up to six hours, agreed to an international pool, it is reasonableto provide automatic generation control and to expect that self-sufficiency and autonomy willother facilities in its control area, to allow remain the priority for some members, at leastwheeling through its system where technically through the first phase of operations. The pooland economically feasible, to submit mainte- agreements include provisions that recognizenance schedules, to disclose information and these concerns while also encouraging greatercosts related to thermal generating facilities, integration, for example, by permitting membersand to contribute toward the center's costs. to meet their Accredited Capacity Obligation
through a contract with another member. Not allA key element in the operation of the pool is countries prefer such a gradualist approach, how-the SAPP pricing arrangement, set out in thir- ever: Botswana, Mozambique, and Namibia haveteen detailed schedules in the operating agree- opted to rely more on importing power than onment. These schedules cover four broad types building new capacity. Regardless of the preferredof transaction: firm power contracts of varying path, it is essential to set pool governance rulesduration; nonfirm power contracts of varying so that all members, large and small, perceiveduration; mutual support contracts such as op- that they have a voice.erating reserve, emergency energy, and con-trol area services; and scheduled outage energy, As national regulatory agencies develop and be-energy banking, and wheeling. gin to assert their authority, there is a risk that
they might not be sufficiently attuned to the needsImplementation of the regional market. Experience in other coun-
tries shows that although a pool can operateThree major factors played a key part in the where regulatory regimes differ, as they do amongdevelopment of the regional pool agreements: SAPP countries, possibilities for gaming or unfairthe availability of complementary power sources, advantage created by differences in regulatoryan active regional organization for economic co- systems can undermine members' willingness tooperation, and the political will to support in- participate. Thus national-level regulatory stat-creased regional energy trade. The Southern utes should be carefully drafted so that the agencyAfrican Development Community and its pre- jurisdictions are properly defined, directed, anddecessor, the Southern African Development Co- restrained in order to avoid regulatory obstaclesordination Conference, served as a focal point to trade. There should also be periodic reviewsfor the promotion of regional integration, facili- of regulatory compatibility as the SAPP devel-tating investment in projects (such as intercon- ops. In addition, the need for a consistent ap-nection projects) that allowed increased regional proach to transmission access is becomingpower trade. The momentum for regional inte- apparent as more independent power producersgration, including increased power trade, was (IPPs) and independent transmission projectsfurther strengthened by the emergence of more (ITPs) express interest in investing in the region.democratic governments in several countries and So far only Zambia has required its regulator tothe cessation of hostilities in others. Also help- take into account SAPP interests.ful has been having at least one country or part-ner (South Africa) act as a driver, encouraging A review of the SAPP's first year of operationmore passive parties. shows that several important practical issues need

36 Promoting Regional Power Trade-The Southern African Power Pool
to be addressed to support the development of utilities should unbundle their domestic trans-the pool. First, the power utilities in each coun- mission pricing and ensure that members adopttry need to be put on a more viable financial identical rules to set transmission costs. In ad-footing to ensure that they are creditworthy and dition, a study is needed to assess the effectsable to respond to commercial incentives for trad- on pool development of transmission pricinging power, including the ability to generate foreign under the SAPP and current national pricingexchange. Toward this end, commercialization policies.programs are under way or undcr considerationat half the utilities (EDM, ENE, ESCOM, ESKOM, Fifth, SAPP members need to estimate and meetZESA, and ZESCO). Most advanced in power financing requirements for operations and newsystem reform are South Africa and Zambia. generation and transmission projects. In identi-
fying potential new projects, they should useSecond, the SAPP members need to reach agree- compatible generation and transmission plan-ment on the design and staffing of the coordi- ning software that explicitly allows for risk analy-nation center, a politically challenging task, so sis and for dealing with hydrological uncertainty.that the center can become operational. The keysteps are deciding on a neutral location; select- Sixth, SAPP members need to harmonizeing a neutral manager with sufficient autonomy; ESKOM's internal competitive generators poolestablishing a legal status; defining clear gover- with the SAPP cooperative pool. The internalnance rules; setting guidelines for the interface pool, set up in 1996, is based on the Englandbetween the center, SAPP members, and the and Wales model and currently does not pro-SADC; identifying equipment needs, especially vide for access to third-party operators. SAPPccmputer hardware and software; training op- members also need to address the risk that theerators; twinning with a mature pool to develop different triggers for capacity addition (priceskills; and developing a realistic budget. By the signals for the internal pool and a planned ap-end of the first year SAPP members had made proach for the other SAPP members) could leadprogress on only a few of these issues. They to suboptimal investment.had agreed to establish the center in Harare,Zimbabwe, separate from ZESA, and had ad- Finally, because the SAPP establishes a largelyvertised for a manager. The operating subcom- self-governing regime at the operating level,mittee had drafted a constitution that was being and as experience in Argentina, Europe, andfinalized. And training programs for operators North America shows, members will need tohad been offered, with more under preparation. quickly set up an effective dispute resolution
process. Clear resolution procedures combinedThird, the pool would benefit from broadening with realistic enforcement could also help inits membership to include existing institutions attracting new generation and minimizing na-that control or influence significant generation tional self-sufficiency concerns.or transmission, such as Hidroelectrica de CahoraBassa, the Copperbelt Energy Consortium, the This Note draws heavily from a longer work by the authors. Support-
new private owner of the Power Division of the ing the Implementation ofthe Southern African Power Pool, forthcom-Zambia Consolidated Copper Mining Company, ing as a World Bank Technical Paper (Washington, D.C.).
and the Zambezi River Authority. But this willmean developing procedures (voting rules) to Donal T O'Leary (currently working withgive voice to and account for the interests of Siemens AG under the World Bank Staffthese players as well as other new entrants, such Exchange Program), Jean-Pierre Charpentier,as IPPs and ITPs. and Diane Ainogue, Energy, Mining, and
Telecommunications DeparlmentFourth, to allow efficient operation of the pooland encourage an IPP presence, all the SAPP

37
Why Performance Contracts for State-OwnedEnterprises Haven't WorkedMary Shirley
When privatization is not feasible or palatable, some developing country governments seek to
improve the performance of state enterprises by negotiating performance contracts with their
managers. Many of these contracts have been put in place with World Bank assistance. Research
shows that they rarely work. This Note summarizes the rationale for performance contracts and
explores the reasons why they haven't worked. It concludes that since a well-designed and -enforced
performance contract can be as politically costly as a well-designed privatization, performance
contracts are not likely to be successful in countries that lack the political will to privatize.
Written contracts between governments and state put in place most governments were trying toenterprises have been widely used in World run their state enterprises without any form ofBank projects since the first Bank operation sup- performance evaluation. As one architect ofporting performance contracts, a 1975 opera- performancc contracts noted, this was like play-tion in Senegal. A Bank survey of developing ing football without rules, scoreboards, or ref-countries found 565 such contracts in thirty-two erees. Performance contracts seemed a logicalcountries, and another 103,000 in China as of solution to this problem, since similar contractsJune 1994 (World Bank 1995). Although these had been successful in the private sector.performance contracts go by different names-contrat-plan. memorandum of understanding, No one, including the proponents of perfor-signaling system-they share common features. mance contracts, minimized the problemsAll are negotiated, written agreements between governments would face in designing suchgovernments and the managers of state enter- contracts, however. Much has been written aboutprises that specify targets that management the problems that principals (in this case, gov-pledges to achieve in a given time frame and ernments) face because they cannot accuratelydefine how performance will be measured at measure the effort expended by their agentsthe end of a specified period. (managers) or sort it out from other factors af-
fecting performance. These agency problems areThe case for performance contracts compounded in the public sector, where politi-
cians have many points of view and bureau-Despite a global wave of privatizations, state crats have many different agendas. Under suchenterprises still account for about 10 percent circumstances it is hard to judge performanceof gross domestic product (GDP) in develop- and to motivate managers and hold them ac-ing countries. These enterprises are often the countable for results. Moreover, unlike privatelargest and most valuable or problematic firms, owners, politicians may not benefit from betterwith monopolies in mining, petroleum, infra- performance, and so may try to make managersstructure, and heavy industry. For these firms serve objectives that conflict with efficiency, suchperformance contracts have often seemed to as rewarding political supporters with jobs ornmake good sense. Before the contracts were subsidies.

38 Why Performance Contracts for State-Owned Enterprises Haven't Worked
Proponents of performance contracts argue that tween performance contracts and productivitythey can be written in ways that clarify mul- in hundreds of state enterprises in China-foundtiple objectives and make it easier to judge per- no evidence that performance contracts had im-formance. For example, a contract could apply proved efficiency. The first study analyzed theweights to the multiple objectives, spell out effects of contracts in monopoly enterprises (inthe obligations for which managers will be held water, electricity, telecommunications, and oilaccountable, and specify rewards (such as and gas) in Ghana, India, the Republic of Ko-bonuses) and penalties (such as demotion or rea, Mexico, the Philippines, and Senegal. Itfiring). Even where a government seeks to found no pattern of improvement associatedmaximize social or political objectives, a per- with the performance contracts in productivityformance contract can improve efficiency by or profitability trends (figure 1).setting appropriate targets. For example, a stateenterprise required to retain redundant work- The second study used a much larger sample iners could still achieve contractual targets aimed manufacturing but in only one country, China.at improving quality. And an overstaffed firm The results showed that the increasing use ofcould still improve labor productivity by mak- performance contracts in China could not steming better use of plant and equipment. The fact the fall in productivity among state enterprisesthat managers operate under such constraints (figure 2). More important, the study found nocould be taken into account by judging perfor- robust, positive association between perfor-mance against past trends. mance contracts and productivity. And a com-
parison of a sample of state enterprises that hadThe contrary evidence signed performance contracts with a sample of
firms that had not found no significant differ-The logic of performance contracts is persua- ence between the two groups.sive, but the reality has been disappointing. Twoempirical studies-one analyzing the effect of Is it possible that performance contracts failedsuch contracts on profitability and productivity to improve productivity because managers werein twelve companies in six countries and the told to maximize social benefits, such as increas-other examining statistically the correlation be- ing employment or developing backward re-
gions? Although the studies did not measuresocial benefits, the weights that contracts as-
FIGURE 1 PERFORMANCE CHANGES IN STATE ENTERPRISES signed to productivity targets (two-thirds onAFTER SIGNING PERFORMANCE CONTRACTS average) and the stated goals of the parties to
the contracts suggest that improving operatingEnterprises efficiency was the prime objective. Moreover,12 most social and political goals imposed constant
I1proved .::Ljn ...costs on state enterprises during the period andImproved V so should not have affected the trends being
8 measured.
Why not simply judge performance contracts on4 , 9. I whether the firms met the targets specified in the
2 contract? All the firms in the first study did achieveat least satisfactory ratings where some sort of
o _ Labor _ Toa score was assigned, and all the contracts assign aReturn on assets Labor productivity Total factor productivity high weight to economic goals. The problem is
that many of the targets are soft or flawed mea-Note: The data cover twelve state enterprises in Ghana, India, the Republic of Korea, Mexico, thePhilippines, and Senegal. sures of economic performance. For example,Source: Company data and World Bank estimates. 30 percent of the score for one of the electricity

The World Bank Group 39
FIGURE 2 CHINESE STATE ENTERPRISES UNDER PERFORMANCECONTRACTS AND THEIR PRODUCTIVITY, 1980-89
ProductivityFirms under performance contracts Index (1980 = 1.0)700 2.75
companies (India's National Thermal Power Cor-poration) depended on the volume of electricity 600 2.50it generated. The company achieved its target 500 Productivity 2.25and received a score of excellent, yet its total Puvfactor productivity actually fell below precontract 400 2.00levels. Output went up, but inputs rose three times / 17faster. The target was flawed because it could be 3e/ 1.75met by increasing inputs, even if efficiency de- 200 1.50clined. The contracts have many such flaws, forreasons explored below. 100Firm 1.25
What is the problem? 1980 1981 1982 1983 1984 1985 1986 1987 1988 1989
The theory of contracting suggests that to im- Note:The data for productivity refer to the state enterprises with performance contracts each year.prove performance, performance contracts must:3 Reduce the information advantage that man-
agers enjoy over owners. a bonus or punished underachievement. And* Motivate managers through rewards or pen- the second study, in China, found that the in-
alties to achieve the contract's targets. centive (wage increases linked to profits) was- Convince managers that the government set too low to motivate improvements in most
promises in the contract (such as to pay bo- of the firms and was aimed only at workers.nuses or impose penalties) are credible.
Finally, governments' commitment to enforc-The performance contracts in the two studies ing the contracts and keeping their promisesfailed on all three counts. First, managers were was not credible. All the contracts lacked neu-able to use their information advantage to nego- tral, third-party enforcement mechanisms (thetiate targets that were either hard for outsiders state enterprises could not take the governmentto evaluate or easy for the firm to achieve. Per- to court, for example), and governments oftenformance is hard to evaluate, for example, when reneged on their promises. In Ghana, India,there are many targets (the contract for Korea's and Senegal, for example, the government didtelecommunications company had forty) or not force public entities to pay their bills towhen targets change frequently (a third of the the electricity companies.targets for Ghana's water company changedevery year). Targets can also simply be soft; in There is evidence that a performance contractIndia, for example, negotiations dragged on so that overcomes the three contracting problemslong that targets were set equal to ex post per- can improve efficiency. The study of China simu-formance. The managers' information advantage lated what would have happened with a "good"was compounded by governments' failure to performance contract-one that addressed thegive the bureaucrats responsible for negotiat- information, incentive, and commitment prob-ing the contracts and evaluating results the lems-and found that it would have had a sta-power, resources, and status they needed to face tistically significant and large positive effect,enterprise managers on a level playing field. boosting productivity growth rates by 10 per-Managers were thus able to negotiate targets cent. But only 2.2 percent of the firms in thethat they could achieve without making addi- sample had "good" performance contracts. Alltional efforts to improve productivity. the other performance contracts had either in-
significant or negative effects on productivity.Second, the incentives provided under the con-tracts failed to motivate managers. The first study Why did so few performance contracts con-found that only two of the twelve contracts paid tain the provisions necessary for success?
40 Why Performance Contracts for State-Owned Enterprises Haven't Worked
Performance contracting assumes that govern- nated all subsidies, transfers, and governmentment objectives can be maximized and perfor- guarantees for debts of state enterprises andmance improved by setting targets that take instructed banks to lend to them under the sameinto account the constraints placed on manag- criteria as for private enterprises. State enter-ers. For this to occur, politicians and bureau- prises were required to pay a 10 percent re-crats must state thieir objectives explicitly and turn on assets as a dividend, and moniey losersagree to weights that reflect their priorities, were required to sell assets to pay their divi-empower a supervisory body to translate these dend. The govcrnment privatized almost allobjectives into monitorable targets negotiated commercial and financial firms and most utili-with managers, punish and reward managers ties, allowing it to concentrate its supervisionon the basis of their performance, and keep on relatively few firms (such as the water andany promises made in the contract. Few of these sewerage companies).actions occurred for the contracts studied.
Do these findings mean that World Bank opera-Why would governments sign performance tions should not support or encourage perfor-contracts and then not try to make them work? mance contracts? Although the studies found fewSome governments may have been motivated successful contracts, they did show that in thoseto pledge actions that were politically unreal- rare cases where a performance contract is prop-istic because it enabled them to meet condi- erly written, it can improve efficiency. But theytions of a World Bank loan. Some governments also found that performance contracts can domay have underestimated the political costs of harm. If targets are set too low, managers mightadhering to a performance contract, such as reduce their efforts to improve performance. Andfiring politically loyal but underperforming flawed targets can have perverse effects, as inmanagers, paying incentives that might raise a the case of India's electricity company. Since amanager's salary well above a minister's, shift- well-designed and carefully enforced perfor-ing funds from other purposes to pay electric- mance contract can be as politically costly as aity bills, or allowing overstaffed state enterprises well-designed privatization, performance con-to lay off workers. All governments seem to tracts are not likely to be successful in countrieshave underestimated the extent of their infor- that lack the political will to privatize, wheremation disadvantage relative to managers. they may be viewed as a soft alternative to
privatization. The findings suggest that perfor-Improving enterprise performance mance contracts should be used only where gov-
ernments are politically prepared to make toughChile's successful experience in reforming its decisions and the contract is part of a broaderstate enterprises points to actions that are key package of state enterprise reforms.to improving efficiency: Chile increased com-petition by ending any legally mandated statemonopolies and barriers to entry, reducing Referencesimport tariffs to 10 percent across the board,breaking up monopolies in such sectors as elec- Shirley, Mary, and Lixin Cohn Xo 1997a Eprl Effeseror-maunce Contracts: Evidence from China.' WVorld Bank, Develop-tricity, and pushing state enterprises to con- ment Research Group, Washington, D.C.tract out competitive activities under strict rules c 1997b. "Information, Incentives, and Commitment: An Empiri-of competitive bidding. It placed state enter- Analysis of Contracts between Government and State Enter-
poses.' Policy Research Working Paper 1769. World Bank, Devel-prises under private commercial law, and mem- opment Researclh Group, Washington, D.C.
bers of the boards of directors became liable WXorld Bank. 1995. BureaucratsinBusiness, The Economics and Poli-
for their decisions. Private parties were named tics ofGouernment Oumberhip. Newv York: Oxford University Press.
to boards, and boards were kept small (fivepeople) to reduce the political value of keep- Mary Shirley, Research bfanager Developmenting companies public. The government elimi- Research Group

41
Private Participation in the Water and SewerageSector-Recent TrendsGisele Silva, Nicola Tynan, and Yesim Yilmaz
In developing countries private sector partici- in recent years decentralized responsibility for The PPI Projectpation in water and sewerage is a relatively water and sewerage services to municipal or Database covers
private participationrecent phenomenon. Before 1990 almost all de- provincial governments, which often had little in infrastructure inveloping countries relied on government pro- experience with private sector contracting and developing countries.vision of water supply and sewerage services; regulation and were thus relatively unlikely to The database records
details of all projectsprivate participation in the sector was rare. The initiate private transactions. owned or managed bypotential for gains from private sector involve- private companies in
ment, through greater efficiency and improved Between 1984 and 1990 developing countries 1984-97 in the water,energy, transport, and
access to finance for new investments, was as awarded contracts for only eight water and sew- telecommunicationsgreat in water and sewerage as in other infra- erage projects to private companies. The pri- sectors. This Notestructure sectors. But governments' willingness vate capital investment in these projects was focuses on private water
and sewerage projectsto take the steps to secure private participa- US$297 million.' Since 1990 private participa- that reached financial
tion was relatively limited. In many countries tion in the water sector in developing countries closure between 1990
water continued to be treated as a social rather has accelerated (figures 1 and 2). The number and 1997 and surveys
than an economic commodity. There was con- of private water projects reaching financial clo- regional trends rtypeof private participation,siderable political resistance to raising tariffs sure increased more than tenfold between 1990 project size, and topto cost recovery levels, increasing the risk of and 1997, though private involvement is still sponsors and operators.
See box I for anlong-term investment in water and sewerage small relative to public provision in the water explanation of the PPI
assets. In addition, many national governments sector and to private participation in other project criteria anddatabase terminology.
FIGURE 1 CUMULATIVE WATER AND FIGURE 2 CUMULATIVE NEW CAPITALSEWERAGE PROJECTS WITH EXPENDITURE IN PRIVATE WATERPRIVATE PARTICIPATION IN AND SEWERAGE PROJECTS INDEVELOPING COUNTRIES, 1990-97 DEVELOPING COUNTRIES, 1990-97
100 1997 US$ millions25.000
8020,000
60 15,000
40 10,000
20 5.000
0 01990 1991 1992 1993 1994 1995 1996 1997 1990 1991 1992 1993 1994 1995 1996 1997
Source: PPI Project Database. Source: PPI Project Database.

42 Private Participation in the Water and Sewerage Sector-Recent Trends
TABLE 1 PRIVATE WATER AND SEWERAGE PROJECTS INDEVELOPING COUNTRIES, BY REGION, 1990-97
infrastructure sectors (particularly energy; seethe next issue for data on private participationin the energy sector).
By the end of 1997 private companies operat-East Asia and the Pacific 30 11,913 ing in developing countries had reached finan-Europe and Central Asia 15 1,499 cial closure on US$25 billion of investment inLatin America and the Caribbean 40 8,225 water and sewerage projects. In total, ninety-MiddleEastandNorthAfrica 4 3,275 seven projects had been implemented in
Sub-Saharan Africa 8 37 thirty-five developing countries, ranging frommanagement contracts to leases, concessions,
Total 97 24,950 divestitures, and greenfield build-operate-own(BOO) or build-operate-transfer (BOT) arrange-
Note:Datamaynetsumrtotetalbecauseofrounding. ments. This Note provides an overview of pat-Source: PPI Project Database. terns and trends in these projects.
Sector trendsFIGURE 3 PRIVATE PARTICIPATION IN WATER AND SEWERAGE
IN DEVELOPING COUNTRIES, BY REGION, 1990-97 The PPI Project Database reveals the follow-ing trends in private participation in water and
Projects sewerage:Europe and *A regional and national concentration of privateCentralsAsia water projects, reflecting varied government
efforts to create conditions for sustainable pri-
East Asia and Sub-Saharan Africa vate involvement through pricing, regulatory,the Pacific and institutional reforms, but also a ripple ef-
Middle East and fect from growing governmnent familiarity with. _ l _ North Africa private involvement in the sector.
* A dominance of concession contracts com-pared with divestitures, BOT contracts, leases,andc managemlent contracts.
Latin America * A few international companies sponsoringand the Caribbean 42% and operating most major projects. But the
number of companies involved in private
Total investment contracts is growing, and it remains too earlyMiddle East and to tell whether other new entrants will in-
13% North Africa crease their international presence.. g Mlddle ~Europ and
East Asia and Central Afia Latin America and East Asia dominatethe Pacific - ran Africa
A regional breakdown of private sector involve-rnent in the water and sewerage sector shows
- ~~~~~~~~a concentration of projects in Latin America
- Latin America ~~~~and the Caribbeani and East Asia and the Pacifican mte Cribban (table 1 and figure 3). This regional concentra-
Caribbeantion is similar to that in energy and transport.The growth of the sector in these two regionscoincides with the opening of markets and,
Source. PPI Project Database, particularly in Latin Amnerica, progress toward

The World Bank Group 43
BOX 1 PPI PROJECT DATABASE: PROJECT CRITERIA AND DATABASE TERMINOLOGY
Database coverage significant investment risk. This category
* To be included, a project must have reached includes build-transfer-operate, build-lease-
financial closure and directly or indirectly transfer, and build-rehabilitate-operate-transfer
serve the general public. contracts as applied to existing facilities.
* Sectors covered are energy, water, transport, Greenfield projects-A private entity or a
and telecommunications. public-private joint venture builds and
• The water sector includes the following operates a new facility. This category includes
subsectors and segments: potable water build-operate-transfer and build-operate-own
treatment and distribution and sewage contracts.
collection and treatment. Divestitures-The state sells an equity stake
* Moveable assets, incinerators and stand- to private entities; this may or may not involve
alone solid waste projects, and small projects private management. This category includes
such as windmills are excluded. full and partial divestitures.
* The period covered is 1984-97.
• The countries covered are developing Definition of financial closure. For greenfield
countries, as defined and classified by the projects and for operations and maintenance
World Bank, in East Asia and the Pacific, contracts with major capital expenditure
Europe and Central Asia, Latin America and financial closure is defined as the existence of a
the Caribbean, the Middle East and North legally binding commitment of equity holders or
Africa, South Asia, and Sub-Saharan Africa. debt financiers to provide or mobilize funding for
the project. The funding must account for a
Definition of private participation. The private significant part of the project cost, securing the
company must assume operating risk during the construction of the facility. For operations and
operating period or assume development and management projects a lease agreement or a
operating risk during the contract period. In contract authorizing the commencement of
addition, the operator must consist of one or management service must exist. For divestitures
more corporate entities, with signfficant private the equity holders must have a legally binding
equity participation, that are separate from any commitment to acquire the assets of the facility.
government agency.Sources
Project types * The World Wide Web.
* Operations and management contracts-The * Commercial databases.
private entity takes over the management of a * Developers and sponsors.
publicly owned enterprise for a given period. * Regulatory agencies.
This category includes management contracts
and leases. Contact. The database is maintained by the
* Operations and management contracts with Private Participation in Infrastructure Group of
major capital expenditure-These are the World Bank. For more information contact
concession contracts for existing facilities Mina Salehi at 202 473 7157 or msalehi@
under which the private entity also assumes worldbank.org.

44 Private Participation in the Water and Sewerage Sector-Recent Trends
TABLE 2 TOP FIVE DEVELOPING COUNTRIES BY TOTALINVESTMENT IN PRIVATE WATER ANDSEWERAGE PROJECTS, 1990-97
regions, following a similar project imple-mented in Casablanca in 1997. Sub-Saharan
'.'JIIIEII 3hr.iusIflhiIIM u in Africa has almost no private investment, but
_ * _ has eight management and lease contracts.Despite an early start in the region, private
Argentina 6,183 7 participation in Africa is progressing slowly. In
Philippines 5,20 3 the absence of strong commitments on tariffsMalaysia 5,030 6 and credible regulatory provisions, private com-
panies have been unwilling to take investmentTurkey 1,230 2 risk in the region. In some cases they have
Mexico 597 12 taken on a degree of commercial risk under
Source: PPI Project Database. lease contracts. In other cases private partici-pation has been limited to short-term manage-ment contracts. No country in South Asia has
TABLE 3 TOP FIVE DEVELOPING COUNTRIES BY NUMBER yet awarded a water or sewerage contract toOF PRIVATE WATER AND SEWERAGE PROJECTS, the private sector, but a number of proposals
are being considered (for example, in Tiripur,1990-97 India, and Karachi, Pakistan).
--I - 1_ A few countries lead the way
Similar to the trend in power and transport, in
China 503 13 each region a few countries have awarded themajority of the water and sewerage contracts
M'v1exico 597 12 (tables 2 and 3). In East Asia, for example, China
Brazil 583 8 has awarded thirteen contracts and Malaysia six,
Argentina 6,183 7 together representing 63 percent of the East
Malaysia 5,030 6' Asian total of thirty projects. A similar pictureemerges in Latin America, with Mexico award-
a. ihe Czech Republicalsoimpementedsixprojetsbetween WO and1997.WIfttot5l ing twelve contracts, Brazil eight, and Argen-
Source: PPI Project Database. tina seven. This pattern is largely explained bythe relative ease of implementing further projectsonce an initial project is in place, given the de-velopment of local private participation models
the establishment of credible legal and regula- and a degree of local experience with privatetory institutions. Latin American countries have transaction processes. In Argentina, for example,awarded forty private contracts, which have the availability of model contracts and regula-brought investment commitments of US$8,225 tory documents is assisting smaller cities andmillion. East Asian countries have awarded provinces in working with the private sector.thirty contracts, with investment commitmentsof US$11,913 million. 2 The relationship between total investment and
the number of projects awarded is not strong.Europe and Central Asia and the Middle East The total investment in any country dependsand North Africa have small but growing private on how and where the projects have beeninvolvement in the water sector, and recent implemented. The top three countries in termsprojects arc likcly to encourage imitation. For of number of projects-China, Mexico, andexample, the Moroccan government awarded Brazil-have awarded small contracts, and theya thirty-year concession contract for a power- account for only 7 percent of investment inwater-sewerage operation in the Rabat and Sale developing countries in the water and sewer-

The World Bank Group 45
TABLE 4 PRIVATE WATER AND SEWERAGE PROJECTS INDEVELOPING COUNTRIES, BY TYPE, 1990-97
age sector. The top three countries as ranked lby investment in private projects have awardedfewer contracts but of larger scale. Argentina, ,,
the Philippines, and Malaysia have awarded 16
percent of private projects, but they accountfor 69 percent of all private investment in water Concession 48 19,909and sewerage. Greenfield 30 4,037
Operations and management 13 n.a.Projects differ vastly in size Divestiture 6 997
Project sizes also differ within countries. In Ar- Total 97 24,950
gentina, for example, one project, Aguas n.a.Notapplicable.
Argentinas, accounts for US$4,464 million (54 Note: Data may not sum to tal because of ounding.percent) of the planned private investment in Source:PPI Project Database.
Latin America, while the country as a wholeaccounts for US$6,183 million. Similarly, in EastAsia three Philippine projects account for half FIGURE 4 PRIVATE PARTICIPATION IN WATER AND SEWERAGE INthe total investment commitments. DEVELOPING COUNTRIES, BY TYPE OF CONTRACT, 1990-97
Concessions are the most popular ProjectsOperations and management
One striking feature of the water and seweragesector is the dominance of concessions com- Greenfield i Divstiur
pared with other forms of private participation.3 *ivestiture
Concessions are attractive to governments be-cause they place full operational and investmentresponsibilities, and associated commercial andinvestment risk, with the private sector, maxi-mizing potential benefits from efficiency gainsand access to private sector financing. But theyalso require significant government commitment, Concessionsand efforts to create a credible regulatory envi-ronment for private investment. Of ninety-sevencontracts with the private sector, forty-eight areconcession contracts, accounting for 49 percent Total investmentof all water and sewerage projects and 80 per- Greenfield
cent of all private capital investment (table 4and figure 4). By contrast, in the energy sectormost private projects are greenfield projects or Divestiture
divestitures,
Differences in government objectives helpexplain differences in the contracts preferred ineach sector. In the energy sector private involve- Concessionsment has been driven largely by an increasingCoesindemand for new capacity, requiring significantprivate sector investment. In the water sectormost developing countries not only need toexpand capacity and distribution networks, but Source: PPI Project Database.

46 Private Participation in the Water and Sewerage Sector-Recent Trends
TABLE 5 PRIVATE WATER AND SEWERAGE PROJECTS INDEVELOPING COUNTRIES. BY SUBSECTOR.1990-97
Some BOT contracts also give the private spon-_*m 7 _ sor responsibility for management of the distri-
- . 1 5 ¢l | bution network, making them more like* i I l lI aconcession contracts. There are only five projects
in which the private company retains owner-ship of the facilities. All these build-operate-own
Water treatment 25 4,249 schemes are in Latin America and the Caribbean.
Full water and sewerage service 19 11,935Full water and sewerage seivice 19 11,935 Most of the greenfield projects in the sector
Water treatmnent and distribution 16 1,177 (twenty-five of thirty, with one project coveringSewage treatment 12 673 both water and sewerage) are for the construc-Water and sewerage netwotks 7 496 tion and operation of water treatment plants in
Waterdistribution 5 218 countries with an increasing demand for piped
Sewage collection and treatment 5 2,754 water. In these cases companies typically haveOther 8 3,536 a take-or-pay agreement with the municipal gov-
ernment for bulk water sales. All six greenfieldTotal 97 24.950 projects in China, for example, are for water
treatment plants. In the relatively high-income
Sote:PPI PDatamnt utbasec countries of Latin America governments haveawarded greenfield contracts to meet thle grow-ing demand for sewage treatment plants.
also face high levels of unaccounted-for water Divestitures are rareand inefficient services. The creation of newcapacity detached from the management of Divestiture of public water and sewerage assetsdistribution networks can exacerbate system is comparatively rare; six projects, all partial di-inefficiencies. The construction of new water vestitures, account for 6 percent of all watertreatment plants, for example, increases the pres- projects and only 4 percent of private investments.sure of water going into the distribution nct- This small sharc highlights the sectoral differ-work, increasing leaks. If. in addition, collections ence between water and energy in asset own-performance is poor, raising funds to meet take- ership: most water and sewerage assets remainor-pay commitments will be difficult. Greenfield in the public sector, and governments are resis-contracts often do not give the private contrac- tant to giving them up. The availability of con-tor an incentive to take these problems into ac- cession contracts as an alternative to divestiturecount. By contrast, concessions can encourage has allowed governments to maintain owner-improved management and maintenance of the ship of sector assets while delegating substan-whole network. tial responsibility and risk to the private sector.
Greenfield projects typically involve bulk Management and lease contracts are less riskywater sales
Management contracts and leases are intendedThe thirty greenfield contracts account for 31 to improve the performance of loss-making pub-percent of all projects and US$4,037 million of lic utilities while leaving the public sector pri-private investment. Almost all greenfield projects marily responsible for new investments. Fundingtake the form of BOT contracts, with owner- for this investment often comes from develop-ship reverting to the government after the ini- ment bank loans, and all investment risk is bornetial contract period. In public-private joint by the government. These types of contractsventures ownership of the assets often remains have therefore proved attractive in countrieswith the public partner during the contract term. where the private sector perceives investment

The World Bank Group 47
TABLE 6 TOP FIVE PRIVATE SPONSORS BY NUMBER OF PROJECTS, 1990-97
Total investment in projects with private participation
Sponsor Projects (1997 USS millions)
Suez Lyonnaise des Eaux 28 16,153
Vivendi Iformerly CGE) 13 5,275
Aguas de Barcelona 6 9,072
Thames Water 6 1,375
SAUR International 5 38
Source: PPI Poject Database.
TABLE 7 TOP FIVE PRIVATE SPONSORS, BY REGION, 1990-97
Number of projects
East Asia Europe and j Latin America Middle East Sub-Saharan
Sponsor and Pacific Central Asia and Caribbean and North Africa Africa , Total
Suez Lyonnaise des Eaux 11 7 6 2 2 28
Vivendi (formerly COE) 4 3 3 0 3 13
Aguas de Barcelona 0 0 6 0 0 6
Thames Water 4 1 1 0 0 6
SAUR International 1 1 0 0 3 5
Source: PPI Project Database.
risk to be high. Management contracts attempt age collection, sewage treatment) highlights the
to improve efficiency through incentive pay- greater prevalence of private sector involve-
ments based on measured performance and in- ment in water relative to sewerage (table 5).
volve minimal transfer of risk to the private Government priorities have generally given
sector. Leases do transfer commercial risk to the greater emphasis to supplying water than to
private partner, thereby creating direct incen- removing wastewater after use. Consumers are
tives to improve revenues and reduce costs. more willing to pay for water delivery service
Together, management contracts and leases con- that yields immediate and direct benefits than
stitute 13 percent of all projects. Seven of the for services such as sewage treatment, the ben-
ten projects in Africa are management contracts efits of which are more dispersed. In Asia con-
or leases. Management and lease contracts ac- tracts commonly focus solely on the water
count for all single-sector water projects in Af- sector (the national concession for sewerage
rica; all three concessions for water services in services in Malaysia is an exception, as are the
Africa also involve electricity generation, trans- Manila water and sewerage concessions in the
mission, and distribution. Philippines). By contrast, concessions cover-ing water treatment, water distribution, and
Private participation is easier in water than sewerage services, as well as BOTs for sewage
in sewerage treatment, are relatively common in LatinAmerican countries. In this region a well-
A breakdown of private involvement by sub- developed water infrastructure is more often
sector (water treatment, water distribution, sew- already in place, and increasing wealth allows

48 Private Participation in the Water and Sewerage Sector-Recent Trends
municipal governments to extend concessions Private participation in the water sector is veryto sewerage. new. The small number of projects and the
dominance of a few major international play-Few major players so far ers are characteristics of an industry in transi-
tion. Developing countries are opening theirA few major companies dominate private par- water and sewerage sectors to greater privateticipation in the water and sewerage sector in participation and giving more private opera-developing countries (see table 6 for the top tors the opportunity to gain experience in thefive sponsors by number of projects in which sector. As opportunities in developing coun-they are involved).' The top five sponsors are tries increase, water sector projects are likelyinvolved primarily in concessions and lease or to attract companies with domestic experience,management contracts, more rarely in divesti- as well as new companies. (We have recentlytures and greenfield projects. witnessed Enron's acquisition of a water com-
pany in England with the aim of expandingThe small number of major players reveals the into the water sector overseas.) Companies al-novelty of private contracts in the water sector ready operating in developing countries arecompared with other sectors. Many contracts are taking on additional projects as they acquireawarded to consortia made up of local compa- experience in the sector, but may face a con-nies, often operating in other industries, and one straint from managerial economies of scale.or two experienced international companies. A Expansion may therefore depend on new en-breakdown of the major players by region high- trants to the sector.lights even more clearly how few major inter-national players operate in developing countries I All dollar amounts are in 1997 U.S. dollars.
(table 7). Only one of the top five sponsors op- 2 Any impact of the East Asian financial crisis is likely to show in the
crates in all five developing regions. There are next update of the water project database.
signs, however, that the growth of the sector For details con cession consh ay to Privaie Gnfrastmcture Sector Mo-
will bring an increase in the number of interna- nopolies" (Public Policy for the Private Sector, September 1995),
tional players. Water and sewerage contracts in- Claude Crampes and Antonio Estache, "Regulating Water Conces-
creasingly are attracting bids from consortia of sions" (Public Policy for the Private Sector, September 1996),Penelope J. Brook coweti, 'The Private Sector in Water and Saniria-multisector utility and construction companies. ton-How to Get Started" (Public Policyjbr the Private Sector, Sep-
tember 1997), and Helen Nankani, "Testing the Waters-A Phased
Conclusion Approach to a Water Concession in Trinidad and robago' (PublicPolicyforthe Private Sector December 1996).
Sponsor companies that have a small stake in a few large projects
The water sector has a long history of tariffs have an inflated market share if market share is calculated accord-
below costs and political resistance to raising ing to the total investment in projects. At the other extreme, majorresistance ~~~~sponsors that focus on management and lease contracts but under-them. Considerable government commitment is take little or no capital investment are exduded from a calculation
required to raise tariffs to cover costs, and to based on investment. Utsing the number of projects avoids this biasbuild regulator arrangements tat give private and highilights the major players in the sector better than the size ofbuild regulatory arrangements that give private projects in which each company has a stake. The number of projects
companies confidence that they can make a fair still is not a perfect measure, however, because it ignores the cross-
rate of return on their investments. Even rela- ownership between some sponsor companies and therefore doubletively low-rskcotracs,suhasmanagmcounts when two affiliated companies have a stake in the sametively low-risk contracts, such as management ptoject.
contracts and leases, still require governmentsto establish their credibility as good partners for Gse Silva, Nicola Tynan, and Yesim Yilmaz,
the private sector. While many governments are George Mason University and Private Participa-currently contemplating reforms that will make tion in Infrastructure Groupprivate participation in water and seweragepossible, only thirty-five countries in the devel-oping world have so far succeeded in imple-menting private transactions in the sector.