Public Disclosure Authorized EAST ASIA - World Bank
249
Editors Kathie Krumm and Homi Kharas EAST ASIA Integrates A TRADE POLICY AGENDA FOR SHARED GROWTH
Transcript of Public Disclosure Authorized EAST ASIA - World Bank

T R A D E A N D D E V E L O P M E N T S E R I E S
ISBN 0-8213-5514-7
A Trad
e Policy A
gen
da fo
r Shared
Gro
wth
THE WORLD BANK
Emerging East Asian economies have seen their share of world exports more thantriple during the past quarter-century, and intraregional trade has driven thisgrowth. Broad measures of development in East Asia have improved at the same
headlong pace. Why push further integration now? Two economic events of historicproportions provide the context: strategic rethinking of development in the region followingthe East Asian financial crisis of 1997–98 and the accession of China to the World TradeOrganization. Policymakers interested in a stable, prosperous region are concerned bymildly rising inequality within countries and a widening income gap between richereconomies and the poorest economies. Increasingly, the development agenda in theregion—with its focus on growth, jobs, and social stability—and the trade policy agen-da—with its focus on market access and competitiveness—have become intertwined.
East Asian policymakers seek to develop a coherent set of economic policies that candeliver stability, growth, and regional integration. Without attempting to be compre-hensive, East Asia Integrates offers fundamental strategies that promote cross-borderflows of trade, globally and regionally, along with domestic policies on logistics, tradefacilitation, standards, and institutions to maximize the impact of these flows on devel-opment and to distribute the gains from trade widely.
As the authors demonstrate, multilateral and regional trade initiatives must provide acompelling vision of how integration can deliver broadly shared growth and prosperityif they are to succeed. In addition, they must use the momentum offered by tradeagreements to address the links between trade on the one hand, and social stability,poverty reduction, and growth on the other.
EditorsKathie Krumm and Homi Kharas
EAST ASIAIntegrates
A TRADE POLICY AGENDA FOR SHARED GROWTH
Pub
lic D
iscl
osur
e A
utho
rized
Pub
lic D
iscl
osur
e A
utho
rized
Pub
lic D
iscl
osur
e A
utho
rized
Pub
lic D
iscl
osur
e A
utho
rized
Administrator
28041


east Asia integratesA Trade Policy Agenda for Shared Growth


east Asia integratesA Trade Policy Agenda for Shared Growth
Kathie Krumm and Homi Kharas, Editors
A copublication of the World Bank and Oxford University Press

© 2004 The International Bank for Reconstruction and Development / The World Bank1818 H Street, NWWashington, DC 20433Telephone 202-473-1000Internet www.worldbank.orgE-mail [email protected]
All rights reserved.
1 2 3 4 06 05 04
A co-publication of the World Bank and Oxford University Press.
The findings, interpretations, and conclusions expressed here are those of the author(s) and do notnecessarily reflect the views of the Board of Executive Directors of the World Bank or the governmentsthey represent.
The World Bank cannot guarantee the accuracy of the data included in this work. The boundaries,colors, denominations, and other information shown on any map in this work do not imply on the part ofthe World Bank any judgment of the legal status of any territory or the endorsement or acceptance ofsuch boundaries.
Rights and PermissionsThe material in this work is copyrighted. No part of this work may be reproduced or transmitted in
any form or by any means, electronic or mechanical, including photocopying, recording, or inclusion inany information storage and retrieval system, without the prior written permission of the World Bank.The World Bank encourages dissemination of its work and will normally grant permission promptly.
For permission to photocopy or reprint, please send a request with complete information to the Copy-right Clearance Center, Inc., 222 Rosewood Drive, Danvers, MA 01923, USA, telephone 978-750-8400, fax978-750-4470, www.copyright.com.
All other queries on rights and licenses, including subsidiary rights, should be addressed to the Officeof the Publisher, World Bank, 1818 H Street NW, Washington, DC 20433, fax 202-522-2422, e-mail [email protected].
ISBN 0-8213-5514-7
Cover photo: World Bank
Library of Congress Cataloguing-in-Publication data has been applied for.
Foreword xi
Acknowledgments xiii
Overview xvKathie Krumm Homi Kharas
PART I WIDENING OPPORTUNITIES IN TRADE ARRANGEMENTS 1
1. China’s Accession to the WTO: Impacts on China 3William J. MartinDeepak BhattasaliShantong Li
2. Regional Impact of China’s Accession to the WTO 21Elena Ianchovichina Sethaput Suthiwart-Narueput Min Zhao
CONTENTS

vi East Asia Integrates
3. New Regionalism: Options for East Asia 39Mari Pangestu Sudarshan Gooptu
4. Market Access Barriers and Poverty in Developing East Asia 59Bijit Bora with additional material by Paul Brenton and Takako Ikezuki
PART II DEVELOPMENT ORIENTATION FOR A BEHIND-THE-BORDER AGENDA 75
5. Trade and Logistics: An East Asian Perspective 77Robin Carruthers Jitendra N. Bajpai David Hummels
6. Protecting Industrial Inventions, Authors’ Rights, and Traditional Knowledge:Relevance, Lessons, and Unresolved Issues 95Manjula Luthria Keith E. Maskus
7. Trade and Competitiveness Aspects of Environmental and Labor Standards in East Asia 115Keith E. Maskus
PART III REINFORCING SOCIAL STABILITY THROUGHBROAD SHARING OF BENEFITS 135
8. Household Welfare Impacts of China’s Accession to the WTO 137Shaohua Chen Martin Ravallion
9. Trade in Sectors Important to the Poor: Rice in Cambodia and Vietnam and Cashmere in Mongolia 149Jehan Arulpragasam Francesco Goletti Tamar Manuelyan Atinc Vera Songwe
10. Trade and Labor Market Vulnerability in Indonesia,Republic of Korea, and Thailand 171François BourguignonChor-ching Goh
Authors and Their Affiliations 189
Index 191

FIGURESFigure 1 Trends in Regional Trade xviiiFigure 2 Intraregional Trade xixFigure 3 China’s Trade in Third-Country Markets xxFigure 4 Reduced Agricultural Protection in China xxiFigure 5 Chinese Imports, 1995 and 2005 xxiiFigure 6 Regional Trade Arrangements xxviFigure 7 Inland Transport Costs for Remote Regions xxixFigure 8 Expanded Exports to APEC from Improvements in Trade Facilitation xxxFigure 9 Costs of Producer Services xxxFigure 10 Regulatory and Competitive Reforms, Selected Countries xxxiiFigure 11 Geographic Distribution of Bilateral Trade Treaties xxxiiiFigure 12 Environmental and Labor Standards, East Asia xxxivFigure 13 Poverty and Inequality xxxviFigure 14 Effects of China’s Accession to WTO on Household Incomes xxxviiFigure 15 Trade and Stability in Labor Markets, Republic of Korea xxxixFigure 2.1 Exports to China from East Asia Compared with Exports to
Other Partners 22Figure 2.2 China’s Imports, 1995 and 2005 23Figure 2.3 China’s Growing Role in Production Networks 24Figure 2.4 Impact of China’s WTO Accession on Japan and East Asia’s NIEs, 2001–10 26Figure 2.5 Impact of China’s WTO Accession on Developing Economies of
East Asia, 2001–10 27Figure 4.1 Real Income Gains in Developing East Asia from Agricultural Liberalization 60Figure 5.1 Potential Contribution of Transport to Economic Growth in East Asia 79Figure 5.2 Poverty and Accessibility in Lao PDR 82Figure 6.1 Comparison of Patenting Trends, Republic of Korea and Major
Developing Countries, 1978–99 97Figure 6.2 Comparison of Korean Semiconductor Patents with Worldwide
Semiconductor Patents, 1976–99 98Figure 6.3 Comparison of Korean Semiconductor Patents with Semiconductor
Patents of Major Advanced Countries, 1976–99 98Figure 6.4 Citations of Korean Patents as a Proportion of Total Patent Citations,
by Types of Patent Applicants, 1986–99 101Figure 6.5 Self-Citation Rates of Korean Private Corporations, 1980–99 102Figure 6.6 Korean Patents Granted in the United States, Selected Industries, 1981–99 102Figure 8.1 Poverty Incidence Curves: Rural 141Figure 8.2 Poverty Incidence Curves: Urban 142Figure 8.3 Mean Gains by Provinces: Absolute Gains in Yuan Per Capita 143Figure 8.4 Mean Gains by Provinces: Proportionate Gains in Percent 143Figure 8.5 Mean Gains by Provinces: Percentage of Gainers 144Figure 8.6 Mean Gains in Yuan, by Income Percentile 144Figure 8.7 Mean Percentage Gain, by Income Percentile 145Figure 8.8 Percentage of Gainers, by Income Percentile 145Figure 9.1 Profit Shares for Rice Value Chain, Cambodia and Vietnam 155Figure 9.2 Profit Structure of Rice Value Chain, Cambodia and Vietnam 161Figure 9.3 Share of Cashmere Products in Mongolia’s Total Cashmere Exports,
1993–2001 166
Contents vii

Figure 10.1 Decade Averages of Import Tariffs for Manufacturing Industries:Indonesia, Republic of Korea, and Thailand, 1980s and 1990s 174
Figure 10.2 Average Log of Real Wages of Males by Broad Sectors (Manufacturing,Services and Construction, and Others) and by Trade Exposure (Low, Medium, and High): Republic of Korea, 1976–2000 177
Figure 10.3 Average Log of Real Wages of Males by Broad Sectors (Manufacturing and Services) and by Trade Exposure (Low, Medium, and High):Thailand, 1991–2000 178
Figure 10.4 Average Log of Real Wages of Males by Broad Sectors (Manufacturing and Services): Indonesia, 1986–1999 178
Figure 10.5 Standard Deviation of Log of Real Wages of a Male Cohort in Low,Medium, and High Trade Exposure Industries: Republic of Korea,1976–2000 179
Figure 10.7 Average Monthly Hours Worked of a Male Cohort in Manufacturing and Services: Thailand, 1991–2000 180
Figure 10.6 Distribution of Employment Status and Employment Sectors ofa Male Cohort: Republic of Korea, 1985–2000 180
Figure 10.8 Estimated ρ by Birth Year Cohort: Republic of Korea, 1929–69 183Figure 10.9 Vulnerability by Sectors and Trade Exposure Groups: Republic of Korea,
1976–2000 184Figure 10.10 Vulnerability by Gender and Educational Attainment: Thailand, 1991–2000 185
TABLESTable 1 Effects on Economic Welfare of Various Regional Trade Proposals xxivTable 2 Structure of Manufactured Exports by Country, 1985 and 1996 xxixTable 1.1 Some Measures of Import Protection in China’s Agriculture 8Table 1.2 Protection of Industrial Sectors in China 10Table 1.3 Impacts of Reduction in Protection Required by WTO Accession from
2001 Tariff Levels, China 14Table 2.1 Weighted Average Tariffs Facing Exports to China: Indonesia and
Thailand, 2001–08 28Table 2.2 Shares of Exports to China Affected by Lifting of Quantitative
Restrictions (QRs): Indonesia and Thailand 28Table 2.3 Market-by-Market and Product-by-Product Analysis of Indonesian Exports:
China’s Market Share and Closeness of Unit Value (UV) as Proxies for Potential Risk 29
Table 2.4 Market-by-Market and Product-by-Product Analysis of Thai Exports:China’s Market Share and Closeness of Unit Value (UV) as Proxies for Potential Risk 30
Table 2.5 Share of Exports to China Affected by Lifting of Quantitative Restrictions (QRs): Cambodia and Lao PDR 33
Table 2.6 Market-by-Market and Product-by-Product Analysis ofCambodian Exports: China Market Share and Closeness of Unit Value (UV) as Proxies for Potential Risk 34
Table 2.7 Market-by-Market and Product-by-Product Analysis of Lao PDR’s Exports: China Market Share and Closeness of Unit Value (UV) as Proxies for Potential Risk 35
Table 3.1 Proposed and Actual Regional Trading Arrangements Involving East Asian Countries 42
viii East Asia Integrates

Table 4.1 Frequency of HS4 Lines in Top 30 Exports of Developing East Asia by Value 61Table 4.2 Key Markets for East Asian Agricultural Exports 62Table 4.3 Commitments and Average Direct Domestic Support Levels, 1995–98 64Table 4.4 Simple Average MFN Applied Tariff Rates by MTN Category,
Selected Asian Countries and Major Trading Partners 66Table 4.5 Trade Policy Structure of European Union, Japan, and United States
for Imports from East Asian Countries 68Table 4.6 Tariff Escalation for Selected Products in Selected Markets
and ASEAN Free Trade Area 69Table 4.7 Nontariff Measures Affecting Products of Interest to Developing
East Asia Economies 71Table 5.1 Availability of Transport Infrastructure 79Table 5.2 Composition of Logistics Costs of Container Transport from Inland China
(Chongqing) to U.S. West Coast 84Table 5.3 Container Movements at Selected East Asian Ports, 1995–2001 85Table 5.4 Customs Clearance Times 87Table 5.5 Electronic Data Interchange and Transport E-Commerce in
Selected Countries 88Table 5.6 Ranking of Major Freight Airports in East Asia, 2001 89Table 6.1 Research Productivity of Selected Countries 100Table 7.1 Ratifications of Fundamental ILO Conventions Covering Worker Rights,
Selected East Asian Countries 117Table 7.2 Overall Ranking of Labor Standards 119Table 7.3 Impacts of Labor Standards on Labor–Intensive Exports from
Developing Countries 122Table 7.4 Environmental Policy Indexes 127Table 7.5 Impacts of Environmental Standards on Pollution-Intensive Exports
from Developing Countries 128Table 8.1 Predicted Aggregate Impacts on Welfare of Rural and Urban Households 141Table 9.1 Rice in Cambodia and Vietnam 153Table 9.2 Land Size and Rice Profit, Cambodia and Vietnam 154Table 9.3 Rice and Income of the Poor, Cambodia and Vietnam 154Table 9.4 Strategic Options for Rice, Cambodia and Vietnam 158Table 9.5 Effects of Various Policy Options on Rice Production, Income,
and Exports: Cambodia and Vietnam 159Table 9.6 Qualitative Analysis of Strategic Options, Cambodia 159Table 9.7 Marketing Costs and Margins for Rice in Cambodia, 2002 160Table 9.8 Marketing Costs and Margins for Export Rice in Vietnam, 2002 160Table 9.9 Marketing Margins of Farmers in Cambodia, Vietnam, Thailand,
and United States 161Table 9.10 Cashmere in Mongolia 162Table 10.1 Average Import Tariffs (Applied Duty Rates) and Percentage Change
in Tariffs of Indonesia, Republic of Korea, and Thailand between 1980s and 1990s 173
Table 10.2 Core Nontariff Barrier Measures: Indonesia, Republic of Korea,and Thailand, 1989–99 175
Table 10.3 Decade Average Shares of Import Tax Revenue in Total Government Revenue and Total Trading: Indonesia, Republic of Korea, and Thailand,1980–2000 175
Contents ix
Table 10.4 Volatility of Annual Growth Rates in GDP and Value Added in Manufacturing, Measured by Coefficient of Variation: Indonesia,Republic of Korea, and Thailand, 1970–96 176
Table 10.5 Level and Fluctuation of Wage Growth Rates (Males) by Trade Exposure Groups: Republic of Korea, 1976–1997 176
Table 10.6 Estimated ρ2 Correlation of Variance of Residual Earnings by Education,Gender, and Sector: Indonesia 183
Table 10.7 Vulnerability by Education, Gender, and Sector: Indonesia, 2001 184
BOXESBox 3.1 Forms of Regional Preferential Trading Arrangements 40Box 3.2 “Early Harvest” 52Box 4.1 Global Trade in Rice 65Box 5.1 Successful Integration of Ports and Land Transport Networks:
Republic of Korea 88Box 6.1 Protection of Indigenous Knowledge in the Philippines 111Box 9.1 Value Added from Value Chains 152
x East Asia Integrates

This collection of studies focuses on one of themost important economic issues facing East Asianand Pacific nations today. We have titled this collec-tion East Asia Integrates: A Trade Policy Agenda forShared Growth to capture three forces operating inthe region.
• First, a strong force for policy integration issweeping through the region, and it has gath-ered strength since the 1997–98 Asian financialcrisis. This new regionalism in East Asia is basedon a strategic re-rethinking of what needs to bedone to bolster growth and stability across theregion.
• Second, trade policy has gained prominence as acentral force, in part because trade within theregion has been one of the dynamos of growthin recent years, accounting for almost 90 percentof East Asian export growth in 2002, and in partbecause of the historic accession of China to theWorld Trade Organization in November 2001.Other countries in the region will have to adapttheir own national development strategies asChina adjusts to its new commitments.
• The third force is the determination that EastAsia should develop strategies to narrow the gapbetween richer and poorer countries andbetween urban and rural households to promoteregional stability and reduce poverty.
This is a very broad agenda, and, of course, nosingle volume can tackle all the problems in depth.But in launching this work we felt it was importantto broaden the approach beyond the technical per-spective of trade policy to emphasize developmentoutcomes and the links to social stability. Increas-ingly, the development agenda in the region—withits focus on growth, jobs, and social stability—andthe trade policy agenda—with its focus on marketaccess and competitiveness—have become inter-twined. Economic integration is a growing force,and we want to ensure it is managed carefully sothat its benefits can be shared broadly by poorercountries and the poor within countries.
To be sure, East Asia is a very diverse region, andour analysis shows that there is no one-size-fits-allapproach. Yet the studies included here suggestseveral policy priorities for East Asia as well as
xi
FOREWORD

directions for further empirical analysis that wouldcarry policymaking to a conclusive stage. It isimperative that all countries have the capacity toundertake detailed analysis on these priorityissues, because today there is an urgency to thepolicymaking process. Negotiating positions arenow being developed for an array of regional andbilateral agreements and for the Doha Develop-ment Agenda after Cancun. The stakes are high, sowe must move from debate and academic discus-sions to the real world of negotiations and concretepolicies.
The World Bank has a long and proud traditionof supporting the expansion of trade in East Asiaand around the world as a crucial tool in promot-ing growth and development. But this support doesnot mean a blind adherence to lower tariffs andreduced nontariff barriers. It does mean support-ing measures to ensure that the opportunitiesafforded by trade are available to everyone and ben-
efit everyone. Thus this volume contains studies onagriculture, market access for the goods producedby the poor, logistics to connect far-flung producerswith markets, environmental and labor standards,income and employment vulnerability, and theeffects on households of opening trade. A compre-hensive approach is needed to link trade to devel-opment and poverty reduction, and we urge policy-makers to develop such a comprehensive approachin their national development strategies, in theirregional and bilateral agreements, and in theirglobal negotiating positions.
We hope you, the reader, will find the studies inthis volume interesting and that in turn you willcontribute your voice to this critical debate.
Jemal-ed-din KassumVice President
East Asia and Pacific RegionWorld Bank
xii East Asia Integrates

ACKNOWLEDGMENTS
We have benefited from the input and guidance ofnumerous colleagues and officials who have supportedthe analysis underpinning this volume. We would liketo express our particular appreciation to the authors ofthe chapters and the background papers. Earlier draftsof the chapters and the main findings were presentedat seminars and workshops throughout East Asia,including Bangkok, Beijing, Hanoi, Jakarta, PhnomPenh, Seoul, Singapore, Tokyo, Ulaanbaatar, and Vien-tiane. We would like to thank the organizers, includingthe Institute for Southeast Asian Studies at theNational University of Singapore, the DevelopmentResearch Center and Tsinghua University in China, theThailand Development and Research Institute, and theWorld Bank Institute, as well as the staff of the countryoffices of the World Bank. We also benefited frominteraction with scholars and policymakers at theFourth Asia Development Forum on Trade andPoverty held in Seoul and organized jointly with theKorean Institute for International Economic Policy, theKorea Development Institute, and the Asia Develop-ment Bank. Valuable comments and contributionswere provided, and we would like to thank all of thosewho participated in these seminars as moderators, dis-cussants, and presenters. Special thanks go to
Narongchai Akrasanee, Ataman Aksoy, Myrna Austria,Choong Yong Ahn, Florian Alburo, Kanemi Ban, Dou-glas Brooks, Siow Yue Chia, Lu Ding, Carsten Fink,Yujiro Hajami, Masahiro Kawai, Jeffrey Lewis, Mai Lu,Aaditya Matoo, Deunden Nikomborirak, Hadi Soesas-tro, Jomo Sundaram, Somkiat Tangkitvanich, JoseTongzan, Shujiro Urata, Dominique Van der Mens-brugghe, Sangui Wang, John Wilson, Lan Xue, andIppei Yamazawa.
The views expressed in this book are those of theauthors and should not be attributed to any particularinstitution, including institutions with which individ-ual authors may be associated, including the WorldBank and the World Trade Organization.


Emerging East Asian economies1 have seen theirshare of world exports more than triple during thepast quarter-century, from 5.4 percent in 1975 to19.8 percent in 2002. Their trade with one anotherhas grown faster than their trade with any othermarket and now makes up 7.2 percent of globaltrade.2 Broad measures of development in East Asiahave improved at the same headlong pace; since1990 more than 300 million people have seen theirincomes rise above a poverty threshold of US$2.00a day.3
But performance has varied sharply over timeand across the region. Most recent trends showmildly rising inequality within countries, includingChina, Vietnam, and the Philippines, and a widen-ing income gap between richer economies such asSingapore and Hong Kong (China) and the poor-est, Lao People’s Democratic Republic (Lao PDR)and Cambodia.4 Both trends are of concern to pol-icymakers interested in a stable, prosperous region,and both trends have been linked with economicliberalization.
Against this background, some analysts estimatethat East Asia would still benefit more than anyother region from global liberalization (WorldBank 2002c)—because of the potential shown byits dynamic exporters—and that it could achievemuch of the benefits of liberalization throughregional integration—because of the wide scope ofintraregional trade among what are very diverseeconomies. The potential gains to the region fromglobal liberalization are estimated at hundreds ofbillions of U.S. dollars by 2015. Increasingly, thedevelopment agenda in the region, with its focus ongrowth, jobs, and social stability, and the trade pol-icy agenda, with its focus on market access andcompetitiveness, have become intertwined.
Pursuit of a “trade for development” strategy inEast Asia will not be easy. It involves economicchange at a time when policymakers are trying tomanage major financial and corporate restructur-ing, repair overstretched social safety nets, respondto the challenges posed by China, listen to thegreater plurality of voices and interest groups com-
xv
OverviewKathie Krumm
Homi Kharas
peting for political power, and adapt to sometimesvicious global economic cycles. Given that stabilityis seen as a key to investor confidence and a returnto high growth, it is not surprising that there isresistance to still further change.
Why Push Integration Now?
Two economic events of historic proportions pro-vide the context for East Asian development today.
The first event, the currency and financial crisisof 1997–98, still affects every aspect of economicpolicymaking. The crisis shattered a deeply heldand broadly shared view of the policy keys to devel-opment success, and called for a review of whatnow needs to be done to build on the basic tenets ofmacroeconomic stability, high savings and invest-ment, rapid expansion of education, and a strongexport orientation.5 Many in the region considerthe crisis to have been a “defining moment” (WorldBank 2002b).
The second major event was China’s accession tothe World Trade Organization (WTO) in November2001—the culmination of a 15-year-long bid formembership. China’s economy is already one of thelargest in the world, and China’s prominence as aneconomic force in the region has clearly risen sincethe crisis.6 China’s strong currency and stronggrowth, set against the weakening currencies andweak growth of other developing countries in theregion, have meant that China’s gross domesticproduct (GDP) now surpasses that of the rest ofemerging East Asia combined.7 China was theworld’s largest recipient of foreign direct investmentin 2002. Moreover, with its trade growing rapidly,China has become an important destination forexports from the rest of the region, and it is a fiercecompetitor in third-country markets.8 Because of itssize and diversity, China resists easy definitions of itscomparative advantage in terms of high-tech or low-wage manufacturing, and now that it has acceded tothe WTO its comparative advantage may changeappreciably. Thus it is no surprise that many policy-makers in the region feel the need to understand thetrends at work in China before they can formulatetheir own development strategies (World Bank2002b). Typically, too, they recognize that overcom-ing the formidable challenges of implementingChina’s WTO commitments will be as important forthe rest of East Asia as it is for China itself.
The region is now shaping its responses to thesetwo events. The financial crisis has forced policy-makers to rethink the financial, trade, and invest-ment linkages that connect regional economies. Atthe same time, it has given new impetus to ideas forregional institutions to help shape commonresponses. East Asian countries had historicallypursued unilateral and nonpreferential approachesto liberalization, sealed through commitmentsmade under WTO agreements. Indeed, through thecrisis market access was largely preserved. Butequally, significant gaps in the international archi-tecture were exposed, in finance, investment flows,and macroeconomic (especially exchange rate)coordination.
On the financial front of this new regionalism,the Chiang Mai initiative has created a web of swapagreements between regional central banks to bedeployed in case of future liquidity problems. TheAsian Bond Fund concept has been endorsed byseveral countries. Informal economic cooperationforums have discussed regional currency coopera-tion and a host of other economic and noneco-nomic issues.
In this context, the trade policy agenda for inte-gration—the subject of this volume—is only oneelement of a broader set of policy and institutionalchanges taking place in the region. Althoughregional trade negotiations have not advanced as faras those governing financial arrangements, manyanalysts consider them to be more fundamental andthe foundation for regional economic cooperation.Success will ultimately depend on the consistency ofapproaches among all elements of integration. Toachieve such consistency, the scope of discussionmust be broadened. To this end, the integrationagenda discussed in this volume covers three areas:
1. Widening opportunities, globally and regionally,in trade arrangements
2. A behind-the-border agenda to maximize thedevelopment impact of international commit-ments
3. Broad sharing of benefits to reinforce social sta-bility and a long-term political commitment tofurther reforms.
These areas are discussed in sections of thisoverview, and the concluding section outlines pri-ority areas for action.
xvi East Asia Integrates

Context: Recent Trends in Trade
Rapid and sustained growth in international tradehas long been a hallmark of successful growth anddevelopment strategies in East Asia. Some successstories are well known: those of the newly industri-alizing economies (NIEs) such as the Republic ofKorea, as well as middle-income economies such asMalaysia and the transition economy of China.More recent entrants to world markets that haveseen rapid export growth include low-incomeeconomies such as Cambodia and Vietnam. Tradehas been an important factor in growth in theregion, enabling progress in poverty reduction.Although the 1997–98 financial crisis interruptedthis progress, recovery since then has broughtpoverty rates in every emerging economy in theregion to record lows, and in economies like that ofVietnam, trade growth has brought with it a rapidreduction in poverty.
Intraregional trade in East Asia has grown fasterthan trade with any other market, and while thelargest economies account for the bulk of thistrade, the regional trade of most smaller economieshas also grown. Trade integration has been market-led, stemming from a combination of unilateralreforms, fulfillment of multilateral commitments,and a pattern of relocation of production processes(see Kawai and Urata 2002). Intraregional trade hasbeen driven not only by growing demand butincreasingly by improved competitiveness inregional markets, as reflected in increased marketshares (Figure 1). China has been particularlydynamic, but almost all countries increased theircompetitiveness in regional markets during1995–2001.9 This increase was accomplished with-out loss of competitiveness in other markets; EastAsia continued to expand its market shares in theEuropean Union (EU) and North American FreeTrade Agreement (NAFTA) markets in the sameperiod.
The product composition of intraregional tradehas become highly concentrated. The top 30exports now account for more than half of totaltrade, with 38 percent in just four subsectors: officemachinery, telecommunications equipment, elec-tronics, and textiles and clothing (Figure 2).
One of the major factors in the concentration ofintraregional trade has been the remarkableincrease in international production networks, as
reflected in the growth of trade in components orpartly assembled goods. China is increasingly acentral player in such production networks, both asa final assembler of products and as an efficientprovider of components. Although Japan remainsan important center of production-sharing opera-tions in East Asia and is the origin of about one-third of all regional exports of components forassembly, China is finding niches; its exports ofparts and components grew by almost $20 billionduring 1996–2001. At the same time, other EastAsian economies have been finding their ownniches within China’s markets and increasing theirshares of China’s imports.
Meanwhile, East Asian trade profiles havebecome more mutually complementary, and thedegree of complementarity for emerging East Asiais now comparable to that of the EU and NAFTA.10
The exceptions are low-income countries suchas Cambodia, Lao PDR, and, to a lesser extent, Viet-nam. This finding is perhaps not surprising, giventhat a country’s trade structure becomes more likethe world’s trade structure as the country’s incomerises. The wide gap between rich and poor coun-tries in East Asia is also largely responsible for a risein regional income inequality (see Milanovic 2003and the discussion later in this chapter). Policiesand institutions that contribute to fuller integra-tion of the low-income countries and regions ofEast Asia will be critical to addressing incomeinequality in East Asia and contributing to a stableregion.
Widening Opportunities in TradeArrangements
Today, the region’s policymakers see trade andinvestment integration as key elements of strategy.Although a few trade barriers were erected inresponse to the Asian economic crisis, they wereminor and temporary.11 Indeed, instead of moreprotection, the crisis produced a new impetus foropenness. A multitrack approach is being followed,with support for a new global round of trade nego-tiations as well as for regional and bilateral arrange-ments.
Liberalization of trade and investment policies isrecognized as a way to spur gains in efficiency. Assuch, it fits well with the new emphasis in Asia oninnovation in firms and on economy-wide produc-
Overview xvii

tivity growth to replace the old model of growththrough physical and human capital accumulation(Yusuf and others 2003). There is ample evidencethat export-oriented firms and those with foreignequity participation are far more productive than
domestic-oriented firms, with productivity differ-entials of 40 percent in Indonesia and the Philip-pines and 15–20 percent in Thailand and Korea(Hallward-Driemeier, Iarossi, and Sokoloff 2002).Moreover, China’s restructuring provides an impe-
xviii East Asia Integrates
Emerging East Asia: share of world trade
0
5
10
15
20Percent
Percent
1980
1982
1984
1986
1988
1990
1992
1994
1996
1998
2000
Emerging East Asia intraregional trade
Intraregional trade: share of export change accounted for by competitiveness
and demand changes
0
20
40
60
80
100
85–9
5
95–0
1
85–9
5
95–0
1
85–9
5
95–0
1
Competitive factora Demand factorb
With emergingEast Asia
Within emerging East Asia
Emerging EastAsia—Japan
0
5
1015
20
25
30
35
40Percent Percent
United StatesJapan
China Other East Asia
East Asia NIEs: export markets(as % of total exports)
Developing East Asia: export markets(as % of total exports)
05
10
15
2025
30
3540
1980
1982
1984
1986
1988
1990
1992
1994
1996
1998
2000
2002
1980
1982
1984
1986
1988
1990
1992
1994
1996
1998
2000
2002
United StatesJapan
China Other East Asia
FIGURE 1 Trends in Regional Trade
Note: Emerging East Asia is ASEAN plus other newlyindustrializing economies plus China plus Mongolia.Source: IMF, Direction of Trade Statistics (various years);data reported from exporter country accounts.
Note: East Asia NIEs refers to Hong Kong (China), Repub-lic of Korea, Singapore, Taiwan (China).Sources: IMF, Direction of Trade Statistics (various years);data reported from exporter country accounts.
Note: Developing East Asia refers to Indonesia, Malaysia,Philippines, Thailand, Cambodia, Lao PDR, Mongolia,Myanmar, Vietnam.Sources: IMF, Direction of Trade Statistics (various years);data reported from exporter country accounts.
Note: Diversification, or change in exports due to newproducts, accounts for a small share.a. Competitive factor = change in market share.b. Demand factor = change in market size.Source: Ng and Yeats (2003: Table 9.1).
Emerging East Asia economies’ share of world exportsgrew…and trade among these economies grew evenfaster.
Intraregional trade is driven increasingly by competitiveness and growing market share.
Exports to China are particularly dynamic, with East Asia finding niches in China’s markets.

tus for establishing new regional production net-works, initially in electronics, that would promotehighly productive firms. For now, these productionnetworks are oriented toward exports to developedcountries, but the growing markets within East Asiaprovide a potential complementary source ofdemand.12
Policies can support these natural economicforces, and the drive to liberalize is shaping new
institutional arrangements. The willingness of theworld’s richer countries to target the needs ofdeveloping countries in the context of the DohaDevelopment Agenda is helpful, but the outcome ofthese negotiations is still uncertain. And regionaland bilateral agreements fit in well with other polit-ical aims of East Asian countries, giving theseagreements a momentum that the global discus-sions have yet to achieve. ASEAN has moved to a
Overview xix
Telecom equipment
5%
Electrical machinery21%
Textiles and clothing6%
Other top 30
13%
Others49%
Office machinery
.6%
Others72%
Parts andcomponents in top 30
28%
Share of 2001 five-digit SITC parts andcomponents in top 30 exports
Share of 2001 intraregional trade accounted forby 30 largest four-digit SITC exports
FIGURE 2 Intraregional Trade
Note: SITC = Standard International Trade Classification.Source: Ng and Yeats (2003: Table 12.1).
Note: Revealed comparative advantage (RCA) measures a country’s relative export performance in a good j. It is definedas the country’s share of world exports of good j (xij/xwj) divided by its share of total world exports (Xi/Xw), where xij andxwj represent the value of good j exported by country i and the world, respectively, and Xi and Xw are country i’s andthe world’s total exports, respectively. If the value of the index exceeds unity, the country is said to have a comparativeadvantage in the production of good j.Source: Ng and Yeats (2003).
Note: In addition, parts and components in the non–top30 exports account for an additional US$8.3 billion or 4percent of total non–top 30 exports.Source: Ng and Yeats (2003: Table 17.1).
Intraregional trade is increasingly concentrated…and production sharing is a major determinant.
China is an increasingly central player in production networks.
0.5
1.0
1.5
2.0
2.5
RCA RCA
Officemachinery
Telecomequipment
Electricalmachinery
Officemachinery
Telecomequipment
Electricalmachinery
0
0.5
1.0
1.5
2.0
1996 2001
Share of components in China's importsrelative to share of components in world trade
Share of components in China's exportsrelative to share of components in world trade

two-tier system to permit its more advanced mem-bers to accelerate trade reform, while launchingnew initiatives to integrate its less-developed mem-bers—Cambodia, Lao PDR, Myanmar, and Viet-nam. At the same time, the speed with which theASEAN-China Framework Agreement has beenlaunched and the ideas for a new ASEAN-Japan arecreating new alliances in favor of liberalizationwithin the region. As Philippines president GloriaArroyo noted in a speech of May 2002, combiningthe Association of Southeast Asian Nations(ASEAN) and Chinese economies “would givebirth to a market of 1.8 billion consumers or almostone third of humanity.”
China’s Role in the Region
In line with its own reforms, China has been agrowing economic force in East Asia. Exports toChina have been dynamic over the last decade, par-ticularly for the newly industrializing economiesbut also for the rest of developing East Asia (Figure1), while shares to the United States and Japan havebeen flat or declining. China’s trade with majormarkets also has been expanding, but not at theexpense of developing East Asia (Figure 3).
Membership in the WTO and the reforms asso-ciated with membership give China an opportunityto play an even larger and growing role in the worldeconomy, and in the regional economy, amplifyingpreexisting trends.
What WTO Accession Means for China: SectoralShifts. As explained in Chapter 1, assessing theimplications of major economy-wide reform suchas that involved in China’s WTO accession is inher-ently difficult. Much of the impact will consist ofreinforcing the structural changes already underway. The experience with other trade events such asthe formation of NAFTA suggests that the actualoverall impact will be much greater than suggestedby ex ante modeling, largely as a result of produc-tivity and other changes that are hard for models tocapture.
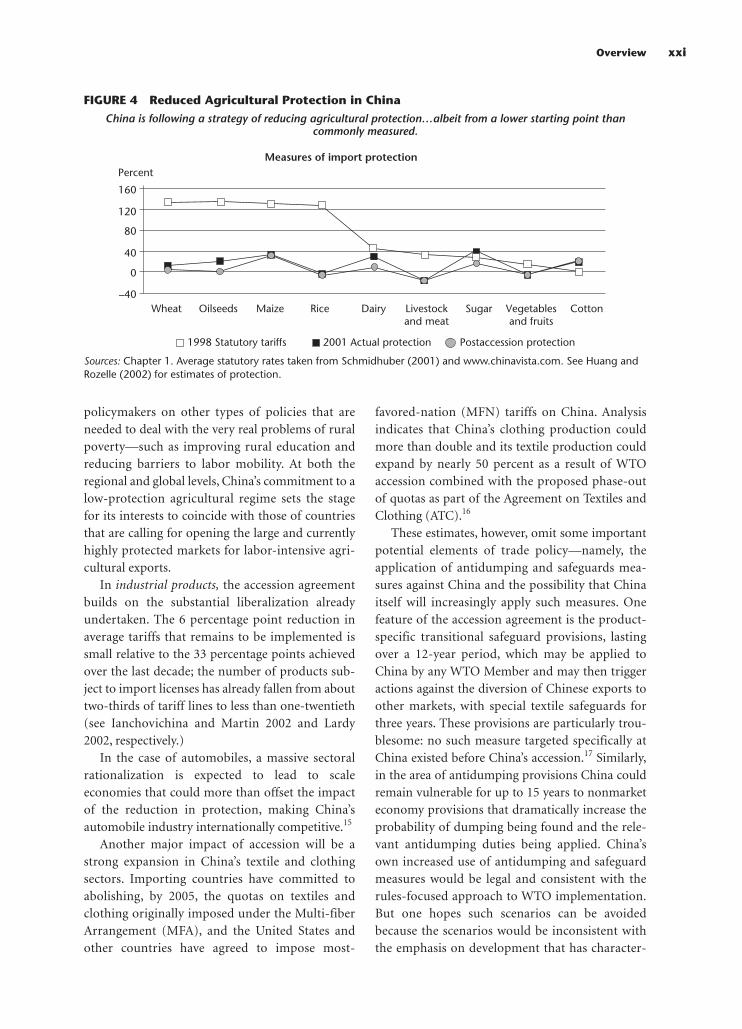
In agriculture, the initial levels of effective pro-tection are in fact likely to be far lower than othershave estimated, implying that sectoral shifts arelikely to be less dramatic than others are predict-ing.13 Nonetheless, China’s agricultural trade liber-alization plan is the expected source of about halfof the efficiency gains from the WTO accessionpackage. Reduced protection and greater scope forimports are likely in a range of products, includingoilseeds, sugar, and dairy products (where the prin-cipal form of protection has been tariffs, which arebeing reduced substantially) and cotton (whereexport subsidies are now ruled out) (Figure 4). Anddemand will sharply increase for other raw materi-als and natural resources such as wood and energyproducts.
China’s decision to contain agricultural protec-tion has more far-reaching implications.14 This useof WTO rules as a commitment device will focus
xx East Asia Integrates
Share of U.S. imports
0
5
10
Percent Percent
1969
1972
1975
1978
1981
1984
1987
1990
1993
1996
1999
2002
Share of Japanese imports
0
5
10
15
20
1969
1972
1975
1978
1981
1984
1987
1990
1993
1996
1999
2002
China
Other developing East Asia
FIGURE 3 China’s Trade in Third-Country Markets
Source: IMF, Direction of Trade Statistics (various years.)
This trade is expanding…but not at East Asia’s expense.
policymakers on other types of policies that areneeded to deal with the very real problems of ruralpoverty—such as improving rural education andreducing barriers to labor mobility. At both theregional and global levels, China’s commitment to alow-protection agricultural regime sets the stagefor its interests to coincide with those of countriesthat are calling for opening the large and currentlyhighly protected markets for labor-intensive agri-cultural exports.
In industrial products, the accession agreementbuilds on the substantial liberalization alreadyundertaken. The 6 percentage point reduction inaverage tariffs that remains to be implemented issmall relative to the 33 percentage points achievedover the last decade; the number of products sub-ject to import licenses has already fallen from abouttwo-thirds of tariff lines to less than one-twentieth(see Ianchovichina and Martin 2002 and Lardy2002, respectively.)
In the case of automobiles, a massive sectoralrationalization is expected to lead to scaleeconomies that could more than offset the impactof the reduction in protection, making China’sautomobile industry internationally competitive.15
Another major impact of accession will be astrong expansion in China’s textile and clothingsectors. Importing countries have committed toabolishing, by 2005, the quotas on textiles andclothing originally imposed under the Multi-fiberArrangement (MFA), and the United States andother countries have agreed to impose most-
favored-nation (MFN) tariffs on China. Analysisindicates that China’s clothing production couldmore than double and its textile production couldexpand by nearly 50 percent as a result of WTOaccession combined with the proposed phase-outof quotas as part of the Agreement on Textiles andClothing (ATC).16
These estimates, however, omit some importantpotential elements of trade policy—namely, theapplication of antidumping and safeguards mea-sures against China and the possibility that Chinaitself will increasingly apply such measures. Onefeature of the accession agreement is the product-specific transitional safeguard provisions, lastingover a 12-year period, which may be applied toChina by any WTO Member and may then triggeractions against the diversion of Chinese exports toother markets, with special textile safeguards forthree years. These provisions are particularly trou-blesome: no such measure targeted specifically atChina existed before China’s accession.17 Similarly,in the area of antidumping provisions China couldremain vulnerable for up to 15 years to nonmarketeconomy provisions that dramatically increase theprobability of dumping being found and the rele-vant antidumping duties being applied. China’sown increased use of antidumping and safeguardmeasures would be legal and consistent with therules-focused approach to WTO implementation.But one hopes such scenarios can be avoidedbecause the scenarios would be inconsistent withthe emphasis on development that has character-
Overview xxi
–40
40
0
80
120
160
PercentMeasures of import protection
1998 Statutory tariffs 2001 Actual protection Postaccession protection
Wheat Oilseeds Maize Rice Dairy Livestockand meat
Sugar Vegetablesand fruits
Cotton
FIGURE 4 Reduced Agricultural Protection in China
Sources: Chapter 1. Average statutory rates taken from Schmidhuber (2001) and www.chinavista.com. See Huang andRozelle (2002) for estimates of protection.
China is following a strategy of reducing agricultural protection…albeit from a lower starting point than commonly measured.
ized China’s trade reform agenda since the begin-ning of the reform era.
China’s trade in services was the subject of one ofthe most radical services reforms ever negotiated inthe WTO. The potential for rapidly increasing tradein services is significant. The important feature ofChina’s commitments is that they focus on marketaccess and do not discriminate between domesticand foreign suppliers. With China expected to bethe largest market for telecommunications in theworld by 2010, its commitments in that sector areprofound in that they allow foreign entry for a widerange of activities. One area of services with animportant bearing on trade is the activities thatmake up the logistical chain. China’s WTO com-mitments promise increased competition andreduced costs in several areas, including throughthe development of third-party logistical firms. Yetrestrictions remain in place on the form of estab-lishments, such as requirements for joint ventures,and on geographic scope.18
What WTO Accession Means for China: Ways ofDoing Business. The implications for China ofaccession to the WTO go beyond the specific com-mitments in its accession package. Changes in theways of doing business—elimination of dual pric-ing, phasing out of restrictions on trading, moreuniform administrative arrangements, and judicialreview—are likely to result in dynamic gains thatwill outweigh those based on comparative-staticestimates of efficiency gains. Every 1 percent gain in
productivity in the services sector from expandedcompetition and foreign entry, for example, implieswelfare gains of $10 billion and a real GDP increaseof 2.2 percent, equivalent to the total estimatedstatic gain from China’s accession to the WTO (Ian-chovichina and Walmsley 2002).
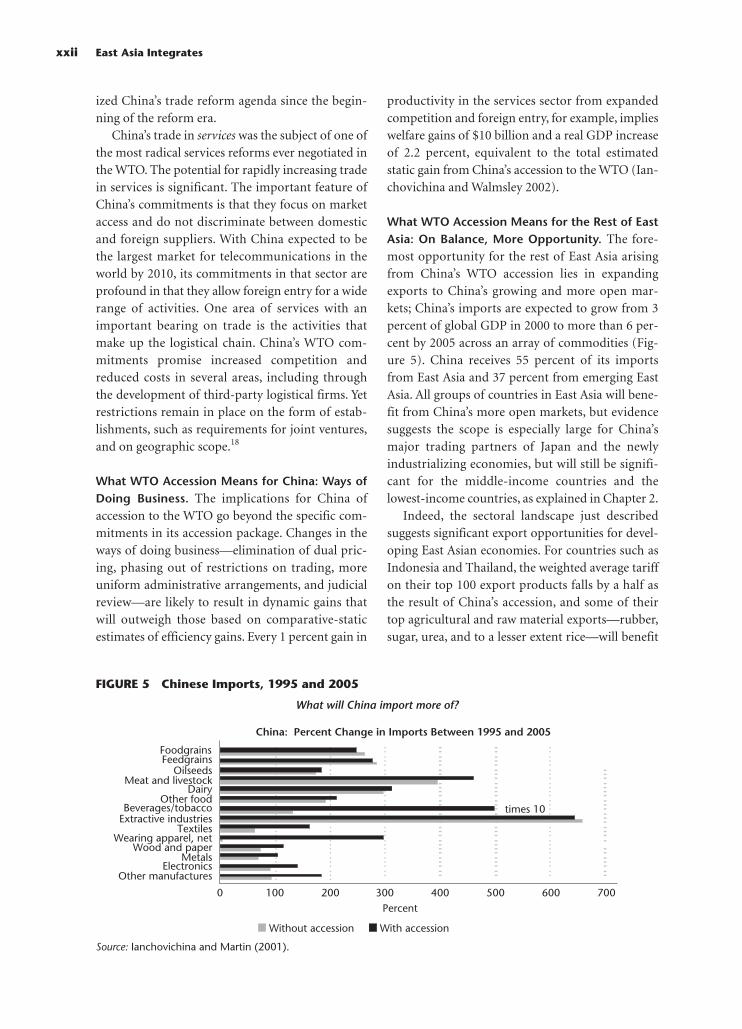
What WTO Accession Means for the Rest of EastAsia: On Balance, More Opportunity. The fore-most opportunity for the rest of East Asia arisingfrom China’s WTO accession lies in expandingexports to China’s growing and more open mar-kets; China’s imports are expected to grow from 3percent of global GDP in 2000 to more than 6 per-cent by 2005 across an array of commodities (Fig-ure 5). China receives 55 percent of its importsfrom East Asia and 37 percent from emerging EastAsia. All groups of countries in East Asia will bene-fit from China’s more open markets, but evidencesuggests the scope is especially large for China’smajor trading partners of Japan and the newlyindustrializing economies, but will still be signifi-cant for the middle-income countries and thelowest-income countries, as explained in Chapter 2.
Indeed, the sectoral landscape just describedsuggests significant export opportunities for devel-oping East Asian economies. For countries such asIndonesia and Thailand, the weighted average tariffon their top 100 export products falls by a half asthe result of China’s accession, and some of theirtop agricultural and raw material exports—rubber,sugar, urea, and to a lesser extent rice—will benefit
xxii East Asia Integrates
China: Percent Change in Imports Between 1995 and 2005
0 100 200 300 400 500 600 700
Other manufacturesElectronics
MetalsWood and paper
Wearing apparel, netTextiles
Extractive industriesBeverages/tobacco
Other foodDairy
Meat and livestockOilseeds
FeedgrainsFoodgrains
Without accession With accession
Percent
times 10
FIGURE 5 Chinese Imports, 1995 and 2005
Source: Ianchovichina and Martin (2001).
What will China import more of?

from a reduction in nontariff barriers. These coun-tries also may see increased interindustry trade andproduction sharing as China’s electronics and othermanufacturing industries, for example, grow.
For the lowest-income countries such as Cam-bodia and Lao PDR, there also will be opportuni-ties. The decline in these countries’ weighted aver-age tariff for the top 100 exports to China is quitesmall (from 4.3 to 2.6 percent for Cambodia andfrom 7.3 to 6.0 percent for Lao PDR), and onlyabout 10 percent of Cambodia’s exports and lessthan 1 percent of Lao PDR’s exports, includingwood and rubber, will face fewer quantitativerestrictions. However, given the trade intensity withChina, they will benefit from China as a powerfulsource of external demand.19
China’s accession also offers the rest of theregion the opportunity to import cheaper pro-duced goods. Most obviously, consumers of Chi-nese finished good imports will benefit. But manyproducers will also gain by access to cheaper inter-mediate inputs into production processes. Forexample, chemicals already represent nearly 10 per-cent of imports from China in Indonesia and Thai-land. By 2001 China was exporting more than $20billion in parts and components to other parts ofemerging East Asia, representing up to 20 percentof those countries’ parts and components trade.Continued growth in imports of parts and compo-nents from China will represent an opportunity forthe rest of emerging East Asia to develop competi-tive firms.
To benefit from these opportunities, it will beimportant that East Asian countries resist the grow-ing protectionist pressures for imposition of exces-sive safeguard measures in a futile effort to protectall domestic producers. In Thailand, local manufac-turers are complaining about low-cost imports ofelectrical appliances and motorbikes from China.In 2002 Indonesia imposed temporary safeguardmeasures for garment imports, and Vietnam did sofor motorbikes. Such decisions can only prolongthe shifts in production that are necessary to realizeregional comparative advantages, and distract poli-cymakers from facilitating the adjustment of work-ers through appropriate labor market and safetynet policies and programs.
China’s WTO entry also implies increased com-petition in third-country markets. If recent Chi-nese export performance (Figure 3) is an indicator,
the expansion of China’s presence in major mar-kets will not necessarily crowd out other develop-ing East Asian exports, although it may constraintheir growth prospects to levels below those of thelate 1980s.
Nonetheless, certain exports appear at risk.Clearly, the apparel and textile sectors in other EastAsian countries will face additional competition inmarkets that are currently constrained by quotarestrictions. The market-by-market and product-by-product analysis in Chapter 2 indicates that for Thai-land, for example, only about 15 percent of exportsto the United States are at risk from increased com-petition from China, but that 25 percent of exportsto Japan are at risk. For Indonesia, the second andthird most important exports to the United States—footwear and video-recording and -reproducingapparatuses—face direct competition with China, asdo about a quarter of exports to Japan.
Among lower-income countries, Cambodia isparticularly vulnerable because its exports arehighly concentrated in apparel. Roughly 30 percentof Cambodia’s exports to the United States haveunit values similar to those of Chinese exports,indicating direct competition, or are in categoriesin which China is currently quota-constrained,indicating that competition from China is likely toincrease. This prospect highlights the need forurgency; such countries must speed up their gover-nance and other reforms to ensure the develop-ment of alternative products.
Nonetheless, on balance, China represents moreof an opportunity than a threat to the rest of EastAsia. Certain challenges will need to be met, andadjustments made. However, the scope for gainsfrom a dynamic China is large across the range ofcountries in East Asia.
Regional Interdependence
Recent trends in the magnitude and composition ofintra–East Asian trade bode well for further inte-gration (also see Ng and Yeats 2003). Comparisonsshow that conditions within East Asia are now verysimilar to those in countries that were previouslyable to implement such successful regionalarrangements as the European Union and NAFTA.
East Asia has achieved a high degree of market-driven regional integration, but regionalism—moreformal economic cooperation and economic inte-
Overview xxiii

gration arrangements and agreements betweencountries—has traditionally been quite limited, asexplained in Chapter 3.20 The major exceptions havebeen the ASEAN Free Trade Area (AFTA), estab-lished in 1993, and dialogue under the Asia-PacificEconomic Cooperation (APEC) forum. However,the past several years have seen a plethora of pro-posals for new bilateral and regional trade arrange-ments: the Framework Agreement on ASEAN-China Comprehensive Economic Cooperation,signed in November 2002; an East Asia–wide freetrade agreement; a more recent proposal by Japanfor an ASEAN-plus-Japan free trade agreement; andbilateral agreements under negotiation, in particu-lar by Japan, Singapore, Korea, and Thailand.
Scope for Gains from Regionalism. Addressingintraregional barriers can ensure continueddynamism in regional trade and investmentflows—including in response to China’s growingrole. The stated motivation of several initiatives,including the ASEAN-China Framework Agree-ment, is to take advantage of complementaritiesand build on existing strengths in order to make theregion collectively more efficient and competitiveand thereby attract investment. The regional agree-ments under consideration are increasingly com-prehensive in scope, going beyond the removal oftariffs and nontariff barriers on trade in goods to
include trade facilitation measures, such as con-formity of standards and procedures acrossnational boundaries, and trade in services. TheNew-Age Partnership between Singapore and Japanannounced in January 2002 is notable in thisregard.
The countries in the region could reap worth-while economic benefits from increased regional-ism aimed at removing border barriers, accordingto analysis using the standard models for evaluatingbenefits from regional trading arrangements (Table1). As is typical in these models, the gains areshown to be greater the wider the country coverageand the wider the sectoral coverage of the regionalarrangements. Notably, the gains for ASEAN coun-tries are shown to be greater than those for theother countries in the region. Given that the lower-and middle-income countries of ASEAN are likelyto benefit less from China’s WTO accession thanthe newly industrializing economies, greaterregionalism in East Asia can help spread the gainsacross a wider set of economies.21
One danger with the current regional arrange-ments is that they have extensive provisions forexcluding sensitive sectors. Such exclusions couldsubstantially reduce the potential for welfare gainsfrom an agreement. Within AFTA, for example, thelack of progress in agriculture and other sensitivesectors has been disappointing. To give some indi-
xxiv East Asia Integrates
TABLE 1 Effects on Economic Welfare of Various Regional Trade Proposals
% of GDP (% of GDP excluding agricultural liberalization)
Proposal ASEAN China Korea, Rep. of Japan USA
China + Korea + Japan –0.26 (–0.16) +0.1 (–0.2) +1.0 (+0.6) +0.1 (+0.2) +0.0 (+0.0)ASEAN – China +0.9 (+0.5) +0.0 (+0.1) –0.1 (–0.1) +0.0 (+0.0) +0.0 (+0.0)ASEAN – Japan +1.1 (+0.2) –0.1 (–0.1) –0.2 (–0.1) +0.0 (+0.1) +0.0 (+0.0)ASEAN + 3 +1.5 (+0.6) +0.1 (–0.2) +1.1 (+0.8) +0.2 (+0.2) –0.1 (+0.0)ASEAN + 3 + CER +1.3 (+0.6) +0.0 (–0.1) +1.1 (+0.9) +0.2 (+0.2) –0.1 (+0.0)
APEC liberalization (MFN) +0.7 +0.5 +0.7 +0.4 –0.0
APEC preferential liberalization +0.8 +0.6 +0.9 +0.4 +0.0
Note: Calculations for ASEAN include only Indonesia, Malaysia, the Philippines, Singapore, Thailand, and Viet-nam. CER (Australia–New Zealand Closer Economics Relations Trade Agreement) includes Australia and NewZealand. Figures in parentheses refer to net welfare effects when agriculture is excluded.Sources: Scollay and Gilbert (2003) for free trade agreement proposals and Scollay and Gilbert (2001) for APECliberalization proposals.
cation of the importance of this point, some eco-nomic models suggest that if agriculture is includedin the ASEAN-China or ASEAN + 3 proposals, theestimated welfare gains for ASEAN countriesroughly doubles (Table 1).
The greatest welfare gains, however, are likely tocome from addressing the deeper integrationagenda being proposed here. In particular, the ben-efits from integrating trade in services and over-coming technical barriers to trade are likely to bemany times those from reducing border barriersalone.22 Gains from liberalizing services trade arefelt not only within the services sector itself, butalso within other sectors because services are vitalinputs in their production processes. As manufac-turing in East Asia moves into a phase where partic-ipating in global markets will become moredependent on services, it increasingly will be heldback by poor efficiency in the services sector, whichhas been protected from competition. Services lib-eralization in East Asia lags relative to that of otherregions, and action to integrate trade in servicescould help restore its global competitiveness. Simu-lation results from China, consistent with findingsfrom other parts of the world, indicate that evensmall productivity gains of 1 percent in servicesoutweigh those based on static border trade effi-ciency gains alone.23
The policy scope for enhancing efficiency inservices, as well as in other sensitive sectors such asagriculture, may well be wider initially in a regionalcontext than in a global one. In fact, expandingintegration into these sectors is one of the mainpotential advantages of regional, as opposed toglobal, liberalization. Most regional partnershipsalready in place or under discussion include theservices and agriculture sectors, whereas these sec-tors have proven much harder to tackle in globaltalks. Because the liberalization of services may benecessary for industries to benefit fully from theremoval of regional barriers to goods trade, it maybe preferable to give the services sector a high pri-ority from the start of any negotiations.
Making East Asian Arrangements a Stepping-stone to Global Integration. Liberalization goalscan be well served by moving on multiple fronts. Inthe East Asian goods trade, traditional concerns thata regional arrangement will merely divert, ratherthan create, trade are less worrisome because a rela-
tively low-tariff bloc already exists, and becausemany of the region’s economies, especially the moredeveloped, are moving toward lower average tariffs.To generate momentum, measures can be takenbefore the parties agree on formal arrangements.The “Early Harvest” aspect of the ASEAN-ChinaFramework Agreement exemplifies this approach.As part of the Early Harvest, the agreement providesaccelerated access for key products to China andASEAN markets (ahead of the MFN schedule that ispart of the WTO accession agreement). Also, Chinahas extended most-favored-nation status to the low-income non–WTO Member countries Lao PDR andCambodia.
The challenge in pursuing regional integrationarrangements will be to avoid the “spaghetti bowl”effect of different rules and regulations associatedwith different agreements, which can add unneces-sary administrative costs to firms doing businessacross the region and result in a bloc-ed up world(Figure 6). Such costs can be especially high when ahost of bilateral agreements are put in place, withlarge numbers of side agreements that each permitsome discriminatory treatment. Inconsistenciesbetween agreements with overlapping membershipalso can become a problem. The exchange of ideason a regional basis can help avoid such difficulties.While, in theory, there are some reasons to expectthat uncoordinated bilateral and regional agree-ments build in incentives toward global free trade,this outcome depends crucially on maintaining acommon set of principles for each agreement—that is, focusing on trade facilitation measures;allowing the most liberal rules of origin; and gener-ally contributing positively to multilateral trade lib-eralization. For example, allowing for accumula-tion under rules of origin will be important to thefacilitation of production networks in the region,and allowing for multiple rules for conferring ori-gin would make it easier for more firms to partici-pate in regional trade (see Brenton 2003b).
Unless countries tackle the sensitive sectors inregional trade arrangements—and ultimately at theglobal level—many of the potential economic ben-efits alluded to earlier will not be realized. China’sbinding to low tariff levels as part of its agriculturalpolicy therefore offers scope for the liberalization ofagriculture in a regional setting, which could set inplace a favorable political dynamic for more openagricultural sectors throughout East Asia.
Overview xxv

Another way to proceed would be to unbundleproposed agreements into components for deeperintegration that could realistically be agreed on andwould yield immediate results in terms of increasedefficiency and development of intraindustry tradeand production networks. In the case of China andASEAN, for example, two-way business transac-tions are already proliferating, and—long beforegovernment policymakers began to act—busi-nesses had recognized and responded to the Chinachallenge. Such transactions could be facilitatedand enhanced by an agreement that focuses ontrade and investment facilitation, such as customs.
It also would be preferable to focus attentionand the resources of policymakers on as fewregional arrangements as possible but to makethem broad in scope and country coverage, espe-cially for small economies that have limited capac-ity to evaluate the development implications ofthese arrangements.
Finally, a further benefit from stronger regionalcooperation could be to link issues of commoninterest to an effective multilateral stance, whetherin services liberalization or discipline onantidumping measures.
Expanding Market Access Globally
One of the motivating factors behind the move toregional integration in East Asia is disappointmentwith the pace of multilateral trade liberalization inproducts of most interest to developing countries.
As discussed in Chapter 4, a consensus appears tobe growing about the negative impact on develop-ing countries of trade barriers on products that areexported by the poor—particularly agriculturalproducts and labor-intensive manufactures such astextiles and clothing, which are the sectors thatconfront the greatest entry barriers in high-incomecountries. One of the disappointments of theUruguay Round was its failure to achieve greatermarket access in these products. The Doha Devel-opment Agenda launched in November 2001 hasthe potential to make the world trading systemmore conducive to development. It includes a largenumber of policy reforms that can and should beundertaken by high-income countries and that willgenerate significant benefits for ordinary people indeveloping East Asia.
Trade in Textiles and Clothing. As noted earlier,the textiles and clothing sector poses a special chal-lenge for East Asia. Many countries of the regionhave large garment export businesses employingsizable numbers of low-skilled workers, many ofwhom are female. These businesses will be threat-ened by competition from China in the form ofboth a macroeconomic threat to the balance of pay-ments (from lost exports) and a social threat of lostjobs and lower wage incomes for many poor house-holds.
Implementation of agreements for further tradeliberalization in textiles and garments is critical tosocial stability in East Asia. Under the Agreement
xxvi East Asia Integrates
Average tariff rates: comparison of MFN with preferential rates
02468
1012
AFTAMFN
AFTACEPT(2002)
GlobalLDCsMFN
GlobalINDsMFN
Number of articles of agreement: recent East Asia initiatives
0
50
100
150
200
AFTA ASEAN–China
JSEPA
FIGURE 6 Regional Trade Arrangements
Note: AFTA = ASEAN Free Trade Area; MFN = most-favored nation; CEPT = common effective preferential tar-iff; LDCs = less developed countries; INDs = industrialcountries.Source: World Bank (2001a) and www. aseansec.org.
Note: JSEPA = Japan-Singapore Economic PartnershipAgreement.Source: www. aseansec.org and www.mofa.go.jp.
Low-tariff bloc reduces trade diversion. Multidimensional nature of agreements compounds“spaghetti bowl” and impedes merging.
on Textiles and Clothing as part of the UruguayRound, quota restrictions were to be graduallyabolished over a 10-year period (that is, no laterthat January 2005) in three stages, and the remain-ing quotas were to be subject to a progressiveincrease in their rates of expansion. However,implementation to date has been disappointing.Acceleration of the quota phase-out under the ATCwould have a significant impact on poverty by sus-taining or increasing employment in these indus-tries. It would help maintain export growth in low-income East Asia, for example, permitting 20percent more exports from Vietnam. It also wouldhelp protect workers in middle-income economiessuch as Thailand, where it would affect an esti-mated 50,000 jobs for garment workers and 10,000jobs for textile workers, about 20,000 of whom arefrom poor households. Finally, acceleration wouldbenefit workers in the textile and clothing sector inChina—workers who are mainly women drawnfrom poor, remote regions—and could result in 5million fewer poor Chinese overall.24
At the same time, some economies in East Asiawill lose. Garment industries in several countrieshave depended on quotas, benefiting from some ofthe rents accruing from preferential access to EUand U.S. markets. Garment exports from higher-income economies such as Korea are likely todecline. And in Cambodia, in particular, ATCimplementation is likely to put pressure onemployment and wages in the garment sector.Cambodia will have to pursue a broader agenda toopen up other trade opportunities.
Agricultural and Rural-Based Trade. Reduction oftrade barriers in agriculture is particularly impor-tant for poverty reduction. Agriculture is the mainlivelihood for poor households: for more than 90percent in Cambodia and Vietnam, more than 75percent in Indonesia, and roughly 70 percent inThailand and the Philippines (World Bank 2002a).
Gains from agricultural liberalization by higher-income countries are estimated at more than $10billion for developing East Asia, and that figuretriples once dynamic productivity gains are takeninto account.25 In contrast to the move towardincreased transparency in trade policy for manu-facturers, agriculture remains protected in myriadways, as laid out in Chapter 4. However, the directimpact of agricultural subsidies and domestic sup-
port programs in Europe and the United States onfarmers in East Asia is limited; such domestic pro-grams are heavily concentrated on meat, dairyproducts, and cereals.26 Thus with the notableexception of rice, East Asian farmers are notdirectly engaged in these distorted world markets.But other barriers in international agriculturalmarkets are important for East Asia, and four prac-tices of the developed countries are especiallyharmful. First, their use of specific rather than advalorem tariffs often leads to very high effectiveprotection, particularly on low-quality goods pro-duced by the poorest countries. Products such aspalm oil, rice, and sugar, as well as fish, crustaceans,and fruits and vegetables are the ones mostaffected. Second, developed countries use tariffsthat cascade upward on goods such as coffee andvegetables as protective devices for their agropro-cessing industries. Third, complex rules of originmake it hard for countries to avail themselves of allthe incentives theoretically made available to them.Fourth, conformance with health and safety regula-tions, notably maximum pesticide residue levels,and difficulties with understanding and adminis-tering standards are costly for many exportingcountries.
Agricultural trade barriers are not just an issuefor developed countries; the emerging economiesof East Asia also maintain high barriers. Regionalagricultural markets already are large. China’s com-mitment to a regime of low protection in agricul-ture is fortunate for other countries that are wellplaced to supply it with imports, providing a directboost to their foreign exchange earnings and to theincomes of poor households. The ASEAN-Chinatrade agreement, with its “Early Harvest” provi-sions, provides another avenue to ensure that pooragricultural households have every opportunity tobenefit from trade opportunities in the region.There may be further scope to address the sensitivefood security and safety issues initially within thecontext of East Asian arrangements.
Development Orientation for aBehind-the-Border Agenda
As WTO director general Supachai Panitchpakdieloquently stated in November 2002, “Trade poli-cies do not stand alone. Mutually supportive com-panion policies are also necessary.” Many of the
Overview xxvii

mechanisms required to maximize the develop-mental benefits of trade and investment liberaliza-tion are “behind-the-border” institutional and reg-ulatory reforms. Each of the new regional andbilateral partnerships reflects this business reality.Technical barriers and product standards, logistics,services sectors, intellectual property rights, com-petition policy, and environmental and labor stan-dards have become as important a part of the pri-vate sector environment as trade policy itself. These“behind-the-border” issues also are featuredprominently on the Doha Development Agenda.The thrust is to place trade policy within a broaderframework of development and poverty reduction.
Technical Barriers and Standards: Balancing Tradewith Consumer Interests
As the traditional barriers to market access decline,measures aimed at trade facilitation become morecritical. Conformity with health and safety stan-dards can be one of the most decisive determinantsof access.27 Many of the standards in use representlegitimate consumer interests, but the use of tech-nical regulations, such as standards, has risen tofurther commercial policy in multilateral, regional,and global trade. An important problem forexporters is that different national governmentsoften apply different technical specifications tomeet the same goal.
For East Asian developing countries, importingcountries’ sanitary and phytosanitary (SPS) stan-dards can impose significant additional costs thatimpede exports. For example, it has been estimatedthat application of the strictest EU standard ratherthan the international Codex Alimentarius standardfor aflatoxin has cost Thailand $350 million inexport losses in cereals and dried fruit, China $380million, and Vietnam $15 million. The adoption ofa Codex standard on tetracycline could doubleThailand and China’s beef exports (Otsuki and Wil-son 2001, 2002). Exporting countries also have tocontend with importers’ use of precautionary mea-sures, such as the EU import ban on geneticallymodified organisms (GMOs), which hurts Thai-land’s tuna exports as well as exports from China,which is the third largest GMO producer in theworld. Only some of these standards may be justi-fied on grounds of consumer safety and preferences;others may simply be protectionism in disguise.
The WTO rules in this area aim at ensuring thattechnical regulations, voluntary standards, andtesting and certification of products do not consti-tute unnecessary barriers to trade. Under the Sani-tary and Phytosanitary Standards (SPS) Agree-ment, WTO Members are encouraged to adoptinternationally recognized standards, but also arefree to apply stricter ones. Although the agreementrecognizes importing countries’ right to implementSPS measures that diverge from internationalnorms, it does require them to provide scientificjustification for such measures and applies riskassessment mechanisms.
In many cases, East Asian economies will wantto adopt unilaterally the international standardsbeing set.28 China is further strengthening its foodsafety regulations and capacity to implement theseregulations as part of its WTO accession and isadopting various authentications and labeling sys-tems. Compliance with SPS in export markets caninduce changes in production systems and supplychannels, but it is likely to require modernization ofstandards infrastructure as well as information andtraining. Countries may need to seek technicalassistance and support for additional projects inthis area. A Standards and Trade DevelopmentFacility to address this need is being established, tobe administered by WTO in collaboration with theWorld Bank, the World Health Organization(WHO), the UN Food and Agriculture Organiza-tion (FAO), Codex Alimentarius, and others.
At the same time, East Asian countries can bene-fit from rationalizing standards in a regional andglobal context. Cooperation on standards is one ofthe important issues generally encompassed inregional arrangements. Recognizing that foreignstandards can achieve the same level of social orconsumer protection as domestic standards,mutual recognition agreements (MRAs) are oneoption. Such agreements have mainly been usedbetween developed countries, but ASEAN currentlyhas signed two MRAs, with plans for an additional20 products, thus avoiding duplication of testingand conformity assessment.
Transport and Logistics
The commodity mix in East Asia is changing rap-idly from resource-based commodities to low- andmedium-technology goods to high-technology
xxviii East Asia Integrates

goods (Table 2). Logistics improvements, essentialfor moving up the value chain, have very high pay-offs in East Asia, as discussed in Chapter 5. High-value agriculture (flowers, fruits, seafood) andmanufacturing (electronics) demand sophistica-tion not only in production but also in logisticshandling. Timeliness matters, and a fast, reliablesupply chain is essential.
In East Asia, the key logistical bottlenecks seemto be high internal land transport costs and portlogistics. This situation is in sharp contrast to exter-nal transport costs: with the sharp decline in trans-Pacific shipping costs over the last decade, produc-
ers in many parts of East Asia can reach the U.S.market more cheaply than inland areas or neigh-boring countries. For example, the inland transportcosts of moving goods from some remote regionsof China to external markets are roughly 10 timesthe inland transport costs at the other end (Figure7). Port logistics have been identified as a high pri-ority (Figure 8). Considerable scope exists forreduction of transport cost margins (Figure 9).Modest improvements could lead to more than $50billion in additional exports from emerging EastAsia to the rest of APEC, with an even larger impacton efficiency of imports (Wilson and others 2002).
Overview xxix
TABLE 2 Structure of Manufactured Exports by Country, 1985 and 1996 (% by value)
Low-/medium- High-Resource-based technology technology
1985 1996 1985 1996 1985 1996Hong Kong (China) 2.1 4.4 78.5 66.7 19.4 28.9Singapore 42.3 12.7 25.4 21.9 32.3 65.4Korea, Rep. of 7.8 9.4 72.1 55.0 20.1 35.6Taiwan (China) 8.7 5.1 70.6 54.1 20.7 40.8Indonesia 72.2 34.9 25.1 50.4 2.7 14.7Malaysia 53.7 17.8 15.2 21.8 31.1 60.4Thailand 42.1 14.5 44.8 49.1 13.1 36.4China 11.7 9.8 78.9 69.7 9.4 20.5
Source: Lall (1998).
Logistics costs of container transport from Chongqing, Chinato the U.S. West Coast: breakdown of total cost of US$3,650 per
20-foot equivalent unit (TEU)
Maritime transport21%
Port to final destination
7%
Port handling (receiving)
4%
Land access to port63%
Port handling (sending)
5%
FIGURE 7 Inland Transport Costs for Remote Regions
Source: Carruthers and Bajpai (2002).
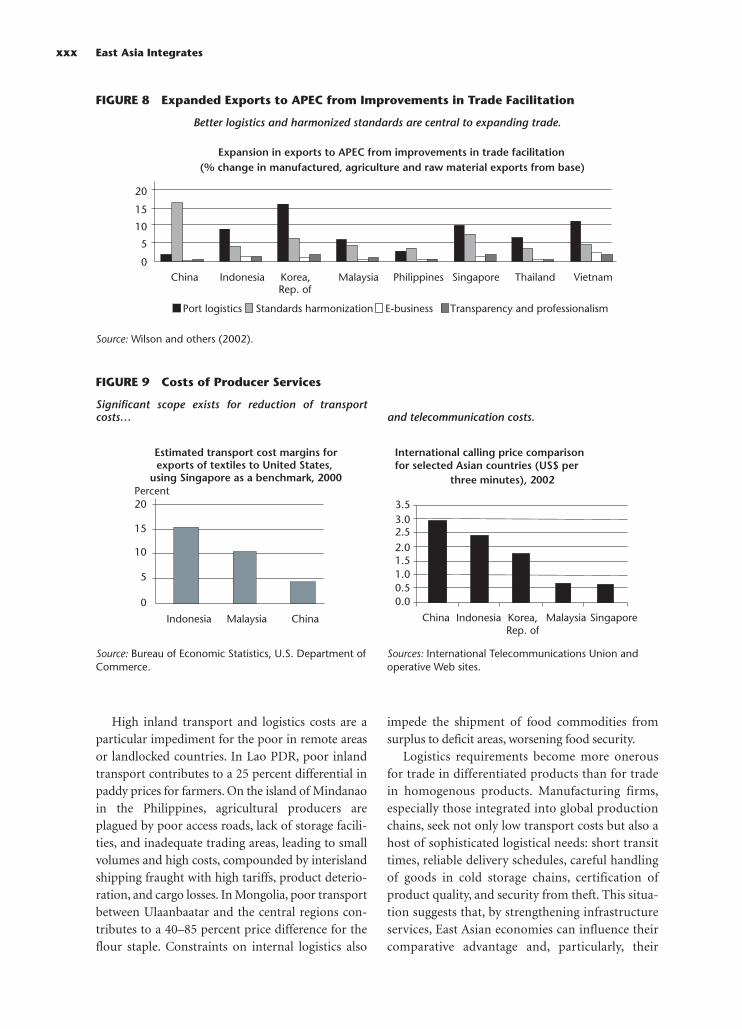
High inland transport and logistics costs are aparticular impediment for the poor in remote areasor landlocked countries. In Lao PDR, poor inlandtransport contributes to a 25 percent differential inpaddy prices for farmers. On the island of Mindanaoin the Philippines, agricultural producers areplagued by poor access roads, lack of storage facili-ties, and inadequate trading areas, leading to smallvolumes and high costs, compounded by interislandshipping fraught with high tariffs, product deterio-ration, and cargo losses. In Mongolia, poor transportbetween Ulaanbaatar and the central regions con-tributes to a 40–85 percent price difference for theflour staple. Constraints on internal logistics also
impede the shipment of food commodities fromsurplus to deficit areas, worsening food security.
Logistics requirements become more onerousfor trade in differentiated products than for tradein homogenous products. Manufacturing firms,especially those integrated into global productionchains, seek not only low transport costs but also ahost of sophisticated logistical needs: short transittimes, reliable delivery schedules, careful handlingof goods in cold storage chains, certification ofproduct quality, and security from theft. This situa-tion suggests that, by strengthening infrastructureservices, East Asian economies can influence theircomparative advantage and, particularly, their
xxx East Asia Integrates
Expansion in exports to APEC from improvements in trade facilitation(% change in manufactured, agriculture and raw material exports from base)
0
5
10
15
20
China Indonesia Korea,Rep. of
Malaysia Philippines Singapore Thailand Vietnam
Port logistics Standards harmonization E-business Transparency and professionalism
FIGURE 8 Expanded Exports to APEC from Improvements in Trade Facilitation
Source: Wilson and others (2002).
Better logistics and harmonized standards are central to expanding trade.
International calling price comparison Estimated transport cost margins forexports of textiles to United States,
using Singapore as a benchmark, 2000for selected Asian countries (US$ per
three minutes), 2002
0.00.51.01.52.02.53.03.520
Percent
15
10
5
0China Indonesia Korea,
Rep. ofMalaysiaChinaIndonesia Malaysia Singapore
FIGURE 9 Costs of Producer Services
Source: Bureau of Economic Statistics, U.S. Department ofCommerce.
Sources: International Telecommunications Union andoperative Web sites.
Significant scope exists for reduction of transportcosts… and telecommunication costs.

prospects for expanding production of moresophisticated products (see Chapter 5 and Fink,Mattoo, and Neagu forthcoming).
Improving logistics involves investing in trans-port infrastructure, but also introducing comple-mentary policies outside the transport sector.Transport regulatory agencies can improve logisticsperformance by allowing paperwork clearance forinland travel of containers and removing distor-tionary queuing pricing for commodities accessingthe transport system. Multimodal coordination isessential to promote seamless freight movement. InKorea, for example, inland container terminals andthe development of intermodal exchanges havemade it easy for containers to reach cities far fromthe ports. Coordination is also critical for urbanland use, standards, licensing, and security. Exam-ples of helpful urban land use policies includediverting traffic around congested areas and pro-viding space for landside container storage.
Better cross-border trade facilitation—customs,e-commerce, paperless clearance, electronic process-ing, and safety measures—can stimulate tradethroughout the region. Some studies show that foremerging East Asia, modest improvements in tradefacilitation could expand trade by more than $200billion (Wilson and others 2002; also see Figure 8).Customs is the most obvious example. In some EastAsian countries such as Singapore, trade documen-tation takes only 15 minutes to clear; two to threedays is required for customs documentation andclearance of sea cargo. By contrast, customs clear-ance takes a minimum of five days in Manila andseven days in Jakarta. In China, trade documentationclearance takes a day, whereas sea containers can take30–35 days to clear (Janet Tay Consultants 2002).Several countries, including Cambodia and Viet-nam, are addressing corruption in customs as criticalto private sector trade (World Bank 2001b, 2003a).
Certain logistics needs are best served by the pri-vate sector, particularly in ports, freight forward-ing, third-party logistics, warehousing, trucking,and the bus industry. Foreign entry may play animportant role in increasing competition and thequality of logistics.
Services Sector Liberalization
East Asia has lagged behind other developingregions in liberalizing trade in services.29 Evidence
suggests that the productivity gains associated withmore efficient services are particularly high, andthat competitiveness in high-value, differentiatedagriculture and in manufacturing depends on effi-cient business services. Static gains for developingEast Asia and Korea from services liberalizationthroughout the developing world are estimated atabout $270 billion, or 10 percent higher income, by2015 (World Bank 2002c).
To realize gains, reforms in the services sectorneed to be designed with broader developmentobjectives in mind and with an eye toward introduc-ing competition, ensuring effective regulation toremedy market failure, and providing essential ser-vices to the poor. Pro-competitive regulation is par-ticularly important in network-based services such astransport, telecommunications, and energy services.In East Asia, the importance of regulatory and pro-competitive reforms to complement privatization hasnot always been fully appreciated (Figure 10).
In this context, international trade agreements inservices offer East Asia three main benefits:improved access to markets abroad and greateropenness at home through reciprocal liberalization;credibility of reforms as the result of binding inter-national commitments; and regulatory cooperation.In some services in which East Asian countries havea stake in cross-border trade—for example, in dataprocessing and other information technology-enabled services—they could secure access to othercountries’ markets through legally binding commit-ments from their trading partners. Some countriesin East Asia have the potential to export significanttransport and logistics, tourism, and business ser-vices to China. East Asia also has a stake in tempo-rary labor mobility, as, for example, when its con-struction workers or accountants work abroad.
A nonpreferential approach to market opening,negotiated within a multilateral context, may beimportant for overall efficiency. It ensures thataccess is provided by the most competitiveproviders and avoids conferring a first-moveradvantage on inferior regional suppliers.
Nonetheless, regional arrangements may pro-vide the advantages of greater policy space for regu-latory cooperation and learning-by-doing. EastAsia is actively pursuing services liberalization inthe context of the regional arrangements just out-lined. Even preferential liberalization can improvethe status quo, given that many existing barriers are
Overview xxxi

frictional (such as unnecessary qualificationrequirements for foreign professionals and borderhurdles for foreign transporters). Initial openingamong regional partners may provide opportuni-ties for learning-by-doing and lessen concerns thatforeign competition would prematurely drive outpotentially competitive domestic providers. Regu-latory cooperation, such as the harmonization andmutual recognition of domestic regulations infinancial, professional, and a range of other ser-vices, may be more feasible in a regional context.
Investment and Competition Policies
Raising the productivity of investment in East Asiarequires harnessing the full force of competitioninherent in global markets.30 Lower barriers tointernational trade and investment can be a power-ful pro-competitive force, like in the services sectorwhere investment is one of the major modes fortrade in services. The greatest potential for makinginvestment more productive lies in unilateral
domestic reforms to remove policy barriers to com-petition. International agreements on investmentand competition can provide benefits through reci-procity. However, most of the remaining restric-tions on reciprocal market liberalization andnondiscrimination are in the services sector. Vehi-cles already exist at both the regional and multilat-eral (General Agreement on Trade in Services, orGATS) levels for realizing gains potentially arisingfrom service investment commitments.
International agreements that focus on protect-ing investors cannot be expected to expandmarkedly the flow of investment to new signatorycountries. The bilateral investment treaties of EastAsian countries (Figure 11) already contain manyprotections, and, even though they are relativelystrong, these protections do not seem to haveincreased investment flows to their signatories.
Policy barriers to trade, such as high tariffs orquotas, are the most important restraints on com-petition. Another restraint on competition is fre-quent recourse to antidumping and other types of
xxxii East Asia Integrates
1990 1991 1992 1993 1994 1995 1996 1997 1998 1999ChinaPrivatizationCompetition LDRegulation
IndonesiaPrivatization 19% 23%CompetitionRegulation
KoreaPrivatization 10% 20% 29%Competition ILD LD LocalRegulation
MalaysiaPrivatization 25%Competition ILD Local LDRegulation
PhilippinesPrivatization 100%Competition ILD Local LDRegulation
SingaporePrivatization 11% 17%Competition LocalRegulation
1990 1991 1992 1993 1994 1995 1996 1997 1998 1999
Sequence of fixed line telecom reform in selected Asian countries
FIGURE 10 Regulatory and Competitive Reforms, Selected Countries
Note: The percentage figures indicate the share of private equity ownership in the incumbent operator. Local, LD, andILD refer to the local long-distance and international fixed-line segments, respectively. Regulation only captures theexistence of a separate regulatory authority. Source: Fink, Mattoo, and Rathindran (2002).
Many regulatory and competitive reforms have not kept pace with privatization.

contingent protection. Antidumping laws wereoriginally created to counteract the predatory prac-tices of foreign sellers into a home market. In prac-tice, more than 90 percent of the antidumping casesinvestigated would never have been launched if acompetition standard—potential threat of injuryto competition—had been used as a criterion(Messerlin 2000). Since 1995, more than 1,800antidumping investigations have been initiated,many of them against East Asian exporters. In 2001the countries most often subject to investigationsincluded China (53), Korea (19), and Indonesia andThailand (16 each).
Large international companies with marketpower can form cartels that fix prices, allocate mar-kets, and restrain competition. The uncovering ofseveral international cartels in the late 1990s hasencouraged prosecutions, including by Korea. Andthere may be further scope for initiatives to disci-pline international cartels, ranging from extendingthe reach of industrial nations’ anticartel laws tonotification and information exchanges by nationalenforcement authorities to a multilateral agreement.
Intellectual Property Rights: Nurturing DomesticInnovation
Given the recent surge in knowledge-intensivetrade and investment flows, intellectual property
rights (IPRs) have become a mainstream topic inglobal trade discussions. As the subject of the 1995Trade-Related Aspects of Intellectual PropertyRights (TRIPS) agreement, IPRs have in factbecome a contentious issue in the WTO, withdeveloping countries concerned that across-the-board upgrading is premature, given their posi-tions as users rather than producers of technologi-cal innovations. Much of the debate has focused onthe impact of more stringent rights on East Asia asa user of technology created elsewhere, butstrengthened IPR regimes also play a role in localtechnology generation by compensating inventorsand creators.
Within the more advanced emerging economiesand parts of China, stronger IPR regimes, success-fully enforced, could stimulate innovation in tech-nology, as outlined in Chapter 6, provided otherconditions are favorable. Korea’s dramatic successin patenting may be particularly relevant: Thenumber of Korean patents registered in the UnitedStates grew quickly in the late 1990s, propellingKorea to sixth in the U.S. patent ranking, overtak-ing India, Brazil, and Singapore. Korea’s strength-ened IPR regime played a role, but so did industrialupgrading, a big push in research and developmentfrom the chaebols (big company groups), and thegovernment’s selective targeting of the semicon-ductor/electronics industry, where Korea has
Overview xxxiii
Asia Pacific
Western Europe and other developed countries
Other developing countries
ChinaHong KongIndonesiaJapanKoreaMalaysiaPhilippinesSingaporeTaiwan ThailandVietnam
Covers 75% or more of countries in the partner groupCovers 50–74% of countriesCovers 25–49% of countriesCovers less than 25% of countries
FIGURE 11 Geographic Distribution of Bilateral Trade Treaties
Source: Bora (2001).
Many protections for investors are already contained.
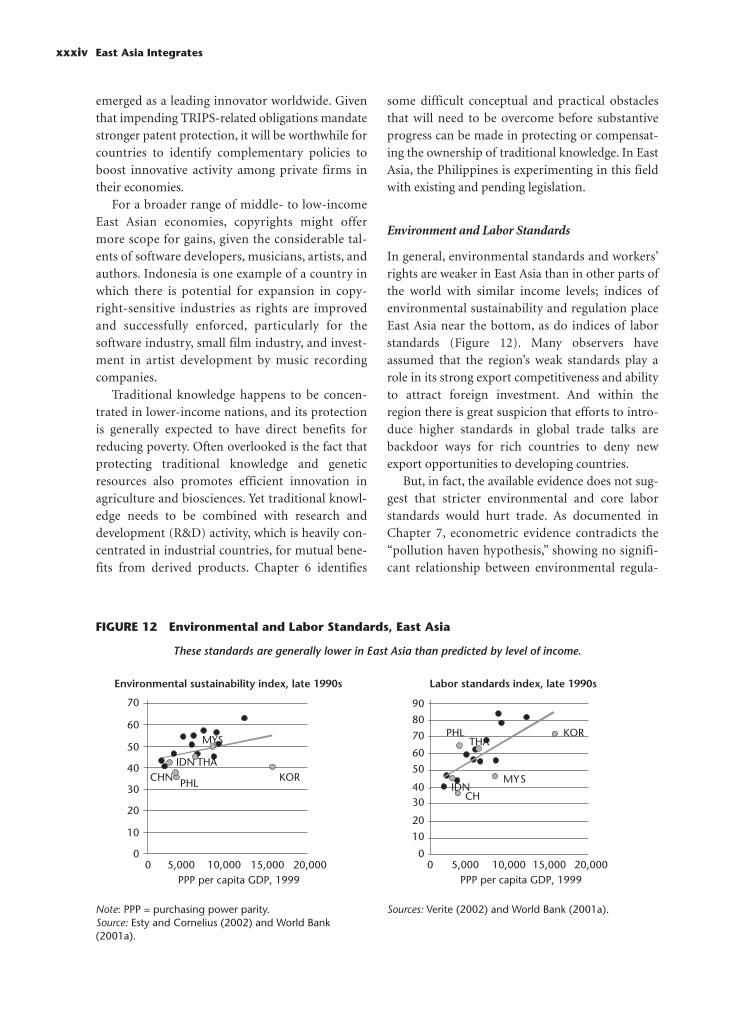
emerged as a leading innovator worldwide. Giventhat impending TRIPS-related obligations mandatestronger patent protection, it will be worthwhile forcountries to identify complementary policies toboost innovative activity among private firms intheir economies.
For a broader range of middle- to low-incomeEast Asian economies, copyrights might offermore scope for gains, given the considerable tal-ents of software developers, musicians, artists, andauthors. Indonesia is one example of a country inwhich there is potential for expansion in copy-right-sensitive industries as rights are improvedand successfully enforced, particularly for thesoftware industry, small film industry, and invest-ment in artist development by music recordingcompanies.
Traditional knowledge happens to be concen-trated in lower-income nations, and its protectionis generally expected to have direct benefits forreducing poverty. Often overlooked is the fact thatprotecting traditional knowledge and geneticresources also promotes efficient innovation inagriculture and biosciences. Yet traditional knowl-edge needs to be combined with research anddevelopment (R&D) activity, which is heavily con-centrated in industrial countries, for mutual bene-fits from derived products. Chapter 6 identifies
some difficult conceptual and practical obstaclesthat will need to be overcome before substantiveprogress can be made in protecting or compensat-ing the ownership of traditional knowledge. In EastAsia, the Philippines is experimenting in this fieldwith existing and pending legislation.
Environment and Labor Standards
In general, environmental standards and workers’rights are weaker in East Asia than in other parts ofthe world with similar income levels; indices ofenvironmental sustainability and regulation placeEast Asia near the bottom, as do indices of laborstandards (Figure 12). Many observers haveassumed that the region’s weak standards play arole in its strong export competitiveness and abilityto attract foreign investment. And within theregion there is great suspicion that efforts to intro-duce higher standards in global trade talks arebackdoor ways for rich countries to deny newexport opportunities to developing countries.
But, in fact, the available evidence does not sug-gest that stricter environmental and core laborstandards would hurt trade. As documented inChapter 7, econometric evidence contradicts the“pollution haven hypothesis,” showing no signifi-cant relationship between environmental regula-
xxxiv East Asia Integrates
0
10
20
30
40
50
60
70
0 5,000 10,000 15,000 20,000PPP per capita GDP, 1999
MYS
THAIDNKORCHN PHL
0
10
20
3040
50
60
70
80
90
0 5,000 10,000 15,000 20,000PPP per capita GDP, 1999
PHLTHA
KOR
IDNMYS
CH
Labor standards index, late 1990sEnvironmental sustainability index, late 1990s
FIGURE 12 Environmental and Labor Standards, East Asia
Note: PPP = purchasing power parity.Source: Esty and Cornelius (2002) and World Bank(2001a).
Sources: Verite (2002) and World Bank (2001a).
These standards are generally lower in East Asia than predicted by level of income.

tion and exports of pollution-intensive manufac-tures for East Asia (see Table 7.5 in Chapter 7).Analysis shows that exports and investments in EastAsia in the most sensitive sectors (pollution-inten-sive industries and labor-intensive industries)appear to benefit when standards are raised. Theargument is that standards help set transparent“rules of the game,” which then promote techno-logical upgrading and skills development fromwhich all parties benefit. Thus the evidence sug-gests that East Asian countries can raise their envi-ronmental standards without adversely affectingtheir exports and investment inflows.
As for the impact of trade on the environment,evidence suggests that, while trade-induced growthadds to pollution and the output of dirty industries,this effect is outweighed by the demand for a cleanerenvironment as a country raises its income andacquires better technologies. For example, an analy-sis of the effects of trade liberalization on water pol-lution in Chinese provinces during 1987–95—aperiod in which there was both an extensive pollu-tion levy system and significant opening to trade—illustrates that trade opening was beneficial to theenvironment overall (Dean 2002).
The links between trade competitiveness andcore labor standards are equally complex. As withtrade and the environment, causality operates inboth directions: Weak labor standards and poorworking conditions may influence trade flows andpatterns, but labor standards themselves are poli-cies determined by many factors, including open-ness to trade. Within East Asia, labor standardsappear to be strengthening. The number of Inter-national Labour Organization (ILO) fundamentalratifications has been increasing, and there is noevidence of backsliding on regulations or legisla-tion. While better labor standards and improvedworking conditions could raise the costs of labor,workers who are treated better may also respondwith more effort and invest in more skills, whichcould lower costs overall.
Econometric evidence suggests that strongerlabor rights are empirically associated with higherexport performance in East Asia (see Table 7.3 inChapter 7). This association is particularly the casefor core labor standards, including rights of freeassociation and a ban on child labor. It is thereforelikely that East Asian countries could introduce
core labor standards, based on social concerns,without undue concern that their export competi-tiveness will suffer.
Reinforcing Social Stabilitythrough Broad Sharing of Benefits
To pursue these trade arrangements and behind-the-border agendas, East Asian policymakers willneed a supportive authorizing environment. To beeffective, trade policy must be widely perceived asreinforcing social stability and not contributing tofurther inequalities. Since the economic crisis of1997–98, many Asian countries have become moredemocratic and their authorities more broadlyaccountable for economic policy decisions. Impor-tant constituencies question the distribution ofbenefits that are produced by complex trade nego-tiations. Evidence on how trade policies affect dif-ferent groups in society and different countries inthe region must be brought into the policy debatemore squarely in East Asia. Here it is important notsimply to generalize from other countries’ experi-ences; East Asia has specific characteristics thatdetermine the distribution of benefits from trade.This understanding is critical for designing a set ofmeasures that enable the poor and the populationmore broadly to take fuller advantage of the growthopportunities from trade. As Oxfam noted,“[W]hen trade is harnessed to effective economicpolicies and positive poverty reduction strategies, itcan act as a powerful force for change” (Oxfam2002).
While progress in poverty reduction has beensignificant in the region, more needs to be done.Well ahead of schedule, the region has attained theMillennium Development Goal of reducingextreme poverty incidence by half.31 Even so,roughly 13 percent of the people of emerging EastAsia were living on less than $1 a day in 2001. Inter-country differences are wide, with the proportionranging from virtually zero in Korea and Malaysiato more than 30 percent in Cambodia and LaoPDR. Using the $2.00 a day poverty line, estimatesfor 2001 range from virtually zero in Korea to morethan 75 percent of the population in Cambodia andLao PDR (World Bank 2003c).
The wide gap between rich and poor countries inEast Asia has been responsible for a rise in regional
Overview xxxv

income inequality.32 The most recent estimate of theGini coefficient for interpersonal inequality withinemerging East Asia is 46, higher than that in high-income countries (40), though lower than that inLatin America (58). Part of the increase has beendriven by mildly rising inequality within countries,including China, Vietnam, and the Philippines. Butthe bulk of the interpersonal inequality withinemerging East Asia—70 percent—is driven byinequality across location and across countries (Fig-ure 13).33 Policies and institutions that contribute totrade and the fuller integration of the low-incomecountries and regions of East Asia will be critical toaddressing income inequality in East Asia and con-tributing to a stable region.
Impact of Trade Reforms on Households
At the household level, the impacts of the changesinduced by specific trade policy reforms are com-plex. Policymakers need tools to better understandhow households will be affected in order to guidetheir policy sequencing and to help them identifyconcrete risk-mitigation measures where needed.
One of the more promising approaches is amicro simulation–cum–computable general equi-librium modeling approach that draws on the rich-ness of detail available from a modern integratedhousehold survey to provide a reasonably detailed“map” of predicted welfare impacts by location andsocioeconomic characteristics. The authors ofChapter 8 apply this approach to assess who withinChina will gain from accession to the WTO. Theyfind that, overall, the reduction in tariffs, quantita-tive restrictions, and export subsidies associatedwith accession will have only a small immediateimpact on mean household income, inequality, andthe incidence of poverty. These findings are per-haps not surprising in the case of China, given thatthe changes in agricultural effective protection arelikely to be far lower than others have estimatedand that significant changes already have been tak-ing place in the manufacturing sector. Nonetheless,the approach allows policymakers to go beyondaverages and aggregates that may hide offsettingimpacts across various households and to identifythose segments of the population for which theimpact may well be more significant. For China,
xxxvi East Asia Integrates
Gini coefficient for interpersonalincome equality
Gini coefficient
Poverty: headcount index(US$2-a-day poverty line)
0.0
10.0
20.0
30.0
40.0
50.0
90Percent
80
East AsiaSoutheast AsiaChinaOther transition (3)
70
60
50
40
3019881990 1996 1999 2000 2001 2002 2003 1993 1998
Inequality within countries/locationsInequality between countries/locations
FIGURE 13 Poverty and Inequality
Source: World Bank (2003a). Note: “Country” is defined such that both China andIndonesia are divided into rural and urban parts.Source: Milanovic (2003). Based on household surveydata.
Although poverty has declined steadily… …inequality, driven by gaps between countries andlocations, is cause for concern.
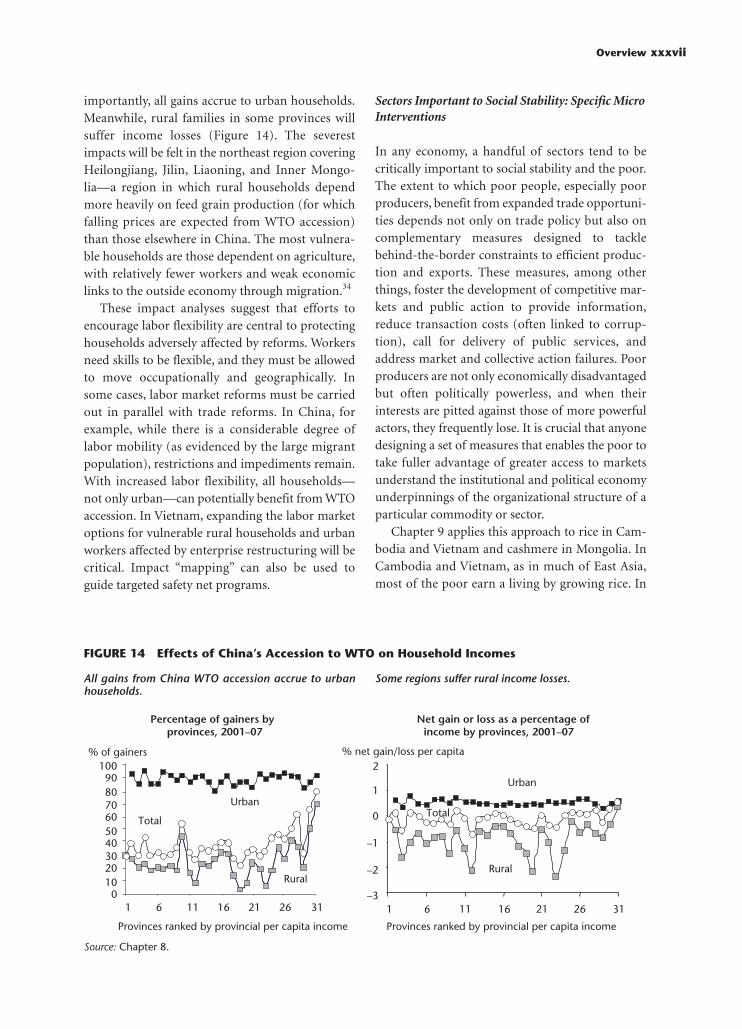
importantly, all gains accrue to urban households.Meanwhile, rural families in some provinces willsuffer income losses (Figure 14). The severestimpacts will be felt in the northeast region coveringHeilongjiang, Jilin, Liaoning, and Inner Mongo-lia—a region in which rural households dependmore heavily on feed grain production (for whichfalling prices are expected from WTO accession)than those elsewhere in China. The most vulnera-ble households are those dependent on agriculture,with relatively fewer workers and weak economiclinks to the outside economy through migration.34
These impact analyses suggest that efforts toencourage labor flexibility are central to protectinghouseholds adversely affected by reforms. Workersneed skills to be flexible, and they must be allowedto move occupationally and geographically. Insome cases, labor market reforms must be carriedout in parallel with trade reforms. In China, forexample, while there is a considerable degree oflabor mobility (as evidenced by the large migrantpopulation), restrictions and impediments remain.With increased labor flexibility, all households—not only urban—can potentially benefit from WTOaccession. In Vietnam, expanding the labor marketoptions for vulnerable rural households and urbanworkers affected by enterprise restructuring will becritical. Impact “mapping” can also be used toguide targeted safety net programs.
Sectors Important to Social Stability: Specific MicroInterventions
In any economy, a handful of sectors tend to becritically important to social stability and the poor.The extent to which poor people, especially poorproducers, benefit from expanded trade opportuni-ties depends not only on trade policy but also oncomplementary measures designed to tacklebehind-the-border constraints to efficient produc-tion and exports. These measures, among otherthings, foster the development of competitive mar-kets and public action to provide information,reduce transaction costs (often linked to corrup-tion), call for delivery of public services, andaddress market and collective action failures. Poorproducers are not only economically disadvantagedbut often politically powerless, and when theirinterests are pitted against those of more powerfulactors, they frequently lose. It is crucial that anyonedesigning a set of measures that enables the poor totake fuller advantage of greater access to marketsunderstand the institutional and political economyunderpinnings of the organizational structure of aparticular commodity or sector.
Chapter 9 applies this approach to rice in Cam-bodia and Vietnam and cashmere in Mongolia. InCambodia and Vietnam, as in much of East Asia,most of the poor earn a living by growing rice. In
Overview xxxvii
Net gain or loss as a percentage of income by provinces, 2001–07
Percentage of gainers by provinces, 2001–07
0102030405060708090
100
1 6 11 16 21 26 31
Provinces ranked by provincial per capita income
% of gainers
Total
Rural
Urban
–3
–2
–1
0
1
2
1 6 11 16 21 26 31
Provinces ranked by provincial per capita income
Urban
Rural
% net gain/loss per capita
Total
FIGURE 14 Effects of China’s Accession to WTO on Household Incomes
Source: Chapter 8.
All gains from China WTO accession accrue to urbanhouseholds.
Some regions suffer rural income losses.
Mongolia, the livestock herding tradition, which iscenturies old, provides a livelihood to the bulk ofthe rural population. Domestic resource cost esti-mates confirm that these two commodities offerscope for efficient and expanding internationaltrade opportunities. In these economies, the exter-nal trade policies for rice and cashmere, by andlarge, no longer represent important impediments.This situation suggests that policymakers lookmore deeply into domestic institutions and thevalue chain domestically to identify the sectoralinstitutional and policy constraints between thetwo ends of the supply chains for rice and cashmerethat reduce the ability of poor producers to benefitfrom these expanding trade opportunities.
As presented in Chapter 9, analysis of institu-tional arrangements along the value chain forthese two sectors highlights the considerableimpediments that exist both to upgrading thevalue of rice and cashmere production and toincreasing the share of poor producers in the valuechains. In all three countries, powerful con-stituents appropriate rents through explicit prefer-ences (credit for state-owned enterprises in Viet-nam, export tax in Mongolia), industrial structure(near monopsony for a few millers in Cambodia),and corrupt practices (illegal fees) that are toler-ated while poor producers remain trapped in low-productivity states in the absence of improvementsin public service delivery (poor road network,inadequate research and extension, and so forth).Similar forces may be present in many economies,but they are compounded in these three transitioneconomies by the absence of strong market institu-tions—institutions that are still developing as partof the transition from planned to marketeconomies. According to the analysis, the poor canbenefit from expanded opportunities presented byglobal integration, provided that these constraintsare addressed. Giving voice to poor producers’interests by placing these issues on the policyagenda is crucial to fostering reforms that unleashthe productivity potential of poor people andincrease their bargaining power.
The trading arrangements and behind-the-bor-der agendas just discussed are also critical to ensur-ing a broad sharing of the benefits from trade inkey commodities. Reducing market access barriersin agriculture in developed countries is critical forsectors that are central to social stability, including
agricultural staple crops such as rice. Efforts torelieve transport and logistics constraints in remoteareas are an important component of realizing effi-ciencies along the value chain. Many of the peoplewho have yet to benefit from East Asia’s successfultrade strategies are located in these more remoteareas. As illustrated by the research findings on theeffects of China’s WTO accession, changes in tradepolicy alone may have a relatively small impact.Other complementary policies will be essential forbenefits to reach the poor more broadly.
Trade and Stability
Employment and earnings stability is anotherimportant element in efforts to ensure a supportiveauthorizing environment for trade. In most of theregion’s economies, labor is flexible; the adjustmentto demand shocks takes place through wages, pro-tecting employment, and spreading the gains orlosses over the broad labor force.35 The East Asiafinancial crisis and more recent global slowdownhave brought concerns about volatility to the fore-front. Trade liberalization, it is argued, may haveincreased the exposure of the economy to more andlarger shocks in the tradable goods sectors. If a sec-tor faces larger or more frequent shocks, workers inthat sector may experience greater fluctuation inemployment or earnings and therefore greater joband earnings insecurity. Adjustment can be costly,with loss in efficiency and displacement of workers.There is particular concern that volatility transmit-ted via trade liberalization may make workers morevulnerable and that poorer workers might be hurtdisproportionately.
The analysis presented here for East Asia sug-gests that trade liberalization has not resulted inincreased volatility or vulnerability for wage work-ers. As outlined in Chapter 10, research in threecountries (Korea, Thailand, and Indonesia) exam-ined the relationship among trade, idiosyncraticshocks, and fluctuations in workers’ earnings andemployment. The first comparison is between peri-ods of different degrees of openness to trade; thesecond is among industries characterized by differ-ent degrees of trade exposure (see Korea in Figure15). Although the analysis is constrained by dataavailability, it finds no correlation between greaterexposure to trade and greater variability in earningsor employment. Indeed, worker cohorts experi-
xxxviii East Asia Integrates

enced lower year-to-year fluctuations in their earn-ings during the 1990s—characterized by fewertrade barriers—than in the previous decade. Thereis some evidence that employment is more volatilein trade-intensive industries; at the onset of theEast Asia financial crisis, employment fluctuatedmore widely in the more trade-intensive industriesthan in the less trade-intensive industries. However,employment in these industries recovered rapidly,with few long-term adverse impacts.
The analysis does find a clear relationshipbetween vulnerability and workers’ educationallevel and gender. Workers who have little educationand those who are female are much more likely tofall into poverty. In Indonesia, for example, the pro-
portion of unskilled workers falling from high-pay-ing jobs into low-paying jobs was two to three timesthat of skilled workers. Thus, while trade opennessmakes an important contribution to growth anddoes not worsen vulnerability, policies to reduce thevulnerability of workers must also focus on broad-ening education and developing skills.
Conclusions
East Asia is emerging from the financial and cur-rency crises of 1997–98 with a new perspective ondevelopment. East Asian policymakers are turningto the region as well as to the rest of the world todevelop a coherent set of economic policies that
Overview xxxix
Standard deviation of wage growth by birth-year cohorts, males
00.01
1976–87 1987–97
0.020.030.040.050.060.070.080.09
0.1
Annual wage growth by birth-year cohorts, males
–0.08
1926
1929
1932
1935
1938
1941
1944
1947
1950
1953
1956
1959
1926
1929
1932
1935
1938
1941
1944
1947
1950
1953
1956
1959
–0.06–0.04–0.02
00.020.040.060.08
0.10.120.14
FIGURE 15 Trade and Stability in Labor Markets, Republic of Korea
Source: Kim (2002).
No higher earnings volatility is evident in periods of greater openness.
Nor is higher earning volatility evident in sectors more exposed to trade.
Standard deviation of log of real wages of samplecohort by low, medium, and high trade exposuregroups, 1976–2000
Standard deviation of log of real wages of samplecohort of Korean males by broad sectors, 1986–2000
1980 1985
Males, secondary education, age 40 in 1990 Males, secondary education, age 40 in 1990
1990 1995 2000 1980 1985
Low exposure Medium exposure High exposure
1990 1995 2000
0
0.2
0.4
0.6
0.8
0
0.2
0.4
0.6
0.8
Manufacturing Services and construction Others

can deliver stability, growth, and regional integra-tion. This volume does not try to be comprehen-sive, but focuses on fundamental strategies thatpromote cross-border flows of trade, along withdomestic policies to maximize the impact of theseflows on development and distribute the gainsfrom trade widely.
Several bilateral, regional, and multilateral ini-tiatives have been advanced to pursue this strategicagenda. But to succeed, these initiatives must havetwo features. First, they must provide a compellingvision of how integration can deliver broadlyshared growth and prosperity. There are concernsin Asia that a narrowly focused approach to global-ization, like that found in the 1980s and early1990s, has worsened the income distributionwithin countries and widened the gap between thericher and poorer countries of the region. Eventhough the evidence may not support such con-cerns, the new initiatives must move beyond theperspective of trade policy to broader approachesthat emphasize the links between trade and socialstability and the coherence with overall develop-ment, stability, and growth. For this reason, thechapters in this volume contain several studies ofthe impacts of integration on poorer countries andon vulnerable groups within countries.
Second, as initiatives for integration movebeyond the narrow confines of trade policy, theymust deal increasingly with second-best issues andtrade-offs, including in areas once treated as sensi-tive. For example, policymakers must balance userrights and incentives for innovation in deciding onan intellectual property rights regime; decide whereto allocate scarce resources to reduce logistics costsand improve competitiveness; introduce appropri-ate environmental and labor standards; and expandliberalization into services and agriculture.
An empirical approach is required to guidecountries on the priorities in these areas; after all,East Asian countries are diverse and each has a dif-ferent set of priorities. The empirical estimates ofthe potential gains are often substantial, amount-ing to hundreds of billions of dollars for the prior-ity areas identified in the rest of this section. It isclearly worthwhile for policymakers to devotemajor effort to get the reforms right. The chaptersin this volume suggest some broadly applicablepriority areas for action, as described in the follow-ing list.
• Broadening agreements to include agriculture andservices. China’s approach to agricultural tradeliberalization offers scope for the region, espe-cially Southeast Asia, to benefit significantly.36
China will emerge as a major importer of agri-cultural and natural resource–intensive com-modities. If agriculture can be liberalized in aregional setting, as in the proposed ASEAN-China free trade agreement, then a favorablepolitical dynamic can be set in place that willlead to more open agricultural sectors overall.As for the region’s agricultural exports to thedeveloped world, all countries need to improvetheir ability to meet sanitary and phytosanitarystandards through better laboratories, stan-dards, and negotiation of mutual recognitionagreements, and rich countries need to reducethe degree of cascading tariffs in agriculturalprocessing and move toward the imposition oftransparent ad valorem tariffs. For ASEANcountries in particular, the inclusion of agricul-ture in global and regional trade agreements isimportant—potential welfare gains can beroughly doubled.
Several international studies37 suggest thatthe gains from liberalizing services could be verysubstantial—the same order of magnitude asthat for liberalizing trade in manufacturedgoods and agriculture. This is an area in whichEast Asia has lagged behind other developingregions. The imperative for moving ahead withservices liberalization is stronger because of theemergence of China as a low-wage, efficientmanufacturer. Other countries in the region willfind it very difficult to compete in internationalmarkets on the basis of wages alone. Instead,they must rely on better producer services toenhance their competitiveness. Improved ser-vices will permit them to participate in regionalproduction networks that offer prospects formaximum efficiency.
• Improving logistics and trade facilitation. EastAsia’s progress on logistics has failed to keeppace with its growth in trade. Logistics costs inmany parts of East Asia are high, and logisticsindustries are underdeveloped. Logistics plays acritical role both in determining aggregate levelsof trade and in ensuring that development bene-fits spread beyond coastal regions. For EastAsia’s less open and accessible countries and
xl East Asia Integrates

regions, the development of more tightly inte-grated domestic markets and logistics systems isa high priority. Complementary institutionalactions are needed not only to promote anappropriate mix of transport modes, but also toextend better transport services to remote areasand establish better conditions for market devel-opment. Beyond strengthening physical infra-structure, governments also need to undertakeimprovements in the regulatory environmentand in the conditions for cross-border facilita-tion. Customs clearances deserve special atten-tion; addressing corruption has been high-lighted as an issue in several countries.
• Institutional strengthening to safeguard and bene-fit the poor. The fear that globalization hasincreased volatility seems to be misplaced. Avail-able evidence for East Asia suggests that greateropenness to trade does not make workers morevulnerable; indeed, greater openness has in factstabilized wage incomes and employment acrossall skill categories. That said, women workersand workers with little education are noticeablymore vulnerable than others to falling intopoverty, emphasizing the need for policies tobroaden education and develop skills. To ensurethat the poor within countries benefit fromopenness, policies are also needed to supportworkers’ geographic and occupational mobility,as are specific actions to reduce transport andmarketing costs in order to improve farm gateprices for the products on which the poor rely.
Beyond these immediate priorities, several otherfindings are highlighted in this volume:
• Easing adjustment in labor-intensive industries.Certain sectors in East Asia, especially the gar-ment sector, are likely to be seriously affected byexpanded output and exports from China. Theregion’s more developed economies will be ableto shift out of garment-making into highervalue added industries, and today’s presence ofcurrent account surpluses implies that the exter-nal adjustment will be manageable. For othercountries, supply chain analysis suggests thatthere is scope for greatly improving competitive-ness in the garment and other manufacturingindustries by improving logistics and reducingthe costs of corruption.
• Framing policies on intellectual property rights.Intellectual property rights are a part of themultilateral framework for trade. Strong protec-tion of intellectual property rights encouragesinnovation, but it is not a magic bullet; otherconditions, including investments in skills andprovision of a competitive business environ-ment, are also needed. Several of the region’smore advanced countries, and parts of China,can hope to stimulate technological advances ifthey better protect intellectual property and paymore attention to competition policy (Yusufand others 2003). Stronger copyright laws, pro-vided they can be enforced, may yield some sig-nificant gains for domestic software industriesas well as the arts and music sectors. As for tradi-tional knowledge, some important conceptualand practical problems need to be sorted outbefore progress can be made in protecting itsownership and linking traditional knowledgeissues to WTO agreements or other mechanismsfor managing research and development.
• Reconsidering environmental and labor stan-dards. There is no evidence from East Asia tosupport the argument that improved environ-mental and core labor standards would unfairlyaffect manufacturing competitiveness. Indeed,the evidence suggests that East Asian countriescan raise their environmental and core laborstandards without adversely affecting theirexports and investment inflows. The fierceresistance of many in the region to consideringthese issues in line with broader developmentstrategies may be misplaced.
This rich agenda suggests scope for East Asiancountries to build on the international commit-ment to a new development round of trade negoti-ations based on the Doha Development Agenda,and on their own commitment to deepeningregional economic ties. Countries must operate onthree levels. Internationally, they can influence thenegotiations, and, in doing so, they should pay par-ticular attention to standards and to liberalizationin agroindustries and services. Regionally and bilat-erally, they can achieve deeper integration, whichoffers prospects for gains in sensitive sectors(although with due care to use these agreements tofurther multilateral liberalization). Nationally,countries need to take a more comprehensive
Overview xli

approach to policy than before, moving beyondnarrow trade and industry interests focused onprotecting specific manufacturing subsectors toadopt a strategy with sectoral components that arealigned to encourage integration and competitionas means of delivering growth, stability, andpoverty reduction.
Endnotes
1. Emerging East Asia is defined here as the Association ofSoutheast Asian Nations (ASEAN), plus other newly indus-trializing economies, China, and Mongolia. ASEAN mem-bers are Brunei Darussalam, Cambodia, Indonesia, LaoPeople’s Democratic Republic, Malaysia, Myanmar, thePhilippines, Singapore, Thailand, and Vietnam.
2. This figure is not much less than the 7.7 percent share of globaltrade among the North American economies when the NorthAmerican Free Trade Agreement went into force in 1994.
3. $2.15 per day in 1993 PPP$. See World Bank (2003c). Allother dollar amounts are current U.S. dollars.
4. East Asia is perhaps the most diverse region in the world.The income per capita, in purchasing power terms, of Sin-gapore, for example, is 25 times that of Lao PDR, and thegap between the two in institutional capacity to managedevelopment may be even greater.
5. See World Bank (2000) for a first assessment of the newpolicy and institutional agenda.
6. China is widely seen as having contributed to stability in1997–98 by maintaining a stable exchange rate in the faceof major devaluations of other currencies. Few scholarsgive credence to the notion that competition from Chinawas the cause of the Asian crisis.
7. The ratio of China’s GDP to that of the rest of emergingEast Asia was 1:2 in 1996 and 1:1 in 2002.
8. China’s share of East Asian exports has grown significantlyover the last decade—from 10 to 20 percent for Singapore,Korea, and Taiwan (China), and from 2 to 5 percent forASEAN countries.
9. Exceptions were Singapore, Cambodia, and Brunei.10. The trade complementarity index measures how well the
export profile of one country matches the import profile ofanother. The index is zero when no good exported by onecountry is imported by the other, and 100 when the export-import profiles exactly match. Higher index values indicatemore favorable prospects for a successful trade arrange-ment between countries. The index stands at more than 60for emerging East Asia. By contrast, indices for previousfailed trade arrangements ranged from values of 7 to 22.See Ng and Yeats (2003).
11. During the crisis, real exchange rate depreciation alsoplayed a role in reducing protectionist tensions. Nonethe-less, the dangers of protectionism and of vested interestscapturing political support in specific cases should not beunderestimated.
12. China’s domestic market is the largest of these, but recenttrends show Korea, Thailand, and other economies grow-ing on the strength of domestic consumption demand.
13. Assessments of the impact of WTO accession on China’s agri-cultural sector based on limited comparisons of statutory tar-iffs and the rates agreed on in the accession process would be
misleading. Recent research reveals that overall protection forcrops such as rice, wheat, and maize is far less than indicatedby statutory tariff rates (Huang and Rozelle 2002).
14. The decision contrasts with the costly and wasteful path toever higher protection followed by previous high-growthEast Asian economies.
15. The positive impact on the automobile sector is a relativelynew finding from François and Spinanger (2002), as dis-cussed in Chapters 1 and 2.
16. See François and Spinanger (2002). The agreement requiresthe elimination of quotas by January 2005.
17. The situation also highlights the importance of improvingthis area of WTO rules.
18. The number of sectors with guaranteed unrestricted accessis still lower in China than in most other countries forcross-border trade and consumption abroad (modes 1 and2) and essentially zero for establishment trade (mode 3).
19. Trade intensity is the degree to which the value of tradebetween two countries conforms to expectations that arebased on the partners’ relative importance in world trade. Itis computed as the ratio of the share of country i’s exportsgoing to country j (xij/Xit, where xij and Xit are the values ofi’s exports to j’s and i’s total exports) relative to the share ofworld trade destined for country j (xwj/Xwt, where xwj andXw are the values of the world’s exports to j and the world’stotal exports). An index of more than unity indicates thatbilateral trade is larger than expected given the partnercountry’s importance in world trade.
20. See Schiff and Winters (2003) for a discussion of regional-ism from the perspective of developing countries morebroadly.
21. Nonmembers may be net losers, though Table 1 suggeststhese losses may be minimal. Nonetheless, consistency withthe WTO could be questioned, and such arrangementscould be subject to challenge in the WTO.
22. See results in Hoekman and Konan (1999) for the Euro-pean Union and Egypt and in Brenton and Manchin (2002)for the European Union and Russia.
23. See Ianchovichina and Walmsley (2002) for China.24. See Kalima and Krumm (2002), which draws on a combi-
nation of labor market surveys, World Bank income distri-bution data, and computable general equilibrium (CGE)modeling results.
25. World Bank (2002c). Real income gains for Korea anddeveloping East Asia are estimated for 2015 at $11 billion,assuming fixed productivity, and $32 billion with endoge-nous productivity, excluding production subsidies, com-pared with baseline income. Static gains are slightly less,including production subsidies, but dynamic gains wouldincrease to $76 billion. China would capture one-third ofstatic gains and two-thirds of dynamic gains.
26. The direct impact of domestic support programs is of lessrelevance to East Asia because this support is concentratedin products that are not of crucial importance to East Asiadeveloping countries, with the exception of rice. Productssuch as fruits, vegetables, and spices together account foronly 7 percent of the developed countries’ total domesticsupport payments.
27. Many nonreciprocal preference schemes have had a lowrate of uptake by developing countries, including those inEast Asia, in large part because of stringent rules of origin.For example, Cambodia made use of only 36 percent of itsentitlement under the EU’s Everything but Arms initiativein 2001 (Brenton 2003a).
xlii East Asia Integrates
28. For example, by Codex Alimentarius, the Organization forAnimal Health, the International Organization for Epi-zootics, or the Hazard Analysis Critical Control Point(HACCP). In Malaysia, the Ministry of Health operates avoluntary certification program for private firms in thefood processing sector. This program was introduced in1996–97 in response to EU requirements for HACCP infish processing plants.
29. See Mattoo, Rathindran, and Subramanian (2001).30. The discussion in this section is based on World Bank
(2003b).31. On the basis of a higher poverty line of $2.00 per day, two-
thirds of the population was poor in 1990; this has declinedto about two-fifths today (Figure 14).
32. The Gini coefficient for interpersonal inequality in emerg-ing East Asia was estimated at 42.0 in 1988 and 46.8 in1993.
33. The Gini coefficient of income inequality (G) can bedecomposed into a within-country inequality componentand a between-country inequality component (G = S Gi pi
pi + S S [(yj – yi )/ yi] pi pj + residual). The within-countrycomponent refers to the weighted sum of within-countryinequalities, where each country’s (i-th) inequality is repre-sented by its own Gini coefficient (Gi), and the weight isgiven by the product of the country’s share in the world’spopulation (pi) and the country’s share in world income(pi). The between-country component is derived such thatall countries are ranked by their mean income (from poor-est to the richest) and the relative distance between coun-tries’ mean incomes [(yj – yi )/ yi] is weighted by the prod-uct of the poorer country’s share in world population (pj)and the richer country’s share in world income (pi).
This situation contrasts with the one in Latin America,where the bulk of inequality reflects differences withincountries, and only 19 Gini points are attributable tobetween-country differences. For East Asia, the definitionof country is such that both China and Indonesia aredivided into rural and urban areas.
34. A similar approach assessed the impact of the ASEAN FreeTrade Area and the U.S. bilateral agreement on aggregativeVietnam household groupings—see Centre for Interna-tional Economics (2002). That analysis suggests that thebenefits are spread across the income deciles and acrossrural and urban areas. However, the poorest rural decilesbenefit the least, and individual households could experi-ence vulnerabilities.
35. The most severe test of this occurred during the Asian eco-nomic crisis. Except in Korea, unemployment in the crisiscountries was kept to manageable levels; most of theadjustment fell on wages.
36. As noted earlier, the adjustments in China’s agricultural sec-tor resulting from WTO accession may be smaller thansome other analysts suggest, because China’s current prac-tices are already more liberal than implied by statutory rates.
37. See Yusuf and others (2003) on producer services.
References
The word processed describes informally reproduced works thatmay not be commonly available through libraries.
Bora, Bijit. 2001. “Prospects for Harmonizing Investment Poli-cies in the East Asian Region.” Draft prepared for the WorldBank. UNCTAD, Geneva.
Brenton, Paul. 2003a. “Integrating the Least Developed Coun-tries into the World Trading System: The Current Impact ofEU Preferences under Everything But Arms.” Policy ResearchWorking Paper. World Bank, Washington, D.C. Forthcom-ing, Journal of World Trade.
———. 2003b. “Notes on Rules of Origin with Implications forRegional Integration in South East Asia.” World Bank, Wash-ington, D.C. Processed.
Brenton, P., and M. Manchin. 2002. “Trade in Services, ForeignDirect Investment and Technology Transfer: Implications ofan EU-Russia Free Trade Agreement for Economic Effi-ciency and Growth.” Report prepared for the EuropeanCommission. Processed.
Carruthers, Robin, and Jitendra N. Bajpai. 2002. “Trends inTrade and Logistics: An East Asian Perspective.” WorkingPaper No. 2. World Bank, Transport Sector Unit, Washing-ton, D.C.
Centre for International Economics. 2002. “Integration andPoverty: An Economy-Wide Analysis.” Draft prepared forthe World Bank. Canberra and Sydney, November.
Dean, Judith M. 2002. “Does Trade Liberalization Harm theEnvironment? A New Test.” Canadian Journal of Economics35 (4): 819–42.
Esty, Daniel C., and Peter K. Cornelius. 2002. Environmental Per-formance Measurement: The Global Report 2001–2002.Oxford: Oxford University Press.
Fink, Carsten, Aaditya Mattoo, and Ileana Cristina Neagu.Forthcoming. “Assessing the Impact of Communication onTrade.” Policy Research Working Paper. World Bank, Wash-ington, D.C.
Fink, Carsten, Aaditya Mattoo, and Randeep Rathindran. 2002.“Liberalizing Basic Telecommunications: The Asian Experi-ence.” HWWA-Institut fur Wirtschaftsforschung DiscussionPaper 63.
François, Joseph F., and Den Spinanger. 2002. “Market Access inTextiles and Clothing.” Prepared for Conference on Inform-ing the Doha Process: New Trade Research for DevelopingCountries, Cairo, May.
Hallward-Driemeier, Mary, Giuseppe Iarossi, and Kenneth L.Sokoloff. 2002. “Export and Manufacturing Productivity inEast Asia: A Comparative Analysis with Firm-Level Data.”NBER Working Paper No. W8894. National Bureau of Eco-nomic Research, Cambridge, Mass.
Hoekman, Bernard, and Denise Eby Konan. 1999. “Deep Inte-gration, Nondiscrimination, and Euro-Mediterranean FreeTrade CEPR.” Policy Research Working Paper 2130. WorldBank, Washington, D.C.
Huang, J., and S. Rozelle. 2002. “The Nature of Distortions toAgricultural Incentives in China and Implications of WTOAccession.” Paper presented at Seminar on WTO Accession,Policy Reform and Poverty Reduction in China, World Bank,Beijing, June 28–29.
Ianchovichina, Elena, and William Martin. 2001. “Trade Liberal-ization in China’s Accession to the World Trade Organiza-tion.” Journal of Economic Integrations 16 (4): 421–45.
———. 2002. “Economic Impacts of China’s Accession to theWTO.” Paper presented at Seminar on WTO Accession, Pol-icy Reform and Poverty Reduction in China, World Bank,Beijing, June 28–29.
Ianchovichina, Elena, and Terrie Walmsley. 2002. “RegionalImpact of China’s Accession.” World Bank, Washington, D.C.Processed.
IMF (International Monetary Fund). Various years. Direction ofTrade Statistics. Washington, D.C.
Overview xliii

Janet Tay Consultants. 2002. “Facilitating Trade: The East AsianExperience in a Comparative Context.” World Bank, Wash-ington, D.C., May. Processed.
Kalima, Blandina, and Kathie Krumm. 2002. “Delays in Imple-mentation of Agreement on Textiles and Clothing: PovertyImpact in East Asia.” World Bank, Washington, D.C., August.Processed.
Kawai, Masahiro, and Shujiro Urata. 2002. “Trade and ForeignDirect Investment in East Asia.” Paper presented to Confer-ence on Linkages in East Asia: Implications for CurrencyRegimes and Policy Dialogue, Seoul, September.
Kim, Dae II. 2002. “Openness and Worker Vulnerability inKorea: A Descriptive Study.” World Bank, Washington, D.C.Processed.
Lall, Sanjaya. 1998. “Exports of Manufactures by DevelopingCountries: Emerging Patterns of Trade and Location.”Oxford Review of Economic Policy 14: 54–74.
Lardy, Nicholas. 2002. Integrating China into Global Economy.Washington, D.C.: Brookings Institution Press.
Mattoo, Aaditya, Randeep Rathindran, and Arvind Subraman-ian. 2001.“Measuring Trade Liberalization and Its Impact onEconomic Growth: An Illustration.” World Bank, Washing-ton, D.C. Processed.
Messerlin, Patrick. 2000. Measuring the Costs of Protection inEurope. Washington, D.C.: Institute for International Eco-nomics.
Milanovic, Branko. 2003. “Worlds Apart: International andWorld Inequality, 1950–2000.” World Bank, Washington,D.C. Processed.
Ng, F., and A. Yeats. 2003. “Major Trade Trends in East Asia:What Are Their Implications for Regional Cooperation andGrowth?” Policy Research Working Paper 3084. World Bank,Washington, D.C.
Otsuki, Tsunehiro, and John S. Wilson. 2001. “Global Trade andFood Safety: Winners and Losers in a Fragmented System.”Working Paper 2689. World Bank, Washington, D.C.
———. 2002. “Beef Trade and Veterinary Drug Standards.”World Bank, Washington, D.C. Processed.
Oxfam. 2002. Rigged Rules and Double Standards: Trade, Global-ization, and the Fight against Poverty. Oxford: Oxfam.
Schiff, Maurice, and L. Alan Winters. 2003. Regional Integrationand Development. Oxford: Oxford University Press.
Schmidhuber, J. 2001. “Changes in China’s Agricultural TradePolicy Regime: Impacts on Agricultural Production, Con-
sumption, Prices, and Trade.” In OECD, China’s Agriculture inthe International Trading System, OECD Proceedings. April.
Scollay, Robert, and John Gilbert. 2001. New Subregional TradingArrangements in the Asia-Pacific. Washington, D.C.: Institutefor International Economics.
———. 2003. “Impact of East Asian Regional or SubregionalFTAs.” Report for Australian Department of Foreign Affairsand Trade. May.
Verite. 2002.“Report to California Public Employees’ RetirementSystem (CalPERS): Emerging Markets Research Project.”Available at [email protected].
Wilson, John, Catherine Mann, Yuen Pau Woo, Nizar Assanie,and Inbom Choi. 2002. “Trade Facilitation: A DevelopmentPerspective in the Asia Pacific Region.” World Bank workingpaper presented to APEC. World Bank, Washington, D.C.Processed.
World Bank. 2000. East Asia Regional Overview: Recovery andBeyond. Washington, D.C.
———. 2001a. Indonesia: “Environment and Natural ResourceManagement in a Time of Transition.” Washington, D.C.
———. 2001b. Cambodia Integrated Framework. Washington,D.C.
———. 2002a. East Asia Regional Overview: Making Progress inUncertain Times. Washington, D.C. November.
———. 2002b: “Trends, Issues and a Glimpse of the Future.”East Asia Regional Office Mimeo. Washington, D.C.
———. 2002c. Global Economic Prospects, and Developing Coun-tries: Making Trade Work for the Poor. Washington, D.C.
———. 2003a. Vietnam’s Exports: Challenges and Opportunities.Washington, D.C.
———. 2003b. Global Economic Prospects and Developing Coun-tries: Investing to Unlock Global Opportunities. Washington,D.C.
———. 2003c. East Asia Regional Overview. East Asia NavigatesShort-Term Shocks for a Stronger Future. Washington, D.C.Available at: www.worldbank.org/eap/eapnsf.
Yusuf, Shahid, with M. Anjum Altaf, Barry Eichengreen, Sudar-shan Gooptu, Kaoru Nabeshima, Charles Kenny, Dwight H.Perkins, and Marc Shotten. 2003. Innovative East Asia: TheFuture of Growth. Washington, D.C: World Bank and OxfordUniversity Press.
xliv East Asia Integrates

Part I
WIDENINGOPPORTUNITIES
IN TRADEARRANGEMENTS


One of the great milestones for economic reform inChina, and for the world trading system, was theaccession of China to the World Trade Organiza-tion (WTO) in December 2001. China’s accessionwill have an enormous impact on both China andthe world trading system (Martin and Ian-chovichina 2001).
Other developing countries will feel the impactof China’s WTO accession through four mainchannels:
1. Expansion of markets in China for exports2. Increases in the supply of exports into others’
markets3. Competition in third-country markets4. Expansion of investment in China and, poten-
tially, outward foreign investment from China.
Understanding how these linkages will play outrequires a good understanding of how WTO acces-sion will affect China itself and, particularly, of howpolicy might develop in the many areas of reformthat go beyond the specific commitments inChina’s WTO accession package. Many excellent
3
1
China’s Accession to the WTO:
Impacts on ChinaWilliam J. Martin
Deepak BhattasaliShantong Li
studies have been conducted of aspects of theimpact of WTO accession on China, includingsymposia in the China Quarterly (see Fewsmith2001) and China Economic Review (see Chun,Fleisher, and Parker 2001); surveys of the estimatedimpacts of trade liberalization (see McKibbin andTang 2000; Gilbert and Wahl 2002); and studies ofthe impact of WTO on China and vice versa (Mar-tin and Ianchovichina 2001). This chapter buildson a large integrated study—undertaken by China’sDevelopment Research Centre of the State Counciland the World Bank—that examines the legalaspects of accession; estimates the impacts of theresulting policy changes on the overall economy;and then assesses impacts on poverty and policyoptions for dealing with these problems.1
There are many perspectives on China’s acces-sion to the WTO. According to one view, whichfocuses on legal rights and responsibilities, China’skey challenges are to meet its legal commitments toimplement particular policies and to ensure that itsrights are maintained through WTO mechanismssuch as its dispute settlement mechanism. Another,purely economic, view is that accession involves a
This chapter draws on a program of research presented in further detail in Bhattasali, Li, and Martin (forthcoming). Theresearch benefited from the support of UK Department for International Development. Particular thanks are due toIppei Yamazawa and Shujiro Urata for their comments at a seminar held at the World Bank office in Tokyo.

set of economic policy changes that will open upChina’s economy and make it much more engagedin the global economy. The most compelling per-spective is the one that sees WTO accession as acomponent of the broader set of reforms thatChina has undertaken since 1978—that is, as a setof policies that can contribute to development andpoverty reduction.
WTO rules are important ingredients in formu-lating good policies for development, but they donot constitute a complete recipe. Like most otherlaws, their intent is to reduce the adverse impacts ofthe actions of one individual or group on anotherrather than to guide a country on the best way toachieve its goals. Many WTO agreements allow agreat deal of choice within the range of legally per-missible policy options. Within the framework ofits WTO commitments, China may choose to pur-sue its development goals either aggressively orquite tentatively.2
In seeking to understand the implications ofChina’s accession to the WTO, we examine thenature of the policy changes associated with acces-sion; the implications of these policy changes for theChinese economy at large and for individual house-holds; and the complementary policies needed totake advantage of the opportunities created byaccession and to minimize the adjustment costs.
Policy Reforms Associated withAccession
The five basic principles of the General Agreementon Tariffs and Trade (GATT) and the WTO providea useful framework for analyzing the implications ofChina’s accession. These principles are: (1) nondis-crimination (the most-favored-nation [MFN] prin-ciple, under which the best market access given toany one Member is extended to all other Members);(2) market opening; (3) transparency and pre-dictability; (4) undistorted trade; and (5) preferen-tial treatment for developing countries.3
Nondiscrimination
The general principle of nondiscriminationrequires WTO Members to give equal treatment tocompeting suppliers and not to discriminatebetween domestically produced and importedgoods or services in their internal markets. In
China’s case, the application of this general princi-ple has involved some additional commitments,including eliminating dual pricing systems, phasingout restrictions on trading, and introducing moreuniform administrative arrangements and judicialreview. These agreements are of crucial importancenot just for the central authorities but also for thelower tiers of government, which are often involvedin internal trade and regulation.
Market Opening
The market opening principle is reflected in com-mitments by China to abolish nontariff barriers,reduce tariffs, and open its service sectors; in com-mitments by countries importing from China toabolish the quotas on textiles and clothing thatwere originally imposed under the Multi-fiberArrangement (MFA); and in commitments by theUnited States and other countries to impose MFNtariffs on China.
The cuts in import tariffs that China has offeredare very substantial, and will result in a reduction inthe weighted average tariff from 12 percent in 2001to 6.8 percent at the end of China’s WTO imple-mentation period.4 But these reductions are smallcompared with the reduction of 29 percentagepoints that China achieved between 1992 and 2001.China’s commitments to liberalize trade in servicesare extremely large relative to those of almost allother countries, although they are more often sub-ject to qualifications or reservations than those ofother countries.
China’s trading partners, for their part, havemade an important “concession” in abolishing thequotas that were imposed under the MFA. Theabolishment of these quotas is likely to provide sig-nificant opportunities for China to increase itsexports of textiles and clothing, given its strongcomparative advantage in these goods, althoughthe effects will be tempered if the importers exer-cise their right to impose special textile and cloth-ing safeguards for a year at a time during a transi-tion period up to 2007.
Another important “concession” by almost allexisting members of the WTO is to refrain frominvoking nonapplication provisions of the type thatwere widely invoked against Japan when it joinedthe GATT. Even though this concession does notinvolve much actual market opening, it means that
4 East Asia Integrates

China now receives permanent MFN status in vir-tually all markets. Having this status frees Chinafrom onerous one-sided review procedures, such asthe former annual review of China’s MFN status inthe United States, and it assures investors in China’sexport industries that foreign markets will be avail-able to them on a continuing basis.
Transparency and Predictability
The transparency and predictability of trade policyare enhanced both through general WTO policyrules, such as the need to publish trade rules andregulations, and through specific commitmentsChina has made, including provisions for uniformapplication of the trade regime and for indepen-dent judicial review. China has also put in place amechanism whereby concerned parties can bringproblems of local protectionism to the attention ofthe central government. Another important con-tributing factor is China’s binding of its entire tariffschedule for goods, almost always at tariff levelsbelow previous applied rates. This binding not onlyreduces tariffs and their variance, but also increasespredictability by ruling out tariff increases in thefuture. The annual transitional reviews to be heldfor eight years after China’s accession will provideadditional information about China’s regime andits reforms during that period. Also important forincreasing transparency are China’s commitmentsto phase out restrictions on trading rights for allproducts, except for a short list of commodities thatmay remain subject to state trading, and to allowthe entry of foreign, and frequently domestic, sup-pliers into distribution and wholesale services.
The emphasis on transparency, and the specificrequirements to this effect, may help to avoid costlyand acrimonious disputes of the kind that marredtrade relations between Japan and (in particular)the United States during Japan’s era of high exportgrowth.
Undistorted Trade
The WTO principle of undistorted trade involvesgeneral disciplines in areas such as subsidies andcountervailing measures, antidumping, and safe-guards. China has made more stringent commit-ments than those normally required, including onenot to subsidize its agricultural exports, and, for
industrial goods, disciplines on some forms ofexport subsidies generally allowed in developingcountries.
The existing regime of antidumping and safe-guard measures has troubling implications forChina’s access to export markets. The WTO rulesagainst dumping are biased toward finding dump-ing even where no economically meaningfuldumping exists (Messerlin 2002). The situation isworse for China than for other WTO Members,because 70 percent of China’s exports are in prod-ucts that are most vulnerable to antidumpingmeasures. Furthermore, China could remain vul-nerable, for up to 15 years, to highly discriminatoryprovisions that are applied to nonmarketeconomies and dramatically increase the probabil-ity of dumping being found. When antidumpingduties are applied under these provisions, they aregenerally much higher than the duties applied tomarket economies. For example, the average 40percent duty applied by the United States againstnonmarket economies was more than 10 timeshigher than that applied where the margin was cal-culated based on actual costs.
A particularly worrying feature of China’s acces-sion agreement is the product-specific transitionalsafeguard provisions. These provisions may beapplied by any WTO Member, and may then triggeractions against the diversion of Chinese exports toother markets (Panitchpakdi and Clifford 2002).They are, in a sense, worse than the provisions onnonmarket economy treatment in that they intro-duce an entirely new form of protection, targetedspecifically against China; they are more readilytriggered than regular safeguards; and they are avail-able to China’s trading partners for up to 12 yearsfrom the date of China’s accession (Anderson andLau 2001). The trade diversion measures allowedunder these provisions are particularly troubling,because they provide even less procedural protec-tion than is available under regular safeguards.
Proposals to use the product-specific safeguardsagainst China’s exports of textiles and clothing havealready surfaced in the United States, despite thecontinuing presence of quotas originally imposedunder the Multi-fiber Arrangement. If the product-specific safeguards are invoked and other countriesdo not resist the temptation to use the trade diver-sion measures, there is a risk of a domino effect:China’s exports would be diverted to fewer and
China’s Accession to the WTO: Impacts on China 5

fewer markets, and China would increasingly betempted to retaliate against what it would almostcertainly see as unfair barriers against its exports.For example, China might increase its use ofantidumping actions and contest the safeguardactions through the WTO’s dispute settlementmechanism, or it might mount a concerted cam-paign for reform of the rules in the Doha negotia-tions, particularly in the area of antidumping(Messerlin 2002). Whatever the case, the resultcould be serious damage to both China and thetrading system.
Clearly, China will need to contest unjustifiedactions and seek settlement of disputes. But retalia-tion that involves launching antidumping actions islikely to be extremely costly to its economy, both byreversing the liberalization process and by increas-ing the uncertainty about trade policy. Even thoughretaliation is likely to be politically attractive (asconfirmed by the recent upsurge in antidumpingactions in China—and the dramatic upsurge inthese actions by developing countries such asArgentina, India, Mexico, and South Africa), theeconomic costs to China in particular suggest thatit should be avoided as much as possible.
If China chooses instead to lead a push forreform of the antidumping and safeguard rules toreduce the abuses of these protectionist measures, itcould greatly improve the performance of its owneconomy in the short run and that of the globaltrading system in the longer run. Messerlin (2002)suggests two courses of action. First, related to itstreatment as a nonmarket economy, China couldpress for new rules on the automatic granting ofmarket economy status in a particular commodity,applicable as long as a country meets basic condi-tions such as low rates of protection, an absence ofserious nontariff barriers, and an absence of statemonopoly in the distribution of that commodity.Second, as for antidumping measures more gener-ally, China could put forward, or strongly support,proposals to narrow the use of antidumping mea-sures and to reduce their severity. China might alsoseek similar relief on the product-specific safe-guards. The abuse of antidumping policies by themajor trading countries and by a growing numberof developing countries is a problem for most ofthe other economies of East Asia, and China couldsurely strengthen the coalitions formed at the WTOto push for stronger rules against this abuse.
Preferential Treatment for Developing Countries
Preferential treatment was a particularly vexingissue throughout the negotiations. Although Chinahas a much lower per capita income than manyeconomies in the WTO that are classified as devel-oping, its size and growth performance made exist-ing WTO Members reluctant to accord it full devel-oping country treatment. In many areas of theagreement, China is likely to have full access to thedeveloping country provisions, but in particularcases it faces tighter restrictions than other devel-oping countries.5 At the same time, China hasobtained specific transitional arrangements inareas such as the phasing out of quotas and licensesand phased entry of foreign enterprises—areas thatare not generally available to developing countrymembers. Because special treatment in the form ofpreferential access to industrial country markets isnot important for China, it has a strong interest inreducing the trade barriers in industrial countriesin the only way it is able—through multilateraltrade reform that lowers protection in the indus-trial countries, particularly on labor-intensiveproducts such as textiles, clothing, and footwear inwhich China has a strong comparative advantage.
Intellectual Property Rights
The Agreement on Trade-Related Aspects of Intel-lectual Property Rights, or TRIPS, which is an inte-gral part of the WTO, involves a number of GATTprinciples such as nondiscrimination and seeks toachieve a balance between offering incentives forinnovation and allowing broad access to informa-tion. An intellectual property regime appropriate toa developed country may be much too rigorous fora developing country; such a regime may inhibitgrowth by limiting innovation and diffusion andresult in excessive transfers to foreign producers ofintellectual property. But all countries require regu-lations to ensure that markets remain competitivewithout excessively reducing the incentive to inno-vate. The TRIPS agreement is generally seen as pro-viding the flexibility needed to design such aregime, but implementation will not be easy.
For China, the TRIPS agreement is a key aspectof WTO accession. Recognizing the need to stimu-late innovation domestically and gain access to for-eign technology and responding to pressure from
6 East Asia Integrates

its trading partners, China has strengthened itsintellectual property rights (IPR) regime. Since1990, China has updated its laws on copyrights,trademarks, patents, and trade secrets and adoptedprotection for new plant varieties and integratedcircuits. These changes are particularly importantfor China’s East Asian neighbors, many of whomare engaged in intellectual property–intensiveactivities in China.
China’s intellectual property rights regime isbroadly appropriate to China’s situation.6 In partic-ular, Maskus (2002) believes that China’s policy ofpublic procurement of pharmaceuticals at negoti-ated prices is appropriate for providing publichealth services. He also concludes that, with currentreforms, the regime will be fully consistent with theTRIPS requirements.
However, Maskus raises some important issuesabout TRIPS policies and their implementation inChina. One concerns proposals to extend patentprotection to computer software, giving a level ofprotection currently provided only in the UnitedStates, Japan, and Australia that is perhaps excessivefor a young industry such as China’s. Serious prob-lems in enforcing trademarks, patents, and tradesecrets in particular could inhibit the transfer oftechnology in China and the development of inno-vative domestic businesses. For China, with its cur-rent low allocation of resources to research anddevelopment, laws protecting domestic innovationsare of limited benefit. Key issues for the futureinclude enhancing pricing regulations on pharma-ceuticals as patent protection becomes stronger anddeveloping a broader competition policy regime todeal with abuses of IPRs such as monopoly pricingand restrictive licensing arrangements.
Sectoral Impacts of Accession
To evaluate the impacts of changes in China’s tradepolicy arising from WTO accession, we first assessedthe policy stance prior to accession and then tracedthe implications of the policy measures being intro-duced. This section describes the evidence on agri-culture, manufacturing, and services in turn.
Agriculture
Many authors have raised concerns about the impactof WTO accession on China’s agriculture and the
many poor people engaged in this sector. Much ofthe concern has arisen from comparisons of China’sstatutory tariffs on agriculture in the 1990s with therates agreed on in the accession process (see, forexample, Schmidhuber 2001). But other authorshave pointed out that the statutory tariff rates borelittle relationship to the actual protection (or taxa-tion) that China’s agricultural sector experienced(see, for example, Johnson 2000 and Lin 2000).
The evidence on the actual rates of protectionapplying to agriculture is still extremely limited andoften contradictory. Agricultural trade in China hasbeen influenced by a bewildering array of policieson imports and exports, including state trading,designated trading, quotas, licenses, tariffs, and tar-iff-rate quotas. Many studies have tried to deal withthis problem by summarizing the protective impactof agricultural trade policies in terms of the pricedistortions created by these measures. The morerestrictive the trade measure, in general, the largerwill be the distortion—that is, the gap between thedomestic price and the international price.
Several studies have estimated the size of theagricultural distortions using the available series ondomestic and international prices. Unfortunately,the results obtained have varied widely.7 And whileCarter (2000) and Martin (2001) felt that WTOaccession would require relatively little liberaliza-tion in China, Schmidhuber (2001) and many oth-ers believed that dramatic changes would beneeded. Clearly, a new approach was required,especially because the policy consequences are solarge.
Huang and Rozelle (2002) adopted a newapproach by basing their analysis of policy impactson detailed interviews with participants in China’sagricultural markets rather than on available priceseries. Their approach provides a much clearerindication of the implications of agricultural tradepolicies for product prices and of the real-worldimpacts of policies. They show, for example, that amajor source of the discrepancies in earlier researchis differences in quality between domestic productsand those traded internationally. They also identifyfeatures of the trade regime, such as export subsi-dies on maize and cotton, that have importantimpacts on product markets.
What then do China’s accession commitmentsimply for agricultural markets? For those productsprotected by ad valorem tariffs, the implications are
China’s Accession to the WTO: Impacts on China 7

straightforward. A reduction in the tariff indicatesdirectly the reduction in the domestic price of thegood, and this change, together with informationon the slope of the import demand curve, can beused to estimate the cost of protection. For thoseproducts protected by both a tariff and an exportsubsidy, it may be necessary to consider changes inboth variables. For products that are being pro-tected, or are to be protected, using tariff-rate quo-tas, the analysis becomes much more complex. Forthem, the impact of a tariff reduction dependsgreatly on whether it is the within-quota or the out-of-quota tariff that determines the price of thegood. And where the quota will be filled in someyears but not in others, the average rate of protec-tion may be a combination of the two tariff rates.
Table 1.1 shows some key assessments of theimplications of the level of protection and thechanges associated with WTO accession. The statu-tory tariff rates for 1998 used by Schmidhuber(2001) and others are given in the first column; theestimates by Huang and Rozelle (2002) of protec-tion in 2001 are given in the second. The third col-umn shows the anticipated average rates of protec-tion after accession, taking into account the reformsrequired by accession and likely market outcomes.
For rice, wheat, and maize, the adjustmentsrequired by WTO accession will be much smallerthan those suggested by analyses based on the statu-tory rates of protection. For rice, Huang and Rozelle(2002) estimate that the average rate of protectionwas slightly negative before accession, implying thatChina’s system of state trading for rice operated in a
way in which rice exports were taxed slightly in 2001.After accession, the rate of protection is expected toremain the same, because accession to WTO doesnot require reductions in negative protection that isadministered by state trading or an export tax. Forwheat, protection averaged an estimated 12 percentbefore accession—much lower than would be sug-gested by simple price comparisons. After accession,this rate of protection need not be greatly reducedon average, because it seems likely that wheatimports will exceed the tariff-rate quota reasonablyoften (Martin 2001), allowing the imposition of atariff of up to 65 percent. For maize, the rate of pro-tection before accession was higher, at 32 percent,because of an export subsidy. After accession, thelevel of import protection need not change greatlyon average, because there is a significant probabilitythat the tariff-rate quota will bind by the end of thedecade (Martin 2001). But the maize export subsidymust be abolished, implying a potentially substantialreduction in the price support given to maize.
Oilseeds present a different case. Here, the prin-cipal form of protection has been a tariff, and thetariff is being reduced substantially. For sugar, theprotection provided must be halved to meetChina’s commitments to a bound tariff of 20 per-cent. On cotton, import protection will not changegreatly, but export subsidies such as the 10 percentexport subsidy observed in 2001 are ruled out inthe future. For livestock and meat, protection couldremain negative as a consequence of export restric-tions to markets such as Hong Kong (China). Pro-tection of dairy products can be expected to decline
8 East Asia Integrates
TABLE 1.1 Some Measures of Import Protection in China’s Agriculture (percent)
1998 statutory 2001 actual Postaccession tariffs protection protection
Rice 127 –3.3 –3.3Wheat 133 12.0 12.0Maize 130 32.0 32.0Vegetables and fruits 15 –4.0 –4.0Oilseeds 132 20.0 3.0Sugar 30 40.0 20.0Cotton 3 17.0 20.0Livestock and meat 35 –15.0 –15.0Dairy 46 30.0 11.0
Source: Average statutory rates taken from Schmidhuber (2001) and www.chinavista.com. See Huang andRozelle (2002) for estimates of protection.

to meet China’s tariff-binding commitments.The reductions in protection shown in Table 1.1
(also Figure 4 of the Overview) are just one set ofpossible outcomes in a situation in which rates ofagricultural protection can vary substantially, par-ticularly if import levels exceed the tariff-rate quo-tas. However, the reductions show that China’s pol-icymakers will still be able to exercise significantdiscretion after accession.
Removing the negative protection from labor-intensive products would be consistent with WTOrules and is likely to be particularly beneficial foremployment in rural areas, as well as for economicefficiency. By taking part in the WTO agriculturalnegotiations being conducted under the DohaDevelopment Agenda, China could potentiallyreinforce these benefits by opening large, and cur-rently highly protected, markets for its labor-inten-sive agricultural exports. Unfortunately, the highrates of agricultural protection that arose whenGATT rules on agriculture were extremely weakmean that China faces barriers to its agriculturalexports that are four times as high as those it faceson its other merchandise exports (Martin 2001).
China’s accession to the WTO with relatively lowtariff bindings on agricultural products prevents itfrom following the path of ever-increasing agricul-tural protection that other high-growth East Asianeconomies have followed (Anderson and others1986). Even China’s highest tariff bindings, of 65percent, provide only one-tenth of the protectioncurrently observed for wheat and rice in Japan(Martin 2002). Given China’s size, this situation isextremely important for world agricultural mar-kets; had China gone down the road of Japan, theworld market for rice and other agricultural com-modities would be permanently depressed.
China’s commitment to a low-protection agri-cultural regime will greatly reduce the costs ofachieving successful economic development. More-over, it will force future policymakers to focus onpolicies such as improvements in rural educationand reductions in barriers to labor mobility thatwill deal effectively with the problems of ruralpoverty in China—rather than resort to commod-ity price distortions, which serve, at best, as a short-term, palliative measure.
China’s agricultural trade commitments throwinto stark contrast the costly and inefficient regimesin neighboring economies (OECD 2002a) and
increase the pressure for their reform. Lookingahead, China is unlikely to be satisfied if traderssuch as Japan and the Republic of Korea are allowedto maintain agricultural protection rates muchhigher than its own. The increasing openness ofChina’s market for agricultural products will createmuch bigger markets for land-intensive productssuch as rice from some East Asian countries, and forspecialty, high-quality products from almost allcountries. But strong policy efforts by China andother agricultural exporters in the current WTOnegotiations will be required to expand marketaccess in the current highly protected agriculturalmarkets.
China will clearly have a strong interest inexpanding its access to export markets for its labor-intensive agricultural products. Particularly forperishable products such as fruits and vegetables,many of the logical markets are in East Asia. It isvitally important that China’s trading partners pro-vide opportunities for China to expand its exportsof these products, which are so important for creat-ing employment for relatively poor rural people.Analysis by Yu and Frandsen (2002) suggests thatagricultural liberalization by member countries ofthe Organisation for Economic Co-operation andDevelopment (OECD) would benefit China andimprove its agricultural trade balance. China’srights as a WTO Member at least give it an oppor-tunity to insist that adequate procedures be fol-lowed and to limit the duration of measures such assafeguards. It would be particularly unfortunate ifChina’s trading partners resorted to the use of stan-dards as a means of restricting access. Such mea-sures are not transparent and are divisive in nature.
If China elects to remove its negative protectionfrom key commodities such as rice, vegetables, andmeats, Anderson, Huang, and Ianchovichina(2002) estimate that the returns to unskilled rurallabor and to farmland would rise slightly, so thatthe overall impact of the accession on rural wageswould be –0.5 percent instead of –0.7 percent. If, onthe other hand, the in-quota tariff rates were uni-formly applied, then the returns to farm factorswould deteriorate by about the same amount.
Industrial Products
Most of the adjustment needed in industrial tariffshas already occurred, and what remains are an
China’s Accession to the WTO: Impacts on China 9

expansion in both imports and exports and a likelypainful restructuring of some key industries.
China substantially reduced its tariffs on manu-factures during the 1990s: weighted average tariffson manufactures fell from 46.5 percent in 1992 to25 percent in 1995 and to around 13 percent by thetime of accession in 2001. With full implementationof China’s accession commitments, these tariffs willfall to 6.9 percent. The 6 percent reduction in aver-age tariffs that remains to be implemented is impor-tant, but small relative to the 33 percent reductionsince 1992 or the 12 percent reduction since 1995(Ianchovichina and Martin 2002).
The largest reductions in industrial tariffs arenow required in beverages and tobacco (a 28 per-cent reduction from 2001 levels) and in automobiles(a 15 percent reduction from 2001 levels)—seeTable 1.2. While large, these reductions are muchsmaller than those already undertaken since 1995.The reduction in protection to the automobile sec-tor is particularly important given the high profileof this industry and its linkages throughout theeconomy (see the next section on motor vehicles).
Other industries in which substantial reductionsin tariffs will be needed include textiles, clothing,electronics, and light manufactures. Many of theseindustries are relatively labor-intensive ones inwhich China has a comparative advantage and inwhich liberalization will help to maintain efficiencyand competitiveness.
The new tariff concessions in manufacturingwill provide enormous opportunities for expand-
ing trade in both final goods and production inputsbetween China and its regional neighbors. China’simports will grow because of the reductions in pro-tection, and exports will expand because ofinduced drops in production costs in China.
Industry in China will face substantial adjustmentpressures in key products such as automobiles, bever-ages, and tobacco, where external protection is beingsubstantially reduced. Restructuring of scale-inten-sive industries such as the motor vehicle will be essen-tial and can generate substantial productivity gains.
Ianchovichina and Martin (2002) estimate thatChina’s imports of merchandise will rise by 17 per-cent on average as a result of the WTO-induced tar-iff reductions after 2001, with particularly largeincreases in products such as beverages and tobacco(112 percent). Much of the benefit is likely toaccrue to China’s neighbors in East Asia.
Motor Vehicles. In the absence of reform andrestructuring, China’s output of motor vehicleswould likely drop sharply in the postaccession years,notwithstanding strong increases in domesticdemand and the shift in China’s comparative advan-tage to more capital- and skill-intensive productssuch as motor vehicles (Francois 2002). China’s autoindustry has been shaped by protective policies thathave encouraged inefficient production and allowedfor market segmentation; indeed, most plants areoperating well below global standards for efficientproduction. Development of a healthy and interna-tionally competitive industry will require consider-
10 East Asia Integrates
TABLE 1.2 Protection of Industrial Sectors in China (percent)
1995 2001 Postaccession
Processed food 20.1 26.2 9.9Beverages and tobacco 137.2 43.2 15.6Extractive industries 3.4 1.0 0.6Textiles 56.0 21.6 8.9Apparel 76.1 23.7 14.9Light manufactures 32.3 12.3 8.4Petrochemicals 20.2 12.8 7.1Metals 17.4 8.9 5.7Automobiles 123.1 28.9 13.8Electronics 24.4 10.3 2.3Other manufactures 22.0 12.9 6.6Total manufactures 25.3 13.5 6.9
Source: Ianchovichina and Martin (2002).

able restructuring of this industry (Harwit 2001).We estimate that restructuring in the motor vehicleindustry to achieve scale economies in final assem-bly could reduce production costs by about 20 per-cent (Francois 2002). Such restructuring wouldmore than reverse the negative impact on output ofthe reduction in protection from 1997 levels, andwould allow the industry to expand dramatically asChina’s growth and shifting comparative advantageshift resources into sectors such as motor vehicles. Ifthe industry is restructured successfully, exports offinished motor vehicles would increase rapidly,resulting in an increase in total exports of vehiclesand parts of more than US$4 billion a year.8
Increases in the efficiency of the final assemblyindustry relative to the production of intermediateparts are likely to increase the demand for importedparts substantially, with their share of total parts ris-ing from 39 percent to 52 percent.
Clearly, profound adjustments are in storethroughout the auto industry. Considerable painfulrestructuring, such as the closure of inefficientplants in many cities, will be required. However,there seems to be no alternative if China is to moveto an efficient and internationally competitivemotor vehicle sector.
Policy Concerns. What are the likely effects of thelarge reductions in the barriers facing China’sexports of textiles and clothing to Europe, the UnitedStates, Canada, and Norway? Because these barriersare implemented through export quotas—that is, anexporter is required to purchase an export quota, orto forgo the opportunity to sell quotas it has beenallocated by the government—they impose a cost onexports that is analogous to an export tax. Based ondetailed information on quota prices, this tax is esti-mated to be around 15 percent for clothing and 10percent for textiles (see www.chinaquota.com). Forparticular products, the export tax equivalent ofthese measures is much higher.
The analysis by Ianchovichina and Martin(2002) focuses largely on tariffs (given the greatuncertainty about the protective impacts of nontar-iff barriers such as designated trading, quotas, andlicenses in China, and their limited remaining cov-erage9), although it also considers the export quotason textiles and clothing. Omission of the effects ofremoving nontariff barriers means that the resultsgive something of a lower-bound estimate of the
benefits of the liberalization associated with acces-sion, and they downplay some important actualand potential elements of trade policy.
A key omission of the analysis is the possibilitythat antidumping and safeguard measures might beapplied against China. Another is the increasing useof measures of this type by China. The introduc-tion of the product-specific safeguards againstChina is particularly important in this respectbecause no such measure specifically targetedChina before China’s accession. The risk that Chinawill increase its use of antidumping and safeguardmeasures beyond the currently high levels is also ofconcern for development policy. Such an actionwould be a triumph of a rules-focused approach toWTO implementation—“it is legal therefore, weshould do it!”—over the sharp focus on develop-ment that has characterized China’s trade reformagenda since the beginning of the reform era.
Services
Trade in services was a key area in China’s WTOaccession negotiations, and China’s commitmentsrepresent perhaps the most thoroughgoing liberal-ization of the services trade ever undertaken in theWTO (Mattoo 2002). Its range of offers isextremely broad, although some commitmentsinvolve restrictions on ownership, business scope,or region. Critical sectors such as telecommunica-tions, logistics, and finance are going to facerenewed competition and are likely to see a burst ofinnovation and productivity growth as they arerestructured. Many middle-income developingcountries, such as Thailand, that have experience indealing with these problems are likely to find sub-stantial market opportunities.
An important feature of China’s commitmentsis that they focus on market access and do not dis-criminate between domestic and foreign suppliers.However, China’s commitments are carefullycrafted: in cross-border trade and in services con-sumed abroad, the number of sectors with guaran-teed unrestricted access is smaller than in mostother countries, and in establishment trade it isessentially zero.
Restrictions on Service Activities. Restrictions onthe form of business establishments, such asrequirements for joint ventures, business scope,
China’s Accession to the WTO: Impacts on China 11
and geographic scope, have a long history in China,and have often been justified as a means to acquiretechnology or obtain a share of monopoly rents. AsMattoo (2002) points out, rules requiring busi-nesses to form joint ventures may in fact inhibit thetransfer of technology. A more thoroughgoingapproach to the problem of monopoly rents wouldensure that competition between firms, whetherdomestic or foreign, would eliminate these rents.
Many restrictions on the geographic scope ofservice suppliers, such as restrictions on the citiesthat can be served by insurance companies, datefrom an era when it was believed that experimenta-tion with market-oriented approaches needed to beisolated because of the inconsistencies between, forexample, planned and market prices. There seemsto be much less need for such policies now that theoperation of market economies is so much betterunderstood in China. Restrictions such as those inthe WTO agreement that confine foreign venturesto five cities for five years—insurance is one exam-ple—might encourage agglomeration of theseactivities in the favored cities, and that agglomera-tion will not be reversed when the restrictions aresubsequently lifted. This situation may reduce theopportunities for other parts of China, such as inte-rior cities with a potential comparative advantagein these activities, to get started in these activities.
There appear to be good developmental reasonsfor China to phase out its geographic restrictionsmore quickly than required by the WTO commit-ments, given the risks of exacerbating the alreadysubstantial inequalities between coastal and inte-rior provinces. China’s commitments do not pre-vent the authorities from moving ahead faster thanrequired, as they have done frequently in the past.
Regulations on services may have various goals,including making competition work, improvingthe availability of information to consumers, andensuring universal service. Making competitionwork is particularly important in network indus-tries such as telecommunications, where the domi-nant incumbent firms frequently do not find it intheir interests to allow new firms to interconnect totheir networks. Improving the availability of infor-mation is particularly important in financial ser-vices, where lenders often do not have enoughinformation on the prospects and repaymentcapacity of borrowers. Developing efficient provi-sions on universal service is important for ensuring
that all parts of China have access to telecommuni-cations services.
Logistics. China’s WTO commitments on logisticsinvolve a range of General Agreement on Trade inServices (GATS) service sectors, including packagingand courier services, maritime and rail transport,freight forwarding, and storage and warehousingservices. Logistics costs are disproportionately highin China, and service quality is lower than desirable,in part an enduring legacy of the planned economy(Findlay and Luo 2002). Logistics-related costs arewidely seen as accounting for up to 30–40 percent ofthe wholesale costs of manufactured goods in China,as against 5–20 percent in the United States (seeFindlay and Luo 2002 and Tanzer 2001). High logis-tics costs are a particularly important problem forpeople in the poorer parts of China. Their ability totrade and, consequently, their real incomes are sig-nificantly reduced by these excessive costs. China hascommitted itself to increasing competition in somekey areas, including road transport, rail transport,warehousing, and freight forwarding. The breadth ofthese commitments also provides a much strongerbasis for development of integrated third-party10
logistics firms able to reduce the costs and increasethe quality of logistics services in China.
China has made substantial progress towardmeeting its commitments on logistics services.Findlay and Luo (2002) believe that the costs of awide range of goods and services might be reducedby about 10 percent from current levels—a hugesavings that would raise incomes substantially inChina, increase opportunities for exports to China,and strengthen China’s competitiveness in exportmarkets.
Achieving the full potential of logistics in Chinawill require not just freer trade but also regulatoryreforms—to remove discrimination against partic-ular types of enterprises, to separate local adminis-trations from enterprises, and to eliminate localprotectionism. In addition, substantial investmentsin infrastructure will be needed to improve thetimeliness, and reduce the cost, of providing logis-tics services.
Telecommunications. China’s commitments intelecommunications take on particular importancegiven that China is expected to be the largest marketfor telecommunications in the world by 2010
12 East Asia Integrates

(Pangestu and Mrongowius 2002). These commit-ments allow foreign entry to a wide range of activitiescurrently closed to foreign investment. Furthermore,this entry takes place in a sector that was monopo-lized by China Telecom until 1994 and is currentlydominated by a small number of state-owned firms.
In basic telecommunications, China has com-mitted to the disciplines of the WTO referencepaper on the regulatory framework for telecommu-nications (WTO 1996). These disciplines aim toensure a competitive environment that allowsinterconnection between systems under reasonableand nondiscriminatory conditions and that allowsfor universal service provisions. They also requirethe existence of a regulator independent of the tele-com provider and set criteria for licensing of entryand allocation of scarce commodities such as themobile telephone spectrum.
In the context of a basic telecommunicationssystem governed by the WTO regulatory frame-work, China’s other GATS commitments covervalue added services such as voice mail and onlineinformation services; mobile voice and data ser-vices; and domestic and international services suchas private leased circuit services. Most of these ser-vices are initially subject to a combination of own-ership restrictions and geographic restrictionswithin China. Although the geographic restrictionswill be phased out over several years, China has notcommitted to allowing more than 49 percent for-eign ownership in important areas such as mobiletelephone service. Allowing higher levels of foreignownership would, of course, be consistent withChina’s GATS obligations.
Allowing the telecommunications sector tomake its maximum contribution to China’s devel-opment will require further reforms of the regula-tory framework. Important issues will includeensuring the independence of the regulator, ensur-ing that interconnection works adequately, andmaking pricing regulations more flexible.
Financial Services. China’s WTO commitments onfinancial services call for radical changes in thestructure of the system. This was a remarkable out-come given that, prior to accession, China’s financialsector was widely regarded as being far from readyfor a major increase in competition from abroad.
The size of the Chinese financial market was sig-nificant, with deposits at banks reaching 150 per-
cent of the gross domestic product (GDP) in 2001,and China’s securities market was the second largestin Asia, with a market capitalization approaching 45percent of GDP. However, four large state banksaccounted for 67 percent of deposits and 56 percentof total financial assets. A key problem in the finan-cial sector was insolvency and a lack of profitabilityin the four big state banks, with more than a quarterof outstanding loans nonperforming. Althoughthere have been improvements, these banks werewidely regarded as having limited ability to makelending decisions based on repayment ability andcredit risk. Furthermore, the administered spreadsbetween deposit and lending rates were very nar-row, reducing the profitability of the banks and theirincentives to lend to many dynamic areas of theeconomy. Many foreign banks were active in China,but they accounted for less than 3 percent of assetsand only 0.1 percent of deposits.
China’s accession commitments allowed foreignbanks to enter the foreign currency business imme-diately, the local currency business for enterprisesafter two years, and the local currency business forall clients after five years. In the securities markets,foreign securities were allowed immediate entryinto trading in foreign currency–denominatedsecurities and entry within three years to joint ven-tures trading in domestic shares. Insurance firmswere allowed immediate entry into reinsurance andlife insurance and entry after two years into healthinsurance, pension insurance, and annuities.
The objective of these radical reform commit-ments appears to have been the vital one of bring-ing about technical innovation that will reduce thecost of financial services and help to stimulategrowth. It seems clear that considerable furtherreform, and probably some re-capitalization of thestate banks, will be required if this goal is to beachieved without the collapse of the state banks or abroader financial crisis.
Impacts of Reforms on the Economy
Because the reforms undertaken by China inresponse to WTO accession are broad-ranging andtheir economy-wide interactions extensive, it isimportant to evaluate these reforms on an econ-omy-wide basis. They need to be seen in the contextof the dramatic changes already under way in
China’s Accession to the WTO: Impacts on China 13
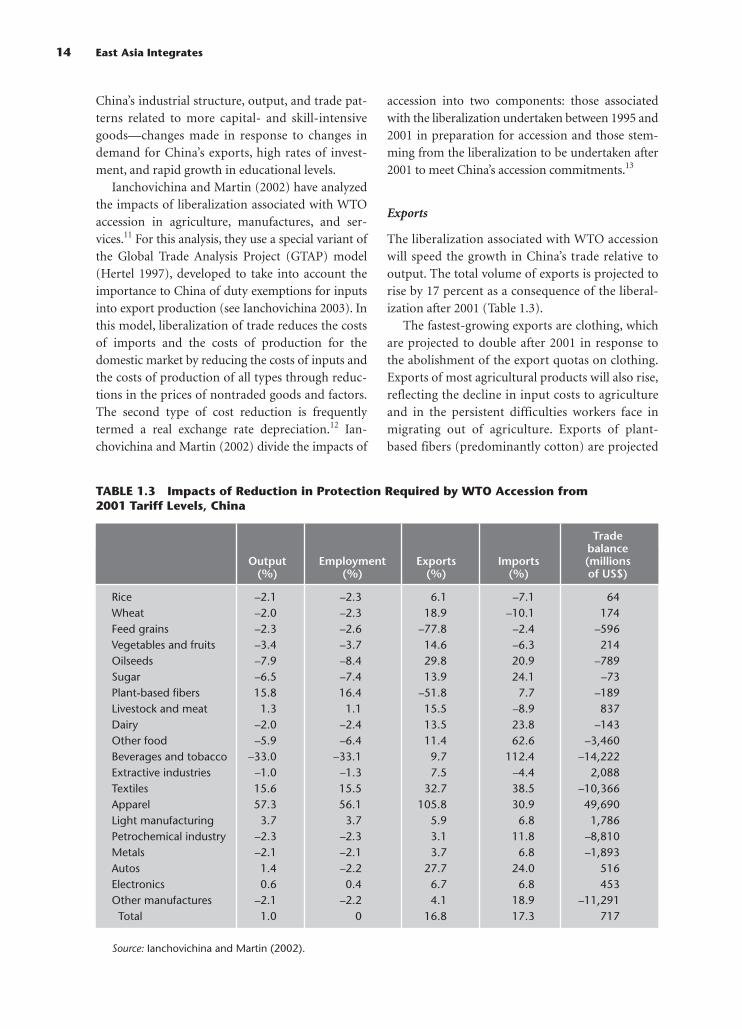
China’s industrial structure, output, and trade pat-terns related to more capital- and skill-intensivegoods—changes made in response to changes indemand for China’s exports, high rates of invest-ment, and rapid growth in educational levels.
Ianchovichina and Martin (2002) have analyzedthe impacts of liberalization associated with WTOaccession in agriculture, manufactures, and ser-vices.11 For this analysis, they use a special variant ofthe Global Trade Analysis Project (GTAP) model(Hertel 1997), developed to take into account theimportance to China of duty exemptions for inputsinto export production (see Ianchovichina 2003). Inthis model, liberalization of trade reduces the costsof imports and the costs of production for thedomestic market by reducing the costs of inputs andthe costs of production of all types through reduc-tions in the prices of nontraded goods and factors.The second type of cost reduction is frequentlytermed a real exchange rate depreciation.12 Ian-chovichina and Martin (2002) divide the impacts of
accession into two components: those associatedwith the liberalization undertaken between 1995 and2001 in preparation for accession and those stem-ming from the liberalization to be undertaken after2001 to meet China’s accession commitments.13
Exports
The liberalization associated with WTO accessionwill speed the growth in China’s trade relative tooutput. The total volume of exports is projected torise by 17 percent as a consequence of the liberal-ization after 2001 (Table 1.3).
The fastest-growing exports are clothing, whichare projected to double after 2001 in response tothe abolishment of the export quotas on clothing.Exports of most agricultural products will also rise,reflecting the decline in input costs to agricultureand in the persistent difficulties workers face inmigrating out of agriculture. Exports of plant-based fibers (predominantly cotton) are projected
14 East Asia Integrates
TABLE 1.3 Impacts of Reduction in Protection Required by WTO Accession from 2001 Tariff Levels, China
Trade balance
Output Employment Exports Imports (millions (%) (%) (%) (%) of US$)
Rice –2.1 –2.3 6.1 –7.1 64Wheat –2.0 –2.3 18.9 –10.1 174Feed grains –2.3 –2.6 –77.8 –2.4 –596Vegetables and fruits –3.4 –3.7 14.6 –6.3 214Oilseeds –7.9 –8.4 29.8 20.9 –789Sugar –6.5 –7.4 13.9 24.1 –73Plant-based fibers 15.8 16.4 –51.8 7.7 –189Livestock and meat 1.3 1.1 15.5 –8.9 837Dairy –2.0 –2.4 13.5 23.8 –143Other food –5.9 –6.4 11.4 62.6 –3,460Beverages and tobacco –33.0 –33.1 9.7 112.4 –14,222Extractive industries –1.0 –1.3 7.5 –4.4 2,088Textiles 15.6 15.5 32.7 38.5 –10,366Apparel 57.3 56.1 105.8 30.9 49,690Light manufacturing 3.7 3.7 5.9 6.8 1,786Petrochemical industry –2.3 –2.3 3.1 11.8 –8,810Metals –2.1 –2.1 3.7 6.8 –1,893Autos 1.4 –2.2 27.7 24.0 516Electronics 0.6 0.4 6.7 6.8 453Other manufactures –2.1 –2.2 4.1 18.9 –11,291Total 1.0 0 16.8 17.3 717
Source: Ianchovichina and Martin (2002).

to fall, reflecting the increased demand for cottonin the export production of textiles and clothingand the abolishment of export subsidies. Feed grainexports will also fall, because of abolishment of theexport subsidy on exports of maize. Exports ofautomobiles will rise substantially, because autoproduction becomes more efficient as it exploitseconomies of scale and becomes more exposed tointernational competition
None of these projected increases in exportstakes into account the possible benefits to China ofbeing able to expand its market access through par-ticipation in WTO market accession negotiations,such as those currently under way as part of theDoha Development Agenda. The expansion in tex-tile and clothing exports is, in fact, a delayed benefitfrom the Uruguay Round, previously denied toChina as a nonmember of the WTO.
Imports
China’s imports are projected to rise in a range ofsectors in which trade barriers have been substan-tially reduced—including beverages and tobacco,processed food, textiles, clothing, oilseeds, dairyproducts, and sugar. Imports of beverages andtobacco will rise the most because of the sharpreductions in tariffs on these commodities. Importsof services are also projected to rise substantially,because trade liberalization in services is expectedto reduce import barriers.
Employment
The projected movements of labor between sectorsare generally quite small relative to the changes intrade patterns. The biggest postaccession change inemployment is likely to be in clothing, with a rise ofmore than 50 percent after 2001. Employment inthe textile sector and in plant fibers used in textileproduction will also rise to meet the demand fromthe clothing sector. Trade reform will lead to smallreductions in employment in most agricultural sec-tors and in manufacturing sectors such as petro-chemicals, metals, and automobiles.
Welfare Gains
Trade liberalization is a source of substantial overallwelfare gains for China. The liberalization under-
taken between 1995 and 2001 is estimated to yield acontinuing gain of $30 billion a year. The smallerreduction in protection between 2001 and the endof the implementation period will generate asmaller gain of $10 billion a year.14
As for the distribution of the projected gains, thewages of skilled and unskilled urban workers willrise modestly, and the wages of unskilled farmworkers will decline by 0.7 percent in real terms.The distribution of gains is examined further in thenext section.
Effects of WTO Accession at theHousehold Level
The simplest approach to capturing the effects ofWTO accession at the household level requires anassessment of the changes in the prices consumerspay; the changes in the prices that owners of labor,capital, and other factors receive for their resources;and the effects of accession on the government’sability to provide transfers or public goods. In addi-tion, it is useful to assess the ability of householdsto adjust to the changes resulting from accession,perhaps by changing their activities.
Effects on Rural and Urban Households
Because ongoing work on trade and poverty hasfound that impacts felt through factor markets areconsistently more important than impacts feltthrough consumer prices, it is certainly worthwhileto examine the impacts of trade liberalization on fac-tor markets. This is particularly the case in China,with its large income differences between urban andrural workers and explicit policy barriers to themovement of labor between urban and rural sectors.
China’s labor markets are affected adversely by arange of regulations that restrict the movement ofworkers from rural to urban areas. These includethe hukou system of residence permits, which regu-lates movement between urban and rural employ-ment. Another inhibiting feature is the restrictionson the sale of farmland usage rights. The effect ofthese rights is that farm families that move perma-nently out of agriculture may have to relinquishtheir land rights without compensation.
The earnings of rural and urban households dif-fer substantially, even for households with labor ofthe same skill level (Sicular and Zhao 2002). The
China’s Accession to the WTO: Impacts on China 15
large barriers that exist between urban and rurallabor markets, particularly for poorer households,depress income levels and make it more difficult forworkers to respond to changes in economic oppor-tunities. Even so, the barriers are not absolute: forlabor supplied to nonagricultural activities by ruralhouseholds, elasticities of supply with respect towage rate differentials are on the order of two forunskilled workers and closer to three for skilledworkers (Sicular and Zhao 2002).
Shi Xinzheng (2002) has examined the substan-tial differences between the earnings of urban andrural households and the extent to which these dif-ferences are caused by the formal barriers betweenChina’s urban and rural labor markets. Onlybetween 30 and 40 percent of the total differencebetween rural and urban wage rates can be explainedby the hukou policy. However, this policy componentof the gap, which is a fundamentally importantbuilding block for assessments of the implications ofliberalization, is difficult to estimate precisely.
A key political concern throughout the imple-mentation period is likely to be the impacts ofaccession on the formerly favored workers in state-owned enterprises. These enterprises are experienc-ing greater competition from imports as a result ofabolishment of the barriers that formerly discour-aged competition from foreign firms in the domes-tic market.
Effects on Poverty
From a poverty perspective, it seems likely that thecentral issues of concern will be in rural areas.Poverty is most prevalent in the rural areas of China,and rural workers face barriers in moving into thesectors that are likely to expand as a result of China’songoing growth and liberalization. Two studies eval-uate the impacts of China’s trade liberalization onpoverty, and both find that the rural sector is morevulnerable than the urban sector to this reform.
In Chapter 8 of this volume, Chen and Ravallionconsider the impact of WTO accession on incomedistribution and poverty.15 They find a sharp con-trast between the experience of urban and ruralhouseholds. Most urban households, and particu-larly those who are relatively poor, gain from WTOaccession. This is not the case for rural households,the poorest of which experience noticeable reduc-tions in their living standards. These reductions
reflect a combination of falling rural wages andincreases in the prices of goods consumed by thesehouseholds.
Hertel, Zhai, and Wang (2002) also provideimportant insights into the impacts of trade reformon poverty.16 Because of limitations on the avail-ability of household data, they focus on Liaoning,Sichuan, and Guangdong, three relatively diverseprovinces. Their scenario for agricultural tariffs issimilar to that in the Ianchovichina and Martin(2002) study, but focuses on an agricultural policydetermined by the tariff-rate quotas. In aggregate,their conclusions are much more optimistic thanthose of Chen and Ravallion in Chapter 8, showingvirtually all households benefiting from tradereform. However, their results suggest that inequal-ity worsens after accession: urban households ben-efit substantially more than rural households, andrural households with diverse income sources ben-efit more than those that depend only on farming.
The results of these quantitative analyses arehighly stylized, because they assume that enterprisesand households adjust successfully to the changes inincentives that are created by WTO accession. AsOECD (2002b) has pointed out, to make thesechanges successfully China will have to strengthenits economic system in areas such as enterprise gov-ernance and reform of the banking system.
The vulnerability of the rural sector to tradereform arises from restrictions on the movement oflabor out of agriculture when returns fall. Theserestrictions inhibit the adjustment needed afteraccession and increase the vulnerability of poor peo-ple to downturns in agricultural prices. Reform ofthese restrictions has now become urgent, becausethe partial liberalization of agriculture is increasingthe pressures on workers to leave agriculture.
Hertel, Zhai, and Wang (2002) consider theimplications of two key complementary policiesthat might be used to deal with the problems ofpoverty in rural areas: (1) reducing the barriers tomobility of rural labor into nonagriculturalemployment, and (2) improving the availability ofeducation in rural areas. They conclude that reduc-tions in the barriers to mobility of labor out of agri-culture would be an important antidote to theincreases in inequality between rural and urbansectors experienced after accession, with diversifiedrural households becoming the largest gainers froma policy package combining WTO accession with
16 East Asia Integrates
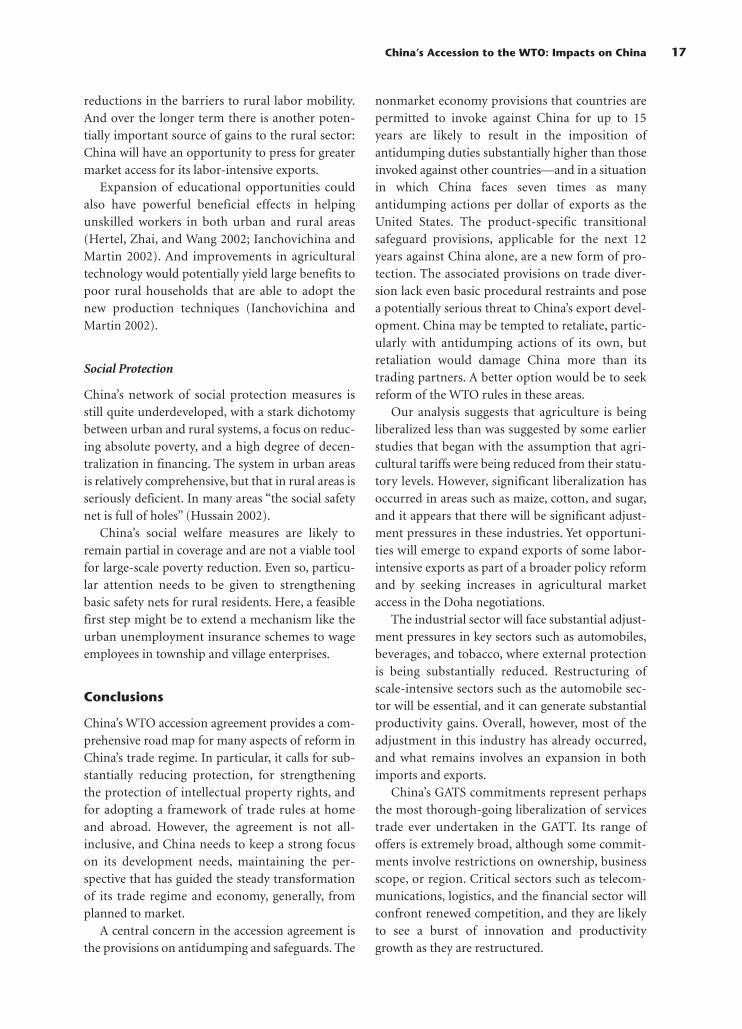
reductions in the barriers to rural labor mobility.And over the longer term there is another poten-tially important source of gains to the rural sector:China will have an opportunity to press for greatermarket access for its labor-intensive exports.
Expansion of educational opportunities couldalso have powerful beneficial effects in helpingunskilled workers in both urban and rural areas(Hertel, Zhai, and Wang 2002; Ianchovichina andMartin 2002). And improvements in agriculturaltechnology would potentially yield large benefits topoor rural households that are able to adopt thenew production techniques (Ianchovichina andMartin 2002).
Social Protection
China’s network of social protection measures isstill quite underdeveloped, with a stark dichotomybetween urban and rural systems, a focus on reduc-ing absolute poverty, and a high degree of decen-tralization in financing. The system in urban areasis relatively comprehensive, but that in rural areas isseriously deficient. In many areas “the social safetynet is full of holes” (Hussain 2002).
China’s social welfare measures are likely toremain partial in coverage and are not a viable toolfor large-scale poverty reduction. Even so, particu-lar attention needs to be given to strengtheningbasic safety nets for rural residents. Here, a feasiblefirst step might be to extend a mechanism like theurban unemployment insurance schemes to wageemployees in township and village enterprises.
Conclusions
China’s WTO accession agreement provides a com-prehensive road map for many aspects of reform inChina’s trade regime. In particular, it calls for sub-stantially reducing protection, for strengtheningthe protection of intellectual property rights, andfor adopting a framework of trade rules at homeand abroad. However, the agreement is not all-inclusive, and China needs to keep a strong focuson its development needs, maintaining the per-spective that has guided the steady transformationof its trade regime and economy, generally, fromplanned to market.
A central concern in the accession agreement isthe provisions on antidumping and safeguards. The
nonmarket economy provisions that countries arepermitted to invoke against China for up to 15years are likely to result in the imposition ofantidumping duties substantially higher than thoseinvoked against other countries—and in a situationin which China faces seven times as manyantidumping actions per dollar of exports as theUnited States. The product-specific transitionalsafeguard provisions, applicable for the next 12years against China alone, are a new form of pro-tection. The associated provisions on trade diver-sion lack even basic procedural restraints and posea potentially serious threat to China’s export devel-opment. China may be tempted to retaliate, partic-ularly with antidumping actions of its own, butretaliation would damage China more than itstrading partners. A better option would be to seekreform of the WTO rules in these areas.
Our analysis suggests that agriculture is beingliberalized less than was suggested by some earlierstudies that began with the assumption that agri-cultural tariffs were being reduced from their statu-tory levels. However, significant liberalization hasoccurred in areas such as maize, cotton, and sugar,and it appears that there will be significant adjust-ment pressures in these industries. Yet opportuni-ties will emerge to expand exports of some labor-intensive exports as part of a broader policy reformand by seeking increases in agricultural marketaccess in the Doha negotiations.
The industrial sector will face substantial adjust-ment pressures in key sectors such as automobiles,beverages, and tobacco, where external protectionis being substantially reduced. Restructuring ofscale-intensive sectors such as the automobile sec-tor will be essential, and it can generate substantialproductivity gains. Overall, however, most of theadjustment in this industry has already occurred,and what remains involves an expansion in bothimports and exports.
China’s GATS commitments represent perhapsthe most thorough-going liberalization of servicestrade ever undertaken in the GATT. Its range ofoffers is extremely broad, although some commit-ments involve restrictions on ownership, businessscope, or region. Critical sectors such as telecom-munications, logistics, and the financial sector willconfront renewed competition, and they are likelyto see a burst of innovation and productivitygrowth as they are restructured.
China’s Accession to the WTO: Impacts on China 17
China’s labor markets are affected adversely by arange of regulations, such as the hukou system ofresidence permits regulating movement betweenurban and rural employment. This system, andrelated labor market policies, inhibit the adjust-ment needed after accession and increase the vul-nerability of poor people to downturns in agricul-tural prices. Other features of the labor market,such as the “tie” to the land where households haveuse rights to land but cannot sell it because prop-erty rights are not sufficiently well defined, restrictthe mobility of labor out of agriculture.
The two studies described in this chapter of theimpacts of trade reform on poverty both find thatthe rural sector is more vulnerable to this reformthan is the urban population. One study concludesthat WTO accession is generally beneficial to urbanhouseholds but that most rural households lose inthe short run. The other study provides a moreupbeat picture, but one in which rural householdsare more subject to negative shocks such as thoseresulting from reductions in protection on someagricultural commodities. A major conclusion isthat the key to mitigating these problems isreforms such as reduction of barriers to the move-ment of labor out of agriculture and investment inrural education.
The network of social protection measures inChina is quite underdeveloped and a constraint onChina’s ability to grow while dealing with widely heldconcerns about the need to compensate the potential“losers” from the policy reforms. Policymakersshould pay particular attention to strengthening thesocial welfare systems available to rural residents.
The dramatic increases in China’s imports andexports associated with its accession create enor-mous opportunities for China’s trading partners tobenefit, both as suppliers of exports to this rapidlygrowing market and as beneficiaries of lower-priced and higher-quality imports. In addition,many countries with similar ranges of exports willface greater competition in third-country marketsfor many products, particularly textiles and cloth-ing, where the removal of quotas in 2005 will lift anenormous burden from China’s exporters.
Endnotes
1. See www.worldbank.org/trade for those studies and moredetailed references to the literature.
2. For example, tariffs may be set at any level below China’stariff bindings. Or the Agreement on Trade-Related Aspectsof Intellectual Property Rights (TRIPS) may be used in away that stimulates the development of a knowledge-basedand more productive economy, or simply in a way thatresults in transfers to industrial countries. Or, similarly,WTO rules on contingent protection may be used in a waythat is extremely damaging to open trade and economicdevelopment, or they may be used (or not used) in a waythat is more consistent with economic efficiency and equity.
3. See Gertler (2002) for an outline of these principles.4. Although the implementation period extends to 2010,
almost all of the reduction will have been completed by2005.
5. For example, in agriculture, China had to accept a limit of8.5 percent on de minimis domestic support, as opposed tothe usual 10 percent limit for developing countries.
6. See Maskus (2002). His assessment of China’s intellectualproperty regime considers the provisions for patents, trade-marks, trade secrets, and copyrights. He compares China’srules on intellectual property rights with internationalbenchmarks for middle-income developing countries,using data from interviews with market participants.
7. Huang, Chen, and Rozelle (1999), for example, estimatedthe protection applying to rice, wheat, and maize in themid-1990s at 4, 20, and 25 percent, respectively. By con-trast, Tuan and Cheng (1999) estimated these protectionrates to be –29, 62, and 15 percent, respectively. Carter(2000: 80) relied on producer price data and found gener-ally negative price distortions.
8. All dollar amounts are current U.S. dollars.9. The frequency of import licenses, in particular, has fallen
from about two-thirds of tariff lines in the late 1980s to lessthan one-twentieth in 2001 (Lardy 2002).
10. Service suppliers that are independent of both the senderand the recipient of the goods.
11. Ianchovichina and Martin (2002) approximate verycrudely the estimated liberalization of services by halvingthe barriers to trade in these activities estimated byFrançois (2002). They also analyze the opportunities thatarise from the elimination of the quotas against China’s(and other countries’) exports of textiles and clothing.Their analysis takes into account China’s important export-processing arrangements and builds on the labor marketstudies undertaken by Sicular and Zhao (2002) and by Shi(2002) and on the analysis of automobile industry restruc-turing undertaken by Francois (2002). The resultingchanges in the specification of their model greatly increasethe realism of their analysis and have important implica-tions for their results.
12. The reduction in the price of nontraded goods is oftencalled a real exchange rate depreciation. The analysisdescribed in this chapter considers only the impact of liber-alization on goods markets, and ignores possible impactson real exchange rates operating through induced increasesin investment, an issue addressed in Chapter 2. McKibbinand Tang (2000) conclude that this stimulus to investmentassociated with reductions in the cost of capital and expan-sion of exports may be sufficient to reverse the long-runtendency toward real exchange rate depreciation, and mayactually require real exchange rate appreciation, during thefirst years after accession.
13. The choice of 1995 as a starting period is somewhat arbi-trary, given that China reformed its trade regime through-
18 East Asia Integrates
out the 1990s. Nevertheless, 1995 was an important turn-ing point, when China had to forgo its hopes of resumingits seat in the GATT and apply as a newcomer to theWorld Trade Organization, under a process much morefocused on the commercial implications of the accessionpackage.
14. These projections of export and income growth are verylower-bound estimates, because they ignore the benefitsfrom abolishing nontariff barriers, because they involveserious aggregation biases, and because models of this typeappear to understate greatly the implications of majortrade liberalizations (Kehoe 2002).
15. Their study draws on the simulation model results provided byIanchovichina and Martin (2002) and uses a sample of84,000 households—17,000 urban and 67,000 rural—fromNational Bureau of Statistics surveys. The price impacts fromthe GTAP analysis are applied to the households’ initialincome and expenditure shares, taking into account theimpacts of these price changes on the prices householdsmust pay for their consumption goods and purchases ofinputs, and the prices they receive for their sales of goods andof labor and other factors. The loss of government revenuefrom falling tariffs is restored very simply in the modelexperiment by increasing the price of all consumption goodsthrough a consumption tax used to maintain governmentrevenues. This approach to measuring the impact likely over-states the extent to which tax rates would need to rise,because government revenues from tariffs as a percentage ofthe value of imports were only about half of the 8 percentthat would have been implied by the statutory tariff rates.
16. Their model of the Chinese economy takes into accountimportant features such as the duty exemptions for inter-mediate goods used in the production of exports.
References
The word processed describes informally reproduced works thatmay not be commonly available through libraries.
Anderson, K., and others. 1986. The Political Economy of Agricul-tural Protection: East Asia in International Perspective.Boston, London, and Sydney: Allen and Unwin.
Anderson, K., J. Huang, and E. Ianchovichina. 2002. “Impact ofChina’s WTO Accession on Agriculture and Rural-UrbanIncome Inequality.” Paper presented to conference onChina’s Accession to WTO, Policy Reform and PovertyReduction, Beijing, June 28–29.
Anderson, S., and C. Lau. 2001. “Hedging Hopes with Fears inChina’s Accession to the World Trade Organization: TheTransitional Special Product Safeguard for Chinese Exports.”Powell, Goldstein, Frazer, and Murphy, LLP, Geneva.Processed.
Bhattasali, D., Li Shantong, and W. Martin, eds. Forthcoming.WTO Accession, Policy Reform and Poverty Reduction inChina. Washington, D.C.: World Bank and Oxford Univer-sity Press.
Carter, C. 2000. “China’s Trade Integration and Impacts on Fac-tor Markets.” In China’s Agriculture in the International Trad-ing System. OECD (Organisation for Economic Co-opera-tion and Development) Proceedings, April.
Chun, Chang, B. Fleisher, and E. Parker. 2001. “The Impact ofChina’s Entry into the WTO: Overview.” China EconomicReview 11 (4): 319–22.
Fewsmith, J. 2001. “The Political and Social Implications ofChina’s Accession to the WTO.” China Quarterly 167 (Sep-tember): 573–91.
Findlay, Christopher, and W. Luo. 2002. “Logistics in China:Accession to the WTO and Its Implications.” Paper presentedto Conference on China’s Accession to WTO, Policy Reformand Poverty Reduction, Beijing, June 28–29.
Francois, Joseph F. 2002. “The Motor Vehicle Sector in Chinaand WTO Accession.” Paper presented to Conference onChina’s Accession to WTO, Policy Reform and PovertyReduction, Beijing, June 28–29.
Gertler, J. 2002. “What China’s WTO Accession Is All About.”Paper presented to Conference on China’s Accession toWTO, Policy Reform and Poverty Reduction, Beijing, June28–29.
Gilbert, J., and T. Wahl. 2002. “Applied General EquilibriumAssessments of Trade Liberalization in China.” World Econ-omy 25(5): 697–731.
Harwit, E. 2001. “The Impact of WTO Membership on theAutomobile Industry in China.” China Quarterly 167:655–70.
Hertel, T. W., ed. 1997. Global Trade Analysis: Modeling andApplications. Cambridge: Cambridge University Press.
Hertel, T. W., F. Zhai, and Z. Wang. 2002. “Implications of WTOAccession for Poverty in China.” Paper presented to Confer-ence on China’s Accession to WTO, Policy Reform andPoverty Reduction, Beijing, June 28–29.
Huang, J., and S. Rozelle. 2002. “The Nature of Distortions toAgricultural Incentives in China and Implications of WTOAccession.” Paper presented at Conference on WTO Acces-sion, Policy Reform and Poverty Reduction in China, WorldBank, Beijing, June 28–29.
Huang, J., C. Chen, and S. Rozelle. 1999. “Reform, Trade Liberal-ization and Their Impacts on China’s Agriculture.” Paperpresented at International Agricultural Trade Research Con-sortium Symposium on China’s Agricultural Trade Policy:Issues, Analysis and Global Consequences, San Francisco,June 25–26.
Hussain, A. 2002. “Coping and Adapting to Job Losses and Fallin Farm Earnings.” Paper presented at Conference on WTOAccession, Policy Reform and Poverty Reduction in China,World Bank, Beijing, June 28–29.
Ianchovichina, Elena. 2003. “GTAP-DD: A Model for AnalyzingTrade Reforms in the Presence of Duty Drawbacks.” GTAPTechnical Paper No. 21. Available at www.agecon.purdue.edu/GTAP/techpapr/index.htm.
Ianchovichina, Elena, and William J. Martin 2002. “EconomicImpacts of China’s Accession to the WTO.” Paper presentedat Conference on WTO Accession, Policy Reform andPoverty Reduction in China, World Bank, Beijing, June28–29.
Johnson, D. G. 2000. “The WTO and Agriculture in China.”China Economic Review 11: 402–4.
Kehoe, T. 2002. “How Well Did Computable General Equilib-rium Models Predict the Effects of NAFTA?” Paper pre-sented to Conference on General Equilibrium Modeling,Cowles Foundation, Yale University, April.
Lardy, Nicholas R. 2002. Integrating China into the Global Econ-omy. Washington, D.C.: Brookings Institution Press.
Lin, J. Y. 2000. “WTO Accession and China’s Agriculture.” ChinaEconomic Review 11: 405–8.
Martin, William J. 2001. “Implications of Reform and WTOAccession for China’s Agricultural Policies.” Economics ofTransition 9 (3): 717–42.
China’s Accession to the WTO: Impacts on China 19

———. 2002. “Reforming Japan’s Rice Policies: Comment.” InR. Stern, ed., Issues and Options for Japan-US Trade Policies.Ann Arbor: University of Michigan Press.
Martin, William J., and Elena Ianchovichina. 2001.“Implicationsof China’s Accession to the World Trade Organization forChina and the WTO.” World Economy 24 (9).
Maskus, Keith E. 2002. “Intellectual Property Rights in the WTOAccession Package: Assessing China’s Reforms.” Paper pre-sented to Conference on China’s Accession to WTO, PolicyReform and Poverty Reduction, Beijing, June 28–29.
Mattoo, Aaditya. 2002. “China’s Accession to the WTO: The Ser-vices Dimension.” Paper presented to Conference on China’sAccession to WTO, Policy Reform and Poverty Reduction,Beijing, June 28–29.
McKibbin, W., and K. Tang. 2000. “Trade and Financial Reformin China: Impacts on the World Economy.” World Economy23 (8).
Messerlin, Patrick. 2002. “China in the WTO: Antidumping andSafeguard.” Paper presented at Conference on WTO Acces-sion, Policy Reform and Poverty Reduction in China, WorldBank, Beijing, June 28–29, 2002.
OECD (Organisation for Economic Co-operation and Develop-ment). 2002a. Agricultural Policies in OECD Countries: Mon-itoring and Outlook. Paris.
———. 2002b. China in the World Economy: The Domestic PolicyChallenges. Paris.
Pangestu, Mari, and D. Mrongowius. 2002. “TelecommunicationServices in China: Facing the Challenges of WTO Accession.”Paper presented to Conference on China’s Accession to WTO,Policy Reform and Poverty Reduction, Beijing, June 28–29.
Panitchpakdi, Supachai, and M. Clifford. 2002. China and theWTO: Changing China, Changing World Trade. Singapore:John Wiley (Asia).
Schmidhuber, J. 2001. “Changes in China’s Agricultural TradePolicy Regime: Impacts on Agricultural Production, Con-sumption, Prices, and Trade.” In China’s Agriculture in theInternational Trading System. OECD (Organisation forEconomic Co-operation and Development) Proceedings,April.
Shi Xinzheng. 2002. “Empirical Research on Urban-RuralIncome Differentials: A Case of China.” Peking University.Processed.
Sicular, T., and Y. Zhao. 2002. “Employment, Earnings andPoverty in Rural China: A Microeconomic Analysis.” Paperpresented to Conference on China’s Accession to WTO, Pol-icy Reform and Poverty Reduction, Beijing, June 28–29.
Tanzer, A. 2001. “Chinese Walls.” Forbes. November 12.Tuan, F., and G. Cheng. 1999. “A Review of China’s Agricultural
Trade Policy.” Paper presented at International AgriculturalTrade Research Consortium Symposium on China’s Agricul-tural Trade Policy: Issues, Analysis and Global Conse-quences, San Francisco, June 25–26.
WTO (World Trade Organization). 1996. “Negotiating Groupon Basic Telecommunications.” Telecommunications Ser-vices Reference Paper. Geneva, April 24.
Yu, Wusheng, and S. Frandsen. 2002. “China’s WTO Commit-ments in Agriculture: Does the Impact Depend on OECDAgricultural Policies?” Paper presented at Fifth Annual Con-ference on Global Economic Analysis, Taipei. Available atwww.gtap.org.
20 East Asia Integrates

China’s accession to the World Trade Organization(WTO) and deeper integration into the worldeconomy present important opportunities andchallenges for the East Asia region. China’s role inthe region is unrivaled. First, its economy is large inabsolute terms—constituting half the economy ofAsia, according to measures of purchasing power.Second, China has rapidly expanded its trade,almost tripling its share of global exports and morethan doubling its share of global imports over theperiod 1990–2002 and absorbing a fast-growingshare of exports from East Asia over the last decade.Third, although its capital account is not fully con-vertible, China is important both as an investmentdestination and as a lender in global capital mar-kets. It is the world’s largest host country for for-eign direct investment (FDI) and the largest capitalsupplier among developing countries.1 And look-ing ahead, China will remain an important driverof change in East Asia. With WTO accession, it willcontinue to open its markets to other countries’exports and improve its business climate.
21
2
Regional Impact ofChina’s Accession
to the WTO Elena Ianchovichina
Sethaput Suthiwart-NarueputMin Zhao
The task of assessing the impact of China and itsaccession to the WTO on East Asia presents anenormous challenge because of the complexity ofthe changes stemming from accession and the diffi-culty in specifying clearly what would have hap-pened had China not acceded to the WTO. Thusthe goal of this chapter is less to predict detailedchanges than to provide a framework for under-standing the impact of WTO accession on theregion’s economies and to offer a broad assessmentof this impact for different countries and countrygroupings. The findings are drawn from quantita-tive and qualitative analysis, including improvedcomputable general equilibrium (CGE) modelingand partial equilibrium studies, which are detailedon the Web site associated with this volume.2
Because the analysis is at an aggregated level, read-ers should supplement the findings here with infor-mation from subsectoral case studies before mak-ing policy decisions.3
Finally, although this chapter focuses on theeconomic impact of China’s accession to the WTO,
The authors gratefully acknowledge helpful comments from Lu Ding of the National University of Singapore, NattapongThongpakde of the Thailand Development Research Institute, William J. Martin of the World Bank, and participants atseminars held at the Institute for Southeast Asian Studies of the National University of Singapore, the Thailand Develop-ment Research Institute in Bangkok, and the World Bank office in Jakarta, as well as helpful discussions with Arvind Pana-gariya of the University of Maryland at College Park and the excellent research assistance of Wallada Atsavasirilert.

the ultimate impact on the region will be driven notjust by economics, but also by broader politicaleconomy considerations. China’s accession to theWTO is a signal of its greater interdependence withthe world and its increasing international presence,which also will have repercussions in the region.China’s expanding influence as a regional powermay be viewed with growing concern by its neigh-bors, and that influence raises issues about China’sfuture leadership on economic matters in theregion, a role traditionally played by Japan.
The chapter is organized as follows. The nextsection briefly describes the major channelsthrough which the impacts of China’s WTO acces-sion will be felt, followed by a section assessing theimpact of accession on the newly industrializingeconomies (NIEs) in East Asia—in particular, theirgrowing opportunities in China’s markets and theeffects of the evolution of global production net-works. The next section assesses the scope for EastAsian middle-income developing countries toexpand exports to China, as well as the challengesthey face from competition with China in third-country markets. It also outlines how domesticmarkets are likely to be affected by increases in thesupply of exports from China and by patterns offoreign direct investment. The impact of China’saccession to the WTO on the lower-income coun-
tries of East Asia is the subject of the next section,and it is followed by our conclusions.
Channels of Impact
Over the next decade, China’s growth and greaterintegration into the world economy will have majoreffects on the region. Other countries in East Asiawill feel the impact of China’s WTO accessionthrough four main channels:
1. Expansion of markets in China for their exports 2. Increased imports from China into their domes-
tic markets3. Competition with China in third-country markets4. Expansion of foreign direct investment in China
and, potentially, outward foreign investmentfrom China.
Increased Access to China’s Domestic Markets
In the 1990s, exports to China spurred growth notonly in the newly industrializing economies but alsoin the developing countries of East Asia (Figure 2.1).The countries of the Association of South East AsiaNations (ASEAN) have increased their exports toChina by 390 percent and expanded their share inChina’s total imports from 6 percent to 9 percent.
22 East Asia Integrates
East Asia NIEs: export markets(as % of total exports)
Developing East Asia: export markets(as % of total exports)
4035
3025201510
50
40Percent Percent
35
3025201510
50
ChinaJapan
United StatesOther East AsiaJapan
China United StatesOther East Asia
1980
1982
1984
1986
1988
1990
1992
1994
1996
1998
2000
2002
1980
1982
1984
1986
1988
1990
1992
1994
1996
1998
2000
2002
FIGURE 2.1 Exports to China from East Asia Compared with Exports to Other Partners
Note: NIEs = newly industrializing countries. “East AsiaNIEs” refers to Hong Kong (China), Rep. of Korea, Singa-pore, Taiwan (China).Source: IMF, Direction of Trade Statistics (various years);data reported from exporter country accounts.
Note: “Developing East Asia” refers to Cambodia,Indonesia, Lao PDR, Malaysia, Mongolia, Myanmar,Philippines, Thailand, Vietnam.Source: IMF, Direction of Trade Statistics (various years);data reported from exporter country accounts.

Continued growth in China’s huge domesticmarkets will fuel further export growth for theworld and the economies of the region. In manysectors, China’s WTO accession only adds a little tothe already vigorous projected growth of thesemarkets (Figure 2.2). Nonetheless, accession willcause several significant shifts. China’s substantialcommitments to liberalize trade in services repre-sent the most significant part of the accession pack-age (Mattoo 2002), providing national treatment toforeign-funded firms and greater opportunities forexporters of services. In manufacturing, China’scommitments to abolish nontariff barriers andreduce its import tariffs from 13.3 percent in 2001to 6.8 percent by the end of the implementationperiod in 20104 will fuel further industrial restruc-turing. Some sectors such as the motor vehicle andhigh-end manufacturing will be affected signifi-cantly by rationalization and industrial restructur-ing. In agriculture, too, China’s imports are pro-jected to grow substantially, although the effect ofWTO-related reforms on agricultural output andimports is much smaller than projected by earlierstudies because protection of many farm productsis expected to remain virtually unchanged by theend of the implementation period (Huang andRozelle 2002).
Growth in the region’s exports will also be fueledby the increased demand from those major tradingpartners that benefit directly from China’s acces-sion. The developing countries of East Asia will
export more not only to China, but also to thenewly industrializing economies in East Asia,whose own demand for imports has grown as aresult of the accession. Both the direct and indirecteffects of increased access to China’s markets will beimportant for regional trade.
Increased Imports from China
China’s accession to the WTO will be accompaniedby cuts in its export prices, increasing China’sappeal as an efficient supplier of intermediateinputs. China’s preaccession reforms have alreadyimproved the competitiveness of its exports andbenefited its closest trading partners. Trade inten-sity indexes for 1985 and 2001 (Ng and Yeats 2003)suggest that trade between individual East Asiancountries and China has intensified sharply since1985. Consequently, most East Asian economies areexpected to benefit from further cuts in exportprices as China continues to implement WTO-related reforms over the next few years. The bene-fits to these countries will be evident in bothincreased output and welfare.
A growing segment of imports from China willbe inputs in production processes, not just finishedconsumer goods (Figure 2.3). China is increasinglya central player in production networks. AlthoughJapan remains an important center of production-sharing operations in East Asia, originating aboutone-third of all regional exports of components for
Regional Impact of China’s Accession to the WTO 23
China: Percent change in imports between 1995 and 2005
0 100 200 300 400 500 600 700
Other manufacturesElectronics
MetalsWood and paper
Wearing apparel, netTextiles
Extractive industriesBeverages/tobacco
Other foodDairy
Meat and livestockOilseeds
FeedgrainsFoodgrains
Without accession With accession
times 10
FIGURE 2.2 China’s Imports, 1995 and 2005
Note: This figure captures the effects of WTO accession, encompassing all reforms since 1995. Ianchovichina andWalmsley (2003), whose work has been drawn on for the remainder of this chapter, have estimated the effects of WTOaccession for 2001–10.Source: Ianchovichina and Martin (2001).
assembly, China is finding niches; its exports ofparts and components increased by almost US$20billion5 from 1996 to 2001. By 2001 China wasexporting more than $20 billion in parts and com-ponents to others parts of emerging East Asia, rep-resenting up to 20 percent of those countries’ partsand components trade (Ng and Yeats 2003). Thusimports from China represent an opportunity forthe rest of emerging East Asia to benefit fromChina’s growing role in global production networks.
To realize the full benefits of China’s lowerexport prices, it will be important that countriesresist pressures to protect their domestic producersand that they avoid imposing excessive safeguardmeasures for this purpose. Pressures to do so aregrowing in several countries. However, succumbingto them will only prolong the adjustments neededto realize regional comparative advantages, and willdistract policymakers from facilitating the transi-tion of workers by putting in place the appropriatelabor market and safety net policies and programs.
Increased Competition in Third-Country Markets
Competition with China in third-country marketswill intensify as a result of China’s accession. Thiscompetition will present a challenge for manycountries, especially those with a similar compara-tive advantage in labor-intensive goods.
Southeast Asia competes with China in worldmarkets for manufactures, especially labor-inten-sive products, and increasingly in higher valueadded manufactures such as semiconductors and
other high-technology products. Competition withChina has brought unit prices down, but thus farother East Asian exporters have maintained theirmarket shares in the United States and Japan. InJapan, developing East Asian countries have evenmanaged to enlarge their market share slightly,while China has captured market share at theexpense of the United States.
In the future, competition is set to intensify fortwo reasons. First, the United States, Canada, andthe European Union (EU) will abolish their importquotas on Chinese textiles and apparel by 2005.6
China will then become a formidable competitor,especially in the apparel sector,7 pushing pricesdown in these important third-country markets.Second, China will lower its own import tariffs oninputs for manufacturing. The effect of these tariffreductions on the real exchange rate will be lowercosts of both traded and nontraded inputs forChina’s manufacturers. This development willmake China’s products more competitive asimports, putting pressure on domestic producers inthe countries that import them.
Shifts in Investment Patterns
WTO accession is likely to increase foreign directinvestment in China, as trade liberalization lowersproduction costs and the price of capital goods andincreases the rental rates, resulting in rising returnsto capital in China.8 Meanwhile, the liberalizationof rules on investment should ease flows of foreigndirect investment into previously restricted sectors
24 East Asia Integrates
Share of components in China’sexports relative to share of
components in world trade (RCA)
0
0.5
1.0
1.5
2.0
Officemachinery
Telecomequipment
Electricalmachinery
RCA
1996 2001
Value of imports from
China Share in
total
Japan 5,587 36.7Hong Kong (China) 13,556 45.5Korea, Rep. of 1,695 21.1Singapore 1,989 11.9Taiwan (China) 1,308 18.9Indonesia 109 4.9Malaysia 1,394 12.8Philippines 170 2.4Thailand 1,030 13.3
Parts and components imports from China, 2001
(millions of US$) (%)
FIGURE 2.3 China’s Growing Role in Production Networks
Note: RCA = revealed comparative advantage.Source: Ng and Yeats (2003).
Source: Ng and Yeats (2003: Table 17.1).

such as services and automobile production. Giventhe substantial productivity gap that exists betweenlocal and foreign firms, the new FDI flows are likelyto raise China’s productivity. In apparel andfootwear, for example, the adoption of foreigntechnology raises productivity by 30–62 percent incollective enterprises and 20–59 percent in stateenterprises (Claro 2001).
China’s accession is also likely to set off changesin regional trade and production patterns, theeffects of which will be felt over the medium to longterm. The question for other East Asian economiesis whether their own FDI inflows will increase ordecrease as a result. It is difficult to answer thisquestion because much will depend on the policyresponses of individual countries. In addition,some factors will work simultaneously to deter-mine the net regional impact of China’s WTOaccession on FDI flows.
Although countries that lose competitivenessmay see declining returns to capital and FDIdiverted to China, several effects are likely to coun-teract this negative impact on FDI. First, increasedproductivity and trade liberalization in China bothincrease the country’s demand for imports andraise investment and welfare in China’s tradingpartners. Martin (1993) shows that a productivityshock in manufactures and services, for which thereis a lot of two-way trade, is more likely to raise wel-fare in a country’s trading partners than is tradeliberalization. The technological advance accompa-nying China’s liberalization will improve the coun-try’s competitiveness, but also increase the coun-try’s demand for imports.
Second, investment liberalization in China willmake it possible for multinational firms to furtherrationalize their production processes within EastAsia. The relief of local content requirements undertrade-related investment measures (TRIMs) willencourage these firms to relocate some segments oftheir production from China to other countries inthe region.
Third, in some sectors China’s neighbors mayreceive FDI flows that complement those going toChina. The scope for export specialization varieswith the degree of complementarity between Chinaand other countries of East Asia.
Fourth, as FDI creates more backward and for-ward linkages among countries in the region, thecompetitiveness of Asian products will depend not
only on the competitiveness of the country thatexports the final product, but also on those neigh-boring countries that contribute various compo-nents at different stages of the production process.This situation will create an incentive for locatinginvestments in the countries that are part of theregional production network in which China isplaying an increasingly central role.
Fifth, whereas in the past China drew heavily onthe overseas Chinese community as a source ofFDI, with WTO accession China is now able todraw on global capital markets for both FDI andportfolio investment. Therefore, competitionbetween China and other countries in the regionfor FDI may actually weaken.
Last, but not least, the determinants of FDI areevolving over time. Agglomeration effects arebecoming more important relative to the tradi-tional determinants of FDI such as market size andlabor costs (UNCTAD 2001). China resists easydefinitions of its comparative advantage in terms ofhigh-tech or low-wage manufacturing, and itscomparative advantage also may change apprecia-bly in response to WTO accession. Its current com-parative advantage in labor-intensive products sug-gests that there is more scope for exportspecialization vis-à-vis the newly industrializingeconomies than the developing East Asian coun-tries. However, this situation is likely to change asEast Asia’s export structure evolves.9 Over time,China is also likely to shift and extend its compara-tive advantage from land- and labor-intensiveproducts and low-end manufacturing to higher-end products as a result of trade-induced produc-tivity gains and savings in transaction costs fromthe reforms spurred by WTO accession. Increasedproductivity from WTO-related liberalization andhigher wages—initially in China’s coastal regions—has been shown to reduce the competitive threat tothe lower- and middle-income economies ofSoutheast Asia,10 while increasing the threat to thenewly industrializing and more advanced middle-income economies of East Asia.
According to a recent analysis, the impact ofaccession is significantly larger than the estimatedstatic gain, if productivity increases in services andhigh-end manufacturing are taken into account.Every percentage point increase in productivity fromexpanded competition and foreign entry in China’sservices sector implies a welfare gain for China of
Regional Impact of China’s Accession to the WTO 25
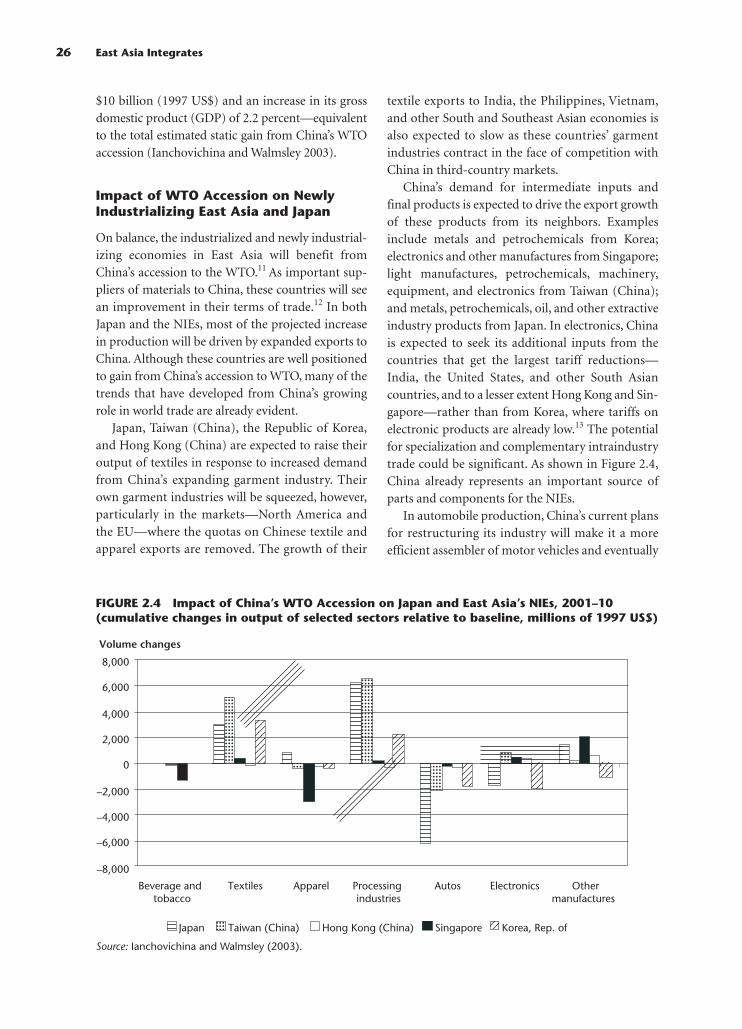
$10 billion (1997 US$) and an increase in its grossdomestic product (GDP) of 2.2 percent—equivalentto the total estimated static gain from China’s WTOaccession (Ianchovichina and Walmsley 2003).
Impact of WTO Accession on NewlyIndustrializing East Asia and Japan
On balance, the industrialized and newly industrial-izing economies in East Asia will benefit fromChina’s accession to the WTO.11 As important sup-pliers of materials to China, these countries will seean improvement in their terms of trade.12 In bothJapan and the NIEs, most of the projected increasein production will be driven by expanded exports toChina. Although these countries are well positionedto gain from China’s accession to WTO, many of thetrends that have developed from China’s growingrole in world trade are already evident.
Japan, Taiwan (China), the Republic of Korea,and Hong Kong (China) are expected to raise theiroutput of textiles in response to increased demandfrom China’s expanding garment industry. Theirown garment industries will be squeezed, however,particularly in the markets—North America andthe EU—where the quotas on Chinese textile andapparel exports are removed. The growth of their
textile exports to India, the Philippines, Vietnam,and other South and Southeast Asian economies isalso expected to slow as these countries’ garmentindustries contract in the face of competition withChina in third-country markets.
China’s demand for intermediate inputs andfinal products is expected to drive the export growthof these products from its neighbors. Examplesinclude metals and petrochemicals from Korea;electronics and other manufactures from Singapore;light manufactures, petrochemicals, machinery,equipment, and electronics from Taiwan (China);and metals, petrochemicals, oil, and other extractiveindustry products from Japan. In electronics, Chinais expected to seek its additional inputs from thecountries that get the largest tariff reductions—India, the United States, and other South Asiancountries, and to a lesser extent Hong Kong and Sin-gapore—rather than from Korea, where tariffs onelectronic products are already low.13 The potentialfor specialization and complementary intraindustrytrade could be significant. As shown in Figure 2.4,China already represents an important source ofparts and components for the NIEs.
In automobile production, China’s current plansfor restructuring its industry will make it a moreefficient assembler of motor vehicles and eventually
26 East Asia Integrates
–8,000
–6,000
–4,000
–2,000
0
2,000
4,000
6,000
8,000
Japan Taiwan (China) Hong Kong (China) Singapore Korea, Rep. of
Volume changes
Beverage andtobacco
Textiles Apparel Processingindustries
Autos Electronics Othermanufactures
FIGURE 2.4 Impact of China’s WTO Accession on Japan and East Asia’s NIEs, 2001–10(cumulative changes in output of selected sectors relative to baseline, millions of 1997 US$)
Source: Ianchovichina and Walmsley (2003).
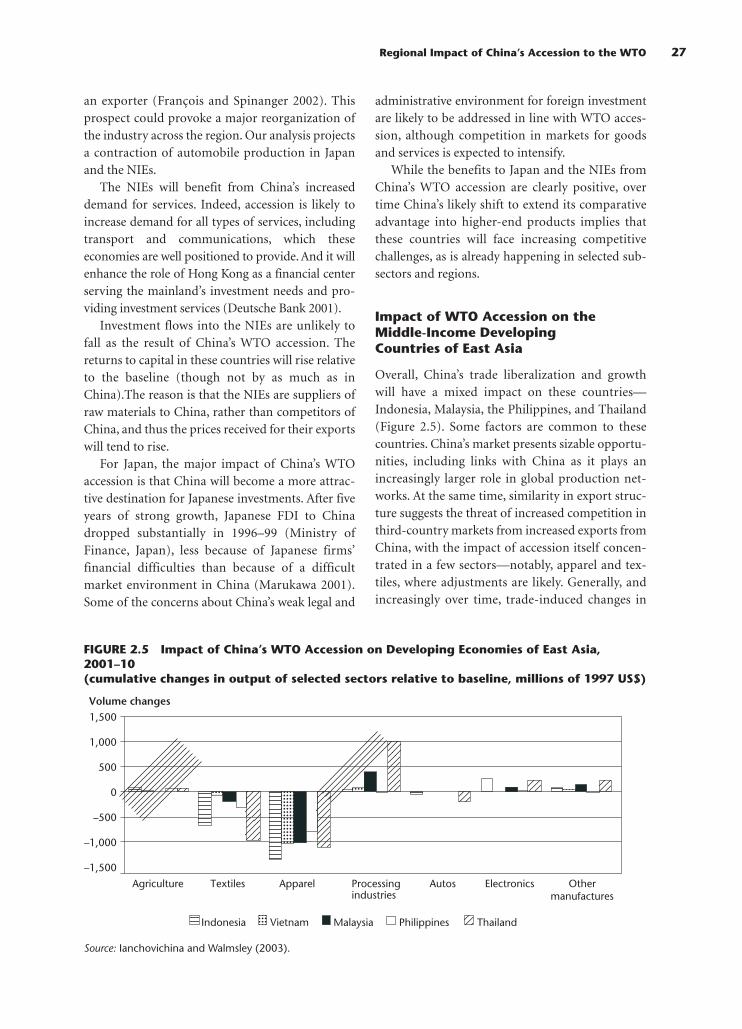
an exporter (François and Spinanger 2002). Thisprospect could provoke a major reorganization ofthe industry across the region. Our analysis projectsa contraction of automobile production in Japanand the NIEs.
The NIEs will benefit from China’s increaseddemand for services. Indeed, accession is likely toincrease demand for all types of services, includingtransport and communications, which theseeconomies are well positioned to provide. And it willenhance the role of Hong Kong as a financial centerserving the mainland’s investment needs and pro-viding investment services (Deutsche Bank 2001).
Investment flows into the NIEs are unlikely tofall as the result of China’s WTO accession. Thereturns to capital in these countries will rise relativeto the baseline (though not by as much as inChina).The reason is that the NIEs are suppliers ofraw materials to China, rather than competitors ofChina, and thus the prices received for their exportswill tend to rise.
For Japan, the major impact of China’s WTOaccession is that China will become a more attrac-tive destination for Japanese investments. After fiveyears of strong growth, Japanese FDI to Chinadropped substantially in 1996–99 (Ministry ofFinance, Japan), less because of Japanese firms’financial difficulties than because of a difficultmarket environment in China (Marukawa 2001).Some of the concerns about China’s weak legal and
administrative environment for foreign investmentare likely to be addressed in line with WTO acces-sion, although competition in markets for goodsand services is expected to intensify.
While the benefits to Japan and the NIEs fromChina’s WTO accession are clearly positive, overtime China’s likely shift to extend its comparativeadvantage into higher-end products implies thatthese countries will face increasing competitivechallenges, as is already happening in selected sub-sectors and regions.
Impact of WTO Accession on theMiddle-Income Developing Countries of East Asia
Overall, China’s trade liberalization and growthwill have a mixed impact on these countries—Indonesia, Malaysia, the Philippines, and Thailand(Figure 2.5). Some factors are common to thesecountries. China’s market presents sizable opportu-nities, including links with China as it plays anincreasingly larger role in global production net-works. At the same time, similarity in export struc-ture suggests the threat of increased competition inthird-country markets from increased exports fromChina, with the impact of accession itself concen-trated in a few sectors—notably, apparel and tex-tiles, where adjustments are likely. Generally, andincreasingly over time, trade-induced changes in
Regional Impact of China’s Accession to the WTO 27
–1,500
–1,000
–500
0
500
1,000
1,500
Indonesia Vietnam Malaysia Philippines Thailand
Agriculture Textiles Apparel Processingindustries
Autos Electronics Othermanufactures
Volume changes
FIGURE 2.5 Impact of China’s WTO Accession on Developing Economies of East Asia,2001–10(cumulative changes in output of selected sectors relative to baseline, millions of 1997 US$)
Source: Ianchovichina and Walmsley (2003).

China’s productivity will make China a strongerpartner and will ensure that the benefits from mar-ket opportunities outweigh third-country marketcompetitive challenges. The details, however, willdepend on the situation and response of the indi-vidual countries.
Indonesia
In the decade ahead, China’s liberalization and eco-nomic expansion open several opportunities forIndonesia but also pose risks, both as an exporterand as a destination for investment. The challengewill be to manage the transition to realize thoseopportunities.
Indonesia’s exports to China stand to benefitsignificantly from China’s growth and liberaliza-tion.14 Much of the tariff reduction under China’sWTO accession will occur by 2004 (Table 2.1), butChina is free to offer tariff rates below these bind-ings. For example, under the “Early Harvest” aspectof the Framework Agreement on China-ASEANComprehensive Economic Cooperation, whichwould establish an ASEAN-China Free Trade Area,a range of Indonesian exports will face lower tariffsthan other countries’ exports.15
Some of the top exports from Indonesia toChina will also benefit significantly from reduc-tions in nontariff barriers (Table 2.2). Nearly 20percent of Indonesian exports to China are inproducts—especially palm oil, rubber, andprocessed oil—on which quantitative restrictionswill be lifted (Table 2.2). Palm oil exports, in partic-ular, should gain significantly from the relaxationof quantitative restrictions (QRs).16 Palm oil, whichwas previously subject to an import license, is nowsubject to tariff-rate quotas (TRQs) with accession.Initial quota levels are set significantly aboveimport levels prior to accession and are slated toincrease significantly by 2005.17 TRQs on rubberwill take effect in 2004, when quotas are elimi-nated.18 Urea also will be subject to a TRQ, with afinal quota level in 2006 of more than 2.5 times theinitial quota level and an in-quota tariff rate of 4percent.19 Most categories of timber will also be lib-eralized within three years of accession.
Indonesia’s overall export volume will continueto grow. Demand from China will be compoundedby increased import demand from China’s closesttrading partners—Japan, the NIEs, the EU, and theUnited States—which themselves have benefitedfrom China’s growth and WTO accession. However,
28 East Asia Integrates
TABLE 2.1 Weighted Average Tariffs Facing Exports to China: Indonesia and Thailand,2001–08 (percent)
2001 2002 2003 2004 2005 2006 2007 2008
Indonesia 8.20 8.66 5.82 4.91 4.73 4.65 4.58 4.51Thailand 10.19 8.91 8.41 4.86 4.63 4.43 4.25 4.05
Note: The weighted average tariff was calculated on the top 100 exported products to China, representing morethan 85 percent of each country’s exports to that country. The in-quota tariff rate is used for tariff-rate quotaproducts.Sources: UN Comtrade data; China’s WTO accession agreement; authors’ calculations.
TABLE 2.2 Shares of Exports to China Affected by Lifting of Quantitative Restrictions(QRs): Indonesia and Thailand (percent of total exports, 1995–99)
Percent of exports
Country facing QRs Key products (% of total exports)
Indonesia 16.5 Palm oil (7.3), rubber (2.9), processed oil (0.6)Thailand 30.6 Rice (9.24), rubber (11.8), cane sugar (5.8)
Sources: UN Comtrade data; China’s WTO accession agreement; authors’ calculations.
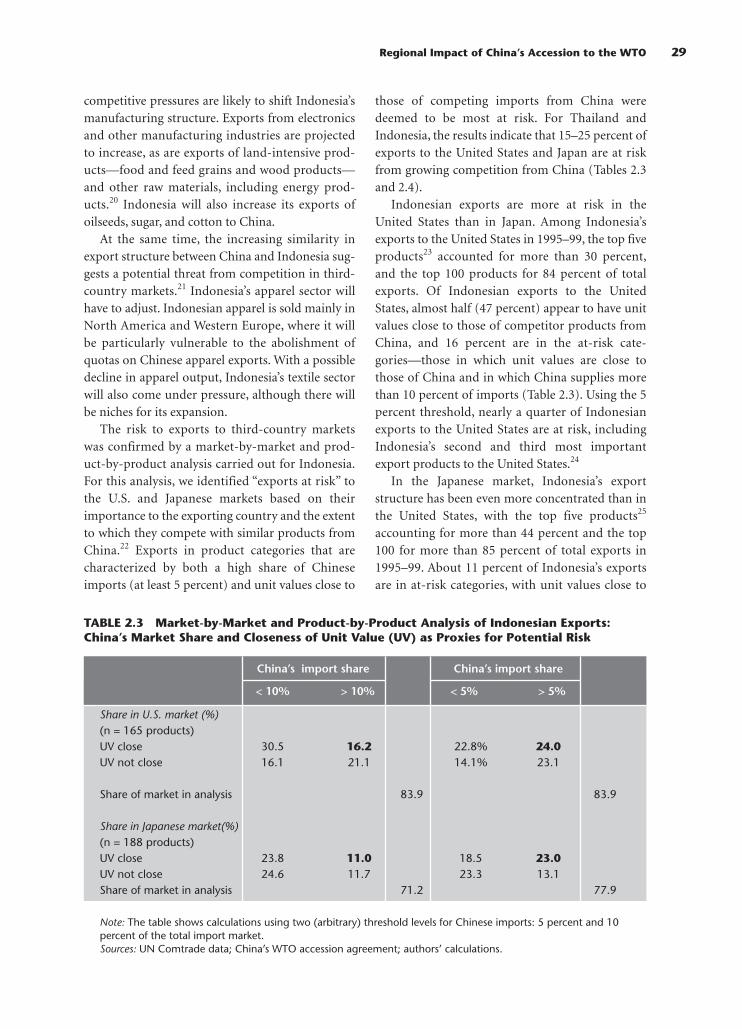
competitive pressures are likely to shift Indonesia’smanufacturing structure. Exports from electronicsand other manufacturing industries are projectedto increase, as are exports of land-intensive prod-ucts—food and feed grains and wood products—and other raw materials, including energy prod-ucts.20 Indonesia will also increase its exports ofoilseeds, sugar, and cotton to China.
At the same time, the increasing similarity inexport structure between China and Indonesia sug-gests a potential threat from competition in third-country markets.21 Indonesia’s apparel sector willhave to adjust. Indonesian apparel is sold mainly inNorth America and Western Europe, where it willbe particularly vulnerable to the abolishment ofquotas on Chinese apparel exports. With a possibledecline in apparel output, Indonesia’s textile sectorwill also come under pressure, although there willbe niches for its expansion.
The risk to exports to third-country marketswas confirmed by a market-by-market and prod-uct-by-product analysis carried out for Indonesia.For this analysis, we identified “exports at risk” tothe U.S. and Japanese markets based on theirimportance to the exporting country and the extentto which they compete with similar products fromChina.22 Exports in product categories that arecharacterized by both a high share of Chineseimports (at least 5 percent) and unit values close to
those of competing imports from China weredeemed to be most at risk. For Thailand andIndonesia, the results indicate that 15–25 percent ofexports to the United States and Japan are at riskfrom growing competition from China (Tables 2.3and 2.4).
Indonesian exports are more at risk in theUnited States than in Japan. Among Indonesia’sexports to the United States in 1995–99, the top fiveproducts23 accounted for more than 30 percent,and the top 100 products for 84 percent of totalexports. Of Indonesian exports to the UnitedStates, almost half (47 percent) appear to have unitvalues close to those of competitor products fromChina, and 16 percent are in the at-risk cate-gories—those in which unit values are close tothose of China and in which China supplies morethan 10 percent of imports (Table 2.3). Using the 5percent threshold, nearly a quarter of Indonesianexports to the United States are at risk, includingIndonesia’s second and third most importantexport products to the United States.24
In the Japanese market, Indonesia’s exportstructure has been even more concentrated than inthe United States, with the top five products25
accounting for more than 44 percent and the top100 for more than 85 percent of total exports in1995–99. About 11 percent of Indonesia’s exportsare in at-risk categories, with unit values close to
Regional Impact of China’s Accession to the WTO 29
TABLE 2.3 Market-by-Market and Product-by-Product Analysis of Indonesian Exports:China’s Market Share and Closeness of Unit Value (UV) as Proxies for Potential Risk
China’s import share China’s import share
< 10% > 10% < 5% > 5%
Share in U.S. market (%)(n = 165 products)UV close 30.5 16.2 22.8% 24.0UV not close 16.1 21.1 14.1% 23.1
Share of market in analysis 83.9 83.9
Share in Japanese market(%)(n = 188 products)UV close 23.8 11.0 18.5 23.0UV not close 24.6 11.7 23.3 13.1Share of market in analysis 71.2 77.9
Note: The table shows calculations using two (arbitrary) threshold levels for Chinese imports: 5 percent and 10percent of the total import market. Sources: UN Comtrade data; China’s WTO accession agreement; authors’ calculations.
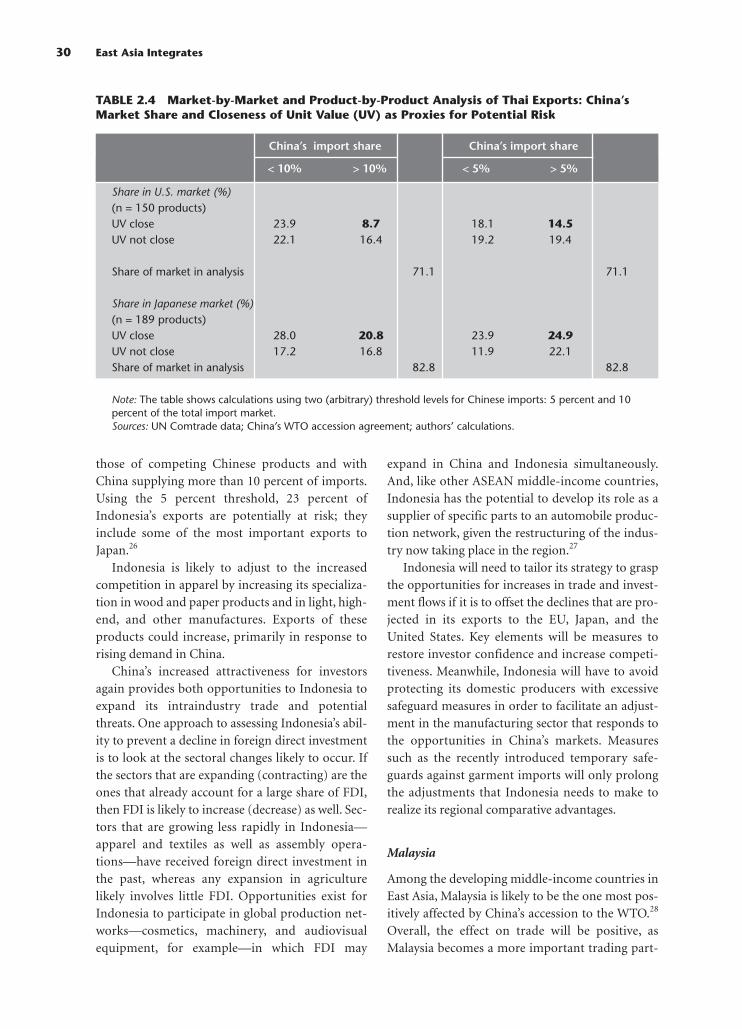
those of competing Chinese products and withChina supplying more than 10 percent of imports.Using the 5 percent threshold, 23 percent ofIndonesia’s exports are potentially at risk; theyinclude some of the most important exports toJapan.26
Indonesia is likely to adjust to the increasedcompetition in apparel by increasing its specializa-tion in wood and paper products and in light, high-end, and other manufactures. Exports of theseproducts could increase, primarily in response torising demand in China.
China’s increased attractiveness for investorsagain provides both opportunities to Indonesia toexpand its intraindustry trade and potentialthreats. One approach to assessing Indonesia’s abil-ity to prevent a decline in foreign direct investmentis to look at the sectoral changes likely to occur. Ifthe sectors that are expanding (contracting) are theones that already account for a large share of FDI,then FDI is likely to increase (decrease) as well. Sec-tors that are growing less rapidly in Indonesia—apparel and textiles as well as assembly opera-tions—have received foreign direct investment inthe past, whereas any expansion in agriculturelikely involves little FDI. Opportunities exist forIndonesia to participate in global production net-works—cosmetics, machinery, and audiovisualequipment, for example—in which FDI may
expand in China and Indonesia simultaneously.And, like other ASEAN middle-income countries,Indonesia has the potential to develop its role as asupplier of specific parts to an automobile produc-tion network, given the restructuring of the indus-try now taking place in the region.27
Indonesia will need to tailor its strategy to graspthe opportunities for increases in trade and invest-ment flows if it is to offset the declines that are pro-jected in its exports to the EU, Japan, and theUnited States. Key elements will be measures torestore investor confidence and increase competi-tiveness. Meanwhile, Indonesia will have to avoidprotecting its domestic producers with excessivesafeguard measures in order to facilitate an adjust-ment in the manufacturing sector that responds tothe opportunities in China’s markets. Measuressuch as the recently introduced temporary safe-guards against garment imports will only prolongthe adjustments that Indonesia needs to make torealize its regional comparative advantages.
Malaysia
Among the developing middle-income countries inEast Asia, Malaysia is likely to be the one most pos-itively affected by China’s accession to the WTO.28
Overall, the effect on trade will be positive, asMalaysia becomes a more important trading part-
30 East Asia Integrates
TABLE 2.4 Market-by-Market and Product-by-Product Analysis of Thai Exports: China’sMarket Share and Closeness of Unit Value (UV) as Proxies for Potential Risk
China’s import share China’s import share
< 10% > 10% < 5% > 5%
Share in U.S. market (%)(n = 150 products)UV close 23.9 8.7 18.1 14.5UV not close 22.1 16.4 19.2 19.4
Share of market in analysis 71.1 71.1
Share in Japanese market (%)(n = 189 products)UV close 28.0 20.8 23.9 24.9UV not close 17.2 16.8 11.9 22.1Share of market in analysis 82.8 82.8
Note: The table shows calculations using two (arbitrary) threshold levels for Chinese imports: 5 percent and 10percent of the total import market. Sources: UN Comtrade data; China’s WTO accession agreement; authors’ calculations.

ner to China. Flows of foreign investment will notbe much affected, because the returns to invest-ment in Malaysia are expected to rise only slightlyover the accession period.
Malaysia’s exports of wood products and othermanufactures will likely increase as a result of WTOaccession, relative to the baseline, in response toincreased demand for these products in China andTaiwan (China).29 Malaysia’s overall volume of agri-cultural exports is not projected to change much, butexports of oilseeds, sugar, livestock, and cotton toChina and Taiwan (China) are likely to increase as aresult of China’s WTO accession. Demand fromChina will be compounded by a higher importdemand from China’s closest trading partners—Japan, the NIEs, the EU, and the United States—which themselves have benefited from China’sgrowth and WTO accession.
Just like the other developing economies of EastAsia, Malaysia is expected to lose some of its share inthe world apparel market as a result of China’saccession.30 In textiles, however, output will be littleaffected, and while the textile exports of all the otherdeveloping countries in the region will contract as aresult of China’s accession, Malaysia’s exports willhold their ground, buttressed by increased demandfrom China’s apparel industry. In this way, Malaysiais more similar to the NIEs in the region.
Malaysia’s involvement in intraregional produc-tion networks and the improving quality of its laborand infrastructure position it well as a destinationfor foreign direct investment that complementsinvestment in China. By 2001 Malaysia was alreadyexporting $1.3 billion to China and importing $1.4billion from China in parts and components (seeNg and Yeats 2003). During China’s recent expan-sion, Malaysia received significant FDI in the infor-mation technology-related and electronics indus-tries; FDI in electronics grew 40 percent from 1997to 2001. In the automobile sector, Malaysia mayposition itself to benefit from participating in inter-national production networks—for example, atpresent it is producing steering gears. Alternatively,it may maintain its more protectionist stand, whichmay harm its prospects to attract additional FDI.
The Philippines
Philippine exports to China stand to benefit fromChina’s growth and liberalization.31 With its acces-
sion to the WTO, China will demand more rawmaterials and land-intensive products, and thePhilippines is well positioned to increase exports offood and feed grains, cottons, sugar, vegetables, andfruits in response.32 Food grain exports, in particu-lar, are expected to rise substantially as a result ofChina’s accession. Output and exports of lightmanufactures are expected to grow faster with thanwithout China’s accession. Demand from Chinawill be compounded by increased import demandfrom China’s closest trading partners, which them-selves will have benefited.
At the same time, because the Philippines hascomparative advantages in many areas in whichChina is strong, China’s WTO accession will inten-sify competition between the two countries. Com-petition with China will be particularly acute inapparel produced for North America and WesternEurope because of the removal of quotas onChina’s textiles and apparel in these markets. Over-all, the impact of accession on the Philippines’ out-put of apparel and textiles will be negative. Even so,the Philippines occupies certain niches within theexport market that may be less exposed to Chinesecompetition.
The impact of China’s accession on the Philip-pines will also depend on investment flows. As inIndonesia and Thailand, the sectors that are grow-ing less rapidly—apparel, textiles, and assemblyoperations—have been targets of FDI in the past.However, looking ahead, the Philippines is poisedto take part in global production networks in elec-tronics, machinery and equipment, processing, andlight manufacturing, where FDI may well expandin China and the Philippines simultaneously. In2001 imports from China and exports to China inparts and components totaled $170 million and$342 million, respectively. This represents only a 2percent share of the total parts and componentstrade for the Philippines, suggesting considerableopportunity for expansion (Ng and Yeats 2003).
The Philippines’ ability to move up the value chainand capture more benefits from China’s accessionwill depend on what strategy the country adopts.Many of the sectors that will suffer from China’saccession to the WTO use unskilled labor intensively,while those sectors that will expand use land orskilled labor more intensively. Wages of unskilledworkers may well come under pressure. The potentialimpact on urban inequality and vulnerability in the
Regional Impact of China’s Accession to the WTO 31

short term will have to be carefully monitored andaddressed, with increasing pressure to facilitate theadjustment process in the labor market.
Thailand
Thailand is well positioned to expand its manufac-turing base, despite the fact that China’s WTOaccession may present a challenge to the Thai econ-omy as competition in the textile and apparel sectorstrengthens.
The intensity of trade between Thailand andChina (Ng and Yeats 2003) in 2001 suggests that theplanned reductions in protection of China’s mar-kets offer some good opportunities for exporters.For Thailand, much of the tariff reduction willoccur by 2004 (Table 2.1); it is receiving an averagetariff reduction of more than six percentage points.These rates represent the statutory tariff bindingsunder China’s WTO accession, but China is free tooffer tariff rates below these bindings as agreed, forexample, in 2003 under the “Early Harvest” aspectof the ASEAN-China Framework Agreement.
Thailand’s agricultural exports to China standto benefit significantly from the liberalization ofnontariff barriers.33 More than 30 percent of Thaiexports to China are in products—especially rice,rubber, and cane sugar—on which quantitativerestrictions will be lifted (Table 2.2).34 And, underthe WTO accession agreement, China confirms thattariff-rate quotas will be allocated with historicaltrade flows to end users in mind, and imports willbe allocated to the full limit of the quota establishedfor each calendar year based on demand in the Chi-nese market. Because Thailand’s import share inmany of the products subject to tariff-rate quotashas been high historically, it can expect to be allo-cated high quotas.35 Thailand’s food processingindustries also are well placed to expand in China’smarkets.
Thailand’s overall export volume will continueto grow. Demand from China will be compoundedby increased import demand from China’s closesttrading partners—Japan, the NIEs, the EU, and theUnited States—which themselves have benefitedfrom China’s growth and WTO accession. However,competitive pressures are likely to shift Thai manu-facturing increasingly into electronics and othermanufactures, especially metals and petrochemicalproducts. Exports from processing and electronics
industries are projected to increase, as are exportsto China of land-intensive products—oilseeds,sugar, and wood products. Cotton production mayexpand as demand for cotton increases in responseto the expansion of Taiwan’s textile sector. China’saccession will have a negative impact on growth inthe apparel and textile sectors.36
The increasing similarity in export structurebetween China and Thailand suggests, however, apotential threat from competition in third-countrymarkets. A market-by-market and a product-by-product analysis carried out for Thailand suggestthat Thai exports are less at risk in the United Statesthan in Japan.37 In the U.S. market, the specificproducts that appear most at risk from Chinesecompetition do not include Thailand’s mostimportant export products to the United States.38
Thailand’s exports to the United States are heavilyconcentrated. Based on data for 1995–99, the topfive products account for more than 25 percent oftotal Thai exports, and the top 100 productsaccount for 81 percent. Less than 9 percent of Thai-land’s U.S. exports fall into the at-risk categories—that is, where unit values are close to those of Chi-nese products and where China’s import marketshare exceeds 10 percent (Table 2.4).39 For productsin which China supplies 5–10 percent of U.S.imports, roughly 15 percent of Thai exports are atrisk.
Thailand’s exports to Japan are more vulnerablethan those to the United States. They are less con-centrated than those to the United States, with thetop five export products40 accounting for only 21percent of total Thai exports and the top 100 for 76percent. But nearly 21 percent of Thailand’s exportsare in the at-risk category—where the unit valuesof Thai products are close to those of their Chinesecompetitors and where China’s share of imports isgreater than 10 percent.41 Four of Thailand’s top 10exports to Japan appear to be at risk on this basis.42
Based on the 5 percent threshold, nearly 25 percentof Thailand’s exports to Japan are at risk.
As for investment flows, the opportunities mayoutweigh the risks. Sectors that are now contract-ing in Thailand—apparel and textiles as well asassembly operations—have historically accountedfor important shares of inward FDI. One-fourth ofFDI has gone to the hotel and restaurant sectors,which have room for expansion. At the same, Thai-land is poised to expand its role in global networks
32 East Asia Integrates

producing electronics, metals, petrochemicals, andother manufactures. In the electronics industry,when FDI flows to China gained momentum inthe late 1990s, FDI flows to Thailand in these sub-sectors continued growing, reaching 27 percent ofthe FDI in Thai manufacturing in 1997–2001. In2001 imports from China of parts and compo-nents already represented 13 percent (or morethan $1 billion) of Thailand’s total parts and com-ponents imports, and exports to China of partsand components totaled nearly $1 billion (Ng andYeats 2003).
In Thailand as in the Philippines, many of thesectors with exports at risk use unskilled laborintensively, while the expanding sectors use land orskilled labor more intensively. This finding suggeststhat growth and change in China will have the effectof lowering the wages of unskilled Thai workers rel-ative to those of skilled workers. The potentialimpact on urban inequality and vulnerability in theshort term will have to be carefully monitored andaddressed. As unemployment in the labor-intensivesectors rises, the pressure to facilitate the adjustmentprocess in the labor market will increase.
The extent to which Thailand will exit fromassembly-type production or upgrade its capabili-ties will depend largely on the policies it pursues—either embracing trade-induced competitivenessand productivity gains or submitting to short-termprotectionist pressures. Manufacturers are alreadycomplaining about low-cost imports of electricalappliances and motorbikes from China. Alsoimportant are supply factors, including the localavailability of engineering and sourcing capabili-ties, and government incentives for upgrading tech-nology. Thailand’s private business community isalready exploring niche opportunities within labor-intensive sectors.
Impact of WTO Accession on theLow-Income Countries of East Asia
The impacts of China’s accession to the WTO willvary widely among Cambodia, the Lao People’sDemocratic Republic (Lao PDR), and Vietnam.Cambodia is particularly vulnerable because of itsheavy emphasis on apparel exports. Lao PDR, bycontrast, is likely to be little affected in either Chinaor third-country markets. Vietnam falls somewherein between, with competitive pressures on itsexports matched by growing market opportunities.
Regional arrangements are playing an impor-tant role in ensuring that the low-income countriesof East Asia benefit from regional trade. For exam-ple, under the “Early Harvest” aspect of theASEAN-China Framework Agreement announcedin November 2002, China granted these countriesmost-favored-nation (MFN) status, even thoughthey have not yet acceded to the WTO.
Cambodia
For Cambodia, it will be important to capitalize onany opportunities from China’s growth. Cambodiawill see some benefits from China’s import tariffreductions,43 but, most important, some of Cam-bodia’s top exports—especially rubber and wood—will benefit from the reduction in quantitativerestrictions (Table 2.5). The “Early Harvest” provi-sion of the ASEAN-China Framework Agreementalso gives Cambodia MFN treatment. Growth inChina overall is expected to be a powerful source ofexternal demand for Cambodia, including forcross-border activity that may not be well capturedin official statistics.
China’s accession to the WTO could pose a dou-ble threat to Cambodia: to its balance of payments,
Regional Impact of China’s Accession to the WTO 33
TABLE 2.5 Share of Exports to China Affected by Lifting of Quantitative Restrictions (QRs):Cambodia and Lao PDR (percent of total exports,1995–99)
Percent of exports
Country facing QRs Key products (% of total exports)
Cambodia 11 Rubber (11); timber (2.9); plywood (4.64)Lao PDR 0.6 Rice (0.6); timber (62.4)
Sources: UN Comtrade data; China’s WTO accession agreement; authors’ calculations.
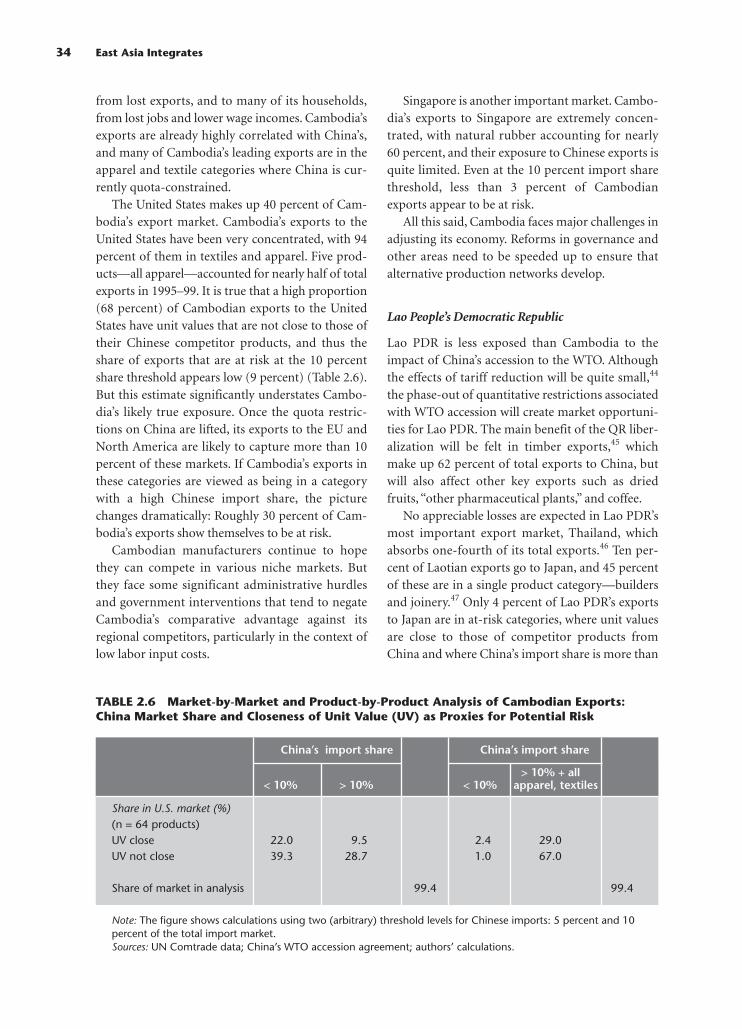
from lost exports, and to many of its households,from lost jobs and lower wage incomes. Cambodia’sexports are already highly correlated with China’s,and many of Cambodia’s leading exports are in theapparel and textile categories where China is cur-rently quota-constrained.
The United States makes up 40 percent of Cam-bodia’s export market. Cambodia’s exports to theUnited States have been very concentrated, with 94percent of them in textiles and apparel. Five prod-ucts—all apparel—accounted for nearly half of totalexports in 1995–99. It is true that a high proportion(68 percent) of Cambodian exports to the UnitedStates have unit values that are not close to those oftheir Chinese competitor products, and thus theshare of exports that are at risk at the 10 percentshare threshold appears low (9 percent) (Table 2.6).But this estimate significantly understates Cambo-dia’s likely true exposure. Once the quota restric-tions on China are lifted, its exports to the EU andNorth America are likely to capture more than 10percent of these markets. If Cambodia’s exports inthese categories are viewed as being in a categorywith a high Chinese import share, the picturechanges dramatically: Roughly 30 percent of Cam-bodia’s exports show themselves to be at risk.
Cambodian manufacturers continue to hopethey can compete in various niche markets. Butthey face some significant administrative hurdlesand government interventions that tend to negateCambodia’s comparative advantage against itsregional competitors, particularly in the context oflow labor input costs.
Singapore is another important market. Cambo-dia’s exports to Singapore are extremely concen-trated, with natural rubber accounting for nearly60 percent, and their exposure to Chinese exports isquite limited. Even at the 10 percent import sharethreshold, less than 3 percent of Cambodianexports appear to be at risk.
All this said, Cambodia faces major challenges inadjusting its economy. Reforms in governance andother areas need to be speeded up to ensure thatalternative production networks develop.
Lao People’s Democratic Republic
Lao PDR is less exposed than Cambodia to theimpact of China’s accession to the WTO. Althoughthe effects of tariff reduction will be quite small,44
the phase-out of quantitative restrictions associatedwith WTO accession will create market opportuni-ties for Lao PDR. The main benefit of the QR liber-alization will be felt in timber exports,45 whichmake up 62 percent of total exports to China, butwill also affect other key exports such as driedfruits, “other pharmaceutical plants,” and coffee.
No appreciable losses are expected in Lao PDR’smost important export market, Thailand, whichabsorbs one-fourth of its total exports.46 Ten per-cent of Laotian exports go to Japan, and 45 percentof these are in a single product category—buildersand joinery.47 Only 4 percent of Lao PDR’s exportsto Japan are in at-risk categories, where unit valuesare close to those of competitor products fromChina and where China’s import share is more than
34 East Asia Integrates
TABLE 2.6 Market-by-Market and Product-by-Product Analysis of Cambodian Exports:China Market Share and Closeness of Unit Value (UV) as Proxies for Potential Risk
China’s import share China’s import share
> 10% + all < 10% > 10% < 10% apparel, textiles
Share in U.S. market (%)(n = 64 products)UV close 22.0 9.5 2.4 29.0UV not close 39.3 28.7 1.0 67.0
Share of market in analysis 99.4 99.4
Note: The figure shows calculations using two (arbitrary) threshold levels for Chinese imports: 5 percent and 10percent of the total import market. Sources: UN Comtrade data; China’s WTO accession agreement; authors’ calculations.
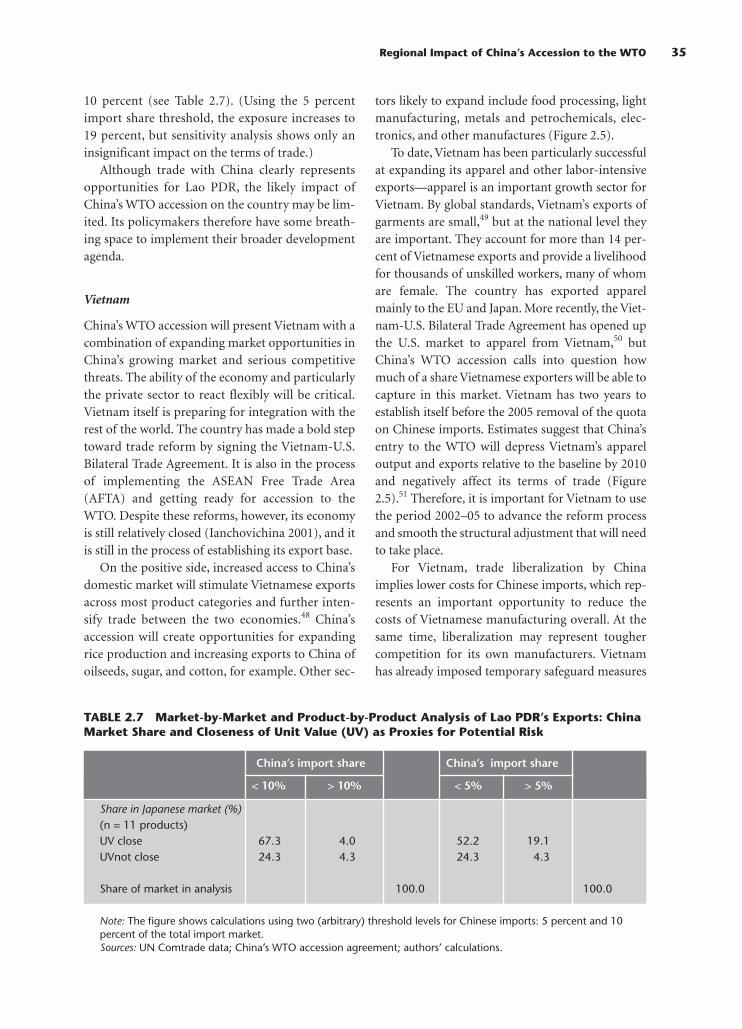
10 percent (see Table 2.7). (Using the 5 percentimport share threshold, the exposure increases to19 percent, but sensitivity analysis shows only aninsignificant impact on the terms of trade.)
Although trade with China clearly representsopportunities for Lao PDR, the likely impact ofChina’s WTO accession on the country may be lim-ited. Its policymakers therefore have some breath-ing space to implement their broader developmentagenda.
Vietnam
China’s WTO accession will present Vietnam with acombination of expanding market opportunities inChina’s growing market and serious competitivethreats. The ability of the economy and particularlythe private sector to react flexibly will be critical.Vietnam itself is preparing for integration with therest of the world. The country has made a bold steptoward trade reform by signing the Vietnam-U.S.Bilateral Trade Agreement. It is also in the processof implementing the ASEAN Free Trade Area(AFTA) and getting ready for accession to theWTO. Despite these reforms, however, its economyis still relatively closed (Ianchovichina 2001), and itis still in the process of establishing its export base.
On the positive side, increased access to China’sdomestic market will stimulate Vietnamese exportsacross most product categories and further inten-sify trade between the two economies.48 China’saccession will create opportunities for expandingrice production and increasing exports to China ofoilseeds, sugar, and cotton, for example. Other sec-
tors likely to expand include food processing, lightmanufacturing, metals and petrochemicals, elec-tronics, and other manufactures (Figure 2.5).
To date, Vietnam has been particularly successfulat expanding its apparel and other labor-intensiveexports—apparel is an important growth sector forVietnam. By global standards, Vietnam’s exports ofgarments are small,49 but at the national level theyare important. They account for more than 14 per-cent of Vietnamese exports and provide a livelihoodfor thousands of unskilled workers, many of whomare female. The country has exported apparelmainly to the EU and Japan. More recently, the Viet-nam-U.S. Bilateral Trade Agreement has opened upthe U.S. market to apparel from Vietnam,50 butChina’s WTO accession calls into question howmuch of a share Vietnamese exporters will be able tocapture in this market. Vietnam has two years toestablish itself before the 2005 removal of the quotaon Chinese imports. Estimates suggest that China’sentry to the WTO will depress Vietnam’s appareloutput and exports relative to the baseline by 2010and negatively affect its terms of trade (Figure2.5).51 Therefore, it is important for Vietnam to usethe period 2002–05 to advance the reform processand smooth the structural adjustment that will needto take place.
For Vietnam, trade liberalization by Chinaimplies lower costs for Chinese imports, which rep-resents an important opportunity to reduce thecosts of Vietnamese manufacturing overall. At thesame time, liberalization may represent toughercompetition for its own manufacturers. Vietnamhas already imposed temporary safeguard measures
Regional Impact of China’s Accession to the WTO 35
TABLE 2.7 Market-by-Market and Product-by-Product Analysis of Lao PDR’s Exports: ChinaMarket Share and Closeness of Unit Value (UV) as Proxies for Potential Risk
China’s import share China’s import share
< 10% > 10% < 5% > 5%
Share in Japanese market (%)(n = 11 products)UV close 67.3 4.0 52.2 19.1UVnot close 24.3 4.3 24.3 4.3
Share of market in analysis 100.0 100.0
Note: The figure shows calculations using two (arbitrary) threshold levels for Chinese imports: 5 percent and 10percent of the total import market. Sources: UN Comtrade data; China’s WTO accession agreement; authors’ calculations.
on imports of motorbikes. Such measures can onlyprolong the adjustments that Vietnam needs tomake to realize its regional comparative advantages.
Vietnam will have to greatly improve its busi-ness environment if it is to compete successfully forforeign investment with China and reap net gainsfrom China’s growing role in the region. Withoutsuch action, the net impact of China’s WTO acces-sion could be negative for Vietnam. It will beimportant to resist protectionist pressures fromdomestic producers and to act aggressively to estab-lish its garment exports in the United States.
Conclusions
The biggest beneficiary of China’s accession to theWorld Trade Organization is China itself, and mostof the benefits are associated with China’s owntrade liberalization. China’s accession and growingrole in the world economy also have importantimplications for the rest of East Asia.
Emerging East Asia is in a good position to ben-efit from China’s agricultural liberalization. Chinaalready is a major agricultural market for thesecountries, and the markets of most interest todeveloping East Asia—oilseeds, sugar, processedfoods—are poised to open further. Although theinitial protection in China’s food grain sector mightbe less than other studies have suggested (e.g., forrice), import demand is still expected to increaseconsiderably.
The potential for specialization and comple-mentary intraindustry trade in the manufacturingsector could be significant. China is increasingly acentral player in global production networks,including electronics and machinery. And its tradewith the rest of East Asia in parts and compo-nents—both imports and exports—represents anopportunity for the rest of emerging East Asia tobenefit from China’s growing role. In the automo-bile sector, however, China’s current plans forrestructuring its industry will make it a more effi-cient assembler, leading to a contraction of produc-tion in Japan and the NIEs. Likewise, the abolish-ment of import quotas on Chinese textiles andapparel in key markets by 2005 will make China aformidable competitor, especially in the apparelsector, and will lead to restructuring, with a partic-ularly significant impact on quota-dependent low-and middle-income countries.
Dynamic gains will swamp the static impactfrom China’s WTO accession. The liberalization ofChina’s services sector will lead to expandedexports of services such as transport logistics, com-munication, business, and tourism services, and theproductivity from expanded competition and for-eign entry in China’s services sector will fuelChina’s economy and demand. Because tradeintensity with China is high for all emerging EastAsian economies, they stand to benefit from thisdynamic growth. Growth in the region’s exportswill also be fueled by the increased demand fromChina’s major trading partners that benefit directlyfrom China’s accession to the WTO.
China’s accession and deeper integration intothe world economy present the East Asia regionwith a range of opportunities and challenges. Giventhe complexity of the changes, this assessment ofthe impact on the region’s economies is merely sug-gestive. However, it provides a framework for fur-ther understanding the likely changes, so that EastAsian economies can position themselves to graspthe opportunities and manage the challenges.
Endnotes
1. It is difficult to judge the accuracy of the FDI data becausethey reflect “round-tripping” investments undertaken fromChina to take advantage of concessions enjoyed only byforeign investors. The outflows do not include flowsthrough Hong Kong (China).
2. Descriptions of the CGE methodology and detailed resultsare given in the background paper by Ianchovichina andWalmsley (2003) at www.worldbank.org/eaptrade.
3. For information on individual sectors, see Yusuf, Altar, andNabeshima (2003).
4. These are weighted average tariffs computed using tradeweights for 2001; see Ianchovichina and Martin (2002). Seewww.worldbank.org/eaptrade for the estimated evolutionof tariff rates by product group, 1997–2010.
5. Dollar amounts are current U.S. dollars.6. China will be subject to additional textile safeguard quotas
until 2007, but these will be applicable for only one year ata time, unlike the existing quotas that were put in place foran indefinite period.
7. This is a consensus finding supported by Deutsche Bank(2001), Ianchovichina and Martin (2003), Ianchovichinaand Walmsley (2003), and Wang (2002). The textile indus-try in general will also be hurt, though not nearly as muchas the apparel industry, because some of these countrieswill start exporting textiles to China and other NIEs.
8. McKibbin and Tang (2000) and Ianchovichina and Walms-ley (2003) discuss in detail the effect of trade liberalizationon rates of return to capital and foreign investment.
9. All East Asian economies saw increases in their share ofmanufactured exports during the first half of the 1990s, andall saw changes in the structure of manufactured exports. In
36 East Asia Integrates

the 1990s the NIEs increased their share of electronics andinformation technology products and China increased itsshare of electronics and telecommunications exports.
10. Even though wage levels and productivity lag in China’shinterland, in the short to medium term the laggingregions may not be able to compete successfully with otherless developed East Asian economies in attracting footlooseexport-oriented industries because of high transport andother infrastructure costs.
11. These results from CGE modeling are consistent with find-ings of other CGE modeling work. See Li and others(2000), Deutsche Bank (2001), Ianchovichina and Martin(2003), and Wang (2002).
12. See Appendix Table 2.3 in the technical appendix to thischapter at www.worldbank.org/eaptrade.
13. Differences in tariff cuts reflect differences in export com-position by exporting country.
14. Ng and Yeats (2003) estimate a distance-adjusted tradeintensity index of 1.36 for China and Indonesia.
15. This group of products includes roasted decaffeinated cof-fee, palm kernel or babassu oil, cocoa powder, soap, cath-ode ray tubes, and cane and bamboo furniture.
16. Between 1995 and 1999 Indonesia was the second largestexporter of palm oil to China after Malaysia. In 1999 it sup-plied China with 355,172 metric tons.
17. The initial quota for palm oil is 2.1 million metric tons,which will rise to 3.168 million metric tons in 2005. In 1999Chinese imports of palm oil totaled 1.193 million metrictons. The in-quota tariff rate is set at 9 percent throughoutthe period, and while the initial out-of-tariff rate is as highas 63.3 percent, it is slated to decline constantly to 9 percentin 2006. Although TRQs will be allocated to both state andnonstate trading enterprises, the reduction in the propor-tion of state trading enterprises from 42 percent to 10 per-cent during the implementation period and the elimina-tion of the tariff-rate quota on January 1, 2006, shouldfacilitate development of the market.
18. For natural rubber imports, the total initial quota level is setat 429,000 metric tons, with an annual quota growth rate of15 percent after 2004, when the quota will be eliminated.Phasing-out dates are as of January 1 of the calendar yearspecified. Natural rubber is a product subject to designatedtrading (Annex 2B of China’s WTO accession agreement),which is slated to be liberalized within three years of acces-sion. Under designated trading, the Chinese governmentauthorizes only certain firms to engage in internationaltrade. Initial and final tariff rates are bound at 20 percent.
19. Urea accounted for 1.3 percent of Chinese imports fromIndonesia. Previously, urea was subject to both an importlicense and quota. These restrictions will be replaced by tar-iff-rate quotas upon accession. The initial quota for urea isabout 1.3 million metric tons, increasing to 3.3 million met-ric tons in 2006. The out-of-quota tariff rate is 50 percent.
20. Indonesia could increase its oil sales. However, becauseIndonesia is a member of the Organization of PetroleumExporting Countries (OPEC), its production is constrainedby OPEC quotas.
21. During 1995–99, based on 2,700 products at the five-digitStandard International Trade Classification (SITC) level,the correlation between Indonesia’s export structure andChina’s rose from 0.174 to 0.302.
22. In each major import market we looked at three variables. Thefirst was imports in a particular product category as a share oftotal imports from that country (e.g., garment imports fromThailand as a share of total imports from Thailand). This vari-
able indicates the importance of exports in that product cate-gory to the sending country. The second variable was importsfrom China as a share of total imports in that product category(e.g., garment imports from China as a share of total garmentimports in the United States). In the country-by countryanalyses, we looked at two (arbitrary) threshold levels for theshare of Chinese imports—10 percent and 5 percent of totalimports. The third variable was unit values of imports in theproduct categories in question. Product categories mask avariety of differences; unit values provide an additional indica-tion of how similar products are and therefore how likely thereis to be a terms-of-trade impact from competition. If the unitvalues of imports from both sending countries were on thesame side of the average unit values for the product category inquestion, we deemed them to be “close.”
23. These products are technically specified natural rubber (9percent of exports); footwear with outer sole of leather (8.2percent); video recording or reproducing apparatus (5.4percent); plywood with outer ply of tropical wood (5 per-cent); and other rubber footwear (3.1 percent).
24. Footwear with leather soles and video recording or reproduc-ing apparatus—which accounted for 8 percent and 5 percentof Indonesian exports to the United States, respectively.
25. Plywood with an outer ply of tropical wood (19.4 percent);frozen shrimp and prawns (11.5 percent); bituminous coal(7.1 percent); nickel mattes (3.5 percent); and nonalloyedaluminum (2.9 percent).
26. They are bituminous coal and cotton yarn other thansewing thread.
27. In 2001 Indonesia exported $313 million to China andimported $110 million from China in parts and compo-nents (Ng and Yeats 2003).
28. Although Malaysia faces some threats because of its highwages and heavy reliance on mid-range electronics, theeconomy-wide, medium-term analysis highlights equallyimportant opportunities for gains.
29. See Appendix Table 2.2 in the technical appendix to thischapter at www.worldbank.org/eaptrade.
30. See Appendix Table 2.2 in the technical appendix to thischapter at www.worldbank.org/eaptrade.
31. Ng and Yeats (2003) estimate a distance-adjusted tradeintensity index of 2.29 for China and the Philippines.
32. See Appendix Table 2.2 in the technical appendix to thischapter at www.worldbank.org/eaptrade.
33. The annual average value of Thailand’s exports to China is$2.14 billion. Thailand’s top exports to China include partsfor automated data processing machines, rice, rubber, canesugar, and plastics.
34. According to China’s WTO Protocol of Accession, tariff-rate quotas will apply to grains, sugar, and cotton for whichout-of-quota tariffs are quite high. Otherwise, after thephase-in period the tariffs will range between just 1 and 15percent—representing substantial liberalization over 2001levels (Anderson, Huang, and Ianchovichina 2002).
35. In 1995–99 Thailand supplied more than 84 percent ofChina’s imports of rice and nearly 60 percent of its importsof natural rubber. Thailand supplied almost 33 percent ofChina’s imports of raw cane sugar, but it is only one of 12countries that have initial negotiating rights.
36 See Appendix Table 2 in the technical appendix to thischapter at www.worldbank.org/eaptrade.
37. See the description of the methodology in the earlier sectionon Indonesia for which a similar analysis was carried out.
38. The top export products include digital monolithic units(7.7 percent); frozen shrimp and prawns (7.5 percent); pre-
Regional Impact of China’s Accession to the WTO 37
cious metal jewelry (4.1 percent); prepared and preservedcrustacea (3.6 percent); and leather sole footwear (2.4 per-cent).
39. These shares denote minimum levels of exposure, becausethe analysis covers only the top 150 and 165 products.
40. They are smoked sheets of natural rubber (6.4 percent);frozen shrimp and prawns (5.7 percent); frozen poultryparts (3.7 percent); preserved and prepared crustacea (2.8percent); and parts for automated data processingmachines (2.5 percent).
41. Among the top 200 export products, unit value data aremissing for 11. We focus on the remaining 189 products,which collectively accounted for 82.8 percent of Thailand’sexports to Japan.
42. The four exports are frozen poultry parts; prepared andpreserved crustacea; other frozen, dry, salted mollusks; andseats with wooden frames.
43. The weighted average tariff for the top 100 exports toChina will decline from a relatively low level of 4.3 percentin 2001 to 2.6 percent in 2005.
44. The weighted average tariff for the top 100 exports to Chinawill decline from 7.3 percent in 2001 to 6.0 percent in 2005.
45. Timber trading will be liberalized within three years ofaccession.
46. Nearly 62 percent of exports to Thailand are of wood andrelated products—categories in which a large Chineseexport supply response is not expected.
47. Lao PDR exports 11 products to Japan—largely wood andwood products (74 percent), coffee (24 percent), and somecotton shirts and footwear (2 percent).
48. Trade intensity indexes in Ng and Yeats (2003) show thatthe intensity of trade between China and Vietnam grewmarkedly between 1985 and 2001.
49. In 1997 Vietnam had less than a 1 percent share of theglobal apparel market.
50. Vietnamese apparel exports to the United States have grownrapidly over the past couple of years. In 2001 articles ofapparel and clothing accessories exported to the United Statesamounted to $57 million. In 2002 exports of these itemsexploded to nearly $900 million, and to more than $200 mil-lion in January 2003 alone (http://dataweb.usitc.gov/). Inresponse, the U.S. government was prompted to imposedquotas on Vietnamese garment exports.
51. See Fan and Li (2000). Also see Appendix Table 2.3 in thetechnical appendix to this chapter at www.worldbank.org/eaptrade.
References
The word processed describes informally reproduced works thatmay not be commonly available through libraries.
Anderson, K., J. Huang, and E. Ianchovichina. 2003. “Impact ofChina’s WTO Accession on Farm–Nonfarm IncomeInequality and Rural Poverty.” Policy Research WorkingPaper 3052, World Bank, Washington, D.C.
Claro, S. 2001. “Tariff and FDI Liberalization: What to Expectfrom China’s Entry into WTO?” Paper presented at EighthAnnual Conference on Empirical Investigations in Interna-tional Trade, Purdue University, November 9–11.
Deutsche Bank. 2001. Quantifying the Impact of China’s WTOEntry. DB Global Market Research, December 14.
Fan, Z., and S. Li. 2000. “The Implications of Accession to WTOfor China’s Economy.” Paper presented at Third Annual
Conference on Global Economic Analysis, Monash Univer-sity, Melbourne, Australia, June 28–30.
Francois, Joseph F., and Den Spinanger. 2002. “Market Access inTextiles and Clothing.” Paper prepared for Informing theDoha Process: New Trade Research for Developing Coun-tries, Cairo, May.
Hertel, T. W., T. L. Walmsley, and K. Itakura. 2001. “DynamicEffects of the ‘New Age’ Free Trade Agreement betweenJapan and Singapore.” Journal of Economic Integration 16 (4):446–48.
Huang, J., and S. Rozelle. 2002. “The Nature of Distortions toAgricultural Incentives in China and Implications of WTOAccession.” Paper presented at Seminar on WTO Accession,Policy Reform and Poverty Reduction in China, World Bank,Beijing, June 28–29.
Ianchovichina, Elena. 2001. “Trade Barriers in Vietnam andChina: A Comparison.” World Bank, Washington, D.C.Processed.
———. 2003. “GTAP-OD: A Model for Analyzing TradeReforms in the Presence of Duty Drawbacks.” GTAP Techni-cal Paper 21, Purdue University.
Ianchovichina, Elena, and William J. Martin. 2001. “Trade Liber-alization in China’s Accession to the World Trade Organiza-tion.” Journal of Economic Integrations 16 (4): 421–45.
———. 2003. “Economic Impacts of China’s Accession to theWTO.” Policy Research Working Paper 3053, World Bank,Washington, D.C.
Ianchovichina, Elena, and Terrie Walmsley. 2003.“The Impact ofChina’s WTO Accession on East Asia.” Policy Research Work-ing Paper 3109, World Bank, Washington, D.C. Processed.
IMF (International Monetary Fund). Various years. Direction ofTrade Statistics. Washington, D.C.: IMF.
Li, S., Z. Wang, Z. Fan, and L. Xu. 2000. WTO: China and theWorld. Beijing: China Development Press.
Martin, William J. 1993. “The Fallacy of Composition andDeveloping Country Exports of Manufactures.” World Econ-omy 16 (2): 159–72.
Marukawa, T. 2001. “Japanese Foreign Direct Investment andChina’s Industrial Development: Focusing on Automobile,Electronics, and Textile Industries.” Paper presented at Con-ference on Japan and China: Economic Relations in Transi-tion, Tokyo, January 18–19.
Mattoo, Aaditya. 2002. “China’s Accession to the WTO: The Ser-vices Dimension.” Paper presented at Seminar on WTOAccession, Policy Reform and Poverty Reduction in China,World Bank, Beijing, June 28–29.
McKibbin, W., and K. Tang. 2000. “Trade and Financial Reform inChina: Impacts on the World Economy.” World Economy 23 (8).
Ng, F., and A. Yeats. 2003. “Major Trade Trends in East Asia:What Are Their Implications for Regional Cooperation andGrowth?” Policy Research Working Paper 3084. World Bank,Washington, D.C.
Spihauger, Den. 1999. “Textiles beyond the MFA Phase-Out.”World Economy 22 (4): 455–76.
UNCTAD (United Nations Conference on Trade and Develop-ment). 2001. World Investment Report 2001: Promoting Link-ages. Geneva.
Wang, Z. 2002. “WTO Accession, ‘Greater China’ Free TradeArea, and Economic Relations across the Taiwan Strait.”Paper presented at Fifth Conference on Global EconomicAnalysis, Taipei, June 5–7.
Yusuf, Shahid, M. Anjum Altar, and Kaoru Nabeshima, eds.2003. Global Production Networking and TechnologicalChange in East Asia. Washington, D.C.: World Bank andOxford University Press.
38 East Asia Integrates

Half of world trade is now conducted under prefer-ential trade arrangements (WTO 2000a, 2000b), upfrom 40 percent in 1988–92 (Lloyd and Crosby,2002). In East Asia, the past several years have seena plethora of proposals for new preferentialarrangements, both bilateral and regional.Although very few of these proposals have reachedthe negotiation stage or have been formalized, sev-eral economies in the region are seriously engagedin developing new preferential trade relationships.These include China and two countries, Japan andthe Republic of Korea, that were formerly staunchlyagainst the preferential route to trade liberalization.
The most significant of the new initiatives interms of members is the ASEAN (Association ofSoutheast Asian Nations)-China Free Trade Areanow under negotiation.1 If agreement is reached, itwill be the world’s biggest free trade area, encom-passing 1.7 billion people, a collective gross domes-tic product (GDP) of almost US$2 trillion,2 andintraregional trade of $1.2 trillion. Other recentproposals include bilateral cooperation betweenJapan and Korea and between Japan and Singapore
39
3
New Regionalism:Options for
East Asia Mari Pangestu
Sudarshan Gooptu
and arrangements aimed at broader cooperation—for example, ASEAN + 3 (China, Japan, and Korea)and ASEAN + CER (Australia, New Zealand). Newearly warning systems for macroeconomic imbal-ances, as well as numerous technical assistance andinformation exchange arrangements, are also beingconsidered.
Preferential trade arrangements are sharply atodds with previous East Asian preferences for anondiscriminatory approach to reform.3 In themid-1990s economies in the region pursued a uni-lateral and nonpreferential route to trade liberal-ization—an approach that is embodied in theprinciples of the Asia-Pacific Economic Coopera-tion (APEC) forum and supported by evidencethat such a commitment contributes to growth,development, and greater integration in economicterms and more broadly.4 The East Asianeconomies, especially, undertook unilateral liberal-ization mainly on a most-favored-nation basis,encouraged by regional peer pressure and WorldTrade Organization (WTO) commitments, amongother factors.
This chapter draws on background papers prepared for this study by Peter Lloyd and Mark Crosby (2002) and He Fan(2002), as well as other papers listed in the references. We have also benefited from the excellent research assistancethat was provided by Qing Lani Wu from the Kennedy School of Government, Harvard University, during her internshipat the World Bank.
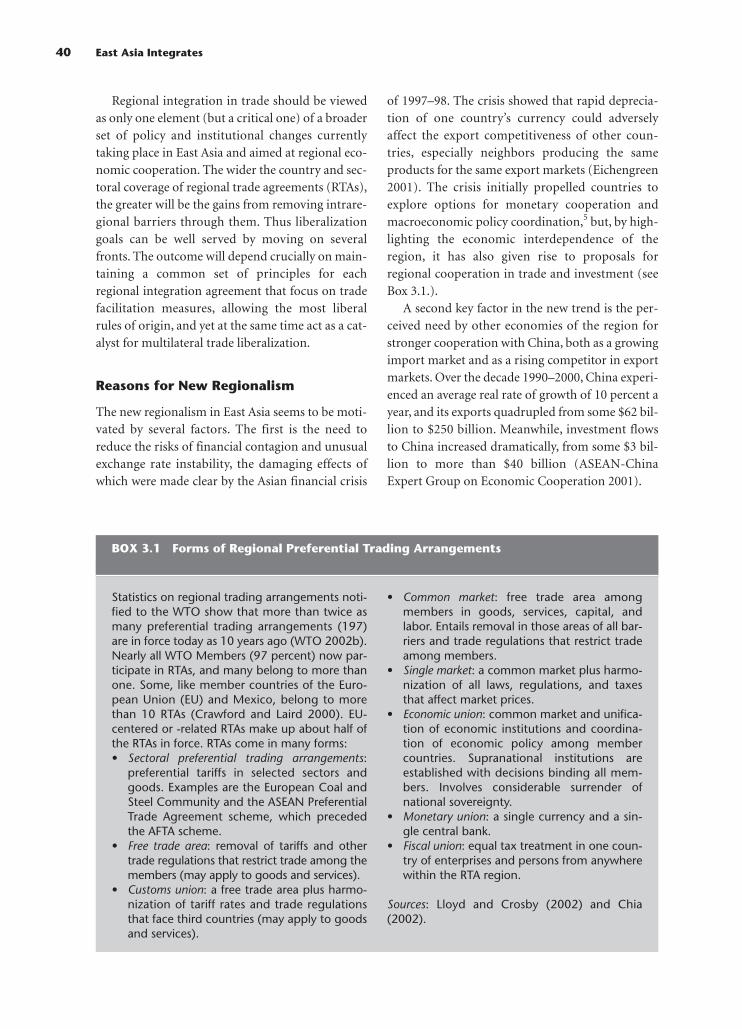
Regional integration in trade should be viewedas only one element (but a critical one) of a broaderset of policy and institutional changes currentlytaking place in East Asia and aimed at regional eco-nomic cooperation. The wider the country and sec-toral coverage of regional trade agreements (RTAs),the greater will be the gains from removing intrare-gional barriers through them. Thus liberalizationgoals can be well served by moving on severalfronts. The outcome will depend crucially on main-taining a common set of principles for eachregional integration agreement that focus on tradefacilitation measures, allowing the most liberalrules of origin, and yet at the same time act as a cat-alyst for multilateral trade liberalization.
Reasons for New Regionalism
The new regionalism in East Asia seems to be moti-vated by several factors. The first is the need toreduce the risks of financial contagion and unusualexchange rate instability, the damaging effects ofwhich were made clear by the Asian financial crisis
of 1997–98. The crisis showed that rapid deprecia-tion of one country’s currency could adverselyaffect the export competitiveness of other coun-tries, especially neighbors producing the sameproducts for the same export markets (Eichengreen2001). The crisis initially propelled countries toexplore options for monetary cooperation andmacroeconomic policy coordination,5 but, by high-lighting the economic interdependence of theregion, it has also given rise to proposals forregional cooperation in trade and investment (seeBox 3.1.).
A second key factor in the new trend is the per-ceived need by other economies of the region forstronger cooperation with China, both as a growingimport market and as a rising competitor in exportmarkets. Over the decade 1990–2000, China experi-enced an average real rate of growth of 10 percent ayear, and its exports quadrupled from some $62 bil-lion to $250 billion. Meanwhile, investment flowsto China increased dramatically, from some $3 bil-lion to more than $40 billion (ASEAN-ChinaExpert Group on Economic Cooperation 2001).
40 East Asia Integrates
BOX 3.1 Forms of Regional Preferential Trading Arrangements
Statistics on regional trading arrangements noti-fied to the WTO show that more than twice asmany preferential trading arrangements (197)are in force today as 10 years ago (WTO 2002b).Nearly all WTO Members (97 percent) now par-ticipate in RTAs, and many belong to more thanone. Some, like member countries of the Euro-pean Union (EU) and Mexico, belong to morethan 10 RTAs (Crawford and Laird 2000). EU-centered or -related RTAs make up about half ofthe RTAs in force. RTAs come in many forms:• Sectoral preferential trading arrangements:
preferential tariffs in selected sectors andgoods. Examples are the European Coal andSteel Community and the ASEAN PreferentialTrade Agreement scheme, which precededthe AFTA scheme.
• Free trade area: removal of tariffs and othertrade regulations that restrict trade among themembers (may apply to goods and services).
• Customs union: a free trade area plus harmo-nization of tariff rates and trade regulationsthat face third countries (may apply to goodsand services).
• Common market: free trade area amongmembers in goods, services, capital, andlabor. Entails removal in those areas of all bar-riers and trade regulations that restrict tradeamong members.
• Single market: a common market plus harmo-nization of all laws, regulations, and taxesthat affect market prices.
• Economic union: common market and unifica-tion of economic institutions and coordina-tion of economic policy among membercountries. Supranational institutions areestablished with decisions binding all mem-bers. Involves considerable surrender ofnational sovereignty.
• Monetary union: a single currency and a sin-gle central bank.
• Fiscal union: equal tax treatment in one coun-try of enterprises and persons from anywherewithin the RTA region.
Sources: Lloyd and Crosby (2002) and Chia(2002).
A third factor is the interest of business commu-nities in getting preferential access to foreign mar-kets, especially when these are imperfectly compet-itive markets in which some form of establishmentis required. The benefits from being the firstmovers in such an environment are significant. Thegreater tradability of many services and the growthof foreign direct investment (FDI) have con-tributed to this focus in policymaking.
Other factors include the move by manyeconomies, especially the more developed in theregion, to lower their average tariffs; the growingrecognition of the value of harmonizing standardsand regulations, so that they do not impede trade;and the higher concentration of trade amongregional partners, especially in East Asia. Thesechanges have affected countries’ assessment of thecosts and benefits of entering into preferentialagreements. Some countries are also seeking toforge new agreements as a defensive response toarrangements being created elsewhere.
Agreements on economic cooperation offeropportunities to build a sense of community or torepair past tensions between neighboringeconomies. Membership in regional tradingarrangements and informal economic cooperationforums provides occasions for numerous meetingsbetween senior officials, ministers, and leaders, andapparently it has served as a crucial component ofthe community building that has taken place in theregion, especially in ASEAN. APEC meetings havealso provided an important forum in which to dis-cuss economic and, increasingly, noneconomicissues of concern to members without having tonegotiate. The discussions and negotiations that dotake place, including issues not yet covered in theWTO, are also seen as important capacity-buildingexercises.
Finally, countries cite their perceptions of a slowpace of progress in trade liberalization, or theirexpectations of poor prospects under WTO andexisting regional cooperation mechanisms such asASEAN and APEC and the example set byincreased economic integration in Europe andNorth America.
Organization of This Chapter
The chances for a new WTO trade round are nowbrighter, and East Asia stands to gain from any
breakthroughs in the multilateral trade liberaliza-tion presently being considered at the global level.There is concern that pursuit of a regionalapproach might deflect attention from the multilat-eral agenda, that it could hold East Asia back fromreaching its full economic potential, and that itcould increase economic and political tensions inthe region. Experience shows that a haphazard anduncoordinated proliferation of preferential agree-ments can increase the costs of doing business.
With an eye toward helping the economies of theregion make informed decisions on trade policy andeconomic integration, this chapter reviews currentand proposed regional trading arrangements anddiscusses issues in their design. The first major sec-tion that follows outlines the agreements now inforce and under discussion in East Asia. The nextsection examines what the literature reveals aboutthe benefits and risks of such arrangements anddraws out some policy implications for East Asianeconomies. It includes a look at whether a regionalapproach can complement a multilateral approach.The evolving relationship between China andASEAN and the implications for their cooperationagreement now under negotiation are examined inthe next section. It is followed by a discussion ofregional financial cooperation and our conclusions.
Regional Trade Agreements in East Asia
Bilateral and multilateral trading arrangements inEast Asia are proliferating and becoming morecomplex. Chia (2002) distinguishes between eco-nomic regionalization and regionalism. Regionaliza-tion refers to the greater economic interdependencethat results from increased intraregional trade,investment, technology, and migration flows with-out any formal framework of cooperation. It isoften termed market-driven integration because itoccurs as each economy undertakes its own unilat-eral process of opening up, as well as fulfilling itsmultilateral commitments. Regionalism refers toformal economic cooperation and economic inte-gration arrangements, and agreements betweentwo or more countries that are designed to achieveeconomic growth through trade and investmentliberalization and facilitation.
Market-driven integration or regionalization hasbeen occurring in East Asia since the mid-1980s
New Regionalism: Options for East Asia 41
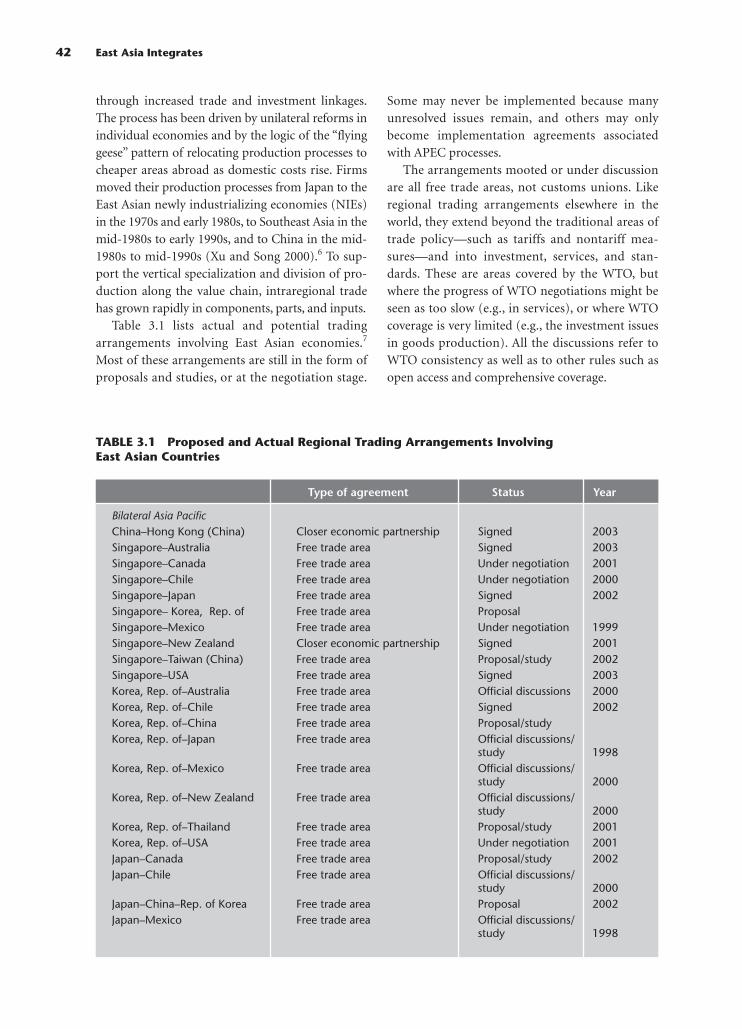
through increased trade and investment linkages.The process has been driven by unilateral reforms inindividual economies and by the logic of the “flyinggeese” pattern of relocating production processes tocheaper areas abroad as domestic costs rise. Firmsmoved their production processes from Japan to theEast Asian newly industrializing economies (NIEs)in the 1970s and early 1980s, to Southeast Asia in themid-1980s to early 1990s, and to China in the mid-1980s to mid-1990s (Xu and Song 2000).6 To sup-port the vertical specialization and division of pro-duction along the value chain, intraregional tradehas grown rapidly in components, parts, and inputs.
Table 3.1 lists actual and potential tradingarrangements involving East Asian economies.7
Most of these arrangements are still in the form ofproposals and studies, or at the negotiation stage.
Some may never be implemented because manyunresolved issues remain, and others may onlybecome implementation agreements associatedwith APEC processes.
The arrangements mooted or under discussionare all free trade areas, not customs unions. Likeregional trading arrangements elsewhere in theworld, they extend beyond the traditional areas oftrade policy—such as tariffs and nontariff mea-sures—and into investment, services, and stan-dards. These are areas covered by the WTO, butwhere the progress of WTO negotiations might beseen as too slow (e.g., in services), or where WTOcoverage is very limited (e.g., the investment issuesin goods production). All the discussions refer toWTO consistency as well as to other rules such asopen access and comprehensive coverage.
42 East Asia Integrates
TABLE 3.1 Proposed and Actual Regional Trading Arrangements Involving East Asian Countries
Type of agreement Status Year
Bilateral Asia PacificChina–Hong Kong (China) Closer economic partnership Signed 2003Singapore–Australia Free trade area Signed 2003Singapore–Canada Free trade area Under negotiation 2001Singapore–Chile Free trade area Under negotiation 2000Singapore–Japan Free trade area Signed 2002Singapore– Korea, Rep. of Free trade area ProposalSingapore–Mexico Free trade area Under negotiation 1999Singapore–New Zealand Closer economic partnership Signed 2001Singapore–Taiwan (China) Free trade area Proposal/study 2002Singapore–USA Free trade area Signed 2003Korea, Rep. of–Australia Free trade area Official discussions 2000Korea, Rep. of–Chile Free trade area Signed 2002Korea, Rep. of–China Free trade area Proposal/studyKorea, Rep. of–Japan Free trade area Official discussions/
study 1998Korea, Rep. of–Mexico Free trade area Official discussions/
study 2000Korea, Rep. of–New Zealand Free trade area Official discussions/
study 2000Korea, Rep. of–Thailand Free trade area Proposal/study 2001Korea, Rep. of–USA Free trade area Under negotiation 2001Japan–Canada Free trade area Proposal/study 2002Japan–Chile Free trade area Official discussions/
study 2000Japan–China–Rep. of Korea Free trade area Proposal 2002Japan–Mexico Free trade area Official discussions/
study 1998

Geographic proximity is not a key considera-tion. Some agreements are between close neigh-bors, but others are between trans-Pacific part-ners, such as Mexico and Singapore or Korea andChile. Several take ASEAN/AFTA (ASEAN FreeTrade Area) as their focal point and build uponAFTA.
ASEAN Free Trade Area
AFTA was until recently the only preferentialregional trade agreement in East Asia. It now has 10member economies with a combined population ofnearly half a billion and a combined GDP almost aslarge as China’s. AFTA became effective on January
New Regionalism: Options for East Asia 43
TABLE 3.1 (continued)
Type of agreement Status Year
Japan–Philippines Free trade area Proposal 2002Japan–Taiwan (China) Free trade area ProposalJapan–Thailand Closer economic partnership Proposal/study 2002Taiwan (China)–New Zealand Free trade area ProposalTaiwan (China)–Panama Free trade area ProposalHong Kong (China)–New Zealand Closer economic partnership Official discussions 2001Thailand–Australia Free trade area Under negotiation 2002Thailand–Croatia Free trade area Proposal 2001Thailand–Czech Republic Free trade area Proposal 2001Thailand–India Free trade area Proposal 2002USA–Philippines Free trade area Proposal 2002USA–Taiwan (China) Free trade area Proposal 2002
Regional plusAFTA Free trade area Being implemented 1992AFTA + CER Closer economic relations Official discussions/
study 2000ASEAN + China Free trade area Official study/
negotiation 2001ASEAN + India Regional trade and investment
agreement Proposal 2002ASEAN + Japan Closer economic partnership Official discussions 2002ASEAN + Korea, Rep. of Free trade area Official discussions 2002Singapore + EFTA Free trade area Signed 2002ASEAN + 3 Free trade area Official discussions/
study 2000EU + ASEAN Trans Regional EU–ASEAN
Trade Initiative (TREATI) Proposal 2003New regionalJapan–Korea, Rep. of–China Free trade area Official discussions/
study 2000Pacific 5 Free trade area Proposal 1997
Notes: EFTA (European Free Trade Area): Switzerland, Iceland, Liechtenstein, and Norway.Pacific 5: Singapore, Australia, New Zealand, United States, and Chile. ASEAN: Brunei, Cambodia, Indonesia, Lao PDR, Malaysia, Myanmar, the Philippines, Singapore,Thailand, Vietnam. ASEAN + 3: ASEAN plus Japan, Korea, and China.AFTA = ASEAN Free Trade Area.CER = Australia–New Zealand, already associated under the Australia-New Zealand Closer Economic RelationsTrade Agreement (ANZCERTA).Sources: Authors’ compilations from various media sources.

1, 2002, for the original six ASEAN members. Longertimetables apply to the newer members: 2004 forVietnam, 2006 for Lao People’s Democratic Republic(Lao PDR) and Myanmar, and 2008 for Cambodia.
Formal economic integration under AFTA isconfined mainly to tariff reductions, and intra-ASEAN trade already enjoys low tariffs. AFTA’s tar-get is for 0–5 percent tariffs for intra-ASEAN tradeamong the original six signatories. In fact, 90 per-cent of intra-ASEAN trade can already be con-ducted at tariffs in the 0–5 percent range. The aver-age ASEAN common effective preferential tariff(CEPT) fell from 12.76 percent to 2.91 percent overthe period 1993–2002. Because individual ASEANeconomies were already liberalizing their tradebefore AFTA came into force, AFTA’s commoneffective preferential tariff rates differ little from themost-favored-nation (MFN) rates, and indeed fortwo-thirds of the items in AFTA’s inclusion list thetwo tariffs are the same. As a result, not much ofintra-ASEAN trade has come in under the CEPTtariff (Soesastro 2001).
The integration of trade and investment—aswell as, to some extent, services and factor move-ments—among AFTA members stems more fromthe unilateral liberalization that has been under-taken by individual members and from the marketforces integrating their economies, especially thosethat are close neighbors, than to the agreementitself. Different AFTA members have different tradepolicy regimes: Some have chosen to multilateralizetheir AFTA commitments; others have chosen thesame schedule of tariff reductions as AFTA butwith a slightly higher end point on an MFN basiscompared with the AFTA preferential rate.
AFTA has evolved more gradually than regionalcooperation schemes in North America and Europe.Strong expressions of political commitment, andproposals to widen ASEAN cooperation, have notalways been followed up with concrete and broad-ranging implementation.8 A comprehensive andintegrated framework to cover investment, services,trade and investment facilitation measures, compe-tition policy, and antidumping has been proposed,but it has not progressed very far.
Proposed Regional Arrangements Involving China
Various initiatives have been discussed in the lastfew years to strengthen cooperation in trade,
investment, and finance between China and north-east Asia, ASEAN, the economies of Hong Kong(China) and Macao (China), and East Asia morewidely. At a recent meeting in Hong Kong, Chinaannounced the possibility of a Hong Kong, Macao,and China free trade area.9 And there have beendiscussions of separate bilateral agreementsbetween China and Asian countries such as Koreaand Thailand. The recently completed ASEAN + 3(China, Japan, and Korea) Bilateral Swap Arrange-ment of the Chiang Mai initiative (CMI) is perhapsa precursor to expanded trade arrangements andgreater financial and macroeconomic cooperationand coordination.10
Proposals for northeast Asian economic cooper-ation involving China, Korea, and Japan face manyobstacles such as agricultural protectionism andthe complex and shifting political relations innortheast Asia.11 Proposals such as a NortheastAsian Council and a Northeast Asian DevelopmentBank have not gone far (He Fan 2002).
The most concrete proposal is for economiccooperation between China and ASEAN. InNovember 2000 the fourth meeting of the ASEAN+ 3 leaders created a task force to study the possibil-ity of establishing an ASEAN free trade zone, and inNovember 2001, “to everyone’s surprise,” ASEANleaders and Chinese premier Zhu Rongji endorsedthe establishment of a free trade area betweenChina and ASEAN economies within 10 years inthe context of the Framework Agreement onChina-ASEAN Comprehensive Economic Cooper-ation (He Fan 2002).12 Negotiations are ongoing,including on issues of product coverage.
The envisaged scope of the agreement is quitecomprehensive. On trade in goods it goes beyondthe removal of tariffs and nontariff barriers toinclude trade facilitation measures such as con-formity of standards and procedures, and it alsocovers trade in services. The aim is to introduce tar-iff reductions for a certain group of products overthree years beginning prior to January 1, 2004, andfor other products over the agreed time frame ofthe free trade area—either to 2010 or to 2013.
Other ASEAN Proposals
In response to the proposed creation of the ASEAN-China Free Trade Area, other countries have nowshown interest in free trade agreements with
44 East Asia Integrates

ASEAN. Japanese prime minister Junichiro Koizumirecently suggested an ASEAN-Japan Comprehen-sive Economic Partnership, an arrangement thatwould include traditional as well as new elementsrelated to facilitation, standards, and other forms ofcooperation. Korea has made a similar proposal,and at the APEC 2002 meeting in Mexico, even theUnited States made a similar overture. PresidentGeorge W. Bush put forward a new trade initiativecalled the U.S. Enterprise for ASEAN Initiative,under which ASEAN could liberalize its trade withthe United States. No timetable has been set.
In the last year or so, Thailand has begun a moredeliberate pursuit of bilateral and regional arrange-ments. Observers are concerned, however, abouthow such arrangements will affect ASEAN eco-nomic regionalism and cooperation.
ASEAN is in a unique position at the hub of aseries of proposed preferential arrangements, butprobably because of its own internal weaknessesand lack of leadership it does not seem to be mak-ing the most of this position. Therefore, to achievesuccess ASEAN would be well advised to ensurethat it has a clear vision of what it wants to achievefrom regionalism and that it has a coherent frame-work for deciding which agreements to enter.
Regional Financial Cooperation
Since the Asian financial crisis, East Asianeconomies have accelerated cooperation in thefinancial sector and macroeconomic manage-ment.13 The initiatives range from institutional—such as the creation of an Asian Monetary Fund,sparked by the initial dissatisfaction with the Inter-national Monetary Fund (IMF) bailout programsat the beginning of the crisis—to the currency swaplines of the Chiang Mai initiative. In practice, theefforts have focused more on stabilizing currenciesthan on coordinating macroeconomic policy orachieving overall financial stability.
Financial cooperation to date has focused onstrengthening surveillance and supervisory mea-sures within the region and on swap agreements.ASEAN + 3 established an ASEAN + 3 SurveillanceProcess in November 1999, based in the ASEANSecretariat in Jakarta, to encourage the coordina-tion of macroeconomic and financial policies. Thefollowing issues will be covered by finance minis-ters at their meetings: enhancing cooperation in
monitoring short-term capital flows, developingearly warning systems, assessing regional financialvulnerabilities, and preventing a future financialcrisis. The Asian Development Bank has dedicateda monitoring unit to undertaking this surveillancetask as well as to providing training for central bankofficials and promoting other regulatory and mon-itoring initiatives.
The most concrete initiative is the Chiang Maiinitiative of May 2000. CMI expanded the existingASEAN swap arrangements to include all ASEANcountries and set up a network of bilateral cur-rency swap and repurchase arrangements amongASEAN + 3 countries. The aim of the initiative isto provide additional short-term hard currency forcountries facing possible liquidity shortfalls. Inaddition, the CMI will seek to achieve better mon-itoring of capital flows, regional surveillance, andtraining of personnel (Henning 2002). The ceilingfor withdrawal is not high and would not havebeen sufficient to prevent the liquidity shortfallduring the 1997–98 financial crisis. Some bilateralagreements have reached their ceiling withdrawalof $3 billion. The maximum available for with-drawal under each bilateral swap agreement is tobe negotiated between countries, because theterms of collateral and conditionalities need to bedetermined. By the end of March 2003, 12 bilateralswap agreements involving $39 billion had beenconcluded under the CMI. In addition, two morebilateral swap agreements proposed by Indonesiawith China and Korea, respectively, were underway. The implementation of the CMI bilateralswap agreements is to be reviewed in 2004, atwhich time the ASEAN + 3 group of countries maydecide to amend the CMI framework arrange-ment, to make it permanent, or to begin a processto transform it into a more formal institution forforeign exchange pooling.14 The June 2003 APECSummit launched the $1 billion Asian Bond Fund,a scheme that aims to reinvest a small portion ofthe reserves of Asia’s central banks within theregion.15 It also endorsed initiatives to contain theeconomic damage from the severe acute respira-tory syndrome (SARS).
According to He Fan (2002), China was not ini-tially enthusiastic about financial cooperation inEast Asia, but it has changed its attitude out of con-cern that if it does not play a positive role in theprocess, it will be kept out by other countries. The
New Regionalism: Options for East Asia 45

Chinese government reportedly feels that trade andtechnological cooperation is more fundamentaland should be preconditions for financial coopera-tion. According to McKinnon (2001), a U.S. dol-lar–linked currency standard can be used to achieveregional exchange rate stability. Mundell (2003)supports the idea of having an Asian “currencyanchor,” but believes that neither the Chinese yuannor the Japanese yen is a suitable candidate at thepresent time. Meanwhile, Kuroda and Kawai (2003)note that a U.S. dollar– based exchange rate regimemakes an economy susceptible to fluctuations ineffective exchange rates (e.g., when the dollar-yenrate became volatile in 1995 and 1998). Such risksneed to be managed as well. The ASEAN Task Forceon ASEAN Currency and Exchange Rate Mecha-nism, which was established in March 2001, is dis-cussing ways of coordinating exchange rate policiesin the region.16
Costs and Benefits of EconomicRegionalism
What can countries hope to achieve from preferen-tial trade agreements (PTAs)? What does the litera-ture say about the economic costs and benefits ofthese agreements?
The economic benefit of a preferential tradeagreement is the gains in economic efficiencyachieved from trade liberalization. A membercountry will allocate resources to sectors in which ithas a comparative advantage vis-à-vis other mem-bers, and trade is created. The greater size of thecombined market can also contribute to economiesof scale and attract foreign direct investment,although because the benefits depend on the size ofmarkets as well as on the producers in the RTA,they vary widely across countries.
Other than the traditional economic benefit ofgreater efficiency, countries enter into RTAs formany development-related reasons. Such arrange-ments offer the chance to create larger regionalmarkets that are more attractive to foreigninvestors; to sequence liberalization by opening upin stages; to lock in place unilateral reforms; and topursue structural change jointly with other mem-bers. Even though liberalization, trade facilitation,and structural reform are often thwarted by vestedinterests, regional cooperation for the joint promo-tion of these processes can make them easier to
achieve. For smaller states, RTAs also offer theopportunity to build capacity in trade negotiations.
But preferential agreements also carry risks, oneof which is that trade may be diverted away frommore efficient nonmembers to less efficient mem-bers. If a preferential agreement diverts more tradethan it creates, it will yield smaller gains in effi-ciency than would multilateral liberalization. Thelarger the difference between the preferential RTAtariff and the external tariff imposed on importsfrom nonmembers, the greater is the trade diver-sion effect. Trade also may be diverted if membersof a free trade area impose rules of origin, becausesuch rules may cause imports to be redirectedthrough the member country that has the lowestexternal tariff.
The literature on the benefits and costs ofregional trade agreements does not offer conclusiveguidance on whether trade creation will outweightrade diversion or on what such agreements willcontribute to welfare.17 The view of Srinivasan,Whalley, and Wooton (1993) is that quantitativeassessments do not offer sufficient grounds foreither vigorous support of or vigorous oppositionto preferential agreements. They reviewed work inthis field based on computable general equilibrium(CGE) models and found that the welfare effects ofpreferential trade agreements had probably beenpositive but not very large.18
Krueger (1995) found that trade diversiontended to occur less in those RTAs whose membershad high levels of bilateral trade before entering theagreement. And Yeats (1998), looking at experiencein MERCOSUR (Mercado Común del Sur/South-ern Common Market Agreement), found that tradediversion can be minimized if external tariffs arelow and if members become more open by furtherreducing their external tariffs as they enter the RTA.
Soloaga and Winters (1999), in a comprehensivestudy of nine arrangements over 17 years, found noindication that the rise in preferential agreementsin the 1990s significantly boosted intrabloc trade.At the same time, for trade diversion they foundsignificant effects only in the European Union (EU)and European Free Trade Area (EFTA).
Davis, McKibbin, and Stoeckel (2000) foundthat a joint free trade arrangement between AFTAand CER would yield worthwhile benefits19: forAFTA an extra $25.6 billion and for CER an addi-tional $22.5 billion in GDP in net present value
46 East Asia Integrates

(that is, in discounted cash flow) terms. The realconsumption gain, allowing for the ability to shiftspending through time, would be 1 percent by 2005for AFTA and 0.6 percent for CER.20
However, the same study also found that ifAPEC proceeds on schedule, the additional gainsfrom the AFTA-CER arrangement would be rela-tively small: those to AFTA would be just over $10billion, and those to CER members would be justunder $2 billion. Two reasons are given for thisfinding: (1) trade between AFTA and CER is smallcompared with members’ trade with APEC as awhole; and (2) APEC is not preferential, so thatsome of the APEC gains could in fact be attributa-ble to the AFTA-CER connection, to the extent thatthis arrangement encourages further liberalizationby APEC members.
Bayoumi and Mauro (2001) also examined thecosts, benefits, preconditions, and implications ofan ASEAN regional currency arrangement that isassumed to culminate in a regional currency. Theyare of the view that, on economic criteria, ASEANappears less suited for a regional currency arrange-ment than Europe before the Maastricht Treaty,although the difference is not large.21 The experi-ences of the European Monetary Union (EMU)indicate that the path toward a common currency isa difficult one. It requires a firm political commit-ment to ensure that an attempt to form a regionalcurrency arrangement is not viewed as simplyanother fixed exchange rate regime open to specu-lative crises.
Clarete, Edmonds, and Wallack (2003) provideempirical analysis to show that the impact of PTAson trade flows varies widely across PTAs. They alsofind that the establishment of APEC and the EUexpanded trade significantly, both among membersand to the rest of the world, providing evidencethat PTAs can create rather than divert trade.Although they used export data in this analysis,their findings are consistent with those of Frankel(1997), who used total trade data (i.e., sum ofexports and imports). Frankel attributed the strongpositive effect on trade to the large share of totalworld trade accounted for by the APEC membercountries. Meanwhile, Low (2003) concedes thatbilateral and cross-regional trading arrangementsare still “second best,” and that broader regionalismand multilateralism are still superior. The Dohaministerial declaration has acknowledged that this
“theory of new regionalism” complements andsupplements the World Trade Organization. Thecurrent initiatives in Asia and Asia-Pacific regional-ism are responses to regionalism happening else-where in the context of globalization, informationcommunication technology, and knowledge-basedeconomies.
Free Trade or a Bloc-ed Up World?
The question of whether regional trade arrange-ments are stumbling blocks or building blocks inattempts to achieve a more open multilateral sys-tem arises often. RTAs have not always been effec-tive in locking in unilateral reforms,22 and it is notclear whether, when compared with a multilateralapproach, they are able to achieve deeper and fasterliberalization. Negotiations of RTAs have arguablybeen no more successful than multilateral negotia-tions in dealing with sensitive sectors and issues.Indeed, RTA negotiations, like multilateral negotia-tions, have tended not to cover sensitive sectorssuch as agriculture. Furthermore, regional arrange-ments may divert attention and resources awayfrom multilateral and unilateral efforts to liberalizeand facilitate trade. Especially in small economies,concentration on negotiating regional agreementscould have dire implications if it slows downprogress on these fronts.
These concerns aside, several recent studies havesuggested that, under some circumstances, uncoor-dinated preferentialism could lead to global freetrade. Their results are derived from special condi-tions—in which just one (differentiated) good orservice is traded in oligopolistic markets—but theyprovide some guidance and focus for cooperation.
For one thing, consider the case in which, drivenby producers’ interest in getting access to rents inforeign markets, economies form a bloc to whichothers seek membership. If the bloc’s constitutionsays that everyone who wants to join must be let inon the same terms as the original members, thenthe excluded economies continue to seek to joinuntil everyone is a member.
Another possibility is the merging of blocs.Andriamananjara (1999), who considers the incen-tives to merge smaller blocs, starts with a situationin which each economy forms a bloc with oneneighbor. In the next stage, the members of oneagreement merge with those of one other agree-
New Regionalism: Options for East Asia 47

ment, and so on. Could this process continue untilglobal free trade is reached, or will it stop beforethen? He finds that global free trade can be attained,but only if the general level of inter-bloc tariffs islow enough. When tariffs are low, the oligopolisticfirms that populate this model can make greaterprofits with unrestricted access to all markets.
These two situations suggest that it would beworthwhile to introduce rules on the use of prefer-ential agreements and, in particular, rules on acces-sion to such agreements. When bloc members havediscretion over who can join, they will stop letting inothers before global free trade is reached. Therefore,without a rule on accession, free trade blocs willstop growing at a point short of universal free trade.
Network effects are a factor that could drive theoutcome of a preferential approach further towardfree trade. When direct network effects exist, thevalue of a product increases with the number ofconsumers who use a compatible product. Gandaland Shy (2001) show that when these effects are sig-nificant, the incentive to form a standards uniondisappears.
Freund (2000), by examining serial bilateralism,provides another perspective on the process of con-solidation.23 She finds that the benefits of a bilateralagreement include higher profits from preferentialaccess to foreign markets and higher consumer sur-plus at home. These gains always outweigh the lossof profits in the home market and the loss of tariffrevenue that results from offering foreign suppliersaccess at preferential rates. This is the case no mat-ter what agreements are already in place and whatother economies have done. The best strategy, then,is for each economy is to have a bilateral agreementwith every other economy. In this model, in thepresence of uncoordinated bilateralism the out-come is free trade.
In reality, as Freund points out, costs are associ-ated with having a series of bilateral agreements,including those associated with complex rules oforigin. The issue of sensitive sectors is also ignored.And the more dimensions there are to an agree-ment, the more scope there is to apply discrimina-tion in a variety of ways and the more difficult itbecomes to bolt different agreements together(Snape 1996a; Findlay 2001). Cooperation with oneset of partners could make it more difficult to har-monize with other partners, and it could impede thesigning of new preferential agreements. Such condi-
tions, in turn, could stop the proliferation of agree-ments before free trade is reached. The issues thatare now on the trade liberalization agenda—forexample, in services, standards, and investment—are likely to make preferential agreements increas-ingly complex. The outcome, in practice, is likely tobe a host of different agreements between differentgroups of partners—the “spaghetti bowl” effect.
Latin America’s overlapping preferential agree-ments have produced this effect. Experience showsthat in these circumstances the costs of doing busi-ness increase, pushed up by inconsistencies amongdifferent agreements—for example, different sched-ules for phasing out tariffs; different rules of originand exclusions, conflicting product standards, anddifferences in rules on antidumping and other regu-lations and policies. The more dimensions there areto the agreements and the more agreements thereare, the wider is the scope for such inconsistencies.And if the costs of doing business increase, furthertrade diversion effects may arise.
Distribution of Benefits: Hubs and Spokes
Many of the proposed regional trading agreementsin East Asia are of the so-called hub and spoke pat-tern.24 The concern here is that the balance ofadvantages in hub and spoke arrangements willtend to favor the hub because of its stronger bar-gaining position and the greater attractiveness toinvestors of its central location. Agreements oncontentious matters will also tend to be tailored tothe demands of the hub. The spokes, for their part,having secured their preferential access, will havean incentive to oppose the admission of new mem-bers into the circle. The rest of this section summa-rizes the key findings of the substantial literatureon hub and spoke arrangements.
Hub and spoke agreements do not provide equalmarket access to all participants. Even if tariffs wereremoved along each spoke, the spoke countrieswould still not have free access to each other’s mar-kets but only to that of the hub.
Snape (1996b) explains that in such systemsthere is an incentive to create tailor-made agree-ments to deal with products that the hub countryregards as contentious. He also notes how smallcountries have incentives to join preferential agree-ments, especially as more and more countries signup with the hub economy. Indeed, the hub and
48 East Asia Integrates
spoke system can “spread like a rash” (Baldwin1997). The spoke economies may or may not havedeals with each other—see, for example, Snape,Adams, and Morgan (1993); Anderson and Snape(1994); Wonnacott (1996); Snape (1996b).
Compared with all the other spokes, the hubeconomy benefits from its preferential access to eachspoke economy. Only firms based at the hub getduty-free inputs from each spoke. The hub countryalso gains if it diverts investment from each of thespokes; its favored position gives producers accessnot only to the domestic market but also to those ofall the spoke economies. Furthermore, producersbased in the hub are likely to be able to get moreinputs at low or zero tariffs than those based in thespokes, because they can source both from the huband from any of the spokes. An inefficient pattern ofinvestment may be perpetuated, as a result of iner-tia, even if a hub and spoke system evolves into afree trade area (Wonnacott 1996).
A spoke economy does not gain from free tradewith other spokes; it could be damaged by discrim-ination in other spoke markets; and its ability tocompete in all markets against firms that are basedin the hub might be reduced (Wonnacott 1996). Itcan respond in three ways:
1. It could organize equivalent agreements withother spoke countries. But doing so may becostly, and the risk is that a series of such agree-ments, negotiated one after the other, could sim-ply add to the layers of discrimination as eachpair deals with its own set of difficult issues.
2. It could make one bloc with all the other spokes.Realistically, however, because the originalmembership of the set of spokes was the resultof pressures from interest groups in the hub, itmay be difficult for this group to agree subse-quently and simultaneously on how to deal witha now larger set of contentious issues.
3. It could unilaterally cut tariffs to the rest of theworld. Depending on the extent of these cuts,such an initiative could offset the investmentdiversion effects. The spoke agreement wouldthen be part of a transition to free trade, but anexpensive one. In hindsight, a giant leap to freetrade is preferable to a couple of small steps.
Hub and spoke mechanisms can lead to greaterresistance to multilateral liberalization. Snape
(1996b) argues that each spoke country has paid aprice for its preferential access to the hub country,and that it will resist further reductions of tariffs onan MFN basis that erode the value of its specialdeals on sensitive products.
At the least, the trade policy of the hub couldbecome a source of conflict among current andprospective members of the arrangement (Andria-mananjara 1999). Spokes may seek to have newmembers come in with fewer and fewer benefits.This objective may stem not only from domesticinterests in the spoke countries, but also from for-eign investors who have invested in these countriesin order to gain access to the hub. (These investorsmay be originally from the hub country, and theywill not be without influence in their old home.)
In short, the hub and spoke structure is fraughtwith many risks. Economies that are large enoughhave strong incentives to assume the role of hubeconomy and to dominate a group of complemen-tary economies in their region. But doing so leadsto a structure of layers of discrimination andpotential conflict. A hub economy that is alreadydominant in economic terms can easily be per-ceived as trying to acquire political dominance bybiasing the rules of the new trading system in itsfavor (Wonnacott 1996).
Assessing the Alternatives
What type of regional arrangements will best servethe East Asia region? First, they should not become a“stumbling bloc” to multilateral liberalization. Sec-ond, they should focus less on easing market accessand more on facilitating trade measures and achiev-ing cooperation on external issues of common inter-est and mutual benefit, such as some of the negotiat-ing issues in the WTO. Third, they should contributepositively to the multilateral trade liberalizationprocess—for example, by including standstill provi-sions on further barriers to trade and investment; byimplementing a simultaneous program of reductionof barriers to nonmembers; by allowing the most lib-eral rules of origin possible; and by avoiding thespaghetti bowl outcome for other issues.
ASEAN and China
Adjustments in industrial trade and investmentresulting from China’s accession to the WTO are
New Regionalism: Options for East Asia 49
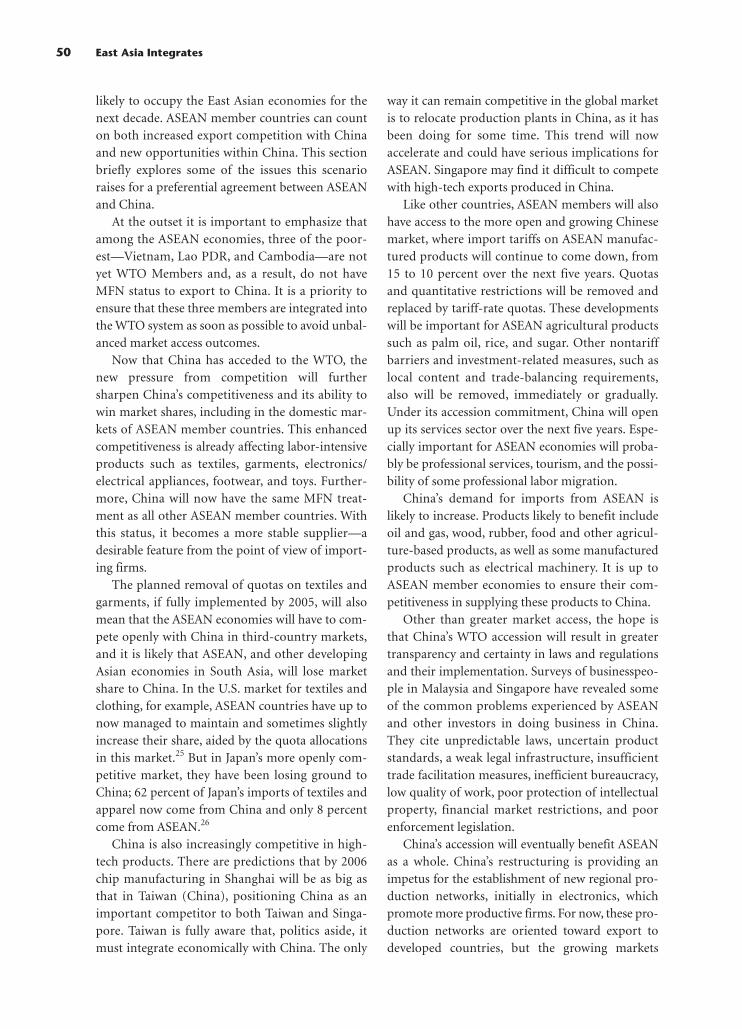
likely to occupy the East Asian economies for thenext decade. ASEAN member countries can counton both increased export competition with Chinaand new opportunities within China. This sectionbriefly explores some of the issues this scenarioraises for a preferential agreement between ASEANand China.
At the outset it is important to emphasize thatamong the ASEAN economies, three of the poor-est—Vietnam, Lao PDR, and Cambodia—are notyet WTO Members and, as a result, do not haveMFN status to export to China. It is a priority toensure that these three members are integrated intothe WTO system as soon as possible to avoid unbal-anced market access outcomes.
Now that China has acceded to the WTO, thenew pressure from competition will furthersharpen China’s competitiveness and its ability towin market shares, including in the domestic mar-kets of ASEAN member countries. This enhancedcompetitiveness is already affecting labor-intensiveproducts such as textiles, garments, electronics/electrical appliances, footwear, and toys. Further-more, China will now have the same MFN treat-ment as all other ASEAN member countries. Withthis status, it becomes a more stable supplier—adesirable feature from the point of view of import-ing firms.
The planned removal of quotas on textiles andgarments, if fully implemented by 2005, will alsomean that the ASEAN economies will have to com-pete openly with China in third-country markets,and it is likely that ASEAN, and other developingAsian economies in South Asia, will lose marketshare to China. In the U.S. market for textiles andclothing, for example, ASEAN countries have up tonow managed to maintain and sometimes slightlyincrease their share, aided by the quota allocationsin this market.25 But in Japan’s more openly com-petitive market, they have been losing ground toChina; 62 percent of Japan’s imports of textiles andapparel now come from China and only 8 percentcome from ASEAN.26
China is also increasingly competitive in high-tech products. There are predictions that by 2006chip manufacturing in Shanghai will be as big asthat in Taiwan (China), positioning China as animportant competitor to both Taiwan and Singa-pore. Taiwan is fully aware that, politics aside, itmust integrate economically with China. The only
way it can remain competitive in the global marketis to relocate production plants in China, as it hasbeen doing for some time. This trend will nowaccelerate and could have serious implications forASEAN. Singapore may find it difficult to competewith high-tech exports produced in China.
Like other countries, ASEAN members will alsohave access to the more open and growing Chinesemarket, where import tariffs on ASEAN manufac-tured products will continue to come down, from15 to 10 percent over the next five years. Quotasand quantitative restrictions will be removed andreplaced by tariff-rate quotas. These developmentswill be important for ASEAN agricultural productssuch as palm oil, rice, and sugar. Other nontariffbarriers and investment-related measures, such aslocal content and trade-balancing requirements,also will be removed, immediately or gradually.Under its accession commitment, China will openup its services sector over the next five years. Espe-cially important for ASEAN economies will proba-bly be professional services, tourism, and the possi-bility of some professional labor migration.
China’s demand for imports from ASEAN islikely to increase. Products likely to benefit includeoil and gas, wood, rubber, food and other agricul-ture-based products, as well as some manufacturedproducts such as electrical machinery. It is up toASEAN member economies to ensure their com-petitiveness in supplying these products to China.
Other than greater market access, the hope isthat China’s WTO accession will result in greatertransparency and certainty in laws and regulationsand their implementation. Surveys of businesspeo-ple in Malaysia and Singapore have revealed someof the common problems experienced by ASEANand other investors in doing business in China.They cite unpredictable laws, uncertain productstandards, a weak legal infrastructure, insufficienttrade facilitation measures, inefficient bureaucracy,low quality of work, poor protection of intellectualproperty, financial market restrictions, and poorenforcement legislation.
China’s accession will eventually benefit ASEANas a whole. China’s restructuring is providing animpetus for the establishment of new regional pro-duction networks, initially in electronics, whichpromote more productive firms. For now, these pro-duction networks are oriented toward export todeveloped countries, but the growing markets
50 East Asia Integrates

within East Asia provide a potential complementarysource of demand.27 The Framework Agreement onChina-ASEAN Comprehensive Economic Coopera-tion, with its “Early Harvest” provisions, providesanother avenue through which the poorer countriesin the region, including non-WTO Members,28 canbenefit from trade opportunities in the region.
ASEAN-China Economic Relations
ASEAN and China have strengthened their mutualtrade and investment ties in the last decade, pro-pelled by the dynamic growth in China, and inASEAN before the financial crisis; by the liberaliza-tion undertaken by individual countries; and bytheir geographic proximity.
ASEAN as a region is China’s fifth largest tradingpartner, after the United States, Japan, the EU, andHong Kong. ASEAN’s share of China’s trade is stillquite small, at around 8 percent, even though it hasbeen growing by 20 percent a year during the lastdecade. Between 1991 and 2000 ASEAN increasedits share of China’s exports from 5.7 to 6.9 percentand of China’s imports from 6 to 9.9 percent.
ASEAN exports to China still consist mainly ofresource- or agriculture-based products (minerals,pulp, wood, vegetable oil, rice, and sugar). How-ever, a growing share consists of machinery andelectrical components for assembly into final goodsin China. These exports are linked to trade-relatedinvestments and are part of the multinationalregional production structure as well as theregional pattern of sourcing (ASEAN-China ExpertGroup on Economic Cooperation 2001; Yusuf,Altaf, and Nabeshima 2003). Intraindustry tradealso takes place in textiles and fibers.
Investment relationships between ASEAN andChina also have been growing stronger. Invest-ments have flowed from ASEAN countries intoChina in the last decade, with varying degrees ofsuccess. Singapore was one of the first SoutheastAsian countries to enter when China opened up toforeign investment in the late 1970s; reflectingancestral links, the investments went mainly tosmall businesses in Guangdong and Fujian. By theend of 2001, Singapore was the fifth largest investorin China, with a cumulative realized investment of$18.6 billion in that country.
Recently, China itself has begun a vigorous out-ward investment drive, and the government has
encouraged Chinese companies to invest in andcontract for major engineering and constructionprojects (Far East Economic Review, March 28,2002). This go-abroad policy appears to bedesigned to expose Chinese firms to internationalbusiness practices as well as to achieve resourcesecurity, given this high-growth economy’sdemands for fuel, minerals, and other resources.For example, the Chinese state-owned offshore oilcompany, CNOC, recently acquired the Spanish oilcompany Repsol-YPF for its Indonesian oil and gasassets.29 Other gas purchase deals between Indone-sia and China are being negotiated. But because ofthe sluggish growth of most economies in thegroup, ASEAN in general remains a less attractivedestination for Chinese investment than LatinAmerica, the United States, or Europe. Thus far, itaccounts for 20 percent of China’s outward invest-ment.
ASEAN and China have important relationshipsin services, especially tourism, finance, andtelecommunications. China’s growing prosperitymeans that an increasing number of Chinesetourists are visiting ASEAN countries. Indeed, 2.2million visited ASEAN countries in 2000, particu-larly Malaysia, Singapore, Thailand, and Vietnam.For their part, ASEAN tourists are visiting China inincreasing numbers. One drawback to investmentand the attractiveness of tourist destinations inASEAN members is the discriminatory treatmentof ethnic Chinese minorities in some of thesecountries, especially Indonesia. This problem needsto be overcome and properly managed because ofits sensitive nature.
Proposed ASEAN-China Free Trade Area: The Goals and Means to Achieve Them
In 2001 China and ASEAN agreed to establish theASEAN-China Free Trade Area within 10 years. Thestated motivation behind this initiative is to takeadvantage of complementarities and build on exist-ing strengths, to make the region collectively moreefficient and competitive, and to attract investment.The aim is to use the enhanced efficiency to competein third-country markets, as well as to provide mem-bers with preferential entry to each other’s markets(China being the largest). The experience of theASEAN Free Trade Area and other RTAs that havebeen introduced recently suggests that any kind of
New Regionalism: Options for East Asia 51

ASEAN-China free trade area must go beyond liber-alization of cross-border barriers. The proposal pre-pared by the expert group is in fact comprehensiveand covers trade and investment liberalization ingoods and services, trade and investment facilitation,capacity building and technical assistance, and coop-eration in various areas (ASEAN-China ExpertGroup on Economic Cooperation 2001).
Certainly the agreement promises big economicbenefits. Estimates based on the study by the expertgroup indicate that the ASEAN-China agreementwould augment trade on both sides by 50 percentand increase GDP by 0.9 percent for ASEAN and by3 percent for China. China’s exports to ASEANcountries would be 55 percent greater with theagreement than without it, and ASEAN countries’exports to China would be 48 percent greater.30
For ASEAN, the agreement would provide first-mover advantages in the Chinese market before it isopened on an MFN basis (Box 3.2). As well as pro-vide opportunities for the “Early Harvest,” it ishoped the agreement will address various nontariffbarriers of concern to ASEAN members, such asquotas on palm oil and other agricultural products;China’s complex import procedures (whereby, forexample, only state-owned enterprises are allowed
to import palm oil); and issues of testing, stan-dards, and labeling requirements, investment pro-motion and protection, visa facilitation, and infra-structure development. The agreement may alsoprovide opportunities to build up the capacity ofASEAN’s less developed members.
But the idea is not yet widely accepted byASEAN member countries, and some of them haveindeed expressed concern about their ability tocompete with China and about whether a free tradearea would be mutually beneficial. Thailand andSingapore seem to be the most supportive of theidea, with Indonesia and the Philippines taking amoderate position, Malaysia adopting a carefulstance, and the lower-income economies withinthis group—Cambodia, Lao PDR, Myanmar, andVietnam—expressing the most concern about theirability to compete and mutually benefit from suchan arrangement. China, for its part, has an interestin the reduction of ASEAN tariffs and trade barri-ers on products of special export interest, includingmotorbikes and vehicle components.
As He Fan (2002) suggests, it may be that Chinawants to assuage ASEAN countries’ fear of the“China threat” by opening up its markets to them.Other than the relatively comprehensive economic
52 East Asia Integrates
BOX 3.2 “Early Harvest”
“Early Harvest,” which refers to provisions of theFramework Agreement on China-ASEAN Com-prehensive Economic Cooperation, would liber-alize tariffs in priority sectors of interest andimplement other trade and investment facilita-tion measures that are deemed to generateimmediate benefits to the ASEAN and Chinesebusiness communities. These measures couldinclude:• Development and technical assistance to
build capacity among countries, particularlyfor the new members of ASEAN, in order toimprove their competitiveness
• Trade and investment facilitation measures • Trade policy dialogue • Business sector dialogue• Facilitation of visa arrangements for business-
people• Standards and conformity assessment
• Measures enhancing market access opportu-nities for specific products or services of inter-est to ASEAN and China, such as agriculturaland tropical products, textiles and clothing,machinery and electronic products, footwear,oils and fats, foodstuffs, forestry and aquacul-ture products, and energy (the list of prod-ucts and services will be determined bymutual consultation)
• Extension of MFN treatment of China’s acces-sion commitments to non-WTO members ofASEAN in compliance with WTO rules
• Any other measures delivering immediatemutual benefits.
Source: SEOM-MOFTEC Inputs on ForgingCloser ASEAN-China Economic Relationship,Second SEOM-MOFTEC Meeting, Brunei Darus-salam, October 28, 2001.

integration proposed, such an agreement andcooperation would enhance the sense of commu-nity within the region, reduce tensions, and con-tribute to stability. It may also enhance members’cooperation on the external front. For China andASEAN alike, the process of getting to know eachother is important, and it is hoped that a tradeagreement will provide a basis for developing acooperative stance on external issues of commonconcern such as the global financial architecture. Inthe near term, given that ASEAN’s share of China’strade is still small, the political impact of theASEAN-China free trade area may be more impor-tant than the economic impact.
Progress in implementing the agreement is likelyto be slow, even though it is known that the wider anddeeper the coverage, the greater will be the benefits.The agreement will probably be confined initially toeliminating tariffs on goods. Sensitive sectors such asagriculture will likely be excluded, and progress willbe slow in other areas such as the removal of nontar-iff barriers, liberalization of services, investment, andother New Age RTA issues such as treatment of work-ers, environmental standards, and the movement oflabor. But if the ASEAN-China Free Trade Area is tobe a building block for deeper economic integrationwithin the region, the framers of the RTA would bewell advised to focus not just on the nitty-gritty ofitem-by-item tariff lines and exclusions, but also onways to increase competition and efficiency and realeconomic benefits.31 In this regard, Elek (2000) sug-gests focusing on trade facilitation through, forexample, simplifying customs procedures and har-monizing standards.
To become viable suppliers to the Chinese mar-ket and to compete successfully with China in theirown and export markets, ASEAN member countriesneed to anticipate and prepare for the structuralchanges that will happen in China. Meanwhile, theirown comparative and competitive advantages needto be continually strengthened. Companies inASEAN must focus on specialization and productdifferentiation, including in terms of quality. Eachmember country should devise a comprehensiveprogram to achieve such goals as well as an actionplan that anticipates the institutions, humanresources, and infrastructure needed to support theprogram. (In fact, such a program is likely to be amore helpful response to the China challenge thanis a regional trade arrangement per se.)
Other than restructuring and maintaining theircompetitive edge, individual ASEAN countriesshould continue on the current track of unilateralliberalization and reforms, while exploring regionalcooperation such as that being proposed throughthe ASEAN-China initiative.
Conclusions: The Way Forward
Regional economic cooperation arrangements inEast Asia raise complex issues, and decisionmakersneed to understand and assess the options carefully,especially in view of the limited resources andcapacity of some of the region’s economies.
East Asian economies seek increased economicefficiency and competitiveness rather than eco-nomic integration in the manner of Europe, andthey can pursue these goals through enacting uni-lateral reforms and through ensuring an open,rules-based multilateral trading system.
The role of regional trade arrangements is tofacilitate and build toward this outcome. The wayforward in the first instance is to ensure that unilat-eral reforms are continued, that commitments tothe multilateral process are faithfully met, and thateconomies are preparing themselves to maximizethe benefits from future developments in the multi-lateral trading system.32 In the process of accessionto the WTO, for example, China had to concede onmany sectors and issues. In the forthcoming negoti-ations, China will now be able to press for marketaccess for products and services of importance toits economy, and for discipline and fairness in therules of the game as well.
Progress on involving a large group ofeconomies can be expected to occur through func-tional cooperation in the financial and monetaryarea. The tasks to be carried out seem likely to beconfined to surveillance, technical assistance andcapacity building, information sharing, and limitedswap arrangements. Joint macroeconomic policycoordination or currency union seems unlikely inthe near future.
Given the limited experience with regionalismin East Asia to date, progress on an inclusiveregional trade agreement is likely to be slow. TheASEAN Free Trade Area lacks scope and depth, asnoted earlier, and the ASEAN-China Free TradeArea being negotiated is likely to suffer from thesame problems because it is based on AFTA. But it
New Regionalism: Options for East Asia 53
is possible that ASEAN-China cooperation canextend to forging common positions for interna-tional negotiations, such as in the WTO.
Both in the formal regional arrangements suchas AFTA and in the informal regional processessuch as APEC the goal up to now has been more tostimulate and support unilateral reforms and con-tribute to multilateral liberalization than to achievegreater regional integration or intraregional tradeand investment. In such arrangements in East Asia,it may be that the process of regional cooperation ismore important to the participants than outcomes.If this is so, the agreements should be evaluated notjust on the basis of whether they achieve free tradeand investment, but also according to the processwhereby each country actually makes progress inunilateral reforms.33 And it may be that the infor-mal process needs to be nurtured more systemati-cally so that it will evolve into a more institutionalone. Whether this means creating an East Asian sec-retariat needs further debate and deliberation.
Is ASEAN/AFTA the natural locus for regionalcooperation? Some analysts believe that it is not ina strong position to serve this important rolebecause of weaknesses within ASEAN itself, whichhave resulted partly from lack of leadership andslow progress on new areas of cooperation (Soesas-tro 2001). It has been suggested that to strengthenASEAN the implementation of AFTA must beaccelerated and the ASEAN economies mustrethink their vision of regionalism.
To conclude, broader liberalization on a multilat-eral basis will lead to greater net benefits, but EastAsia is likely to realize net gains if it pursues comple-mentary regional approaches simultaneously withmultilateralism. One further benefit from strongerregional cooperation could be a more effectivestance at the WTO on issues of common interest—for example, in achieving further discipline onantidumping. China would play a critical role in thisregard because of its growing economic dominancein the East Asian region, if not the world, and thusthe type of regional cooperation arrangement inwhich it chooses to participate will have a lastingimpact on the course of events and pace of develop-ment in the region. Economic development inChina can only strengthen the perception of EastAsia as a “good neighborhood” and place to bewithin the global community.
Endnotes
1. ASEAN has 10 members: Brunei, Cambodia, Indonesia,Lao People’s Democratic Republic, Malaysia, Myanmar, thePhilippines, Singapore, Thailand, and Vietnam.
2. All dollar amounts are current U.S. dollars. This GDP ishalf of Japan’s, but if current growth rates are maintained,it will catch up with Japan’s in the next 5–10 years. In pur-chasing power parity (PPP) terms, China’s GDP nowexceeds that of Japan (World Bank 2002).
3. Until a few years ago, apart from the ASEAN Free Trade Area(AFTA), East Asia had no formal regional cooperation agree-ments. A proposal by Malaysian prime minister MahathirMohamad in December 1990 to form an East Asian eco-nomic grouping elicited strong protests from U.S. Secretaryof State James A. Baker III, and support of the proposal fromJapan or China was not forthcoming. There was in general astrong sentiment against institutionalizing regional coopera-tion or regionalism. See also Munakata (2001).
4. The texts of most regional trade agreements (RTAs) can befound on the Web site of the RTA secretariat (e.g., theASEAN Secretariat at www.aseansec.org or the EuropeanUnion Secretariat at europa.eu.int) or of the relevantadministering government department in one or moremember countries (e.g., the Singaporean Ministry of Tradeand Industry at www.mti.gov.sg or the New Zealand Min-istry of Foreign Affairs and Trade at www.mfat.govt.nz).The texts of all agreements in the Americas are available onthe Web site of the Organization of American States(www.sice.oas.org). Useful reviews of developments underparticular RTAs also are available. See, for example, Pelk-mans (1997), Thanadsillapakul (2001), Lloyd (2002),Mahani (2002), and Low (2003). The Asian DevelopmentBank (2002: Part III) reviews RTAs in the Asia-Pacific area,and Estevadeordal (2002) provides an excellent compari-son of some features of RTAs in the Americas. See also theWTO’s World Trade Report (2003: 46–66) on recent devel-opments in the realm of RTAs.
5. Kaminsky and Reinhart (1999) have shown that outputlosses are much more significant when a currency crisis isaccompanied by major financial sector problems.
6. The distinct period for each group of economies is also theperiod in which flows of foreign direct investment, espe-cially intraregional FDI, accelerated into that group.
7. This section provides only an introductory overview of thevarious regional and multilateral trade arrangements inEast Asia, and the following questions may need furtherresearch: How large is intra-ASEAN Free Trade Area(AFTA) trade relative to AFTA’s total trade? How muchintra-AFTA trade is excluded because of “sensitive sectors”?How would these numbers change if China were added?How much variance is there among AFTA and ASEANmembers in how much of their trade is covered? Theanswers to these questions will influence how differentcountries and groups approach others and their approachto liberalizing in other geographic areas.
8. There is evidence that some AFTA members have fallenbehind in their reform schedules. One example is delays inincluding the automotive and petrochemical sectors in theAFTA by Malaysia and the Philippines, respectively.
9. The main reason is that because of China’s WTO accessionthese three have separate customs territories, and so Chinacannot give preferential treatment to Hong Kong or Macaounless they are members of a free trade agreement.
54 East Asia Integrates

10. Eichengreen (2001) finds that unlike in the EU countriesand those under the North American Free Trade Agree-ment (NAFTA), in East Asia monetary and financial coop-eration has tended to precede cooperation in trade.
11. Such as the role of China in the Korean Peninsula situationand Japan’s alleged support for Taiwan.
12. Agreement was also reached at the November 2000 meetingon reviewing the possibility of an East Asian economiczone. The fact that the ASEAN-China economic coopera-tion has forged ahead faster than East Asia-wide coopera-tion (or a similar earlier idea for cooperation betweenJapan and ASEAN) indicates, some would say, the currentlack of vision and strategy shown by Japanese leaders aboutJapan’s leadership in the region (www.Asahi.com, Novem-ber 2001). The main issue in Japan is resistance to openingup its agriculture sector.
13. For details, see Yusuf and others (2003: Chap. 5).14. Henning (2002) and Kuroda and Kawai (2003) provide
details on recent bilateral swap agreements under the CMIand discussions of related issues.
15. Asia’s official reserves account for over half of globalreserves. See “APEC Declining Relevance” (2003).
16. See Kuroda and Kawai (2003). Manupipatpong (2002)reviews the development of regional surveillance and self-help mechanisms through the ASEAN Surveillance Processand the Chiang Mai initiative.
17. Much depends on the assumptions made and the methodsused to measure trade creation and diversion, and whetherthe effects measured are dynamic or static. Some authorsfind a positive net trade creation effect (Salazar-Xirinachs2001), while others argue that in some cases there has beena serious net trade diversion effect, such as in North Amer-ica (Panagariya 2000). The balance between positive andnegative effects also may differ between members and non-members of an RTA. For example, dynamic benefits mightoutweigh positive effects for members, but nonmembersmight still be adversely affected by trade diversion as aresult of their exclusion. Yeats (1998) found net trade diver-sion in the case of MERCOSUR (Mercado Común delSur/Southern Common Market Agreement), where a con-tributing factor seems to have been the high margins ofpreference. However, for some pairings the cost in terms oftrade diversion may be relatively small when trade barriersare already low. The preferential trade agreement routethen looks like a low-risk option.
18. CGE models have the advantage of providing more optionsfor good choices of base scenarios and for capturing moreof the detail of preferential policies. The models are becom-ing increasingly sophisticated and able to incorporate scaleeffects, imperfect competition, and capital accumulation.Panagariya (2000), however, identifies some problems inthe modeling approaches. Appendix C of “The AngkorAgenda” (available from www.aseansec.org/aem/angkor_agenda.pdf) also lists some empirical papers.
19. They use the APG-cubed model (18 countries and 6 sec-tors), which permits the identification of dynamic gainsand allows for allocative efficiency effects, terms of tradechanges, and capital accumulation for goods and for ser-vices, as well as endogenous productivity effects.
20. These gains are nearly three times as great as those foundby an earlier study that excluded services liberalization andthe productivity effect.
21. On the basis of the theory of optimum currency areas, thebenefits emanate mainly from the greater economic inte-
gration, reduced transaction costs, and higher levels oftrade and investment that may result from exchange ratestability within ASEAN. The costs come from the loss ofmonetary autonomy involved, which limits the macroeco-nomic policy options available to deal with unexpectedmacroeconomic shocks (Bayoumi and Mauro (2001). Seealso Lloyd (2002).
22. There is some evidence that this has worked effectively insome cases in the Western Hemisphere, but in other casesunilateral reforms have been delayed as economies heldback moves to open up until they entered into RTA andWTO negotiations.
23. Freund uses the same segmented oligopolistic marketmodel as Andriamananjara (1999), but now governmentsmaximize welfare—that is, the sum of producer and con-sumer surplus, plus tariff revenue. The outcome of unilat-eral policymaking is that each government sets the optimaltariffs on imports from other economies, taking thoseeconomies’ tariffs as given. In this setting, when bilateralagreements are possible, each country wants to sign anagreement with every other country.
24. Suppose there are three countries: A, B, and C. Country Aconcludes separate agreements with B and C, but B and Cdo not have an agreement with each other. Country A is thehub, and B and C are the spokes. Lloyd and Crosby (2002),using this example, point out that the entity at the hubcould itself be a regional trading agreement.
25. James, Ray, and Minor (2002). Before its WTO accession,China was not eligible to take advantage of growth in theU.S. quotas.
26. For example, from 1996 to 2001 China’s share of Japan’smarket for cotton knit apparel increased from 47.3 to 77.3percent, and for manmade fiber knit apparel it increasedfrom 59.1 percent to 80.4 percent. Japan does not imposebilateral quotas, and thus its market reflects more opencompetition.
27. China’s domestic market is the largest of these, but recenttrends show Korea, Thailand, and other economies grow-ing on the strength of domestic consumption demand.
28. Vietnam, Lao PDR, and Cambodia are not yet WTO Mem-bers.
29. This acquisition, for $584 million, is the biggest foreignacquisition of Indonesian oil and gas assets in the lastdecade (Far East Economic Review, March 28, 2002).
30. He Fan (2002: 14), quoting Zhou Keren, the Chinese viceminister of foreign trade and economic cooperation.
31. According to Chirathivat (2002), the ASEAN-China FTAhas “contributed to the rethinking of East Asia, not for onlya geographical concept, but more strongly as an institu-tional arrangement.” However, both ASEAN and Chinaremain highly dependent on outside markets “rather than aself-fulfilling grouping among themselves” to further stim-ulate their economic growth.
32. For both the Maastricht Treaty and North American FreeTrade Agreement (NAFTA), crucial unilateral domesticdecisions that reflected the pressures of rising opennesspreceded the negotiations. For the Maastricht Treaty,French and Italian financial market liberalization was aprerequisite, and for NAFTA, Mexican trade liberalizationwas a necessary precondition (Milner 1998).
33. For example, APEC had the purported role of helping tobreak the deadlock in the Uruguay Round negotiations in1993.
New Regionalism: Options for East Asia 55
References
The word processed describes informally reproduced works thatmay not be commonly available through libraries.
Anderson, Kym, and Richard Snape. 1994. “European andAmerican Regionalism: Effects on and Options for Asia.”Journal of the Japanese and the International Economies 8 (4):454–77.
Andriamananjara, Soamiely. 1999 “On the Size and Number ofRegional Integration Arrangements: A Political EconomyModel.” Policy Research Working Paper 2117. World Bank,Washington, D.C.
“APEC Declining Relevance.” 2003. Oxford Analytica Brief. June18.
ASEAN (Association of Southeast Asian Nations)-China ExpertGroup on Economic Cooperation. 2001. Forging CloserASEAN-China Economic Relations in the 21st Century.Report submitted to the ASEAN SEOM-MOFTEC, October.
Asian Development Bank. 2002. “Preferential Trade Agreementsin Asia and the Pacific.” Asian Development Outlook. Avail-able at www.adb.org/Documents/Books/ADO/2002/pta0000.asp.
Baldwin. R. 1997. “The Causes of Regionalism.” World Economy20 (7).
Bayoumi, Tamim, and Paolo Mauro. 2001. “The Suitability ofASEAN for a Regional Currency Arrangement.” World Econ-omy 24 (7): 933–54.
Chia Siow Yue. 2002. “East Asian Regionalism.” Paper presentedat East Asian Cooperation: Progress and Future Agenda,Institute of Asia-Pacific Studies (Chinese Academy of SocialSciences, CASS) and Research Center for APEC and EastAsian Cooperation (CASS), Beijing, August 22–23.
Chirathivat, Suthiphand. 2002. “ASEAN-China Free Trade Area:Background, Implications and Future Development.” Jour-nal of Asian Economics 13: 671–86.
Clarete, Ramon, Christopher Edmonds, and Jessica Seddon Wal-lack. 2003. “Asian Regionalism and Its Effects on Trade in the1980s and 1990s.” Journal of Asian Economics 14: 91–129.
Crawford, Jo-Ann, and Sam Laird. 2000. “Regional Trade Agree-ments and the WTO.” Paper prepared for meeting of NorthAmerican Economic and Finance Association, Boston, Janu-ary 6–9.
Davis, Lee, Warwick McKibbin, and Andrew Stoeckel. 2000.“Economic Benefits from an AFTA-CER Free Trade Area:Year 2000 Study.” Centre for International Economics, Can-berra and Sydney, June.
Eichengreen, Barry. 2001.“Hanging Together? On Monetary andFinancial Cooperation in Asia.” University of California,Berkeley. Processed.
Elek, Andrew. 2000. “Sub-Regional Trading Arrangementsamong APEC Economies: Managing Diversity in the AsiaPacific.” Pacific Economic Papers No. 309. Australia-JapanResearch Centre, Australian National University, November.
Estevadeordal, A. 2002. “Traditional Market Access Issues inRTAs: An Unfinished Agenda in the Americas?” Paper pre-sented at WTO Seminar on Regionalism and the WTO,Geneva, April 26.
Findlay, Christopher. 2001. “Old Issues in New Regionalism.”Pacific Economic Papers 311. Australia-Japan Research Cen-tre, Australian National University, January.
Frankel, J. 1997. “Regional Trading Blocs in the World EconomicSystem.” Institute for International Economics, Washington,D.C.
Freund, Caroline. 2000. “Spaghetti Regionalism.” InternationalFinance Discussion Paper No. 680. Federal Reserve Board,September. Available at www.federalreserve.gov/pubs/ifdp/.
Gandal, N., and O. Shy. 2001. “Standardization Policy and Inter-national Trade.” Journal of International Economics 53:363–83.
He Fan. 2002. “Regional Economic Cooperation: China’s Per-spective.” Background Paper for EAS Country Unit. WorldBank, Washington, D.C., June.
Henning, Randall C. 2002. “East Asian Financial Cooperation.”Policy Analyses in International Economics 68 (September).Institute for International Economics, Washington, D.C.
James, William E., David J. Ray, and Peter J. Minor. 2002.“Indonesia’s Textile and Apparel Industry: Meeting the Chal-lenges of the Changing International Trading Environment.”Report for Ministry of Industry and Trade, Republic ofIndonesia, USAID/ECG, Jakarta, July.
Kaminsky, Graciela, and Carmen Reinhart. 1999. “The TwinCrises: The Causes of Banking and Balance of PaymentsProblems.” American Economic Review 89 (3): 473–500.
Krueger, Anne O. 1995. “Free Trade Agreements versus CustomsUnions.” NBER Working Paper No. 5084. National Bureau ofEconomic Research, Cambridge, Mass., April.
Kuroda, Haruhiko, and Masahiro Kawai. 2003. “StrengtheningRegional Financial Cooperation in East Asia.” Pacific Eco-nomic Papers. Australia-Japan Research Centre, AustralianNational University, Canberra, May.
Lloyd, Peter. 2002. “New Bilateralism in East Asia.” World Econ-omy 25 (9): 1279–96.
Lloyd, Peter, and Mark Crosby. 2002. “China’s Options forRegional Integration and Cooperation: Conceptual andTheoretical Framework.” Background Paper for EAS Coun-try Unit. World Bank, Washington, D.C., June.
Low, Linda. 2003. Multilateralism, Regionalism, Bilateral andCrossregional Free Trade Arrangements: All Paved withGood Intentions for ASEAN. Asian Economic Journal 17 (1):65–86.
Mahani, Zainal-Abidin. 2002. “ASEAN Integration: At Risk ofGoing in Different Directions.” World Economy 25 (9):1263–77.
Manupipatpong, Worapot. 2002. “The ASEAN SurveillanceProcess and the East Asian Monetary Fund.” ASEAN Eco-nomic Bulletin 19 (1): 111–22.
McKinnon, Ronald. 2001. “After the Crisis, the East Asian DollarStandard Resurrected.” In Joseph Stiglitz and Shahid Yusuf,eds. Rethinking the East Asian Miracle. Washington, D.C.:World Bank and Oxford University Press.
Milner, Helen. 1998. “Regional Economic Cooperation, GlobalMarkets and Domestic Politics: A Comparison of NAFTAand the Maastricht Treaty.” In William D. Coleman andGeoffrey Underhill, eds., Regional and Global Economic Inte-gration: Europe, Asia and the Americas. London and NewYork: Routledge Publications.
Munakata, Naoko. 2001. “Focus on the Benefits—Not Threats—of Regional Economic Integration.” PacNet Newsletter,November 16. Centre for Strategic and International Stud-ies, Washington, D.C.
Mundell, Robert. 2003. “Prospects for an Asian Currency Area.”Journal of Asian Economics 14: 1–10.
Panagariya, Arvind. 2000.“Preferential Trade Liberalization: TheTraditional Theory and New Developments.” Journal of Eco-nomic Literature 38 (June): 287–331.
Pelkmans, J. 1997. European Integration: Methods and EconomicAnalysis. New York: Longman.
56 East Asia Integrates

Salazar-Xirinachs, José M. 2001. “Implications of ProliferatingSub-Regional Trade Agreements: Lessons from the LatinAmerican Experience.” Pacific Economic CooperationCouncil (PECC), Trade Policy Forum, Seminar on RegionalTrade Agreements, Bangkok, June12–13.
Snape, Richard. 1996a. “Trade Discrimination—Yesterday’sProblem?” Economic Record 72 (December): 381–96.
————-. 1996b. “Which Regional Trade Agreement?” In BijitBora and Christopher Findlay, eds. Regional Integration andthe Asia Pacific. Melbourne: Oxford University Press.
Snape, Richard, Jan Adams, and D. Morgan. 1993. Regional TradeAgreements: Implications and Options for Australia. Reportfor the Australian Department of Foreign Affairs and Trade,AGPS, Canberra.
Soesastro, Hadi. 2001. “Whither ASEAN Plus Three?” Paper pre-sented to Pacific Economic Cooperation Council (PECC)Trade Policy Forum, Seminar on Regional Trading Arrange-ments, Bangkok, June 12–13.
Soloaga, I., and A. Winters. 1999. “Regionalism in the 1990s:What Effect on Trade?” Discussion Paper No. 2183. Centrefor Economic Policy Research (CEPR), London.
Srinivasan, T. N., John Whalley, and Ian Wooton. 1993.“Measur-ing the Effects of Regionalism on Trade and Welfare.” InKym Anderson and Richard Blackhurst, eds. Regional Inte-gration and the Global Trading System. London: HarvesterWheatsheaf for the GATT Secretariat.
Thanadsillapakul, L. 2001. “Open Regionalism and Deeper Inte-gration: The Implementation of ASEAN Investment Areaand ASEAN Free Trade Area.” Processed.
Wonnacott, Ronald. 1996. “Trade and Investment in a Hub-and-Spoke System versus a Free Trade Area.” World Economy 19(3): 237–52.
World Bank. 2002. World Development Indicators 2002. Wash-ington, D.C.: World Bank.
WTO (World Trade Organization). 2000a. “Synopsis of ‘Sys-temic’ Issues Related to Regional Trade Agreements.”WT/REG/W/37. Note by the Secretariat, March 2.
———. 2000b. “Committee on Regional Trade Agreements,Mapping of Regional Trade Agreements.” WT/REG/W/41.Note by the Secretariat, October 11.
———. 2002. “Regional Trade Integration under Transforma-tion.” Paper prepared for the World Trade Organization’sseminar Regionalism and the WTO, Geneva, April 26.
———. 2003. World Trade Report. Geneva, August.Xu, X., and L. Song. 2000. “Export Similarity and the Pattern of
East Asian Development.” In P. Lloyd and X, Zhang, eds.,China in the Global Economy. Cheltenham, UK: Edward Elgar.
Yeats, Alexander. 1998. “Does Mercosur’s Trade PerformanceRaise Concerns about the Effects of Regional Trade Agree-ments?” World Bank Economic Review 12 (1):1–28.
Yusuf, Shahid, M. Anjum Altaf, and Kaoru Nabeshima, eds.2003. Global Production Networking and TechnologicalChange in East Asia. Washington, D.C.: World Bank andOxford University Press.
Yusuf, Shahid, with M. Anjum Altaf, Barry Eichengreen, Sudar-shan Gooptu, Kaoru Nabeshima, Charles Kenny, Dwight H.Perkins, and Marc Shotten. 2003. Innovative East Asia: TheFuture of Growth. Washington, D.C: World Bank and OxfordUniversity Press.
New Regionalism: Options for East Asia 57


A central element of any poverty alleviation strat-egy is to improve market access for exports inwhich the poor have a comparative advantage. Thischapter analyzes market access barriers to agricul-tural exports produced by the poor in East Asia.The effects of trade liberalization on the poor arethe subject of intense debate,1 but there is generalsupport for freeing market access for products ofexport interest to the poor. The discussion takes asa starting point the premise that increased exportsof products of interest to the poor will help toreduce poverty.2
This first section of this chapter identifies thekey export products and major markets of EastAsian exporters likely to be of interest to the poor,with a focus on agricultural and agroprocessingproducts. The next section analyzes market accessbarriers for those products. A concluding sectionsuggests priorities.
Identifying and removing barriers to interna-tional trade are, however, only part of the process ofalleviating poverty. Policymakers need to consider
59
4
Market Access Barriersand Poverty in
Developing East Asia Bijit Bora
with additional material by Paul Brenton and Takako Ikezuki
market access barriers in conjunction with issuessuch as downstream integration and coordinationbetween producers and retailers.3 The value chainbetween the production of commodities by thepoor and the final product that reaches the marketsof developed and developing countries is central toimproving market access for products of the poor(see Chapter 9 in this volume for approaches tosuch improvements).
Products and Markets of ExportInterest to the Poor
Reducing the trade barriers in agriculture is partic-ularly important for reducing poverty in East Asia.4
Although agriculture is no longer a major source ofexports and income for many economies of EastAsia,5 it is the main livelihood for poor householdsin both low-income and middle-income countriesin the region. According to statistics compiled bythe World Bank, agriculture represents the mainsource of income for over 90 percent of poor
The views in this paper are expressed in a personal capacity and should not in any way be associated with the WorldTrade Organization, World Bank, or their member states. I am grateful to Zheng Wang for her excellent research assis-tance and to Aki Kuwahara, Daniel Morales, and Jurgen Richtering for extracting and processing the tariff data. Thepaper also benefited from comments from Florian Alburo and other participants in the seminar held at the Institute forSoutheast Asian Studies, Singapore.

households in Cambodia and Vietnam, and overtwo-thirds of poor households in Indonesia, thePhilippines, and Thailand.6
Determining the exposure of the poor to inter-national markets is a first step in identifying prod-ucts of export interest to the poor. Research using aframework developed by Winters shows that theirexposure is largely indirect (see McCulloch, Win-ters, and Cirera 2001). Poor households tend toproduce primary products such as fruits and veg-etables, fish and fish products, and commoditiessuch as jute and coffee. Those in these householdsalso work for wages in low-skill jobs such as in tex-tiles, clothing, footwear, and travel goods. In each ofthese cases, output is sold to wholesalers, who thenmake international transactions. This chapterfocuses on agricultural and agroprocessed exports.
Analytical modeling suggests that the gains fromagricultural liberalization are reasonably large, asshown in Figure 4.1. This figure reveals that theEast Asia region stands to benefit substantially fromagricultural liberalization in high-income coun-tries, and perhaps three times as much from agri-cultural liberalization in low- and middle-incomecountries. Full global agricultural liberalizationwould bring benefits to East Asia of almost US$300billion,7 an amount comparable to the gains fromfurther liberalization in manufactured goods. Someof the gains would come from a better allocation ofresources associated with agricultural liberalization
and from improved market access. But the majorityof the gains, about three-quarters, would comefrom productivity improvements as farmers gainunrestricted access to export markets and specializein higher value added crops. China would be one ofthe main beneficiaries, and, indeed, China hastaken a position of unilaterally opening its marketsfor agriculture, thereby obtaining some of thepotential benefits for itself. But as shown in Chap-ter 1, China is likely to become a major importer ofoilseeds, sugar, beverages, tobacco, plant fibers, andother food products in which regional East Asianeconomies have strong comparative advantage.Thus some of the gains from agricultural liberaliza-tion can be generated through regional arrange-ments, even if global negotiations do not make sig-nificant progress.
Agricultural and Agroprocessed Exports
Within the East Asia region, there is significantdiversity of products through which the poor areexposed to international markets. Using anapproach described in the technical appendix tothis chapter,8 we examined the structure of exports,which suggests some important priorities despitethis diversity.
The agricultural exports of the East Asian devel-oping countries are quite concentrated.9 The topfour products account for between 30 percent and
60 East Asia Integrates
Real income gains from agricultureliberalization: high-income country
liberalization
(1997 $US billions, compared with baseline income in 2015)
(1997 $US billions, compared with baseline income in 2015)
Simulations with endogeneous productivity
East Asia andPacific
China Other East Asia East Asia andPacific
China Other East Asia
Simulations with fixed productivitySimulations with endogeneous productivitySimulations with fixed productivity
0
5
10
15
2076 64
0
20
40
60
80213 148
Real income gains from agricultureliberalization: low- and middle-income
country liberalization
FIGURE 4.1 Real Income Gains in Developing East Asia from Agricultural Liberalization
Source: World Bank (2002: Table 6.1).
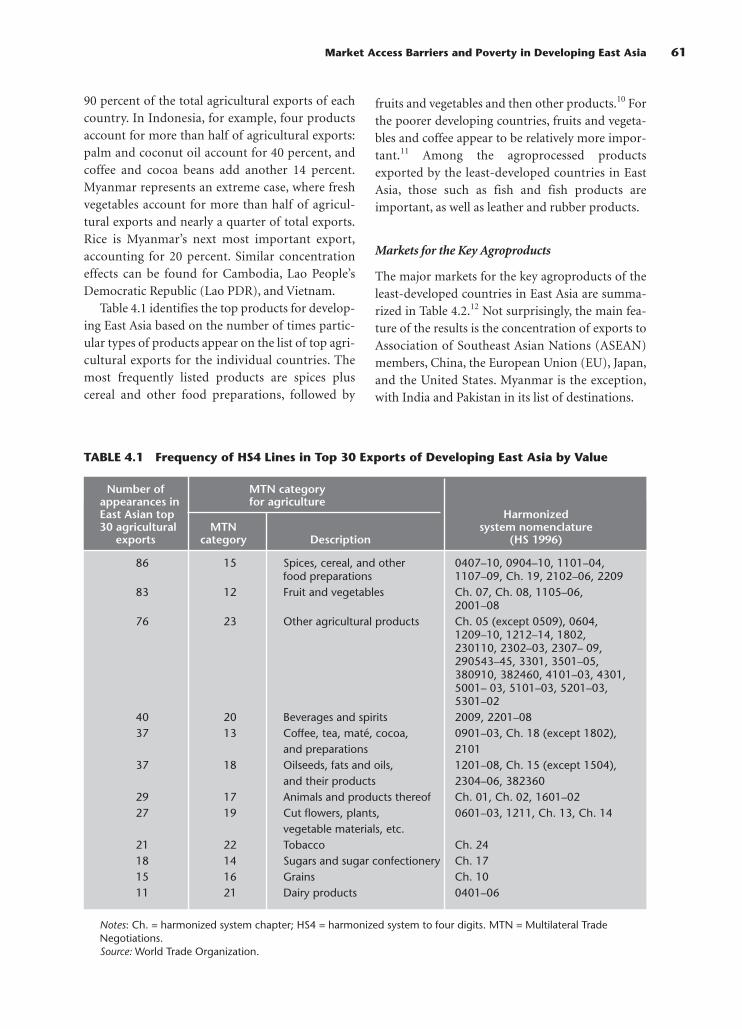
90 percent of the total agricultural exports of eachcountry. In Indonesia, for example, four productsaccount for more than half of agricultural exports:palm and coconut oil account for 40 percent, andcoffee and cocoa beans add another 14 percent.Myanmar represents an extreme case, where freshvegetables account for more than half of agricul-tural exports and nearly a quarter of total exports.Rice is Myanmar’s next most important export,accounting for 20 percent. Similar concentrationeffects can be found for Cambodia, Lao People’sDemocratic Republic (Lao PDR), and Vietnam.
Table 4.1 identifies the top products for develop-ing East Asia based on the number of times partic-ular types of products appear on the list of top agri-cultural exports for the individual countries. Themost frequently listed products are spices pluscereal and other food preparations, followed by
fruits and vegetables and then other products.10 Forthe poorer developing countries, fruits and vegeta-bles and coffee appear to be relatively more impor-tant.11 Among the agroprocessed productsexported by the least-developed countries in EastAsia, those such as fish and fish products areimportant, as well as leather and rubber products.
Markets for the Key Agroproducts
The major markets for the key agroproducts of theleast-developed countries in East Asia are summa-rized in Table 4.2.12 Not surprisingly, the main fea-ture of the results is the concentration of exports toAssociation of Southeast Asian Nations (ASEAN)members, China, the European Union (EU), Japan,and the United States. Myanmar is the exception,with India and Pakistan in its list of destinations.
Market Access Barriers and Poverty in Developing East Asia 61
TABLE 4.1 Frequency of HS4 Lines in Top 30 Exports of Developing East Asia by Value
Number of MTN category appearances in for agricultureEast Asian top Harmonized 30 agricultural MTN system nomenclature
exports category Description (HS 1996)
86 15 Spices, cereal, and other 0407–10, 0904–10, 1101–04, food preparations 1107–09, Ch. 19, 2102–06, 2209
83 12 Fruit and vegetables Ch. 07, Ch. 08, 1105–06, 2001–08
76 23 Other agricultural products Ch. 05 (except 0509), 0604, 1209–10, 1212–14, 1802, 230110, 2302–03, 2307– 09, 290543–45, 3301, 3501–05, 380910, 382460, 4101–03, 4301, 5001– 03, 5101–03, 5201–03, 5301–02
40 20 Beverages and spirits 2009, 2201–0837 13 Coffee, tea, maté, cocoa, 0901–03, Ch. 18 (except 1802),
and preparations 210137 18 Oilseeds, fats and oils, 1201–08, Ch. 15 (except 1504),
and their products 2304–06, 38236029 17 Animals and products thereof Ch. 01, Ch. 02, 1601–0227 19 Cut flowers, plants, 0601–03, 1211, Ch. 13, Ch. 14
vegetable materials, etc.21 22 Tobacco Ch. 2418 14 Sugars and sugar confectionery Ch. 1715 16 Grains Ch. 1011 21 Dairy products 0401–06
Notes: Ch. = harmonized system chapter; HS4 = harmonized system to four digits. MTN = Multilateral TradeNegotiations. Source: World Trade Organization.
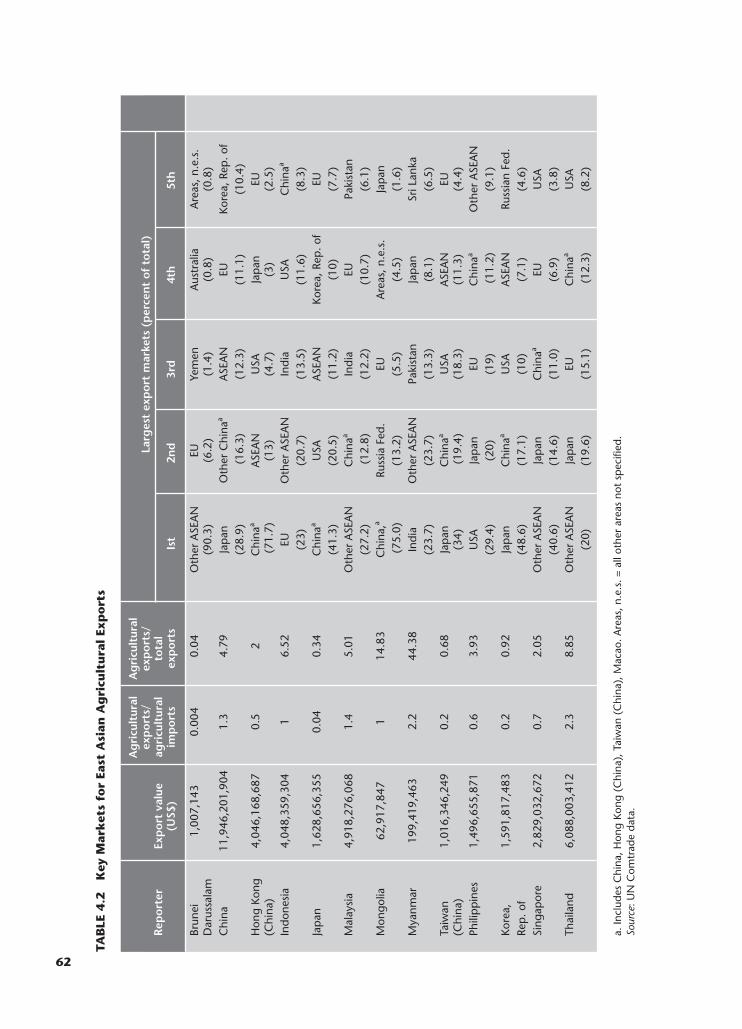
TAB
LE4.2
Key
Mar
ket
s fo
r Ea
st A
sian
Ag
ricu
ltu
ral
Exp
ort
s
Ag
ricu
ltur
alA
gri
cult
ural
ex
po
rts/
ex
po
rts/
La
rges
t ex
po
rt m
arke
ts (
per
cen
t o
f to
tal)
Rep
ort
erEx
po
rt v
alue
agri
cult
ural
to
tal
(US$
)im
po
rts
exp
ort
sIs
t2n
d3r
d4t
h5t
h
Brun
ei
1,00
7,14
30.
004
0.04
Oth
er A
SEA
NEU
Yem
enA
ustr
alia
Are
as, n
.e.s
.D
arus
sala
m(9
0.3)
(6.2
)(1
.4)
(0.8
)(0
.8)
Chi
na11
,946
,201
,904
1.3
4.79
Jap
anO
ther
Chi
naa
ASE
AN
EUKo
rea,
Rep
. of
(28.
9)(1
6.3)
(12.
3)(1
1.1)
(10.
4)H
ong
Kong
4,
046,
168,
687
0.5
2C
hina
aA
SEA
NU
SAJa
pan
EU(C
hina
)(7
1.7)
(13)
(4.7
)(3
)(2
.5)
Indo
nesi
a4,
048,
359,
304
16.
52EU
Oth
er A
SEA
NIn
dia
USA
Chi
naa
(23)
(20.
7)(1
3.5)
(11.
6)(8
.3)
Jap
an1,
628,
656,
355
0.04
0.34
Chi
naa
USA
ASE
AN
Kore
a, R
ep. o
fEU
(41.
3)(2
0.5)
(11.
2)(1
0)(7
.7)
Mal
aysi
a4,
918,
276,
068
1.4
5.01
Oth
er A
SEA
NC
hina
aIn
dia
EUPa
kist
an(2
7.2)
(12.
8)(1
2.2)
(10.
7)(6
.1)
Mon
golia
62,9
17,8
471
14.8
3C
hina
,aRu
ssia
Fed
.EU
Are
as, n
.e.s
.Ja
pan
(75.
0)(1
3.2)
(5.5
)(4
.5)
(1.6
)M
yanm
ar19
9,41
9,46
32.
244
.38
Indi
aO
ther
ASE
AN
Paki
stan
Jap
anSr
i Lan
ka(2
3.7)
(23.
7)(1
3.3)
(8.1
)(6
.5)
Taiw
an
1,01
6,34
6,24
90.
20.
68Ja
pan
Chi
naa
USA
ASE
AN
EU(C
hina
)(3
4)(1
9.4)
(18.
3)(1
1.3)
(4.4
)Ph
ilip
pin
es1,
496,
655,
871
0.6
3.93
USA
Jap
anEU
Chi
naa
Oth
er A
SEA
N(2
9.4)
(20)
(19)
(11.
2)(9
.1)
Kore
a,
1,59
1,81
7,48
30.
20.
92Ja
pan
Chi
naa
USA
ASE
AN
Russ
ian
Fed.
Rep
. of
(48.
6)
(17.
1)(1
0)(7
.1)
(4.6
)Si
ngap
ore
2,82
9,03
2,67
20.
72.
05O
ther
ASE
AN
Jap
anC
hina
aEU
USA
(40.
6)(1
4.6)
(11.
0)(6
.9)
(3.8
)Th
aila
nd6,
088,
003,
412
2.3
8.85
Oth
er A
SEA
NJa
pan
EUC
hina
aU
SA(2
0)(1
9.6)
(15.
1)(1
2.3)
(8.2
)
a. In
clud
es C
hina
, Hon
g Ko
ng (
Chi
na),
Tai
wan
(C
hina
), M
acao
. Are
as, n
.e.s
. = a
ll ot
her
area
s no
t sp
ecifi
ed.
Sour
ce: U
N C
omtr
ade
data
.
62

Regional agricultural markets are large. Notably,China (with Hong Kong and Taiwan) is the first orsecond largest market for all economies with theexception of Brunei, Singapore (where China isthird largest), Indonesia (fifth largest), and thePhilippines (fourth largest). ASEAN is also a largeand important market, with the rest of ASEANbeing the first or second largest market for all theASEAN economies. For the northern Asianeconomies of Japan, Republic of Korea, and China,ASEAN is the third or fourth largest market. Thisimplies that many of the mutual gains from agri-cultural liberalization depend on the policies ofcountries in the East Asia region.
There also is a clear distinction between marketsin which preferential access through the ASEANFree Trade Agreement (AFTA) is important, andthose in which most-favored-nation (MFN) ratesapply. Some countries have nonreciprocal prefer-ences through the Generalized System of Prefer-ences (GSP). Cambodia, as a least-developed coun-try, is eligible for a specific set of preferences.
Market Access Barriers
This section examines the implications of some ofthe market access policies of importing countries insectors of central interest to East Asian developingcountries. In agriculture, governments use a varietyof policies beyond tariffs that not only protect theirmarkets but also distort them so that efficient pro-ducers are not the main suppliers of products(ABARE 2000).
Domestic Support
Hoekman, Ng, and Olarreaga (2002) make animportant point that guides the analysis here.Comparing the impact of a 50 percent cut indomestic support by an importing, not exporting,country with a 50 percent cut in tariffs, they findthat developing countries as a group would receivea larger benefit from the cut in tariffs.13 For onething, domestic support payments are concentratedin few products in which developing countriesdirectly compete, and tariff cuts have a more directeffect on world market prices than do cuts indomestic support programs. This section thereforefocuses on the different types of border measuresand the identification of relevant nontariff mea-
sures where possible. This is not to suggest thatsupport payments in importing countries areunimportant to developing country exporters, butrather that these payments should be considered inrelation to the export potential of specific coun-tries. According to Hoekman, Ng, and Olarreaga(2002), domestic subsidy payments are concen-trated in a few sectors such as meat, dairy products,and cereals (Table 4.3).
Most products important to the poor of EastAsia, such as fruits, vegetables, and spices, togetheraccount for only 7 percent of domestic supportpayments. The major exception is rice. Within cere-als, rice accounts for nearly half of all direct sup-port commitments, totaling $46 billion driven bythe $36 billion attributable to Japan (see Box 4.1).Because of the dominance of East Asia in rice pro-duction and trade, many of the mutual gains fromagricultural liberalization depend on the policies ofcountries in the East Asia region. Coordinatedregional action could contribute to an increase inthe share of rice traded and thereby to an increasein the reliability and stability of rice markets, whichhave been at the core of concerns of East Asian pol-icymakers.
Tariff Barriers
Because several different types of measures areknown collectively as tariffs, it is useful to clarifythe measures analyzed here. First, bound andapplied MFN tariffs differ. Bound tariff rates, whichare negotiated in the World Trade Organization(WTO), are the ceilings that apply to tariffs.Applied tariffs are the actual duties applied at cus-toms on an MFN basis.14 They can be raised in amanner consistent with a country’s WTO obliga-tions so long as the increase is not above the boundrate. This chapter looks at the applied rates. Second,it is important to identify the prevalence of specifictariffs as well as ad valorem duties. Data presentedin this section show the prevalence of specific tariffson the exports of developing Asian countries.
Table 4.4 provides an overview of the simpleaverage of tariff rates applied on products of interestto the poor in East Asian countries.15 These figureshave been calculated using only ad valorem lines.Many countries do not report ad valorem equiva-lents for specific tariffs or tariff-quota schemes, sothese figures may largely reflect the barriers posed
Market Access Barriers and Poverty in Developing East Asia 63

by ad valorem tariffs only.16 The table does showreasonably high numbers in the key agricultural cat-egories (categories 12–23)—in particular, fruits andvegetables (category 12); coffee, tea, and cocoa (cat-egory 13); and cut flowers (category 19). Averagetariffs are also high on agroprocessing products oftraditional export interest to the poor: leather, rub-ber, footwear, and travel goods (category 3) and fishand fish products (category 11).17 The data here arebased on MFN trade barriers and do not take intoaccount the preferences that East Asian countriesare granted in these markets.
This table confirms two general points about thelandscape of protection. First, developing countriesin general impose considerably higher overall aver-
age tariff rates than developed countries. Second,industrial countries apply above-average tariffs onagricultural products of particular interest to devel-oping countries. These products tend to face tariffsthat are double the average rates in the UnitedStates, Japan, and the EU.
Specific tariffs are quite prevalent. Table 4.5summarizes the structure of the trade policies ofthe EU, Japan, and United States affecting marketaccess for East Asia as a whole.18 The data here arebased on MFN trade barriers and do not take intoaccount the preferences that East Asian countriesare granted in these markets. Yet they suggest that,for individual countries, specific tariffs can affect avery large proportion of agricultural exports,
64 East Asia Integrates
TABLE 4.3 Commitments and Average Direct Domestic Support Levels, 1995–98
Direct support As % (millions of US$) of total
HS2 Product Commitment 1995–98 Commitment 1995–98
01 Live animals 250 63 0.1 0.102 Meat and edible meat offal 60,155 14,907 22.3 18.504 Dairy products; birds’ eggs; honey 39,372 11,557 14.6 14.306 Live trees and other plants; bulbs, cut flowers 0 14 0.0 0.007 Edible vegetables and roots and tubers 10,326 3,975 3.8 4.908 Edible fruit and nuts; melons 7,879 3,474 2.9 4.309 Coffee, tea, maté, and spices 1272 50 0.5 0.110 Cereals 104,109 27,953 38.5 34.611 Milled products; malt; starches 421 142 0.2 0.212 Oilseed, oleaginous fruits 8,577 447 3.2 0.613 Lac; gums, resins, other vegetables 0 0 0.0 0.015 Animal/vegetable fats and oils and products 1,899 1,050 0.7 1.317 Sugars and sugar confectionery 12,370 5,304 4.6 6.618 Cocoa and cocoa preparations 16 0 0.0 0.020 Prep. of vegetable, fruit, nuts products 892 529 0.3 0.721 Miscellaneous edible preparations 0 0 0.0 0.022 Beverages, spirits, and vinegar 4,306 1,172 1.6 1.523 Residues and waste from food industry 382 192 0.1 0.224 Tobacco and manufactured tobacco products 2,662 735 1.0 0.950 Silk 416 14 0.2 0.051 Wool, fine/coarse animal hair nest 124 17 0.0 0.052 Cotton 3,411 655 1.3 0.853 Other vegetable textile fibers and yarns 34 71 0.0 0.198 Nonproduct-specific 11,276 8,392 4.2 10.4
Total agricultural products above 270,151 80,714 100.0 100.0
Notes: Direct domestic support is defined as the sum of World Trade Organization DS4 to DS9 categories. HS2 =harmonized system to two digits.Source: Hoekman, Ng, and Olarreaga (2002). Based on WTO Secretariat (2000).

notably to the EU and the United States. These tar-iffs contribute to a lack of transparency about themagnitude of the overall extent of protection.
In agriculture, more than 94 percent of EastAsian countries’ exports to Japan are subject toduties at the border (ad valorem or a specific tariff).Almost three-quarters of their agricultural exportsto the EU and just over 46 percent of those to theUnited States are subject to duties. Specific tariffsare prevalent in the United States, affecting morethan one-quarter of all East Asian exports of agri-cultural goods and more than half of the East Asianagricultural exports that are subject to duties. In theEU, specific tariffs affect about one-quarter of totalagricultural exports from East Asia and more thanone-third of those that are subject to MFN duties.For example, almost two-thirds of Thailand’s agri-cultural exports to the EU are subject to specificduties, and 45 percent of total agricultural exportsfrom the Philippines to the United States are subjectto specific duties. Within the East Asia region, how-ever, specific duties are very rarely used as a meansof trade protection.19 Specific duties are less com-
mon in Japan, affecting only about 10 percent ofagricultural exports from East Asia.
The incidence of specific duties likely falls partic-ularly heavily on the least-developed countriesexporting relatively low-value products, where thecomputed ad valorem equivalents of specific dutiesare subsequently often high.20 The reason is that themethodology for conversion depends on the perunit value. In many cases, the per unit value ofproducts from the poor is lower than those fromhigher-income producers, resulting in a high ad val-orem rate. Thus paradoxically, low-quality goods,and cheap goods from low-income countries, aresubjected to higher rates of border taxation for theirexports to Europe and the United States.
Tariff Escalation
High tariffs are only part of the market access pic-ture for developing countries. Tariff escalation,whereby tariffs imposed on processed products arerelatively higher than those on raw materials,reduces the incentive for producer countries to
Market Access Barriers and Poverty in Developing East Asia 65
BOX 4.1 Global Trade in Rice
Over 90 percent of rice production and con-sumption occurs in Asia. Much of Asian rice issubject to monsoon climates, resulting inuncertain rice yields and rice supplies. Only 6.8percent of global rice production is traded, asmaller share than other major grains andoilseeds. The price variability of rice is also thelargest of all food crops, with a coefficient ofvariation of 47 compared with 34–35 for wheatand maize. However, its price variability ismuch less than that of other commodities suchas sugar and oil with a coefficient of variationover 70.
The major types of distortion in world ricemarkets are import tariffs and tariff-rate quotas(TRQs) in key importing countries and price sup-ports in key exporting countries. In 2000 theglobal trade weighted tariff on all rice was 43.3percent. Global trade weighted average rice tar-iffs for japonica rice markets were much higherthan those on indica rice—217 percent com-pared with 21 percent—because of the TRQ andquotas in the major japonica rice–importingeconomies of Japan, the Republic of Korea, and
Taiwan (China). Protection in other countries ofEast Asia is more moderate. The greatest degreeof protection is in medium and short grain rice,and thus very few rice-exporting countries pro-duce this type. Most global rice trade is in longgrain rice, which is characterized by tariff escala-tion, notably in the European Union and Centraland South America. This pattern of protectiondepresses world prices for high-quality, milledlong grain rice and discriminates against themilling sectors of exporting nations such as Thai-land and Vietnam.
Protectionist policies have contributed to thethinner global markets by encouraging greaterreliance on domestic production for domesticconsumption. At the same time, the variability inglobal markets has been a motivation for heavierprotection. If collective action were taken in EastAsia to address transition and vulnerability con-cerns, it is estimated that trade liberalizationwould result in a 73 percent increase in globaltrade of short and medium grain rice, which inturn would contribute to the stability and relia-bility of global markets.
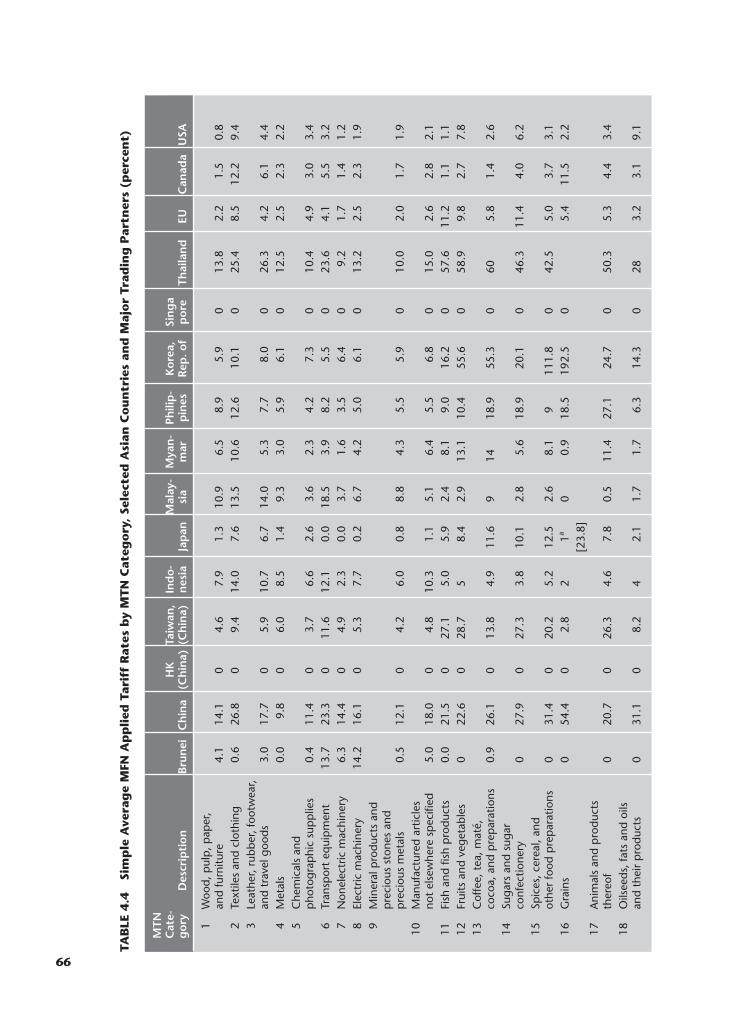
TAB
LE4.4
Sim
ple
Ave
rag
e M
FN A
pp
lied
Tar
iff
Rat
es b
y M
TN
Cat
ego
ry, Se
lect
ed A
sian
Co
un
trie
s an
d M
ajo
r Tr
adin
g P
artn
ers
(per
cen
t)
MTN
C
ate-
HK
Ta
iwan
, In
do
-M
alay
-M
yan
-Ph
ilip
-K
ore
a,
Sin
ga
go
ryD
escr
ipti
on
Bru
nei
Ch
ina
(Ch
ina)
(Ch
ina)
nes
iaJa
pan
sia
mar
pin
esR
ep. o
fp
ore
Thai
lan
dEU
Can
ada
USA
1W
ood,
pul
p, p
aper
, an
d fu
rnitu
re4.
114
.10
4.6
7.9
1.3
10.9
6.5
8.9
5.9
013
.82.
21.
50.
82
Text
iles
and
clot
hing
0.6
26.8
09.
414
.07.
613
.510
.612
.610
.10
25.4
8.5
12.2
9.4
3Le
athe
r, ru
bber
, foo
twea
r, an
d tr
avel
goo
ds3.
017
.70
5.9
10.7
6.7
14.0
5.3
7.7
8.0
026
.34.
26.
14.
44
Met
als
0.0
9.8
06.
08.
51.
49.
33.
05.
96.
10
12.5
2.5
2.3
2.2
5C
hem
ical
s an
d p
hoto
grap
hic
sup
plie
s0.
411
.40
3.7
6.6
2.6
3.6
2.3
4.2
7.3
010
.44.
93.
03.
46
Tran
spor
t eq
uip
men
t13
.723
.30
11.6
12.1
0.0
18.5
3.9
8.2
5.5
023
.64.
15.
53.
27
Non
elec
tric
mac
hine
ry6.
314
.40
4.9
2.3
0.0
3.7
1.6
3.5
6.4
09.
21.
71.
41.
28
Elec
tric
mac
hine
ry14
.216
.10
5.3
7.7
0.2
6.7
4.2
5.0
6.1
013
.22.
52.
31.
99
Min
eral
pro
duct
s an
d p
reci
ous
ston
es a
nd
pre
ciou
s m
etal
s0.
512
.10
4.2
6.0
0.8
8.8
4.3
5.5
5.9
010
.02.
01.
71.
910
Man
ufac
ture
d ar
ticle
s no
t el
sew
here
sp
ecifi
ed5.
018
.00
4.8
10.3
1.1
5.1
6.4
5.5
6.8
015
.02.
62.
82.
111
Fish
and
fish
pro
duct
s0.
021
.50
27.1
5.0
5.9
2.4
8.1
9.0
16.2
057
.611
.21.
11.
112
Frui
ts a
nd v
eget
able
s0
22.6
028
.75
8.4
2.9
13.1
10.4
55.6
058
.99.
82.
77.
813
Cof
fee,
tea
, mat
é,
coco
a, a
nd p
rep
arat
ions
0.9
26.1
013
.84.
911
.69
1418
.955
.30
605.
81.
42.
614
Suga
rs a
nd s
ugar
co
nfec
tione
ry0
27.9
027
.33.
810
.12.
85.
618
.920
.10
46.3
11.4
4.0
6.2
15Sp
ices
, cer
eal,
and
othe
r fo
od p
rep
arat
ions
031
.40
20.2
5.2
12.5
2.6
8.1
911
1.8
042
.55.
03.
73.
116
Gra
ins
054
.40
2.8
21a
00.
918
.519
2.5
05.
411
.52.
2[2
3.8]
17A
nim
als
and
pro
duct
s th
ereo
f0
20.7
026
.34.
67.
80.
511
.427
.124
.70
50.3
5.3
4.4
3.4
18O
ilsee
ds, f
ats
and
oils
an
d th
eir
pro
duct
s0
31.1
08.
24
2.1
1.7
1.7
6.3
14.3
028
3.2
3.1
9.1
66

19C
ut fl
ower
s, p
lant
s,
vege
tabl
e m
ater
ials
; la
cs, e
tc.
012
.40
9.2
5.7
1.3
04.
53.
228
.10
38.5
2.4
0.7
1.2
20Be
vera
ges
and
spiri
ts0
50.6
028
.180
14.7
9.4
24.2
10.7
29.1
00
11.3
4.4
1.8
21D
airy
pro
duct
s0
40.3
018
.65
263.
63.
35
72.2
035
.87.
77.
413
.522
Toba
cco
056
.70
25.4
10.7
4.2
258.
433
.20
39.7
7.3
204.
223
Oth
er a
gric
ultu
ral p
rodu
cts
0.1
12.3
03.
74.
41.
10.
73.
13.
210
.10
29.1
1.3
0.8
0.8
Not
es: M
FN =
mos
t-fa
vore
d na
tion;
MTN
= M
ultil
ater
al T
rade
Neg
otia
tions
, Wor
ld T
rade
Org
aniz
atio
n.a.
Exc
ludi
ng t
ariff
-rat
e q
uota
s, w
hich
are
hig
h on
ric
e. B
rack
ets
indi
cate
val
ue w
ith a
d va
lore
m e
qui
vale
nts
calc
ulat
ed u
sing
Sta
wow
y (2
001)
.So
urce
: WTO
IDB.
67
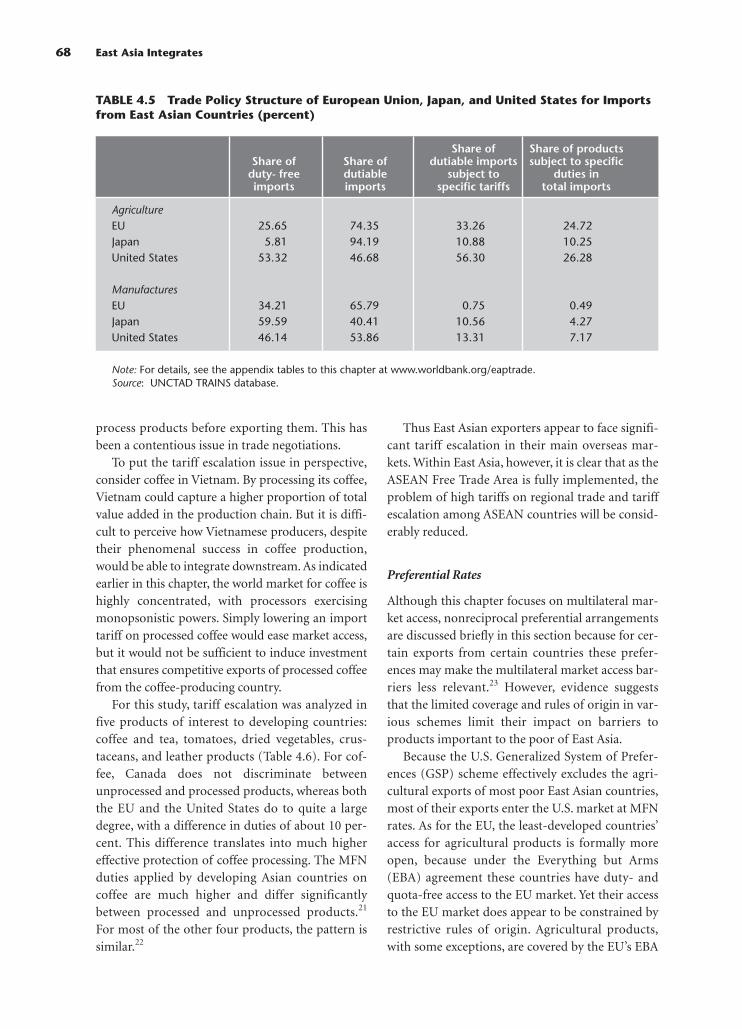
68 East Asia Integrates
process products before exporting them. This hasbeen a contentious issue in trade negotiations.
To put the tariff escalation issue in perspective,consider coffee in Vietnam. By processing its coffee,Vietnam could capture a higher proportion of totalvalue added in the production chain. But it is diffi-cult to perceive how Vietnamese producers, despitetheir phenomenal success in coffee production,would be able to integrate downstream. As indicatedearlier in this chapter, the world market for coffee ishighly concentrated, with processors exercisingmonopsonistic powers. Simply lowering an importtariff on processed coffee would ease market access,but it would not be sufficient to induce investmentthat ensures competitive exports of processed coffeefrom the coffee-producing country.
For this study, tariff escalation was analyzed infive products of interest to developing countries:coffee and tea, tomatoes, dried vegetables, crus-taceans, and leather products (Table 4.6). For cof-fee, Canada does not discriminate betweenunprocessed and processed products, whereas boththe EU and the United States do to quite a largedegree, with a difference in duties of about 10 per-cent. This difference translates into much highereffective protection of coffee processing. The MFNduties applied by developing Asian countries oncoffee are much higher and differ significantlybetween processed and unprocessed products.21
For most of the other four products, the pattern issimilar.22
Thus East Asian exporters appear to face signifi-cant tariff escalation in their main overseas mar-kets. Within East Asia, however, it is clear that as theASEAN Free Trade Area is fully implemented, theproblem of high tariffs on regional trade and tariffescalation among ASEAN countries will be consid-erably reduced.
Preferential Rates
Although this chapter focuses on multilateral mar-ket access, nonreciprocal preferential arrangementsare discussed briefly in this section because for cer-tain exports from certain countries these prefer-ences may make the multilateral market access bar-riers less relevant.23 However, evidence suggeststhat the limited coverage and rules of origin in var-ious schemes limit their impact on barriers toproducts important to the poor of East Asia.
Because the U.S. Generalized System of Prefer-ences (GSP) scheme effectively excludes the agri-cultural exports of most poor East Asian countries,most of their exports enter the U.S. market at MFNrates. As for the EU, the least-developed countries’access for agricultural products is formally moreopen, because under the Everything but Arms(EBA) agreement these countries have duty- andquota-free access to the EU market. Yet their accessto the EU market does appear to be constrained byrestrictive rules of origin. Agricultural products,with some exceptions, are covered by the EU’s EBA
TABLE 4.5 Trade Policy Structure of European Union, Japan, and United States for Importsfrom East Asian Countries (percent)
Share of Share of products Share of Share of dutiable imports subject to specific
duty- free dutiable subject to duties in imports imports specific tariffs total imports
AgricultureEU 25.65 74.35 33.26 24.72Japan 5.81 94.19 10.88 10.25United States 53.32 46.68 56.30 26.28
ManufacturesEU 34.21 65.79 0.75 0.49Japan 59.59 40.41 10.56 4.27United States 46.14 53.86 13.31 7.17
Note: For details, see the appendix tables to this chapter at www.worldbank.org/eaptrade.Source: UNCTAD TRAINS database.

69
TAB
LE4.6
Tari
ff E
scal
atio
n f
or
Sele
cted
Pro
du
cts
in S
elec
ted
Mar
ket
s an
d A
SEA
N F
ree
Trad
e A
rea
Qua
d c
oun
trie
s (M
FN)
ASE
AN
co
untr
ies
(AFT
A c
om
mit
men
ts)a
HS6
cat
ego
ryC
ana-
Cam
-In
do
-La
o
Mal
ay-
Mya
nPh
ilip
-Ta
iwan
Th
ai-
Vie
t-(f
our
- d
igit
co
de)
da
EUJa
pan
USA
Ch
ina
bo
dia
nes
iaPD
Rsi
am
arp
ines
(Ch
ina)
lan
dn
am
Ag
ricu
ltu
reC
offe
eU
npro
cess
ed (
0901
)0.
00
12.0
0.2
2530
5 (0
)40
(0)
05
(4)
51 (
5)5.
340
(5)
25 (
5)Pr
oces
sed
(210
1)0
9.5
18.7
12.2
5035
5 (5
)20
11.6
(2)
1535
(5)
22.5
47 (
5)50
Tom
atoe
sU
npro
cess
ed (
0702
) 0.
0En
try
0.0
Spec
ific
and
137
5(0)
40 (
0)0
1510
(5)
1060
(5)
30 (
5)p
rices
bse
ason
alc
Proc
esse
d (2
002)
11.5
14.4
12.6
11.9
2535
5 (0
)30
5.8
(0)
1511
.6 (
4)24
30 (
5)50
Vege
tabl
esU
npro
cess
ed (
0713
)2.
53.
211
.21.
27.
27
5 (5
)40
(0)
00
4 (4
)12
60 (
5)30
(50
Proc
esse
d (1
106)
6.0
1515
.96.
925
355
(0)
5 (0
)5
(0)
410
(3)
2060
(5)
20 (
5)N
on
agri
cult
ura
l p
rod
uct
sC
rust
acea
nsU
npro
cess
ed (
0306
)5
11.0
73.
87.
530
.215
5.0
(5)
10 (
0)8
(2.5
)10
(3)
10.8
(5)
36.5
60 (
5)30
(5)
Proc
esse
d (1
605)
4.35
19.0
45.
97.
125
3516
(0)
10 (
0)20
(2.
5)15
5 (5
)30
.040
(5)
50 (
5)Le
athe
rU
npro
cess
ed (
4104
)3.
30–
5.5
243.
48.
735
0 (0
)20
07.
5 (5
)4
(3)
2.5
55
Proc
esse
d (6
403)
187.
77.
210
2524
15 (
5)10
(0)
30 (
0)2
(2)
15 (
5)5
40 (
5)50
Not
es:M
FN =
mos
t-fa
vore
d na
tion;
ASE
AN
= A
ssoc
iatio
n of
Sou
thea
st A
sian
Nat
ions
; AFT
A =
ASE
AN
Fre
e Tr
ade
Are
a; H
S =
harm
oniz
ed s
yste
m.
a. T
he c
omm
itmen
ts m
ade
by A
FTA
mem
bers
are
in p
aren
thes
es. N
o p
aren
thes
es in
dica
te t
hat
no c
omm
itmen
t ha
s be
en m
ade.
b. T
he t
ariff
com
pris
es a
n ad
val
orem
com
pon
ent
and
a sp
ecifi
c du
ty t
hat
incr
ease
s th
e lo
wer
the
pric
es. T
he d
utie
s ar
e al
so s
easo
nal.
For
exam
ple
, the
ad
valo
rem
com
pon
ent
rang
es fr
om 8
.8 t
o 14
.4 p
erce
nt.
c. T
he s
pec
ific
duty
ran
ges
from
2.8
to
3.9
cent
s p
er k
ilogr
am, d
epen
ding
on
the
seas
on.
Sour
ce: W
TO ID
B.

scheme, but the reduction on specific duties is only30 percent. Furthermore, when the MFN duty hasboth an ad valorem and a specific component, thespecific component is not reduced.
The GSP is highly relevant to the exports of theleast-developed countries and Vietnam to the EU.Almost 100 percent of Cambodia’s EU exports, 93percent of the Lao PDR’s EU exports, and 83 per-cent of Vietnam’s EU exports are eligible for prefer-ential access to the EU. For other East Asian coun-tries, the GSP is less important, and poorhouseholds in these countries do not benefit. Forexample, less than 30 percent of China’s exports tothe EU are eligible for preferences, and only 15 per-cent of Malaysia’s exports are eligible.24
An important feature of many nonreciprocalpreference schemes is their low level of utilizationfor products actually exported by developing coun-tries. For example, although almost all of Cambo-dia’s exports to the EU were eligible for preferences,Cambodia took advantage of these preferences foronly 36 percent of those exports.25 For the otherEast Asian developing countries, the take-up ofpreferences never exceeds two-thirds of the value ofexports eligible for preferences. A major reason isthe prevalence of stringent rules of origin. Poorcountries, with underdeveloped institutions, find ithard to comply with the complex bureaucraticrequirements needed to prove the origin of theirexports and so take advantage of tariff reductions.
Nontariff Measures
Data on nontariff measures (NTMs) are very diffi-cult to collect, but they remain an important bar-rier in agroproducts. Unfortunately, despite theimportant role that nontariff measures play in themarket access of agricultural products, very littlework has been done to quantify their impact. Onepossible methodology for assessing the extent ofNTMs is the use of frequency data. Such data areavailable, but they are limited in their ability toquantify the trade distortive element of NTMs (seeBora 2002). Qualitative data are more helpful, butthose available are not comprehensive. Case studiesare the best way to deal with these kinds of issues.
The qualitative data that are available, such asthe analysis by Cerrex (2002) reproduced as Table4.7, show that for the products of concern to thepoor countries of East Asia, the key issues are health
and safety regulations, notably maximum pesticideresidue levels; difficulties with understanding andadministering standards; lack of technical assis-tance; and, in some cases, seasonal tariffs. Forexample, health and safety standards are a majorbarrier for fresh fruit, vegetables, fish, sweet bis-cuits, and other foodstuffs and drinks. Organicproducts face high costs in complying with EUstandards and definitions and problems of certifi-cation.
Conclusions
Agriculture is the predominant source of incomefor poor households in East Asia. In products ofspecial importance to these poor households—agricultural and agroprocessing products—impor-tant barriers remain in developed and developingcountry markets.
In contrast to the move toward increased trans-parency and reduced protection in trade policy formanufactures, agriculture and agroprocessingremain more heavily protected, distorting globalmarkets and affecting production patterns and theefficient adoption of technology in poor countries.For this reason, agricultural liberalization offersgreat potential for welfare gains. And because poorhouseholds are heavily engaged in agriculturalactivity, they would benefit most from greater mar-ket access in agricultural products. For East Asia,liberalization in both developed and developingcountry markets is important, the latter even moreso than the former. And there is greater potentialfor realizing these gains through regional arrange-ments, especially between ASEAN and China, giventhe political complexity surrounding multilateralagricultural liberalization and given the existingmarketing links within the region in agriculturalproducts.
Fortunately, East Asian farmers do not partici-pate much in those markets most distorted by thedomestic support programs used in high-incomecountries, with the notable exception of rice. Buteach major market has significant barriers, whichvary according to the product and market. First, theEU and the United States levy above-average ad va-lorem tariffs on agricultural products and use spe-cific tariffs to a large extent, thereby reducing trans-parency and creating higher effective protectionagainst low-value goods, often from poorer coun-
70 East Asia Integrates

Market Access Barriers and Poverty in Developing East Asia 71
TABLE 4.7 Nontariff Measures Affecting Products of Interest to Developing East Asia Economies
Product HS number Particular problems
Fresh fruit Health/safety: pesticide residue levels; difficulties in complying with EU standards (i.e., expense, lack of technical knowledge, difficulty with interpretation of directives).Common Agriculture Policy (CAP) levies; quota/license requirements; seasonal preferences; continuing high residual tariffs. Generally no tariff preference for GSP suppliers.
Processed fruit/ Except 20.07 Same as above, especially high residual tariffs. No fruit-vegetable juices to 20.09 concession for GSP.
Jams and jellies Except 20.07 Preference given, although residual duty remains very high.Natural honey 04.09 No preference for GSP; high residual duties.Rice 10.06 Quotas and licensing and levies: very complicated
tariff structure.Vegetables Health/safety regulations: maximum pesticide residue
levels; difficulties with understanding and administering standards; lack of technical assistance.Seasonal preferences for some products; no preference generally for tomatoes.
Organic products Misc. High costs of complying with EU standards and definitions; problems with certification; lack of subsidies from national governments; costs of meeting phytosani-tary standards.Mixture of tariff preferences (e.g., no GSP preferences for chicken or pork); minimal GSP preference for sausages.
Walnuts Except 08.02 Tariff quotas may apply.Fish Except Ch. 3 High residual tariffs often granting GSPs no preference;
and 16 problems of origin rules; cost of meeting and administering health regulations; difficulties and cost of testing procedures.
Chocolates Origin rules and sugar levies.Sweet biscuits 19.05 Difficulties meeting health/phytosanitary standards;
sugar levies; quotas.Fresh flowersOrchids and 06.03 Difficulties in meeting environment and social rose stems standards; CAP levies and duties; quota/license
requirements.Wine Except 22.04 Subject to continuing high duties; specific excise
duties; removal of GSP preference for certain countries.Cocoa Except 18 A mixture of the effect of sugar levies. Origin rules for
chocolate, quotas, and the number of preferences available (up to 28) make this the most complicated chapter in the tariff.
Foodstuffs and drinks, electrical and engineering goods Passim Standards.
Wheat gluten 11.09 Quotas may apply; no preference for GSP countries.Refined palm oil 15.11 CAP levies and duties may apply; quota restrictions.Frozen vegetables Chs. 7 and 20 Need for financial assistance for freezing capacity.Essential oils and 33.01 and 33.03 Operation of excise duties to the disadvantage of perfumes cheaper products.
Notes: This list is not meant to be a fully comprehensive one of the products or of the problems. Theinformation given is as of mid-2001. HS = harmonized system; GSP = Generalized System of Preferences;Ch. = harmonized system of chapter.Source: Cerrex (2002).

tries. Second, domestic support and tariff-quotaschemes remain an important element of protec-tion in Japan, notably for rice. Third, tariff escala-tion on agroprocessed goods in the EU, NorthAmerican, and Japanese markets results in higheffective protection rates and discourages diversifi-cation into processing activities as well as the cap-ture of more value added by producing countries.Fourth, standards are increasingly a major barrier,with East Asian exporters facing difficulties inmeeting health and safety standards, for example.
The results of the analysis in this chapter suggestthat reducing trade barriers to agriculture-basedproducts important to the poor of East Asia shouldbe a central trade policy objective. Because no sin-gle trade protection element dominates in barriersto these products—and because each trade protec-tion element is important in at least one majormarket—the approach toward trade policy needs tobe broad. Thus the targets for this trade policyshould cover all of the following:
• Reducing the above-average tariff rates• Reducing the extent of tariff escalation and pro-
viding additional routes for product diversifica-tion and export growth in developing countries
• Reexamining health and safety regulations andprocedures for administering them
• Improving the transparency of tariff schedulesby converting non–ad valorem rates to ad va-lorem rates.
Deciding on the arena in which to pursue theseobjectives is another issue. The chapter has stressedthat many of the poorer countries have adoptednonreciprocal market access as a central compo-nent of their export strategy. However, theseschemes remain beyond the scope of multilateralnegotiations for reasons that are beyond the scopeof this chapter. Nevertheless, an opportunity forimprovements in market access conditions clearlyexists through further clarification and simplifica-tion of rule of origin procedures, clearer and morestreamlined applications of standards, and, in thecase of some developed markets, a broadening ofthe coverage of such schemes.
An opportunity also exists to address some ofthe market access barriers discussed in this chapterthrough the current round of multilateral negotia-tions. Negotiators have been given a clear mandate
to address barriers specifically for products ofinterest to developing countries. Such steps wouldinclude reducing tariff barriers, converting non–advalorem lines to ad valorem rates, reducing domes-tic support, and disciplining export subsidies. Thetype of result that emerges from the negotiations,however, depends on the effective participation ofdeveloping countries in the negotiations.
Yet another possible avenue for pursuingenhanced market access is through the ASEAN FreeTrade Area process and other regional arrange-ments. The current implementation schedule hasresulted in fewer barriers in the more advancedASEAN members. This is an important stepbecause evidence suggests that many products areproduced on a regional basis. A more liberalregional trading landscape will encourage furtherprocessing and specialization in a regional context,which could enhance opportunities for exportingthe types of products discussed here.
Endnotes
1. See Rodriguez and Rodrik (1999) for a general discussionof these issues, as well as Rodrik (2001).
2. Much has also been written about the need for developingcountries to move from labor-intensive and low-technol-ogy exports into higher technology and higher value addedproducts. Indeed, such a transition is crucial from a generaldevelopment perspective. But because agricultural prod-ucts and labor-intensive products remain of key interest topoor households, this chapter focuses on these products.
3. For example, consider coffee in Vietnam. Since 1990 Viet-nam’s coffee production has increased more than tenfold—mainly from small farms. Farmers sell their coffee cherriesto wholesalers, but all they can do is try to ensure that theircrop meets minimum quality standards. Four companiespurchase half of the world’s coffee production, and fewerthan 20 percent of the world’s population drinks 65 percentof the coffee. Traders who mediate between farmers and themajor buyers are responsible for the rest of the productionprocess. Some coffee retailers buy some supplies directlyfrom farmers, but the coordination costs of dealing withmillions of farmers are high. The U.S. retail chain Star-bucks, for example, buys only about 10 percent of its totalcoffee purchases directly from farmers. This discussion isbased on Stern (2002).
4. See Bacchetta and Bora (2002) and Bora (2002) for a gen-eral discussion of this topic.
5. Agriculture’s share of official exports is only significant forMyanmar, as shown in Table 4.2 (44 percent). Agriculture’sshare of GDP exceeds 25 percent in only a few countriessuch as Mongolia, Lao People’s Democratic Republic (LaoPDR), and Cambodia.
6. World Bank, Poverty Projections Toolkit, 2002 estimate.7. All dollar amounts are 1997 U.S. dollars.8. The technical appendix to this chapter can be found at
www.worldbank.org/eaptrade.
72 East Asia Integrates

9. The top 30 agricultural exports of each least-developedcountry in East Asia were identified for this study. Lists areavailable from the author upon request.
10. It should be noted that the frequency count could overstatethe importance of a particular category. For example,countries such as Malaysia have fairly diverse exports, butexport value is heavily concentrated in a few products.
11. See last column of Appendix Table 4.1 of this chapter atwww.worldbank.org/eaptrade.
12. The major markets were identified for each of the key four-digit products on the basis of aggregated overall agricul-tural exports. ASEAN served as one group, given the simi-larity of members’ protection profiles in the ASEAN FreeTrade Area. In that way, further attention could be focusedon non–ASEAN markets such as Canada, Japan, the Euro-pean Union, and the United States.
13. The reasons for this are the high incidence of domestic sup-port for products that are of relatively low importance todeveloping countries and the fact that tariffs affect worldprices more strongly than do subsidies. This is not to saythat support payments in importing countries are unim-portant to developing country exporters, but rather thatone needs to consider these payments in relation to theexports of specific countries.
14. A distinction can also be drawn between the applied rate ofduty as in a nation’s tariff schedule and the rate of duty thatis applied at the customs point.
15. See the technical appendix to this chapter at www.worldbank.org/eaptrade.
16. See the technical appendix to this chapter at www.worldbank.org/eaptrade.
17. China’s tariff profile does not take into account its finalWTO accession commitments, which have yet to be fullyimplemented.
18. For details, see the appendix tables 4.4 and 4.5 to this chap-ter at www.worldbank.org/eaptrade.
19. See Appendix Table 4.3 to this chapter at www.worldbank.org/eaptrade.
20. For example, in the EU market in 2001 the specific duty of128 euros per 1,000 kilograms on imports of broken ricetranslated into an ad valorem tariff of 24.75 percent forimports from China and 28.92 percent for imports fromVietnam. In the U.S. market, specific tariffs on certain nutsexported from East Asian countries can translate into advalorem equivalents in excess of 12 percent.
21. Lao PDR is an exception, imposing a lower duty onprocessed coffee than on unprocessed.
22. In certain cases, the tariffs on processed agricultural prod-ucts can be very complex. For example, in the EU processedfood products such as biscuits are subject not only to a tar-iff on the product itself (of about 9 percent) but also to spe-cific tariffs on both the milk and sugar content of the prod-uct. Such tariffs can represent very high levels ofprotection.
23. For developing Asian countries, two important issues sur-round preferential rates: the nonreciprocal preferences theyare granted in the industrial country markets and the recip-rocal granting of preferences in the context of regionalintegration. As discussed elsewhere in this volume, animportant question for these countries is whetherimproved market access at the regional level could be an
intermediary step toward multilateral liberalization. Inindustrial markets, the issue is whether preferences removeor limit the impact of the above-average tariffs and theextensive use of specific tariffs on products of particularrelevance to the poorest countries.
24. Further details of preferential access arrangements for poorEast Asian countries to the EU and the United States aregiven in the technical appendix to this chapter atwww.worldbank.org/eaptrade.
25. Brenton (2003) shows that, even with duty-free access onpaper, Cambodia faced an average tariff equivalent to 7.7percent on its exports to the EU.
References
The word processed describes informally reproduced works thatmay not be commonly available through libraries.
ABARE. 2000. The Impact of Agricultural Trade Liberalization onDeveloping Countries. Canberra: Australian Bureau of Agri-cultural and Resource Economics.
Bacchetta, M., and B. Bora. 2002. “Industrial Tariffs and theDoha Development Agenda.” World Trade Organization,Geneva. Processed.
Bora, Bijit. 2002. “LDC Market Access Issues and the DohaDevelopment Agenda.” World Trade Organization, Geneva.Processed.
Brenton, Paul. 2003. “Integrating the Least Developed Countriesinto the World Trading System: The Current Impact of EUPreferences under Everything But Arms.” Policy ResearchWorking Paper, World Bank and forthcoming in Journal ofWorld Trade.
Cerrex. 2002. “Making EU Trade Agreements Work.” Study pre-pared for the UK Department for International Develop-ment. Processed.
Hoekman, Bernard, F. Ng, and M. Olarreaga. 2002. “ReducingAgricultural Tariffs versus Domestic Support: What’s MoreImportant for Developing Countries.” World Bank, Wash-ington, D.C. Processed.
McCulloch, Neil, L. Alan Winters, and Xavier Cirera. 2001. TradeLiberalization and Poverty: A Handbook. London: Centre forEconomic Policy Research.
Rodriguez, Francisco, and Dani Rodrik. 1999. “Trade Policy andEconomic Growth: A Skeptic’s Guide to the Cross-NationalEvidence.” NBER Working Paper No. 7081. National Bureauof Economic Research, Cambridge, Mass.
Rodrik, Dani. 2001. “The Global Governance of Trade: As IfDevelopment Really Mattered.” United Nations Develop-ment Programme, New York, October. Processed.
Stawowy, V. 2001. “A Method for Calculating Ad Valorem Equiv-alents.” United Nations Conference on Trade and Develop-ment (UNCTAD), Geneva. Processed.
Stern, Nicholas. 2002. “Crisis in a Coffee Cup.” Fortune. Decem-ber 9.
World Bank. 2002. Global Economic Prospects and DevelopingCountries: Making Trade Work for Poor. Washington, D.C.
WTO (World Trade Organization) Secretariat. 2000. DomesticSupport. WTO document G/AG/NG/S/1, Secretariat Back-ground Paper 13. World Trade Organization, Geneva,April.
Market Access Barriers and Poverty in Developing East Asia 73

Part II
DevelopmentOrientation for
A behind-the-border agenda

Why focus on logistics? The reason is simple.Reducing the cost and improving the quality oflogistics and transport systems improve interna-tional market access and lead directly to increasedtrade—and through this to higher incomes and awider scope for significant reductions in poverty.
East Asia’s progress on logistics has failed to keeppace with its growth in trade. Developing countriesin other regions are now catching up, so fasterprogress on logistics development will be crucial tosustaining East Asia’s competitive advantages. Highlogistics costs for East Asian countries stem frompoor transport infrastructure, underdevelopedtransport and logistics services, and slow and costlybureaucratic procedures for dealing with bothexported and imported goods. The balance amongthese three factors varies among countries, but ineach country a complementary approach toaddressing all of them will be needed to produce asustainable improvement in competitiveness.
Recent studies have indicated the importanceof efficient ports (in terms of both operationalefficiency and document facilitation) for tradecompetitiveness (Wilson and others 2002), but
77
5
Trade and Logistics:An East Asian
PerspectiveRobin Carruthers
Jitendra N. BajpaiDavid Hummels
the arguments presented in this chapter show thatports are only one aspect of the connectionbetween logistics and trade growth. A look at thetotal cost of getting products from producers tomarkets reveals that land transport to portsaccounts for a higher proportion of the cost thanprocessing within the port or the maritime voy-age itself, and improvements in land access offerthe greatest scope for increasing trade competi-tiveness.
Countries that have moved beyond exportingbasic agricultural and mining commodities findthat logistics requirements have become moreonerous, not less onerous. Manufacturing firms,especially those integrated into global productionchains, seek not only low transport costs but alsofulfillment of a host of sophisticated logisticalneeds: short transit times, reliable delivery sched-ules, careful handling of goods in cold storagechains, certification of product quality, and securityfrom theft. Basic transport infrastructure does notmeet the logistics needs of manufacturing firms.Thus the requisite policy agenda extends broadly tostimulating the evolution of transport services,
The authors are grateful to Dr. Jose Tongzan for his comments at the seminar at the Institute for Southeast Asia Studies,Singapore.

promulgating product standards, licensing im-ports, and encouraging foreign investment.
This chapter reviews the logistics issues facingEast Asia and proposes a policy agenda to addressthem. We first briefly outline the macroeconomicconnections between logistics and trade, and,because the economies of the region differ funda-mentally in their levels of development, the extent ofopenness and composition of trade. We then discussthe logistics needs specific to each of three broadgroupings of economies. This discussion is followedby a description of the benefits that flow fromimprovements in logistics, and the channels throughwhich these benefits are produced. We then reviewthe current situation in different aspects of logisticsacross the region and offer policy recommendations.
Trade and Logistics Nexus
The literature offers substantial evidence linkingimprovements in transport and logistics directly toimprovements in export performance. The effectsare especially strong when importers have access tomultiple suppliers of highly substitutable com-modities. Comparing sales by manufacturers ofsimilar products, Hummels (1999) estimates thatexporters with 1 percent lower shipping costs willenjoy a 5–8 percent higher market share. Limaoand Venables (2001) estimate that differences ininfrastructure quality account for 40 percent of thevariation in transport costs for coastal countriesand up to 60 percent for landlocked countries.Fink, Mattoo and Neagu (2002) estimate that liber-alizing the provision of port services and regulatingthe exercise of market power in shipping couldreduce shipping costs by nearly a third.
A World Bank study (Wilson and others 2002)shows that member countries of the Asia-PacificEconomic Cooperation (APEC) forum differ sub-stantially in the quality of their logistics and tradefacilitation across a broad range of measures,including ports infrastructure, customs clearance,regulatory administration, and e-business use.They find that these differences are related signifi-cantly to differences in trade performance, andconclude that substantial growth in trade withinthe APEC bloc could be accomplished by bringinglagging countries up to median performance levels.
Furthermore, improving access to internationalmarkets raises incomes. Frankel and Romer (1999)
found that countries closer to world markets enjoyhigher levels of trade, and that a 1 percent rise inthe ratio of trade to gross domestic product (GDP)increases income per person by at least 0.5 percent.Redding and Venables (2002) estimate that morethan 70 percent of the variation in per capitaincome across countries can be explained by thegeography of market and supplier access. Betteraccess to coasts alone raises incomes by 20 percent.
As for income differences within countries,internal and effectively landlocked regions havesystematically lower levels of income than coastalregions. Comparing China’s regions, Wei and Yi(2001) show that trade levels, trade growth, andincome growth rates all drop as one moves inlandfrom coastal areas.1 The evidence on inland regionsmakes an especially strong case for the importanceof access to international markets, because within-country differences control for institutional charac-teristics that cross-country regressions cannot.
Country Group Perspective
A useful way to organize thinking about logistics inEast Asia is to place economies on a graph of tradeopenness and accessibility (Figure 5.1). Those lyingabove the horizontal axis score high on measures ofopenness. The economies to the right of the verticalaxis are accessible to world markets in the sense ofhaving superior logistics and low transport costs.2
The combination of these two measures groupseconomies on the basis of their current logisticsstatus, as well as on the basis of the value ofimproved openness and logistics services in thefuture—that is, economies with fewer political bar-riers to trade can enjoy greater returns to logisticsinvestments than those whose tariff structureswould prevent much trade growth even withworld-class infrastructure. Similarly, accession tothe World Trade Organization (WTO) may be oflimited value if logistics services are too weak tosupport trade growth.
Figure 5.1 suggests two additional correlates: percapita incomes and the commodity structure oftrade. The economies in the upper-right quadrantenjoy higher incomes than those in the lower left,and their exports are high-technology manufac-tures rather than resource-based commodities.Causality probably runs both ways. Economies likethose of Singapore and Hong Kong (China) have
78 East Asia Integrates

Trade and Logistics: An East Asia Perspective 79
Philippines
Philippines Mindanao
Mongolia
Indonesia Sulawesi
Laos
Hong KongTaiwan
Singapore
KoreaJapan
Thailand NEMalaysia
ChinaThailand
China Inland
Vietnam Inland
-1.00
PNG
–2.00
–1.50
–1.00
–0.50
0.00
0.50
1.00
1.50
2.00
2.50
–15.00 –10.00 –5.00 0.00 5.00 10.00 15.00Accessibility
Openness
Cambodia
Vietnam
Indonesia
FIGURE 5.1 Potential Contribution of Transport to Economic Growth in East Asia
Source: Carruthers and Bajpai (2002).
TABLE 5.1 Availability of Transport Infrastructure
No. of airports with paved
Total roads Percent of runways longer (km/ roads Railways than 1,523 m/
1,000 km2) paved (km/1,000 km2) 1,000 km2
Cambodia 78.6 11.6 3.3 22.1China 146.3 28.3 7.1 27.4Indonesia 178.5 46.3 3.4 32.8Lao PDR 59.1 24.0 0.0 25.3Korea, Rep. of 888.9 74.7 31.7 375.7Malaysia 196.1 75.3 5.5 63.7Mongolia 46.1 2.2 1.2 4.5Philippines 606.5 19.8 3.0 113.3Thailand 125.7 97.5 7.9 75.9Vietnam 283.1 25.1 9.5 45.5Argentina 78.6 29.5 12.3 32.8Brazil 234.0 9.3 3.6 21.3Mexico 167.9 29.7 9.3 64.8USA 695.4 90.1 23.2 190.7France 1,621.8 100.0 58.1 138.1Poland 1,218.6 65.6 74.9 236.7
Note: The World Development Report 1994 (World Bank 1994) provided a broad assessment of the basic infra-structure of 132 countries. The consultants for this report expanded and updated the data. UN ESCAP providesan even more comprehensive and current transport database for Asia atwww.unescap.org/tctd/data/index2.asp.Source: Policy Research Corporation (2003).

grown rich in part because their past investments insuperior logistics have facilitated trade. Meanwhile,Mongolia, Lao People’s Democratic Republic (LaoPDR), and Cambodia still suffer from poor basicroad access (Table 5.1). Similarly, while sophisti-cated logistics facilitate the move up the manufac-turing quality ladder, demands from advancedmanufacturers may push the private sector toimprove logistics. Figure 5.1 also presents data forinland regions of China, Thailand, and Vietnam aswell as for the islands of Mindanao in the Philip-pines and Sulawesi in Indonesia, because theseareas have very different access to internationalmarkets compared with the coastal metropolitanareas or principal islands in the same countries.
Using Figure 5.1, we divided the economies ofthe East Asia region into three groups:
1. Outward-oriented, highly accessible: HongKong, Rep. of Korea, Singapore, Taiwan (China)
2. Outward-oriented, accessible: China, Indonesia,Malaysia, the Philippines, Thailand
3. Less open and accessible: Cambodia, Lao PDR,Mongolia, Papua New Guinea, Samoa, Vietnam.
Group 1: Outward-Oriented, Highly Accessible
In the higher-income economies—Hong Kong,Korea, Singapore, and Taiwan—exports haveshifted toward high-technology manufactures andservices. Logistics costs are at very competitive lev-els, transport volumes are high, and multimodallinkages are well developed. Given the strength ofglobal competition, however, these economies needto keep their logistics costs competitive andimprove quality in line with the evolution in tech-nology and with recently introduced securityrequirements.
Hong Kong and Singapore have specialized inproviding logistics services as transshipment hubsfor neighboring states. Singapore has been the maintransshipment stop for much of Southeast Asia,and Hong Kong has specialized in direct shipmentto and from neighboring Guangdong Province, themanufacturing region that produces nearly 40 per-cent of China’s exports. But these two megaportsnow face competition from emerging regionalports: Singapore from Tanjung Pelepas in Malaysiaand Laem Chabang in Thailand, and Hong Kongfrom the rapidly expanding container ports of the
Pearl River Delta on China’s southern coast. Themajor success factors for these and other newlyemerging ports are their transaction cost and timecost advantages. Other advantages include theirefficient auxiliary services (particularly customsand freight forwarding), less congested road andrail access, and better links to national and interna-tional transport networks. Relative to Singapore,the competitive advantage of Tanjung Pelepas willincrease as Malaysia expands its rail network andlinks the port to Cambodia, Thailand, and Viet-nam. Likewise, the growth in traffic through portsin southern China is expected to accelerate with thedismantling of restrictions on the direct imports ofgoods from the United States and Taiwan.
Group 2: Outward-Oriented, Accessible
The countries that fall in this category—China,Indonesia, Malaysia, the Philippines, and Thai-land—face daunting problems in addressing thelogistics impediments to higher pro-poor eco-nomic growth. They are still in the early stages ofdesigning national policies and institutional struc-tures that encourage rather than inhibit the growthof the multimodal transport services that they needfor increased external and domestic trade. Manyparts of these countries have inadequate and ineffi-cient port and shipping facilities, transport ser-vices, and land infrastructure. Poor rural roadscause long transport times and high transportcosts, which in turn hamper the development ofdomestic markets and lead to substantial interre-gional price differences, particularly within China,Indonesia, and the Philippines. Local authoritiesand other agencies charge quasi-legal and illegalroad tolls, often in a desperate attempt to raise rev-enue, but always to the detriment of market access.
In the countries of this group, the form of con-tracts used for international trade and transport dis-courages multimodal use. It is common for the pur-chaser of exports to contract free on board (FOB) inthe port of the exporting country, and the seller(producer) is responsible for contracting landsidedelivery to the specified port. Because no one agentassumes responsibility for the whole logistics chain,the full advantages of multimodal transport are notrealized. Third-party logistics (3PL), in which anindustry contracts out its logistics functions to spe-cialized suppliers of logistics services, are uncom-
80 East Asia Integrates

mon in Group 2 except in Thailand. In some cases,however, such as large international agroproductcompanies in the Philippines, large exporters havedeveloped their own well-integrated logistics. Tradedocumentation is a particularly difficult hurdle forinternational trade with an inland origin or destina-tion. Customs and health authorities are very reluc-tant to allow inland clearance.
Interviews with freight forwarders in the interiorof China suggest that inland transport costs canaccount for about two-thirds of the total transportcosts from Chinese producers to overseas markets.In the context of WTO requirements, customs feeswill be reduced. China’s recent liberalization processhas led to an influx of foreign shipping services (for-eign carriers transported almost 60 percent ofexport trade cargo in 2002). In some cases, ship-ment costs for exports are subsidized by imports.3
Group 3: Less Open and Accessible
These mostly low-income countries—Cambodia,Lao PDR, Mongolia, Papua New Guinea, Samoa,Vietnam—are either former centrally plannedsocialist economies or small island states, depen-dent on a small number of commodities andtourism. Their regimes, recent history, and geo-graphic position are largely responsible for thesmall role that international trade plays in theirnational economies. Except for Vietnam, they havelow population density, small domestic markets,and primarily subsistence agrarian economies.
Many logistical constraints hamper the economicgrowth of these countries, the most fundamentalbeing lack of adequate infrastructure. Roads areoften closed and services suspended, and the state ofinfrastructure requires the use of small, inefficientvehicles and vessels, which have high operating costs.In Cambodia, for example, truck rates for distancesover 100 kilometers vary from about $.034–$.116per ton-kilometer, depending on road conditions. InLao PDR, almost 40 percent of villages are more than6 kilometers from a main road, half are inaccessibleduring the rainy season, one-quarter of the districtcenters lack year-round road access, and a quarter ofprovincial and local roads cannot be used during therainy season. This situation not only makes it diffi-cult to get outputs to markets, but also increases theimport costs of essential consumer products andinputs such as fertilizers. In Papua New Guinea, the
Highlands Highway, the prime road corridor usedfor the export of minerals and coffee, is inadequatefor container movement by trucks; it suffers frompoor maintenance and frequent closures, causingenormous losses in trade.
Government policies in the realm of logisticstend to lack stability, consistency, and transparency,creating many additional problems for the process-ing, storage, transport, grading, marketing, and saleof products. Policy coordination between centraland provincial authorities is poor. Many countriesin this group suffer from highly distorted prices as aremnant of their previously centrally plannedeconomies. National standards on product quality,packaging, storage, and transport conditions areoften rudimentary, and farmers lack management,marketing, and logistics capabilities. In Vietnam,overall port, cargo handling, trucking, and rail tar-iffs may not be excessive, but relative inefficienciesimpose high costs in terms of inventory and theunproductive times of vessels and road vehicles.
The intermodal transport systems of most ofthese countries are poorly integrated, with nostreamlined procedures to support the seamlessmovement of containers between coastal andinland areas. Many countries lack container freightstations, yards, and trucks in their inland regions.Container tracking capability is particularly poor,with shippers often unaware of their containers’whereabouts. The potential impact of improvedmultimodal transport is well illustrated in a recentstudy on the time and costs of container move-ments from Lao PDR to Europe. The study showedthat alternative multimodal routes could reduce thepresent high door-to-door cost from Lao PDR toEurope (through Danang and Singapore) by almostone-third (Banomyong and Beresford 2000).
Border procedures are also cumbersome andtime-consuming in these countries. One reason isexcessive and ad hoc regulatory requirements. InCambodia, which experiences enormous competi-tive pressures from its neighbors, customs clearancetakes 8 days for imports and 10–14 days for exports.Informal payments are needed to handle vesselsafter 5 p.m. in its main port, Sihanoukville. Portcharges at Sihanoukville are the highest in theregion, almost four times those at the comparablysized port of Songkhla in Thailand (CambodiaMinistry of Commerce 2001). For landlockedcountries, land border crossings invariably involve
Trade and Logistics: An East Asia Perspective 81

delays and costs arising from the inefficient appli-cation of national regulations, difficulties in cargoand document clearance, unnecessarily long stor-age, high insurance premiums, and long waitingtimes. For example, Mongolian rail freight arrivingat the border with China often waits for days forChinese rail wagons so that it can complete its jour-ney to the port of Tianjin. Because of a lack of qual-ified staff at the relevant ministries or governmentdepartments, documentation is often inadequate.Border delays lead to extra storage charges, whichcannot always be properly controlled. Detailed cus-toms statistics are often collected at a high cost totraders, but data that might be of use to them arenot compiled, published, or analyzed.
Remote Regions within Countries
Many East Asian countries have vast remote areaswith poor connections to other domestic markets,as well as to international sea and air gateways. Theproblem begins with low population density andgeographic remoteness, but it is worsened by thelack of basic transport infrastructure. Of course,where markets are distant and trade volumes arelow, it is difficult to justify building and maintainingeven basic infrastructure. But this situation creates avicious cycle, resulting in transport costs so high
that these remote areas become nearly autarkic.Remoteness is not limited to landlocked regions. Inthe Philippines, Mindanao has few connectionswith population centers, and containerized cargoservices are limited. Inland transport costs of mov-ing goods from some remote regions of China toexternal markets are large multiples of the inlandtransport costs at the other end (Table 5.2).
Logistics difficulties associated with remotenessextend beyond the frequency and cost of transport.For example, connections are poor between themain cities and many of the outlying counties andvillages in the Chinese provinces of Hunan andYunnan. In such interior regions, it is difficult tomaintain road access and harder still to maintainsupporting facilities such as warehouses, cold stor-age rooms, intermodal terminals, and informationstructures to control flows. As a consequence, cargoconsolidation is limited, harvests cannot be stored,and perishable products do not survive shipment.
Inland regions are squeezed on two sides—byhigher prices for their imported consumptionitems and by lower net revenues (and thereforelower wages) for their exported output.4 In LaoPDR, for example, regions that enjoy more days ofroad access have much lower rates of poverty. Fig-ure 5.2 charts poverty rates across Lao provincesagainst road access in the rainy season.
82 East Asia Integrates
20
30
40
50
60
70
80
25 30 35 40 45 50 55 60 65 70 75
Rainy season road access (%)
Percentage of population in poverty
FIGURE 5.2 Poverty and Accessibility in Lao PDR
Source: D. Hummels’s calculations, based on Arnold (2003).
Similar arguments apply across countries. Acountry with high logistics costs is, in a broad eco-nomic sense, far from international markets in thatit pays high prices for its imports and receives lowprices for its exports.5
Benefits from Improved Logistics
What are the specific channels through whichinvestments in logistics can improve welfare indeveloping economies? This section reviews exam-ples and evidence taken both from academic stud-ies and from a series of recent country studies bythe World Bank.
Reduced “Wedge” between Consumer and Producer Prices
Reducing the cost of moving goods between mar-kets reduces the prices paid by consumers andincreases the prices received by producers. On theconsumer side, this effect can be seen most clearlyby examining the price of goods at the port relativeto the price of goods inland. Producers will not shipgoods inland unless the price they receive, net ofshipping, is at least as high as the price at the port.As a result, inland consumers bear the full burdenof shipping costs for any good that is not producedlocally. This burden can be substantial. Data fromMongolia, for example, reveal substantial price dif-ferences between Ulaanbaatar and outlying regions,with as much as 67 percent of the higher costs inoutlying regions attributable to transport.
A similar logic applies to exports. Internationalmarkets will not pay more for goods produced ininland regions, and so the ex factory or ex farmprices are reduced by the full inland logistics costsof access to the port.
Insurance against Regional Price Fluctuations
Agricultural output sometimes varies because ofunpredictable weather—one region may experi-ence drought and food shortages, while anotherenjoys sufficient rainfall and ample harvests. If theregions are separated by poor logistics and trans-port systems, consumers in the shortfall region willface very high food prices, and producers in thesurplus region will face a market glut. Regionalvariations in agricultural prices are especially pro-
nounced in countries such as Cambodia, Lao PDR,and Vietnam, where agricultural production is alarge portion of national output and where interiorregions are poorly connected or inaccessible.
Good internal logistics facilitate commodityshipments from surplus to shortfall regions,smoothing price variations between them and pro-viding a kind of insurance against shortage andglut. Better market access appears to dampen pricevolatility for a broad range of products. Accordingto Engel and Rogers (1996), the volatility in goodsprices between city pairs rises with the distancebetween the cities, and is especially large for citypairs across national borders. Essentially, arbitrageis necessary to narrow price differentials acrosslocations, but such an objective is much harder toachieve when logistics are poor.
Reduced Inventory Costs
Better transport and logistics systems not onlylower the costs of delivery, but also make the timingof delivery more reliable. Because producers cannotmanufacture goods without the inputs they needand retailers cannot sell goods they do not have instock, firms must hold large inventories of goods ifdelivery times are uncertain. Gausch and Kogan(2001) found that inventory holdings in manufac-turing are two to five times higher in developingcountries than in the United States, and they esti-mated that halving inventories could reduce unitproduction costs by 20 percent.
One reason for long and uncertain deliverytimes is poor infrastructure—roads may be impass-able and railways nonexistent, or roads may inflictdamage on trucks that involves high costs and longdelays. Another reason is peak load congestion, asevere problem in areas where population andmanufacturing intensity have grown faster thaninfrastructure capacity. In Vietnam’s Ho Chi MinhCity, for example, the government bans trucksheavier than 2 metric tons in the inner city between6 a.m. and 6 p.m. to combat growing traffic conges-tion. Delivery trucks sit idle during that period,forcing manufacturers to maintain large invento-ries all day. By contrast, under modern just-in-timetechniques, deliveries are continuous, and thetransport capital stock is in constant use.
But leaner production techniques require a sub-stantial flow of information. Manufacturing firms
Trade and Logistics: An East Asia Perspective 83

can run with small inventories of inputs only ifthey are certain where and when the next shipmentwill arrive—a situation that requires sophisticatedelectronic data interchange. Table 5.5 shows that inmany countries in the East Asia region systems forthis purpose are far from competitive.6
More Developed Markets
Well-developed logistics increase consumers’choices and producers’ sources of supply, and bringmore markets within the reach of producers.According to Evenett and Venables (2002), 40 per-cent of the growth in trade in East Asia arises fromoffering new product lines and extending exportsof existing product lines to new trading partners.
Product diversification benefits both agricul-tural- and industrial-based economies. For both,specialization in a narrow range of products can bedangerous because of price volatility. Recent studieshave shown that most of the differences in tradelevels between small and large economies can beattributed to differences in the range of goodstraded, and that much of the growth in importsthat results from lowering trading costs arises fromexpanding the set of products available.7 Romer(1994) shows that the welfare benefits fromexpanded product variety can dwarf those fromstandard calculations of the gains from trade. Andmanufacturing firms are consumers as well. Feen-stra and others (1999) find that expanding the vari-ety of inputs in Taiwan and Korea is associated withproductivity growth in manufacturing.
Better logistics allow expanded variety in twoways. First, they may directly lower the fixed costsof expansion. The scale advantages to providingtransport hubs, warehousing, and logistics services
that many firms can share are significant. Second,by lowering the marginal costs of serving markets,firms can increase sales and spread entry costs overmore units.
The diversification argument also applies acrossmarkets, because reliance on a single export desti-nation leaves firms subject to significant risks frombusiness cycles. The market destinations for EastAsia’s exports are mainly the industrial countries,and intraregional trade is limited. This situationstems in part from the pattern of logistics costs andthe institutional barriers to land-based trade thatmake many countries in the region effectivelycloser to industrial countries than their own geo-graphic neighbors. Thus, although the proposedconversion of the Association of Southeast AsianNations (ASEAN) to a free trade area would domuch to remove tariff barriers, the signatory coun-tries will have to make a corresponding change intheir implementation of customs and other restric-tions on trade, supported by a reduction in logisticscosts, if they are to realize the full benefits of tariffreductions.
Moving Up the Value Chain
As countries move up the value chain from resourceextraction to sophisticated manufacturing andhigher value added agriculture, they must developtheir logistics capabilities accordingly. As the value-to-weight ratio of a country’s exports rises, logisticsand transport costs will fall, but only if the nature oflogistics and transport services stays unchanged. Inpractice, the more sophisticated exports generallyimpose much greater demands on logistics andtransport services. For example, iron ore and bulkgrains may be heavy and difficult to move over land
84 East Asia Integrates
TABLE 5.2 Composition of Logistics Costs of Container Transport from Inland China(Chongqing) to U.S. West Coast
Activity US$ per TEU Percent of total cost
Land access to port 2,300 63Port handling 200 5Maritime transport 750 21Port handling 150 4Land access to final destination 250 7Total 3,650 100
Note: A TEU is a 20-foot equivalent unit, the size of a standard container.Source: Carruthers and Bajpai (2002).
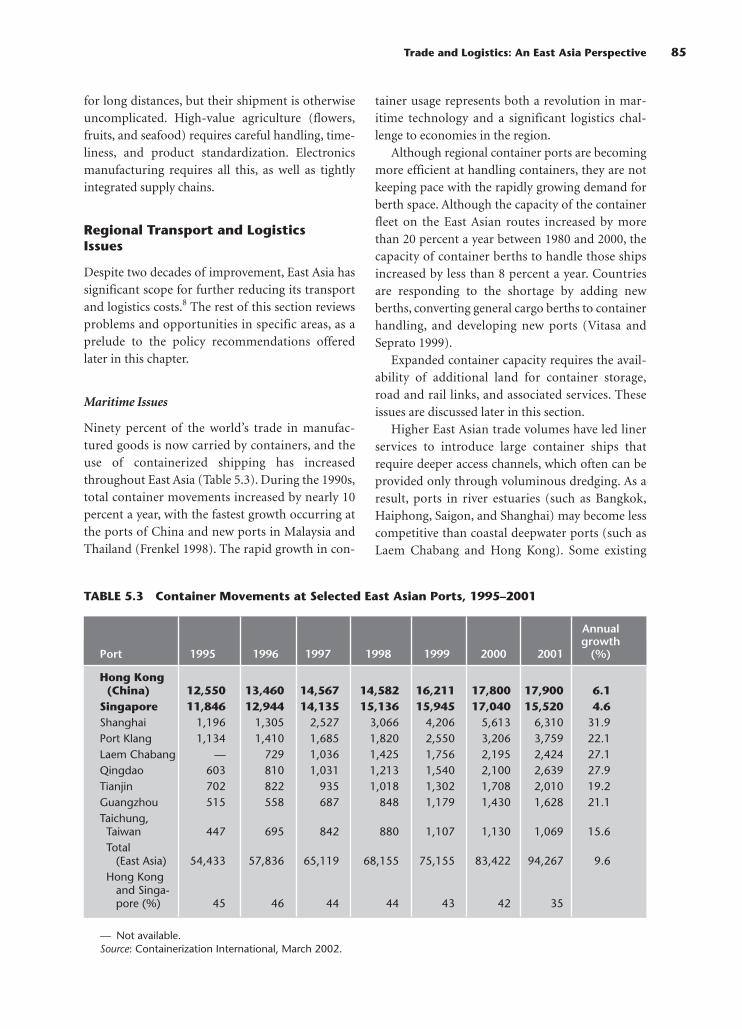
for long distances, but their shipment is otherwiseuncomplicated. High-value agriculture (flowers,fruits, and seafood) requires careful handling, time-liness, and product standardization. Electronicsmanufacturing requires all this, as well as tightlyintegrated supply chains.
Regional Transport and LogisticsIssues
Despite two decades of improvement, East Asia hassignificant scope for further reducing its transportand logistics costs.8 The rest of this section reviewsproblems and opportunities in specific areas, as aprelude to the policy recommendations offeredlater in this chapter.
Maritime Issues
Ninety percent of the world’s trade in manufac-tured goods is now carried by containers, and theuse of containerized shipping has increasedthroughout East Asia (Table 5.3). During the 1990s,total container movements increased by nearly 10percent a year, with the fastest growth occurring atthe ports of China and new ports in Malaysia andThailand (Frenkel 1998). The rapid growth in con-
tainer usage represents both a revolution in mar-itime technology and a significant logistics chal-lenge to economies in the region.
Although regional container ports are becomingmore efficient at handling containers, they are notkeeping pace with the rapidly growing demand forberth space. Although the capacity of the containerfleet on the East Asian routes increased by morethan 20 percent a year between 1980 and 2000, thecapacity of container berths to handle those shipsincreased by less than 8 percent a year. Countriesare responding to the shortage by adding newberths, converting general cargo berths to containerhandling, and developing new ports (Vitasa andSeprato 1999).
Expanded container capacity requires the avail-ability of additional land for container storage,road and rail links, and associated services. Theseissues are discussed later in this section.
Higher East Asian trade volumes have led linerservices to introduce large container ships thatrequire deeper access channels, which often can beprovided only through voluminous dredging. As aresult, ports in river estuaries (such as Bangkok,Haiphong, Saigon, and Shanghai) may become lesscompetitive than coastal deepwater ports (such asLaem Chabang and Hong Kong). Some existing
Trade and Logistics: An East Asia Perspective 85
TABLE 5.3 Container Movements at Selected East Asian Ports, 1995–2001
Annual growth
Port 1995 1996 1997 1998 1999 2000 2001 (%)
Hong Kong (China) 12,550 13,460 14,567 14,582 16,211 17,800 17,900 6.1
Singapore 11,846 12,944 14,135 15,136 15,945 17,040 15,520 4.6Shanghai 1,196 1,305 2,527 3,066 4,206 5,613 6,310 31.9Port Klang 1,134 1,410 1,685 1,820 2,550 3,206 3,759 22.1Laem Chabang — 729 1,036 1,425 1,756 2,195 2,424 27.1Qingdao 603 810 1,031 1,213 1,540 2,100 2,639 27.9Tianjin 702 822 935 1,018 1,302 1,708 2,010 19.2Guangzhou 515 558 687 848 1,179 1,430 1,628 21.1Taichung, Taiwan 447 695 842 880 1,107 1,130 1,069 15.6Total
(East Asia) 54,433 57,836 65,119 68,155 75,155 83,422 94,267 9.6Hong Kong
and Singa-pore (%) 45 46 44 44 43 42 35
— Not available.Source: Containerization International, March 2002.

estuarial ports are already looking for new develop-ments on the coast to overcome this disadvantage.
Because the scope for further reducing costs byincreasing vessel size is limited, the next developmentis likely to be more direct services from what are nowfeeder ports. With higher volumes and more efficientsmaller vessels, such a step could overcome the highcost penalty of transfers in the hub ports. This trendis already reflected in the slower growth rates of thetwo regional megaports, shown in Table 5.3.
Multimodal Transport
Much of East Asia uses containers only for the mar-itime part of trips, loading and unloading them inthe ports rather than at the origin and destination oftheir cargo. This approach, however, eliminates themain cost savings advantages of container use. Thecountries most successful at encouraging door-to-door movement of containers using multimodaltransport will be the ones best equipped to competeand to bring trade benefits to their more remoteregions. To achieve this integration, they will need to:
• Match inland infrastructure with maritime infra-structure. One important reason that containersdo not move inland from container ports is thatroad and rail infrastructure lack the appropriatecarrying capacity and vehicle dimensions for thetransport of loaded containers.
• Simplify trade documentation. Examples includethe use of through waybills and single invoicesfor all modes. In customs clearance times, thoseof the East Asian economies are quite similar tothose of other developing countries (Table 5.4),but, taken together, developing countries are sig-nificantly slower than developed countries.Another regulatory change—allowing containersto be cleared for tariffs, customs, health, and tax-ation charges at inland locations away from theports—would help to reduce port congestion,but could raise additional security concerns.
• Develop an efficient freight forwarding industry.As noted earlier, third-party logistics is not awell-advanced concept in East Asia. In industrialcountries, almost a third of logistics turnover iscontracted to 3PL providers, but even in severalindustrialized East Asian economies, barely 10percent of trade-related transport services isprovided in this way. In some countries, pro-
gression to the earlier stage of second-partylogistics—in which companies unify their inter-nal transport and warehousing functions andcreate their own internal logistics depart-ments—is still under way.
• Develop effective communications systems. Suchsystems will allow freight forwarders to takeadvantage of the shipping alternatives availableand inform clients about the status and locationof their freight.
Some of the least accessible countries haveimproved the quality and scope of their informa-tion systems (Table 5.5), but few have been able todevelop freight forwarding agencies that perform aswell as those in the more accessible and trade-opencountries. The efficiency of logistics services corre-lates closely with the efficiency of other trade facili-tation procedures. Countries that have poorly inte-grated trade services, such as customs requirementsthat are badly coordinated with those of taxationand health agencies, also tend to have poorly devel-oped logistics services. Evidence from some EastAsian countries, particularly Thailand, suggeststhat the presence of a strong logistics industry canbe effective in bringing about efficiencies in theseother trade facilitation procedures.
Some evidence also suggests that even thosecountries with the least developed logistics systemshave recognized the need to catch up. According toa recent report on logistics in China,9 the develop-ment of hypermarkets and other large retail cus-tomers with significant bargaining power is creat-ing a demand for better logistics services that wasnot obvious even a few years ago. At the same time,the Chinese government is encouraging companiesto outsource their logistics services, and as part ofthe agreement on WTO accession, it is in theprocess of rapidly opening its logistics services toforeign competitors and participants.
Ports and Land Access
The high costs of land access to ports, reinforced bythe effects of production agglomeration, havecaused an excessive concentration of export-relatedactivities in port cities and essentially haverestricted the benefits of trade growth to the areasimmediately surrounding ports. In China, forexample, more than 90 percent of foreign direct
86 East Asia Integrates
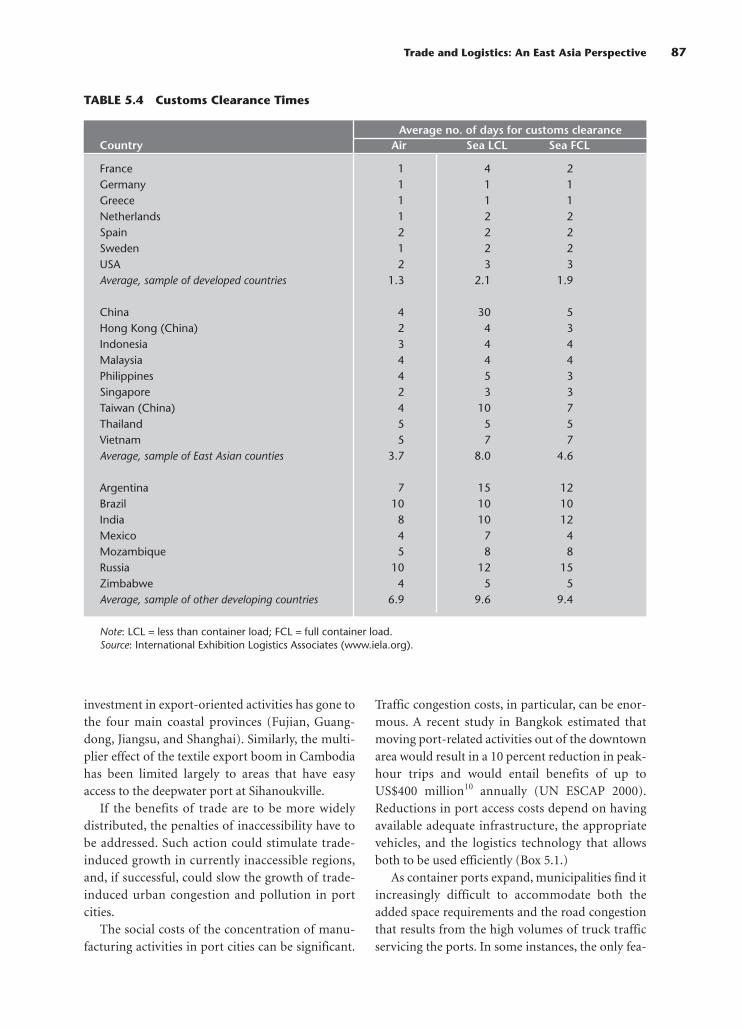
Trade and Logistics: An East Asia Perspective 87
TABLE 5.4 Customs Clearance Times
Average no. of days for customs clearanceCountry Air Sea LCL Sea FCL
France 1 4 2Germany 1 1 1Greece 1 1 1Netherlands 1 2 2Spain 2 2 2Sweden 1 2 2USA 2 3 3Average, sample of developed countries 1.3 2.1 1.9
China 4 30 5Hong Kong (China) 2 4 3Indonesia 3 4 4Malaysia 4 4 4Philippines 4 5 3Singapore 2 3 3Taiwan (China) 4 10 7Thailand 5 5 5Vietnam 5 7 7Average, sample of East Asian counties 3.7 8.0 4.6
Argentina 7 15 12Brazil 10 10 10India 8 10 12Mexico 4 7 4Mozambique 5 8 8Russia 10 12 15Zimbabwe 4 5 5Average, sample of other developing countries 6.9 9.6 9.4
Note: LCL = less than container load; FCL = full container load.Source: International Exhibition Logistics Associates (www.iela.org).
investment in export-oriented activities has gone tothe four main coastal provinces (Fujian, Guang-dong, Jiangsu, and Shanghai). Similarly, the multi-plier effect of the textile export boom in Cambodiahas been limited largely to areas that have easyaccess to the deepwater port at Sihanoukville.
If the benefits of trade are to be more widelydistributed, the penalties of inaccessibility have tobe addressed. Such action could stimulate trade-induced growth in currently inaccessible regions,and, if successful, could slow the growth of trade-induced urban congestion and pollution in portcities.
The social costs of the concentration of manu-facturing activities in port cities can be significant.
Traffic congestion costs, in particular, can be enor-mous. A recent study in Bangkok estimated thatmoving port-related activities out of the downtownarea would result in a 10 percent reduction in peak-hour trips and would entail benefits of up toUS$400 million10 annually (UN ESCAP 2000).Reductions in port access costs depend on havingavailable adequate infrastructure, the appropriatevehicles, and the logistics technology that allowsboth to be used efficiently (Box 5.1.)
As container ports expand, municipalities find itincreasingly difficult to accommodate both theadded space requirements and the road congestionthat results from the high volumes of truck trafficservicing the ports. In some instances, the only fea-
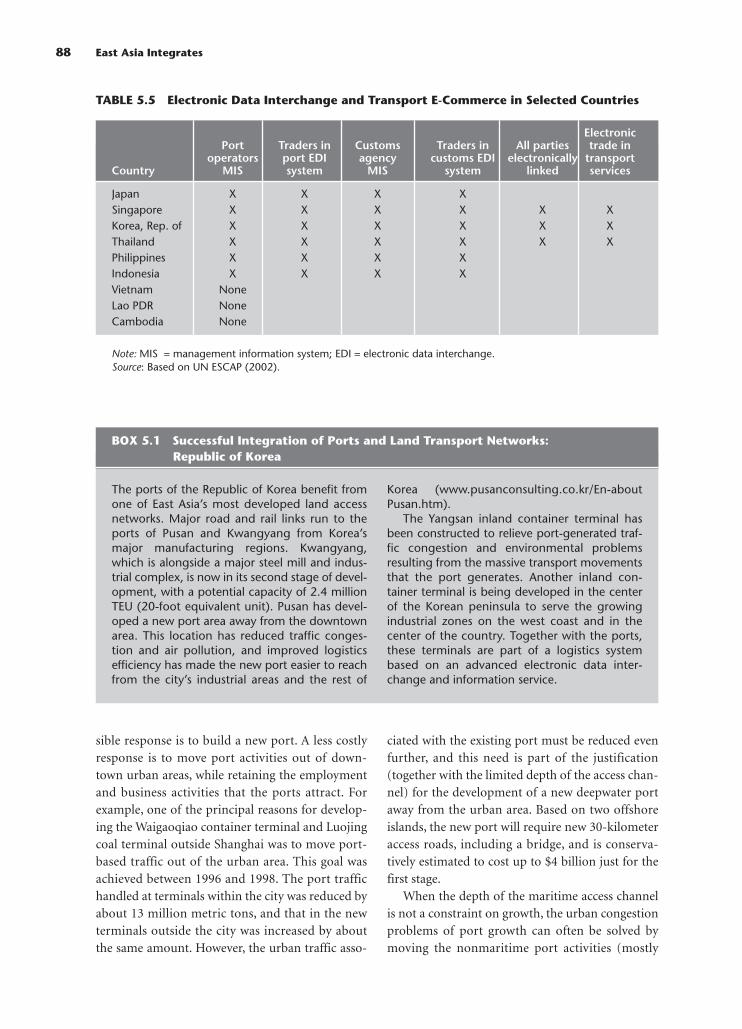
sible response is to build a new port. A less costlyresponse is to move port activities out of down-town urban areas, while retaining the employmentand business activities that the ports attract. Forexample, one of the principal reasons for develop-ing the Waigaoqiao container terminal and Luojingcoal terminal outside Shanghai was to move port-based traffic out of the urban area. This goal wasachieved between 1996 and 1998. The port traffichandled at terminals within the city was reduced byabout 13 million metric tons, and that in the newterminals outside the city was increased by aboutthe same amount. However, the urban traffic asso-
ciated with the existing port must be reduced evenfurther, and this need is part of the justification(together with the limited depth of the access chan-nel) for the development of a new deepwater portaway from the urban area. Based on two offshoreislands, the new port will require new 30-kilometeraccess roads, including a bridge, and is conserva-tively estimated to cost up to $4 billion just for thefirst stage.
When the depth of the maritime access channelis not a constraint on growth, the urban congestionproblems of port growth can often be solved bymoving the nonmaritime port activities (mostly
88 East Asia Integrates
BOX 5.1 Successful Integration of Ports and Land Transport Networks: Republic of Korea
The ports of the Republic of Korea benefit fromone of East Asia’s most developed land accessnetworks. Major road and rail links run to theports of Pusan and Kwangyang from Korea’smajor manufacturing regions. Kwangyang,which is alongside a major steel mill and indus-trial complex, is now in its second stage of devel-opment, with a potential capacity of 2.4 millionTEU (20-foot equivalent unit). Pusan has devel-oped a new port area away from the downtownarea. This location has reduced traffic conges-tion and air pollution, and improved logisticsefficiency has made the new port easier to reachfrom the city’s industrial areas and the rest of
Korea (www.pusanconsulting.co.kr/En-aboutPusan.htm).
The Yangsan inland container terminal hasbeen constructed to relieve port-generated traf-fic congestion and environmental problemsresulting from the massive transport movementsthat the port generates. Another inland con-tainer terminal is being developed in the centerof the Korean peninsula to serve the growingindustrial zones on the west coast and in thecenter of the country. Together with the ports,these terminals are part of a logistics systembased on an advanced electronic data inter-change and information service.
TABLE 5.5 Electronic Data Interchange and Transport E-Commerce in Selected Countries
Electronic Port Traders in Customs Traders in All parties trade in
operators port EDI agency customs EDI electronically transport Country MIS system MIS system linked services
Japan X X X XSingapore X X X X X XKorea, Rep. of X X X X X XThailand X X X X X XPhilippines X X X XIndonesia X X X XVietnam NoneLao PDR NoneCambodia None
Note: MIS = management information system; EDI = electronic data interchange.Source: Based on UN ESCAP (2002).

value-adding production and packaging services)inland, closer to the industries that the port serves,and building rail links to avoid generating extraroad traffic (Rafferty 2003).
Air Freight
Air freight accounts for only about 1 percent of EastAsia’s international trade by volume, but more than35 percent by value. More than for other regions, airfreight is important for East Asia. For one thing, thedistance from the region’s major markets—theUnited States and Europe—makes quick delivery ofsea freight impossible. And, for another, a high pro-portion of the region’s manufactured exports requiretimely delivery. (Because these manufactures havehigh value-to-weight ratios, the ad valorem cost oftheir air transport is comparatively low.)
A ranking of cargo volumes by airport revealsthe importance of air freight to East Asia. Of air-ports outside the United States, those in East Asiatook 10 of the top 30 places for air freight volumein both 2000 and 2001, and accounted for morethan 30 percent of air freight at the top 30 airportsworldwide (Table 5.6).
Good air freight facilities are important inattracting fast-growing, high value added indus-tries. Competition is, therefore, growing betweenairports in the region to act as a hub for majorlogistics companies. The smaller, newer airports
that can offer better services are growing faster thanthe larger ones.
Airlines and traditional freight forwarders bothcompete and cooperate with each other to provideair transport-based freight services. The progress ofair freight forwarding and air freight logistics inHong Kong, Japan, Korea, and Singapore comparesfavorably with that in the United States and Europe.Some countries in the region still depend on a fewmultinational air carriers for efficient air freightlogistics.
Policy Recommendations
Against this background, governments in East Asianeed to take action to improve trade-related logis-tics on several fronts if they are to increase theirtrade competitiveness.
Domestic Integration
For the less open and less accessible group of coun-tries, and for landlocked regions and remoteregions in China, Indonesia, the Philippines, andThailand, the development of more tightly inte-grated domestic markets and logistics systems is ahigh priority. Besides promoting an appropriatemix of modes—roads, waterways, and rail—insti-tutional actions must be taken to extend bettertransport services to remote areas and to establish
Trade and Logistics: An East Asia Perspective 89
TABLE 5.6 Ranking of Major Freight Airports in East Asia, 2001
Amount of Global cargo handled ranking Airport Code (metric tons)
3 Hong Kong (China) HKG 2,099,6055 Tokyo NRT 1,680,9388 Singapore SIN 1,529,930
15 Inchon ICN 1,196,84516 Taipei TPE 1,189,87418 Osaka KIX 871,16119 Bangkok BKK 842,58823 Tokyo HND 725,12427 Seoul SEL 598,62028 Beijing PEK 586,704
Total East Asia 33,210,120Percent of total top 30 34.1
Source: Airports Council International, 2002.
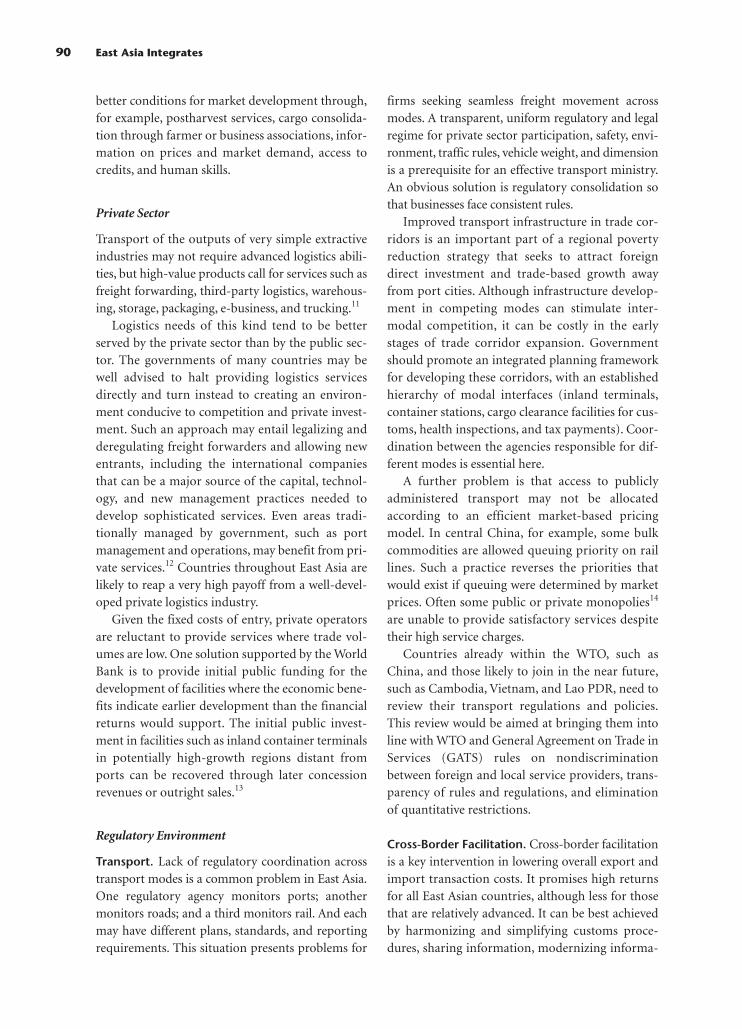
better conditions for market development through,for example, postharvest services, cargo consolida-tion through farmer or business associations, infor-mation on prices and market demand, access tocredits, and human skills.
Private Sector
Transport of the outputs of very simple extractiveindustries may not require advanced logistics abili-ties, but high-value products call for services such asfreight forwarding, third-party logistics, warehous-ing, storage, packaging, e-business, and trucking.11
Logistics needs of this kind tend to be betterserved by the private sector than by the public sec-tor. The governments of many countries may bewell advised to halt providing logistics servicesdirectly and turn instead to creating an environ-ment conducive to competition and private invest-ment. Such an approach may entail legalizing andderegulating freight forwarders and allowing newentrants, including the international companiesthat can be a major source of the capital, technol-ogy, and new management practices needed todevelop sophisticated services. Even areas tradi-tionally managed by government, such as portmanagement and operations, may benefit from pri-vate services.12 Countries throughout East Asia arelikely to reap a very high payoff from a well-devel-oped private logistics industry.
Given the fixed costs of entry, private operatorsare reluctant to provide services where trade vol-umes are low. One solution supported by the WorldBank is to provide initial public funding for thedevelopment of facilities where the economic bene-fits indicate earlier development than the financialreturns would support. The initial public invest-ment in facilities such as inland container terminalsin potentially high-growth regions distant fromports can be recovered through later concessionrevenues or outright sales.13
Regulatory Environment
Transport. Lack of regulatory coordination acrosstransport modes is a common problem in East Asia.One regulatory agency monitors ports; anothermonitors roads; and a third monitors rail. And eachmay have different plans, standards, and reportingrequirements. This situation presents problems for
firms seeking seamless freight movement acrossmodes. A transparent, uniform regulatory and legalregime for private sector participation, safety, envi-ronment, traffic rules, vehicle weight, and dimensionis a prerequisite for an effective transport ministry.An obvious solution is regulatory consolidation sothat businesses face consistent rules.
Improved transport infrastructure in trade cor-ridors is an important part of a regional povertyreduction strategy that seeks to attract foreigndirect investment and trade-based growth awayfrom port cities. Although infrastructure develop-ment in competing modes can stimulate inter-modal competition, it can be costly in the earlystages of trade corridor expansion. Governmentshould promote an integrated planning frameworkfor developing these corridors, with an establishedhierarchy of modal interfaces (inland terminals,container stations, cargo clearance facilities for cus-toms, health inspections, and tax payments). Coor-dination between the agencies responsible for dif-ferent modes is essential here.
A further problem is that access to publiclyadministered transport may not be allocatedaccording to an efficient market-based pricingmodel. In central China, for example, some bulkcommodities are allowed queuing priority on raillines. Such a practice reverses the priorities thatwould exist if queuing were determined by marketprices. Often some public or private monopolies14
are unable to provide satisfactory services despitetheir high service charges.
Countries already within the WTO, such asChina, and those likely to join in the near future,such as Cambodia, Vietnam, and Lao PDR, need toreview their transport regulations and policies.This review would be aimed at bringing them intoline with WTO and General Agreement on Trade inServices (GATS) rules on nondiscriminationbetween foreign and local service providers, trans-parency of rules and regulations, and eliminationof quantitative restrictions.
Cross-Border Facilitation. Cross-border facilitationis a key intervention in lowering overall export andimport transaction costs. It promises high returnsfor all East Asian countries, although less for thosethat are relatively advanced. It can be best achievedby harmonizing and simplifying customs proce-dures, sharing information, modernizing informa-
90 East Asia Integrates

tion and communications technology and customsadministration, and establishing transparent transitrules and postentry compliance audits. Plans forimprovements must take into account the interestsof related public and private communities—includ-ing customs, freight forwarders, shippers, port oper-ators, shipping lines, insurers, and bankers.
Urban Land Use and Management. Urban gov-ernments need to exercise market-responsive landuse policies for locating logistics infrastructure,especially ports. This is perhaps more difficult thanit sounds because of unpriced externalities. Firmsmove production into clusters because there theyenjoy positive productivity externalities—informa-tion spillovers, access to intermediate inputs, andspecialized human capital—but they do not takeinto account the effect that clustering has onalready severe congestion. Government efforts torelieve congestion or relocate facilities must takeinto account the trade-offs between the positiveexternalities (agglomeration economy) and nega-tive externalities (congestion, pollution) of thebusinesses or facility to be displaced, such as a portor container depot. Unfortunately, these externali-ties, especially the positive spillovers, remain diffi-cult to measure.
Security
The September 11, 2001, terrorist attacks on theUnited States heightened the importance of effi-cient and secure trade facilitation in supportingtrade-led growth. The increased transport costsrelated to security have already begun to affecttrade volumes and the competitiveness of ports.According to an estimate by the Organisation forEconomic Co-operation and Development(OECD), trading costs excluding the increasedinventory and other “behind the border” costs haverisen by about 1–3 percent, resulting in a loss ofabout $75 billion in aggregate welfare.
The increased costs and challenges of trade facil-itation will depress the level of trade of countriesthat cannot manage them successfully. All the inter-national agencies involved directly in internationaltrade are helping exporting countries to achievehigher security as expeditiously as possible. Theyare providing funding for the procurement ofequipment, technical assistance in drafting regula-
tions, and training for customs and security staff.The solutions that countries select are likely to varyaccording to country conditions (human skills andresources, technology, quality of facilities), risk pro-files, and types of trade transactions. The WorldCustoms Organization Task Force on Security andTrade Facilitation is expected to develop appropri-ate processes and identify the related needs forcapacity building.
Because security and facilitation are two sides ofthe same coin, an integral approach to supply chainmanagement would be appropriate, although nowthe focus is on limiting the security risks of importsby improving a few discrete points in supply chains(customs). Security initiatives are now targetingcontainers as well as air cargo and passenger move-ments.15 For security initiatives to succeed, the rele-vant technologies and information systems must beshared among government agencies, shippers, andcorporations.
Regional Cooperation
Such sharing is best achieved through a regionaldialogue—a dialogue that is also central to the har-monization of national, regional, and internationalrules and policies related to trade facilitation.Cooperation is especially important in assistinglandlocked countries, such as Mongolia and LaosPDR, and those with long land borders, mostly inthe Mekong River region.
Ongoing regional and subregional initiatives(ASEAN, APEC, Mekong River Commission, andGreater Mekong subregion) provide regular oppor-tunities to cooperate on country-specific invest-ments and reforms to address the regional needs.16
The World Bank’s country-specific programs—andmore specifically the Global Trade Facilitation Part-nership17 among more than 100 international, pub-lic, and private agencies—can also assist countriesthrough investments and technical assistance ontrade facilitation issues, while serving as a majorsource for knowledge sharing in global best prac-tices and capacity building.18
Endnotes
1. Gallup, Sachs, and Mellinger (1999) point out that “core”coastal regions worldwide contain 10 percent of the world’spopulation but contribute 35 percent of the gross worldproduct.
Trade and Logistics: An East Asia Perspective 91

2. The measures of openness are based on those indicated inthe Global Competitiveness Report 2001–2002 (World Eco-nomic Forum 2002). Values for countries not included inthat report have been added using World Bank staff assess-ments of the three indices (see Carruthers and Bajpai2002). All values have been normalized for the countries ofEast Asia. The measures of accessibility are based on thecost of transporting a standard container from the metro-politan region of the largest port to Hamburg, Germany.For inland regions, the land transport cost to the metropol-itan region has been added.
3. For example, in Thailand the inbound rate for a 20-footcontainer is about $380 compared with $168 for an out-bound container.
4. Transport cost incidence is a primary candidate forexplaining why incomes drop as international marketaccess drops, as shown by Wei and Yi (2001) for China andby Frankel and Romer (1999) and Redding and Venables(2002) for the situation worldwide.
5. A manufacturer in Thailand claimed to be closer in timeand cost to the United States than to Vietnam because ofthe poor land access facilities from Thailand to Vietnam.
6. Certainty in delivery also requires that shipments be securefrom theft and pilferage. This problem is likely to be mostserious for products that are of high value but sufficientlyhomogeneous that gray markets exist for resale. Firms’strategies to avoid theft can result in higher transport costsand uncertainty in delivery times. For example, manufac-turers of integrated circuits in the Philippines reducehijacking of shipments by using irregular and thereforecostly transport schedules.
7. See Hummels and Klenow (2001) for cross-sectional com-parisons of small and large economies, and Hillberry andMcDaniel (2002) for an examination of how trade liberal-ization affects trade growth.
8. An assessment of the issues at the country and specific tradeflow levels is provided in country studies undertaken for theWorld Bank in 2002. See Arnold and Villareal (2002);Arnold, Banomyong, and Ritthironk (2002); InfrastructureConsulting Ltd. (2002); International Trade Institute of Sin-gapore (2002); and Nomura Research Institute (2002).
9. See Shaw and Wang (2002). Other articles in this series ofthe McKinsey Quarterly also confirm the growing impor-tance of multimodal transport arrangements.
10. All dollar amounts are current U.S. dollars.11. Domestic providers of such services may not be up to inter-
national standards. For example, because of concerns aboutthe quality of local freight forwarders, Japanese manufac-turers in Vietnam insist on working with freight forwardersthat are joint venture partners with familiar (Japanese)logistics providers. Part of the reason may be a need for thesuperior technology that the foreign logistics providers canoffer, and part may be the long-standing relationshipbetween the manufacturer and logistics provider. Freightforwarders that fail to provide reliable delivery times andcareful handling jeopardize contracts not only in Vietnambut also back in Japan.
12. See Fink, Mattoo, and Neagu (2002) for the Latin Americanexperience with port privatization.
13. This approach is being applied in the China ContainerTransport Project supported by the World Bank.
14. Such as the Philippines Ports Authority, the private ship-ping cartels Vinamarine and Vinalines in Vietnam, and thetraders’ cartel for freight forwarding in Lao PDR.
15. See Reddy (2002). Traditional security methods result inprocesses that increase the cycle time for activities, such asqueuing to go through metal detectors and physical inspec-tions. Reddy argues that the preferred approach from boththe security and efficiency perspectives is for goods and rawmaterials to be secured after inspection at the point of ori-gin. If this approach can be implemented for the 1 percentof shippers that account for more than 60 percent of allcontainer movements at the point of origin, then nationalsecurity agencies can focus on a more thorough examina-tion of the remaining 40 percent of containers. The overallresult should be to minimize the impact on the flow ofinternational trade. A key to this approach is the security ofcontainers once they have left their country of origin. Sometechnologies already available allow a container to betracked and monitored at all times between its origin anddestination.
16. Including for cross-border transport links, improved cus-toms processing, and harmonization of rules dealing withcustoms, vehicle standards, border crossings by vehiclesregistered in neighboring or third countries, movement ofhazardous material, insurance coverage, safety and treat-ment of transit traffic.
17. The Global Facilitation Partnership for Transport and Trade(GFP) seeks to pull together all interested parties, publicand private, national and international, that want to helpachieve significant improvements in transport and tradefacilitation in World Bank member countries. The partnerswill together agree to design and undertake specific pro-grams toward meeting this objective, making use of theirrespective comparative advantages in the subject matter in acoordinated fashion (http://wbln0018.worldbank.org/twu/gfp.nsf/).
18. For example, by means of distance learning and toolkits oncustoms modernization, supply chain management, andport modernization.
References
The word processed describes informally reproduced works thatmay not be commonly available through libraries.
Arnold, John. 2003. “Logistics Development and Trade Facilita-tion in Lao PDR.” Working Paper No. 3, East Asia TransportUnit. World Bank, Washington, D.C.
Arnold, John, and Theresa Villareal. 2002. “Philippine LogisticsStudy.” Study prepared for the World Bank, Washington, D.C.
Arnold, John, Ruth Banomyong, and Nipawis Ritthironk. 2002.“Logistics Development and Trade Facilitation in Lao PDR.”Study prepared for the World Bank, Washington, D.C.
Banomyong, R., and A. K. C. Beresford. 2000. “Multi-ModalTransport Systems: The Case of the Laotian Garment Indus-try.” Trois-Rivieres, France. Processed.
Cambodia Ministry of Commerce. 2001. “Integration and Com-petitiveness Study—Part B.” Pilot study prepared underIntegrated Framework for Trade-Related Technical Assis-tance.
Carruthers, Robin, and Jitendra N. Bajpai. 2002. “Trends inTrade and Logistics: An East Asian Perspective.” WorkingPaper No. 2, Transport Sector Unit. World Bank, Washing-ton, D.C.
Engel, Charles, and John. H. Rogers. 1996. “How Wide Is theBorder?” American Economic Review 86 (5): 1112–25.
92 East Asia Integrates

Evenett, Simon J., and Anthony J. Venables. 2002. “The Geo-graphic Spread of Trade: Evidence from Twenty-Four Devel-oping Countries.” European Research Workshop in Interna-tional Trade (ERWIT), Munich, June 14, 2002.
Feenstra, Robert C., Dorsati Madani, Tzu-Han Yang, and Chi-Yuan Liang. 1999. “Testing Endogenous Growth in SouthKorea and Taiwan.” Journal of Development Economics 60(2): 317–41.
Fink, Carsten, Aaditya Mattoo, and Ileana Cristina Neagu. 2002.“Trade in International Maritime Services: How Much DoesPolicy Matter?” World Bank Economic Review 16: .81–108.
Frankel, Jeffrey, and David Romer. 1999. “Does Trade CauseGrowth?” American Economic Review 89 (3): 1–16.
Frenkel, E. G. 1998. “China’s Maritime Developments.” MaritimePolicy Management 25 (3): 235–49.
Gallup, John Luke, and Jeffrey Sachs with Andrew D. Mellinger.1999. “Geography and Economic Growth.” InternationalRegional Science Review 22 (2): 179–232.
Gausch, Luis J., and J. Kogan. 2001. “Inventory in DevelopingCountries: Level and Determinants, a Red Flag on Competi-tiveness and Growth.” World Bank, Washington, D.C.
Hillberry, Russell, and Christine McDaniel. 2002. “A Decompo-sition of North American Trade Growth since NAFTA.”International Economic Review (May/June): 1–6.
Hummels, David. 1999. “Towards a Geography of Trade Costs.”Graduate School of Business, University of Chicago. Processed.
Hummels, David, and Peter Klenow. 2001. “The Variety andQuality of a Nation’s Trade.” NBER Working Paper No. 8712.National Bureau of Economic Research, Cambridge, Mass.
Infrastructure Consulting Ltd. 2002.“Mongolia Trade Competitive-ness.” Study prepared for the World Bank, Washington, D.C.
International Trade Institute of Singapore. 2002. “LogisticsDevelopment, Trade Facilitation and Its Impact on PovertyReduction in China’s Lagging Provinces.” Study prepared forthe World Bank, Washington, D.C.
Limao, Nuno and Anthony Venables. 2001. “Infrastructure, Geo-graphical Disadvantage, Transport Costs and Trade.” WorldBank Economic Review 15: 51–479.
Nomura Research Institute. 2002. “Vietnam Logistics Develop-ment and Trade Facilitation.” Study prepared for the WorldBank, Washington, D.C.
Policy Research Corporation. 2003. “East Asia Transport andLogistics Strategy: Measuring Progress.” Working PaperNo. 9, East Asia Transport Unit. World Bank, Washington,D.C.
Rafferty, Laura. 2003. “East Asia Ports in their Urban Context.”Working Paper No. 7, East Asia Transport Unit. World Bank,Washington, D.C.
Redding, Stephen, and Anthony, J. Venables. 2002. “EconomicGeography and International Inequality.” Discussion PaperNo. 2568. Centre for Economic and Policy Research (CEPR),London.
Reddy, Ram. 2002. “Friction over Security Gaps.” October 8.Available at www.intelligententerprise.com/.
Romer, Paul. 1994. “New Goods, Old Theory, and the WelfareCosts of Trade Restrictions.” Journal of Development Eco-nomics 43: 5–38.
Shaw, Stephen, and Feng Wang. 2002.“Moving Goods in China.”McKinsey Quarterly. No. 2.
UN ESCAP (United Nations Economic and Social Commissionfor Asia and the Pacific). 2000. “State of the Environment inAsia and the Pacific.” ST/ESCAP/2087. Bangkok.
———. 2002. “Review of Developments in Transport and Com-munications in the ESCAP Region, 1996–2001.” Bangkok.
Vitasa, H.R., and N. Seprato. 1999. “Maritime Sector Develop-ments in ASEAN Countries.” Paper presented at UnitedNations Development Programme (UNDP) Conference onTrade and Development, Jakarta, October.
Wei, Shang-Jin, and Yi Wu. 2001. “Globalization and Inequal-ity: Evidence from China.” NBER Working Paper No.8611. National Bureau of Economic Research, Cam-bridge, Mass.
Wilson, John S., Catherine Mann, Yuen Pau Woo, Nizar Assanie,and Inbom Choi. 2002. “Trade Facilitation: A DevelopmentPerspective in the Asia Pacific Region.” Working paper pre-sented to APEC (Asia-Pacific Economic Cooperation).World Bank, Washington, D.C.
World Bank. 1994. World Development Report 1994: Infrastruc-ture for Development. Washington, D.C.: Oxford UniversityPress and World Bank.
World Economic Forum. 2002. Global Competitiveness Report2001–2002. Geneva.
Trade and Logistics: An East Asia Perspective 93


In recent years, the increasingly intensive use ofknowledge and innovation in international tradeflows and foreign direct investment has brought theissue of intellectual property rights (IPRs) into themainstream in global trade discussions.1 The debateleading up to the Agreement on Trade-RelatedAspects of Intellectual Property Rights (TRIPS),adopted by Members of the World Trade Organiza-tion (WTO) in 1995, was a contentious one betweendeveloped countries, which were lobbying forstronger intellectual property rights, and developingcountries, which largely considered such across-the-board upgrading to be premature, given their posi-tions as users rather than producers of technologicalinnovations. Subsequent and ongoing negotiationsat the global and bilateral levels are attempting toaddress some of these tensions.
Intellectual property rights are a form of domes-tic business regulation that sets background incen-
95
6
Protecting IndustrialInventions, Authors’
Rights, and TraditionalKnowledge: Relevance,
Lessons, andUnresolved Issues
Manjula LuthriaKeith E. Maskus
tives for innovation and the diffusion of new infor-mation into consumption and competition. Theinterests of innovative businesses need to be deli-cately balanced with those of the users of newproducts and technologies.2 It is possible to estab-lish intellectual property standards that are tooweak to support local innovation and productintroduction, but it is also possible to adopt stan-dards that are excessively protectionist, limiting theaccess that consumers and rivals have to new tech-nologies. Both of these problems can limit a coun-try’s long-term economic growth prospects. It isevident that the interests of countries that are pri-marily technology importers and adapters coulddiffer significantly from those of the more industri-alized developing economies, which are movingrapidly into technology development and exports.
To assist new adopters of IPR protection, thischapter discusses national case studies of patent
This chapter draws on background reports prepared by Jaeyong Song, Yonshei University, Seoul, Korea, and TimothySwanson, University College, London, UK. The authors gratefully acknowledge helpful comments from Myrna Austriaand other participants in the seminar held at the Institute for Southeast Asian Studies of the National University of Sin-gapore and in the Fourth Asia Development Forum in Seoul as well as seminars held at the Thailand DevelopmentResearch Institute in Bangkok and the World Bank office in Jakarta.
and copyright protection and also looks closely atthe issues involved in the protection of traditionalknowledge. The idea is to examine how these threeforms of intellectual property protection are beingimplemented in countries of widely different devel-opment levels and technological capacities. Wethen attempt to draw basic conclusions about thedevelopment aspects of different forms of IPRsacross countries.
The first case study is retrospective: it considersthe impacts of past patent reforms in the Republicof Korea, an advanced developing economy. Patentshave been studied in the literature on the econom-ics of innovation for nearly four decades, and therepercussions of patent protection are generallywell understood. Patents are usually of relevancefor countries importing or creating cutting-edgetechnologies and innovations, and they are becom-ing relevant more broadly because the TRIPs agree-ment mandates stronger patent protection in all itssignatory nations.
The second case study is contemporary: it sum-marizes the results of a survey of copyright-sensi-tive firms in Indonesia, a lower-income developingcountry that is in the process of upgrading its pro-tection. Copyrights have been studied much lessthan patents, but they have recently taken centerstage as economic incentives in areas such as soft-ware and the entertainment industries.3 Copyrightsaffecting the software, publishing, film, and musicindustries are relevant to a broad range of middle-to low-income nations.
The final case study is prospective: it analyzesthe difficulties poor countries will face in develop-ing appropriate regimes for protecting traditionalknowledge. This knowledge is concentrated inlower-income nations, and its protection is gener-ally expected to have direct effects on povertyreduction.4 As some industrial countries attemptto patent the products they have developed basedon traditional knowledge, developing nations per-ceive themselves as doubly disadvantaged—theirindigenous resources are being used without com-pensation and the resulting products are coming tothem at a higher price because of the associatedpatents. Protection of traditional knowledge is arelatively new issue, and the policy dialogue wouldbenefit from more analytical work to improveunderstanding of the conceptual issues underlyingthis debate.
Did Korea’s Stronger Patent LawsContribute to Its Success in Foreign Patenting?
Governments often strengthen IPRs in the hopethat by establishing exclusive rights to use and sellnewly developed technologies they will promoteinvestments in knowledge creation and businessinnovation, including by foreign investors who willintroduce advanced technologies. A rise in innova-tive activity, or in the amount of productive researchand development (R&D), signals an acceleration oftechnological change and a positive outlook for pro-ductivity growth. If increases in patenting, and inthe innovation that gives rise to them, can be attrib-uted entirely to changes in IPR laws, there areimportant implications for the design of public pol-icy. Specifically, policymakers need to better under-stand the complementary roles of broader publicpolicies that promote innovation and of private cor-porate sector strategies in facilitating technologicalcatch-up. To shed light on these issues, we examinethe determinants of Korea’s dramatic success inpatenting in the United States.
The Republic of Korea is a premier example of anation that has achieved rapid structural transfor-mation and industrialization in recent decades. Assuch, it illustrates an economy that was poised toachieve dynamic gains from stronger protection atthe time of its major policy regime shift. In a seriesof new laws enacted from 1985 to 1992, the govern-ment expanded patent coverage, increased thescope of claims, lengthened the duration of protec-tion, and made other changes. Although there wassignificant opposition to these policies, whichseemed to many to have been imposed externallyvia pressure from the United States, some industrialconcerns had already established competence inresearch and product development.5 Thus Korea isa good candidate for a case study of a country withan industrial structure and resource base thatwould be able to react positively overall to strongerdomestic patent protection. Our interest is in ascer-taining whether the patent regime change itselfmight be responsible for rising rates of innovationas measured by Korean patent applications in amajor foreign market, the United States.
Before beginning this analysis, we note thatother factors entered into Korea’s ability to expandits innovation stream. For example, an important
96 East Asia Integrates

element was Korea’s success in educating and train-ing rapidly rising numbers of technical personnelfor deployment in industry during this period.Between 1980 and 1996, the number of researchersper million inhabitants in the country rose from484 to 2,193.6 Such factors are discussed further inthe next section.
Factors Contributing to the Rise in Korean Patenting
The number of U.S. patents filed by Korean firmshas risen dramatically in recent years (Figure 6.1).Patenting activity might rise because of either anincrease in the propensity to patent or an increase inthe ability to patent. The former could be framed asthe demand side view and the latter as the supplyside view. Four factors might explain Korean patent-ing success. On the demand side, the factors are
• Fertile technology pull. In this view, patenting wasspurred by a global surge in discovery and inno-vation in emerging, “patent-intensive” industriessuch as semiconductors and biotechnology.7
• Friendly court pull. By making courts moreprone to grant and enforce patents, the strongerintellectual property protection regime adopted
by Korea may have increased the propensity ofinventors to seek patent protection.
The supply side factors are
• Industrial upgrading push. In this view, upgrad-ing of Korean industry shifted the output mix tomore patent-prone, high-technology industries.
• Corporate management push. Large Korean busi-ness groups (chaebols) placed ever more empha-sis on innovative capabilities, and they improvedR&D management and productivity. This viewpostulates that changes in the corporate man-agement of R&D have contributed to increasedpatenting activity.
The rest of this section examines each factor inturn. The analysis relies on aggregate data on inter-national patent applications by technology classand assignee of patents in the United States; patentcitation data of Korean firms; and aggregate mea-sures of research effort. We also use informationfrom in-depth, firm-level interviews.
Fertile Technology Pull. If a surge in innovation isdriven by breakthroughs in specific technologies,we should expect to see an uneven increase in
Protecting Industrial Inventions, Authors’ Rights, and Traditional Knowledge 97
0
500
1,000
1,500
2,000
2,500
3,000
3,500
4,000
1978 1980 1982 1984 1986 1988 1990 1992 1994 1996 1998
Patents
Korea Taiwan India Brazil Singapore
FIGURE 6.1 Comparison of Patenting Trends, Republic of Korea and MajorDeveloping Countries, 1978–99(Registration counts in U.S. Patent Office)
Source: U.S. Patent Office.

patenting across technologies. When the techno-logical revolution is more widespread, we shouldexpect a general increase in patenting activityworldwide. Korean semiconductor patents, in par-ticular, show a growth pattern similar to the generalincrease in patenting activities in the semiconduc-tor industry worldwide (Figure 6.2).
Is Korea simply enjoying the benefits of a world-wide technology explosion in semiconductors? Acomparison with other industrial and industrializ-ing countries suggests instead that Korea is an out-lier (Figure 6.3).
Pair-wise t-tests support this conclusion, show-ing that Korea’s semiconductor patents have prolif-
98 East Asia Integrates
0
2,000
4,000
6,000
8,000
10,000
12,000
14,000
16,000
18,000
1976 1978 1980 1982 1984 1986 1988 1990 1992 1994 1996 1998
World
0
100
200
300
400
500
600
700
800
900
1,000
Korea
World Korea
FIGURE 6.2 Comparison of Korean Semiconductor Patents with WorldwideSemiconductor Patents, 1976–99(Registration counts in U.S. Patent Office)
Source: U.S. Patent Office.
0
100
200
300
400
500
600
700
800
900
1,000
1976 1978 1980 1982 1984 1986 1988 1990 1992 1994 1996 1998
Patents
Korea United Kingdom France Germany
FIGURE 6.3 Comparison of Korean Semiconductor Patents with Semiconductor Patents of Major Advanced Countries, 1976–99(Registration counts in U.S. Patent Office)
Source: I.S. Patent Office.

erated much faster than those of advanced coun-tries such as Germany, Japan, and the United States.However, there is no statistically significant differ-ence between the growth rates of semiconductorpatents in Korea and Taiwan (China).8
Friendly Court Pull. What was the role of intellec-tual property protection regimes in patenting activ-ities at home and abroad? We examine importantchanges in IPR protection within Korea to under-stand whether it increased access to foreign knowl-edge at home (through foreign patents) and pro-vided a testing ground for domestic innovatorsbefore they attempted patenting abroad. If Koreancourts become more patent-friendly, both foreignand domestic firms should find patenting in Koreaincreasingly attractive, and thus patent registrationdata should be relatively uniform across both for-eign and native residents.
Three major changes have affected Korean IPRssince the 1970s:9
• 1980–82: Revision of the patent law in 1980 incompliance with the Paris Convention for theProtection of Industrial Property and revision ofthe patent law in 1982 in compliance with thePatent Cooperation Treaty
• 1986: Revision of the patent law to introducesubstance (product) patents for pharmaceuticaland chemical materials
• 1995–97: Revision of the patent law in 1995 incompliance with TRIPs as well as to reform theappeals/trials system. The patent law was revisedagain in 1997 to introduce opposition to thegranting of patents after registration.
Trends in foreign and total patent applicationsin Korea seem to support the view that IPR changeshave spurred increases in patenting. Foreign patentapplications in Korea had two major inflectionpoints in the 1980s. The first jump took place in1983 just after the major changes in Korean IPRs in1980–82. The second jump occurred in 1986–87,just after the introduction of substance (product)patent eligibility for pharmaceuticals and chemi-cals. In the 1980s, when the major IPR changeswere made in Korea, patent applications by foreign-ers rose faster than those by local residents,although patent applications by the latter alsoincreased steadily. Paired t-tests confirm that
between 1983 and 1991 Korea’s patent growth ratewas significantly faster than that of either Japan orGermany.10
Industrial Upgrading Push. Did improvements inKorean industry shift the output mix to morepatent-intensive industries? If so, the industrialcomposition of Korean patents in both the UnitedStates and Korea should more closely match theindustrial composition of Korean exports to theUnited States than the industrial composition ofU.S. patents at large. Analysis shows that the indus-trial composition of Korean patents in the UnitedStates correlates very highly with that of Koreanexports but not with that of overall U.S. patents.This finding strongly suggests that Korean patent-ing in the United States has been influenced moreby Korea’s industrial upgrading than by specificindustry-level propensities for patenting.11
The highly significant positive correlationbetween patenting and exporting suggests thatindustries that develop strong innovative capabili-ties (reflected in subsequent patenting) tend toachieve strong revealed comparative advantagesand thereby to export more. At the same time,export-driven industries tend to invest more ininnovative R&D activities and file for patentsabroad more aggressively, both to build and main-tain their global competitiveness and to protecttheir newly developed technologies and products intheir main export markets. Thus export-drivenindustrial upgrading and patenting through build-ing innovative capabilities seem to be mutuallyreinforcing trends, even though we cannot infercause and effect here.
Corporate Management Push. Increases inpatenting activity may have been caused byincreases in R&D and its productivity. To test thisproposition, we compared the R&D productivity ofKorean firms with that of selected advanced coun-tries, using the number of U.S. patents per US$1billion12 spent by each country on R&D. Weallowed for a five-year time lag between R&Dinvestments and patent registrations.13 Researchproductivity was lower in Korea than in Japan andthe United States, but substantially higher than inGermany, the United Kingdom, or France (Table6.1). U.S. firms have a clear home advantage inpatenting in the United States, and the other four
Protecting Industrial Inventions, Authors’ Rights, and Traditional Knowledge 99

countries account for about 70 percent of total U.S.patents of foreign origin. Thus Korea’s researchproductivity, measured by U.S. patent counts peramount of R&D expenditure, seems to be the sec-ond highest in the world, just behind Japan’s.14
Private corporations, particularly the five largestchaebols, accounted for most of the Korean patentsgranted in the United States in the 1990s.15 Theincreased productivity of R&D in Korea has essen-tially been driven by the good R&D managementand productivity of the five largest chaebols, espe-cially the Samsung Group. The largest chaebolsincreased their R&D expenditures dramatically inthe 1980s, and in that decade Korea’s investment inprivate sector R&D per unit of gross domesticinvestment was higher than that of any other coun-try.16 In 2000 the four largest chaebols—Samsung,LG, Hyundai, and SK—spent 4.731 trillion won(about $4 billion) on R&D, and in 2001 their R&Dspending continued to increase, even in the wake ofthe global recession.17
Over time, R&D investments have become moreconcentrated in the top 20 companies. According tothe Korean Ministry of Science and Technology, thetop 20 companies in Korea (all industries)accounted for 49.8 percent of R&D spending in1992 and 51.7 percent in 1993, and that percentageclimbed steadily to reach 56.5 percent in 1996 and65.8 percent in 1998. The top five corporatespenders on R&D accounted for 31 percent ofKorea’s R&D spending in 1993. In manufacturing,Korea’s top 20 spenders on R&D undertook 64 per-cent of research spending in 1996. This concentra-tion is significantly higher than comparable figuresfor the United States, at 43 percent, and Japan, at 44percent (Korea Ministry of Science and Technol-ogy, 1998).
In 1997 the private sector accounted for 77 per-cent of Korea’s R&D expenditures, and since then,private corporations’ share of R&D expenditureshas continued to rise. In 2000 they increased theirR&D expenditures by 20 percent, while governmentresearch institutes and universities increased theirsby only 9 percent and 3 percent, respectively. PrivateR&D laboratories proliferated, especially in the late1990s, as the government’s policy of nurturinghigh-technology start-up firms began to pay off.18
The chaebols were also able to hire the best R&Dresearchers. After they began investing heavily inthe high-tech industries, they aggressively sought tolure experienced ethnic Korean engineers frommajor companies and universities abroad, espe-cially in the United States (Song, Almeida, and Wu2002). The returned engineers played an importantrole in speeding up the learning process of Koreancompanies and enhancing the productivity of theirresearch. Koreans residing abroad also served inR&D posts for Korean companies and as coun-selors to the Korean government in helping toshape the direction of policy support in Korea.
Technology Trajectory
How do Korea’s firms compare with the world’sleaders in the technology fields in which Korea haslarge numbers of patents? And why has Korea’s pri-vate sector been so successful in one fast-growingtechnology field, semiconductors, but not inanother, biotechnology, where world patenting isrising dramatically?
Innovation Performance: Korean Firms andWorldwide Leaders. All new claims for patentingmust contain a reference to a previous invention on
100 East Asia Integrates
TABLE 6.1 Research Productivity of Selected Countries
U.S. patent counts R&D expenditures U.S. patent count/in 1999 (billions of 1994 US$) R&D expenditures
Korea, Rep. of 3,529 12.8 275.7USA 75,014 169.3 443.1Japan 32,666 75.1 435.0Germany 8,121 37.3 217.7France 3,150 26.5 118.9UK 2,351 21.7 108.3
Sources: Patent counts from our U.S. patent database; R&D expenditures from OECD (1999).
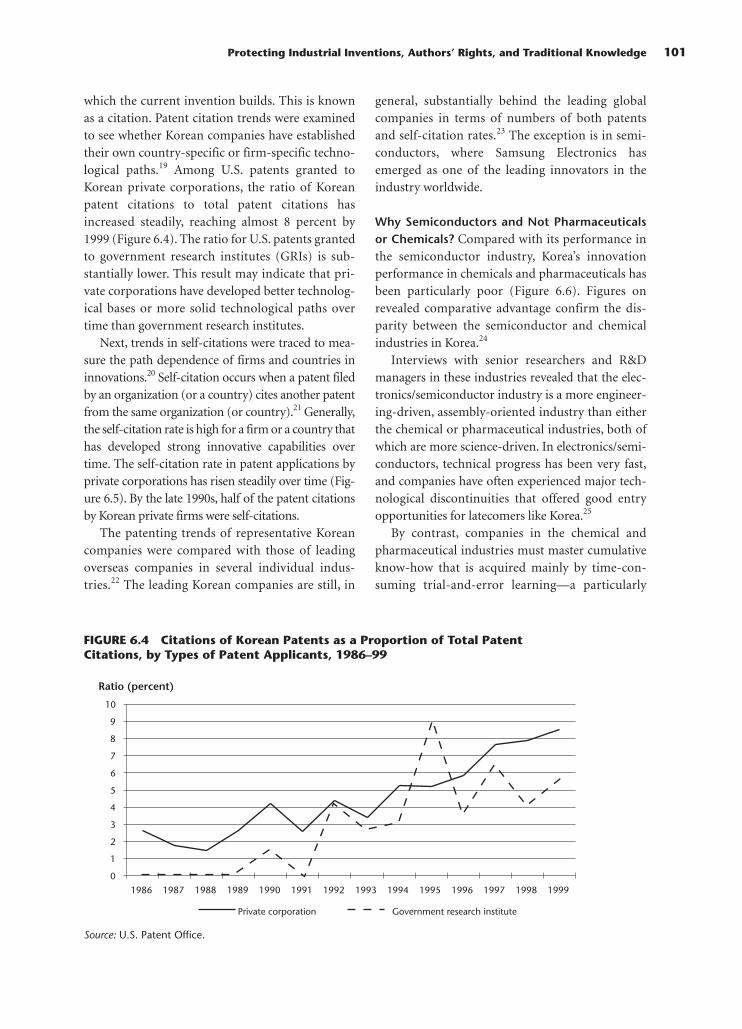
which the current invention builds. This is knownas a citation. Patent citation trends were examinedto see whether Korean companies have establishedtheir own country-specific or firm-specific techno-logical paths.19 Among U.S. patents granted toKorean private corporations, the ratio of Koreanpatent citations to total patent citations hasincreased steadily, reaching almost 8 percent by1999 (Figure 6.4). The ratio for U.S. patents grantedto government research institutes (GRIs) is sub-stantially lower. This result may indicate that pri-vate corporations have developed better technolog-ical bases or more solid technological paths overtime than government research institutes.
Next, trends in self-citations were traced to mea-sure the path dependence of firms and countries ininnovations.20 Self-citation occurs when a patent filedby an organization (or a country) cites another patentfrom the same organization (or country).21 Generally,the self-citation rate is high for a firm or a country thathas developed strong innovative capabilities overtime. The self-citation rate in patent applications byprivate corporations has risen steadily over time (Fig-ure 6.5). By the late 1990s, half of the patent citationsby Korean private firms were self-citations.
The patenting trends of representative Koreancompanies were compared with those of leadingoverseas companies in several individual indus-tries.22 The leading Korean companies are still, in
general, substantially behind the leading globalcompanies in terms of numbers of both patentsand self-citation rates.23 The exception is in semi-conductors, where Samsung Electronics hasemerged as one of the leading innovators in theindustry worldwide.
Why Semiconductors and Not Pharmaceuticalsor Chemicals? Compared with its performance inthe semiconductor industry, Korea’s innovationperformance in chemicals and pharmaceuticals hasbeen particularly poor (Figure 6.6). Figures onrevealed comparative advantage confirm the dis-parity between the semiconductor and chemicalindustries in Korea.24
Interviews with senior researchers and R&Dmanagers in these industries revealed that the elec-tronics/semiconductor industry is a more engineer-ing-driven, assembly-oriented industry than eitherthe chemical or pharmaceutical industries, both ofwhich are more science-driven. In electronics/semi-conductors, technical progress has been very fast,and companies have often experienced major tech-nological discontinuities that offered good entryopportunities for latecomers like Korea.25
By contrast, companies in the chemical andpharmaceutical industries must master cumulativeknow-how that is acquired mainly by time-con-suming trial-and-error learning—a particularly
Protecting Industrial Inventions, Authors’ Rights, and Traditional Knowledge 101
0
1
2
3
4
5
6
7
8
9
10
1986 1987 1988 1989 1990 1991 1992 1993 1994 1995 1996 1997 1998 1999
Ratio (percent)
Private corporation Government research institute
FIGURE 6.4 Citations of Korean Patents as a Proportion of Total PatentCitations, by Types of Patent Applicants, 1986–99
Source: U.S. Patent Office.

slow process for a country with a relatively shortperiod of industrial experience. Even in firms thatare industry leaders, new drugs take several years todevelop, entail huge costs, and come with a highchance of failure.26 And—given the heavily regu-lated nature of the drug approval and distributionprocesses—even if Korean companies developpotentially valuable drugs or new chemical entities,they must rely on the multinational pharmaceutical
giants for global clinical trials, drug approvals, andworldwide distribution.
Korea’s government and companies placed theirbets on electronics and information technology,which they perceived as easier industries in which tocatch up technologically. As a matter of industrialpolicy, both the investments and the number ofresearchers in the chemical, pharmaceutical, andbiotechnology industries have been small compared
102 East Asia Integrates
0
1
2
3
4
5
619
80
1981
1982
1983
1984
1985
1986
1987
1988
1989
1990
1991
1992
1993
1994
1995
1996
1997
1998
1999
Ratio (percent)
FIGURE 6.5 Self-Citation Rates of Korean Private Corporations, 1980–99
Source: U.S. Patent Office.
0
500
1,000
1,500
2,000
2,500
79 80 81 82 83 84 85 86 87 88 89 90 91 92 93 94 95 96 97 98 99
Year
Patents
Chemical Electronics Machinery
Semiconductor Pharmaceutical Biotechnology
FIGURE 6.6 Korean Patents Granted in the United States, Selected Industries, 1981–99
Source: U.S. Patent Office.

with those in the electronics/semiconductor indus-try.27 Historical industrial policy in Japan and Koreahave favored engineering-based industries asopposed to science-based ones, presumably becauseof the greater uncertainties associated with the lattertype of research. An additional factor may be thatKorea’s close proximity to and trade relationshipswith Japan fostered the expansion of Korea’s elec-tronics sectors through the use of Japan’s OEM(original equipment manufacturer) technologies.
Conclusions
Korea’s success in innovation has required muchmore than a tightening of intellectual propertyrights. Industrial upgrading, exports, a big push inR&D from the chaebols, and selective targeting ofthe electronics/semiconductor industry have allplayed a role.
Korean firms have become much more innova-tive in the short span of a decade, but the self-cita-tion patterns of patents registered by Korean firmsreveal that most have yet to attain the status ofglobal leaders in technology. The focus thus far inKorea has been on inventing processes and not ondeveloping generic technologies. As the innovationprocess becomes more sophisticated, it maybecome more difficult for Korea to compete suc-cessfully in broader-based inventions. Thus thenext stage of its R&D effort will likely have to focuson inventing standard-setting technologies that canearn substantial royalties in international markets.
To comply with the TRIPs agreement, manycountries will have to introduce stronger patentprotection. Given Korea’s experience, other coun-tries wishing to boost innovative activity amongtheir private firms should not expect too muchfrom simply adopting a new patent regime, andthey may wish to design packages of complemen-tary “behind-the-border” policies. Korea has used avariety of instruments for this purpose, many ofwhich could be emulated by developing countries.
Will Stronger Copyright ProtectionEncourage the Development ofCopyright-Sensitive Businesses inIndonesia?
This section examines the effects of copyright lawon business development in Indonesia. Using data
from field interviews and surveys of copyright-sen-sitive firms, we draw some general lessons for thedesign of copyright policy.28
From the standpoint of economic development,the main reasons for a developing country to adoptand enforce stronger copyright laws are to encour-age creative activity by local artists and firms and tosupport the transformation of that activity intoproducts for the domestic and export markets.Stronger copyright regimes can generate significantincome streams for creative people and firms. Yet atthe same time these new rights can be expected toraise the prices of copyrighted goods by reducingthe supply of pirated versions. The higher priceswill hurt consumers, although they benefit fromhaving higher-quality products and support ser-vices on the market. Stronger copyright regimesalso may also hinder the progress of education andscientific and technical advance. Copyrightstrengthening will likely cut the sales of imitationproducts over time, and, to the extent that imitatorsand their employees are domestic, the impact maybe higher unemployment and adjustment costs inthe labor market.
To the extent that workers in the pirating firmsare poor, stronger copyrights can worsen poverty,at least in the short term. In many developingnations, fear of the short-term effects of strongercopyright laws on employment and prices is wide-spread. For stronger copyrights to reduce poverty,they must open new economic opportunities forpoor artists and innovators, including those in thesoftware, film, music, and print publishing indus-tries, to develop, record, and sell their products.Furthermore, mechanisms must be in place toensure that these artists and innovators realizehigher incomes from the commercialization oftheir works.
On this subject, Indonesia is an interestingcountry to study for two reasons. First, the citizensof this lower-income economy may have strongpreferences for unimpeded abilities to purchaseunauthorized copies of software and entertainmentproducts. Second, Indonesia has a wealth of cul-tural interests, particularly in music, and a growingbase of intermediate skills. Thus considerable scopeexists for developing local copyright sectors, whichwould prefer somewhat stronger protection. A con-flict may therefore exist in perceived interests, rais-ing interesting policy trade-offs.
Protecting Industrial Inventions, Authors’ Rights, and Traditional Knowledge 103

Legal Structure and Enforcement
On paper, Indonesia has a strong copyright regime,and one Indonesian official has declared that, of thecountries in Southeast Asia, Indonesia has thestrongest degree of compliance with the WTOTRIPs agreement. Indeed, Indonesia’s 1997 copy-right law was virtually in compliance with thatagreement. It was replaced by a new copyright lawin early 2003, which established a regime of neigh-boring rights (consistent with the Rome Conven-tion) and significantly increased the civil and crim-inal penalties for infringement.29
As might be expected, the gap between legisla-tion and actual protection is significant, becauseIndonesia’s capacity to enforce the copyright law isrelatively limited for several reasons:
• The piracy, largely of recorded movies andmusic, is extensive. The incentives to copy anddistribute these and similar goods are enor-mous, and piracy has become such a significantindustry that even a well-funded enforcementagency would find it difficult to make much of adent in its scope.
• Funding for the police is extremely low. Accord-ing to one police official in Jakarta, his depart-ment’s budget for copyright enforcement isabout $200 per action, but each case costs per-haps $1,000–$1,500. The police therefore acceptpayments from complainants (for example,music recording companies) to defray theircosts. This practice limits the incentives for legit-imate complaints and is questionable from thestandpoint of honest and efficient enforcement.
• Very few customs authorities and police person-nel work on IPR issues, because these officialsmay have higher priorities. The copyright officeitself devotes some effort to making raids andraising awareness, but it is seriously under-staffed. And, like many developing countries,Indonesia has far fewer qualified judges, prose-cutors, and IPR lawyers than it needs for effec-tive enforcement. Computerized systems are vir-tually nonexistent.
• Centralized authorities in Jakarta and Bandungfind it impossible to undertake enforcementactivities in Indonesia’s widely flung urban andrural areas and coastlines. They rely on localgovernments to manage the problem, and those
governments may have other priorities or inter-ests in weak enforcement.
Despite these limitations, the government ismaking some progress in combating piracy. A newlaw requires registration of the pressing machineryfor compact discs, digital video discs, and videoCDs—all of which is imported. The number ofcopyright enforcement cases increased from 44 in1999 to 109 in 2001 and to 1,999 by early June2002.30 Virtually all such cases involve piratedmovies and music, with enforcement actionsagainst both production facilities and retail shops.
At the time of this writing, no copyright caseshave involved software copying, probably becauseof a significant limitation in the law. To sustain aclaim of infringement, complainants must provideoriginal software code to the courts so that theauthorities can compare the code with that of thedefendant. Many software companies prefer not toreveal their machine language in an environment inwhich it may be released to rivals. However, in twocases in 2001 the local agent for a major foreignsoftware firm sued five firms for having loaded thefirm’s products into personal computers withoutauthorization. The agent was able to do so underIndonesia’s consumer fraud statutes and achievedjudgments against all defendants.31
Effects of Copyright Law on Specific Industries
This section describes particular copyright-sensi-tive industries in Indonesia and the changes theymight experience in the event of stronger copyrightenforcement.32 Across the board, survey respon-dents overwhelmingly preferred stronger govern-ment efforts to reduce piracy. This finding is notsurprising, because it would remove some costs forthese industries while expanding demand for theirproducts.
Software. In Indonesia, software and databases areprotected by copyrights providing protection for 50years, and computer programs may be patented.According to at least two Indonesian officials, thegovernment views copyrights as an inducement toinnovation in software development, an industry ithas identified as central to economic growth andrecovery. This decision is based on the fact thatwriting code for programs and games is fairly
104 East Asia Integrates

straightforward and labor-intensive, offeringprospects for absorbing large numbers of reason-ably well-educated young people into the laborforce. Indeed, as several interviewees commented,Indonesia has a good base of semiskilled workersfor the software industry. Software is viewed as adynamic industry that should experience risingglobal and domestic demand over the long term,particularly as the Indonesian economy makesgreater use of information technologies. The gov-ernment has established incubator programs thatprovide incentives for software developers. Theprograms are too new to assess, but they seem to bewell structured for this purpose.
The software industry has considerable scopefor expansion in both the domestic and exportmarkets. Copyright protection will be one elementin realizing this potential. In this relatively youngindustry, firms perceive the threat of softwarepiracy as a significant entry barrier. Other majorentry barriers cited are strong competition, short-ages of skilled labor, existence of dominant produc-ers, and concern about weak copyrights in neigh-boring countries. For firms considering expansion,the most significant problems are a weak telecom-munications infrastructure and Internet services,shortages of skilled labor, and concern about unau-thorized copying. Of the 25 software firms sur-veyed, 24 indicated an intention to expand outputover the next two years. Twenty-two firms citeduncertainty about the economy as a “very impor-tant” or “somewhat important” barrier to expan-sion. At least over the medium term, better copy-right enforcement seems to offer only moderatepotential for encouraging additional business activ-ity in software development in Indonesia.
Virtually all the survey respondents foundpiracy endemic and would like to see strongerefforts to reduce it. Of the small firms surveyed,only one said it would expand its output andinvestment if rights were strengthened. Medium-size enterprises would be more likely to expandtheir activity and develop new products, as wouldlarger enterprises. Presumably, that expansionwould increase net incomes for software developersand employees in the industry, even as it reducesemployment opportunities in copying.
It is possible to be more optimistic about thelonger term. Given the country’s human capitalresources and the small size of the software indus-
try in relation to Indonesia’s economy and popula-tion, stronger copyright protection shouldimprove the software industry’s prospects to somedegree.33 However, the industry is unlikely to growsignificantly before the economy overcomes itscurrent sources of instability and uncertainty andimproves its infrastructure for telecommunica-tions services.
Recorded Music. Among the copyright-sensitiveindustries in Indonesia, the recorded music indus-try probably suffers the most damage from poorcopyright enforcement. The industry is largelydevoted to local cultural and pop music and thedomestic audience. It is made up mainly of smallfirms, and, as in software, they are remarkably fewin number for an economy of Indonesia’s size. Thecurrent system yields revenues for a very smallnumber of musicians. A more sophisticated system,including professional rights management and col-lection societies, could help to improve this situa-tion considerably. The primary prospect forexpanding income opportunities for poor artistslies in the expansion the recording companies saythey would undertake in response to better copy-right protection; the companies also would investmore in artist development.
Virtually all the recording companies said thegovernment is doing “far too little” to stop piracy,and claimed unambiguously that their businesseswould grow considerably if copyright enforcementwere more transparent and effective. Both largefirms, all 11 of the medium-size firms, and 9 of the11 small firms said they would expand, eithermodestly or significantly. Ten of the small firmsand all the medium-size firms would invest morein developing new songwriters and recordingartists. Again, given Indonesia’s size, there is reasonto believe that expansion now will pay off consid-erably in the long run.
Film. Indonesia’s film industry is small but grow-ing. Film producers with small companies are par-ticularly concerned about domestic copying andcould benefit from stronger copyright enforce-ment. Like those in the recorded music business,the great majority of firms said the government isdoing far too little to reduce piracy. However,stronger copyright enforcement is not expected tohave as dramatic an impact on film as on music.
Protecting Industrial Inventions, Authors’ Rights, and Traditional Knowledge 105

Among the film companies, 9 of 16 said they wouldattempt to expand modestly or significantly, while6 of the small firms anticipated no impact or asmall contraction. At the same time, 14 of 16 firms(including 6 small firms) said they would invest inmore filmmaking capacity in the event of strongercopyrights. Thus, although the signals are some-what mixed, there does seem to be a reasonableindication that the film industry would expand ascopyrights become more strongly enforced.
Print Publishing. Indonesia’s publishers believebook piracy is fairly widespread, but their industryis suffering only modest damage and would notexpand much as the result of stronger protection.They believe that the major problem in starting aprint publishing business in Indonesia is a shortageof financial backing.
Conclusions
Indonesia’s copyright law is TRIPs-compliant, andin some ways it goes beyond the TRIPs require-ments. An assessment of whether the extra protec-tion is really appropriate for Indonesia’s economymight be useful.34 For some time into the future,enforcement is likely to continue to suffer fromweak capacity, chronic underfunding, limitedaccess to enforcement procedures, and a lack oftransparency.
As rights are more successfully enforced, copy-right-sensitive industries will see opportunities forexpansion and more income. These gains would befelt in the medium term and would have to beassessed against the short-term hardship thatwould result for the firms and workers nowengaged in unauthorized copying and distributing.The extent of this hardship cannot be predictedwith confidence, but it seems probable thatemployment in copying and selling pirated ver-sions of music, movies, and software is significantin the larger cities.
If copyright enforcement is likely to remain inef-fective for the foreseeable future, what mightIndonesia do to improve the marketing prospectsof local artists, software developers, and publishers?First, the government could accelerate its programsto improve telecommunications and private Inter-net services, which initially could be used to raiseawareness abroad of Indonesian products. Second,
it could encourage development of a larger base oftechnological and creative personnel through edu-cation and training incentives. Finally, to the extentthat other barriers to entry in these sectors exist,they could be diminished.
What Are the Problems in Protecting Traditional Knowledgein Genetic Resources?
Genetic resources, including plants and herbs, andunderstanding of their properties for nutrition andmedicines are known collectively as biologicallybased traditional knowledge. Typically, that knowl-edge derives from generations of collective andexperimental use of naturally occurring plants andsoils. This section addresses the problems encoun-tered in converting such knowledge into mar-ketable products.
Other forms of traditional knowledge arise inmusic, designs, and folklore. For example, tradi-tional designs of carpets and clothing are oftenshared by numerous villages in particular regions ofdeveloping countries. Although many of the prob-lems discussed in this section arise in these culturalcontexts as well, the scientific and biological basis ofgenetic resources makes them unique and the centerof current controversy. Thus we focus on issues thatemerge particularly in the latter area.
Innovations in agriculture and pharmaceuticalsare drawing increasingly on traditional or indige-nous knowledge, and the market value of pharma-ceutical derivatives from traditional medicine hasbeen estimated at about $43 billion a year world-wide (IPBN 1995). The trial and error required tobring about a successful innovation can be drasti-cally reduced when researchers consult the practi-tioners of traditional knowledge. In medicalresearch, bio-prospectors have increased the suc-cess ratio of clinical trials from 1 in 10,000 samplesto 1 in 2,000 (Prakash 1999). Given that roughly 90percent of the world’s genetic resources and tradi-tional knowledge is held in developing countries,and roughly an equal percentage of the world’sR&D activity takes place in industrial countries,there is scope for mutually beneficial bargainsbetween a gene-rich, technology-poor South and agene-poor, technology-rich North.
The proper means for establishing the documen-tation, ownership, compensation, and exploitation
106 East Asia Integrates

of traditional knowledge remain unclear. The TRIPsagreement touches on these issues, but essentiallyleaves them to interpretation or further negotia-tions. This is an area in which developing nationscould benefit from advances in thinking andstronger policy options. This section outlines theanalytical and practical issues that need attention tospur progress on protecting traditional knowledgeor compensating its ownership. For this purpose, itbegins by discussing the complexities in researchand development in the biological sciences.
A Framework for R&D in the Biological Sciences
All technological advances take place in three dis-tinct stages. In the primary stage, known as inven-tion, a new idea is observed or occurs. In the sec-ondary stage, the idea, by being embedded in aproduct or process, is transformed into an innova-tion. In the tertiary stage, the innovation is diffused.
Each of these stages has features peculiar to thebiological sciences. In the primary stage, observa-tion and experimentation, which must rely on acombination of physical, human, and natural capi-tal, are needed to capture exogenous information.In the biological sciences, the dependence on natu-ral capital (plants and soils) at this stage is unique,and issues related to the valuation of natural capitalbecome central. In the secondary stage, traditionalknowledge and natural capital are combined intophysical and human capital. Innovations that arefully embodied in a physical product can be sold,and few externalities exist in appropriating thereturns to investment. But innovations that are dis-embodied—that is, not contained in a physicalproduct but rather held as knowledge, say, by afarmer or researcher or by a social system—aresubject to such externalities. A large part of biolog-ical innovation is disembodied, and, in particular,traditional knowledge is almost always held withinsocial systems. The tertiary stage, diffusion of thenew innovation, also varies in character, dependingon whether the innovation is embodied or disem-bodied. When the innovation is embodied, its dif-fusion takes place through the marketing of theproduct, albeit at a cost. The diffusion of disem-bodied innovations is more complicated. Becausediffusion occurs mainly through the exchange ormovement of human capital, it often takes placemore efficiently in a nonmarket setting.
Much of the new knowledge in the biologicalsciences is acquired through observation of natu-ral phenomena, combined with trial and error—as, for example, when farmers observe weather-resistance or disease-resistance in certain cropsand then create hybrids that have the desirablecharacteristics. Finding new solutions to problemstherefore depends on maintaining a diverse genepool, and, in turn, the conservation of biodiversityper se is the key to solving the agricultural andhealth problems of tomorrow. Because thedestruction of biodiversity is irreversible, preser-vation of the stock of genetically rich lands andresources is vital.
The economic question at the crux of the debateon protecting traditional knowledge is how toensure that both the primary and secondary stagesof R&D, and their associated capital inputs, receiveenough compensation to generate incentives fortheir continuing efficient operation. How is naturalcapital to be valued? How are the returns to innova-tions to be appropriated and apportioned?
About half of the yield gains in agriculture canbe ascribed to traditional genetic resources, accord-ing to estimates from models using the standardCobb-Douglas production function. But whenmodels have attempted to quantify firms’ willing-ness to pay for such resources, shockingly small val-ues have emerged.35 The explanation for thesesmall values lies in the potential redundancy ofsolutions in the biological sciences. The moreephemeral a solution promises to be (and thus thelower the revenue it promises to yield), the smallerthe private investment. However, public health andfood security concerns would dictate that the lessdurable the solution, the greater the investmentneeded in R&D. Therefore, some form of publicintervention is warranted that rests on the under-standing that resources that are not valuable nowmay be valuable later.
Proper arrangements for the appropriation ofreturns and compensation of contributors are pre-conditions for an optimal R&D effort and supply ofthe factors needed for innovation. Property rightsprovide these preconditions. The literature suggeststhat the property rights assignment matters verymuch if contracting within the industry is costly,and that property rights should be placed at the lev-els that most encourage investment in the assetsconcerned (Swanson and Goeschl 1999).
Protecting Industrial Inventions, Authors’ Rights, and Traditional Knowledge 107

Evolution in R&D Management
The international R&D management regime forgenetic resources has evolved through three eras:
1. Equal access/common heritage. This first eraemphasized the accumulation of already avail-able information and its widest possible diffu-sion. The aggregation of traditional knowledgeand genetic resources occurred within nationalacademic and governmental institutions, andalmost wholly by virtue of publicly fundedinvestments. The emphasis was on the publicgood nature of this information, and rapid dif-fusion was subsidized by means of the universalrecognition of the doctrine of free access to col-lected resources.
2. Private investment/property rights in end prod-ucts based on genetic resources. The second eraarose with the recognition that the traditionalknowledge base could be developed andexpanded with investments of other forms ofcapital. Scientific method and physical capitalcould be combined with natural forms of capi-tal (genetic resources) to create more informa-tion and more useful information. Publicinvestors were probably the first movers, butthey were joined rapidly by private investorswhose involvement required the developmentof institutions for compensating private invest-ments. In the pharmaceutical industry, theseinvestments could be compensated throughexisting patent laws. In agriculture, it was neces-sary to extend IPR law in a new direction—thatis, toward granting exclusive rights for the useof naturally occurring organisms.
This second era of R&D managementrevolved around developing property rights inend products based on genetic resources; the fun-damental notion that naturally occurringgenetic resources were a common heritageremained undisturbed. The problem was seen asone of compensating other forms of capital(human, physical) that were combined with nat-ural capital (genetic resources) to produce inno-vative end products, even when those productswere biological and thus capable of naturalreproduction.
It became increasingly clear, however, thatthe useful genetic resource base was not static,
and that investment was needed to maintain andexpand that base. Thus the assumption thatproperty right mechanisms should not extend tonatural forms of capital was brought into ques-tion. Once it was recognized that information inthe biological sector must be optimally pro-duced as well as diffused, it became important tomove away from the doctrine of common her-itage and free access.
3. Private investment/property rights in base geneticresources. The third era of R&D management istaking a harder look at claiming exclusive rightsin the base genetic resources. Both physical andhuman capital are now directed at analyzing andmanipulating the base resources themselves,with the object of developing genetic character-istics that are useful in and of themselves. In thisway, the various forms of capital are all com-bined (natural, human, and physical), and theend product becomes the understanding or cre-ation of a genetically generated characteristicthat is useful in itself. The property right is thenclaimed in the genetic trait and its claimed use.Thus the third era of R&D management hasmoved the property rights debate down a level,to that of the genetic trait rather than the bio-logical resource.36
A Brief History of Global Policies Affecting Genetic Resources
Historically, traditional knowledge and geneticresources were treated under the doctrine of thecommon heritage of mankind. They were thereforeavailable without restriction.
This view changed in the 1930s in the UnitedStates and Europe, where plant breeders firstsought to protect the results of their selectivebreeding programs. In 1961 the International Con-vention for the Protection of New Varieties ofPlants (UPOV) established a harmonized systemfor international recognition and establishment ofplant breeders’ rights.
The Convention on Biodiversity (CBD), whichcame into force in 1992, established the doctrine ofnational sovereignty over genetic resource inputs,abrogating the doctrine of common heritage. It alsoestablished an approach to property rights ingenetic resource inputs based on bilateral benefit-sharing agreements. This bilateral contract
108 East Asia Integrates

approach to property rights in genetic resourceshas had little impact to date, however, because ofthe practical difficulties of implementation. Underthe terms of the CBD, either the state or the localcommunity that hosts the resource can refuseaccess. If it allows an outside party to have access toits genetic resources, it can require an agreementsetting out the terms on which access is given. Butdoing so successfully requires the passage of accesslegislation for the resources, as well as a means fordeciding among competing rights of ownershipand establishing the mechanism for consent andtransfer. Few states have adopted and implementedthe access legislation required for this task. It is alsoclear that establishing such claims and providinglegal consent would be difficult.
By contrast, the TRIPs agreement attempts aglobal standardization of IPR regimes. In particu-lar, the agreement requires WTO member states toadopt some form of plant breeders’ rights, while itspecifically permits countries to exclude frompatentability all life forms emanating from essen-tially biological processes. The wording of theTRIPs agreement requires all member states of theWTO to adopt either some form of patent systemfor improved plant varieties or a sui generis regimefor the protection of the same. Pressure hasmounted for the adoption of uniform systems ofIPR for plant varieties and other genetic resources(microorganisms) and for countries’ mutual recog-nition of the rights they confer for such resources.The TRIPs agreement is essentially silent on theissues of traditional knowledge.
Thus CBD and the TRIPs agreement are in con-flict. CBD emphasizes the importance of sovereignrights in indigenous genetic resources and theknowledge associated with them. The TRIPs agree-ment requires the adoption of IPR systems forimproved plant varieties, but not for resourcesemanating from essentially biological processes.
Reconciliation of these two approaches wouldrequire, for genetic resources, some manner ofrecognition of rights to innovations, both at theindustry end and potentially for some of the basegenetic resources used as inputs. Such a regimewould incorporate the rights of states that providethe natural inputs (as required under the CBD) andalso those that provide the final outputs (asrequired under the TRIPs agreement). But howmight such a regime operate?
Is There an Optimal Property Rights Institution?
To be practicable, a system of property rights in thebiological sciences must take into account how thisdiverse (because it depends on so many differentforms of capital) and globally dispersed R&D sec-tor is managed. An intellectual property rightsregime would seek to facilitate R&D managementby providing some form of exclusive marketingrights so that the optimal level of investment is gen-erated in various parts of the industry.
Broadly, the options for IPRs are the following:property rights only at the primary stage of R&D;property rights only at the secondary stage; or prop-erty rights at both the primary and secondary stages.We examine the pros and cons of each in turn.
1. Property rights only at the primary stage of R&D.This option would be inadequate. Property rightinstitutions could not pertain only to the pri-mary stage of R&D—that is, at the level of theproducts of the natural capital—because itwould be impossible to capture the benefitsemanating from the other (non-natural) formsof capital employed within the sector. The latterare usually employed at a later stage in theindustry, and the property right pertaining tothe first stage would be incapable of managingthe end markets. Also, it is not clear that a prop-erty rights mechanism at this level would dra-matically increase the levels of investment inreserves. The mechanism selected would need tooperate at several different levels of knowledge,(embodied, disembodied, expressed) in order tocreate and share profits among suppliers of tra-ditional knowledge. This scenario might be pos-sible, but at the cost of introducing distortions(for example, exclusive dealing arrangements)that would introduce their own costs.
2. Property rights only at the secondary stage ofR&D. The sector could be managed with a singleproperty right at the secondary stage of R&D,but it would require substantial amounts of con-tracting between the industry developing end-use products and the providers of traditionalknowledge and genetic resources. In essence, asingle property right at the secondary stagewould permit its owner to appropriate the fullvalue of the information inherent in the finalproduct, but complete contracting would be
Protecting Industrial Inventions, Authors’ Rights, and Traditional Knowledge 109

needed to ensure that these rents are distributedefficiently across all components of the verticalindustry. Given the diverse and widely distrib-uted nature of the R&D sector, it would be costlyto engage in this sort of structured contracting.
3. Property rights at both the primary and secondarystages of R&D. R&D could also be managed withthe placement of a property right mechanism atboth the primary and the secondary stages. Suchan approach would create an institution focusedon the efficient distribution of the industry’sprofits, but at the cost of creating multiple levelsof monopoly within the same vertical industry.Multiple constrictions on output (to generaterents) would reduce the welfare generatedwithin the industry. Successive monopolieswould introduce successive distortions withinthe industry, which might result in more welfarereduction than enhancement.
The choice between the second and thirdoptions depends on their comparative institutionalcostliness. Having a single property right at the sec-ondary stage (option 2) would result in substantialcontracting costs and thus significant residual inef-ficiency in the distribution of rents. Having multi-ple property rights in the single vertical industry(option 3) would address this problem, but itwould result in successive distortions in the market.
Practical Concerns
Even if the conceptual and analytical issues justoutlined were somehow addressed, some practicalconcerns would remain about the valuation, appro-priation, and distribution of returns from tradi-tional knowledge.
First, intellectual property rights are individual-istic, but traditional knowledge is normally heldcollectively and developed by members of anindigenous community over several generations,making it extremely difficult to identify individualinventors of such knowledge. Although the fact thatthe knowledge is passed down over generationsshould, in principle, add to its value, the problemarises that the information may be said to existwithin the public domain.
Second, patent applicants must supply evidenceof a single act of discovery. This would be extremelydifficult to establish. The patenting of indigenous
practices might be supported if it were possible toprovide written documentation of local and tradi-tional practices, but traditional knowledge has usu-ally been passed on orally.
A third problem concerns the description of tra-ditional knowledge and ownership claims madefrom it in a written application. Specifications for apatent must be written in technical language thatdemarcates its limits and establishes the relation-ship of the innovation to existing knowledge andinnovations. A particular use of a characteristic of aplant or animal may be well known to an indige-nous community, but it must be stated in a formthat distinguishes it from other biochemical orgenetic information or usefulness. Much tradi-tional knowledge is disembodied and subject to theproblems of appropriating benefits from disem-bodied information.
Finally, to be protected from unauthorized use,traditional knowledge must first be placed in publicregistries. In principle, such registries would estab-lish the sources, ownership, and characteristics ofthe included knowledge. In practice, the operationof registration systems poses at least two complexquestions:
• How would traditional knowledge be registered?Before any valuation or distribution issues aretackled, traditional knowledge must be docu-mented. Should the burden be on local commu-nities to disclose and register what they know inthe event that this knowledge becomes preciousto the scientific community in the future?Would communities that do not do so be penal-ized?
• How would such registers operate? To establish aclaim of prior possession and therefore precludepatenting by others, these registers would haveto be made public. Putting them in the publicdomain could prejudice future protection of theknowledge documented in them.
To illustrate these problems and to understandone case in which they have been addressed, con-sider recent legislation in the Philippines (Box 6.1).This nation, which is composed of many indige-nous peoples, has been a leader in instituting legis-lation for access and compensation of indigenousknowledge. Indeed, the country is viewed as a labo-ratory for evaluating solutions to the property
110 East Asia Integrates

rights problems that are affecting the R&D sectorglobally.
Conclusions
The historical tendency to treat genetic resourcesas constant and freely available is an anachronismin an era of private property rights for the prod-ucts emanating from those resources. Thus a betterapproach to the management of these resources isneeded, and some public intervention is required.Given international externalities, this public inter-vention should ideally be global in scope. In fact,rights acquired in countries of origin alone willnot mean much unless they are extended to majormarkets where derived and patented products aremarketed.
It is therefore appropriate to discuss the protec-tion and compensation of traditional knowledge ininternational forums. The TRIPs agreement estab-lishes the principle that some genetic resourcesshould be subject to intellectual property rights,but it does not resolve the conflicts between WTOmember states; it merely transfers the debate to this
new forum. Complex problems—conceptual andpractical—will have to be sorted out beforeprogress can be made in linking traditional knowl-edge issues to WTO agreements or other mecha-nisms for managing R&D in the biological sciences.
In summary, the application of property rightsto traditional knowledge raises important prob-lems, but there is probably no one regime thatcould serve as a solution. In compensating commu-nities that hold traditional knowledge, other insti-tutional devices should also be considered, such asgeographical indications, copyrights, and tradesecrets. In selecting a second-best approach tomanaging R&D in the biological sciences, the com-parative costliness of the various approaches willhave to be the guide.
Overall Conclusions and Lessons
The development aspects of IPR regimes differacross the three forms of intellectual property pro-tection examined here—patents, copyrights, andtraditional knowledge—for countries of widely dif-ferent development levels and technological capac-
Protecting Industrial Inventions, Authors’ Rights, and Traditional Knowledge 111
BOX 6.1 Protection of Indigenous Knowledge in the Philippines
The Philippines recently developed and imple-mented legislation on the protection of biologicalresources. Two noteworthy attempts have beenExecutive Order 247 (EO247) adopted in 1995and the Indigenous Peoples’ Act (IPRA) of 1997.
EO247 covers the prospecting of all biologicalresources in the public and private domains andrequires anyone, whether a national or foreignentity, who wishes to access biological resourcesto enter into a formal research agreement withthe government after obtaining the informedconsent of the appropriate local community.
Although this approach has increased theinvolvement of the indigenous community, theactual practice has been criticized for beingmore of a procedural checklist than a substan-tive process in that access requires no more thannotification to the local community. Also, EO247does not elaborate precisely how benefit sharingwith the local communities comes about.Notably, this legislation has been used as a basisfor a model law on access and benefit sharingfor national systems in Asia by the Association ofSoutheast Asian Nations (ASEAN).
IPRA gave indigenous peoples rights overtheir ancestral lands as well as rights to use anddevelop the natural resources found in theirancestral domains. It did so by creating theNational Council for Indigenous Peoples, whichis responsible for overseeing the issuance of per-mits for access to indigenous peoples’ lands onthe basis of prior informed consent. IPRA seeksto extend the system of controlled accessbeyond biological and genetic resources to their“sciences, technologies, and cultural manifesta-tions” by recognizing the concept of “commu-nity intellectual property rights.”
Although IPRA remains in its infancy, it isexpected to provide impetus for significantchanges to IPR law in the Philippines. Hurdlesrelated to implementation need to be workedout—and one of the most challenging ones is todefine and implement community-based IPRs.
For details on progress in the Philippines onlegislating protection of traditional knowledge,see www.worldbank.org/eaptrade, which pro-vides background papers and technicalannexes.

ities. Yet for each form, issues of balance and com-plementary policies are prominent.
Within the more advanced emerging economiesand parts of China, stronger IPR regimes, success-fully enforced, could stimulate innovation in tech-nology, provided other conditions are favorable.Retrospective analysis of Korea’s strengthened IPRregime suggests that it played a role in the country’sdramatic success in patenting, but so did industrialupgrading, a big push in research and developmentfrom the chaebols, and the government’s selectivetargeting of the electronics/semiconductor indus-try, where Korea has emerged as a leading innova-tor worldwide. The successes of these innovativebusinesses helped to offset the impact of strongerpatent protection on the users of new products andtechnologies in Korea. Because impending TRIPs-related obligations mandate stronger patent protec-tion, it will be worthwhile for other, more advancedemerging economies to identify such complemen-tary policies to boost innovative activity amongprivate firms in their economies.
For a broader range of middle- to low-incomeEast Asian economies, copyrights might offeropportunities for gains, but again balance is criti-cal. Contemporary analysis of Indonesia’s copy-right protection suggests that considerable scopeexists for developing local copyright sectors—giventhe talents of software developers, musicians,artists, and authors—which would prefer some-what stronger protection. Yet these gains wouldhave to be assessed against the short-term hardshipfaced by the firms and workers who are nowengaged in unauthorized copying and distributing.In addition, enforcement is likely to remain ineffec-tive for the foreseeable future because of a weakcapacity. In the interim, complementary policiesmight be considered to improve the marketingprospects of local artists, software developers, andpublishers, such as improvements in telecommuni-cations and private Internet services which couldbe used initially to raise awareness abroad ofIndonesian products.
Traditional knowledge happens to be concen-trated in lower-income nations, and its protectionis generally expected to have direct benefits forpoverty reduction. Prospective analysis suggeststhat treating genetic resources as constant andfreely available is an anachronism in an era of pri-vate property rights in the products emanating
from those resources through R&D activity, whichis heavily concentrated in industrial countries. InEast Asia, the Philippines is experimenting in thisfield with existing and pending legislation onindigenous knowledge. However, rights acquired incountries of origin alone will not mean muchunless they are extended to major markets wherederived and patented products are marketed. Thusa broader approach to the management of protec-tion of traditional knowledge is needed, and somepublic intervention is required—ideally global inscope—to balance the interests of the communitiesholding traditional knowledge, those carrying outthe R&D activity, and the ultimate users of thesederived products.
Much of the debate on IPR has focused on theimpact of more stringent rights on East Asia as auser of technology created elsewhere, but strength-ened IPR regimes also play a role in local technol-ogy generation by compensating inventors and cre-ators. We are mindful of the complexities of designfor each form of IPR, and for countries at eachstage of development, and the need to identifycomplementary policies. Nonetheless, if managedcarefully, the scope for dynamic gains in innovationshould be considerable.
Endnotes
1. A host of instruments are available for protecting differentkinds of intellectual property: patents and trade secrets toprotect industrial inventions; copyrights to protectauthored works; trademarks to protect industrial logos andsymbols; and geographical indications to certify that aproduct was made in an area that has specific characteris-tics (such as soil conditions, climate, or design traditions)underlying the quality of the good.
2. Maskus (2000a) discusses these trade-offs extensively.3. An essential form of intellectual property protection, copy-
right gives creative artists and firms the right to control thecopying and distribution of particular expressions ofmusic, art, film, and literature. Copyrights and patentsoperate differently, primarily because copyrights controlthe use of an idea’s expression, while patents control the useof the idea itself. In recent years, copyright protection hasbeen extended in many countries to such industrially usefulexpressions as software, data compilations, performances,television broadcasts, and satellite transmissions, and it alsohas been applied to the use of electronic copies down-loaded from the Internet. For these reasons, copyrightsdeserve greater analytical attention than in the past.
4. For example, if means can be found for villagers in poorcountries to register their collective knowledge, whether ofmedicinal uses for biological materials or of other forms,for purposes of licensing its commercial use, they mightbenefit from substantial royalty income.
112 East Asia Integrates

5. See Maskus (2000a) on the regime changes and WorldBank (1993) on the economic structure.
6. Data from the United Nations Education, Scientific, andCultural Organization (UNESCO). Available at http://portal.unesco.org/uis/TEMPLATE/html/SandTec/Table_III_1_Asia.html.
7. Patent-intensive industries are those that rely heavily onpatenting to protect proprietary knowledge. Reliance onpatents varies by industries because, by definition, patentsmust reveal what they need to protect. Upon revelation,some knowledge is easier to imitate than other—for exam-ple, highly coded knowledge (such as chemical formulas) isrelatively easy to duplicate once it leaks out.
8. For the results of these tests, see Appendix Table 1of thischapter at www.worldbank.org/eaptrade.
9. In essence, these are the changes being requested of mostdeveloping countries within the next two to four years.
10. We conducted paired t-tests of the growth rates of Japaneseand German patents in Korea and the United Statesbetween 1983 and 1991. These tests confirm that the patentgrowth rate in Korea was significantly higher than that inthe United States for both Japanese patents (t-value of2.213) and German patents (t-value of 1.835), at the signif-icance level of p = 0.10.
11. For the results of this test, see Appendix Table 2 of thischapter at www.worldbank.org/eaptrade.
12. All dollar amounts are current U.S. dollars.13. Recent increases in patents per unit of R&D in many devel-
oped countries have also been attributed to an increase in“defensive” patenting—that is, innovations that a firm nor-mally would not commercialize and protect, but it does soonly to prevent others from patenting them later. In thisway, the firm increases the portfolio of patents it owns toimprove its negotiating power in technology purchase deals.
14. This is likely to be the outcome of a combination of factorssuch as more patentable inventions per unit of R&D, as wellas a higher propensity to patent eligible inventions for thestrategic reasons just described. See also Kim (1997).
15. Of the U.S. patents granted to private Korean corporations,90 percent were awarded to the five largest chaebols, espe-cially the Samsung Group.
16. It was 32 percent, compared with 16 percent in Taiwan and9 percent in Japan (Kim 1997).
17. In 1998 the ratios of R&D expenditures to total sales for theflagship companies of the largest chaebols were SamsungElectronics, 7 percent; Hyundai Electronics, 8 percent;Hyundai Motor, 12 percent; and SK Telecom, 2 percent.These percentages were generally comparable to or higherthan those of the global leaders in their respective industries.
18. As of February 2002, Korea had 9,208 private R&D labs, upsixfold from 1,435 a decade earlier (Korea Industrial Tech-nology Association).
19. In the United States, under law a patent application mustspecify any and all of the “prior art” known to the appli-cant. Thus it is possible to track knowledge-building acrosspeople, firms, countries, and regions, and time. Recentstudies have analyzed patent citations to trace the sourcesof original knowledge underlying patented innovations.See Jaffe, Tranjtenberg, and Henderson (1993); Almeida(1996); Almeida, Song, and Grant (2002); Song, Almeida,and Wu (2002).
20. Sorensen and Stuart (2000), Rosenkopf and Nerkar (2001),and Song, Almeida, and Wu (2002) have used self-citationsto evaluate the extent of path dependence in innovationactivities.
21. For example, if a patent application granted to SamsungElectronics in 1996 cites a patent granted to Samsung Elec-tronics in 1990, it is regarded as a self-citation. If the ratioof self-citation to total citations is high, it means that a firmor a country has already established its own technologicalpath or trajectory and will tend to pursue subsequent inno-vations along this path (Song, Almeida, and Wu 2002).
22. For detailed results, see the technical appendix to this chap-ter at www.worldbank.org/eaptrade.
23. This observation supports the finding that Korea invents inareas that have smaller citation peaks, which may implynewer technologies (Hu and Jaffe 2001).
24. Revealed comparative advantages for Korea, Japan, and theUnited States were 275, 253, and 133 for the electronicsindustry and 21, 45, and 170 for the chemical industry,respectively. Revealed comparative advantage is an index ofthe country’s share of patents in those industries divided bythe country’s share of total patents, computed for the1981–99 period.
25. A good example is the Korean advances in emerging digitaltechnologies. Koreans lagged behind Japan and the UnitedStates in the conventional analog-based technologies in theelectronics industry. However, when the technological basein the electronics industry recently moved to more digital-based technologies, Korean companies such as SamsungElectronics and LG Electronics seized golden opportunitiesto catch up with industry leaders in the European Union,Japan, and the United States by investing heavily in digitaltechnologies early on. For both companies, a substantialnumber of U.S. patents are now for technologies related toemerging digital appliances, and some of them are morebasic product patents than traditional process patents.
26. About 10 years are usually devoted to the discovery, animaltesting, clinical trials, and approval of a new drug.
27. According to the Korea Industrial Technology Association,as of December 1999 the number of researchers in the elec-tronics industry was 65,028, or about 38 percent of theresearchers in Korea, whereas researchers in the chemicalindustry numbered only 15,807. The ratio of R&D expen-ditures to sales for Korean electronics companies was 4.54percent in 1997, or more than twice the average for manu-facturing firms.
28. In 2003 extensive interviews of government officials andenterprise managers were carried out, and a survey wasadministered to 70 Indonesian enterprises in these copy-right-sensitive sectors, commissioned by the World Bank.
29. The new law also improves procedures for arbitrating andresolving disputes, and it clarifies that copyright cases canbe appealed in a streamlined fashion to the commercialcourt. It also increases the authority of the police to under-take enforcement actions on their own initiative. Perhapsmost significant, it makes end use piracy a criminaloffense, with a maximum five-year prison term. Anotherprovision of the new law permits copyright owners fromoutside Indonesia to retain Indonesian legal representa-tion. Under past law, a complainant had to come to courtin Indonesia to claim infringement. Foreign companies(and certainly individual artists) often found this was notworth the time and effort. Indonesia has adopted theWorld Intellectual Property Organization (WIPO) Copy-right Treaty and intends to ratify the WIPO Performanceand Phonograms Treaty. Among other things, thesechanges will make it illegal for Internet users to circum-vent electronic protection devices on binary files andtransmission protocols.
Protecting Industrial Inventions, Authors’ Rights, and Traditional Knowledge 113
30. This increase seems to have come at the expense of fewertrademark cases. These data are from the national policeforce.
31. The money the agent received from the resulting fines wascontributed to a program to purchase computers for schools.
32. Details of the survey results and descriptions of the indus-tries appear in the technical appendix to this chapter atwwww.worldbank.org/trade.
33. The median estimates from the survey were that Indonesiahas 230 software firms, employing some 5,800 workers. Bycontrast, survey work in Lebanon in 1997 estimated thatthe country was home to some 490 software companiesemploying about 3,000 workers (Maskus 2000b). Clearly,the Indonesian market potential is far larger than that ofLebanon.
34. Indeed, it may be that some aspects of Indonesia’s intellec-tual property regime—in particular, the limitations on fairuse and the provisions for patenting software—are overlyrestrictive from the standpoint of the country’s develop-ment needs. In software, the tighter copyright law to beintroduced in 2003 may substantially limit fair use provi-sions. In addition to the prior restraint that the user of acomputer program may make only one archival copy, edu-cational users of software and printed materials will be per-mitted only one copy for their use before they are requiredto attain licenses for multiple copies. The new law outlawsthe decompilation (reverse engineering) of computer code.
35. For example, a hectare of land in West Ecuador and the Ama-zon—biodiversity hot spots of the world—is valued at $20.63and $2.59, respectively (Simpson, Sedjo, and Reid 1996).
36. It is now possible to claim a patent in any or all of the follow-ing steps toward identifying useful biological activity: geneticsequence, cloning method, expression of protein fromsequence, biological activity of protein, and method of action.
References
Almeida, Paul. 1996. “Knowledge Sourcing by Foreign Multina-tionals: Patent Citation Analysis in the US SemiconductorIndustry.” Strategic Management Journal 20: 251–59.
Almeida, Paul, Jaeyong Song, and Robert M. Grant. 2002. “AreFirms Superior to Alliances and Markets? An Empirical Testof Cross-Border Knowledge Building.” Organization Science13 (2): 147–61.
Hu, Albert G. Z., and Adam Jaffe. 2001. “Patent Citations andInternational Knowledge Flow: The Cases of Korea and Tai-
wan.” NBER Working Paper No. 8528. National Bureau ofEconomic Research, Cambridge, Mass.
IPBN (Indigenous Peoples’ Biodiversity Network). 1995.“Indigenous People, Biodiversity, and Health.” COURTSCanada IPBN Factsheet, November.
Jaffe, Adam B., Manuel Trajtenberg, and Rebecca Henderson.1993. “Geographic Localization of Knowledge Spillovers asEvidenced by Patent Citations. Quarterly Journal of Econom-ics 108: 577–98.
Kim, Linsu. 1997. Imitation to Innovation: The Dynamics ofKorea’s Technological Learning. Cambridge, Mass.: HarvardBusiness School Press.
Maskus, Keith E. 2000a. Intellectual Property Rights in the GlobalEconomy. Washington, D.C.: Institute for International Eco-nomics.
———. 2000b. “Strengthening Intellectual Property Rights inLebanon.” In Bernard Hoekman and Jamel Zarrouk, eds.,Catching Up with the Competition: Trade Opportunities andChallenges for Arab Countries. Ann Arbor: University ofMichigan Press.
OECD (Organisation for Economic Co-operation and Develop-ment). 1999. Main Science and Technology Indicators, 1999.Geneva.
Prakash, S. 1999. “Towards a Synergy between Biodiversity andIntellectual Property Rights.” Journal of World IntellectualProperty 2 (5).
Rosenkopf, Lori, and Atul Nerkar. 2001. “Beyond Local Search:Boundary-Spanning, Exploration, and Impact in the OpticalDisc Industry.” Strategic Management Journal 22: 287–306.
Simpson, R. D., R. A. Sedjo, and J. W. Reid. 1996. “Valuing Biodi-versity for Use in Pharmaceutical Research.” Journal of Polit-ical Economy 104 (1): 163–85.
Song, Jaeyong, Paul Almeida, and Geraldine Wu. 2002. “Learn-ing-by-Hiring: When Is Mobility Useful in Inter-firmKnowledge Transfer?” In Linda Argote, B. McEvily, and R.Reagens, eds., Management Science (Special Issue on Knowl-edge) 49 (4): 446–63.
Sorensen, Jesper B., and Toby E. Stuart. 2000. “Aging, Obsoles-cence, and Organizational Innovation.” Administrative Sci-ence Quarterly 45: 81–112.
Swanson, T., and T. Goeschl. 1999. “Ecology, Information, Exter-nalities and Policies: The Optimal Management of Biodiver-sity for Agriculture.” In G. H. Peters and J. von Braun, eds.,Food Security, Diversification and Resource Management:Refocusing the Role of Agriculture. Brookfield, Vt.: Ashgate.
World Bank. 1993. The East Asian Miracle. New York: OxfordUniversity Press.
114 East Asia Integrates

Rapid economic growth is often blamed for thewidespread deterioration of the natural environ-ment in East Asian economies through deforesta-tion, urbanization, and industrialization. Put dif-ferently, it is claimed that domestic andmultinational companies gain a competitive advan-tage from the willingness of public authorities topermit environmental resources to be used indis-criminately or without charge. Similarly, it isclaimed that a permissive government attitudetoward the protection of workers’ rights permitsfirms to suppress wages and working conditions,generating a cost advantage on the labor side. Aparticular concern is that labor and environmentalstandards may have been weakened in the after-math of the Asian financial crisis of 1997–98, orbecause of additional trade liberalization in the late1990s, and that this weakening has boosted exportssince the crisis. Poor environmental stewardshipand a failure to support at least core labor rightsraise issues of human rights, health maintenance,educational attainment, and sustainability.
This chapter reviews theoretical and empiricalanalysis to help clarify these issues. Three compet-ing hypotheses are influential in the literature. One
115
7
Trade and CompetitivenessAspects of Environmental
and Labor Standards in East Asia
Keith E. Maskus
is that foreign direct investment (FDI) and traderespond at least in part to country standards. Ifweak environmental and labor standards providecost advantages that motivate domestic and foreignfirms to locate in areas with such standards, thestandards may stimulate growth in exports. If weakor ineffective standards are an important spur tocompetitiveness and export growth, and firms atleast implicitly demand such weakness throughtheir location decisions, governments may competeto offer low standards in a “race to the bottom.”Now that many countries have significantlyreduced their tariffs and other border restraints ontrade, standards that raise costs have presumablyincreased their influence on trade.
An alternative hypothesis is that exceptionallyweak environmental and labor standards restraineconomic competitiveness, exports, and growth.1
Unchecked or untreated discharges of chemicalsinto water supplies can harm agricultural produc-tion and workers’ health status and limit productiv-ity. Widespread reliance on child labor limits edu-cational enrollments and the development of laborskills, and potentially restricts both the moderniza-tion of the output mix and growth rates. To the
The author is grateful to Kanemi Ban for helpful comments at the seminar at the Tokyo office of the World Bank.

extent that firms require high productivity, lowabsenteeism, and clean resources, weak standardscan deter investment and restrict exports. In thisview, competitiveness flows more readily fromhigher social protection than from lower.
Both of these hypotheses suggest that competi-tiveness, trade, and FDI depend on the effects ofenvironmental and labor protection regulations(and their enforcement) on costs. A third claimreverses this causation, arguing that the optimalstandards for a country depend on factor endow-ments, development levels, technology, and nationalpreferences (Anderson 1996; Antweiler, Copeland,and Taylor 2001). In this context, regulations areendogenous to changes in openness to trade andFDI. Openness may either worsen or improve thenatural environment, depending on prevailing con-ditions, but to the extent that openness raisesincomes, demand for stronger environmental pro-tection may be expected to rise. Similar commentsapply to rules on the protection of workers. Thesehigher demands for stronger environmental protec-tion and protection of workers have been observedin recent decades in Japan, the Republic of Korea,Taiwan (China), and Singapore as development hasproceeded, in part because of export-led growth.
These hypotheses cannot be tested conclusively.One reason is that the relationships between laborstandards or environmental standards, on the onehand, and international trade, on the other, are com-plex and involve causality in both directions.Another reason is that it is difficult with the availableinformation to capture the subtleties of labor rightsor environmental conditions for statistical analysis.Even so, by reviewing the balance of evidence it ispossible to draw useful guidelines for policy. Thenext section considers general issues in the area oflabor standards and trade, and it is followed by a dis-cussion of the situation in East Asian nations. Thenext sections repeat this structure for environmentalregulation. They are followed by a review of environ-mental protection issues arising in the Doha roundof multilateral trade negotiations. A concluding sec-tion offers policy recommendations.
Labor Standards: Background and Institutions
The literature on relationships between labor mar-ket regulations and international competition is
huge, reflecting the complexity of the subject.2 Thissection summarizes important institutional ques-tions and the available evidence.
Many different kinds of regulations provideworkers with rights in labor markets:
• Basic rights include prohibition of slavery andphysical coercion, elimination of discrimina-tion, and a ban on the exploitative use of childlabor.
• Civic rights include freedom of association, col-lective bargaining, and expression of grievances.Together, these provisions constitute the so-called core labor standards, which embody prin-ciples that are supposed to be universallyrespected as a matter of human rights.3
• Survival rights provide for a living wage or mini-mum wage, limited hours of work, informationabout working conditions and job hazards, pro-tection from occupational hazards, and com-pensation for employment-related accidents.
• Security rights include protection against arbi-trary firing, rights to severance payments, andaccess to health and retirement benefits and sur-vivors’ compensation.
These various rights are granted by governmentsto workers through regulations on employer prac-tices.4 Such regulations vary considerably acrosscountries, and even within countries.
An important distinction may be made betweencore labor standards and other rights. To a consid-erable degree, core labor standards may be inter-preted as policies buttressing the basic freedoms inthe workplace. The elimination of coercive forms oflabor and discrimination gives workers and firmswider choices, and costly distortions in labor mar-kets are removed (Maskus 1997; Martin andMaskus 2001). Recognition of the rights of workersto associate freely and engage in collective bargain-ing allows worker groups to counter the distor-tionary impacts of single employers. By contrast,survival rights and security rights award workersbenefits that might not otherwise emerge in com-petitive labor markets. But they also raise the costsand reduce the flexibility of firms. Moreover, as thestrength of such mandates rises, firms may findthemselves less able to compete.5 This problemmight be particularly difficult for minimum wagelaws, which can contribute to unemployment in the
116 East Asia Integrates

event of an economic crisis or political collapse, assuggested by a recent study of Indonesia (Suryahadiand others 2003).
In addition to regulating employers’ practices,governments may directly support workersthrough public services. Such services consist ofsocial safety net programs, including temporaryunemployment compensation, and programs toimprove workers’ ability to function in labor mar-kets, including job training, wage subsidies,employment services, job creation through publicworks projects, and education.
Table 7.1 compares the policies of key East Asianeconomies on workers’ rights and support pro-grams by indicating their decisions on ratificationof the eight “fundamental” conventions of theInternational Labour Organisation (ILO) thatcover the core labor standards. In the table, themany ratifications since 1996 are indicated by bold-face, and they suggest that worker protection stan-dards have improved since the Asian financial cri-sis. These data reveal that legislated labor standardshave not been reduced in the East Asian region
since 1997; indeed, there is some evidence of a gen-eral trend toward raising them.6 Nevertheless, areview of legislation finds that Korea is the onlycountry to have significantly strengthened its regu-latory framework for labor protection. China hasdone little to improve its formal recognition andprotection of union rights. Meanwhile, allegationspersist that governments in the region are raisingroadblocks to union activities, and enforcement oflabor laws is often thought to be weak.7
Workers in the informal sector are not directlyaffected by changes in labor legislation. They havefew rights and may work in conditions that are lesssanitary and more dangerous than those in formalemployment (Maskus 1997). Child labor tends tobe concentrated in the informal sector. Employ-ment in the informal economy depends on manyfactors (including the effects of labor regulationson costs in the formal economy), but especially onthe rate of overall growth in the economy.
One impact of the Asian financial crisis was ashift toward informal employment in many EastAsian economies (Betcherman and Islam 2001),
Trade and Competitiveness Aspects of Environmental and Labor Standards in East Asia 117
TABLE 7.1 Ratifications of Fundamental ILO Conventions Covering Worker Rights, SelectedEast Asian Countries
Convention (convention number)
Worst Freeforms Abolition dom
of of Equal Nondis- of Minimum child Forced forced remuner- crimin- associ- Collective
age labor labor labor ation ation ation bargaining(138) (182) (29) (105) (100) (111) (87) (98)
Cambodia Yes No Yes Yes Yes Yes Yes YesChina Yes No No No Yes No No NoHongKong (China) Yesa n.a. Yesa Yesa No No Yesa Yesa
Indonesia Yes Yes Yes Yes Yes Yes Yes YesKorea, Rep. of Yes Yes No No Yes Yes No NoMalaysia Yes Yes Yes No Yes No No YesPhilippines Yes Yes No Yes Yes Yes Yes YesSingapore No Yes Yes No Yes No No YesThailand No Yes Yes Yes Yes No No NoVietnam No Yes No No Yes Yes No No
n.a. Not applicable.Note: Words in boldface indicate ratification decisions since 1996.a. Indicates Hong Kong’s intention to comply with the conventions indicated, even though Hong Kong is not amember of the International Labour Organisation (ILO). Sources: OECD (2000) and www.ilo.org.

which suggests that working conditions deterio-rated on average. Although the shift was temporaryin much of the region, it has persisted in Indonesiaand the Philippines.8
Evidence on Labor Standards,Trade, and Competitiveness
Because the provision of workers’ rights affects thecosts of hiring workers, it may influence interna-tional price competitiveness. For example, the abil-ity of firms to require employees to work long hourswithout a premium for overtime, or to dischargeworkers with little notice or severance pay, presum-ably reduces their labor costs per unit of output,which may be significant in labor-intensive prod-ucts. Extensive government support programs fortraining and employment services can reduce aver-age labor costs, depending on how such programsare financed. Unfortunately, it is quite difficult toascribe changes in trade performance to suchactions, both because they are difficult to measure(particularly at the firm level) and because the rela-tionships are complex. This section considers theserelationships and reviews some general evidence.
Effects of Openness on Labor Standards and Conditions of Work
Table 7.2 gives an aggregate index of the strength oflabor standards across several developing countriesin the late 1990s (Verite 2002). Among East Asianeconomies, China, Indonesia, and Malaysia ranknear the bottom of this scale. Regulations in thelabor market depend on several influences, includ-ing economic openness, which vary across coun-tries and over time (Freeman 1994; Fields 1995;OECD 1996; Maskus 1997).
As the table suggests, a primary determinant oflabor standards is the level of income per person orper family in an economy. The poor may be littleable to refuse dangerous work. Clearly, extensivepoverty is the main factor underlying high rates ofchild labor participation (Grootaert and Kanbur1995). As incomes rise, the treatment of laborimproves for several reasons. First, the contributionof children to household income becomes lessimportant, and schooling becomes a higher-valuedalternative as parents become more capable ofinvesting in their children. The child labor supply in
many East Asian countries fell dramatically as thoseeconomies became richer (U.S. Department ofLabor 1994). Second, richer households gain greateraccess to credit markets, permitting them to investmore in acquiring skills. This investment can playan important role in decisions by rural householdsto keep their children in school, but it is also impor-tant for increasing adult productivity, which sup-ports better working conditions. Third, the demandfor tighter labor protection increases. This demandreflects both the impact of rising real wages—whichmake workers demand more protection to safe-guard their incomes from dismissal or injury—andthe nature of labor standards as public goods thatbecome more affordable as incomes increase.
Another important determinant of labor rightsis the endowment and output mix of the economy.In countries with abundant unskilled labor, firms inlabor-intensive sectors may view workers as easilyreplaceable and have few incentives to train them. Ineconomies with greater endowments of skilled laborand training, workers offer more differentiated—and more valuable—skills that make employersmore concerned about retaining them and aboutavoiding the output losses associated with occupa-tional injuries. Rapid growth emanating from theaccumulation of human capital tends to increase thedemand for better working conditions.
Yet another determinant of labor rights is thenature of competition in both the product andlabor markets. A firm that is the sole or mainemployer in a local labor market can suppresswages or working conditions.
A government’s willingness to legislate andenforce better labor standards depends on the politi-cal-economic situation. A strong positive correlationexists between democracy and the rights of workersto freely associate (OECD 2000), as corroborated bythe last column of Table 7.2. In countries withouteffective political competition, it may be difficult toestablish stronger standards, even where economicefficiency could be improved by doing so or wheremuch of the public would prefer such standards.
Effects of Changes in a Country’s Trade and Investment Regulations on Labor Standards
Tariff cuts could have several distinctive impacts onworkers, depending on the economic circum-stances of each country:
118 East Asia Integrates

• Relative price changes from trade liberalizationwould tend to push capital and labor into prod-ucts in which the country has a comparativeadvantage. This situation could either worsen orimprove net working conditions in the econ-omy, depending on whether conditions in theexpanding industries are worse or better thanthose in other sectors.9
• In labor-abundant countries, tariff cuts ordinar-ily would raise the real wages of less skilled laborand increase aggregate income. These impactsshould induce workers to demand strongerlabor standards. As a result, over time employersshould be willing to provide better working con-ditions.
• Trade liberalization can increase poverty undercertain circumstances.10 Wages in formal manu-facturing may fall significantly for workerswhose incomes had previously been protected.Workers who are laid off could end up in theinformal economy, pushing down wages there.Trade liberalization increases the prices ofexport goods, which may have a large weight inhousehold consumption baskets. To the extentthat openness to trade reduces wages andincreases poverty, labor standards and workerprotection will deteriorate. This impact wouldbe especially problematic in those regions thatare not competitive in producing exportablegoods. In East Asian developing economies,
Trade and Competitiveness Aspects of Environmental and Labor Standards in East Asia 119
TABLE 7.2 Overall Ranking of Labor Standards
Labor Fundamental Freedom Standards ILO PPP per House
Index, conventions capita GDP, Index, Country late 1990sa 1995 1999 1999 (US$) 1998–99b
Chile 83.3 3 7 8,720 5.5Argentina 80.8 6 7 12,258 5.0South Africa 78.0 1 5 8,994 6.5Korea, Rep. of 71.3 0 3 15.778 6.0Brazil 67.8 5 5 7,130 4.5Philippines 63.8 5 6 3,803 5.5Thailand 63.0 2 3 6,095 5.5Colombia 62.0 6 6 5,821 4.5Peru 59.0 6 6 4,626 3.5Venezuela 56.0 7 7 5,586 5.5Mexico 55.3 5 5 8,329 4.5Turkey 55.0 5 8 6,374 3.5India 46.5 3 3 2,250 5.5Malaysia 46.3 2 4 8,215 3.0Indonesia 44.5 3 7 2,873 3.0Egypt 44.0 6 7 3,423 2.0Pakistan 40.0 5 5 1,813 3.5China 36.3 1 2 3,620 1.5Correlations with Labor Standards Index 0.71 0.77
Note: PPP = purchasing power parity.a. This index is a weighted average of four broad categories: ratification of the fundamental International LabourOrganisation (ILO) conventions (see Table 7.1); a comparison of national labor laws with ILO standard recom-mendations; an evaluation of each government’s capacity to implement its laws and policies; and an assessmentof the level of compliance with or violations of the core labor standards.b. This index is the average of the figures for political rights and civil liberties from the Freedom House Web site(www.freedomhouse.org). Here they have been scaled so that a figure of 1 means the least political freedomand a figure of 7 means the most political freedom.Sources: Labor Standards Index (VERLS) from Verite (2002); GDP data from World Bank (2001c).

however, greater openness to trade has increasedincomes, reduced poverty, and improved work-ing conditions.11
• As the product markets of different countriesbecome more integrated through trade liberal-ization, firms may seek out locations withweaker standards. Studies of practices in devel-oped countries have found no evidence of a“race to the bottom” in labor standards (Maskus1997; OECD 2000). Unfortunately, it appearsthat no studies have been done of competitionin labor standards among developing countriesthat produce similar goods for export.
Labor Standards in Export Processing Zones
Some analysts view export processing zones(EPZs), or free trade zones, as examples of compet-itive standard setting.12 In many instances, workerswithin EPZs have been denied the rights to union-ize and bargain collectively, and safety and healthconditions are poor (Moran 2002). This complainthas been leveled at some of the EPZs in China,Indonesia, and the Philippines, suggesting that EastAsian countries may be competing in this way.However, no evidence was found that standards inEPZs had been weakened in the aftermath of theAsian financial crisis or because of additional tradeliberalization in the late 1990s.
By contrast, there is evidence that the operationsof multinational enterprises, even within EPZs,tend to improve working conditions and wages rel-ative to those in the rest of the economy.13 It is notdifficult to understand why multinational firms payhigher-than-average wages in developing countries.First, these firms invest much more in advancedindustries, such as electrical equipment, electron-ics, industrial machinery, and automobile parts,than in the less advanced industries such as gar-ments, textiles, footwear, and toys. Jobs in theadvanced industries require higher skills and payconsiderably higher wages than those in the lessadvanced industries. Second, these firms tend toproduce for export, which requires sustained qual-ity, specific skills, and limited absenteeism, and theyare willing to pay higher wages in return. Third,multinational firms typically bring superior tech-nologies to the factory floor, which raise productiv-ity and wages relative to those of domestic firms. Inthis regard, openness to foreign direct investment is
generally a force for raising labor standards ratherthan the other way around.
Evidence on the Effects of Labor Standards on TradePerformance and FDI
Have weak labor standards in East Asian develop-ing economies contributed positively or negativelyto the export performance of these economies andto their attractiveness for inward FDI? This is a dif-ficult question to answer. First, economic theorycannot establish a clear relationship between weak-ness in labor standards and international tradecompetitiveness.14 Second, labor standards andworking conditions are only two of numerousdeterminants of relative costs, and it is virtuallyimpossible to isolate their impacts using aggregatedata. A truly informative answer would requiredetailed survey work at the firm level and wouldtrack the dynamics of labor use over several years.Third, available aggregate measures of labor rightsare crude and cannot capture the subtleties of costimpacts or enforcement efforts, nor can they con-trol adequately for other influences on trade. Evi-dence on this subject must be treated with caution.
As for the relationship between labor standardsand international trade performance, Aggarwal’s(1995) study of manufacturing sectors in develop-ing countries found that workers in export-ori-ented firms received higher wages and benefits thanthose in less export-oriented firms. And countrieswith weak labor rights did not have higher importpenetration ratios in the United States than coun-tries with stronger labor rights. Rodrik’s (1996)cross-country econometric analysis found no rela-tionship between basic measures of labor standardsand international trade flows. Similarly, the Organ-isation for Economic Co-operation and Develop-ment (OECD 1996) found no relationshipsbetween labor standards and measures of exportperformance. Nor could the OECD authors detectany correlations between measures of revealedcomparative advantage and attempts to suppresslabor union rights, or any association between indi-vidual countries’ core labor standards and theprices of their exports of textiles and apparel to theUnited States. They concluded that differences incore labor standards have no detectable effects onpatterns of specialization, competitiveness, orexports.
120 East Asia Integrates

Van Beers (1998), analyzing OECD trade data,found a weak association between stricter laborstandards and lower exports of labor-intensivegoods. His index of labor standards included suchmeasures as maximum working hours, conditionsof employment contracts, and minimum wages,suggesting that strong security rights can negativelyaffect trade performance in richer nations. It maybe, however, that inflexible labor market mandatesreduce competitiveness rather than fundamentallabor standards.15
As for the relationship between labor standardsand FDI, Aggarwal (1995) found no associationbetween U.S. foreign direct investment and poorlabor standards; if anything, FDI from the UnitedStates was less concentrated than expected in coun-tries with low standards. Rodrik (1996) found someindication that FDI from the United States waslower than expected in countries with limited corelabor standards. OECD (2000) reported that largerinflows of FDI are associated with stronger laborrights. This study also reported growing evidencethat export processing zones with poor workingconditions are less likely to attract sustained, long-term FDI than those with better conditions. Kucera(2001) regressed aggregate flows of FDI into manydeveloping countries on several indexes of laborstandards. He found no statistical indication thatweak labor rights attract FDI, and some of his coef-ficients suggested that the opposite result holds.
The analysis just described suggests that weaklabor standards are capable of expanding exportsmost readily in labor-intensive goods such asapparel, textiles, footwear, and miscellaneous manu-factures such as toys and sporting goods. The Asianfinancial crisis may have reduced the relative costs ofproduction in labor-intensive exports for severalreasons. First, even if legislated labor standards werenot diminished during this period, authorities mayhave signaled a reduced commitment to enforcingworkers’ rights within labor-intensive industries.Second, the costs of acquiring inputs from subcon-tractors may have fallen quite sharply during thecrisis if wages fell in the subcontractors’ firms.Third, exchange rate changes may pass throughmore quickly to competitive sectors. Under such cir-cumstances, one would expect effectively weakerlabor standards to have raised the share of labor-intensive manufactures in total exports between1995 (before the crisis) and 1999 in East Asia.
At best, however, the data simply do not supportthis notion. Data on the shares of labor-intensiveproducts in total manufactured exports show that,except perhaps in China and Indonesia, the outputmix shift has, over time, shifted away from labor-intensive goods.16 The export data cannot revealmuch about how labor standards affected changesin trade shares, because numerous other factorscould have driven these changes.17 But data onlabor conditions in this period provide useful com-plementary insights (ILO 2002). Despite the largeincreases in unemployment between 1995 and 1999in Hong Kong (China), Indonesia, Korea, Malaysia,the Philippines, and Thailand, there was virtuallyno change in reported hours worked per week.Moreover, in these countries the number ofreported injuries per 100,000 fell sharply during1995–99. Thus, at least on these simple indicators,firms (in the formal sector) were not pressuringworkers to work harder or more dangerously.
For a more formal test of the hypothesis thatlabor standards have affected East Asian exports oflabor-intensive goods, and did so more stronglyafter the onset of the financial crisis, an economet-ric analysis was undertaken.18 The underlyingmodels are estimated for 1995 and 1999 to see ifany differences may have arisen during the crisis interms of the impact of standards on exports. (Ifweak labor rights were a factor raising exports oflabor-intensive manufactures, one would expect tofind a negative coefficient in both years. But if thenegative coefficient was larger in 1999 than in 1995,it would suggest that differential labor rights pro-vided a stronger impetus to exports in the latteryear.) This is at best a partial and crude test of thenotion that labor rights were effectively weakenedduring the crisis and that they helped to boostexports in the post-crisis period.
Three measures of labor standards were used: anindex of the strength of freedom of association (FA)rights in the exporting countries; the index of fourlabor standards developed by Verite (2002—VERLS,see Table 7.2); and the number of the eight funda-mental ILO conventions that were ratified by theexporting countries by 1995 or 1999 (see Table 7.1).
For two of these three measures of labor stan-dards, the results suggest that bilateral export vol-umes in labor-intensive goods actually rise asworker protection is increased—a finding that isparticularly true within East Asia (Table 7.3).19 The
Trade and Competitiveness Aspects of Environmental and Labor Standards in East Asia 121

122 East Asia Integrates
TABLE 7.3 Impacts of Labor Standards on Labor–Intensive Exports from Developing Countries
Model 1 Model 1 Model 2 Model 2 Model 3 Model 3 Variable (1995) (1999) (1995) (1999) (1995) (1999)
NAFTA 2.37*** 3.53*** 2.52*** 3.62*** 2.07*** 2.86***Political freedom –0.30*** –0.19*** –0.82*** –0.91*** –0.27*** –0.11**East Asia 1.05* 3.13*** 2.80*** 4.28*** 1.59*** 0.05South Asia 8.18*** 5.46*** 16.9*** 6.11*** –0.09 –1.56Latin America 2.37** 1.34 1.55* 6.18*** 0.69 0.72FA rights 0.60*** 0.66***
(1.37) (1.59)FA rights • East 0.94*** –0.32Asia (2.13) (1.32)
FA rights • South –2.42*** –1.52***Asia (0.71) (1.15)
FA rights • Latin –1.18** –1.03**America (0.27) (0.57)
VERLS 0.09*** 0.14***(5.28) (8.22)
VERLS • East Asia 0.01 –0.02(5.41) (7.81)
VERLS • South Asia –0.21*** –0.04(3.31) (7.94)
VERLS • Latin –0.03** –0.11***America (4.56) (5.57)
ILO-F –0.16** –0.52***(–0.62) (–2.69)
ILO-F • East Asia 0.38*** 0.42**(–0.10) (–1.93)
ILO-F • South Asia 0.85*** 0.71***(–0.23) (–2.25)
ILO-F • Latin –0.19** –0.27America (–0.92) (–3.27)
No. of observations 1,700 1,700 1,700 1,700 1,700 1,700R–squared 0.74 0.76 0.75 0.77 0.74 0.77
* Significant at 10 percent level.** Significant at 5 percent level.*** Significantly different from zero at 1 percent level. Notes: FA = freedom of association; ILO-F = fundamental International Labour Organisation conventions.The coefficients come from gravity models of bilateral exports from 17 developing countries to 20 OECDimporters listed below. Each equation is estimated as an augmented gravity model with controls for importer and exporter GDP, importerand exporter population, bilateral distance, and industry fixed effects. Standard errors are robust to heteroskedasticity.Figures in parentheses are elasticities calculated at sample means.Export values are included for the set of labor-intensive industries listed below.The regressions include standard gravity variables (logs of importer and exporter GDP levels, logs of importer andexporter population levels, and the log of distance between trading partners), a dummy variable for NAFTA whenthe exporter is Mexico and the importer is either the United States or Canada, an index of political freedoms fromthe Freedom House Web site (www.freedomhouse.org), industry fixed effects, regional fixed effects, a measure oflabor standards, and interaction terms between labor standards and regional dummies. Data on GDP (in billions ofU.S. dollars in purchasing power parity terms) and population (in millions) are from World Bank (2001c). Distance isthe number of kilometers (in thousands) between capital cities. The index of political freedoms is the simple averageof the “political freedom” and “civil liberties” indicators from Freedom House (www.freedomhouse.org), rescaled sothat an increase in the index here signifies an increase in political rights. Labor-intensive industries are defined as ISIC(International Standard Industrial Classification) 321, 322, 323, 324, and 390. Exporters are Argentina, Brazil, Chile, Colombia, Mexico, Peru, Venezuela (Latin America); India, Pakistan (SouthAsia); China, Indonesia, Republic of Korea, Malaysia, the Philippines, Thailand (East Asia); Egypt, and South Africa.Importers are Australia, Austria, Canada, Denmark, Finland, France, Germany, Greece, Japan, Ireland, Italy, theNetherlands, New Zealand, Norway, Portugal, Spain, Sweden, Turkey, United Kingdom, and United States.Source: The author.
balance of evidence does not support the view thatweak labor rights promote exports in these goods,nor does it suggest decisively that during the finan-cial crisis weak labor rights translated into strongerlabor-intensive exports.
The policy message that emerges is that EastAsian developing countries need not delay in intro-ducing core labor standards. Doing so will notreduce their competitiveness in labor-intensivemanufactured exports and could well increase it.However, they should exercise caution in imple-menting stronger measures that could limit flexibil-ity in formal labor markets.20
Environmental Protection: Background and Institutions
It is beyond the scope of this chapter to attempt acomprehensive review of environmental regulatoryregimes. All the major East Asian economies havesome form of regulatory regime and institutionsaimed at protecting the environment or promotingsustainable resource use. But these regimes varyconsiderably in terms of resource commitments,enforcement capacity, and regulatory mechanisms(Esty and Cornelius 2002).
Did the onset of the financial crisis affect envi-ronmental use and policy in the region? Reportssuggest that the crisis did alter various indicators ofenvironmental damage, though in different ways.In many cities, the short-term effect of economiccollapse was improved air quality as industrial pro-duction slackened and as vehicles were used less inreaction to lower product demand and, in somecases, sharply higher fuel prices (World Bank1999). By 1999, however, air pollution indexes wereregaining and perhaps exceeding their previous lev-els. Water quality is relatively insensitive to short-term changes in industrial activity and householdconsumption, and so water quality measureschanged little. But sanitation conditions deterio-rated markedly in many locations because growingamounts of industrial and toxic waste were notbeing disposed of properly. Industrial pollutionworsened somewhat in some countries, perhapsbecause of weaker regulatory control and reducedcompliance by firms. In several countries such asIndonesia, some urban dwellers responded to thefinancial crisis by returning to the countryside,which placed more stress on natural resources and
farming communities. The collapse also seemed tospeed deforestation in Indonesia and Vietnam,although a reduction in export demand in Japanand Korea offset this problem initially (Marinova1999; World Bank 1999, 2001b). Finally, there areindications that fishing stocks and coral reefs havecome under greater stress as a result of risingunemployment, although most such pressures arelong term rather than cyclical (World Bank 1999;World Resources Institute 2002).
Like for labor standards, there is little indicationthat governments actively reduced their legislatedor formal environmental regulations during thecrisis period. In fact, since 1997 some economieshave adopted stricter regulation or greater incen-tives for conservation:
• China tightened its industrial point source pol-lution control and deforestation regulations inthe late 1990s (World Bank 2001a), and it hasincreased pollution discharge fees to levels atleast as high as treatment costs (APEC 2001).
• Hong Kong is subsidizing projects to developgreen production technologies, develop newwaste treatment systems, and promote ISO14000 environmental standards. Vietnam hasannounced a reforestation program (WorldBank 2001a).
• Korea’s Ministry of Environment has expandedits programs for pollution prevention, includingcertification of enterprises, and it has begunrequiring compliance with certain OECD stan-dards. It also has expanded tax incentives andprocurement policies for recycling (World Bank2000). Korea adopted a new law in December1998 that revises the Waste Management Act.The new law clarifies and increases landowners’liabilities for abandoned waste, which hasbecome a significant and costly problem to cleanup. By 1999 Korea had eased up on its regula-tions in the textile dyeing industry, despite alarge drop in output. However, perhaps relatedto the financial crisis, Korea decided to delayrevising some air quality standards in 1997. Andrecently the government has shifted towardderegulation of onerous mandates and self-cer-tification and voluntary compliance by busi-nesses.
• Thailand recently implemented a series of plansfor enhancing and conserving national environ-
Trade and Competitiveness Aspects of Environmental and Labor Standards in East Asia 123

mental quality (APEC 2001). This approachincludes both tighter pollution control, imple-menting the “polluter pays” principle, and pro-grams to promote the development of new tech-nologies.
However, in the countries affected strongly bythe slowdown, the associated fiscal problems havereduced public expenditures on environmentalprotection (World Bank 1999, 2001a).21 Thisreduced spending has been a significant problem inIndonesia, where the administrative and regulatoryframework does not encourage sustainable use ofthe environment. It is likely that the collapse of cen-tral government authority exacerbated Indonesia’sfiscal difficulties. Forest loss has continued, landuse management problems remain severe, andinadequate wastewater treatment and the dumpingof hazardous wastes have not abated. Some com-mentators view Indonesia’s ongoing devolution ofadministrative authority to local governments asdamaging for environmental protection, becausethese governments may not have effective capaci-ties or budgets for the job and may be particularlyprone to weak and nontransparent enforcement. Inthe Philippines, fiscal stringency has had a mixedeffect on incentives for environmental resource use(World Bank 1999). Environmental budget cutswere reported, but fiscal pressures also resulted inreductions in subsidies to coal production and fuelconsumption, with associated increases in userprices.
Remarkably little research has been done on therelationships among the environment, the financialcrisis, and trade in East Asia. The following researchagenda, which could be pursued by nationalauthorities, international organizations, or researchinstitutions, would substantially improve under-standing of the processes at work:
• How the Asia financial crisis affected the use ofenvironmentally damaging agricultural inputsand whether changes in such use were needed tosustain trade flows
• Whether exchange rate changes associated withthe crisis altered demand for imported inputsthat might have limited toxic discharges
• Whether multinational firms had a greater orlesser propensity than domestic firms to ignorecost-increasing environmental regulations.
Evidence on Environmental Protection, Trade, and Competitiveness
The links between declines in economic activityand environmental degradation are complex andnot easily predicted. The same is true for the linksbetween openness to trade and FDI and use of theenvironment. These impacts presumably work inboth directions and depend on circumstances.
How Does Openness Affect Environmental Protection and Use?
Grossman and Krueger (1993) describe the impactsof changes in an economy’s fundamental vari-ables—endowments, prices, technologies, and poli-cies—on the aggregate use of the environment.22
Drawing on their framework, I use the word emis-sions as a proxy for all forms of environmental use,including air and water pollution, deforestation,habitat destruction, and waste deposits. In the sim-plest terms, the amount of emissions an economygenerates depends on three essential factors: thesize of the economy, the share of output producedby emission-intensive (“dirty”) sectors, and thedegree of emissions intensity in those sectors.
Any change in pollution emissions can thereforebe decomposed into three effects. The scale effectrefers to an increase in emissions associated with alarger gross domestic product (GDP), holding con-stant the relative mix of outputs and pollutionintensities across sectors—that is, a 10 percentincrease in all productive factors, everything elseheld constant, should raise pollution by 10 per-cent.23 The composition effect refers to a change inthe share of dirty goods in the GDP, which maycome about because of a price change. With a con-stant scale of the economy and no change in emis-sions intensities per industry, a rise in the share ofdirty goods would increase total pollution. Thetechnique effect refers to a change in the amount ofemissions per unit of output across sectors (an“emissions-intensity” change)—for example, asproducers change technologies in response to ahigher pollution tax.24 This typology can be used toanalyze the impacts of trade liberalization and FDIon the environment.
Trade liberalization reduces impediments toimports and exports25 and affects use of the environ-
124 East Asia Integrates

ment through its effects on prices, which then filterthrough to production and consumption. For exam-ple, suppose that an East Asian developing economyhas abundant labor and therefore has a comparativeadvantage in labor-intensive goods. Freeing up tradewould raise the price of labor-intensive goods in thiseconomy and shift capital and labor into productionof these goods. If these goods are produced withcleaner technologies on average, overall emissionswill fall as the composition of output shifts awayfrom dirtier goods. (Note that emissions could rise ifthe goods that a country exports are dirtier; compar-ative advantage is an important factor.) The shift inthe composition of output after trade liberalizationraises the aggregate productivity in the economy,and thereby raises real GDP. The scale effect of tradeliberalization is thus to increase pollution. Finally, asaggregate and per capita incomes rise from freertrade, so does the demand for a cleaner environ-ment.26 Thus the technique effect of trade liberaliza-tion is to improve the environment by reducingemissions per unit of output.27
The same framework can be used to assess theeffects of an increase in foreign direct investmenton environmental quality. If multinational firmsexist disproportionately in dirtier industries, theirarrival in a country has an effect like an increase inthe capital stock that worsens the environmentthrough the composition effect. But if they existdisproportionately in cleaner industries, theirarrival can improve the environment. By expandingeconomic activity, multinational firms would gen-erate a scale effect that increases the effects of firms’activities on the environment.28 Perhaps most fun-damentally, the operations of multinational firmscan generate beneficial technique effects. For a vari-ety of reasons, they are likely to transfer cleanertechnologies, developed in their home economies,to recipient countries (Moran 2002). If they payhigher-than-average wages without generating off-setting unemployment, the impact would be higherper capita incomes and an induced demand forstronger environmental protection. Thus, even ifmultinational firms do not alter much the compo-sition of output, one would expect their operationsto improve environmental stewardship. In this con-text, economies that are more open to FDI, otherthings being equal, would tend to have strongerenvironmental standards and cleaner technologies.However, this is an empirical issue.
Important evidence is available on the effects oftrade liberalization on the environment, and whatfollows is only a selective and brief review.
The most prominent study is by Antweiler,Copeland, and Taylor (2001), covering the effects oftrade liberalization on air pollution in 44 coun-tries.29 They find that international trade generatesrelatively minor changes in concentrations of airpollution when it alters the composition of output,but that the associated technique and scale effectsreduce pollution. Overall, they find that withintheir sample greater openness to trade actuallyreduces air pollution on average.
Beghin and others (2000) consider the relation-ships between trade liberalization and pollution inChile. In their computable general equilibriummodel, unilateral liberalization substantially wors-ens air pollution by providing cheaper and dirtierenergy sources. But if this trade policy were com-bined with an appropriate tax on emissions, Chilewould reap significant welfare gains.30
Dean (2002) analyzes the impacts of trade liber-alization on water pollution in Chinese provincesduring 1987–95, a period in which there was bothan extensive pollution levy system and a significantopening to trade. She finds that trade liberalizationhas aggravated environmental damage, becauseChina has a comparative advantage in pollution-intensive goods, but that greater openness has alsoraised per capita incomes, mitigating the environ-mental costs through stronger regulation. She alsofinds that emissions per unit of industrial output inChina would have been much higher without tradereform, so that China’s opening to trade was benefi-cial for the environment overall.
Arunanondchai (2001) assesses the impacts thatcuts in tariffs and export taxes on logging and tim-ber products would have on Indonesian andMalaysian exporters. She finds that trade liberaliza-tion would not necessarily raise log production,because it might not raise net producer prices, butthat foreign tariff cuts in plywood and sawn lumberwould generate significant gains for Indonesia. Shealso finds that removal of export taxes on logswould reduce world log prices, tending to worsenthe joint welfare of exporting nations.
APEC (1999) assesses the effects of selected non-tariff restraints on trade in forest products. Theauthors find that multilateral removal of taxes andsubsidies would generate some gains for timber
Trade and Competitiveness Aspects of Environmental and Labor Standards in East Asia 125

exporters, but they claim that the data were insuffi-cient to assess the environmental impacts of suchliberalization.
In summary, the literature suggests it is not pos-sible to predict the implications of trade liberaliza-tion for use of the environment and economic wel-fare in general, but the balance of econometric andempirical evidence suggests that it can be benefi-cial. Studies of the effects of FDI on environmentaldamage are surprisingly scarce.31 Moran (2002) hasprovided some anecdotal evidence that multina-tional firms are associated with improvements inuse of the environment, but such improvementsdepend on the industry.
Evidence on Environmental Standards and Competitiveness
The “pollution haven hypothesis” has attractedmuch study. What is the evidence that weak envi-ronmental protection either generates an exportadvantage or attracts FDI? In principle, one mightexpect weak regulation to be more strongly identi-fied with trade performance and FDI for the envi-ronment than for labor standards. After all, unlikeworkers, the environment cannot complain orshirk when it is treated badly. Therefore, the abilityto exploit it without regulation could reduce costs,at least up to the limits from congestion.
Past Evidence. This prediction is borne out in a 24-country study of environmental standards andtrade by Wilson, Otsuki, and Sewadeh (2002).32
Their results suggest that more stringent environ-mental laws reduce net exports of pollution-inten-sive goods. Thus weak environmental regulation isassociated with higher trade performance. More-over, they find that a hypothetical trade agreementto harmonize environmental protection laws at lev-els higher than those in developing countries wouldreduce trade by up to 11 percent a year.
Their study is unique in its findings, however.Earlier studies discovered no evidence that a coun-try with stricter environmental standards wouldhave lower exports of pollution-intensive goods(Tobey 1990; Low and Yeats 1992; Xu 1999). Mostobservers have concluded that, because environ-mental controls typically amount to a small per-centage of total costs, they are relatively unimpor-tant in determining trade patterns.
Levinson and Taylor (2001) find that in theUnited States during the 1970s and 1980s, thelargest relative increases in sectoral net importswere in those industries experiencing the largestincreases in environmental control costs. Thustrade flows do react to such regulation. Unfortu-nately, because there are no comparable measuresin developing countries, it is impossible to deter-mine whether this result holds more widely.
The literature gives little support for the hypoth-esis that FDI responds to international variations inenvironmental costs. For example, Eskeland andHarrison (1997) find almost no evidence thatmultinational firms investing in developing coun-tries are attempting to escape higher environmentalcosts in their home countries. They also find thatforeign-owned plants in developing countries areless polluting than comparable domestic plants.Wheeler (2001) discusses why the “race to the bot-tom” idea in environmental standards makes littlesense in terms of attracting FDI. He finds thatindexes of air pollution actually improvedmarkedly in the major cities in China, Brazil, andMexico during an era of extensive investmentinflows. Smarzynska and Wei (2001) examine firm-level data in 24 transition economies, controllingfor corruption levels, and find little support for thepollution haven idea (see also Jaffe and others1995). Levinson (1996) finds no evidence that dif-ferences in environmental standards across statesaffect the location choices of manufacturing plants.
This view is not universal, however. Lucas,Wheeler, and Hettige (1990) claim that increasinglystrict environmental regulations in OECD coun-tries led to the displacement of pollution-intensiveindustries. List and Co (1999) find that FDI in theUnited States was negatively related to regulatoryexpenditures per firm. Mani, Pargal, and Huq(1997) discover that in India spending on environ-mental damage abatement was higher in more pol-lution-intensive industries and was a factor in plantlocation decisions. Keller and Levinson (2002)point out problems with endogeneity in such mea-sures. The issues are inherently empirical.
Evidence from East Asia. Available measures sug-gest that environmental protection regulations arenot very stringent in East Asia. Table 7.4 lists twoindexes of environmental regulation in severaldeveloping countries. The first is an environmental
126 East Asia Integrates

sustainability index, which is a compilation of sev-eral categories involving resource use, pollutantconcentrations, and infrastructure. The correlationof environmental sustainability with per capitaGDP is positive and significant at 0.37, but wellbelow unity. The environmental sustainabilityindex is correlated positively with the political free-dom ranking in Table 7.2, but only weakly. The sec-ond environmental policy index measures thestringency of environmental regulations. Thisindex too is positively correlated with per capitaGDP, but it is not correlated with the measure ofpolitical freedom.
One might expect a reduction in costs resultingfrom weaker, or more weakly enforced, environ-mental standards to be reflected in increases in theshare of pollution-intensive goods in manufacturedexports for East Asian economies. But, in fact,trends in shares of pollution-intensive exports vary
widely across these economies.33 Indonesia pro-vides the most straightforward support for the ideathat the financial crisis pushed the composition ofoutput toward pollution-intensive sectors—a shifttoward dirtier industries took place in its totalexports and its exports to the European Union andthe United States. This shift is consistent with thefact that Indonesia’s output of dirty goods rose rel-ative to that of other goods during the crisis (WorldBank 2001b). The export share of dirty industriesalso rose in Korea from 1997 to 1998 before fallingagain in 1999, and there is some indication of simi-lar increases in the Philippines and Thailand in1999.34
To investigate further the relationship betweenenvironmental protection and exports of pollu-tion-intensive goods, I undertook an econometricanalysis based on models whose essential structureis the same as those applied earlier to the labor
Trade and Competitiveness Aspects of Environmental and Labor Standards in East Asia 127
TABLE 7.4 Environmental Policy Indexes
Environmental Environmental Sustainability Regulatory Regime PPP per capita
Country Index, 2001 Index, 2001a GDP, 1999 (US$)
Argentina 62.9 –0.732 12,258Brazil 57.4 –0.077 7,130Chile 56.6 0.177 8,720Colombia 54.8 –0.416 5,821Peru 54.3 –0.722 4,626South Africa 51.2 –0.029 8,994Venezuela 50.8 –1.079 5,586Malaysia 49.8 –0.127 8,215Egypt 46.4 –0.224 3,423Turkey 46.3 n.a. 6,374Mexico 45.3 –0.602 8,329Thailand 45.2 –0.389 6,095Pakistan 43.4 n.a. 1,813Indonesia 42.5 –0.758 2,873India 40.7 –0.759 2,250Korea, Rep. of 40.3 –0.121 15,778China 37.5 –0.348 3,620Philippines 35.6 –1.014 3,803Correlation with GDP per capita 0.37 0.41Correlation with Freedom House
Index, 1998–99 0.17 –0.03
n.a. Not applicable.Note: PPP = purchasing power parity.a. Most values are negative because the measure is scaled across all countries (including OECD members) to bezero for the average regime. Sources: Sustainability and regulatory regime indexes are from Esty and Cornelius (2002). GDP data are fromWorld Bank (2001c).

standards.35 The two measures of environmentalstandards used are the environmental sustainabilityindex and the environmental regulatory regimeindex shown in Table 7.4. Also included are theindex of political freedom, a dummy for jointimporter-exporter membership in the NorthAmerican Free Trade Agreement (NAFTA), andregional fixed effects. The results are shown inTable 7.5.
Overall, it is difficult to reach any confident con-clusions from the results of the numerical analysis.From the changes in export shares by country, itappears that those countries hardest hit by theAsian crisis tended to shift more output andexports into pollution-intensive sectors. But theeconometric analysis provides little evidence thatweaker environmental standards are associatedwith higher exports of pollution-intensive goods.
128 East Asia Integrates
TABLE 7.5 Impacts of Environmental Standards on Pollution-Intensive Exports from Developing Countries
Model 1 Model 1 Model 2 Model 2Variable (1995) (1999) (1995) (1999)
NAFTA 2.38*** 2.33*** 2.33*** 2.82***Political freedom 0.38*** –0.82 –0.35*** –0.08East Asia 15.8*** 25.7*** –2.12*** –1.25***South Asia –237.4*** –247.6*** 0.18 –0.09Latin America 21.2*** 29.8*** –2.44*** –2.95***Environmental 0.46*** 0.61***sustainability (ES) (21.6) (28.7)
ES • East Asia –0.30*** –0.51***(16.1) (19.3)
ES • South Asia 5.85*** 6.17***(51.9) (60.6)
ES • Latin America –0.46*** –0.64***(13.2) (16.9)
Environmental regime (ER) 16.0*** 14.9***(8.32) (7.75)
ER • East Asia –16.3*** –14.1***(5.01)a (4.44)a
ER • South Asia –13.1*** –10.9***(7.57) (7.00)
ER • Latin America –14.2*** –13.9***(5.44) (4.87)a
Number of observations 2,880 2,880 2,880 2,880R–squared 0.55 0.58 0.56 0.58
* Significant at 10 percent level.** Significant at 5 percent level.*** Significantly different from zero at 1 percent level. Note: Each equation is estimated as an augmented gravity model, with controls for importer and exporter GDP,importer and exporter population, bilateral distance, and industry fixed effects. Standard errors are robust toheteroskedasticity. Figures in parentheses are elasticities calculated at sample means. Pollution-intensive goods are ISIC (International Standard Industrial Classification) 332, 341, 351, 352, 353, 356,371, and 372. Exporters are Argentina, Brazil, Chile, Colombia, Mexico, Peru, Venezuela (Latin America); Bangladesh, India(South Asia); China, Indonesia, Republic of Korea, Malaysia, the Philippines, Thailand, Vietnam (East Asia);Egypt, and South Africa. Importers are Australia, Austria, Canada, Denmark, Finland, France, Germany, Greece,Japan, Ireland, Italy, the Netherlands, New Zealand, Norway, Portugal, Spain, Sweden, Turkey, United Kingdom,and United States. a. Not significantly different from zero at the 10 percent level.Source: The author.
At best, there is no strong or systematic indicationthat the crisis significantly augmented exportsbased on pollution havens in East Asia.
Environmental Protection and theDoha Round
The Doha Round of multilateral trade negotia-tions at the World Trade Organization (WTO)would be the first round to consider linkagesbetween environmental protection and trade.Many developing countries have raised concernsabout the potential implications of environmentalprotection for their trade opportunities. This sec-tion reviews the environmental provisions of theDoha Declaration and the scope of the upcomingnegotiations, and comments on potential obliga-tions for East Asian economies.
The Doha Declaration calls on countries to
• Clarify relationships between WTO rules andtrade obligations under various multilateral envi-ronmental agreements (MEAs).36 Further clarifi-cation is needed about whether trade sanctionsissued under the Montreal Protocol, the Con-vention on International Trade in EndangeredSpecies (CITES), and other agreements are con-sistent with WTO obligations. To date, suchsanctions have been effectively exempted fromthe WTO, and this exemption is likely to becomea formal interpretation in the Doha Round. It isconceivable that a broad interpretation couldlimit export opportunities in certain goods inthe future, even as it gives East Asian countriesgreater scope to limit imports. However, accord-ing to the Doha Declaration, negotiations onsuch linkages must be undertaken without alter-ing the WTO rights of countries that are notmembers of an associated MEA. Thus thereshould be little reason for concern about facingtrade restrictions by virtue of not joining MEAs.
As for toxic waste disposal, developing coun-tries need to know whether current or potentialWTO rules allow them to ban imports of toxicwastes and products. A clarification of restraintsunder the Basel Convention and WTO obliga-tions is needed. Under the Basel Convention,which was ratified or acceded to by all majorEast Asian economies by 2000, transboundarymovements of hazardous wastes or other wastes
can take place only after prior written notifica-tion by the exporting country authorities to thecompetent authorities of the importing countryand to countries through which they mighttransit. Each shipment of hazardous waste mustthen be accompanied by documentation or bedeemed illegal. Exports of toxic wastes to certaincountries are banned outright. Cross-bordermovements can take place, however, if theexporting nation lacks the capacity to manage ordispose of the hazardous waste in an environ-mentally sound manner. The Basel Conventionclearly anticipates that importing governmentsmay closely regulate the disposal of hazardouswastes because they must agree to the documen-tation and may monitor execution of the trans-action. The convention falls short of permittingindividual countries to ban such imports,though a proposed amendment provides forcountries to ban exports. Whether importerscould issue such bans presumably depends on alegal interpretation of Article XX of the GeneralAgreement on Tariffs and Trade (GATT), whichpermits trade restraints in order to protect envi-ronmental and human health. However, suchregulation must be consistent with nationaltreatment, so that imported waste is not treatedworse in the commercial sense than is domesticwaste. In poor countries, waste treatment tendsto be weakly regulated, suggesting that importlimitations could be problematic under WTOrules.
• Reduce or eliminate trade barriers to environmen-tal goods and services. Such barriers raise costs tocountries that must import technology if theywish to mitigate environmental problems.Obligations to cut import tariffs and open ser-vice markets may run into political economyconcerns, but they can effectively complementdomestic environmental policy.
• Clarify rules on the effects of environmental regu-latory measures on market access. These rulesseem to be aimed mainly at efforts by developedand middle-income countries to restrict trade inorder to achieve (indirectly) some environmen-tal goal.37 It remains to be seen whether suchclarification would expand the scope of unilat-eral action to restrict trade or whether it wouldimpose additional obligations on countries thatlimit imports.
Trade and Competitiveness Aspects of Environmental and Labor Standards in East Asia 129

• Identify cases where reducing trade restrictionsand economic distortions would benefit the envi-ronment, trade, and economic development.Prominent examples would be subsidies to coaland other forms of carbon-based energy and towater use in agriculture. Reductions in such sub-sidies bear considerable promise for improvinguse of the environment while raising marketaccess to new technologies and agriculturalproducts (Anderson 1996). Negotiations on thispoint should give East Asian economies anopportunity to rationalize their trade policywith resource subsidies and other policies.
• Clarify provisions of the intellectual propertyagreement in the WTO that could affect the tradeand transfer of environmental technologies. Thereare concerns that stronger private propertyrights that exclude unauthorized use—includ-ing by governments—of technologies, products,and services able to reduce environmental prob-lems might make environmental managementmore costly.
• Consider the scope for environmental labelingrequirements on products. Effective labelingrequirements could be beneficial in restrainingthe use of blunter trade restrictions, althoughmeeting the costs of labeling could be high.
Finally, the declaration pledges that developedcountries will commit to increasing technical andfinancial assistance for meeting international envi-ronmental needs.
This set of negotiating objectives aims to addressthe existing inconsistencies in and shortcomings ofthe trading system rather than permit the introduc-tion of extensive new trade control regimes. There-fore, East Asian developing economies should not beoverly concerned about the introduction of environ-mental issues into the WTO, because those issues arealready included in various ways. The scope of nego-tiations as set out in this section would not raisemuch concern about market access, although devel-oping country members should perhaps be particu-larly wary about labeling requirements.
Policy Implications
The analysis in this chapter finds little evidence thatEast Asian governments have relaxed their stan-dards on working conditions or on environmental
stewardship. If anything, it finds a continuing trendtoward stronger regulation. However, public expen-ditures devoted to social safety nets for workers andto enforcement of environmental laws suffered insome countries affected by the 1997–98 financialcrisis, and there is anecdotal evidence of declines inworking conditions and environmental protectionduring the crisis.
Unfortunately, it is quite difficult to tracewhether these processes have boosted exports. Eco-nomic theory and evidence from past studies sug-gest that weak labor rights are not correlated withexport performance, even in labor-intensive goods,and that they are negatively correlated with aneconomy’s attractiveness to foreign direct invest-ment. They also suggest that weak environmentalregulations are not a significant determinant ofexports or FDI in most circumstances. Given thisbackground, it is not surprising that the economet-ric work performed for this study finds no indica-tion that weak labor rights or environmental stan-dards are positively correlated with exportperformance. There is evidence on the labor sidethat stronger rights are associated with higherexports of labor-intensive goods, although thatfinding depends on the measure of labor standardsused. Environmental protection indexes also seemto be positively but weakly correlated with EastAsian exports in pollution-intensive goods. In sum-mary, although it is difficult to be confident aboutsuch inferences, I could find no significant evidencein the data that weak labor rights or environmentalstandards boost East Asian exports.
If the results are taken seriously, important pol-icy messages emerge. East Asian developing coun-tries have weaker measured labor and environmen-tal standards, relative to per capita income, than doother developing regions. To the extent that thesepolicies have supported flexibility in labor markets,they may be beneficial for export competitiveness.However, these countries have considerable roomfor improving their protection of fundamentallabor rights and environmental standards. Doing sowould not reduce their ability to export labor-intensive goods or pollution-intensive goods;indeed, export growth can be compatible with rais-ing core labor standards and environmental protec-tion. In short, the developing economies of EastAsia can feel comfortable in applying greaterweight to social considerations in setting their poli-
130 East Asia Integrates

cies without significant fear of deterring exportgrowth.
Endnotes
1. Such a situation can arise directly if, for example, absenceof collective bargaining by workers permits monopsonisticemployers in particular regions to restrain wages and out-put (Martin and Maskus 2001).
2. For extensive reviews, see Maskus (1997), OECD (1996,2000), and Elliott (2001).
3. The right to strike is not generally considered a core laborstandard.
4. Many such benefits may be provided by employers volun-tarily or through collective bargaining arrangements. Thusgovernment regulation may simply provide a floor forthese rights.
5. An across-the-board set of requirements might be offset bydepreciation of the home currency, with little net impact oninternational competitiveness (Sykes 1995). The claim thatstrong civic and security rights may raise costs is not univer-sally accepted; institutional labor economists argue thatsuch rights increase the attachment of workers to firms andskills, which can lower costs. It is an empirical question.
6. Note, however, that ratification signals only an intention tocomply with a convention, not a country’s actual labor mar-ket policies. The ILO has little scope for enforcing theserights. Conversely, a decision not to ratify does not meanthat the inherent rights in a convention are denied. Govern-ments may provide such rights while objecting to the lan-guage of a particular convention. The United States, forexample, has ratified only two of these conventions (105and 182), but its practices largely comply with ILO expecta-tions. A review of labor standards in eight East Asian coun-tries appears in the technical appendix to this chapter atwww.worldbank.org/eaptrade, the Web site for this volume.
7. According to information on the ILO Web site, between1997 and 2001 unions issued two complaints about govern-ment practices in China, one in Hong Kong, one in Cam-bodia, one in Indonesia, two in Korea, one in the Philip-pines, one in Thailand, and none in Malaysia, Singapore, orVietnam.
8. In the Philippines, the gross primary school enrollmentrate, which is strongly and negatively correlated with childlabor, fell from 99.2 percent in 1997–98 to 98.1 percent in1998–99 (Lim 2000). Overall, however, there is no evidenceof a significant increase in child labor use during the crisisin the Asia-Pacific region.
9. In export-oriented, labor-intensive sectors in labor-abun-dant countries that have weak labor standards, conditionsof work would deteriorate. However, if the effect of tradeliberalization is to draw workers from the informal sector,net conditions could improve. Overall, whether the infor-mal sector expands or contracts would depend on the cir-cumstances (Maskus 1997).
10. See Dollar and Collier (2001) and McCulloch, Winters, andCirera (2001) for an extensive discussion.
11. Dollar and Collier (2001) and Dollar and Kraay (2002) aretwo of many sources on the effects of more open trade onEast Asia. The child labor force participation rate in the EastAsia–Pacific Region fell from 21.5 percent in 1995 to 19 per-cent in 2000, despite the economic crisis (UNICEF 1999;ILO 2002). Although for various reasons these estimates
may not be strictly comparable, they do not suggest thatchild labor use significantly increased during the crisis.Edmonds and Pavcnik (2002), who studied household sur-veys in Vietnam, discovered that an increase in the real priceof rice in the 1990s, associated largely with a decision tophase out the export quota on rice, raised net incomes ofrural households enough to reduce the use of child laborsharply. By their estimates, a 30 percent increase in the priceof a kilogram of rice led to a decline of nine percentagepoints in the use of child labor. The children, especially sec-ondary school–age girls, were able to go to school instead.
12. EPZs are regions within an economy that offer firms—often multinational enterprises (MNEs)—tax advantages,free importation of inputs (or duty drawbacks), infrastruc-ture development, and other inducements to locate thereand produce goods for export (Madani 1999; Moran 2002).
13. Romero (1995) reports extensive evidence that wages aresignificantly higher in manufacturing jobs within EPZs thanin similar positions outside. Moran (2002) provides ampleanecdotal evidence that MNEs pay wages 20–25 percenthigher than those paid by domestic firms for similar jobs.He also describes a process of continuing improvements inthe 1990s in safety conditions, minimum wages, and bene-fits packages within several EPZs, including two (Mactanand Baguio City) in the Philippines (also see Jacobson1999). Drezner (2001) reviews theories of why multina-tional firms are likely to be a force for raising standards.
14. See the discussion in the technical appendix to this chapterat www.worldbank.org/eaptrade.
15. Mah (1997), who studied 45 developing countries, foundthat the ratio of exports to gross domestic product (GDP)correlated negatively with decisions to ratify fundamentalconventions on freedom-of-association rights and rights tonondiscrimination. But the lack of control variables in theequations estimated renders these results questionable.
16. Figures on the shares of labor-intensive manufacturedexports in 1995–99 for eight East Asian economies are inAppendix Figure 1 of the technical appendix to this chapterat www.worldbank.org/eaptrade.
17. For example, the growth in volume of exports of appareland textiles to key markets may have been constrained byquotas. It is also possible that the price impacts of depreci-ating exchange rates were relatively greater for labor-inten-sive goods, tending to reduce their values if not volumes.
18. Details of this analysis appear in the technical appendix tothis chapter at www.worldbank.org/eaptrade.
19. The results using the third measure differ from those usingthe first and second ones. Close consideration of the threemeasures provides insight. The OECD measure of free-dom-of-association rights is directly keyed on a central andfundamental basic labor right, and the Verite Labor Stan-dards Index (VERLS), though it combines four approaches,incorporates enforcement and effective recognition of fourcore labor standards, and thus also focuses on basic rights.Both of these measures are suited to analyze the impacts ofcore labor protection on export performance, and theseimpacts appear to be positive. On its face, the third mea-sure—the number of ILO ratifications—should also be anindicator of core labor rights, but, as explained earlier, it is aquestionable measure of a country’s actual commitment toimproved working conditions.
20. Hasan and Quibria (2002) reach a similar conclusion,although their focus is on the determinants of povertyreduction rather than trade competitiveness.
Trade and Competitiveness Aspects of Environmental and Labor Standards in East Asia 131

21. The Korean government reduced its environmental expen-ditures from 2.5 percent of total expenditures in 1997 to 2.3percent in 1998, although this reduction was not especiallysevere in relation to those for other programs (World Bank2000).
22. Copeland and Taylor (2001) provide a clear presentation ofthis framework.
23. It is assumed that net output (total output less resourcesdevoted to pollution abatement) is produced with constantreturns to scale.
24. One important reason that a government would increasethe pollution tax (or generally increase environmental reg-ulation) is that voters demand a cleaner environment asincomes rise, justifiably assuming that environmentalhealth is a normal good. Thus in the applied literature, theterm technique effect generally refers to the idea that any-thing that raises per capita income generates an endoge-nous increase in environmental taxes, thereby reducing thepollution intensity of production. In this sense, the term isrelated to the so-called Kuznets environmental curve. How-ever, it also refers to autonomous improvements in envi-ronmental technologies.
25. It could also mean domestic deregulation of services andchanges in other policies, such as intellectual propertyrights, the effects of which are left aside here.
26. Per capita income would be higher despite changes in thedistribution of income.
Three comments are relevant here. First, the impacts ofopenness to trade are less clear when account is taken ofinput flows. Because inputs themselves may be dirty orclean, there is an additional comparative advantage effect toconsider. (For example, if trade liberalization increasesaccess to imported coal and petroleum, the net effect may beexpanded output of dirty final goods even if there is a directcomparative disadvantage in them. Moreover, tariff cutscould expand the consumption of cheaper imported fuels.)Second, many analysts suggest that as incomes rise there willbe an incentive to improve environmental technologiesendogenously as a result of the higher demand for environ-mental protection associated with rising incomes. Onedirect means by which this could come about is the greateraccess that more open economies have to foreign technolo-gies. In this context, trade openness provides an endogenoustechnique effect that could be decisive in improving envi-ronmental stewardship. Third, for the standard techniqueeffect to operate, citizen demand for a cleaner environmentmust be mediated effectively through an increase in the costof polluting the environment. In some cases, this mediationtakes place through informal pressures (Wang and Wheeler1999), but, generally, the government must respond to citi-zen preferences and raise environmental charges as incomesgrow. Therefore, once again the openness and efficiency ofthe political process matter for environmental policy, as theydo for labor standards. Barrett and Graddy (2000) find thatincreases in political freedoms significantly improve envi-ronmental quality.
27. It is conceivable that trade openness in rich countries con-tributes to better environmental quality in developingcountry exporters by moving workers out of environmen-tally harmful rural activities. However, this hypothesis hasnot been tested.
28. Not all would agree that FDI expands economic activity asmuch as it eliminates domestic competition.
29. Using data on sulfur dioxide concentrations in 293 sites in44 countries from the Global Environment Monitoring
Project over the period 1971–96, they decompose emis-sions into scale (GDP), composition (capital-labor endow-ment ratios), and technique (real income) effects, interact-ing each with a measure of openness to trade.
30. This insight underscores an important observation aboutthe nexus between trade policy and environmental policy.In general, if environmental distortions are internalizedefficiently, open trade enhances welfare.
31. It is possible they exist, but I could not locate any.32. They regressed net exports in five pollution-intensive
industries on measures of factor endowments and environ-mental laws in 24 countries (6 OECD countries, includingKorea, and 18 developing countries) over the period1994–98.
33. Figures on shares of pollution-intensive manufacturedexports are in Figure 7.1 in the technical appendix to thischapter at www.worldbank.org/eaptrade.
34. Grossman and Krueger (1993) found no contribution ofU.S. pollution intensity to U.S. imports from Mexico.
35. It is noteworthy that those countries experiencing thegreatest stress from the crisis—Indonesia, Korea, thePhilippines, and Thailand—registered these increases inexport shares. This tendency was not evident in Malaysiaand Taiwan (China). Again, such calculations are only sug-gestive, because many factors other than declining environ-mental costs or weak environmental standards couldexplain such changes in export shares.
36. Details of this analysis appear in the technical appendix tothis chapter at www.worldbank.org/eaptrade.
37. One important MEA is the Convention on Biodiversity,whose commitments on the exploitation of geneticresources are at odds with rights established under theintellectual property agreement in the WTO. The Conven-tion on Biodiversity does not itself implicate trade policydirectly, but a recently added provision, the Protocol onBio-safety, essentially permits countries to exclude importson the basis of the precautionary principle. By permittingunilateral import restraints that could be more rigorousthan those in the WTO’s Agreement on the Application ofSanitary and Phytosanitary Measures, this policy couldnegatively affect exports of genetically modified foodstuffsfrom developing countries. For the East Asian countries,such exports are not significant, so this issue may be of lim-ited importance unless the principle is extended to otherforms of production processes.
38. One example is the shrimp-turtle case, in which the UnitedStates threatened to limit imports of shrimp from certainSoutheast Asian countries failing to use turtle-excluderdevices in their fishing fleets.
References
The word processed describes informally reproduced works thatmay not be commonly available through libraries.
Aggarwal, Mita. 1995. “International Trade, Labor Standards,and Labor Market Conditions: An Evaluation of the Link-ages.” Working Paper 95-06-C. U.S. International TradeCommission, Washington, D.C.
Anderson, Kym. 1996. “The Intrusion of Environmental andLabor Standards into Trade Policy.” In Will Martin and L.Alan Winters, eds., The Uruguay Round and the DevelopingCountries. Cambridge: Cambridge University Press.
132 East Asia Integrates

Antweiler, Werner, Brian R. Copeland, and M. Scott Taylor. 2001.“Is Free Trade Good for the Environment?” American Eco-nomic Review 91: 877–908.
APEC (Asia Pacific Economic Cooperation). 1999. Study of Non-Tariff Measures in the Forest Products Sector. Committee onTrade and Investment. Singapore: APEC.
———. 2001. Survey of Environmental Markets in APEC. Com-mittee on Trade and Investment. Singapore: APEC.
Arunanondchai, May. 2001. “Trade Policy and the Welfare ofSoutheast Asian Timber Exporters: Some Implications forForest Resources.” Research Report. Economy and Environ-ment Program for Southeast Asia.
Barrett, Scott, and Kathryn Graddy. 2000. “Freedom, Growth,and the Environment.” Environment and Development Eco-nomics 5: 433–56.
Beghin, John C., Bradley J. Bowland, Sebastien Dessus, DavidRoland-Holst, and Dominique van der Mensbrugghe. 2000.“Trade Integration, Environmental Degradation, and PublicHealth in Chile: Assessing the Linkages.” Environment andDevelopment Economics 7: 241–67.
Betcherman, Gordon, and Rizwanul Islam, eds. 2001. East AsianLabor Markets and the Economic Crisis. Washington, D.C.:World Bank.
Copeland, Brian R., and M. Scott Taylor. 2001. “InternationalTrade and the Environment: A Framework for Analysis.”NBER Working Paper 8540. National Bureau of EconomicResearch, Cambridge, Mass.
Dean, Judith M. 2002. “Does Trade Liberalization Harm theEnvironment? A New Test.” Canadian Journal of Economics35 (4): 819–42.
Dollar, David, and Paul Collier. 2001. Globalization, Growth, andPoverty: Building an Inclusive World Economy. Oxford:Oxford University Press.
Dollar, David, and Art Kraay. 2002. “Growth Is Good for thePoor.” Journal of Economic Growth 7 (3): 195–225.
Drezner, Daniel W. 2001. “Fears of a ‘Race to the Bottom’ onWages and Labor Standards: Why Aren’t They Justified?”University of Chicago. Processed.
Edmonds, Eric, and Nina Pavcnik. 2002. “Does GlobalizationIncrease Child Labor? Evidence from Vietnam.” NBERWorking Paper 8760. National Bureau of EconomicResearch, Cambridge, Mass.
Elliott, Kimberly A. 2001. “Finding Our Way on Trade and LaborStandards?” International Economic Policy Briefs no. 01-5.Institute for International Economics, Washington, D.C.
Eskeland, Gunnar S., and Ann E. Harrison. 1997. “Moving toGreener Pastures? Multinationals and the Pollution HavenHypothesis.” World Bank, Washington, D.C. Processed.
Esty, Daniel C., and Peter K. Cornelius. 2002. Environmental Per-formance Measurement: The Global Report 2001–2002.Oxford: Oxford University Press.
Fields, Gary S. 1995. Trade and Labor Standards: A Review of theIssues. Paris: Organisation for Economic Co-operation andDevelopment.
Freeman, Richard B. 1994. “A Hard-Headed Look at Labor Stan-dards.” In W. Sengenberger and D. Campbell, eds., Interna-tional Labor Standards and Economic Interdependence.Geneva: International Labour Organization.
Grootaert, Christian, and Ravi Kanbur. 1995. “Child Labor: AnEconomic Perspective.” International Labour Review 134:187–203.
Grossman, Gene M., and Alan B. Krueger. 1993. “EnvironmentalImpacts of a North American Free Trade Agreement.” InPeter Garber, ed., The U.S.-Mexico Free Trade Agreement.Cambridge, Mass.: MIT Press.
Hasan, Rana, and M. G. Quibria. 2002. “Poverty and Patterns ofGrowth.” ERD Working Paper No. 18. Asian DevelopmentBank, Manila.
ILO (International Labour Organisation). 2002. Every ChildCounts: New Global Estimates of Child Labor. Geneva.
Jacobson, Mark. 1999. “The Philippines: The Case of EconomicZones.” In Alleviating Poverty through Foreign Direct Invest-ment: Country Case Studies. Washington, D.C.: World Bank.
Jaffe, A., S. Peterson, P. Portney, and R. Stavins. 1995. “Environ-mental Regulation and the Competitiveness of U.S. Manu-facturing. What Does the Evidence Tell Us?” Journal of Eco-nomic Literature 33: 132–63.
Keller, Wolfgang, and Arik Levinson. 2002. “Environmental Reg-ulations and FDI to U.S. States.” Review of Economics andStatistics 84, no. 4.
Kucera, David. 2001. “The Effects of Core Workers’ Rights onLabor Costs and Foreign Direct Investment: Evaluating the‘Conventional Wisdom.’” ILO Discussion PaperDP/130/2001. International Labour Organisation, Geneva.
Levinson, Arik. 1996. “Environmental Regulation and Manufac-turers’ Location Choices: Evidence from the Census of Man-ufactures.” Journal of Public Economics 62: 5–29.
Levinson, Arik, and M. Scott Taylor. 2001. “Trade and the Envi-ronment: Unmasking the Pollution Haven Effect.” George-town University, Washington, D.C. Processed.
Lim, Joseph Y. 2000. “The East Asian Crisis and Child Labor inthe Philippines.” ILO/IPEC Working Paper 2000. Available athttp://www.ilo.org/public/english/standards/ipec/publ/pol-icy/papers/philippines/.
List, John. A., and Catherine Y. Co. 1999. “The Effects of Envi-ronmental Regulations on Foreign Direct Investment.” Jour-nal of Environmental Economics and Management 40: 1–20.
Low, Patrick, and Alexander Yeats. 1992. “Do Dirty IndustriesMigrate?” In Patrick Low, ed. “International Trade and theEnvironment.” World Bank Discussion Paper 159. Washing-ton, D.C.
Lucas, R. E. B., D. Wheeler, and H. Hettige. 1990. “EconomicDevelopment, Environmental Regulation, and the Interna-tional Migration of Toxic Industrial Pollution.” Paper pre-sented at Symposium on International Trade and the Envi-ronment, Washington, D.C.
Madani, Dorsati. 1999. “A Review of the Role and Impact ofExport Processing Zones.” Policy Research Working Paper2238. World Bank, Washington, D.C.
Mah, Jai S. 1997. “Core Labor Standards and Export Perfor-mance in Developing Countries.” World Economy 20:773–85.
Mani, M., S. Pargal, and M. Huq. 1997. “Does EnvironmentalRegulation Matter? Determinants of the Location of NewManufacturing Plants in India.” Policy Research WorkingPaper 1718. World Bank, Washington, D.C.
Marinova, Nadja. 1999. “Indonesia’s Fiery Crises.” Journal ofEnvironment and Development 8: 70–81.
Martin, William J., and Keith E. Maskus. 2001. “The Economicsof Core Labor Standards: Implications for InternationalTrade Policy.” Review of International Economics 9: 317–28.
Maskus, Keith E. 1997. “Should Core Labor Standards BeImposed through Trade Policy?” Policy Research WorkingPaper 1817. World Bank, Washington, D.C.
McCulloch, Neil, L. Alan Winters, and Xavier Cirera. 2001. TradeLiberalization and Poverty: A Handbook. London: Centre forEconomic Policy Research.
Moran, Theodore H. 2002. Beyond Sweatshops: Foreign DirectInvestment and Globalization in Developing Countries. Wash-ington, D.C.: Brookings Institution.
Trade and Competitiveness Aspects of Environmental and Labor Standards in East Asia 133

OECD (Organisation for Economic Co-operation and Develop-ment). 1996. Trade, Employment, and Labor Standards: AStudy of Core Workers’ Rights and International Trade. Paris.
———. 2000. International Trade and Core Labor Standards.Paris.
Rodrik, Dani. 1996. “Labor Standards in International Trade: DoThey Matter and What Do We Do about Them?” OverseasDevelopment Council, Washington, D.C.
Romero, Ana Teresa. 1995. “Labor Standards and Export Pro-cessing Zones: Situation and Pressures for Change.” Develop-ment Policy Review 13: 247–76.
Smarzynska, Beata, and Shang-Jin Wei. 2001. “Pollution Havensand Foreign Direct Investment: Dirty Secret or PopularMyth?” CEPR Discussion Paper 2966. Centre for EconomicPolicy Research, London.
Suryahadi, Asep, Wenefrida Widyant, Daniel Perwira, andSudarno Sumarto. 2003. “Minimum Wage Policy and ItsImpact on Employment in the Urban Formal Sector.” Bul-letin of Indonesian Economic Studies 39 (1): 29–50.
Sykes, Allan. 1995. Product Standards in a Globalizing World.Washington, D.C.: Brookings Institution.
Tobey, J. A. 1990. “The Effects of Domestic Environmental Poli-cies on Patterns of World Trade: An Empirical Test.” Kyklos43: 191–209.
UNICEF (United Nations Children’s Fund). 1999. The State ofthe World’s Children, 1999: Education. Geneva.
U.S. Department of Labor. 1994. By the Sweat and Toil of Chil-dren. Vol. 1, The Use of Child Labor in U.S. Manufactured andMined Imports. Washington, D.C.
Van Beers, Cees. 1998. “Labor Standards and Trade Flows ofOECD Countries.” World Economy 21: 57–73.
Verite. 2002.“Report to California Public Employees’ RetirementSystem (CalPERS): Emerging Markets Research Project.”Available at [email protected].
Wang, Hua, and David Wheeler. 1999. “Endogenous Enforce-ment and Effectiveness of China’s Pollution Levy System.”Development Research Group. World Bank, Washington,D.C.
Wheeler, David S. 2001. “Racing to the Bottom? Foreign Invest-ment and Air Pollution in Developing Countries.” Journal ofEnvironment and Development 10: 225–45.
Wilson, John S., Tsunehiro Otsuki, and Mirvat Sewadeh. 2002.“Dirty Exports and Environmental Regulation: Do Stan-dards Matter to Trade?” Development Research Group.World Bank, Washington, D.C.
World Bank. 1999. “Environmental Implications of the EconomicCrisis and Adjustment in East Asia.” East Asia Environmentand Social Development Unit, Discussion Paper 01. Wash-ington, D.C.
———. 2000. Korea: The Environmental Dimension of the Crisis:A Step Back of a New Way Forward? Washington, D.C.
———. 2001a. East Asia Regional Overview Special Focus: Envi-ronment. Washington D.C.
———. 2001b. Indonesia: Environment and Natural ResourceManagement in a Time of Transition. Washington, D.C.
———. 2001c. World Development Indicators 2001. Washington,D.C.: World Bank.
World Resources Institute. 2002. Reefs at Risk in Southeast Asia.Available at: www.wri.org/wri/reefsatrisk/reefriskseasia.html.
Xu, X. 1999. International Trade and Environmental Regulation:A Dynamic Perspective. Huntington, N.Y.: Nova Science Pub-lishers.
134 East Asia Integrates

Part III
Reinforcing SocialStability through
broad sharing of benefits


China’s recent accession to the World Trade Orga-nization (WTO) brings with it sharp reductions inimport tariffs, quantitative restrictions, and exportsubsidies, with implications for the domestic struc-ture of prices and wages and thus for the welfare ofChinese households. Even if the trade reforms havelittle effect on poverty and income distribution inthe aggregate, the impacts may vary across house-hold types and regions, with implications for thedesign of compensatory policy responses.
In China, the economic geography of poverty,and its interaction with the geographic diversity inthe impact of policy reforms, is high on the domes-tic policy agenda. A policy analysis that simplyaverages such differences would miss a great deal ofwhat matters to the policy debate. In this chapter,data from national household surveys for rural andurban areas are used to measure and explain thewelfare impacts on households of changes in goods
137
8
Household WelfareImpacts of China’s
Accession to the WTOShaohua Chen
Martin Ravallion
and factor prices stemming from the accession. Theapproach respects the richness of detail that isavailable from a modern integrated household sur-vey, allowing us to go well beyond the highlyaggregative types of analysis one often finds. Ouranalysis measures the expected impacts across thedistribution of initial levels of living, but it alsoexamines the way in which the impacts vary byother household characteristics, including locationand demographic characteristics. A reasonablydetailed “map” of the predicted welfare impacts bylocation and socioeconomic characteristics there-fore emerges.
The first section of this chapter briefly reviewsthe approaches that typically have been used inanalyzing the welfare impacts of trade reform. It isfollowed by a summary of the approach taken inthis chapter. The penultimate section describes theresults of our analysis, and our conclusions follow.
The authors are grateful to Tamar Manuelyan-Atinc and Will Martin for their encouragement to undertake this task, toElena Ianchovichina and Will Martin for the estimates of the price impacts of China’s trade reform that are crucial tothis study, and to Pingping Wang, Yan Fang, Liqun Peng, Honge Gong, and Min Yuan for their help in matching vari-ables from China rural/urban household surveys to the categories of the general equilibrium model. The comments ofFrançois Bourguignon, John Cockburn, Neil McCulloch, Sangui Wang, Shujiro Urata and participants in the FourthAsian Development Forum in Seoul, the seminar at the Tokyo office of the World Bank, and the National Bureau of Sta-tistics in Beijing are gratefully acknowledged.

Measuring the Welfare Impacts ofTrade Reform
The literature contains much debate about the wel-fare impacts of greater openness to trade. Someauthors argue that external trade liberalizationbenefits the poor in developing countries, whileothers assert that the benefits are captured more bythe nonpoor. Assessments have focused particularlyon the expected impacts on relative wages (notablybetween skilled and unskilled labor) and relativeprices (such as between food staples and luxuryimports).
What does the evidence suggest? One mighthope to provide a conclusive answer by comparingchanges over time in measures of inequality orpoverty between countries that are open to externaltrade and countries that are not. Thus several stud-ies have combined levels of measured inequality, orchanges over time in measured inequality orpoverty, with data on trade openness and othercontrol variables, using aggregate cross-countrydata sets (for example, see Bourguignon andMorisson 1990; Edwards 1997; Li, Squire, and Zou1998; Lundberg and Squire 1999; Barro 2000; Dol-lar and Kraay 2002; and Milanovic 2002).
There are reasons, however, to be cautious indrawing policy inferences from such studies. First,concerns have emerged about data and economet-ric specification. Differences in survey design andprocessing between countries, and over time withincountries, can distort the measured levels and theapparent differences in inequality. Second, theextent to which cross-country data sets can detectany underlying effects of greater openness or othercovariates is unclear. Another issue is whether thevolume of trade should be treated as exogenous inthese cross-country regressions. It is clearly not apolicy variable as such, and it may well be highlycorrelated with other (latent) attributes of countryperformance independently of trade policy. Attri-bution of inequality impacts to trade policyreforms per se is clearly problematic.
Furthermore, starting conditions vary widelyamong reforming countries, and averaging acrossthis diversity can readily hide systematic effects ofrelevance to policy. For example, countries differ intheir initial levels of economic development. It hasbeen argued that greater openness to external trade
will have very different effects on inequalitydepending on the level of economic develop-ment—raising inequality in rich countries andreducing it in poor ones.1 But the opposite out-come is possible when economic reforms, includingtrade liberalization, increase the demand for rela-tively skilled labor, which may well be less equallydistributed in poor countries than in rich ones.Regressions for inequality across countries showsome evidence of a negative interaction effectbetween openness to trade and initial gross domes-tic product (GDP) per capita (Barro 2000; Raval-lion 2001; Milanovic 2002).
In principle, these problems can be dealt with byintroducing suitable nonlinearities (includinginteraction effects) into the regressions based oncompilations of country aggregates. However, theconcerns go deeper. For example, although aggre-gate inequality or poverty may not change withtrade reform, there may be both gainers and losersat all levels of living. Indeed, when surveys havetracked the same families over time, it is quite com-mon to find that many people have escaped frompoverty, while others have fallen into poverty, eventhough the overall poverty rate may have movedrather little.2 As another example, geographic dis-parities in access to human and physical infrastruc-ture, between and within developing countries,affect the prospects for participating in the growthgenerated by reform, and these disparities tend tobe correlated with incomes.3 A reform may wellentail sizable redistributions between the poor andthe rich, but in opposite directions in differentregions within countries. One should not be sur-prised to find no correlation between growth andchanges in inequality, or that, on average, a policyreform has virtually no impact on inequality. Yetnonrandom distributional changes could well begoing on beneath the surface of the average impactstatistics. A policy analysis that simply averagesover such differences would miss a great deal ofwhat matters to the debate on policy.
This chapter follows a different approach forwhich the attribution to trade policy changes isunambiguous and the diversity of welfare impactsis not lost. It studies welfare impacts at the house-hold level of changes in commodity and factorprices attributed to a specific trade policy reform—China’s accession to the WTO.
138 East Asia Integrates

Our Approach in This Chapter
Past approaches to studying the welfare impacts ofspecific trade reforms have tended to be either par-tial equilibrium analyses, in which the welfareimpacts of the direct price changes resulting fromtariff changes are measured at the household level,or general equilibrium analyses, in which second-round responses are captured in a theoreticallyconsistent way, but with considerable aggregationacross household types.4 Although partial equilib-rium analysis requires little or no aggregation of theprimary household data, it misses potentiallyimportant indirect effects on prices and wages.General equilibrium analysis has the power to cap-ture these effects by simulating the economy-wideimpacts on markets. Standard computable generalequilibrium (CGE) models, however, entail consid-eration aggregation across household types, withrarely more than six or so “representative house-holds.” Such models are crude tools for welfare dis-tributional analysis.
The challenge for applied work is to find anapproach that respects the richness of detail avail-able from a modern integrated household survey,while assuring that the price changes attributed toreform are internally consistent with economy-wide equilibrium conditions. Anyone addressingthis challenge can in principle build the CGE modelonto the household survey, such that the number ofhouseholds in the model is the number sampled inthe survey.5 In our analysis, this degree of integra-tion would require a CGE model of extraordinarilyhigh dimensions, with 85,000 households (the totalsample size of the surveys we use). This route is nota feasible one at present.
Instead, we follow an intermediate approach inwhich the reform-induced commodity and factorprice changes simulated from a general equilibriummodel are carried to the level of all the sampledhouseholds in the survey.6 In measuring the welfareimpacts, we use standard tools of analysis familiarfrom past work on the welfare effects of pricechanges associated with tax and trade policyreform. Our approach imposes minimal aggrega-tion conditions on the survey data, within unavoid-able data limitations. In addition to calculating theoverall effects of a trade reform on poverty andinequality, we are able to provide a detailed socioe-
conomic “map” of impact, showing how it varieswith other “non-income” characteristics, such aslocation. In this way, we are better able to answerthe questions policymakers are asking about whogains and who loses from reform.
In our analysis, we use past estimates of thedirect and indirect impacts of China’s WTO acces-sion on prices for both commodities and factors ofproduction, as reported in Ianchovichina and Mar-tin (2002), and apply standard methods of first-order welfare analysis to measure the gains andlosses at the household level.7
The price changes induced by the trade policychange are simulated from the CGE model used byIanchovichina and Martin (2002). This competitivemarket-clearing model originated in the GlobalTrade Analysis Project (GTAP).8 In this model, therevenue implications of the trade policy change arereflected in changes in indirect tax rates.
The CGE model is applied to the data from largenational sample surveys of households in urbanand rural areas of China carried out by the NationalBureau of Statistics (NBS). The general equilibriumanalysis generates a set of price and wage changes.These changes embody both the direct price effectsof the trade policy change and the “second-round”indirect effects on the prices of nontraded goodsand on factor returns, including effects that makethemselves felt through the government’s budgetconstraint. Because the price changes are based onan explicit model, their attribution to the trade pol-icy reform is unambiguous, thereby avoiding theidentification problems common to past attemptsto estimate the distributional effects of trade policyreform using cross-country comparisons.
The welfare impacts are derived from a house-hold model that incorporates own-productionactivities. The CGE and household-level analysesare not integrated—with 85,000 households in thesurvey; doing so would require an extraordinarilylarge CGE model. The microsimulations are builton economic assumptions that are consistent withthe CGE model—notably, that households takeprices as given and that those prices clear all mar-kets—but no attempt was made to ensure full con-sistency between the microanalysis and the predic-tions of the CGE model. Chen and Ravallion(2004) describe our methods of measuring the wel-fare impacts in detail.
Household Welfare Impacts of China’s Accession to the WTO 139

The survey data were taken from the 1999 RuralHousehold Survey (RHS) and the 1999 UrbanHousehold Survey (UHS), both carried out byChina’s National Bureau of Statistics. The RHS sam-ple covers 67,900 households, and the UHS covers16,900.9 NBS kindly provided the microdata forthree provinces (Liaoning, Guangdong, andSichuan), called here the “test provinces.” The com-puter program to implement the estimationmethod was written for these data, after which NBSstaff ran the program on the entire national data set.
Before China’s accession to the WTO in 2001, itseconomy had already begun to adapt to the expectedchange. Chinese trade reform can thus be consideredas having two stages: a lead-up period, in which tar-iffs started to fall in anticipation of WTO accession,and the period from 2001 onward. Ianchovichinaand Martin (2002) argue that 1995 is a plausiblebeginning of the lead-up period, and we use theirestimates of the price changes induced by WTOaccession for the periods 1995–2001 and 2001–07.The discussion that follows focuses mainly on thelatter period, although estimates of the welfareimpacts for the lead-up period are also provided.
We calculated the welfare impacts to the surveydata for 1999. This year was chosen in part for datareasons; it was the most recent year for which accessto the microdata could be obtained. Also, we believethat choosing a year near the middle of the lead-upperiod rather than at the beginning or end mightdiminish possible biases caused by any nonlinearityin the welfare impacts of price and wage changes.
Results
Summarized here are the results described in Chenand Ravallion (2004). Appendix Table 8.1 andAppendix Table 8.210 show the predicted changes inrelative prices and wages in China during1995–2001 and 2001–07, respectively, as obtainedfrom the China GTAP model of Ianchovichina andMartin (2002). The tables also show the mean netrevenue per capita for urban and rural areas, basedon the 1999 rural and urban household surveys.
Measured Welfare Impacts of WTO Accession
Based on the relative price changes from the ChinaGTAP model and production/consumption sharesfrom the 1999 rural/urban household survey data,
the net gain (or loss) for each household can becomputed.11 Table 8.1 summarizes the results. Sec-tion 1 of the table gives the mean gains for the peri-ods 1995–2001 and 2001–07, split by urban andrural areas.
Section 2 of Table 8.1 shows the impacts onincome inequality, both actual (for the baselineyear, 1999) and simulated for the two stages of thetrade reform. The simulated income distribution isobtained, for the first stage, by subtracting the esti-mated gains over 1995–2001 from the 1999incomes at household level and, for the secondstage, by adding the household-specific gains from2001–07 to the 1999 incomes. Thus the first simula-tion gives the distributional impact of the pricechanges during the first stage of the reform—thatis, what the baseline distribution would havelooked like without the reforms—and the secondshows the impact of the post-2001 price changes—that is, how those changes are expected to affect thebaseline distribution, looking forward.
Section 3 of Table 8.1 gives the headcount indexof poverty as measured by various poverty lines.The “official poverty line” gives estimates based onthe poverty lines used by the National Bureau ofStatistics, while the “$1/day” and “$2/day” lines arethose from Chen and Ravallion (2001).
The overall gain in mean income is about 1.5percent, all in the period leading up to WTO acces-sion. There is almost no impact on inequality,either in the period leading up to WTO accession orpredicting forward. The aggregate Gini indexincreases slightly, from 39.3 percent without WTOaccession to 39.5 percent post-WTO.
In 1999 the incidence of poverty would havebeen slightly higher had there been no trade policychanges over the lead-up period to WTO accession,but that from 2001 to 2007 will increase veryslightly as a result of the price changes expected tobe induced by the remaining tariff changes.
The impacts of WTO accession on poverty asmeasured by a wide range of poverty lines arerevealed in Figures 8.1 and 8.2, which give thecumulative distributions of income for both thebaseline and the two simulated distributions, forthe poorest 60 percent in rural areas and the poor-est 40 percent in urban areas.
In the aggregate, then, WTO accession has virtu-ally no predicted impact on poverty and inequality.Disaggregating the results, predicting forward from
140 East Asia Integrates

Household Welfare Impacts of China’s Accession to the WTO 141
TABLE 8.1 Predicted Aggregate Impacts on Welfare of Rural and Urban Households
Rural Urban National
1. Mean gains (yuan per capita)1995–2001 34.47 94.94 55.49
(1.54%)a
2001–07 –18.07 29.45 –1.54(–0.04%)a
2. Inequality impacts (Gini index as %)Baseline (1999) 33.95 29.72 39.31Simulated: less gains 1995–2001 33.90 29.68 39.27Simulated: plus gains 2001–07 34.06 29.65 39.53
3. Poverty impacts (headcount index, %)Official poverty line
Baseline (1999) 4.38 0.08 2.92Simulated: less gains 1995–2001 4.56 0.08 3.04Simulated: plus gains 2001–07 4.57 0.07 3.04
$1/day (1993 PPP)Baseline (1999) 10.51 0.29 7.04Simulated: less gains 1995–2001 10.88 0.28 7.28Simulated: plus gains 2001–07 10.81 0.28 7.23
$2/day (1993 PPP)Baseline (1999) 45.18 4.07 31.20Simulated: less gains 1995–2001 46.10 4.27 31.88Simulated: plus gains 2001–07 45.83 3.97 31.60
Note: PPP = purchasing power parity.a. Percentage of mean income.Source: The authors.
0
10
20
30
40
50
60
400 600 800 1,000 1,200 1,400 1,600 1,800 2,000
Annual per capita income (yuan)
Baseline distribution
Post-WTO (middle)
Pre-WTO
Percent of people below poverty line
FIGURE 8.1 Poverty Incidence Curves: Rural
Source: The authors.

WTO accession, we focused on three indicators ofimpact at the household level: the absolute gain orloss in yuan, the percentage gain or loss, andwhether the change is a gain or a loss. Our interestin the first two measures is obvious enough. Weincluded the third to help determine where theremight be high concentrations of losses—whetherin specific geographic areas or socioeconomicgroups.
About three-fourths of rural households andone-tenth of urban residents are predicted to losereal income in the period 2001–07. Farm income ispredicted to drop by 18 yuan per person, whileurban per capita income rises by 29 yuan (Appen-dix Table 5.3 and Appendix Table 5.4). The drop inrural income is caused by the drop in the wholesaleprices of most farm products, plus higher prices foreducation and health care (Appendix Table 5.2). Yetfarmers will benefit from the drop in some con-sumer prices and from the increase in nonfarmlabor wages. Urban residents will enjoy lower pricesfor most farm products and higher wages, but theyalso will be hit by higher fees for education andhealth care.
Impacts differ widely across regions, as evidentin Figures 8.3, 8.4, and 8.5, which plot the results byprovinces ranked by mean income per person.12
The mean absolute gains tend to be highest in therichest provinces in both urban and rural areas(Figure 8.3), although there is no correlation
between proportionate gains and the mean incomeof the province (Figure 8.4).
One spatially contiguous region stands out aslosing the most from trade reform—the northeastprovinces of Heilongjiang, Inner Mongolia, Jilin,and Liaoning (Appendix Table 5.3). Both theabsolute and proportionate impacts are highest inthis region; indeed, more than 90 percent of farm-ers in Heilongjiang and Jilin are expected to experi-ence a net loss in income.
When households are ranked by initial income,there is a notable difference between urban andrural households. Figures 8.6, 8.7, and 8.8 plot theresults given earlier against percentiles of theincome distribution. For example, the mean impactin yuan per capita at the median income level isrevealed by looking at the 50th percentile in Figure8.6. (Figure 8.6 gives the horizontal differences inFigures 8.1 and 8.2 plotted against the point on thevertical axis.)
The absolute gains tend to be higher for higher-income households in urban areas and lower forlow-income households in rural areas. Nationally(combining urban and rural areas using the weightsdescribed in the technical appendix to this chapter),there is a hint of a U-shaped relationship, thoughstill with the highest absolute gains for the rich.
This pattern flips when one looks at the propor-tionate gains (Figure 8.7). In urban areas, the pro-portionate gains tend to fall as income rises, but in
142 East Asia Integrates
0
5
10
15
20
25
30
35
40
500 1,000 1,500 2,000 2,500 3,000 3,500 4,000 4,500
Annual per capita income (yuan)
Baseline distribution in 1999 (middle)
Post WTO income
Pre WTO income
Percent of people below poverty line
FIGURE 8.2 Poverty Incidence Curves: Urban
Source: The authors.
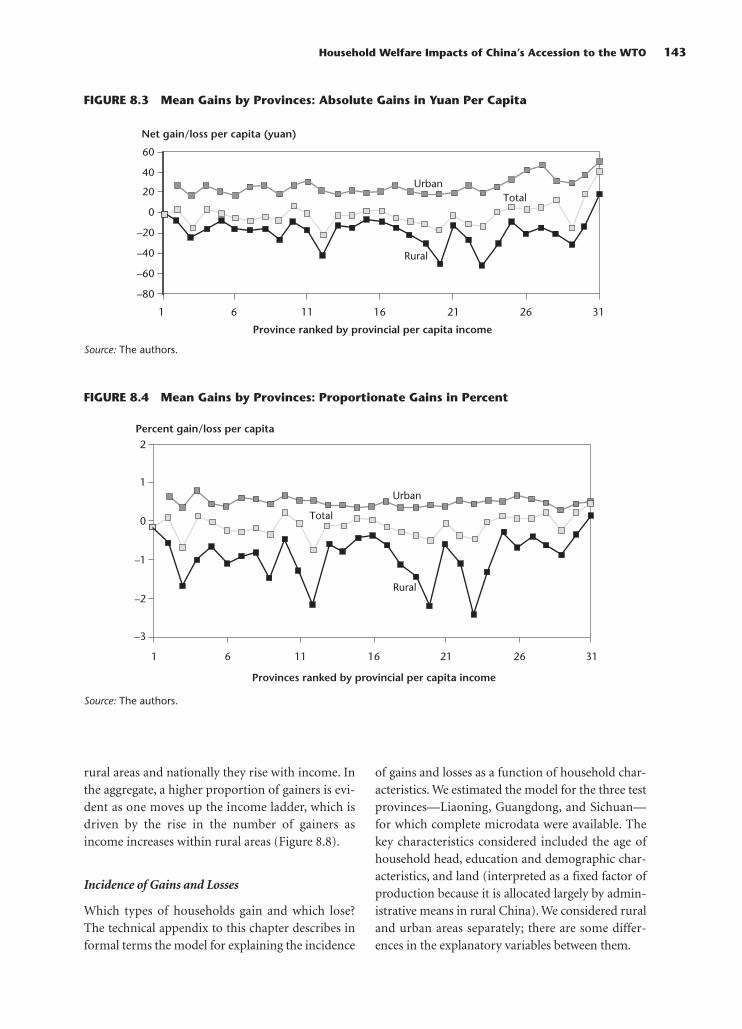
rural areas and nationally they rise with income. Inthe aggregate, a higher proportion of gainers is evi-dent as one moves up the income ladder, which isdriven by the rise in the number of gainers asincome increases within rural areas (Figure 8.8).
Incidence of Gains and Losses
Which types of households gain and which lose?The technical appendix to this chapter describes informal terms the model for explaining the incidence
of gains and losses as a function of household char-acteristics. We estimated the model for the three testprovinces—Liaoning, Guangdong, and Sichuan—for which complete microdata were available. Thekey characteristics considered included the age ofhousehold head, education and demographic char-acteristics, and land (interpreted as a fixed factor ofproduction because it is allocated largely by admin-istrative means in rural China). We considered ruraland urban areas separately; there are some differ-ences in the explanatory variables between them.
Household Welfare Impacts of China’s Accession to the WTO 143
–80
–60
–40
–20
0
20
40
60
1 6 11 16 21 26 31
Province ranked by provincial per capita income
UrbanTotal
Rural
Net gain/loss per capita (yuan)
FIGURE 8.3 Mean Gains by Provinces: Absolute Gains in Yuan Per Capita
Source: The authors.
–3
–2
–1
0
1
2
1 6 11 16 21 26 31
Provinces ranked by provincial per capita income
Urban
Total
Rural
Percent gain/loss per capita
FIGURE 8.4 Mean Gains by Provinces: Proportionate Gains in Percent
Source: The authors.

The results are given in Appendix Tables 8.6 and8.7 for rural areas and Appendix Tables 8.8 and 8.9for urban areas. Because these results are averagesacross the impacts of these characteristics on theconsumption and production choices that deter-mine the welfare impact of given price and wagechanges, they are difficult to interpret. We viewthem as mainly of descriptive interest, to help iso-
late covariates of potential relevance in thinkingabout compensatory policy responses.
Looking first at rural areas, in all three provincesthe predicted gain from trade reform tends to belarger for larger households. There is also a U-shaped relationship with the age of the householdhead, such that the gains reach a minimum at about50 years of age (47 in Liaoning, 52 in Guangdong,
144 East Asia Integrates
0
10
20
30
40
50
60
70
80
90
100
1 6 11 16 21 26 31
Provinces ranked by provincial per capita income
Urban
Total
Rural
Percent of gainers
FIGURE 8.5 Mean Gains by Provinces: Percentage of Gainers
Source: The authors.
–60
–50
–40
–30
–20
–10
0
10
20
30
40
0 10 20 30 40 50 60 70 80 90 100
Percent of population ranked by per capita income(assuming urban price is 15% higher)
Urban
National
Rural
Net gain or loss per capita (yuan)
FIGURE 8.6 Mean Gains in Yuan, by Income Percentile
Source: The authors.

and 55 in Sichuan). The gains are smaller for agri-cultural households. They are larger for householdswith more employees, more workers in townshipand village enterprises, more migrant workers, andless cultivated land (although the last finding is sig-nificant only in Liaoning). The only strong demo-
graphic effect is that younger households (thosewith a higher proportion of children under six)tend to be gainers in Liaoning.
For agricultural households, predicted losses aresignificantly higher than average in six counties inLiaoning (losses of from 3 to 5.6 percent versus the
Household Welfare Impacts of China’s Accession to the WTO 145
–6.0
–5.0
–4.0
–3.0
–2.0
–1.0
0.0
1.0
2.0
0 10 20 30 40 50 60 70 80 90 100
UrbanNational
Rural
Percent net gain or loss per capita
Percent of population ranked by per capita income(assuming urban price is 15% higher)
FIGURE 8.7 Mean Percentage Gain, by Income Percentile
Source: The authors.
Total
Urban
Rural
Percent of gainers
0 10 20 30 40 50 60 70 80 90 100
10
20
30
40
50
60
70
80
90
100
Percent of population ranked by per capita income(assuming urban price is 15% higher)
FIGURE 8.8 Percentage of Gainers, by Income Percentile
Source: The authors.

provincial average of 1.3 percent), seven counties inGuangdong (from 2.5 to 5.3 percent versus theprovincial average of 0.8 percent), and six countiesin Sichuan (from 2.8 to 5.7 percent versus theprovincial average of 0.7 percent)—see AppendixTable 8.10.
In urban areas, the gains tend to be larger forsmaller households (except in Guangdong). As inrural areas, there is a U-shaped pattern (except inLiaoning), with the smallest gains for householdswhose heads were 66 years of age in Guangdong and51 years in Sichuan. By contrast with rural areas,where we find no relationship between educationlevels and welfare gains, in urban areas the gains tendto be larger for less well-educated households.13
There are signs of some sectoral effects, althoughonly significantly so in Liaoning, with higher gainsfor those in government jobs. Signs of larger gainsare evident among those whose employer is the gov-ernment. Retirees tend to gain less than others.
Conclusions
In the aggregate, the finding is that China’s acces-sion to the WTO has only a small impact on meanhousehold income, inequality, and incidence ofpoverty. There is, however, a sizable, and at leastpartly explicable, variance in impacts across house-holds of different characteristics. Rural families tendto lose; urban households tend to gain. Impacts arelarger in some provinces than others, and largest inthe geographically contiguous northeast region ofHeilongjiang, Inner Mongolia, Jilin, and Liaoning.In this region rural households depend more onfeed grain production (for which falling prices areexpected from WTO accession) than those else-where in China. Such impact “mapping” can be usedto guide targeted safety net programs.
Within rural or urban areas of a given province,the gains from WTO accession vary with observ-able household characteristics. The most vulnera-ble households tend to be rural, to be dependent onagriculture, to have relatively few workers, and tohave weak economic links to the outside economythrough migration. There are also some strong geo-graphic concentrations of adverse impacts. Forexample, agricultural households in certain coun-ties of Guangdong, Liaoning, and Sichuan incurpredicted welfare losses of 3–5 percent of theirincomes.
This incidence analysis suggests that encourag-ing labor flexibility is central to protecting house-holds adversely affected by reforms. But workersneed skills to be flexible, and they must be allowedto move occupationally and geographically, sug-gesting that labor market reforms must be carriedout in parallel with trade reforms. In China, eventhough its degree of labor mobility is considerable(as evidenced by the large migrant population),restrictions and impediments remain. Withincreased labor flexibility, more rural householdscan potentially benefit from WTO accession. How-ever, to assess properly the impact of changes ininternal labor mobility policy on household wel-fare, we would require a richer data set and addi-tional behavioral assumptions, which suggests afuture research agenda.
Naturally, this approach has other limitations. Acase in point: some dynamic gains from trade liber-alization may not be captured by the model used togenerate the relative price impacts. For example,trade may well facilitate learning about new tech-nologies and innovation that brings longer-termgains in productivity. These effects may be betterrevealed by studying time-series evidence, com-bined with cross-country comparisons.
The geographic differences identified in welfareimpacts arise entirely from differences in house-hold consumption and production behavior. Inreality, trade reform is likely to have differentialimpacts on local prices as a result of transport orother impediments to internal trade. Our approachdoes not incorporate such differences, and doing sowould pose data and analytical problems. Thisdirection might, however, be a fruitful one forfuture work in settings in which the necessary dataon prices and wage levels by geographic area areavailable.
Another limitation of the approach is that, asexplained in the technical appendix, we had tomake linear approximations in the neighborhoodof an initial optimum for each household. In otherapplications using this method, doing so may bedeceptive if the price or wage changes are large, or ifa household is initially out of equilibrium, perhapsbecause of rationing (including involuntary unem-ployment). In principle, there are ways to deal withthese problems by estimating complete demandand supply systems, allowing for rationing. Thisavenue may prove to be a fruitful one for future
146 East Asia Integrates
research, but it should be noted that such methodsgenerate their own problems, such as those arisingfrom incomplete data on price and wage levels atthe household level.
While acknowledging these limitations, webelieve that the type of approach offered here canstill illuminate the likely short-term distributionalimpacts of economy-wide reforms, with minimumaggregation. By avoiding unnecessary aggregationof the primary household-level data, the relativelysimple tools described here can also offer insightsinto the kinds of policy responses that might beneeded to compensate losers from reform.
Endnotes
1. Wood (1994) makes a qualified argument along these lines.2. Jalan and Ravallion (1998) report evidence of such churn-
ing using panel data for rural China. Baulch and Hoddinott(2000) review evidence for a number of countries.
3. In the context of China’s lagging poor areas, see Jalan andRavallion (2002).
4. For an overview of alternative approaches to assessing thewelfare impacts of trade policies and examples, see McCul-loch, Winters, and Cirera (2001).
5. The only example of this full integration known to us isthat by Cockburn (2002), who built a classic, trade-focusedCGE model onto the Nepal Living Standards Survey cover-ing about 3,000 households.
6. In an antecedent to our approach, Bourguignon, Robilliard,and Robinson (2003) also take price changes generated by aCGE model to survey data (for Indonesia). Methodologi-cally, the main difference is that we derive first-order welfareimpacts analytically from a standard competitive farm-household model, and Bourguignon and his colleagues gen-erate income impacts at the household level from a micro-econometric model of income determination.
7. Details of the methodology and data treatment are given inthe technical appendix to this chapter at www.worldbank.org/eaptrade. The appendix includes a discussion ofthe main assumptions underlying the CGE framework. Seealso Chen and Ravallion (2004).
8. Papers describing the standard GTAP with applications canbe found in Hertel (1997). A full discussion of the assump-tions of the general equilibrium model and the results of itsapplication to China’s accession to the WTO can be foundin Ianchovichina and Martin (2002).
9. The full sample of the UHS in 1999 was about 40,000households. Since 2002 the central office has kept the dataon all 40,000 households.
Over the past 15 years, the NBS has made a great effort toimprove both the RHS and UHS, focusing on sample cover-age, questionnaire design, survey methodology, and dataprocessing. The number of variables in the surveys hasincreased dramatically, with additional details on income,expenditure, savings, housing, and productivity, amongother things. However, some problems remain in the 1999RHS and UHS. For its sample frame, the RHS relies on itssampled counties from 1985. The UHS excludes ruralmigrants, because the base of the UHS sample frame is the
legal registration system (Hukou). As in other countries, theRHS gives data on the remittances of migrant workers, butdoes not provide information about the migrant workersthemselves, who (unlike in other countries) are not sampledin the urban survey either. It is therefore difficult to measureimpacts through labor mobility and rural-urban transfers inthe present study. Comparisons between the RHS and UHSalso pose problems. For example, income in the RHSincludes income in-kind (such as from own-farm produc-tion and other household enterprises), but income in theUHS ignores some in-kind components, notably subsidiesreceived from the government. For further discussion in thecontext of the RHS, see Chen and Ravallion (1996).
10. All the appendix tables cited in this section appear in thetechnical appendix to this chapter at www.worldbank.org/eaptrade. See also Chen and Ravallion (2004).
11. Using equation 3, as explained in the technical appendix.12. For the province rankings, see Appendix Table 8.5 at
www.worldbank.org/eaptrade.13. This finding may be biased by the fact that, as explained in
the technical appendix at www.worldbank.org/eaptrade, wehad to use education levels to identify skilled labor (notingthat wages of unskilled nonfarm workers are predicted toincrease relative to those of skilled labor, as shown inAppendix Tables 8.6–8.8).
References
Barro, Robert. 2000.“Inequality and Growth in a Panel of Coun-tries.” Journal of Economic Growth 5: 5–32.
Baulch, Bob, and John Hoddinott. 2000. “Economic Mobilityand Poverty Dynamics in Developing Countries.” Journal ofDevelopment Studies 36 (6): 1–24.
Bourguignon, François, and C. Morisson. 1990. “Income Distri-bution, Development and Foreign Trade.” European Eco-nomic Review 34: 1113–32.
Bourguignon, François, Anne-Sophie Robilliard, and ShermanRobinson. 2003. “Representative versus Real Households inthe Macro-Economic Modeling of Inequality.” WorkingPaper 2003-05. DELTA, Paris.
Chen, Shaohua, and Martin Ravallion. 1996.“Data in Transition:Assessing Rural Living Standards in Southern China.” ChinaEconomic Review 7: 23–56.
———. 2001. “How Did the World’s Poor Fare in the 1990s?”Review of Income and Wealth 47 (3): 283–300.
———. 2004. “Welfare Impacts of China’s Accession to theWTO.” World Bank Economic Review, forthcoming.
Cockburn, John. 2002. “Trade Liberalization and Poverty inNepal: A Computable General Equilibrium Micro Simula-tion Analysis.” University of Laval, Quebec. Processed.
Dollar, David, and Art Kraay. 2002. “Growth Is Good for thePoor.” Journal of Economic Growth 7 (3): 195–225.
Edwards, S. 1997. “Trade Policy, Growth, and Income Distribu-tion.” American Economic Review, Papers and Proceedings 87(2): 205–10.
Hertel, T. W., ed. 1997. Global Trade Analysis: Modeling andApplications. Cambridge: Cambridge University Press.
Ianchovichina, Elena, and William Martin. 2002. “EconomicImpacts of China’s Accession to the WTO.” Paper presentedat Seminar on WTO Accession, Policy Reform and PovertyReduction in China, World Bank, Beijing, June 28–29.
Jalan, Jyotsna, and Martin Ravallion. 1998. “Transient Poverty inPost-reform Rural China.” Journal of Comparative Economics26: 338–57.
Household Welfare Impacts of China’s Accession to the WTO 147

Li, Hongyi, Lyn Squire, and Heng-fu Zou. 1998. “ExplainingInternational and Intertemporal Variations in IncomeInequality.” Economic Journal 108: 26–43.
Lundberg, Mattias, and Lyn Squire. 1999. “Growth and Inequal-ity: Extracting the Lessons for Policymakers.” World Bank,Washington, D.C. Processed.
McCulloch, Neil, L. Alan Winters, and Xavier Cirera. 2001. TradeLiberalization and Poverty: A Handbook. London: Centre forEconomic Policy Research.
Milanovic, Branko. 2002. “Can We Discern the Effect of Global-ization on Income Distribution?” Policy Research WorkingPaper 2876. World Bank, Washington, D.C.
Ravallion, Martin. 2001.“Growth, Inequality and Poverty: Look-ing Beyond Averages.” World Development 29 (11): 1803–15.
Wood, Adrian. 1994. North-South Trade, Employment andInequality. Changing Fortunes in a Skill-Driven World.Oxford: Clarendon Press.
148 East Asia Integrates

Trade liberalization has profoundly changed thedeterminants of national economic growth andsocial development. World trade is now growingmuch faster than the world gross domestic product(GDP), so that growth opportunities are typicallygreater for exports than they are for domestic sales.But the extent to which poor people, especially poorproducers, benefit from expanded trade opportuni-ties often depends on complementary measuresdesigned to tackle behind-the-border constraints toefficient production and exports. These measuresinclude ones to foster the development of competi-tive markets and public action to provide informa-tion, reduce transaction costs that are often high as aresult of corruption, deliver public services, andaddress market and collective action failures. Poorproducers are not only economically disadvantagedbut also often politically powerless, and when theirinterests are pitted against those of more powerfulactors, they frequently lose. Understanding theinstitutional and political economy underpinnings
149
9
Trade in SectorsImportant to the Poor:
Rice in Cambodia andVietnam and Cashmere in
MongoliaJehan Arulpragasam
Francesco GolettiTamar Manuelyan Atinc
Vera Songwe
of the organizational structure of a particular com-modity or sector is crucial for designing a set ofmeasures that enables the poor to take fuller advan-tage of greater access to markets.
The studies underpinning this chapter illustratethe kind of analysis—using a supply chainapproach—that is needed to inform policymakersand the directions that need to be taken to ensurethat trade opportunities reach the poor. The illus-trative case studies focus on two sectors—rice inCambodia and Vietnam and cashmere in Mongo-lia. Why rice and cashmere? For one important rea-son: in the countries considered, the two commodi-ties provide a livelihood for the majority of poorpeople, and therefore any gains in productivity orin the share of producers in the value chain willlead to improvements in poor people’s welfare. Thevalue chain is the steps of the production system(from raw producer to consumer) as well as thelinkages among the networks of producers,exporters, importers, and retailers along the way.
The authors gratefully acknowledge helpful comments from Florian Alburo and participants in seminars held at the Insti-tute for Southeast Asian Studies of the National University of Singapore and at the World Bank office in Ulaanbaatar.
In Cambodia and Vietnam, as in much of Asia,most of the poor earn a living by growing rice, andthe rice culture permeates the farming traditions ofthe region. In Mongolia, livestock herding, a tradi-tion that is centuries old, provides a livelihood formost of the rural population. These are traditionaleconomic activities of the poor, determined by his-tory and country context, and higher productivityand returns to producers in these subsectors wouldhave a vital impact on the livelihoods of the poor.
Why value chain analysis? The main remainingconstraints to improvements in the welfare of poorproducers engaging in rice and cashmere produc-tion are related to sectoral policy. Domestic tradepolicies, by and large, no longer represent impor-tant impediments, which means that exportersreceive the undistorted prices signals from interna-tional markets. At the other end of the exportchain, producers have incentives to respond toprice signals, because they now have full propertyrights over their assets or the returns to thoseassets, thanks to the increased security of landtenure in Vietnam and the privatization of live-stock in Mongolia. But between the two ends of thesupply chain is a host of institutional and policyconstraints that tend to interfere in the transmis-sion of the price signals and reduce the ability ofpoor producers to benefit from expanding oppor-tunities.
For transition economies such as Vietnam,Cambodia, and Mongolia, institutional constraintsare particularly prevalent.1 Indeed, transitioneconomies making the complex move from a com-mand economy regime to a more market-orientedone are subject to particular challenges and con-straints that value chain analysis is well placed toidentify and assess.
First, the removal of the administratively dic-tated value chains found under a command econ-omy (e.g., where a certain set of economic agents iscommanded to sell to another set of economicagents, perhaps with the prohibition of entry ofother agents) is expected to (indeed, intended to)result in a structural transformation. State-ownedenterprises that may have had a monopoly or amonopsony under such an arrangement willbecome subject to competition. Low levels of effi-ciency that may have been protected might promptclosures or a general restructuring of the valuechain, raising serious political economy issues and
resistance to full and effective implementation ofreforms (Braguinsky and Yavlinsky 2000).
Second, at the same time, new entrants do notalways readily appear to fill in market opportunitiescreated by the removal of administrative con-straints to entry. In addition to noncompetitivebehavior by incumbent economic actors, oftenabetted by state agencies, low capacity, limitedaccess to working capital, and low population den-sity are factors that commonly constrain the devel-opment of the private sector in many transitioneconomies (Sachs, Zinnes, and Eilat 2000; Small-bone and Welter 2003).
Third, a common market failure in early transi-tion economies is imperfect information—aboutthe changes in structural policies that affect the sec-tor and about relevant prices.
Fourth, information services are just one of themany ancillary services and institutions on which afully developed market economy relies for effi-ciency. Indeed, value chains in transitioneconomies are often hindered by a lack of the rele-vant institutions, technology, and infrastructurethat may have developed in step with market devel-opment, in response to market demands, in othermore fully developed market economies(Havrylyshyn and van Rooden 2003). Institutionalfailure or missing markets in areas such as trans-port services, insurance, credit, and research andextension are just some examples of lacunae inlinked markets that challenge the development ofefficient value chains.
Fifth, the freeing up of prices is expected to leadto more competitive and efficient behavior. Butbehavioral changes are not instantaneous and arethemselves closely linked with institutional changeand the development of markets. For example,there may be a role for collective action or publicaction to raise the capacity of nascent private sectorentrepreneurs to figure out how collective behaviormight improve their efficiency, or how qualityenhancements might improve their returns (e.g.,through the establishment of grading systems).Moreover, in many transition economies, althoughthe move to efficient markets calls for the develop-ment of market-related institutions and behavior, italso calls for dismantling the institutions of pettycorruption and nuisance bribes that can add signif-icantly to transaction costs (North 1991; WorldBank 1996; Boeva 2002).
150 East Asia Integrates

Value chain analysis (see Box 9.1) is a useful toolfor understanding these constraints and proposinga set of measures to relieve them. Valuable in thecontext of any economy, it is particularly useful indiagnosing the constraints produced by marketfailures, institutional and capacity failures, as wellas policy and actual policy implementation failuresin transition economies. Value chain analysis evalu-ates the behavior of each major participant (pro-ducers, processors, traders, exporters) in the systemthat links production to final consumption andprovides a detailed account of the constraints par-ticipants face at different stages of the chain.
The value chain analysis approach considersinternational trade relations as part of a series ofnetworks of producers, exporters, importers, andretailers whereby knowledge and relationships aredeveloped to gain access to markets and suppliers.In the shorter term, the relations among differentparticipants in a sector, in turn, determine themeans by which benefits are distributed within thechain and influence the way different actors try toimprove their positions within the chain. From theconstraints identified, it is possible to derive policyrecommendations to raise the returns of poorerhouseholds within the sector. These recommenda-tions can then be validated and assigned priorityby means of quantitative methods. Over the longerterm, measures to eliminate constraints need notbe conflictual in nature, as would be the case in azero-sum game. Policy, institutional, and gover-nance changes can indeed eliminate constraints,improve efficiency and competitiveness within thechain, and permit incremental value to be “added”to the chain (e.g., by improving the quality of thefinal product or better placing it in the global mar-ketplace).
Developing a value chain is tantamount totransforming the production function. The addedvalue can result in important gains from trade forall participants: a positive-sum game. In fact, thefocus on the links among various actors in thevalue chain can be a powerful means of buildingconsensus around reform. The common objectiveof all participants—to enhance the value of theirproduct in the global marketplace—could form animportant constituency for, if not motivator of,reform at various levels of the economy (e.g., pro-ducers, traders, processors, exporters, etc.) withknock-on benefits for other sectors of the economy.
The analysis in the rest of the chapter describesthe considerable impediments to both upgradingthe value of rice and cashmere production andincreasing the share of poor producers in the valuechains. In all three countries, powerful constituentsappropriate rents through explicit preferences(credit for state-owned enterprises in Vietnam,export tax in Mongolia), industrial structure (nearmonopsony for a few millers in Cambodia), andthe toleration of corrupt practices (illegal fees).Meanwhile, poor producers remain trapped in low-productivity states in the absence of improvementsin the delivery of public services such as the poorroad network and inadequate research and exten-sion. Our analysis shows that the poor can benefitfrom the expanded opportunities presented byglobal integration, provided that these institutionalconstraints are addressed. Giving voice to poor pro-ducers’ interests by placing these issues on the pol-icy agenda is crucial for fostering reforms thatunleash the productivity potential of poor peopleand increase their bargaining power.
The first section of this chapter analyzes thevalue chain in rice in Cambodia and Vietnam andmakes policy recommendations to address theconstraints that face different groups of partici-pants. It then validates these recommendationsusing quantitative methods and weighs their effec-tiveness in reducing poverty. The next section ana-lyzes the cashmere value chain in Mongolia andmakes policy recommendations. A concluding sec-tion follows.
Rice and the Poor in Cambodia and Vietnam
Rice is a central feature of life in Cambodia andVietnam. More than 80 percent of the populationof both countries is rural, and most of the ruralpopulation produce rice (Table 9.1). Rice coversmuch of the cultivated area (64 percent in Vietnamand 84 percent in Cambodia) and makes majorcontributions to agricultural GDP (35 percent inVietnam and 22 percent in Cambodia) and to agri-cultural exports. It is the main staple food, repre-senting 60–70 percent of the calories in the diet ofthe average rural household and absorbing about30 percent of household expenditures. Food secu-rity in both countries is closely identified with rice,as supported by recent history.2
Trade in Sectors Important to the Poor: Rice in Cambodia and Vietnam and Cashmere in Mongolia 151

152 East Asia Integrates
BOX 9.1 Value Added from Value Chains
Kaplinsky defines the value chain as “the fullrange of activities . . . required to bring a prod-uct or service from conception through theintermediary phases of production, delivery tofinal consumers, and final disposal after use”(Kaplinsky 1999: 121). The value chain method-ology derives from two strains of literature: thebusiness literature on strategy and organization(Porter 1990) and the literature on global com-modity chains promoted by Gereffi and devel-oped in numerous studies in the late 1990s(UNCTAD 2000).
Value chain analysis focuses on the interac-tion of actors along each step of the productionsystem (from the producer of the raw material toconsumer) as well as the linkages within each setof actors. Such an approach thus considers inter-national trade relations as part of a series of net-works of producers, exporters, importers, andretailers, whereby knowledge and relationshipsare developed to gain access to markets andsuppliers. By mapping the range of activities inthe chain, value chain analysis allows for adecomposition of earnings and rewards amongdifferent parties in the chain. As a diagnosticmethodology, it allows identification of whererents are being captured, as well as the natureand extent of barriers to entry along the chain.
Value chain interventions can both affect therelative gains of the economic agents that par-ticipate in the chain and enhance the total valuethat accrues to the chain, enabling all partici-pants to gain. Value chain analysis can con-tribute to an understanding of the governancestructures within a value chain and to an under-standing of where relative gains are likely toaccrue. Also important, it can lead to strategiesthat improve the relative gains of certain actors(such as poor smallholder producers at the bot-tom of the chain) and to strategies in which allactors can benefit from the gains to trade.
Strategies to improve relative positions mayinvolve cooperative solutions through vertical orhorizontal integration within the chain. Forexample, farmer associations may help toimprove the bargaining power of producers vis-à-vis traders, or direct contractual relationsbetween smallholders and retailers mightenhance the predictability and quality of supply
for the retailer while increasing producers’ sharein the value chain by cutting out the middlemen.
Strategies devised to improve the overall valuein the chain could focus on upgrading upstreamactors, which may take the form of either devel-oping new, higher-value market niches orexpanding the range of activities—for example, amanufacturer might expand into distribution orresearch and development. The growing role ofsupermarket procurement systems in developingcountries is a key development in this regard(Reardon and others 2003; Weatherspoon andReardon 2003). For example, exporters able toplace packaged carrots in UK supermarkets canearn a premium 7–15 times that for exportingordinary bulk carrots (Dolan and others 1998).Yet at the same time, such systems are leading toconsolidation and a shift toward nontraditionalwholesalers, as well as the introduction of strin-gent private standards, posing compliance chal-lenges for small farmers.
The role of governance structures is importantin how such upgrading by suppliers occurs, as isthe support of government and other institutions(UNCTAD 2000). Indeed, there may be a regula-tory or supportive role for the public sector in thisregard. In addition, the overall value of the chainoften benefits from improvements in the quality ofraw material at the early stages of the value chain,pointing to the benefits of cooperative solutionsamong, for example, smallholder producers,traders, and processors. Presumably, there wouldbe a common interest in ensuring that small-holder suppliers reduce the risks of plant diseaseand enhance the quality of their supply.
As market integration moves to sourcing ofhigh-quality products for niche markets, actionis also warranted to ensure that the averagesmallholder does not get marginalized (Dolanand others 1998; Reardon and others 2003).Also important to improving the overall value inthe chain are measures taken to reduce market-ing margins and transaction costs arising frominfrastructure and transport constraints. There issubstantial evidence, for example, that loweringtransport margins through better rural roadsbenefits not only farmers but also other eco-nomic agents along the value chain (Hayamiand Kawagoe 1993).
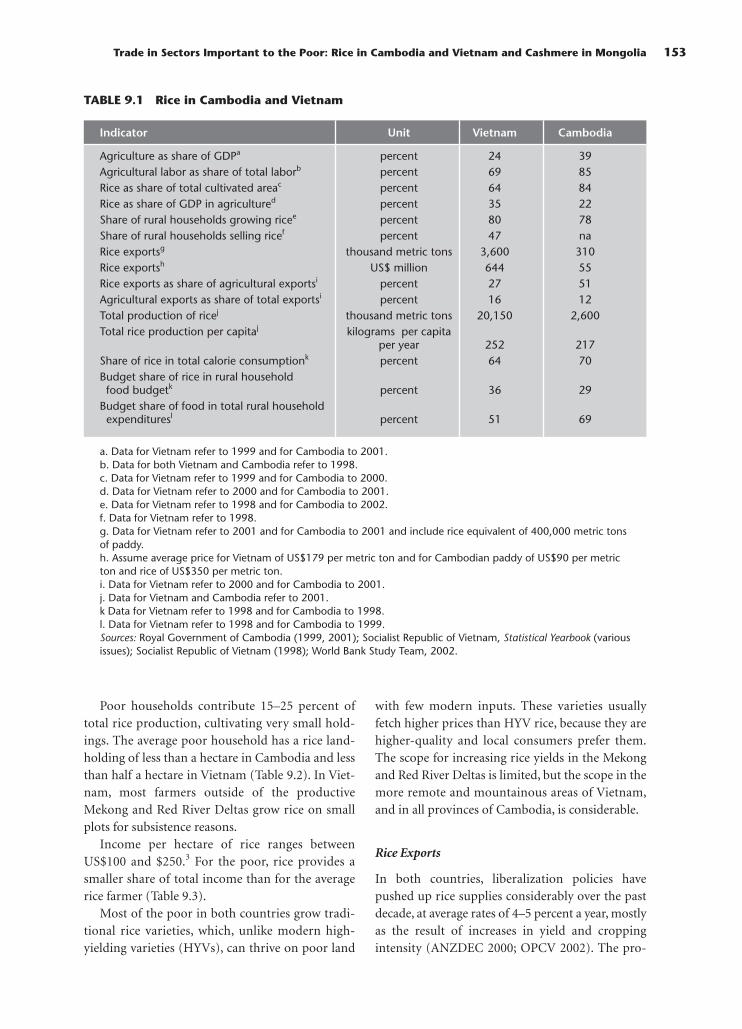
Poor households contribute 15–25 percent oftotal rice production, cultivating very small hold-ings. The average poor household has a rice land-holding of less than a hectare in Cambodia and lessthan half a hectare in Vietnam (Table 9.2). In Viet-nam, most farmers outside of the productiveMekong and Red River Deltas grow rice on smallplots for subsistence reasons.
Income per hectare of rice ranges betweenUS$100 and $250.3 For the poor, rice provides asmaller share of total income than for the averagerice farmer (Table 9.3).
Most of the poor in both countries grow tradi-tional rice varieties, which, unlike modern high-yielding varieties (HYVs), can thrive on poor land
with few modern inputs. These varieties usuallyfetch higher prices than HYV rice, because they arehigher-quality and local consumers prefer them.The scope for increasing rice yields in the Mekongand Red River Deltas is limited, but the scope in themore remote and mountainous areas of Vietnam,and in all provinces of Cambodia, is considerable.
Rice Exports
In both countries, liberalization policies havepushed up rice supplies considerably over the pastdecade, at average rates of 4–5 percent a year, mostlyas the result of increases in yield and croppingintensity (ANZDEC 2000; OPCV 2002). The pro-
Trade in Sectors Important to the Poor: Rice in Cambodia and Vietnam and Cashmere in Mongolia 153
TABLE 9.1 Rice in Cambodia and Vietnam
Indicator Unit Vietnam Cambodia
Agriculture as share of GDPa percent 24 39Agricultural labor as share of total laborb percent 69 85Rice as share of total cultivated areac percent 64 84Rice as share of GDP in agricultured percent 35 22Share of rural households growing ricee percent 80 78Share of rural households selling ricef percent 47 naRice exportsg thousand metric tons 3,600 310Rice exportsh US$ million 644 55Rice exports as share of agricultural exportsi percent 27 51Agricultural exports as share of total exportsi percent 16 12Total production of ricej thousand metric tons 20,150 2,600Total rice production per capitaj kilograms per capita
per year 252 217Share of rice in total calorie consumptionk percent 64 70Budget share of rice in rural household food budgetk percent 36 29
Budget share of food in total rural household expendituresl percent 51 69
a. Data for Vietnam refer to 1999 and for Cambodia to 2001.b. Data for both Vietnam and Cambodia refer to 1998.c. Data for Vietnam refer to 1999 and for Cambodia to 2000.d. Data for Vietnam refer to 2000 and for Cambodia to 2001.e. Data for Vietnam refer to 1998 and for Cambodia to 2002.f. Data for Vietnam refer to 1998.g. Data for Vietnam refer to 2001 and for Cambodia to 2001 and include rice equivalent of 400,000 metric tonsof paddy.h. Assume average price for Vietnam of US$179 per metric ton and for Cambodian paddy of US$90 per metricton and rice of US$350 per metric ton.i. Data for Vietnam refer to 2000 and for Cambodia to 2001.j. Data for Vietnam and Cambodia refer to 2001.k Data for Vietnam refer to 1998 and for Cambodia to 1998.l. Data for Vietnam refer to 1998 and for Cambodia to 1999.Sources: Royal Government of Cambodia (1999, 2001); Socialist Republic of Vietnam, Statistical Yearbook (variousissues); Socialist Republic of Vietnam (1998); World Bank Study Team, 2002.

duction increases have allowed both countries toachieve self-sufficiency and to export rice. Vietnamhas become a major player in international markets.Indeed, with exports of 3.5–4.5 million metric tons,it is now the world’s second largest exporter afterThailand (see Appendix Table 9.3).4 Cambodia hasbegun to export rice (milled) to international mar-kets (316,000 metric tons currently) and paddy(threshed, unmilled rice) to Vietnam.
The values of rice exports are significant forboth countries. For Vietnam, they range from $600million to $1 billion a year and represent 30–50percent of agricultural trade. For Cambodia, riceplus paddy exports provide about $40 million ayear and represent about 40 percent of agriculturalexports, surpassing rubber and forest products.
Cambodia and Vietnam have a comparative andcompetitive advantage in rice relative to otherregional and international rice producers.5 Accord-ing to the computed domestic resource costs for dif-ferent rice varieties and production patterns, bothVietnam (with domestic resource cost ratios for riceranging from 0.42 to 0.66) and Cambodia (with thesame ratios ranging from 0.87 to 0.77) have a com-parative advantage in rice and would gain signifi-cantly from using more efficient farming practices.6
Exports are likely to be the main driver of fur-ther production expansion in rice in the mediumterm, given that the domestic demand for rice is
unlikely to grow much faster than the population(at 2 percent a year). The world rice market is thinand growing only slowly, but it presents goodopportunities for export gains by countries such asVietnam and Cambodia that have a comparativeadvantage in rice, especially if global trade liberal-ization continues in the direction indicated byUruguay Round trade negotiations. Vietnam andCambodia are in competition with only a few othermain suppliers, and the customers are many, withdiverse preferences.
Currently, Cambodia and Vietnam have a 2 per-cent and a 16 percent share of world rice exports,respectively. If they want to maintain or increasetheir shares, they will need to maintain or increasetheir productivity relative to that of their competi-tors. Their success will also depend on establishinglinks with value chains that go beyond theirnational boundaries.
Some opportunities for export gains may lie indiversifying into higher-quality rice. Rice comes inmany varieties, grades, standards, and qualities. Thai-land, as a highly successful rice exporter, has been ableto accommodate the diverse requirements of foreignmarkets—high quality, low quality, fragrant, nonfra-grant, long grain, short grain, parboiled, normallymilled, and so forth. If a producer like Vietnam con-tinues to focus on delivering on contracts for low-quality rice, it will lose the opportunity to export to
154 East Asia Integrates
TABLE 9.2 Land Size and Rice Profit, Cambodia and Vietnam
Indicator Cambodia Vietnam
Average landholding size (hectares) 1.71 1.08Average size of cultivated rice land (hectares/household) 0.99 0.87Average household size 5.3 4.9Size of cultivated rice land by the poor (hectares/household) < 1 < 0.5 Rice production gross margin on labor (US$/hectare) 49 96Rice production gross margin, including labor (US$/hectare) 147 216
Sources: Cambodia: Goletti, Bhatta, and Srey (2002) and ACI (2002a); Vietnam: ACI (2002b).
TABLE 9.3 Rice and Income of the Poor, Cambodia and Vietnam (percent)
Indicator Cambodia Vietnam
Rice as share of total farmers’ income 50.4 42.5Rice as share of income of the rural poor 40.4 47.5
Sources: Cambodia: Goletti, Bhatta, and Srey (2002); Vietnam: Minot and Goletti (1998).

other markets, to diversify its clientele, and possiblyto increase its overall market share.
In neither Vietnam nor Cambodia does tradepolicy per se offer significant further promise forexpanding rice exports. Most of the traditionalinstruments of trade policy have already beenused.7 Some difficulties in import and export stillexist as a result of irregularities, mostly corruptionand weak institutions (inspection, customs, ship-ping, accounting, banking), but barriers to inter-provincial trade have been lifted in both countries.Further progress in trade liberalization is certainlypossible, but the most effective way to promote riceexports in both countries seems to be sector policyrather than trade policy.
Even if rice exports expand successfully, bothVietnam and Cambodia will face challenges inensuring that the expansion benefits the poor.What can value chain analysis reveal about the spe-cific constraints and challenges for Vietnam andCambodia in expanding rice exports as an elementof a strategy for poverty reduction?
Value Chain Analysis: Constraints on Productionand Trade, and Policy Options
Numerous actors take part in the value chain thatlinks rice producers to final consumers: farmers, col-lectors, millers, wholesalers, retailers, state-owned
enterprises, and exporters. Other participantsinclude transporters, seed companies, agrochemicalcompanies, agricultural equipment companies, irri-gation companies, shipping companies, port author-ities, banks, inspection agencies, commerce and taxdepartments, agricultural departments, farm organi-zations, miller organizations, research organizations,extension organization, policymakers, and consumerorganizations (Figure 9.1).
The market and power structures evident in therice markets in Vietnam and Cambodia highlightthe particular challenges facing transitioneconomies that are struggling to overcome the lega-cies of their previous command economy struc-tures in which the state and state-owned enter-prises played a particularly important role, and thatare seeing private sector activity (and even owner-ship) still in the process of being fully institutional-ized. Value chain analysis is especially useful inidentifying the links in the value chain where mar-ket failures or idiosyncrasies are hindering achieve-ment of competitive behavior, diminished margins,or enhanced value.
In fact, this kind of analysis reveals that produc-ers are not the dominant actors in the chain ineither Cambodia or Vietnam; nor are there power-ful retailers or multinationals. In Vietnam, a gooddeal of power rests with a state-owned enterpriseengaged in rice trade, particularly through govern-
Trade in Sectors Important to the Poor: Rice in Cambodia and Vietnam and Cashmere in Mongolia 155
–20
0
20
40
60
80
100
120
Percent
Cambodia Vietnam
VINAFOOD/retailer
Exporter/wholesaler
Transporter
Miller
Collector/husker
Farmer
FIGURE 9.1 Profit Shares for Rice Value Chain, Cambodia and Vietnam
Source: ACI (2002a, 2002b).
ment-to-government contracts involving largeamounts of low-quality rice. Financial sector mar-kets have yet to develop that can serve the creditneeds of Vietnamese farmers, and ancillary servicedelivery functions, such as in the delivery of appro-priate irrigation and seed varieties, have yet notbeen developed. In Cambodia, power lies with afew large millers oriented toward high-quality riceexports, a new Rice Millers’ Federation, and traderswho ship paddy to Vietnam. Meanwhile, retailers inCambodia suffer high transaction costs related topoor infrastructure and unofficial fees and othertransaction costs, including poor infrastructure.
The sections that follow briefly analyze the char-acteristics, constraints, and behavior of each of themain groups of participants, and draw policy rec-ommendations for improving efficiencies and dis-tribution in each country.8
Cambodia. Cambodian rice farmers face seriousconstraints on increasing productivity and outputquality. These include a lack of breeding-seed stock,many farmers’ lack of title to the land they farm(which discourages them from investing inimprovements), and a lack of access to commercialcredit, in part because credit application proce-dures are cumbersome and not tailored to smallloans. Water use systems, where irrigation is avail-able, are highly politicized, with pervasive free rid-ing, and many farmers struggle to subsist on riceproduction from plots that are just not suited torice production.
Increased public investment is needed to main-tain the breeder stock of seed, particularly for thetraditional rice varieties grown by the poor. Suchinvestment should be complemented with anappropriate institutional framework to ensure thatresearch centers focus on basic research and vari-etal development, while private companies focuson the multiplication and sale of certified seed.The government also needs to redouble its effortsto implement the land law and raise public aware-ness of land rights. And improvements in the func-tioning of water user groups would go a long waytoward raising productivity and returns. Thosefarmers who cannot profitably produce ricebecause of poor natural resource endowmentsshould be encouraged to diversify into other prod-ucts, with the aid of agricultural extension andadvisory services.
Rice processing, too, faces some important con-straints. The few millers that do operate havemonopsony power, allowing them to capturehigher margins than if the milling link were morecompetitive (Figure 9.1). Their reliance on obsoletemilling equipment results in high levels of brokenrice, reducing the value of the crop. Poor paddyquality, in the form of mixed varieties of seeds andinadequate postharvest handling, also increases thepercentage of broken rice and lowers the priceearned by most farmers. Lack of working capitaland the high cost of credit limit millers’ ability tobuy paddy from farmers and update their machin-ery. In the end, such conditions encourage theunofficial export of paddy to Vietnam and Thai-land and prevent the country from capturing thevalue added from rice milling. Because they areunable to produce consistent amounts of standard-ized varieties of milled rice and because they lack ofinformation about foreign market conditions, ricemillers have limited access to foreign markets.
Milling is the key bottleneck in the rice valuechain in Cambodia. Millers and farmers haveimportant unexploited opportunities for collabora-tion to encourage more productive cultivation ofpaddy as well as better sorting and postharvest han-dling. In Angkor Kasekam, farmer associationshave linked up with millers and processors, provid-ing a model that could well be replicated elsewhere.More important still is increased competition inmilling to help reduce milling margins in Cambo-dia that are substantially higher than those in Viet-nam and to increase prices to poor producers.Efforts to build capacity (both private and public)in marketing information services would be usefulto improve knowledge among participants in therice marketing chain.
As for the distribution of both retail productsand exports, poor roads dampen production incen-tives and reduce market access. Unofficial check-points and port fees raise the costs of rice for Cam-bodian consumers and lower the competitivenessof all Cambodian rice products, including thosebound for export. Nearly half of transport fees areunofficial costs. In addition, exporters are con-strained by their inability to obtain consistentamounts of a standardized quality of milled rice.
Increased investment to improve roads, rail-ways, and ports and to strengthen the market infor-mation system would reduce transaction costs and
156 East Asia Integrates
raise the profits for actors along the chain. So toowould efforts to put into place transparent rules forexport clearance and to build capacity in legal insti-tutions to facilitate export transactions. Reducingtransaction costs and marketing margins can go along way toward improving returns.
Vietnam. Vietnamese farmers seeking credit facecomplicated borrowing procedures and unsuitablerepayment schedules. They have difficulty obtain-ing high-quality seed in the absence of standard-ized seed specifications. And they are charged thesame irrigation fees regardless of how much waterthey use and despite the poor quality of service.
As in Cambodia, Vietnam’s research institutesand universities should focus on seed research andvarietal development, while commercial seed com-panies focus on seed multiplication and sale of cer-tified seed. Irrigation fees should be set on the basisof metered water use rather than area irrigated (atleast at the level of farmer groups), and they shouldbe set at levels high enough to cover capital costsand operations and maintenance. Also as in Cam-bodia, research is needed on alternative land useoptions and possibilities for diversification, espe-cially for farmers who do not have suitable land orother endowments for productive rice farming.
Rice processing faces constraints as well. Viet-nam’s milling sector is in transition, from abimodal structure—with a large number of smalland medium-size mills catering to the domesticmarket and a few large mills catering to the exportmarket—to a more modern industry with fewer,larger mills. Technology in the domestic millingsector is often outdated, resulting in high levels ofbroken rice, and, as in Cambodia, millers are fun-damentally constrained by a lack of working capi-tal. Small millers are also constrained by their lim-ited storage space, as well as, for some, shortages ofelectricity. In the large milling sector, the preferen-tial credit arrangements for state-owned mills ham-per the ability of the private sector to competeeffectively. The awarding of government-to-gov-ernment contracts to state-owned mills also pre-vents expansion of the export base to private mills.
Interventions are needed to improve postharveststorage facilities and build the financial manage-ment capacity of millers. Leveling the playing fieldbetween state-owned and private mills would alsofoster enhanced private sector involvement in the
milling sector. And, as in Cambodia, there is muchto be gained by encouraging collaboration betweenfarmers and millers, with millers providing seedand other inputs and enhancing farmers’ incentivesto supply higher-quality, less breakable paddy thatwould realize higher prices.
Rice distribution in Vietnam is hampered byinadequate infrastructure, particularly in areas out-side the Mekong River Delta, and a multilayered dis-tribution system makes it difficult for millers andexporters to obtain high-quality inputs from pro-ducers. State-owned enterprises benefit from prefer-ences and are able to borrow the entire value of acontracted shipment of rice, while private firms canborrow only up to 70 percent. Rice exports fromVietnam are vulnerable because they are of rela-tively poor quality and go to only a limited numberof markets. Most exports go through a small num-ber of distributors, and most sales are made throughgovernment-to-government contracts.
Improving physical infrastructure, particularly inremote and mountainous regions, would lowertransaction costs. Rationalizing state-owned enter-prises, permitting their equitization, and leveling theplaying field by removing their preferential access tocredit arrangements would foster greater private sec-tor participation and efficiencies in this link of thechain. The diversification of export outlets might beencouraged through simple steps such as the devel-opment of overseas trade promotion activities andstrategy. Increased efficiency, lower transaction costs,and better placement of a final, higher-quality prod-uct would raise prices, lower costs, and benefit thevarious actors along the value chain.
Overview of Recommendations
To the extent that the poor are able to benefit fromincreased production, they will also benefit fromtrade. Most poor households in Vietnam and Cam-bodia are farm households, and because 80 percentof farmers grow rice, the poor are likely to benefitfrom any improvement in rice productivity orvalue added. They will probably benefit most fromimprovements in productivity and the technologyassociated with traditional varieties. Therefore,short-term strategies to reduce the number of peo-ple in poverty and the severity of poverty shouldfocus on how to increase returns from these vari-eties. Steps should be taken to improve production
Trade in Sectors Important to the Poor: Rice in Cambodia and Vietnam and Cashmere in Mongolia 157

technologies for traditional varieties, moderatepostharvest losses,9 introduce increased competi-tion and more modern technology into milling,strengthen infrastructure, and lower transactioncosts (including illegal fees). Particularly significantwill be efforts to establish farm organizations. Newinstitutions and markets that increase informationabout prices and permit the agents in a value chainto form strategic alliances can play an importantrole in increasing returns to players such as poorsmallholder farmers.
The role of the public sector in direct invest-ments to increase productivity should be limited toproviding irrigation, where irrigation is economi-cally viable. Elsewhere, the public sector shouldplay an enabling role, both through legislation andthrough provision of services—especiallyimproved infrastructure and public policies toreduce the transaction costs of providing credit.
For convenience, the recommendations thatemerged from the value chain analysis are groupedas strategic options related to improvements inproductivity, postharvest technology, and infra-structure and chain management (Table 9.4).10
This section uses quantitative methods, applied tohousehold data, to evaluate these options andexplore their effects on different participantswithin the value chain.
Aggregate Effects. A multimarket model was builtto explore the probable effects of the various policyoptions on aggregates, including production,
exports, and agricultural incomes. The resultsreported in Table 9.5 show that a combination ofdifferent approaches is needed to improve theincome generated by the value chain. Improve-ments in productivity, postharvest technology, andmarketing and institutions can go a long waytoward increasing exports and agricultural income.
Clearly, policy design would require a moreexplicit idea of the costs involved and the time framerequired to implement different options. Even so,some useful insights can be obtained from a qualita-tive analysis such as that reported in Table 9.6.
Effects on Farmers and the Poor. What are themarketing margins and profits for the different par-ticipants in the value chain? Tables 9.7 and 9.8report these at each level of the chain for rice inCambodia and Vietnam.11 Farmers and millers havethe largest marketing margins and profit margins12
in both countries, but the distribution of profits dif-fers; Cambodian millers capture a much highershare of profits than their Vietnamese counterparts.
In absolute terms, Cambodia’s rice value chainrealizes a higher profit than Vietnam’s (Figure 9.2),in part because Cambodia exports higher-qualitypaddy than does Vietnam. Meanwhile, Cambodia’sfarmers realize lower unit profits than their Viet-namese counterparts. On average, their rice land isonly half as productive as that in Vietnam, but theaverage Cambodian rice farmer has more thantwice as much land as his Vietnamese counterpart.These features suggest that efforts to reduce poverty
158 East Asia Integrates
TABLE 9.4 Strategic Options for Rice, Cambodia and Vietnam
Option Adoption of option
Productivity Adopting green revolution package Dry season, CambodiaImproving traditional varieties Wet season, Cambodia
Upland areas in Vietnam
Postharvest technology Reducing postharvest losses Cambodia, VietnamImproving milling Cambodia, Vietnam
Marketing and chain Improving road and port infrastructure Cambodia, Vietnammanagement Reducing transaction costs Cambodia, Vietnam
Establishing niche market (specialty rice) Cambodia, VietnamEstablishing level playing field Private sector and state-
owned enterprises, Vietnam
Source: ACI (2002a, 2002b).

Trade in Sectors Important to the Poor: Rice in Cambodia and Vietnam and Cashmere in Mongolia 159
TABLE 9.5 Effects of Various Policy Options on Rice Production, Income, and Exports:Cambodia and Vietnam
Percent change in
Rice Agricultural Rice Cambodia Option production income exports
Improved productivity Green revolution technologies 4 1.5 31
Traditional varieties 15 7 228
Improved postharvest handling Milling technology 3.1 1.3 24Postharvest losses 4.6 2 37
Marketing and chain management Marketing costs farm to port 1.6 5 25
Percent change in
Rice Total Rice Vietnam Option production income exports
Improved productivity Yield improvement 18.2 1.2 39Improved postharvest handling Milling technology 0.5 0.37 12
Postharvest losses 1.31 0.1 1
Source: Authors’ simulation of multimarket model; see ACI (2002a).
TABLE 9.6 Qualitative Analysis of Strategic Options, Cambodia
Benefit in Benefit/Cambodia Option agricultural cost
income Cost ratio Time frame
Improved productivity Green revolution technologies 2 4 0.5 3–10 years
Traditional varieties 5 3 1.7 3–10 years
Improved postharvest Milling technology 1 1 1.0 3–5 yearshandling Postharvest losses 3 2 1.5 3–5 years
Marketing and chain Marketing costs farm 4 5 0.8 5–10 yearsmanagement to port
Note: Scoring method: 1 = lowest, 2 = low, 3 = average, 4 = high, 5 = highest.Source: ACI (2002a).
by raising productivity might be more effective inCambodia than in Vietnam. Because rice produc-tion represents between 30 and 50 percent of theincomes of the poor in the two countries, even smallimprovements in productivity can lead to impor-tant direct income gains for the poor. In addition,the combined effects of higher productivity for mil-
lions of small rice farmers could be dramaticincreases in rural nonfarm activities.
Assessing the overall direct impact on the poor ofthe proposed improvements in the rice subsectorwould require a more in-depth model based onhousehold data (e.g., those available from livingstandards surveys). Such a model could trace the

microeconomic behavior of poor households.Higher consumer prices for rice will undoubtedlyhurt households that are net consumers of rice,including the urban poor. Also, it is clear that netsellers of rice in rural areas would benefit fromhigher prices or increased trade volumes. An in-depth study might look usefully at the distributionof poor households in rural areas, seek to under-stand who is going to be a net buyer or net seller,
and consider the effect of changes on each categoryin detail. To the extent that the farm gate prices ofpaddy increase more than the retail prices for rice,not only net sellers of rice but also some of the netbuyers will benefit from increased exports, and areduction in overall poverty might result (Minotand Goletti 1998).
Rice farmers in both countries have limitedcapacity to capture a larger share of the profit or
160 East Asia Integrates
TABLE 9.7 Marketing Costs and Margins for Rice in Cambodia, 2002
Trans- Whole-Inputs Farmer Collector Miller porter saler Retailer Total
Transport cost 15 26 10Operating cost 34 6Input cost 355 453 469 526 561 605Total costs 355 468 503 553 577 605Price received 355 453 469 526 561 605 625Value of byproduct 65Total revenue 355 453 469 592 561 605 625Profit (%) 355 98 (21.7) 1 (0.3) 88 (14.9) 8 (1.5) 27 (4.5) 20 (3.2) 244 Percent of total profit 40 1 36 3 11 8 100Marketing margins (%) 56.8 15.7 2.6 9.1 5.6 6.9 3.2 27.5Markup over farm gate price (%) 0 3.6 31 24 33 38
Notes: Costs are shown in riels per kilogram of paddy rice; yield is calculated at 2 metric tons per hectare; trans-port is from Battambang to Phnom Penh; and milling recovery is 0.64.Sources: Derived from data collected by World Bank Study Team, July 2002; ACI (2002a).
TABLE 9.8 Marketing Costs and Margins for Export Rice in Vietnam, 2002
Collector/ Large Trans- VINA-Inputs Farmer husker miller porter Exporter FOOD Total
Transport cost 32 4 2Operating cost 37 47 14 13Input cost 1,000 1,600 1,717 1,716 1,742 1,727Total costs 1,000 1,669 1,769 1,732 1,755 1,727Price received 1,000 1,600 1,717 1,716 1,742 1,727 1,736Value of byproduct 144.10Total revenue 1,000 1,600 1,717 1,860 1,742 1,727 1,736Profit (%) 1,000 600 (37.5) 48 (2.8) 90 (4.9) 9 (0.5) –27 (–1..6) 9 (0.5) 729Percent of total profit 82 6 12 1 –4 1 100Marketing margins (%) 57.5 34.5 6.7 –0.06 1.5 –0.8 0.5 7.8Markup over farm gate price (%) 0 7.3 16 9 8 9
Notes: Costs are shown in dong per kilogram paddy equivalent. Milling recovery is: brown rice, 0.77; white ricefrom brown rice, 0.85; white rice from paddy, 0.66. Export price is: (assuming 15 percent broken rice) US$172per metric ton = 2,632 dong per kilogram.Sources: Derived from data collected by World Bank Study Team, July 2002; ACI (2002b).

marketing margins produced along the value chain.Comparisons of four countries at increasing levelsof development suggest that the marketing marginsof farmers are smaller in the less developedeconomies than in the more developed economies(Table 9.9). As national income per capitaincreases, farmers get a progressively bigger size ofthe total price (higher margins) and higher profits.The reasons farmers get less in Cambodia and Viet-nam than in the other countries shown are relatedpartly to infrastructure and partly to political econ-omy. In the United States, where the farm lobby hasgarnered substantial subsidies, leading to farm gateprices higher than FOB prices, farmers are betterpositioned to influence decisions than are farmersin Cambodia, who have very small and dispersedholdings, are less effective in influencing policy, and
face relatively much higher costs for transport, pro-cessing, marketing, credit search, and information.
Policies that promote infrastructure, informa-tion systems, and farm organizations will help totransfer some of the benefits to farmers. Betterinfrastructure will lower the cost of transport fromfarm gate to port and the marketing costs of traders.For farmers, such reductions will likely result inhigher prices and a greater share of the value added.Better information systems will help farmers toadopt better technology and orient marketingagents toward the higher-quality rice that isdemanded by international markets. The result willbe higher production and higher prices for the rawmaterial, and both suggest that farmers will capturea larger share of the value added. The promotion offarm organizations will raise the bargaining powerof farmers vis-à-vis millers, traders, and exporters.The development and strengthening of farm orga-nizations, and their alliance with milling firms andother agencies in the value chain, can lead to sub-stantial improvements in efficiencies and quality.
Cashmere and the Poor in Mongolia
Mongolia produces one-fourth of the world’s sup-ply of raw cashmere and is the world’s secondlargest producer after neighboring China. Over thelast decade annual production has more than dou-bled. All cashmere production is traded, and almostall is exported. Cashmere exports of $70 million
Trade in Sectors Important to the Poor: Rice in Cambodia and Vietnam and Cashmere in Mongolia 161
Farmer Collector/husker
Miller Transporter Exporter/wholesaler
VINAFOOD/retailer
Total
7060
50
40
3020
10
0
–10
Cambodia
Profits of each actor (US$ per 1,000 kilograms)
Vietnam
FIGURE 9.2 Profit Structure of Rice Value Chain, Cambodia and Vietnam (US$/ton)
Source: ACI (2002a, 2002b).
TABLE 9.9 Marketing Margins of Farmersin Cambodia, Vietnam, Thailand, andUnited States
Country Farm price/FOB price (%)
Cambodia 72Vietnam 80Thailand 90USA 111
Sources: Cambodia and Vietnam: fieldwork ofWorld Bank Study Team, July 2002; ACI (2002a,2002b). Thailand: personal communication, TomSlayton, October 2002. United States: USDA-ERS(2002).

accounted for 13 percent of Mongolia’s officialexports in 2001 and generally have been evenhigher (Table 9.10).13
The cashmere subsector provides more than athird of the country’s 2.4 million people withincomes. It is the single largest employer—providingjobs for more than 16 percent of the work force andaccounting for more than 6 percent of GDP in1993–2001 (see World Bank 2003)—and it is a prin-cipal source of livelihood for Mongolia’s poor. Aver-age household income from cashmere for herdinghouseholds is estimated at $220 for 2001. The varia-tion around this average, however, is substantial, with
44 percent of livestock herding households earningless than $100 a year, another 44 percent earningbetween $100 and $500 a year, and the remaining 12percent earning more than $500 a year.14
When COMECON (Council for Mutual Eco-nomic Assistance) collapsed in 1991, Mongolia pri-vatized collective farms and livestock and removedprice controls, fueling a boom in the livestock sec-tor and ushering in substantial increases in the live-stock population. The number of cashmere goatsdoubled, to 10.3 million by the end of 2000, and theper capita incomes of herders rose from about $30to $55 between 1991 and 1996. The characteristics
162 East Asia Integrates
TABLE 9.10 Cashmere in Mongolia
Indicator Unit 1998 1999 2000 2001
Agriculture as share of GDP percent 39.9 40.3 34.2 28.4 Livestock sector as share of GDP percent 36.1 36.8 30.8 24.8 Agricultural labor as share of total labor percent 49.7 49.5 48.6 48.3 Goat herd as share of total livestock percent 33.6 32.9 34.0 36.8 Cashmere production as share of GDP percent 3.5 6.7 11.7 5.7 Cashmere exportsa metric tons 1,812.1 3,499.6 2,770.6 2,369.1 Cashmere exportsb US$ million 38.7 70.3 90.1 67.8 Cashmere exports as share of total exports percent 8.4 15.5 16.8 13.0
Cashmere exports as share of agricultural exportsc percent 41.6 53.7 53.8 50.0
Agricultural exports as share of total exports percent 17.3 24.7 26.5 24.5
Total production of cashmere metric tons 3,126.7 3,194.8 3,084.5 2,930.0 Total cashmere production per capita kilograms
per capita per year 1.3 1.3 1.3 1.2
Cashmere revenue per capita US$ 15.2 26.5 49.1 25.0 Share of cashmere revenue per capita in GDP per capita percent 3.8 6.9 12.2 6.0
Total cashmere production/household kilograms with livestock per capita
per year 11.4 11.8 11.5 11.4 Cashmere revenue/household with livestock US$ 124.4 223.4 423.4 229.0
Share of cashmere revenue/household with livestock in GDP per capita percent 31.1 55.9 105.9 57.3
Livestock per capita head 13.6 14.1 12.6 10.7 Livestock/household with livestock head 119.6 124.4 112.5 101.6 Goats per capita head 4.58 4.64 4.26 3.98Goats/household with livestock head 40.2 40.9 38.2 37.4
a. Data for semiprocessed and finished cashmere products converted to raw cashmere.b. Official exports; value of smuggled cashmere is not included.c. Here the finished cashmere products (tops and garments) are excluded from total cashmere exportsand agricultural exports.Sources: National Statistical Office of Mongolia, 2001, and World Bank staff estimates.
of the herder population changed as well. Thenumber of herding households more than doubledduring the 1990s, to 185,500 (one-third of house-holds nationwide) in 2001, reflecting an influx ofnontraditional herders.
Mongolia now has three groups of herders, dis-tinguished by herd size, income levels, and grazingtechniques. The first group is made up of house-holds that were in poverty after the collapse ofCOMECON and moved into cashmere productionfor lack of alternative income opportunities (WorldBank 2001).15 Unlike traditional herders, most ofthese families own small herds of up to 100 goatsthat they graze on common areas, and more than30 percent of them—with fewer than 30 goats onaverage—live in urban areas. The average annualincome of these families from cashmere sales in2000 was less than $55 per capita. Their intensiveand stationary herd management is a major sourceof serious land degradation. As their livestocknumbers have increased, land degradation hasbecome more acute, imposing costs on both thepoor and the state. Overgrazing increases the inci-dence of respiratory diseases from dust, and it low-ers productivity because herders have to travel fur-ther to tend their stock. It also exacerbates theimpact of harsh winters on animals and on thehouseholds that depend on them. These house-holds have been able to operate at the marginthanks only to the implicit subsidies—free publicland and water—and explicit subsidies—freerestocking of goats after the devastation of livestockin the successive harsh winters of 2000 and 2001.Taking into account the cost of inputs and landdegradation, the social returns from the livestockpractices of these households may be negative.
The second group of herders, who own herds offrom 101 to 500 head, account for the bulk of cash-mere production. They own 38 percent of thenational herd and produce more than 65 percent ofMongolia’s cashmere. Most live in rural areas, pre-viously worked in state-owned livestock coopera-tives, have herding experience, and bought livestockusing vouchers when collective enterprises wereprivatized. They depend almost entirely on live-stock herding for income. Not all of these herdersare poor, but all are vulnerable to bad weather andchanges in demand.
The third group makes up 2 percent of all herderfamilies and produces about 3 percent of Mongo-
lian cashmere. These households are consideredrich and are generally not at risk.
Both the second and third groups of herders arenomadic and can afford to move to three or moredifferent camps a year. They have access to wintershelters by tradition or kinship, and they havelonger experience in selecting and occupyingrangeland in distant areas (World Bank 2001).
Potential Gains for the Poor from Trade in Cashmere
Because a high share of its production is exported,the cashmere subsector in Mongolia is much moredirectly influenced by trends in the internationalmarket, including quality standards, than is the ricesector in Cambodia and Vietnam. Looking ahead,there are many reasons for optimism about theinternational market. Demand for luxury goods isgrowing worldwide and is well balanced globally.Demand for finished cashmere articles is highlyincome-elastic, and trade in cashmere and cash-mere products is likely to continue growing.16
Quality is an important consideration in assess-ing Mongolia’s prospects for expanding exportearnings and incomes. Mongolia has historicallysupplied some of the world’s best cashmere, butquality has declined significantly over the last 15years as the country’s production has increased.Quality cashmere commands a 30–40 percent pricepremium in international markets, and quality dis-counts cost Mongolian herders about $18 millionin 2001—23 percent of the income of the averagehousehold with livestock.
Higher export earnings from cashmere wouldhelp to boost the incomes of a large number ofMongolians. Although information about the rela-tive position of herder households in the incomedistribution is not available, it is clear that many ofthese households represent the poorest segments ofMongolian society. However, the sustainability ofcashmere production as a livelihood for householdsin the first group just described is open to question.
Value Chain Analysis: Constraints on Productionand Trade, and Policy Options
Many different actors—herders, traders, processors,retailers, and exporters—take part in the value chainlinking producers to final consumers. Others are vet-
Trade in Sectors Important to the Poor: Rice in Cambodia and Vietnam and Cashmere in Mongolia 163
erinary service providers, local and central govern-ment officials, herder organizations, graders, andexternal partners, including donors and nongovern-mental organizations. Most of the power within thevalue chain resides with the state-owned processingfirm and retailer, Gobi; herders are the largest groupof actors but perhaps the least powerful.
This section looks at the policy and institutionalconstraints faced by each of the main actors andsuggests possible policy responses. Like the situa-tion for rice in Cambodia and Vietnam, many ofthe constraints in the sector represent shortcom-ings of sectoral policies and institutions rather thanof trade policy. Once again, value chain analysisproves particularly useful in pointing out the par-ticular challenges to developing efficient and high-value products, with returns that benefit the poor,in the context of transition economies.
The difficulties faced by transition economies areparticularly evident in Mongolia where, with tradi-tional practices under stress and state institutionsbeing dismantled, efficient market development isfacing the challenge of developing new institutionsand overcoming the legacy of passing ones. Forexample, in overcoming the history of collectiviza-tion in Mongolia, economic agents must spendsome time allaying suspicions and work to developnew and efficient institutions through collectiveaction with a view toward benefiting fromeconomies of scale. The development of new herdercooperatives and responsive private sector veteri-nary services to replace defunct communal andpublic service institutions has been a slow process.
Two requirements—understanding the need forquality control and grading systems and developingan effective demand for such systems throughappropriate price signals—have yet to be met. Thebreakdown of traditional pastureland and risk man-agement practices is resulting in overgrazing andsevere losses of herds after a particularly harsh win-ter (dzud), and an inability to maintain wells andbores. Likewise, missing markets, weak institutions,and an absence of ancillary markets in services—such as a lack of physical marketplaces, traders, andinsurance markets—are challenging the develop-ment of value chains in Mongolia. Indeed, this situ-ation plagues many transition economies.
Herders. Herders face several serious impedimentsin improving the quality and expanding the supply
of cashmere without undue environmental dam-age. The combination of easy entry into cashmereproduction and failing institutions for key inputshas led to deterioration of the water supply, col-lapse of the fodder industry, and an absence of pas-ture management. These factors have therefore putpressure on environmentally fragile land andincreased both the private and social costs of pro-duction.
Mongolia’s existing legal and administrativemechanisms for controlling grazing are unlikely tobe able to resolve the problems of land degradation.The primary input for cashmere—grazing and pas-tureland—continues to be a public good, and pri-vatization is not a realistic option.17 Strengtheningsocial controls would require introducing provi-sions into the land laws to allow groups of herders,organized as legal entities, to exclude others fromwell-defined areas of pastureland. Other optionswould include land user fees, whose feasibilitywould have to be assessed, or modifications of thehead tax on livestock to ensure that it reflects thesocial costs associated with land degradation.18
Improvements in land use laws or a revision of thelivestock tax would provide incentives for herdersto rationalize their stocks, pool resources, andemploy more efficient grazing techniques. Impos-ing fees on land use would also spur the develop-ment of a sustainable fodder market. Rehabilitatingwater bores is crucial to increased livestock produc-tivity and supply and could generate rural employ-ment. Bores and wells are constitutionally theresponsibility of local government administrators,but the Gobi Initiative, funded by the U.S. Agencyfor International Development (USAID), hasshown that herders are willing to pay for waterfacilities if exclusive use is guaranteed. Supportfrom government and donor agencies is needed inscaling up this successful public-private partner-ship nationwide.
Mongolia is vulnerable to severe winters.19 Bet-ter herding practices can help to mitigate theimpact of severe weather, but herders will remainhighly vulnerable without insurance. Only about0.3 percent of Mongolia’s livestock was insured in2001, when Mongolia had a particularly harsh win-ter.20 It is estimated that the government spent thatyear about 2 billion tugriks (about 1.1 percent ofGDP) on providing subsidized fodder and otherdisaster relief services.
164 East Asia Integrates

A well-developed insurance market for livestockcould reduce these costs substantially for the gov-ernment and help to stabilize herders’ incomes. Thedevelopment of insurance options faces importantchallenges, including herders’ nomadic lifestyle, thedifficulties of gathering adequate information onherd management techniques, and a lack of suffi-cient skills and information to determine appropri-ate insurance premiums. But recent pilot projectsaimed at providing index-based livestock insuranceprovide a good start to the introduction of market-based techniques for addressing risks.21 The persist-ence of an implicit government guarantee of live-stock assets will discourage the development of aninsurance market and delay the needed exit of mar-ginal producers. Donors and the government needto desist from restocking herds free of charge and atlevels too high for long-term sustainability.
Finally, restoring quality is critical to increasingthe value of Mongolian cashmere and the incomesof herders. Reasons for the drop in quality over thelast decade include herders’ lack of information ongrades and prices, and on veterinary and other herdimprovement topics, together with a lack of grad-ing and testing facilities. When herders lack marketinformation, they are vulnerable to exploitation byprocessors and traders, and without price differen-tials between high-quality cashmere and othergrades, herders lack incentives to invest in improv-ing their herds.
The way to restore the quality of Mongoliancashmere is through herd selection, superior genet-ics, and price incentives that reward qualityimprovement. Improvements in the legal and regu-latory framework could encourage the establish-ment of innovative joint venture agreements andpartnerships in research and development. Newtechnological developments in rearing cashmeregoats could improve the supply and quality ofMongolian cashmere without damaging the envi-ronment. The provision of services for testing andgrading should be encouraged, and the Mongolianherders’ association should use internationallyaccepted grading standards. Grading will allow forproduct differentiation and will allow herders andprocessors to determine the best mix of quality andprice for production and sale.
Traders and Marketing and Distribution Chan-nels. Mongolia’s one major cashmere market—the
Tsaiz market in Ulaanbataar—is 600–1,000 kilome-ters from most regional production centers. Almostall herders must sell their cashmere either to tradersat the farm gate or at informal provincial market-places, at discounts of 10–45 percent from capitalcity prices. Generally, they sell as individuals, oftenon a barter basis, with little knowledge of marketdemand and little ability to influence market out-comes. They incur additional expenses for trans-porting goods to the market day locations with nocertainty of concluding sales.
Steps to stimulate growth in Mongolia’s cash-mere industry, and in poor herders’ incomes in par-ticular, will require strategies to improve marketingchannels, so that herders are able to get their prod-ucts to processors at least cost and so that they areremunerated fairly for superior quality. Develop-ment of regional market centers, such as those inthe Gobi Initiative funded by USAID, and improve-ments in infrastructure could significantly increasethe incomes of rural herders. Other promising ini-tiatives are the development of herder cooperativesand attempts by government to improve herders’access to markets by creating wholesale networks.Mongolia has a good law on cooperatives, but assis-tance is needed to improve governance and finan-cial management in cooperatives.
Vertical integration between herders and proces-sors could in principle lead to a sharing of trans-port costs between agents, improve herders’ incomesecurity, and reduce the uncertainty of supply forprocessors. But developing such strategic allianceswould be challenging; with their nomadic lifestyle,herders would find it difficult to enter into formalmarketing agreements. Moreover, such formal rela-tionships require a lot of trust and strong socialcohesion, which has been eroding in Mongolia.Credible mechanisms to enforce contractual obli-gations would have to be in place and so would asystem that rewards herders for cooperation andorganization.
Processors. Since Mongolia’s transition from acommand economy to a more market-orientedeconomy, the number of cashmere processing anddehairing companies has risen to more than 30, andherders can trade directly with international buy-ers, middlemen, or trading agents. Although thestate abandoned cashmere producers in the wake ofthe transition, it retained a heavy influence in cash-
Trade in Sectors Important to the Poor: Rice in Cambodia and Vietnam and Cashmere in Mongolia 165

mere processing through the ownership of Gobi,the largest processing company, and other jointventure partnerships in Mongol-Amical and Mon-Forte.22 Processing capacity exceeds domestic sup-ply even in the best of years, and in 2000 the fourlarge factories that account for about two-thirds ofprocessing capacity were running at only one-fifthof their capacity.
Policies to reform this segment of the valuechain need to level the playing field among proces-sors; Gobi benefits from continued governmentsupport in raw cashmere procurement. The indus-try’s excess processing capacity also should berationalized, which adds to production costs.
Cashmere Trade Policies. In 1994 the governmentbanned exports of raw and washed cashmere on thegrounds of the need to “protect domestic industryfrom external competition and increase domesticvalue added.” In 1997 the export ban was replacedby an export tax on raw cashmere of 4,000 tugriksper kilogram, equivalent to 13 percent in 2001prices.
Although these policies were meant to protectdomestic processing firms by providing them withlarger volumes of cashmere at cheaper prices, and toincrease the value added by the cashmere subsectorto the economy, these goals have not been met.Rather, these policies have stimulated activities thatcircumvent the ban and the export tax, in fact low-
ering the supply of raw cashmere to the domesticprocessing industry and exacerbating the problemsassociated with low-capacity utilization. Smugglinghas grown rampant, given the length and porosity ofthe border with China, and Mongolia’s final goodsexports have remained quite limited (Figure 9.3).
Proceeds from the export tax in 2001 amountedto less than 0.01 percent of total government rev-enues. The decline in recorded raw cashmereexports cost Mongolia about $100 million in offi-cial export earnings between 1996 and 2001. Inaddition, by pitting the interests of processorsagainst those of herders, the export tax may havedamaged the prospects for forming strategicalliances within the domestic supply chain.
The case for retaining the export tax is uncon-vincing. The tax has shown itself to be unenforce-able, but if it were to have its intended effects, theresult would be a transfer of resources in the valuechain away from the poorest members to the morepowerful ones. Abolishing the tax is likely to havebeneficial consequences both for herder incomesand for the overall development of the cashmeresubsector.
Overview of Recommendations
As a matter of priority, measures are needed to stopthe degradation of grazing land and ensure moresecure supplies of water and fodder.
166 East Asia Integrates
0102030405060708090
100
Cashmere, greasy/raw Cashmere, dehaired
Cashmere tops Cashmere garments
Percent
1993 1994 1995 1996 1997 1998 1999 2000 2001
FIGURE 9.3 Share of Cashmere Products in Mongolia’s Total Cashmere Exports, 1993–2001
Source: Government of Mongolia.

For herders, the scope is significant for expand-ing incomes and reducing poverty by upgradingthe quality of cashmere produced. Simple simula-tions suggest that closing half the quality gapbetween Mongolian and Chinese cashmere wouldhave increased average annual incomes for herderhouseholds from $220 to $263, or by 20 percent, in2001. This increase is a feasible target over the next6–10 years.
Reducing poverty will require a combination ofmeasures to increase both the value of output—through upgrading quality—and herders’ share ofthat value. A host of measures would help to increaseherders’ share of profits in the value chain: increasingtheir security of access to pastureland; enabling thedevelopment of input and insurance markets; pro-viding livestock support services and reliable infor-mation about quality standards and prices that aredifferentiated by quality; developing markets inregional centers, reducing transport costs, andincreasing the bargaining power of herders; and fos-tering cooperative solutions to help householdsattain economies of scale or strategic alliances toincrease the security and quality of supply.
Government has a necessary role in improving thepolicies and institutions to support the cashmerevalue chain. For the most part, it must play anenabling role, but some instances of market failurerequire nonmarket solutions. These solutions includepastureland management, veterinary services, stan-dard setting, and dealing with information asymme-try in insurance markets. In addition, there is a casefor revising Mongolia’s trade policies for cashmere:although the government should pursue relaxation ofthe ban on breeder stock imports from China, in thecontext of discussions on China’s accession to theWorld Trade Organization the tax on exports of rawcashmere appears counterproductive.
Detailed household survey data are not yet avail-able for Mongolia, and without them it is difficult toestimate the net impact of the recommendedchanges on the welfare of various participants in thecashmere supply chain.23 It seems clear, however,that upgrading cashmere quality is likely to increasevalue, and that reducing transaction costs (by devel-oping regional market centers) and reducing volatil-ity (through insurance) would yield unambiguouswelfare gains. Some of the recommendations, par-ticularly elimination of the cashmere export tax,would transfer gains from one set of participants to
another, and others would increase private costs toreflect more accurately the economic costs of inputprovision and of externalities, notably environmen-tal degradation from overgrazing.
Without subsidies, the marginal segments of theherder population might no longer find cashmereproduction a sustainable activity. This possibilityraises difficult questions about the role of livestockherding in Mongolia, which has acted as a safety netfor many households adversely affected by the tran-sition from a planned to a market economy. Forsuch families, a transition out of herding wouldhave to be phased over time and accompanied bymeasures to stimulate alternative employment—for example, in storage, maintenance and repair ofwells, and fodder production.
Conclusions
An analysis of value chains provides a good under-standing of the behavior and constraints of differ-ent actors involved in the addition of value as aproduct moves from producers to consumers, andat the same time allows the analyst to identify themajor constraints in the sector as a whole. Suchanalysis reveals that the poor can benefit from theexpanded opportunities presented by global inte-gration, provided that these institutional con-straints are addressed. Giving voice to poor pro-ducers’ interests by placing these issues on thepolicy agenda is crucial for fostering reforms thatunleash the productivity potential of poor peopleand increase their bargaining power.
Growth in trade can be achieved throughimprovements in productivity, combined withimprovements in postproduction technologies andmarketing and institutions. This finding is true forrice in Vietnam and Cambodia, where a small pro-portion of total production is actually traded andan even smaller proportion is exported. It is alsotrue for cashmere in Mongolia, where all output istraded and almost all is exported in some form.
Both rice and cashmere are commodities centralto the livelihood of a large proportion of poorhouseholds in the countries studied, but betweenthe countries there are differences in the prospectsfor income gains from improvements in the supplychain. These different prospects stem largely fromdifferences in the nature of the commodities—which affect the prospects for growth in the inter-
Trade in Sectors Important to the Poor: Rice in Cambodia and Vietnam and Cashmere in Mongolia 167

national market, for gains from upgrading quality,and for gains in the relative share of producers, whoare the poorest participants in the value chain.Although cashmere is a luxury good for whichdemand is highly income-elastic, most rice is abasic good where growth in the overall market issluggish and tied to population growth rather thanincome trends. Moreover, few poor householdsengaged in rice production are likely to be able toraise their incomes from producing high-qualityrice; the niche market for high-quality rice is small,and Cambodia and Vietnam have limited potentialfor supplying it. By contrast, for cashmere produc-ers the prospects for income gains from qualityimprovements are sizable and would have wide-spread impacts among all herder households.
Within the value chains for both rice and cash-mere, power rests not with producers but with pro-cessing firms, especially state-owned Gobi in Mon-golia, millers in Cambodia, and the state-ownedtrading company in Vietnam. The share that pro-ducers capture of the final value of the productsdiffers among countries—and so, therefore, do theprospects for raising their incomes through gains inefficiency and strategic alliances in the form ofeither greater horizontal or vertical integration. InVietnam, where farm gate prices are 80 percent ofthe border price for rice and farmers capture asmuch as 82 percent of the profits from the valuechain, there is less scope for gains from eitherimproving efficiency or restructuring the valuechain. In Cambodia, where farm gate prices aresomewhat lower, at 72 percent of the border price,and the farmers’ share of total profits is substan-tially less, at 40 percent, there is considerable scopefor productivity and efficiency gains along thevalue chain and for improvements in farmers’ bar-gaining position. In Mongolia, it is difficult todecompose the value chain, but it is clear thatherders capture only a very small portion of profitsand that they have significant potential for raisingtheir incomes. Finally, all three countries are highlyvulnerable to external shocks, and coping with riskis a major concern for households engaged in bothrice and cashmere production.
Endnotes
1. Early on, Fischer and Gelb (1991) flagged the role of insti-tutional reforms in the transition.
2. For a brief history of rice cultivation in the two countries,see the technical appendix to this chapter at www.worldbank.org/eaptrade.
3. All dollar amounts are current U.S. dollars.4. All appendix tables cited in this chapter can be found at
www.worldbank.org/eaptrade.5. As shown in the technical appendix to this chapter at
www.worldbank.org/eaptrade.6. Domestic resource cost (DRC) is an indicator of compara-
tive advantage. It measures the ratio of value added fromdomestic, nontraded activities to the foreign exchangeearned or saved from domestic production. A DRC of lessthan 1.00 suggests comparative advantage and efficiency inproduction.
7. Quotas have been lifted, export taxes are zero, import tariffsare low in Cambodia (7 percent) and, even though tariffsare relatively high in Vietnam (at 30 percent), they are notbinding.
8. The background papers for this chapter contain a detailedanalysis of the constraints for each actor along the chain(see ACI 2000a, 2000b). Based on these papers, a moreextensive analysis of the specific constraints and policy rec-ommendations related to each link of the value chain isdetailed in Appendix Tables 5–12 at www.worldbank.org/eaptrade.
9. These losses, which occur at different stages after harvest,and are the result of moisture, pests, rodents, outdatedmilling technology, and pilferage. Losses at the village levelcan be substantial, from 5 to 20 percent of production.
10. Details of these options are described in the technicalappendix to this chapter at www.worldbank.org/eaptrade
11. This breakdown may not be an appropriate metric forcross-country comparisons of the efficiencies of agents(such as farmers), because farmers in some countries maytake on more functions (e.g., postharvest storage) than theydo in other countries. In Vietnam and Cambodia, however,the comparison would appear to be appropriate.
12. In Cambodia, these two groups together get about 80 per-cent of the profits, whereas in Vietnam they get about 90percent of the profit (see Figure 9.1).
13. These figures considerably understate the importance ofthe industry to the Mongolian economy. It is estimated thatabout 45 percent of the raw cashmere produced in 2000—worth about $50 million—was smuggled to China. Thisestimate is derived from deducting official exports andsales to domestic processors from total known production.
14. 2001 Household Income and Expenditure Survey, Mongo-lian National Statistics Office.
15. The collapse of the Soviet Union ushered in a difficultperiod of transition for Mongolia. The Mongolian econ-omy imploded, and real GDP declined by 20 percentbetween 1989 and 1993. The one bright spot was theexpansion in agriculture and herding, fueled by wholesaleprivatization of the livestock sector in 1991. The privatiza-tion of livestock using the voucher system was largely equi-table and successfully put assets in the hands of poorhouseholds. Every Mongolian citizen received vouchersworth 10,000 tugriks (roughly $10) for the purchase ofstate assets, particularly livestock and small businesses, butonly members of state-owned cooperatives (about 40 per-cent of the population) could use vouchers to purchaselivestock. The voucher distribution system was not eco-nomically optimal, because it created incentives for pro-duction but encouraged suboptimal herd sizes. Over time,
168 East Asia Integrates

concentration was aimed at yielding an economically sus-tainable herd size, but this process was interrupted in 1999by external shocks.
16. Trends in the global cashmere market are outlined in thetechnical appendix to this chapter at www.worldbank.org/eaptrade.
17. Private ownership is prohibited under Mongolia’s constitu-tion and its 2002 land laws. Traditionally, private herds haveused public lands, with herders having rights to certain areasat certain times of the year. Mobility and knowledge areessential if the pastures are not to suffer from overgrazing.
18. Mongolia already has a specific tax on livestock, but thelevel of the tax would have to be reassessed to determinewhether it is sufficient to capture the social costs associatedwith land degradation. Local administrators already havedetailed records of stock ownership by herder that enablethe tax to be administered efficiently.
19. The winters of 2000 and 2001 were particularly harsh, anddrove down the stock of goats by more than 700,000 ani-mals. Rising prices cushioned the impact of declining pro-duction and export volumes, but more than 19,000herders—about 8 percent of the households with live-stock—lost all of their animals.
20. They were insured by Mongol Daatgal, a state-ownedinsurance company.
21. For example, the livestock insurance program under theSustainable Livelihoods Project supported by the WorldBank is a public-private initiative aimed at developing arisk index that private insurance companies would use inoffering insurance to livestock owners to cover risks arisingfrom drought or other weather-related events. Details ofthis scheme are in the technical appendix to this chapter atwww.worldbank.org/eaptrade.
22. Gobi remains in state hands, despite having been slated forprivatization for some time.
23. A new household survey, including a special module oncashmere production, is currently under way and will yielduseful information to enable a more quantitative estima-tion of both net impacts and distributional changes.
References
ACI (Agrifood Consulting International). 2002a. “Rice ValueChain Study: Cambodia.” Report Prepared for the WorldBank. Phnom Penh, September.
————-. 2002b. “Rice Value Chain Study: Vietnam.” ReportPrepared for the World Bank. Ha Noi, September.
ANZDEC. 2000. ”Agricultural Sector Program, InceptionReport.” ADB TA 3223-VIE. March.
Boeva, Bistra. 2002. “Governance in the Transition Economies:Current Issues in Bulgaria.” Center for International PrivateEnterprise, Washington, D.C.
Braguinsky, Serguey, and Grigory Yavlinsky. 2000. Incentives andInstitutions: The Transition to a Market Economy in Russia.Princeton, N.J.: Princeton University Press.
Dolan, C., and others. 1998. “Horticulture Commodity Chains:The Impact of the UK Market on the African Fresh VegetableIndustry.” IDS Working Paper 96. Institute for DevelopmentStudies, University of Sussex.
Fischer, Stanley, and Alan Gelb. 1991. “The Process of SocialistEconomic Transformation.” Journal of Economic Perspectives5 (4): 91–106.
Goletti, F., A. Bhatta, and C. Srey. 2002. “Farmer Survey: Tabula-tion of Results.” Discussion Paper No. 5. Agricultural SectorDevelopment Program, ADB TA 3695-CAM. Phnom Penh,October.
Havrylyshyn, Oleh, and Ron van Rooden. 2003. “InstitutionsMatter in Transition, But So Do Policies.” Comparative Eco-nomic Studies 45 (1): 2–24.
Hayami, Yujiro, and Toshihiko Kawagoe. 1993. The AgrarianOrigins of Commerce and Industry. New York: St. Martin’sPress.
Kaplinsky, R. 1999. “Globalisation and Unequalization: WhatCan Be Learned from Value Chain Analysis.” Journal ofDevelopment Studies 30 (2): 117–46.
Minot, N., and F. Goletti. 1998. “Export Liberalization andHousehold Welfare: The Case of Rice in Vietnam.” AmericanJournal of Agricultural Economics 80 (4): 738–49.
North, Douglass C. 1991. “Institutions.” Journal of Economic Per-spective 5 (1): 97–112.
OPCV (Overseas Projects Corporation of Victoria). 2002. “Agri-cultural Sector Performance Review.” Final Report submit-ted to Asian Development Bank. TA 3695-CAM. Manila.
Porter, M. E. 1990. The Competitive Advantage of Nations. NewYork: Free Press.
Reardon, Thomas, C. Peter Timmer, Christopher B. Barrett, andJulio Berdegue. 2003. “The Rise of Supermarkets in Africa,Asia and Latin America.” American Journal of AgriculturalEconomics (December).
Royal Government of Cambodia. 1999. Cambodia Socioeco-nomic Survey 1999. National Institute of Statistics, Ministryof Planning.
———. 2001. Statistical Yearbook 2001. National Institute ofStatistics, Ministry of Planning.
Sachs, Jeffrey, Clifford Zinnes, and Yair Eilat. 2000. “The Gainsfrom Privatization in Transition Economies: Is ‘Change ofOwnership’ Enough?” CAER Project II, Harvard Institute forInternational Development.
Smallbone, David, and Friederike Welter. 2003. “InstitutionalDevelopment and Entrepreneurship in TransitionEconomies.” Paper presented at ICSB 48th World Confer-ence—Advancing Entrepreneurship and Small Business,Belfast, June 15–18.
Socialist Republic of Vietnam. 1998. Vietnam Living StandardSurvey 1998. Government Statistics Office.
UNCTAD (UN Conference on Trade and Development). 2000.“Strategies for Diversification and Adding Value to FoodExports: A Value Chain Perspective.” UNCTAD/DITC/COM/TM/1. Geneva.
USDA-ERS (United States Department of Agriculture, Eco-nomic Research Service). 2002. “Rice Outlook.” Report RCS-0802. Washington, D.C.
Weatherspoon, Dave D., and Thomas Reardon. 2003. “The Riseof Supermarkets in Africa: Implications for Agrifood Sys-tems and the Rural Poor.” Development Policy Review 21 (5):333–55.
World Bank. World Development Report 1996: From Plan to Mar-ket. New York: Oxford University Press, 1996.
———. 2001. “Mongolia Participatory Living Standards Assess-ment.” Washington, D.C.
———. 2003. “From Goats to Coats: Institutional Reforms inthe Mongolian Cashmere Sector.” Washington, D.C.
Trade in Sectors Important to the Poor: Rice in Cambodia and Vietnam and Cashmere in Mongolia 169


The links between openness to international tradeand economic growth have been the subject ofmany research papers. Although somewhat contro-versial, evidence suggests that openness to interna-tional trade tends to raise national income (Frankeland Romer 1999; Irvin and Tervio 2002).1 Morecontroversial are debates about the distribution ofthe benefits from higher economic growth—bothacross countries and within countries. Proponentsof integration posit that for a small, labor-abun-dant economy, opening up to trade leads to risingwages and greater stability. They point to the sub-stantial increases in average real wages in opendeveloping countries over the last several decadesas evidence that international trade does indeedincrease demand for the abundant factor—labor inmost developing countries—much like trade the-ory predicts. They also argue that trade benefits thepoor at least as much as the average household, andthat opening a small economy permits access tomore stable international markets and thus greateropportunities for hedging and insurance.
171
10
Trade and Labor MarketVulnerability in
Indonesia, Republic ofKorea, and Thailand
François BourguignonChor-ching Goh
Opponents of integration, by contrast, see grow-ing inequality between and within nations whereproponents see average gains in welfare. They speakabout the uneven distribution of gains from open-ness to trade and the increased uncertainty and vul-nerability associated with being more exposed tothe vagaries of international markets and more sus-ceptible to shocks that can be transmitted rapidlyacross countries and regions as evidenced duringthe 1997–98 East Asian financial crisis.
Recent empirical work analyzing the determi-nants of distributional changes over time showsthat indeed some evidence (from Latin America aswell as some Asian countries) suggests that greaterintegration may be generating higher returns toskills, which, when coupled with unequal access toeducation, is leading to growing wage inequality insome liberalizing economies. Other papers alsolend support to the hypothesis that macroeco-nomic shocks have become more frequent intoday’s more integrated international markets, eventhough their severity and duration may be less
We would like to thank the following people for their contributions to this chapter: Tamar M. Atinc, Mun S. Ho, Caro-line Hoxby, Lawrence Katz, William Maloney, and Martin Rama for valuable suggestions and ideas when we embarkedon this work; Vivi Alatas (Indonesia) and Dae Il Kim (Korea) for excellent analysis; and Anant Chiarawongse and BinhNguyen for data assistance. We are also grateful for comments from participants in the seminars held at the WorldBank’s Tokyo Resident Mission; the Institute of Southeast Asia Studies in Singapore; the Thailand Development ResearchInstitute; the Fourth Asian Development Forum in Seoul; and the World Bank’s Jakarta office. All errors remain ours.

because governments are better equipped torespond to them than in the past. But little empiri-cal work has been done to test whether a greaterpropensity to experience shocks at the macro leveltranslates into more vulnerability at the level ofindividual workers.
It is indeed possible that many of the concernsexpressed by the opponents of integration reflectanxiety about the future prospects for employmentand wages even if the evidence points to an increasein average returns to labor. For East Asian countriesthat are closely integrated into world markets, andbecoming more so, an examination of whether thisconcern indeed rests on solid ground should havecrucial implications in three policy areas: trade,labor markets, and social safety nets.
Within the large literature on wage inequality andwage differentials in relation to trade liberalization,only a handful of studies—mostly on Latin Ameri-can economies, perhaps because macroeconomicvolatility appears to be structurally higher there—examine trade, volatility, and insecurity in the labormarket, most of them taking changes in employ-ment as the indicator of vulnerability. The literaturesuggests that trade liberalization has only a smallimpact on aggregate employment. Papageorgiou,Choksi, and Michaely (1990) found that, by andlarge, trade liberalization did not significantly raiseunemployment in the 19 countries they examined.Revenga (1994) discovered that Mexico’s tradereform of 1985–88 reduced employment modestly,but did not reduce wages. Cox and Edwards (1996)found that Chile’s trade liberalization of the 1970saffected workers’ duration of unemployment, butthat its effect was small relative to those of other vari-ables, and declined over time. Currie and Harrison(1997) discovered that during trade liberalizationbetween 1984 and 1990 in Morocco, changes inimport tariffs and quota coverage had no impact onaggregate employment. Using rotating panel house-hold surveys, Arango and Maloney (2002) saw someevidence of a higher incidence of involuntary sepa-ration, mostly among skilled workers, in sectors thatare opening to trade in Mexico and Argentina, butthe impact is transitory.
One concern has been that trade liberalizationmay make the demand for labor more elastic. Issuesof worker insecurity and economic openness inLatin America are summarized in De Ferranti andothers (2000), who found that wage volatility is
affected more by inflation than by openness, andthat in Argentina, Bolivia, Brazil, Chile, and Peruwages became more stable in the 1990s. Althoughjob turnover rates increased and informal sectoremployment rose, unemployment was stable overthe period 1970–90, and there was no evidence of ahigher probability of unemployment or of longerunemployment spells. Fajnzylber and Maloney(2000) found no evidence in Chile, Colombia, andMexico that trade liberalization has increasedworkers’ insecurity.
This chapter is a first attempt to investigate thetopic in an East Asian context. The analysis wasapplied to three East Asian countries: Indonesia,Republic of Korea, and Thailand. We sought todetermine whether workers’ earnings and workinghours have fluctuated more as countries have liber-alized their trade regimes. Because no data wereavailable for testing that hypothesis directly, atwofold approach was followed. First, we askedwhether output and average wages become morevolatile as the economies become more open. Sec-ond, we looked for signs that workers in sectors andindustries highly exposed to world markets aremore vulnerable to falling into poverty than thosein sectors less exposed.
We begin here by describing the evolution ofgrowth and volatility of output and wages as theeconomies became more open. Then, in the firststage of the analysis, we examine the dynamics ofearnings and employment across sectors andindustries with different degrees of exposure totrade and thus external shocks over time. Enteringthe second stage of the analysis, we explore moreformally the relationship between trade intensityand workers’ vulnerability to falling into poverty.Because our findings for all three countries yieldedsimilar conclusions, for the sake of brevity we pre-sent only selected examples in this chapter.2
Overview of Trade Liberalizationand Labor Market Volatility
This chapter examines the relationship betweentrade liberalization and vulnerability by comparingtwo time periods in each country under study: onein which the economy was more closed and one inwhich it was more open. The periods covered in thethree countries differ, depending on data availabil-ity. For Indonesia and Thailand, we used labor force
172 East Asia Integrates

surveys, and for Korea, we used both the establish-ment surveys (known as occupation wage surveys)and labor force surveys. The labor force data cover1991–2000 for Thailand, 1986–2001 for Indonesia,and 1976 and 1981–2000 for Korea.
We also compared workers’ experiences accord-ing to the sectors and industry groups in whichthey work, because these sectors and groups havedifferent degrees of exposure to world markets. Foreach country, sector definitions are governed by thesource data. Agriculture, fishery, and forestry wereexcluded from the tradable sector because of dataconstraints.3
Korea has three broad sectors—manufacturing;construction and social services; and “others,”which include public utilities, wholesale and retailtrades, transport, communications, and financialservices.4 In Indonesia, industry classification isrestricted to a few categories, and so it has only twosectors: manufacturing and nontradables. Non-tradables include all nonmanufacturing and non-primary industries.5 Within the manufacturing sec-tors of Thailand and Korea, we define groups ofindustries that have differing degrees of exposure totrade, determined by the share of trading volume(exports and imports) in their output.6
The main question explored in this section iswhether changes in trade regimes in the threeeconomies under study were accompanied bychanges in the volatility of various aggregate outputand labor market indicators. But, first, were thethree economies indeed more open in the 1990sthan in the 1980s, as commonly believed? Toanswer this question, we begin by determining
whether the usual structural measures such as tariffrates, nontariff barriers, and tariff revenue conformto this view.
Measures of Trade Liberalization
All the economies examined in this study werealready open in the early 1970s (see, for example,Sachs and Warner 1995), but they have becomemore open since then. Table 10.1 shows the averageimport tariffs in manufacturing during the 1980sand 1990s and their rates of reduction from onedecade to the next. In manufacturing, the averagetariff dropped by 26 percent in Indonesia, by 42percent in Korea, and by 8 percent in Thailand. Inthe category of duty called the most-favored-nationstatus rate, the reductions were even bigger.
As for the import tariffs faced by specific indus-try groups, Figure 10.1 shows the average importtariff rates in 11 industry groups within manufac-turing. In all three countries, tariffs decreasednoticeably in all these industries, with a few excep-tions, from the 1980s to the 1990s.
Core nontariff barrier measures followed thesame evolution (Table 10.2). They fell between1989–94 and 1995–98 in all three countries, moreor less at the same rate as tariffs. Changes in indi-vidual measures such as licensing, variable levies,and minimum pricing also generally suggest thatthese economies have become more open in practi-cally all dimensions.
That the preceding measures have been effectiveis confirmed by the evolution of import tax rev-enue. In all three countries in the 1980s and the
Trade and Labor Market Vulnerability in Indonesia, Republic of Korea, and Thailand 173
TABLE 10.1 Average Import Tariffs (Applied Duty Rates) and Percentage Change in Tariffsof Indonesia, Republic of Korea, and Thailand between 1980s and 1990s
Manufacturing Indonesia Korea Thailand
Average tariff (applied duty rate)during 1980s 24.23 18.74 39.04
Average tariff (applied duty rate) during 1990s 17.97 10.96 36.06
Percentage reduction (applied duty rate) 25.84 41.50 7.64Percentage reduction(most-favored-nation status rate) 45.65 46.31 22.46
Source: Simple averages from United Nations Conference on Trade and Development (UNCTAD).

1990s, these revenues fell as a proportion of totaltrading value as well as of total government revenue(Table 10.3), suggesting that these economiesbecame effectively less protected. Korea’s importtax revenue fell from about 16 percent of total rev-
enue to about 8 percent. In Thailand, import rev-enue also fell substantially in terms of both totalrevenue and total import value. This downwardtrend is much less pronounced for Indonesia, butthat country’s trade liberalization also proceeded
174 East Asia Integrates
70
80
90
60
50
40
30
20
10
0
1980s1990s
Food
, bev
erag
e, a
nd t
obac
co
Text
iles
and
app
arel
Woo
d an
d fu
rnitu
re
Pap
er
Che
mic
als
Petr
oleu
m
Rubb
er a
nd p
last
ics
Prim
ary
met
als
Fabr
icat
ed m
etal
s
Mac
hine
ry a
nd e
qui
pm
ent
Oth
er m
anuf
actu
res
Thailand
70
80
90
60
50
40
30
20
10
0
1980s1990s
Food
, bev
erag
e, a
nd t
obac
co
Text
iles
and
app
arel
Woo
d an
d fu
rnitu
re
Pap
er
Che
mic
als
Petr
oleu
m
Rubb
er a
nd p
last
ics
Prim
ary
met
als
Fabr
icat
ed m
etal
s
Mac
hine
ry a
nd e
qui
pm
ent
Oth
er m
anuf
actu
res
Korea
70
80
90
60
50
40
30
20
10
0
1980s1990s
Food
, bev
erag
e, a
nd t
obac
co
Text
iles
and
app
arel
Woo
d an
d fu
rnitu
re
Pap
er
Che
mic
als
Petr
oleu
m
Rubb
er a
nd p
last
ics
Prim
ary
met
als
Fabr
icat
ed m
etal
s
Mac
hine
ry a
nd e
qui
pm
ent
Oth
er m
anuf
actu
res
Indonesia
FIGURE 10.1 Decade Averages of Import Tariffs for Manufacturing Industries: Indonesia, Republic of Korea, and Thailand, 1980s and 1990s
Source: United Nations Conference on Trade and Development (UNCTAD).

on the export side, with export duties as a propor-tion of total tax revenue falling by more than half.
Volatility of Some Aggregate Indicators
Did this increased openness make these economiesmore vulnerable to international shocks, withgreater fluctuations in the growth of output andwages? The evolution of the observed volatility inthe growth of the gross domestic product (GDP),manufacturing value added, and wages gives a firstrough answer. Table 10.4 shows the volatility ofGDP growth rates by decade, as measured by thecoefficient of variation.7 According to the table, the1990s—the decade of greatest openness (up to andexcluding the financial crisis of 1997–98)—was notonly less volatile than the 1980s, but in fact the leastvolatile of the last three decades. The same conclu-sion holds when considering only the manufactur-ing sector, which appears to be generally morevolatile than the overall economy.
If there are short-term adverse shocks, they arelikely to be transmitted into fluctuations of earn-ings and employment. Unemployment rates havebeen stable and uniformly low in all theseeconomies as they have become more open, and forKorea and Thailand, where sectoral unemploymentrates are available, there are no significant differ-ences among industries of varied intensity in trade.
Less unemployment volatility could have beenachieved at the expense of more variability inwages. However, in general, the year-to-year fluctu-ation of wages was much less in the more open1990s than it was in the previous decade. Moreover,we found no evidence that volatility of wages wasgreater in more trade-intensive industries. InKorea, for example, wages were significantly lessvolatile in the later, supposedly more open periodthan in the earlier period, whereas industries withhigh trade exposure experienced less volatility inthe later period and roughly the same volatility asother sectors in the first period (Table 10.5).
Trade and Labor Market Vulnerability in Indonesia, Republic of Korea, and Thailand 175
TABLE 10.2 Core Nontariff Barrier Measures: Indonesia, Republic of Korea, and Thailand,1989–99
Core nontariff barrier measures
Country 1989–94 1995–99
Indonesia 53.6 31.3Korea 50.5 25.0Thailand 36.5 17.5
Note: Table shows the percentage of items with various types of nontariff barrier measures among all StandardInternational Trade Classification (SITC) or harmonized system (HS) two-digit products. Core nontariff barriermeasures are licensing, prohibition, quotas, and administered pricing. Nonauto licensing includes various formsof administrative approvals.Source: Michalopoulos (1999).
TABLE 10.3 Decade Average Shares of Import Tax Revenue in Total Government Revenueand Total Trading: Indonesia, Republic of Korea, and Thailand, 1980–2000
Import duties as Import duties as percentage of total percentage of
Country Decade import value government revenue
Indonesia 1980s 4.6 4.71990s 3.7 4.5
Korea 1980s 8.3 16.31990s 5.1 8.3
Thailand 1980s 12.2 21.11990s 7.6 16.4
Source: Trade Analysis and Information System of United Nations Conference on Trade and Development (UNCTAD).

But the preceding aggregate evidence must beinterpreted with caution. First, because volatility isevaluated for only a small number of years in eachsubperiod, the results may be strongly influencedby single observations. In particular, the economicshocks of the 1980s may be responsible for thehigher volatility observed during that period,which therefore may not be fully comparable to the1990s, when the crisis that occurred late in thatdecade is ignored. Second, although volatility ispractically constant at the aggregate or even at theindustry level, it may have increased at the individ-ual level. The stability of aggregate employment
levels or average wage rates may actually hide anincreased turnover rate among employees andhigher variance in their earnings over time.
Any study of workers’ vulnerability to shocksrequires panel data that follow individual workersover time. Unfortunately, the only panel data avail-able were for Korea, and for too short a period to bereally useful.8 For the first stage of our approach, weused synthetic panels, which were created by follow-ing cohorts of randomly selected individual workersover time in successive cross-sectional surveys.Cohort cells in this synthetic panel were defined byworkers’ year of birth, gender, and educational
176 East Asia Integrates
TABLE 10.4 Volatility of Annual Growth Rates in GDP and Value Added in Manufacturing,Measured by Coefficient of Variation: Indonesia, Republic of Korea, and Thailand, 1970–96
Coefficient of variation of annual growth rates in
GDP Manufacturing (value added)
Indonesia1970–1979 0.16 0.341980–1989 0.40 0.551990–1996 0.10 0.10
Korea1970–1979 0.26 0.311980–1989 0.52 0.641990–1996 0.22 0.30
Thailand1970–1979 0.39 0.351980–1989 0.43 0.751990–1996 0.19 0.26
Sources: Bank of Thailand, Bank of Korea, and Bank of Indonesia.
TABLE 10.5 Level and Fluctuation of Wage Growth Rates (Males) by Trade ExposureGroups: Republic of Korea, 1976–1997
Low Medium High exposure exposure exposure
Annual growth rate 1976–1987 0.022 0.020 0.0181988–1997 0.064 0.066 0.076
Standard deviation of growth rates 1976–1987 0.077 0.071 0.0681988–1997 0.038 0.054 0.038
Note: Low trade exposure industries: food and beverage, paper, petroleum, and rubber and plastics. Mediumtrade exposure industries: wood, chemical, and iron and steel. High trade exposure industries: textile andapparel, fabricated metal, machinery, and others not elsewhere classified.Source: Wage Structure Survey (formerly the Occupational Wage Survey).

attainment. Because the resulting samples are smallfor some countries, it was sometimes necessary touse a more aggregate definition of cohorts.9
For the second stage of the analysis, we recov-ered information on the dynamics of individualearnings from the observation of the time patternsof the mean and the variance of earnings in cohortcells. We then used that information to simulate thelikely vulnerability of workers to poverty under aset of simplifying assumptions.
Trends in Earnings and Employment in Synthetic Panels
In Korea and Indonesia, where longer time-seriesdata are available, average real wages have been ris-ing steadily since the early 1980s, except for a mod-est drop in Korea and a sharper decline in Indone-sia associated with the 1997–98 financial crisis. InThailand, average real wages stayed quite constantbetween 1991 and 2001.
Figure 10.2 shows that for Korea (1976–2000)this evolution is the same for a specific cohort andthat trends do not differ between broad sectors oracross industries of varying trade intensity. Thesame consistency is observed for other cohorts andfor Thailand (1991–2001) in Figure 10.3 andIndonesia (1986–1999) in Figure 10.4.
This similarity suggests that labor markets in thethree countries are quite integrated, with no evi-dence of segmentation between tradable and non-tradable sectors or among industries with different
degrees of exposure to trade. In a flexible labormarket where workers are mobile, a shock thatoriginates in the tradable sector will be transmittedto other sectors. For Korea, where the time seriesare longer, there is no noticeable change in trendwhen the economy experiences greater openness intrade. There is also no sign of greater variability ingrowth rates.
It is quite possible that the steady and paralleltrends in a cohort’s mean wage hide a variability inindividual earnings that increases over time or isvery different across sectors. A simple way to checkthis possibility is to examine whether the varianceof individual earnings changes very much overtime or differs markedly across sectors. If so, such achange or difference could correspond to someincrease in the variance of transitory earnings,thereby reflecting increased instability at the indi-vidual level.10
The variance of (log) wages within cohort cellsin the three countries does not show any risingtrend, and patterns are similar across the tradableand nontradable sectors as well as across the indus-try groups with varying degrees of trade exposure.An example is given in Figure 10.5, which shows forKorea the evolution of the variance of (log) earn-ings in a male cohort (born in 1950, attained a sec-ondary education) between 1976 and 2000.
This result in Figure 10.5 appears to contradictthe finding in the pioneering work by Deaton andPaxson (1994). In an analogous cohort analysis inthe United States, the United Kingdom, and Taiwan
Trade and Labor Market Vulnerability in Indonesia, Republic of Korea, and Thailand 177
Manufacturing Services and Construction
Others
Males, 38 years old in 1990, primary education
1980 1985 1990 1995 200012.5
13.0
13.5
14.0
14.5
12.5
13.0
13.5
14.0
14.5
1980 1985 1990 1995 2000
Low Medium High Exposure
FIGURE 10.2 Average Log of Real Wages of Males by Broad Sectors (Manufacturing, Services and Construction, and Others) and by Trade Exposure (Low, Medium, and High):Republic of Korea, 1976–2000
Source: Wage Structure Survey (formerly the Occupational Wage Survey).

(China), these authors found that the variance ofthe log of household consumption, income, andearnings tended to increase with the age of thehousehold head.
The discrepancy between the present result forKorea and their results for Taiwan, two very similareconomies, might be more apparent than real,however. First, Deaton and Paxson also found that
the variance of (log) earnings was extremely stablein Taiwan between ages 20 and 50 (and then dou-bled between ages 50 and 65)—which is in full con-formity with our results. Second, our results forKorea refer to active wage workers, whereas Deatonand Paxson’s data for Taiwan include changes inparticipation and in wage work status. Finally, it isalso possible that a slightly increasing trend in
178 East Asia Integrates
Males, 35–39 years old in 1991, primary education
7.0
7.5
8.0
8.5
9.0
9.5
10.0
7.0
7.5
8.0
8.5
9.0
9.5
10.0
1991 1992 1993 1994 1995 1996 1997 1998 1999 2000 1991 1992 1993 1994 1995 1996 1997 1998 1999 2000
Average log of real wages Average log of real wages
Manufacturing Services Low Medium High
FIGURE 10.3 Average Log of Real Wages of Males by Broad Sectors (Manufacturing andServices) and by Trade Exposure (Low, Medium, and High): Thailand, 1991–2000
Source: Thailand Labor Force Surveys.
Males, 35–39 years old in 1986, primary or less education
7.8
6.8
5.8
1986 1987 1988 1989
Manufacturing Services
1990 1991 1992 1993 1994 1995 1996 1997 1998 1999
Average log of real wages
FIGURE 10.4 Average Log of Real Wages of Males by Broad Sectors (Manufacturing andServices): Indonesia, 1986–1999
Source: Indonesia Labor Force Surveys (SAKERNAS).

inequality might be observed in the Korean data ifcohorts with different educational levels were takentogether, as in Deaton and Paxson.
Changes in labor market conditions possiblyassociated with more openness might have affectedemployment or working hours rather than earningrates. But Figures 10.6 and 10.7 suggest this is not thecase. In general, the distribution of employment sta-tus and of sector of employment within cohort cellshows no noticeable change in trend in the 1990s incomparison with the 1980s, except, of course, duringthe 1997–98 financial crisis in East Asia.
For example, for a cohort of Korean males bornfrom 1950 to 1954 who attained a primary educa-tion or less, the rising trend in the share of the non-tradable sector showed no discontinuity until 1998,and the same was true of the declining trend inagriculture and manufacturing (Figure 10.6). Thesetrends may therefore reflect the long-run process ofchange in the economic structure rather than theeffect of a change in the trade regime. Likewise, theunemployment rate remained remarkably constantuntil the 1997–98 crisis. The inactivity rateincreased somewhat a few years before the crisis,
and this increase might be taken as hiding a slightincrease in disguised unemployment, possiblyimputable to the rising openness of the economy.However, the change in the inactivity rate seemstoo modest to be of real concern.
The evolution of average working hours withincohorts leads to the same conclusion: the absenceof an openness effect. Because of data limitations, itwas not possible to compare the 1980s and the1990s in Thailand. For a cohort of educated men,no significant trend appears to be present in the1990s until the 1997–98 financial shock (Figure10.7). The evolution was similar in other cohorts.In most of them, it is true that working hours tendto be longer in trade-exposed manufacturing thanin trade-protected services. But this variation seemsto be true in many countries, and it is more sugges-tive of differences in the conditions of productionthan of differences in trade exposure. Within man-ufacturing, by contrast, work hours do not differaccording to the trade intensity of industries.
In summary, looking at the evolution of labormarket indicators for synthetic cohorts, we foundno evidence of a systematic difference associated
Trade and Labor Market Vulnerability in Indonesia, Republic of Korea, and Thailand 179
Low Exposure High Exposure
1980 1985 1990 1995 2000
0
.2
.4
.6
.8
Males, 40 years old in 1990, secondary education
Medium Exposure
Standard deviation
FIGURE 10.5 Standard Deviation of Log of Real Wages of a Male Cohort in Low, Medium,and High Trade Exposure Industries: Republic of Korea, 1976–2000
Source: Wage Structure Survey (formerly, Occupational Wage Survey).

with the degree of exposure to trade in any of thethree countries studied. No systematic differencein workers’ earnings or employment was foundbetween the tradable and nontradable sectors, oramong manufacturing industry groups according
to trade exposure. And there was no evidence thattrends in earnings or employment changed, or thatworking hours became more unstable aseconomies liberalized their trade policies duringthe 1990s.
180 East Asia Integrates
0
10
20
30
40
50
60
Percent
1985 1986 1987 1988 1989 1990 1991 1992 1993 1994 1995 1996 1997 1998 1999 2000 2001
Unemployed Inactive AgricultureManufacturing Nontradable
Males, born in 1950–54, primary education or less
FIGURE 10.6 Distribution of Employment Status and Employment Sectors of a Male Cohort:Republic of Korea, 1985–2000
Source: Surveys of the Economically Active Population, Korea.
30
35
40
45
50
55
60
1991 1992 1993 1994 1996 1997 1998 1999 2000 2001
Average hours worked per week
Manufacturing Services
Males, born in 1951–55, secondary education or more
FIGURE 10.7 Average Monthly Hours Worked of a Male Cohort in Manufacturing and Services: Thailand, 1991–2000
Source: Thailand Labor Force Surveys.

Indirect Estimation of Changes inWorkers’ Vulnerability to Povertyfrom Cross-Sectional Data
A steady aggregate evolution of earnings andemployment levels for the whole population or forcohorts of individuals may hide changes in the vari-ability of conditions for individual workers. Theshare of employment in manufacturing or servicesmay change steadily over time, but, meanwhile, anincreasing proportion of people may be switchingamong sectors or switching between employmentand inactivity within a cohort. Likewise, averageearnings may go up at a steady pace while individualvariability in earnings is increasing.11
Any attempt to determine whether there arechanges in the variability of individual conditionsin a labor market, and therefore in personal vulner-ability to poverty, would ideally require panel datathat would allow a sample of people to be followedover time. Unfortunately, such data are seldomavailable in developing countries, and Thailand andIndonesia are no exception.12
To estimate the individual variability of earningsand the vulnerability of workers to having theirearnings fall below a poverty threshold, we used anindirect method based on comparing successivecross sections. The idea is as follows: if it can beassumed that all individuals within a cohort face astochastic earning process that has common charac-teristics, then these characteristics can be recoveredat the aggregate level without observing actual earn-ing paths. Observing the evolution of the mean andthe variance of earnings within a cohort is sufficientfor estimating the common characteristics of indi-vidual earning processes. On this basis, simple esti-mates of the probability of a worker observed in yeart falling into poverty in year t + 1 can be obtained.
Now returning to the issue of trade exposure,the problem is one of knowing whether the insecu-rity and uncertainty evaluated with the precedingtechnique changed between less liberal and moreliberal time periods, as well as between industries ofvarying exposure to trade. This comparative esti-mation of vulnerability to poverty was made foreach of the three countries. For all countries, apoverty threshold of 60 percent of the nationalmedian wage was used. Findings for the threecountries were very similar, so only a typical selec-tion is presented here.
A Simple Model
The earnings, wit, at time t of individual i belongingto cohort group j may be represented by
(10.1)
where Xit is a set of characteristics that are not usedin the definition of cohort group j—that is, they arenot from age, gender, and education. In addition, itis assumed that the unobserved residual term ξj
it
follows a first-order autoregressive processAR(1)—that is
(10.2)
This is the simplest time dependency assump-tion that can be made.13
In the absence of panel data, the dynamic equa-tion cannot be estimated directly on individual-level data. However, some indirect estimation ispossible by considering successive observations ofindividuals in the same cohort, even though thoseindividuals are not the same from one period to thenext. Indeed, (10.2) implies that
(10.3)
where σ2ξjt is the variance of the residual term of the
earning equation at time t, and σ2εj is the variance of
the innovation term during the same period in thedynamic equation (10.2). Both variances are evalu-ated for the whole cohort j of individuals observedat time t. The sequence of σ2
ξjt is a time series. Esti-mating a standard autoregressive model on thisseries yields estimates of ρj and σ2
εjt. Of course, acrucial identifying assumption here is that theregression coefficient ρj is constant over time.
If the model is well specified and the time seriesis long enough, then the estimated ρ̂j and σ̂2
εjt
should have the expected signs and orders of mag-nitude. In particular, it should be the case that 0 <ρ̂j < 1 and σ̂2
εjt > 0. However, if well-behaved esti-mates of ρ̂j and σ̂2
εjt (for every t) are not forthcom-ing, then it may be necessary to use alternative esti-mates of ρj lying in the confidence intervalobtained in the original estimation.14 However, thisstep seldom proved necessary.
With estimates of ρj and σ2εjt, it is now possible to
simulate the dynamics of individual earnings,
σ ρ σ σξ ξ εjtj
jt jt2 2
12 2= +−
ξ ρ ξ εitj j
itj
itj= +−1 .
lnw Xitj
itj
tj
itj= +β ξ
Trade and Labor Market Vulnerability in Indonesia, Republic of Korea, and Thailand 181

according to equations 10.1 and 10.2. One beginsby drawing a value ε̂ j
it + 1 in the normal distributionwith mean 0 and variance σ2
εit + 1. Substituting thedraw, ε̂ j
it + 1, into equation 10.2, and combining itwith estimated ρ̂j from equation 10.3 and predictedξ̂ j
it from ordinary least-squares in equation 10.1,yields an estimate ξ̂ j
it + 1. Substituting this value in(10.1) at time t + 1 then gives the (log) earnings foran individual in cohort j at time t + 1, conditionalon the earnings at time t and assuming exogenouschanges in characteristics.
Using the preceding reasoning, one can see thatthe probability for individual i, observed at time t,of receiving e earnings below a survival threshold wat time t + 1, conditional on characteristics andearnings in period t, is given by
(10.4)
where Φ(.) denotes the cumulative density of thestandard normal. But this expression requiresdetermining the characteristics of individual i attime t + 1. Indeed, X j
it is observed, but X jit + 1 is not.
Without a special reason to do otherwise, the sim-plest approach is to assume the same characteristicsin time t and t + 1 except, of course, for age. Such anassumption should be satisfactory if the character-istics in X are truly exogenous.
According to equation 10.4, vulnerability—thatis, the probability of being below the earningpoverty threshold in year t + 1, conditional onearnings in year t—depends on the followingparameters: initial earnings, individual characteris-tics, changes in the returns to these characteristics,the persistence of earning shocks from one periodto the next, and, finally, the variance of theseshocks. As noted earlier, differences in traderegimes did not seem to be associated with differ-ences in overall earning inequality. This findingsuggests either that some of the previous parame-ters, or their distribution within cohorts, remainedmore or less constant over time, or that compensat-ing variations have taken place. In what follows, noattempt is made to isolate the effect of each set ofparameters on the evolution of vulnerability. Yet
the comparison of the evolution of the mean andthe variance of earnings within the typical cohortwith vulnerability as proxied by the preceding tech-nique should be informative.
The definition and estimation of vulnerabilitygiven here do not take into account employmentmobility. Vulnerability is estimated for those indi-viduals in a cohort who are employed in eachperiod, and thus ignores the part of vulnerabilitythat is associated with losing one’s job. As revealedearlier, net flows into unemployment did not seemto have increased because of the change in traderegime in the three countries under analysis. Butgross flows may have become bigger. Not enoughinformation is available to verify this point.
Also, in comparing the vulnerability of workersin sectors with different degrees of exposure totrade, it is tempting to apply the preceding tech-nique in equation 10.4 to cohorts of individualsemployed in the same sector. But then the same pro-viso applies. The resulting proxy for vulnerability isvalid insofar as intersectoral movements did notchange substantially during the period under study.Again, the analysis just described suggests that theydid not, in net terms, but this finding is not neces-sarily inconsistent with increased vulnerability topoverty through forced mobility. Under these con-ditions, our findings must be interpreted cautiously.
Findings
Reasonable estimates of the parameters of themodel were obtained for all three countries. In par-ticular, estimated persistence coefficients, ρ, inequation 10.2 range from zero to one, and generallysignificantly so, suggesting that earning shocks inthe current period are actually transmitted to con-secutive periods, but that the effect of the shockswill eventually fade out.15 For example, Table 10.6presents the estimates of ρ2 for Indonesia (note thatcohorts are pooled to estimate ρ2). The estimated ρ2
ranges from 0.06 to 0.45. All of these ρ2 are statisti-cally significantly greater than zero—the smallest t-statistic being 3.5—and less than one. An exceptionis female workers with secondary education work-ing in the nontradable sector for whom ρ2 is not sig-nificantly different from zero because of the limitednumber of observations within these cohorts. Fig-ure 10.8 presents the estimated ρ for every birthcohort of workers in Korea. The estimates of ρj
182 East Asia Integrates
ˆ Pr( | , , )
log( ) ˆ ˆ log( ) ˆ
v w w X X w
w X w X
itj
itj
itj
itj
itj
itj
tj j
itj
itj
tj
jt
+ + + +
+ +
+
= <
=− − −[ ]
1 1 1 1
1 1
12
Φβ ρ β
σε

range from 0.3 to 0.9 in most cohorts and the aver-age is 0.74 for men and 0.59 for women.16
In Korea, a worker’s risk of falling into povertydiffered rather little among the three sectors, andthese differences narrowed over time. Differencesamong manufacturing industries with differentdegrees of trade exposure narrowed, too, as vulner-ability decreased. Remarkably, the drop in vulnera-bility was the most pronounced for the manufac-turing sector, which has the highest exposure totrade (Figure 10.9). In the Korean manufacturingsector, vulnerability to relative poverty decreaseduntil 1998 and increased again somewhat after-ward. Vulnerability may have increased slightly inservices and construction a little before the1997–98 financial crisis, but it remained stable inthe other sectors. It must be stressed, however, that
the extent of vulnerability was extremely limited—with an overall average of 3 percent—reflecting thevery low inequality of individual earnings in Korea.
Overall growth in Korea and in the other twocountries between the early 1980s and 1998 wassuch that the strongly decreasing trend in absolutepoverty hides any variation that might be the resultof more trade exposure.
In all three countries, not surprisingly, vulnera-bility tended to differ widely according to genderand educational attainment. As reflected in Figure10.10 for Thailand and Table 10.7 for Indonesia, theexpected earnings of women and people with littleeducation were much below national averages. Thevulnerability of less educated workers to povertymay be considerable, reaching 20 percent for maleworkers in Indonesia.
Trade and Labor Market Vulnerability in Indonesia, Republic of Korea, and Thailand 183
TABLE 10.6 Estimated ρρ2 Correlation of Variance of Residual Earnings by Education, Gender, and Sector: Indonesia
Manufacturing Nontradable
Education Male Female Male Female
Primary or less 0.3548 0.3746 0.4583 0.4098Secondary 0.3547 0.3549 0.1841 0.0617Tertiary 0.4124 — 0.2165 —
Notes: For female workers, tertiary education falls within secondary education because there are not enoughobservations for those with tertiary education to treat them separately.Source: Alatas (2002).
0
Men Women
1929
1931
1933
1935
1937
1939
1941
1943
1945
1947
1949
1951
1953
1955
1957
1959
1961
1963
1965
1967
1969
0.10.2
0.30.40.5
0.6
0.7
0.8
0.91
FIGURE 10.8 Estimated ρρ by Birth Year Cohort: Republic of Korea, 1929–69
Source: Wage Structure Survey (formerly the Occupational Wage Survey).
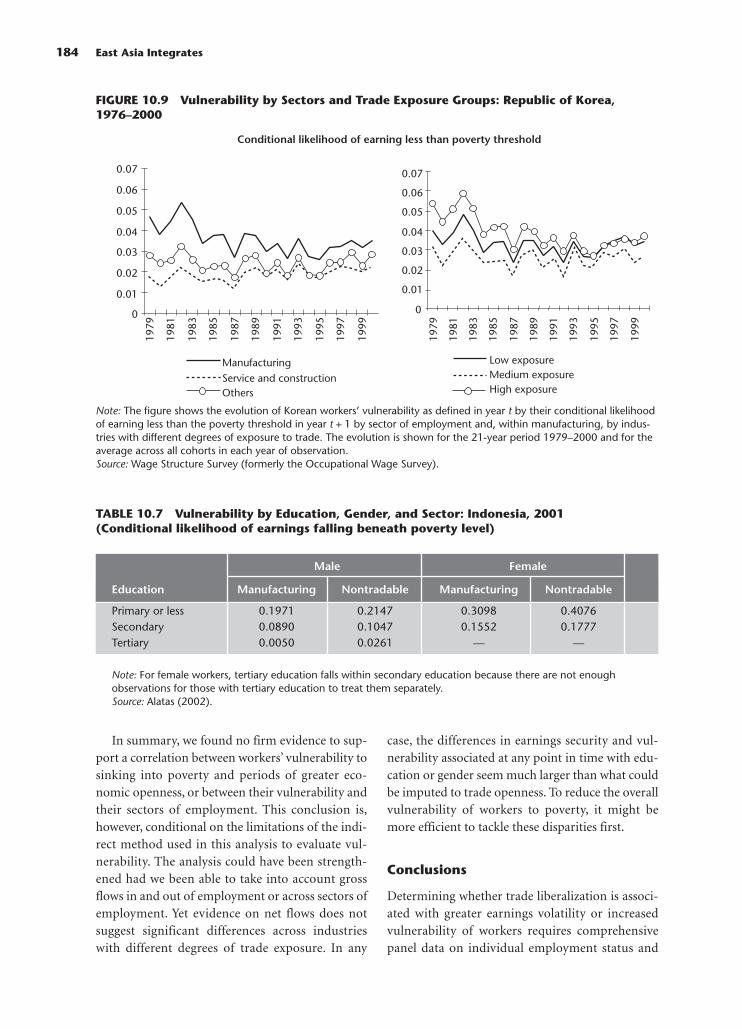
In summary, we found no firm evidence to sup-port a correlation between workers’ vulnerability tosinking into poverty and periods of greater eco-nomic openness, or between their vulnerability andtheir sectors of employment. This conclusion is,however, conditional on the limitations of the indi-rect method used in this analysis to evaluate vul-nerability. The analysis could have been strength-ened had we been able to take into account grossflows in and out of employment or across sectors ofemployment. Yet evidence on net flows does notsuggest significant differences across industrieswith different degrees of trade exposure. In any
case, the differences in earnings security and vul-nerability associated at any point in time with edu-cation or gender seem much larger than what couldbe imputed to trade openness. To reduce the overallvulnerability of workers to poverty, it might bemore efficient to tackle these disparities first.
Conclusions
Determining whether trade liberalization is associ-ated with greater earnings volatility or increasedvulnerability of workers requires comprehensivepanel data on individual employment status and
184 East Asia Integrates
0
0.01
0.02
0.03
0.04
0.05
0.06
0.07
1979
1981
1983
1985
1987
1989
1991
1993
1995
1997
1999
Low exposureMedium exposureHigh exposure
0
0.01
0.02
0.03
0.04
0.05
0.06
0.07
1979
1981
1983
1985
1987
1989
1991
1993
1995
1997
1999
ManufacturingService and constructionOthers
Conditional likelihood of earning less than poverty threshold
FIGURE 10.9 Vulnerability by Sectors and Trade Exposure Groups: Republic of Korea,1976–2000
Note: The figure shows the evolution of Korean workers’ vulnerability as defined in year t by their conditional likelihoodof earning less than the poverty threshold in year t + 1 by sector of employment and, within manufacturing, by indus-tries with different degrees of exposure to trade. The evolution is shown for the 21-year period 1979–2000 and for theaverage across all cohorts in each year of observation.Source: Wage Structure Survey (formerly the Occupational Wage Survey).
TABLE 10.7 Vulnerability by Education, Gender, and Sector: Indonesia, 2001(Conditional likelihood of earnings falling beneath poverty level)
Male Female
Education Manufacturing Nontradable Manufacturing Nontradable
Primary or less 0.1971 0.2147 0.3098 0.4076Secondary 0.0890 0.1047 0.1552 0.1777Tertiary 0.0050 0.0261 — —
Note: For female workers, tertiary education falls within secondary education because there are not enoughobservations for those with tertiary education to treat them separately.Source: Alatas (2002).

earnings. In the absence of such data, only indirectevidence or indirect proxies for individual earningvolatility and vulnerability may be used. This chap-ter has reviewed such evidence for three East andSoutheast Asian countries where trade barrierswere lowered significantly during the 1990s.
Indirect evidence revealed no significant changein year-to-year fluctuations in workers’ earnings andemployment after trade was further liberalized in the1990s or in sectors that were more exposed to for-eign competition. The mean and variance of earn-ings, and net flows in employment, proved to be verysimilar in tradable and nontradable sectors. We didnot find any systematic differences in employmentor earnings volatility. Nor did workers’ vulnerability,as approximated using an original methodologydeveloped in this chapter, seem to differ significantlyacross manufacturing industries with differentdegrees of exposure to trade. Our results, in fact,show that vulnerability to relative poverty—definedas 60 percent of the national median wage—seemsto have declined over the last 10–20 years in the threecountries and that differences across sectors seem tohave narrowed considerably.
These conclusions may be criticized becausethey rely on indirect evidence. In particular, it maybe that the stability of net employment flows andthe steady evolution of the mean and the varianceof earnings behind the proxy used for vulnerabilityactually hide an increased instability for individualworkers in the labor market. Again, to reach a defi-nite conclusion would require panel data.
Now it is time to make a point that will reinforcethe general findings in this chapter and at the sametime suggest another, more subtle way throughwhich openness to trade may actually affect earn-ings volatility. The apparent stability of net employ-ment flows and the evolution of earnings and theirvariance in the decade or so preceding the 1997–98East Asian financial crisis are meaningful preciselybecause the crisis corresponded to quite significantchanges in practically all existing trends. Thus thecrisis shows that there may be some variability in allthe indicators used in this chapter. The remarkableresult is therefore that no systematic variationshowed up at the time the three economies werebecoming more open, or in the comparison acrosssectors with distinct exposures to trade. This find-ing seems indeed to confirm that opening up totrade in the late 1980s and early 1990s did not havestrong negative effects on poverty and vulnerabil-ity, whereas the 1997–98 crisis did have such effects.In turn, one may wonder whether it was opennessthat made that crisis much more serious than thevarious shocks that hit the three economies in the1980s. If this were true, then it could be assertedthat openness actually contributed to more indi-vidual vulnerability in East and Southeast Asiathrough increased macroeconomic volatility, ratherthan through the interplay of modified microeco-nomic mechanisms. The question is open.
Although it is not unreasonable to suggest thatshort-term idiosyncratic shocks in the global mar-ket may affect the more exposed sectors dispropor-
Trade and Labor Market Vulnerability in Indonesia, Republic of Korea, and Thailand 185
Males by educational attainment
0
1992
1993
1994
1995
1996
1997
1998
1999
2000
1992
1993
1994
1995
1996
1997
1998
1999
2000
0.05
0.1
0.15
0.2
0.25
Conditional likelihood of earning less than poverty threshold
PrimarySecondaryTertiary
Females by educational attainment
0
0.05
0.1
0.15
0.2
0.25
PrimarySecondaryTertiary
FIGURE 10.10 Vulnerability by Gender and Educational Attainment: Thailand, 1991–2000
Source: Thailand Labor Force Surveys.

tionately, the fact that we did not find such evi-dence suggests that a possible reason is that, in theabsence of systemic shocks like the one in 1997–98,an open economy is subject to many uncorrelatedshocks that tend to cancel one another out thanksto a well-functioning labor market—certainly acharacteristic of the three economies under study.Another possibility is that liberalization in smalleconomies may facilitate access to the interna-tional market, which provides hedging and self-insuring opportunities. In addition, these Asianeconomies were already relatively open by the1970s, and have been exposed to world marketsand their fluctuations since then. Thus the tariffreductions of the 1980s and 1990s may have hadonly negligible effects on domestic industries. As iswell known, a country’s tariff regime is a complexcombination of step function, multiple tiers, andvarious types of percentage-quantity barriers.Under these conditions, it is extremely difficult toquantify the magnitude of additional exposurethat actually follows from an observed reductionin the average tariff rates.
Although we find no obvious link between tradeand vulnerability, the analysis in this chapter con-firms that some workers are more vulnerable thanothers. Women workers are more vulnerable tofalling into poverty, as are workers who have lessschooling. This result reflects the dominant evi-dence in the literature that gender and skill have astrong discriminatory power in determining a per-son’s earnings. An important conclusion is thatremedies to vulnerability to poverty must besought more in education than in trade openness.A more open trade regime is unlikely to justify byitself the creation of effective safety nets. Suchinsurance systems may be justified independently,either because of the presence of a substantial pro-portion of unskilled workers with limited capacityto face adverse shocks or possibly because of anincreased likelihood of a major macroeconomic orsystemic crisis.
Endnotes
1. For a critical view, see Rodriguez and Rodrik (1999).2. Detailed and comprehensive findings for Indonesia, Korea,
and Thailand are available from the authors upon request.3. The sample of wage workers in the primary sector in the
labor force surveys of Thailand and Indonesia is small, andit is not possible to isolate precisely agriculture from other
activities in the income of rural self-employed. In Korea, weworked primarily with the establishment surveys, becausethe labor force surveys do not contain wage informationand the establishment surveys do not include the primarysector.
4. For Korea, we were able to break up services into the strictlynontradable construction, social, and communal services,and nontradable industries that may depend on tradeactivity and are categorized as “others.”
5. Services, retail and wholesale, transport, and communica-tions.
6. We also examined the ranking by trade per worker, whichgives very similar groupings. In Korea, the industries in thegroup of highest trade exposure are textile and apparel, fab-ricated metal, machinery, and others not elsewhere classi-fied; those in the group of medium exposure are wood,chemical, and iron and steel; and those in the group of lowexposure are food and beverage, paper, petroleum, andrubber and plastic. In Thailand, the highest trade exposuregroup consists of the chemical, primary metal, machinery,and other industries not elsewhere classified; the mediumexposure group consists of the food and beverage, tobacco,textile, apparel, footwear, wood product, furniture, and fab-ricated metals industries; and the low exposure group ismade up of the paper product, petroleum, and rubber andplastics industries.
The Indonesian data do not permit a comparable break-down. Before 1988, SAKERNAS, the Indonesian labor forcesurveys from which our data are taken, provided only arough five-way classification of the sectors in which work-ers were employed: agriculture, manufacturing, trade, ser-vices, and other industries. Between 1989 and 2000 the sec-toral classification was expanded from 5 categories to 18,but within manufacturing it provided for only four indus-try groups: food, beverages, and tobacco; apparel and tex-tiles; wood products; and others.
7. Standard deviation of growth divided by the decade-aver-age growth.
8. Daewoo Economic Research Institute carried out the KoreaHousehold Panel Survey from 1994 to 1998. The survey col-lected information on income, assets, expenditures, thelabor market, and other household and individual charac-teristics. There were no replacements of households, but thedata covered split-off households stemming from marriageor other reasons. The survey was conducted through strati-fied random sampling by street blocks, and it covered allKorean prefectures except Jeju-do. In 1994 there were about3,500 households and in 1998 about 2,200 households.
9. The synthetic panels could be assembled for only a limitedtime period (except for Korea where establishment surveysare available for as early as 1976, and labor force surveys foras early as 1985). Because of this limitation, it was not pos-sible to compare systematically the 1980s and the 1990s—that is, moderate versus pronounced openness to trade—for all three countries. The comparison performed onsectors with high and low exposure to trade did not presentthis difficulty.
10. It is also known that the inequality of earnings tends toincrease with age because the stochastic process behindindividual earnings is close to a random walk, a substantialproportion of shocks being persistent.
11. Such an evolution is even consistent with a constant vari-ance of relative earnings. It is sufficient that individualswithin a cohort switch rank more and more frequently.
186 East Asia Integrates

12. In Korea, there is the household panel survey conducted byDaewoo Economic Research Institute, but the five-yearperiod covered was too short for our analysis.
13. A more general specification would also include a persist-ent component in the innovation term xjt. Some implica-tions of this specification are considered in Deaton andPaxson (1994).
14. Let us rewrite equation 10.3 as σ 2ξjt = ajσ 2
ξjt – 1 + bj + ujt,
where σ 2ξjt = Bj + u j
t. Let the ordinary least-squares (OLS)estimates of the two coefficients aj and bj be A and B. Twobad cases are possible. Scenario 1: suppose that A is positivebut some Bj + u j
t are negative. We can then try to find avalue ρ2 < A in the confidence interval of A, such that all Bj
+ u jt are positive. Scenario 2: suppose that OLS gives a neg-
ative A or a value that exceeds one. In the first case, it is bestto start with small positive values of ρ2 in the confidenceinterval of A and proceed as in scenario 1. In the secondcase, we would start with values below but close to ρ2 = 1and proceed as in Scenario 1. Practically, A was never foundsignificantly smaller than zero or greater than one withstandard tests—in theory, nonstationarity tests of theDickey-Fuller type should be applied to test A = 1.
15. This finding is in apparent contradiction with the findingby Deaton and Paxson (1994), who applied a similarmethodology to Taiwan (China). They found that shockson household consumption expenditures—and implicitlyincome—tend to be persistent. Thus there is an increasingtrend in the variance of log expenditures. The reason forthe difference with the findings reported in this chaptermight be that we focus on individual earnings and wageearners rather than household consumption per capita. Wetherefore ignore shocks linked to the demographic compo-sition of the household and labor supply.
16. Note that ρ is highest among the youngest cohorts for bothmen and women, because earning changes persistently takeplace early in a worker’s career.
References
The word processed describes informally reproduced works thatmay not be commonly available through libraries.
Alatas, Vivi. 2002. “Labor Market Vulnerability in Indonesia: ASynthetic Cohort Panel Simulation Exercise.” World Bank,Washington, D.C. Processed.
Arango, Carlos, and William Maloney. 2002. “UnemploymentDynamics in Latin America: Estimates of Continuous TimeMarkov Models for Mexico and Argentina.” World Bank,Washington, D.C. Processed.
Cox, Edwards A., and Sebastian Edwards. 1996. “Trade Liberal-ization and Unemployment: Policy Issues and Evidencefrom Chile.” Cuademos de Economia 33 (99): 227–50.
Currie, Janet, and Ann E. Harrison. 1997. “Sharing the Costs:The Impact of Trade Reform on Capital and Labor inMorocco.” Journal of Labor Economics 15 (13) (part 2, July):S44–S71.
Deaton, Angus, and Christina Paxson. 1994. “IntertemporalChoice and Inequality.” Journal of Political Economy 102:437–67.
De Ferranti, David, Guillermo E. Perry, Indermit S. Gill, and LuisServén Region. 2000. Securing Our Future in a Global Econ-omy. Washington, D.C.: World Bank.
Fajnzylber, Pablo, and W. F. Maloney. 2000. “Labor Demand andTrade Liberalization in Latin America.” Latin America andCaribbean Sector Management Unit for Poverty Reductionand Economic Management. World Bank, Washington,D.C.
Frankel, Jeffrey, and David Romer. 1999. “Does Trade CauseGrowth?” American Economic Review 89 (3): 1–16.
Irvin, D., and M. Tervio. 2002. “Does Trade Raise Income? Evi-dence from the Twentieth Century.” Journal of InternationalEconomics 58: 1–18.
Michalopoulos, Constantine. 1999. Trade Policy and MarketAccess Issues for Developing Countries. Policy Research Work-ing Paper 2214. World Bank, Washington, D.C., October.
Papageorgiou, Demetrios, Armeane M. Choksi, and MichaelMichaely. 1990. Liberalizing Foreign Trade in DevelopingCountries: The Lessons of Experience. Washington, D.C.:World Bank.
Revenga, Ana. 1994. “Employment and Wage Effects of TradeLiberalization: The Case of Mexican Manufacturing.” PolicyResearch Working Paper 1524. World Bank, Washington,D.C.
Rodriguez, Francisco, and Dani Rodrik. 1999. “Trade Policy andEconomic Growth: A Skeptic’s Guide to the Cross-NationalEvidence.” NBER Working Paper No. 7081. National Bureauof Economic Research, Cambridge, Mass.
Sachs, Jeffrey, and Andrew Warner. 1995. “Economic Reformand the Process of Global Integration.” Brookings Papers onEconomic Activity No. 1. Brookings Institution, Washing-ton, D.C.
Trade and Labor Market Vulnerability in Indonesia, Republic of Korea, and Thailand 187


Kathie Krumm The World Bank
Homi Kharas The World Bank
William J. Martin The World Bank
Deepak Bhattasali The World Bank
Shantong Li Development Research Centre of the State Council,China
Mari Pangestu Center for Strategic and International Studies,Indonesia
Sudarshan Gooptu The World Bank
Bijit Bora World Trade Organization
Robin Carruthers The World Bank
Jitendra N. Bajpai The World Bank
David Hummels Purdue University, United States
Manjula Luthria The World Bank
Keith E. Maskus University of Colorado at Boulder,United States
Shaohua Chen The World Bank
Martin Ravallion The World Bank
Jehan Arulpragasam The World Bank
189
AUTHORS AND THEIR
AFFILIATIONS

Francesco Goletti Agrifood Consulting, United States
Tamar Manuelyan Atinc The World Bank
Vera Songwe The World Bank
François Bourguignon DELTA, France
Chor-ching Goh The World Bank
190 East Asia Integrates

AAFTA (ASEAN Free Trade Area)
extent of regional interdependence, xviiimarket access barriers, poverty, and agricultural
products, 63, 68, 72RTAs, 41–42, 45, 52
agehousehold-level effects of China’s accession to WTO,
137, 138, 139vulnerability of trade and labor market in Indonesia,
Republic of Korea, and Thailand, 177, 178Agreement on Textiles and Clothing (ATC), Uruguay
Round, xxiAgreement on Trade-Related Aspects of Intellectual
Property Rights (TRIPS), xxvii, 91China’s accession to WTO, 6–7copyright in Indonesia, 102patents in Korea, 99, 108traditional knowledge protections, 103, 105, 107
agriculturecashmere (see cashmere in Mongolia)China’s accession to WTO, xiv–xv, 7–9, 18, 23,
139–140market access issues (see market access barriers,
poverty, and agricultural products)rice
Cambodia and Vietnam (see rice in Cambodiaand Vietnam)
global trade in, 63, 65significant source of income for low and middle-
income countries, 59–60technical requirements and standards, xxiitraditional knowledge protections, 102, 103
AMF (Asian Monetary Fund), 43antidumping provisions and China’s accession to WTO,
xv, 5–6, 17APEC. see Asia-Pacific Economic Cooperation (APEC)apparel. see textilesArgentina
customs clearance, 83dumping, 6environmental standards, 127labor standards and employment, 119logistics, 75vulnerability of trade and labor market, 166
Arulpagasam, Jehan, 149–169ASEAN. see Association of South East Asia Nations
(ASEAN)Asia-Pacific Economic Cooperation (APEC)
environmental standards, 125–126extent of regional interdependence, xviiilogistics, xxiii, xxiv, 74, 87RTAs, 37, 39, 43, 45
Asian Monetary Fund (AMF), 43Association of South East Asia Nations (ASEAN)
AFTA [see AFTA (ASEAN Free Trade Area)]China and (see China)logistics, 80, 87market access barriers, poverty, and agricultural
products, 61, 63, 70, 72MRAs, xxiipolicy recommendations, xxxivRTAs, xviii–xix, 37, 39, 51–52
ASEAN-China Free Trade Area, 37, 41, 42, 47–52current and proposed agreements, 37, 39, 41–43financial cooperation on regional basis, 43–44
191
INDEX

trade trends and opportunities, xiii–xivATC (Agreement on Textiles and Clothing), Uruguay
Round, xxiAtinc, Tamar Manuelyan, 149–169Australia, 7, 37, 40, 41, 45authors’ rights. see copyright in Indonesia
BBajpal, Jitendra N., 73–89Basel Convention, 129“behind the border” reform issues, xxi–xxiiBhattasali, Deepak, 3–20bilateral investment treaties, East Asian countries,
xxvi–xxviibiological research and traditional knowledge protec-
tions. see traditional knowledge protectionsBolivia, 166books and copyright in Indonesia, 102Bora, Bijit, 69–73Bourguignon, François, 165–181box features. see tables, charts, and figuresBrazil
customs clearance, 83environmental standards, 126, 127intellectual property rights, xxviilabor standards and employment, 119logistics, 75vulnerability of trade and labor market, 166
Brenton, Paul, 69–73Brunei, 66–67
CCambodia
China’s accession to WTO, xvii, 33–34economic/income gap, ix, xxixlabor standards and employment, 117logistics, 75, 76, 77–78, 79, 83, 86market access barriers, poverty, and agricultural
products, 61, 63, 69, 70MFN status with China, xixrice (see rice in Cambodia and Vietnam)textiles, xxitrade trends and opportunities, xi, xiv
Canada, 11, 24, 40, 66–69, 72Carruthers, Robin, 73–89cashmere in Mongolia, xxxi–xxxii, 149–151, 161–168. see
also tables, charts, and figuresexports, 161–163, 166herders, 163, 164–165household level effects of cashmere trade, 163, 167importance of cashmere to economy and society,
161–163policy and policy reform, 151–152, 163–164,
166–167processors, 165–166quality issues, 163share of cashmere products in total cashmere
exports, 166traders, marketers, and distributors, 165
value chain analysis, xxxii, 149–152, 163–166,167–168
CBD (Convention on Biodiversity), 104–105CER (Australia-New Zealand Closer Economic Rela-
tions) and East Asia RTAs, 37, 41, 45CGE (comparable general equilibrium) modeling, 133charts. see tables, charts, and figureschemicals patents in Korea, 97Chen, Shaohua, 131–142Chiang Mai initiative (CMI), x, 43child labor, 117Chile, 40, 125, 127, 166China. see also Hong Kong (China); Taiwan (China)
accession to WTO (see China’s accession to WTO)ASEAN and China
ASEAN-China Free Trade Area, 37, 41, 49–51China-ASEAN framework agreement, xviii“Early Harvest” provisions, China-ASEAN agree-
ment, xix, 28, 33, 49, 50RTAs, xx, 37, 41, 42, 47–52WTO, China’s accession to, 22, 28, 33, 47–48
bilateral investment treaties, xxviicustoms clearance, 83economic/income gap, ix, xxxenvironmental standards, 123, 125, 126, 127intellectual property rights, xxvii, 108labor standards and employment, 117, 119logistics, xxiii, xxiv, 12, 74–78, 80–86market access barriers, poverty, and agricultural
products, 60, 63, 66–67, 69, 70regional role of, xiv–xviiregulatory and pro-competitive reforms, xxviRTAs
ASEAN and China, 37, 41, 42, 47–52current and proposed, 40, 41financial cooperation on regional level, 43–44reasons for new resurgence of, 38
services liberalization, xxvtechnical requirements and standards, xxiitextiles
easing adjustments in industry, xxxvglobal integration, xx–xxiWTO, accession to, xv, 4–5, 11, 14–15, 26, 33, 48
third country markets, China’s trade in, xivtrade trends and opportunities, xi–xiv
China’s accession to WTO, x, xiv–xvii. see also tables,charts, and figures
agriculture, xiv–xv, 7–9, 18, 23, 139–140ASEAN and China, 22, 28, 33, 47–48educational opportunities, expansion of, 17employment, 15, 18exports, 14–15, 18, 23–24FDI, 24–26financial issues
economic reforms, 13–15financial services, 13investment patterns, 24–26, 27
household-level impact (see also tables, charts, andfigures)
192 East Asia Integrates
agricultural households, 139–140characteristics of households affecting, 136,
137–140geographic variations, 131, 136, 140methodology of analysis, 133–134policy and policy reforms, 131, 132, 140poverty and income, 16–17, 131, 132, 134–140results, 134–140rural vs. urban households, 15–16, 131, 136–140welfare impact of accession, 15, 131–132, 134–137
imports, 15, 18, 22–23investment patterns, 24–26, 27Japan and (see Japan)manufacturing, xv, 9–11, 17, 23motor vehicles, xv, 10–11, 26–27national impact, 3–20
economic reforms, 13–15household-level effects (see subhead “household-
level impact,” this entry)policy reforms, xv, 4–7, 11sectoral changes, xiv–xv, 7–13ways of doing business, changes in, xvi
poverty and income effects, 16–17, 131, 132, 134–140regional impact, xvi–xvii, 21–38
channels of, 22–26low-income countries, 33–36middle-income developing countries, 27–33NIEs, 26–27
services, xvi, 10–13, 23social protection measures, 17, 18technical requirements and standards, xxiitextiles, xv, 4–5, 11, 14–15, 26, 33, 48third-country market competition, 24United States and (see United States)welfare impact, 15, 131–132, 134–137
CITES (Convention on International Trade in Endan-gered Species), 129
clothing. see textilesCMI (Chiang Mai initiative), x, 43Colombia, 119, 127, 166COMECON (Council for Mutual Economic Assistance),
collapse of, 162–163comparable general equilibrium (CGE) modeling, 133competition
environmental standards, xxviii–xxix, 115–116,126–129
investment and competition policies, xxvi–xxviilabor standards, xxviii–xxix, 115–116, 118–123regulatory and pro-competitive reforms, xxv, xxvi
Convention on Biodiversity (CBD), 104–105Convention on International Trade in Endangered
Species (CITES), 129copyright in Indonesia, 92, 99–102, 108
film, 101–102legal structures and enforcement, 100music recordings, 100–101pirating, 99, 100print publishing, 102software, 100–101
corporate cartels, xxviicost/benefit analysis for RTAs, 44–47Council for Mutual Economic Assistance (COMECON),
collapse of, 162–163Croatia, 41cross-border facilitation of logistics, xxv, 86–87customs clearance, xxv, 82, 83Czech Republic, 41
Ddesign and traditional knowledge protections, 102diversification of products and logistics, 80Doha Round, Declaration, and Development Agenda,
xx, xxii, 9, 45, 116, 129–130drugs, 97, 102dumping/antidumping provisions and China’s accession
to WTO, xv, 5–6, 17
Ee-commerce and logistics, 82, 84“Early Harvest” provisions, China-ASEAN agreement,
xix, 28, 33, 49, 50earnings stability. see vulnerability of trade and labor
market in Indonesia, Republic of Korea, andThailand
East Asia currency and financial crisis, 1997-1998, x,xxxii, 123–124, 179
East Asia integration, ix–xxxviii. see also more specifictopics
“behind the border” reform issues, xxi–xxixbenefits, scope of, xviii–xixChina
accession to WTO, regional impact of (see China’saccession to WTO)
role in region, xiv–xvii (see also China)extent of regional interdependence, xvii–xviiiglobal integration (see global integration)logistics and transport issues, regional, 81–85, 87 (see
also logistics)reasons for current importance of, xtrade trends and opportunities, xi–xiv
EBA (Everything But Arms) Agreement, 68education
China’s accession to WTO, 17vulnerability of trade and labor market in Indonesia,
Republic of Korea, and Thailand, xxxiii, 177–178,179
EFTA (European Free Trade Area), 41Egypt, 119, 127employment. see labor standards and employmentenvironmental standards, xxviii–xxix, xxxv, 115–116,
123–131. see also tables, charts, and figurescompetition, xxviii–xxix, 115–116, 126–129Doha Round, 129–130East Asia currency and financial crisis, 1997-1998,
123–124exports of pollution-intensive products, 127–129FDI and, 115–116, 124–126logistics in urban environments, 87
Index 193

policy and policy reforms, 130–131political freedom index, 128trade liberalization and openness, effect of, 124–126
EPZs (export processing zones), 120European Free Trade Area (EFTA), 41European Union (EU)
China’s accession to WTO, 11, 24, 28compared to East Asia, xviienvironmental standards, 127logistics, 85market access barriers, poverty, and agricultural
products, 61, 64, 65, 66–67, 68, 69, 72RTAs, 41, 45trade trends and opportunities, xi
Everything But Arms (EBA) Agreement, 68export processing zones (EPZs), 120exports. see also tariffs
agricultural and agroprocessed exports, 60–61 (seealso market access barriers, poverty, and agricul-tural products)
cashmere in Mongolia, 161–163, 166China’s accession to WTO, 14–15, 18, 23–24environmental standards and exports of pollution-
intensive products, 127–129labor standards and employment, 120–123rice from Cambodia and Vietnam, 153–155, 159
FFA (freedom of association) rights, 121, 122farming. see agricultureFDI. see foreign direct investment (FDI)figures. see tables, charts, and figuresfilm and copyright in Indonesia, 101–102financial issues
China’s accession to WTOeconomic reforms, 13–15financial services, 13investment patterns, 24–26, 27
investment (see investment)RTAs and financial cooperation on regional level,
43–44financial services and China’s accession to WTO, 13folklore and traditional knowledge protections, 102foreign direct investment (FDI)
China’s accession to WTO, effect of, 24–26environmental standards, 115–116, 124–126labor standards, 115–116, 120–123
France, 75, 83, 94free trade
ASEAN-China Free Trade Area, 37, 41, 49–51current and proposed free trade areas, 41regional blocs, effects of, 45–46
freedom of association (FA) rights, 121, 122
GGATS. see General Agreement on Trade in Services
(GATS)GATT. see General Agreement on Tariffs and Trade
(GATT)
gender and vulnerability of trade and labor market inIndonesia, Republic of Korea, and Thailand,177–178, 179
General Agreement on Tariffs and Trade (GATT)ATC (Agreement on Textiles and Clothing), Uruguay
Round, xxiChina’s accession to WTO, 4, 6, 9, 17environmental standards, 129Japan and, 4
General Agreement on Trade in Services (GATS)China’s accession to WTO, 12, 13, 17investment and competition policies, xxvilogistics, 86
general equilibrium analysis, 133Generalized System of Preferences (GSP), 63, 68–70genetic resources, traditional knowledge regarding. see
traditional knowledge protectionsGermany, 83, 94, 96Gini coefficient for interpersonal income inequality, xxxglobal integration, xix–xxi
rice, global trade in, 63, 65traditional knowledge protections, 104–105
Global Trade Analysis Project (GTAP), 14, 133, 134Goh, Char-ching, 165–181Goletti, Francesco, 149–169Gooptu, Sudarshan, 21–38Greece, 83GSP (Generalized System of Preferences), 63, 68–70GTAP (Global Trade Analysis Project), 14, 133, 134
Hhealth and safety standards, xxiihigh-tech products, ASEAN and China, 48Hong Kong (China)
bilateral investment treaties, xxviiChina’s accession to WTO, effect of, 6, 26customs clearance, 83economic/income gap, ixlabor standards and employment, 117, 121logistics, 74, 75, 76, 81, 85market access barriers, poverty, and agricultural
products, 63, 66–67RTAs, 40, 41
household-level effectscashmere trade in Mongolia, 163, 167China’s accession to WTO (see China’s accession to
WTO)trade reforms, impact of, xxx–xxxi
hub and spoke arrangements, 46–47hukou system and China’s accession to WTO, 15, 16, 18Hummels, David, 73–89
IIanchovichina, Elena, 21–38Ikezuki, Takako, 69–73ILO (International Labour Organization), xxix, 117, 121,
122imports. see also tariffs
China’s accession to WTO, xvi, 15, 18, 22–23
194 East Asia Integrates

market access barriers, poverty, and agriculturalproducts, 63
IndiaChina’s accession to WTO, 26customs clearance, 83dumping, 6environmental standards, 127intellectual property rights, xxviilabor standards and employment, 119market access barriers, poverty, and agricultural
products, 61RTAs, 41
Indonesiabilateral investment treaties, xxviiChina’s accession to WTO, xvii, 27, 28–30CMI, 43copyright (see copyright in Indonesia)customs clearance, 83environmental standards, 124, 127labor standards and employment, 117, 119, 121logistics, xxiv, 75, 76–77, 85market access barriers, poverty, and agricultural
products, 63, 66–67, 69regulatory and pro-competitive reforms, xxvitrade trends and opportunities, xiivulnerability of trade and labor market (see vulnera-
bility of trade and labor market in Indonesia,Republic of Korea, and Thailand)
industrial inventions. see intellectual property rightsindustrial products. see manufacturinginformal employment, 117–118information technology and logistics, 82, 84intellectual property rights, xxvii–xxviii, 91–110. see also
tables, charts, and figuresChina’s accession to WTO, 6–7copyright (see copyright in Indonesia)defined, 91patents (see patents in Korea)pirating, 99, 100policy recommendations, xxxvtraditional knowledge (see traditional knowledge
protections)TRIPS [see Agreement on Trade-Related Aspects of
Intellectual Property Rights (TRIPS)]International Conventions for the Protection of New
Varieties of Plants (UPOV), 104International Labour Organization (ILO), xxix, 117, 121,
122intraregional trade trends, xiiiinventions. see intellectual property rightsinventory costs and logistics, 79–80investment
bilateral investment treaties, East Asian countries,xxvi–xxvii
China’s accession to WTO, effect of, 24–26, 27FDI [see foreign direct investment (FDI)]policies on investment and competition,
xxvi–xxviiIPRs. see intellectual property rights
JJapan
bilateral investment treaties, xxviiChina’s accession to WTO
national impact, 4, 5, 7, 9regional impact, 22, 24, 26, 27, 28
environmental and labor standards, 115–116logistics, 75, 85market access barriers, poverty, and agricultural
products, 61, 63, 64, 65, 66–67, 69, 72market-driven integration or regionalization, 40patents, 95RTAs, xviii, 37, 40, 41, 43Thailand, 32
KKhuras, Homi, ix–xxxviiiKorea. see Republic of KoreaKrumm, Kathie, ix–xxxviii
Llabor standards and employment, xxviii–xxix, xxxv,
115–123. see also tables, charts, and figureschild labor, 117China’s accession to WTO, xxxi, 15, 18competition, xxviii–xxix, 115–116, 118–123determinants of standards, 118EPZs, 120export performance, effect on, 120–123FA (freedom of association) rights, 121, 122FDI, 115–116, 120–123household-level effects of trade reforms, xxxiILO conventions, ratification of, 117, 121, 122informal employment, 117–118minimum wage laws, 116–117policy and policy reform, 117, 130–131political freedom index, 122poverty, 118, 119ranking standards, 118, 119rights of workers, 116, 117social protection measures, 117tariffs and trade liberalization, 118–120vulnerability to trade liberalization (see vulnerability
of trade and labor market in Indonesia, Republicof Korea, and Thailand)
Lao Peoples’ Democratic Republic (Lao PDR)China’s accession to WTO, xvii, 33, 34–35economic/income gap, ix, xxixlogistics, xxiv, 75, 76, 77–78, 78, 79, 86, 87market access barriers, poverty, and agricultural
products, 61, 69, 70MFN status with China, xixpoverty and accessibility, 78trade trends and opportunities, xi, xiv
Li, Shantong, 3–20logistics, xxii–xxv, xxxiv–xxxv, 73–89. see also tables,
charts, and figuresair freight, 85benefits from improvement to, 79–81
Index 195
China’s accession to WTO, 12commodity structure of trade, 74–76country groupings, 74–78cross-border facilitation, xxv, 86–87customs clearance, xxv, 82, 83development of markets and product diversification,
80domestic integration of systems, 85–86inventory costs, 79–80land access to ports, 83–85less open and accessible (Group 3) countries, 77–78maritime transport, 81–82multimodal transport, 82, 84outward-oriented, accessible (Group 2) countries,
76–77outward-oriented, highly accessible (Group 1) coun-
tries, 76per capita income levels, 74–76policy recommendations, 85–87pricing differentials, 79private sector involvement, 86regional cooperation, 87regional price fluctuations, 79regional transport issues, 81–85regulatory environment for, 86–87remote regions within countries, 78–79security issues, 87trade and logistics nexus, 74urban land use and management, 87value chain, position on, 80–81
low-income countriesagriculture as significant source of income for, 59–60China’s accession to WTO, effect of, 33–36intellectual property rights, xxviii
Luthria, Manjula, 91–110
MMalaysia
bilateral investment treaties, xxviiChina’s accession to WTO, effect of, 27, 30–31customs clearance, 83economic/income gap, xxixenvironmental standards, 125, 127labor standards and employment, 117, 119, 121logistics, xxiv, 75, 76–77, 81market access barriers, poverty, and agricultural
products, 66–67, 69regulatory and pro-competitive reforms, xxvi
manufacturing industries and China’s accession toWTO, xv, 9–11, 17, 23
maritime transport, 81–82market access barriers, poverty, and agricultural prod-
ucts, xxi, 59–73. see also tables, charts, and figuresagricultural liberalization, importance of, 60domestic support, 63, 64exports, agricultural and agroprocessed, 60–61exposure of poor to international markets, 60–61imports, 63key markets for agroproducts, 61–63
NTMs, 70, 71preferential rates, 68–70rice, global trade in, 63, 65significance of agricultural income to middle and
lower-income countries, 59–60tariff barriers, 63–65tariff escalation, 65–68tariff rates, 66–67trade policy recommendations, 72trade policy structure of EU, Japan, and United States
for East Asian imports, 64–65, 68market development and logistics, 80market-driven integration or regionalization, 39–40market opening and China’s accession to WTO, 4–5marketing margins and costs for rice in Cambodia and
Vietnam, 158–161Martin, Will, 3–20Maskus, Keith E., 91–110, 115–134MEAs (multilateral environmental agreements), 129medical research and traditional knowledge protections.
see traditional knowledge protectionsMekong River Commission and Greater Mekong subre-
gion, 87Mexico
customs clearance, 83dumping, 6environmental standards, 126, 127labor standards and employment, 119logistics, 75RTAs, 40, 43vulnerability of trade and labor market, 166
MFA (Multi-fiber Arrangement), 4–5MFN. see most favored nation (MFN) statusmiddle-income developing countries
agriculture as significant source of income for, 59–60China’s accession to WTO, regional impact of, 27–33intellectual property rights, xxviiitrade trends and opportunities, xi
minimum wage laws, 116–117Mongolia, xxiv, xxxi, 75–79, 87. see also cashmere in
MongoliaMontreal Protocol, 129Morocco, 166most favored nation (MFN) status
China’s accession to WTO, 4–5“Early Harvest” provisions, China-ASEAN agree-
ment, xix, 33market access barriers, poverty, and agricultural
products, 63, 64, 68, 70market opening principle of GATT and WTO, 4
motor vehicle industry and China’s accession to WTO,xv, 10–11, 26–27
movies and copyright in Indonesia, 101–102Mozambique, 83MRAs (mutual recognition agreements), xxiiMulti-fiber Arrangement (MFA), 4–5multilateral environmental agreements (MEAs), 129music
copyright in Indonesia, 100–101
196 East Asia Integrates

traditional knowledge protections, 102mutual recognition agreements (MRAs), xxiiMyanmar, xiv, 61, 66–67, 69
NNAFTA (North American Free Trade Agreement), xi,
xvii, 122, 128Netherlands, 83New Zealand, 37, 40, 41, 45newly industrializing economies (NIEs)
China’s accession to WTO, impact of, 26–27, 28market-driven integration or regionalization, 40trade trends and opportunities, xi
nondiscrimination principle and China’s accession toWTO, 4
nontariff measures (NTMs), 70, 71North American Free Trade Agreement (NAFTA), xi,
xvii, 122, 128Norway, 11NTMs (nontariff measures), 70, 71
OOrganisation for Economic Co-operation and Develop-
ment (OECD), 9, 120, 126
PPakistan, 61, 119, 127Panama, 41Pangestu, Mari, 21–38Papua New Guinea, 76, 77–78Paris Convention for the Protection of Industrial Prop-
erty, 95partial equilibrium analysis, 133patents in Korea, 92–99, 106. see also tables, charts, and
figurescitations of, 96–97, 98comparison with other countries, 93, 94, 96–99corporate management push, 95–96demand and supply side factors contributing to rise
in, 93fertile technology pull, 93–95friendly court pull, 94–95industrial upgrading push, 95R&D activity, 95–96semiconductor patents
comparison charts, 94fertile technology pull, 94–95reasons for prevalence of, 97–99
TRIPS, 99, 108U.S., Korean patents granted in, 95, 98
Peru, 119, 127, 166pharmaceuticals, 97, 102Philippines
bilateral investment treaties, xxviiChina’s accession to WTO, 26China’s accession to WTO, effect of, 27, 31–32customs clearance, 83economic/income gap, ix, xxxenvironmental standards, 124, 127
labor standards and employment, 117, 119, 121logistics, xxiv, 75, 76–77, 78, 85market access barriers, poverty, and agricultural
products, 65, 66–67, 69regulatory and pro-competitive reforms, xxviRTAs, 41trade trends and opportunities, xii, xivtraditional knowledge protections, 107
pirating of copyright material, 99, 100Poland, 75policy and policy reforms, ix, x, xxxiii–xxxvi
“behind the border” reform issues, xxi–xxixcashmere in Mongolia, 151–152, 163–164, 166–167China’s accession to WTO, household-level impact
of, 131, 132, 140environmental standards, 130–131household-level effects, xxx–xxxilabor standards, 117, 130–131logistics, policy recommendations for, 85–87market access barriers, poverty, and agricultural
productstrade policy recommendations, 72trade policy structure of EU, Japan, and United
States for East Asian imports, 64–65, 68predictability of trade policy and China’s accession to
WTO, 5regulatory and pro-competitive reforms, xxv, xxvirice in Cambodia and Vietnam, 151–152, 155,
157–161vulnerability of trade and labor market to (see vul-
nerability of trade and labor market in Indonesia,Republic of Korea, and Thailand)
WTO, associated with accession to, xv, 4–7, 11political freedom index, environmental and labor stan-
dards, 122, 128ports, 81–82. see also logistics
container movements at selected ports, 81land access to, 83–85
poverty. see also tables, charts, and figuresChina’s accession to WTO, 16–17, 131, 132, 134–140economic/income gap, ix, xxix–xxxlabor standards, 118, 119logistics, poverty, and accessibility in Lao PDR, 78market access barriers (see market access barriers,
poverty, and agricultural products)micro-interventions to relieve, xxxireduction efforts, xxix, xxx, xxxi, xxxvtrade in sectors important to the poor (see cashmere
in Mongolia; rice in Cambodia and Vietnam)vulnerability to, indirect estimation using cross-sec-
tional data, 175–178preferential trade agreements, 37–38, 45, 63. see also
regional trade agreements (RTAs)preferential treatment for developing countries, 6, 68–70pricing differentials and logistics, 79print publishing and copyright in Indonesia, 102private sector business, 86, 104product diversification and logistics, 80publishing and copyright in Indonesia, 102
Index 197

RR&D. see research & development (R&D) activityRavallion, Martin, 131–142recorded music and copyright in Indonesia, 100–101regional trade agreements (RTAs), xvii–xix, 37–55. see
also tables, charts, and figuresAFTA [see AFTA (ASEAN Free Trade Area)]ASEAN [see Association of South East Asia Nations
(ASEAN)]blocs vs. free trade, 45–46China (see China)costs and benefits, 44–47current and proposed agreements, 39–43financial cooperation on regional level, 43–44forms of, 38hub and spoke arrangements, 46–47market access barriers, poverty, and agricultural
products, 63reasons for new resurgence in, 38–39regional plus agreements, 37, 41
regionalization vs. regionalism, 39regulatory and pro-competitive reforms, xxv, xxviRepublic of Korea
agricultural protections, 9bilateral investment treaties, xxviiChina’s accession to WTO, effect of, 26corporate cartels, xxviieconomic/income gap, xxixenvironmental and labor standards, 115–116environmental standards, 123, 127intellectual property rights, xxviilabor standards and employment, 117, 119, 121logistics, xxiv, xxv, 75, 76, 80, 85market access barriers, poverty, and agricultural
products, 63, 66–67patents (see patents in Korea)regulatory and pro-competitive reforms, xxviRTAs, 37, 40, 42, 43services liberalization, xxvtextiles, xxitrade trends and opportunities, xi, xiivulnerability of trade and labor market (see vulnera-
bility of trade and labor market in Indonesia,Republic of Korea, and Thailand)
research & development (R&D) activitypatents in Korea, 95–96traditional knowledge protections, 103–104
rice, global trade in, 63, 65rice in Cambodia and Vietnam, xxxi–xxxii, 149–161,
167–168. see also tables, charts, and figuresaggregate effects of policy options, 158Cambodia, issues specific to, 156–157different participants, effect of policy on, 158–161exports of rice, 153–155, 159importance of rice to economy and society,
151–153marketing margins and costs, 158–161policy and policy reform, 151–152, 155, 157–161value chain analysis, 149–152, 155–161, 167–168
Vietnam, issues specific to, 157rights of workers, 116, 117RTAs. see regional trade agreements (RTAs)rural households and China’s accession to WTO, 15–16,
131, 136–140Russia, 83
Ssafeguards and China’s accession to WTO, xv, 5–6, 17Samoa, 76, 77–78Sangwe, Vera, 149–169sanitary and phytosanitary (SPS) standards, xxiisecurity issues and logistics, 87semiconductor patents in Korea. see patents in KoreaSeptember 11 attacks, 87services sector, xvi, xxv–xxvi, 10–13, 23sex and vulnerability of trade and labor market in
Indonesia, Republic of Korea, and Thailand,177–178, 179
Singaporebilateral investment treaties, xxviiChina’s accession to WTO, 26customs clearance, 83intellectual property rights, xxviilabor standards and employment, 117logistics, xxiv, 74, 75, 76, 81, 85market access barriers, poverty, and agricultural
products, 66–67regulatory and pro-competitive reforms, xxviRTAs, 37, 40, 41
size of household and effects of China’s accession toWTO, 138
social protection measures, 17, 18, 117social stability, reinforcing, xxix–xxxiiisoftware and copyright in Indonesia, 100–101South Africa, 6, 119, 127South Korea. see Republic of KoreaSpain, 83standards requirements, xxiiSuthiawart-Narueput, Sethaput, 21–38Sweden, 83
Ttables, charts, and figures
bilateral investment treaties, East Asian countries,xxvii
cashmere in Mongoliaeconomic role of, 162share of cashmere products in total cashmere
exports, 166value chain analysis, 152
China’s accession to WTOagriculture protections, xv, 8exports, 24household-level effects (see subheading “house-
hold-level effects of China’s accession toWTO,” this entry)
imports, xvi, 22, 23low-income countries, effect on, 33–35
198 East Asia Integrates
manufacturing protections, 10middle-income developing countries, effect on,
27–30NIEs, effect on, 26reductions in protection, impact of, 14
e-commerce, 84“Early Harvest” provisions, China-ASEAN agree-
ment, 50environmental standards
impact on pollution-intensive exports, 128policy indexes, 127sustainability index, xxviii, 127
Gini coefficient for interpersonal income inequality,xxx
household-level effects of China’s accession to WTO,xxximean gains, 137–139percentage of gainers, 139predicted aggregate impacts, 135rural poverty incidence curves, 135urban poverty incidence curves, 136
ILO conventions, ratification of, 117intellectual property rights
patents in Korea (see subhead “patents in Korea,”this entry)
research productivity of selected countries, 96traditional knowledge protections in the Philip-
pines, 107intraregional trade trends, xiiilabor standards and employment
exports, effect on, 122ILO conventions, ratification of, 117index of countries, xxviiiranking of standards, 119
logisticsair freight, 85APEC, expansion of exports to, xxivavailability of transport infrastructure, 75country groupings by openness, 75customs clearance times, 83e-commerce, 84land access to ports, 84manufactured exports by country, structure of,
xxiiipoverty and accessibility in Lao PDR, 78producer services, costs of, xxivremote regions, xxiii, 80selected ports, container transport from, 81
market access barriers, poverty, and agriculturalproductsdomestic support levels, 64key markets, 62NTMs, 70, 71real income gains from agricultural liberalization,
60rice, global trade in, 65tariff escalation, 69tariff rates, 66–67top export products, 61
trade policy structure of EU, Japan, and UnitedStates for East Asian imports, 68
marketing margins of farmers in Thailand, UnitedStates, Cambodia, and Vietnam, 161
patents in Koreacitations of Korean patents, 97research productivity of selected countries, 96self-citation rates of Korean private corporations,
98semiconductor patent comparisons, 94trend comparisons, Korea and major developing
countries, 93U.S., Korean patents granted in, 98
povertydeclining rate of, xxxGini coefficient for interpersonal income inequal-
ity, xxxmarket access barriers to agricultural products
(see subhead “market access barriers, poverty,and agricultural products,” this entry)
regional trade trends, xiiregulatory and pro-competitive reforms, xxvirice, global trade in, 65rice in Cambodia and Vietnam
economic role of, 153income of poor and, 154land size and rice profit, 154marketing costs and margins, 160, 161profit shares, 155profit structure, 161strategic policy options, effects and analysis of,
158, 159value chain analysis, 152
RTAsaverage tariff rates, xxcurrent and proposed agreements, 40–41“Early Harvest” provisions, China-ASEAN agree-
ment, 50economic welfare effects of proposals, xviiiforms of, 38multidimensional nature of, xx
third country markets, China’s trade in, xivtraditional knowledge protections in the Philippines,
107value chain analysis, 152vulnerability of trade and labor market in Indonesia,
Republic of Korea, and Thailandannual wage growth, xxxiiiaverage monthly hours worked, 174average tariffs and percent change in tariffs, 167core nontariff barrier measures, 169decade average shares of import tax revenue, 169decade averages of import tariffs for manufactur-
ing industries, 168demographic factors, 177, 178, 179distribution of employment status and sectors, 174education in Korea, xxxiiilog of real wages, 171, 172, 173standard deviation of wage growth, xxxiii
Index 199

trade sectors, 178Taiwan (China)
bilateral investment treaties, xxviiChina’s accession to WTO, effect of, 26customs clearance, 83environmental and labor standards, 115–116logistics, 75, 76, 80market access barriers, poverty, and agricultural
products, 63, 66–67, 69RTAs, 40, 41
tariffslabor standards and employment, 118–120market access barriers, poverty, and agricultural
productstariff barriers, 63–65tariff escalation, 65–68tariff rates, 66–67
vulnerability of trade and labor market in Indonesia,Republic of Korea, and Thailand, 167–169
technical requirements and standards, xxiitelecommunications industry and China’s accession to
WTO, 12–13textiles
ATC, xxiChina
easing adjustments in industry, xxxvglobal integration, xx–xxiWTO, accession to, xv, 4–5, 11, 14–15, 26, 33, 48
easing adjustments in industry, xxxvglobal integration, xx–xxi
Thailandbilateral investment treaties, xxviiChina’s accession to WTO, xviiChina’s accession to WTO, effect of, 11, 27, 28, 29,
32–33customs clearance, 83environmental standards, 123–124, 127labor standards and employment, 117, 119, 121logistics, xxiv, 75, 76–77, 82, 83, 85market access barriers, poverty, and agricultural
products, 65, 66–67, 69marketing margins of farmers, 161RTAs, 40, 41, 42, 43technical requirements and standards, xxiitextiles, xxitrade trends and opportunities, xiivulnerability of trade and labor market (see vulnera-
bility of trade and labor market in Indonesia,Republic of Korea, and Thailand)
trade policy and reform. see policy and policy reformstraditional knowledge protections, 92, 102–108
evolution of, 104–105global policy development, 104–105Philippines, 107practical issues and problems, 106–107property rights
history of, 104–105possible options for, 105–106
TRIPS, 103, 105, 107
WTO, 107transparency of trade policy and China’s accession to
WTO, 5transport systems. see logisticsTRIPS. see Agreement on Trade-Related Aspects of Intel-
lectual Property Rights (TRIPS)Turkey, 119, 127
Uundistorted trade and China’s accession to WTO, 5–6United Kingdom (UK), 94United Nations, xxiiUnited States
China’s accession to WTOnational impact, 4, 5, 7, 11regional impact, 22, 24, 26, 28
customs clearance, 83environmental standards, 127intellectual property rights, xxviiKorean patents granted in, 95, 98labor standards and employment, 120logistics, 75, 80, 85, 87market access barriers, poverty, and agricultural
products, 61, 64, 65, 66–67, 68, 69, 72marketing margins of farmers, 161RTAs, 40, 41, 43Thailand, 32third country markets, China’s trade in, xiv
UPOV (International Conventions for the Protection ofNew Varieties of Plants), 104
urban environmentscashmere in Mongolia, 163China’s accession to WTO, household-level effects
of, 15–16, 131, 136–138, 140logistics, 87
Vvalue chain
cashmere in Mongolia, xxxii, 149–152, 163–166,167–168
logistics, 80–81rice in Cambodia and Vietnam, xxxii, 149–152,
155–161, 167–168Venezuela, 119, 127VERLS labor standards, 121, 122Vietnam
bilateral investment treaties, xxviiChina’s accession to WTO, xviiChina’s accession to WTO, effect of, 26, 27, 33, 35–36customs clearance, 83economic/income gap, ix, xxxhousehold-level effects of trade reforms, xxxilabor standards and employment, 117logistics, xxiv, 75, 76, 77–78, 79, 86market access barriers, poverty, and agricultural
products, 61, 68, 69, 70rice (see rice in Cambodia and Vietnam)textiles, xxitrade trends and opportunities, xi, xiv
200 East Asia Integrates

vulnerability of trade and labor market in Indonesia,Republic of Korea, and Thailand, xxxii–xxxiii,xxxv, 165–181. see also tables, charts, and figures
cross-sectional data, indirect estimation of changesin vulnerability from, 175–178
demographic factors, 177–178education, xxxiii, 177–178GDP (gross domestic product) growth rates, volatil-
ity of, 169, 170synthetic panels, earnings and employment trends,
170, 171–174tariffs, 167–169trade liberalization
contested effects of, 165–166labor market volatility, 165–171measures of, 167–169
volatility of aggregate indicators, 169–171wage growth rates, volatility of, 169, 170
Wwage stability. see vulnerability of trade and labor mar-
ket in Indonesia, Republic of Korea, and Thailand
welfare. see social protection measureswelfare impact of China’s accession to WTO, 15,
131–132, 134–137WHO (World Health Organization), xxiiWorld Bank, xxii, 87World Health Organization (WHO), xxiiWorld Trade Organization (WTO)
bound tariff rates, 63China’s accession to (see China’s accession to
WTO)Doha Round, Declaration, and Development
Agenda, xx, xxii, 9, 45, 116, 129–130five basic principles, 4intellectual property rights, xxviilogistics, 74, 86RTAs, 37, 40, 45technical requirements and standards, xxiitraditional knowledge protections, 107
ZZhao, Min, 21–38Zimbabwe, 83
Index 201


T R A D E A N D D E V E L O P M E N T S E R I E S
ISBN 0-8213-5514-7
A Trad
e Policy A
gen
da fo
r Shared
Gro
wth
THE WORLD BANK
Emerging East Asian economies have seen their share of world exports more thantriple during the past quarter-century, and intraregional trade has driven thisgrowth. Broad measures of development in East Asia have improved at the same
headlong pace. Why push further integration now? Two economic events of historicproportions provide the context: strategic rethinking of development in the region followingthe East Asian financial crisis of 1997–98 and the accession of China to the World TradeOrganization. Policymakers interested in a stable, prosperous region are concerned bymildly rising inequality within countries and a widening income gap between richereconomies and the poorest economies. Increasingly, the development agenda in theregion—with its focus on growth, jobs, and social stability—and the trade policy agen-da—with its focus on market access and competitiveness—have become intertwined.
East Asian policymakers seek to develop a coherent set of economic policies that candeliver stability, growth, and regional integration. Without attempting to be compre-hensive, East Asia Integrates offers fundamental strategies that promote cross-borderflows of trade, globally and regionally, along with domestic policies on logistics, tradefacilitation, standards, and institutions to maximize the impact of these flows on devel-opment and to distribute the gains from trade widely.
As the authors demonstrate, multilateral and regional trade initiatives must provide acompelling vision of how integration can deliver broadly shared growth and prosperityif they are to succeed. In addition, they must use the momentum offered by tradeagreements to address the links between trade on the one hand, and social stability,poverty reduction, and growth on the other.
EditorsKathie Krumm and Homi Kharas
EAST ASIAIntegrates
A TRADE POLICY AGENDA FOR SHARED GROWTH