Public Disclosure Authorized Decentralized the poor
303
VOLUME II: BACKGROUND PAPERS Decentralized the poor Public Disclosure Authorized Public Disclosure Authorized Public Disclosure Authorized Public Disclosure Authorized 35692 v 2 Public Disclosure Authorized Public Disclosure Authorized Public Disclosure Authorized Public Disclosure Authorized
Transcript of Public Disclosure Authorized Decentralized the poor

V O L U M E I I : B A C K G R O U N D P A P E R S
Decentralizedthe poor
Pub
lic D
iscl
osur
e A
utho
rized
Pub
lic D
iscl
osur
e A
utho
rized
Pub
lic D
iscl
osur
e A
utho
rized
Pub
lic D
iscl
osur
e A
utho
rized
35692v 2
Pub
lic D
iscl
osur
e A
utho
rized
Pub
lic D
iscl
osur
e A
utho
rized
Pub
lic D
iscl
osur
e A
utho
rized
Pub
lic D
iscl
osur
e A
utho
rized

Decentralizedthe poorservice delivery forhh
V O L U M E I I : B A C K G R O U N D P A P E R S
Portada_Falsa.indd 3Portada_Falsa.indd 3 7/28/06 1:44:23 AM7/28/06 1:44:23 AM
Decentralized Service Delivery for the Poor Copyright © 2006 by The International Bank for Reconstruction and Development / The World Bank 1818 H Street, N.W. Washington, D.C. 20433, U.S.A. All Rights Reserved Manufactured in Mexico City First Printing: August, 2006 The findings, interpretations, and conclusions expressed in this book are entirely those of the authors and should not be attributed in any manner to the World Bank, to its affiliated organizations, or to members of its Board of Executive Directors or the countries they represent. The World Bank does not guarantee the accuracy of the data included in this publication and accepts no responsibility for any consequence of their use. The boundaries, colors, denominations, and other information shown on any map in this volume do not imply on the part of the World Bank Group any judgment on the legal status of any territory or the endorsement or acceptance of such boundaries. The material in this publication is copyrighted. The World Bank encourages dissemination of its work and normally will promptly grant permission to reproduce portions of the work. For permission to reprint individual articles or chapters, please fax a request with complete information to Gabriela Aguilar, Communications Officer – The World Bank Colombia and Mexico Fax (55) 5480‐4222. All other queries on rights and licenses should be addressed to the Communications Officer, The World Bank Mexico at the above faxed to (55) 5480‐4222. Printing and Manufactured in Mexico City / 2006 The World Bank ‐ Mexico Edition: Marcela Rubio Sanchéz Design: Alejandro Espinosa Photographic: Adrian Mealand ; The World Bank’s photo library The World Bank ‐ Mexico World Bank Decentralized Service Delivery for the Poor. – Mexico : The World Bank, 2006. 2 vol. il. – (Report No. 35692) Content: vol. 1. Core report. – vol. 2. Background papers 1. Education – Decentralization – Mexico. – 2. Health – Decentralization – Mexico. – 3. Infrastructure (Social) ‐ Decentralization – Mexico. – Rural Development ‐ Mexico
351.0972 / W67 / 2006

Decentralized Service Delivery for the Poor i
Preface
The collaboration between the Government of Mexico (GOM) and the World Bank on poverty has four objectives: (i) to assist the GOM in improving the effectiveness of its programs in reducing poverty; (ii) to support the analysis and design (or redesign) of specific policy instruments; (iii) to build capacity, especially in evaluation techniques and processes; and (iv) through workshops, to share best practice in poverty reduction policies in a national and international context. The combination of demand‐driven analytical work and capacity building is designed to strengthen the government’s institutional capacity to implement policies that bring about effective poverty reduction results on the ground.
The results of the first phase of the Programmatic Poverty Work of the World Bank in Mexico were published in 2004: Poverty in Mexico: an Assessment of Conditions, Trends, and Government Strategy (World Bank, 2004). The second report was published in 2005: Income Generation and Social Protection for the Poor, which summarized and consolidated the findings of three World Bank studies on poverty issues in Mexico written as part of the second phase work: Urban Poverty, Rural Poverty, and Social Protection.
This report is structured in two Volumes. Volume I is a cross‐sectoral report—the Core Report. The first part includes the program and performance overview which describes the programs (including their poverty goals) and their process of decentralization, the overview of expenditures, the access of the poor to these services, and the evidence on the quality of services. The second part of the Core Report is on the institutional dimensions of decentralized service delivery which includes the WDR 2004‐type framework of accountability, adapted to the situation in Mexico. Volume II contains the sectoral pieces.
The third phase of the Poverty Work was coordinated by Steven Webb and Gladys López‐Acevedo. Team members included Marcela Rubio, Mark V. Hagerstrom, Harry Patrinos, Vicente García‐Moreno, April Harding, María Luisa Escobar, Anna Wellenstein, Luis Andrés, Angélica Núñez, José María Caballero, David Rosenblatt, and Christian González. Specific inputs were provided by Armando Arredondo, Jesús Álvarez, John Scott, Carlos Mancera, Michael Walton, and Carlos Moreno. Elizabeth Forsythe assisted with the editing.
This report has greatly benefited from the comments received from the Social Cabinet, Presidencia, the Ministry of Finance, and the peer reviewers: Margaret Grosh (Lead Economist), Yasuhiko Matsuda (Senior Public Sector Specialist) Alain de Janvry (Professor from the University of California at Berkeley and Consultant), and Maria Emilia Freire (Regional Advisor). Participants at the review meetings provided comments, including Guillermo Perry, Humberto López, and Ariel Fiszbein. Special thanks to Michael Walton for his insightful comments to this report.
Decentralized Service Delivery for the Poor ii
We would also like to acknowledge the valuable contributions made by our Government counterparts, especially: Antonio Ruiz (SAGARPA); Félix Vélez, Gustavo Merino, Miguel Angel López, and Germán Palafox (SEDESOL); Rafael Freyre, Felicia Knaul, and Silvia Schmelkes (SEP); Debora Schlam, María Cecilia Hernández, José Luis Meixueiro, Patricia Cravioto, and Miguel Angel González (SHCP); Tábata Vilar (Social Cabinet); and Eduardo González Pier, Héctor Peña, and Rafael Lozano (SSA).
The Vice President for Latin America and the Caribbean is Pamela Cox; the Country Director for the Mexico and Colombia Unit is Isabel Guerrero; the Sector Director for Poverty Reduction and Economic Management in Latin America and the Caribbean is Ernesto May; Sector Leader for PREM in the Mexico and Colombia Unit is David Rosenblat; and the Task Managers are Steven Webb and Gladys López‐Acevedo.

Decentralized Service Delivery for the Poor iii
TABLE OF CONTENTS
BASIC EDUCATION Mark V. Hagerstrom (LCSHD) SERVICIOS DE SALUD PARA LOS POBRES EN UN CONTEXTO DESCENTRALIZADO: EL CASO MEXICANO Armando Arredondo, Carlos Hernández, and Carolina Álvarez (Instituto Nacional de Salud Pública) SEGURO POPULAR INCIDENCE ANALYSIS John Scott (Centro de Investigación y Docencia Económica) SOCIAL INFRASTRUCTURE: FONDO DE APORTACIONES PARA LA INFRAESTRUCTURA SOCIAL Anna Wellenstein, Angélica Núñez, and Luis Andrés (LCSFP) MEXICO: DECENTRALIZATION OF RURAL DEVELOPMENT PROGRAMS José María Caballero (LCSER)
1
49
147
167
223

Decentralized Service Delivery for the Poor iv
Acronyms and Abbreviations AGEs Apoyos a la Gestión Escolar School Management Support Program ARD Desarrollo Rural y Agrícola Agriculture and Rural Development AVIS Años de vida saludables Healthy Life Years CDDRS Consejos Distritales de Desarrollo Rural Sustentable District Councils of Rural Sustainable Development CEDRS Consejos Estatales de Desarrollo Rural Sustentable State Councils of Rural Sustainable Development CES Comité Estatal de Salud Health State Committee CIDRS Comisión Intersecretarial para el Desarrollo Rural Sustentable Interministerial Commission for Rural Sustainable Development CMDRS Consejos Municipales de Desarrollo Rural Sustentable Municipal Councils for Rural Sustainable Development CONAFOR Consejo Nacional Forestal National Forestry Council CNA Comisión Nacional del Agua National Water Commission CNPS Consejo Nacional de Protección Social National Commission of Social Protection CNPSS Comisión Nacional de Protección Social en Salud National Commission of Social Protection in Health CONAFE Consejo Nacional de Fomento Educativo National Council for Educational Support

Decentralized Service Delivery for the Poor v
CONAPO Consejo Nacional de Población National Population Council COPLADE Comités para la Planeación del Desarrollo en los Estados State Development Planning Councils COPLADEMUN Consejos de Planeación Municipal Municipal Planning Councils CSS Coordinación de Servicios de Salud Health Services Coordination DGE Dirección General de Evaluación General Direction for Evaluation ENHRUM Encuesta Nacional de Hogares Rurales de México National Rural Households Survey of Mexico ENIGH Encuesta Nacional de Ingresos y Gastos de los Hogares National Household Income and Expenditure Survey FAEB Fondo de Aportaciones para la Educación Básica Basic Education Fund FAETA Fondo de Aportaciones para la Educación Técnica y de Adultos Technical and Adult Education Fund FAIS Fondo de Aportaciones para la Infraestructura Social Social Infrastructure Fund FAM Fondo de Aportaciones Múltiples Multiple Uses Fund FAO Food and Agriculture Organization FASSA Fondo de Aportaciones para los Servicios de Salud Health Services Fund FAPPA Programa para el Apoyo a Proyectos Productivos Program for the Support to Productive Projects FIRCO Fideicomiso de Riesgo Compartido Shared Risk Trustfund

Decentralized Service Delivery for the Poor vi
FISE Fondo para la Infraestructura Social Estatal State Social Infrastructure Fund FISM Fondo para la Infraestructura Social Municipal Municipal Social Infrastructure Fund FONAES Fondo Nacional de Apoyo a las Empresas en Solidaridad National Support Fund for Firms in Solidaridad IM Índice de marginación Marginality Index IMSS Instituto Mexicano de Seguro Social Mexican Institute for Social Security INEE Instituto Nacional para la Evaluación de la Educación National Institute for Education Evaluation INEGI Instituto Nacional de Estadística, Geografía e Informática National Institute of Statistics, Geography, and Information INSP Instituto Nacional de Salud Pública National Public Health Institute IRA Infección Respiratoria Aguda Acute Respiratory Disease ISSSTE Instituto de Seguridad y Servicios Sociales de los Trabajadores del Estado Security and Social Services Institute for the State Workers LCF Ley de Coordinación Fiscal Fiscal Coordination Law LDRS Ley de Desarrollo Rural Sustentable Law of Sustainable Rural Development MIDAS Modelo Integrado de Atención a la Salud Integrated Health Attention Model OLS Ordinary least squares ORFIS Órgano de Fiscalización Superior Comptroller’s Office

Decentralized Service Delivery for the Poor vii
PAN Partido Acción Nacional National Action Party PAFEF Programa de Apoyos para el Fortalecimiento de las Entidades
Federativas Support Program for the Strengthening of the States PAPIR Programa de Apoyo a los Proyectos de Inversión Program for Investment Projects Support PEA Población económicamente Activa Econonomically Active Population PEC Programa de Escuelas de Calidad Program of Schools of Quality PISA Program for International Student Assessment PRD Partido de la Revolución Democrática Democratic Revolution Party PRI Partido Revolucionario Institucional Institucional Revolutionary Party PRODESCA Programa de Desarrollo de Capacidades Program for the Development of Capacities PRODEFOR Programa para el Desarrollo Forestal Program for Forestry Development PRODEPLAN Programa de Plantaciones Forestales Comerciales Program for Commercial Forestry Plantations PROFEMOR Programa de Fortalecimiento de Empresas y Organizaciones Rurales Program for Rural Firms and Organizations Strengthening PROMUSAG Programa de la Mujer en el Sector Agrario Program for Women in the Agrarian Sector PRONASOL Programa Nacional de Solidaridad National Solidarity Program RD Desarrollo Rural Rural Development

Decentralized Service Delivery for the Poor viii
RDP Programa de Desarrollo Rural de la Alianza Alianza’s Rural Development Program SAGARPA Secretaría de Agricultura, Ganadería, Desarrollo Rural, Pesca y
Alimentación Ministry of Agriculture, Livestock, Rural Development, Fishery,
and Alimentation SCT Secretaría de Comunicaciones y Transportes Ministry of Communications and Transports SEDESOL Secretaría de Desarrollo Social Ministry of Social Development SE Secretaría de Economía Ministry of Economy SEMARNAT Secretaria de Medio Ambiente y Recursos Naturales Ministry of Environment and Natural Resources SEP Secretaría de Educación Pública Ministry of Public Education SHCP Secretaría de Hacienda y Crédito Público Ministry of Finance and Public Credit SNTE Sindicato Nacional de Trabajadores de la Educación Teachers’ Union SRA Secretaría de la Reforma Agraria Ministry of the Agrarian Reform SSA Secretaría de Salud Ministry of Health STPS Secretaría de Trabajo y Previsión Social Ministry of Labor and Social Provision UTOE Unidad Técnica de Operación Estatal de Alianza Technical Unit of Alianza State Operation

Decentralized Service Delivery for the Poor 1
BASIC EDUCATION
Mark Hagerstrom
PERFORMANCE
• Net enrollment at the primary level is nearly universal, and more children are completing primary education. Success at that level is increasing demand for secondary level schooling and access by the poor at the lower secondary level is a concern.
• Quality is low in comparison to other OECD countries. While level of income is an important factor, Mexico is below the curve in terms of results/per capita GDP.
• Results have declined with incorporation of more disadvantaged students in the short term at the lower and upper secondary level (among 15‐year‐olds).
• Equity in results is high in comparison to other LAC middle income countries. Greater equity is seen across states, within schools and across socioeconomic groups, even as compared to some OECD countries.
EXPENDITURES
• Public spending on basic education has increased to 5.7 percent of GDP in 2005, from 3.7 percent in 1990. The share devoted to basic education has increased and now accounts for 72 percent of educational spending.
• The current system for financing, relying heavily on federal transfers combined with little control over human resource management by the states, does not promote efficiency and quality. Mexico is left with a very generous remuneration system compared to most other countries, but with no guarantee that this results in quality teaching.
• Spending on basic education is concentrated in personnel cost, which account for more than 90 percent of the total. Mexico spends less on complementary inputs than more successful performers.
• Spending is not clearly correlated with results in Mexico, which is also below the curve in regards to performance relative to per student expenditures.

Decentralized Service Delivery for the Poor 2
INSTITUTIONAL ARRANGEMENTS
• Decentralization created policy space is only slowly being exploited by a few states. Analysis shows that institutional innovations can help improve performance.
• State‐level innovations can feedback positively into the national system.
• At the policy level, greater voice and participation can counterbalance resistance of organized labor to reform and increase local resource mobilization for non‐salary expenditures.
• At the school level, greater community participation is correlated with better results.
• Assessment and public dissemination can foster greater voice and participation, and provide feedback and benchmarking for schools.
• Further administrative decentralization to the municipal level has not been shown to have a strong direct impact on improving quality, but has been used by some states to free up resources for complementary inputs through efficiency and transparency gains.
• Pedagogical decentralization has a positive impact on performance.
• Non‐competitive hiring practices and control by organized labor remains a major constraint to improving teacher quality and learning outcomes.
FEDERAL COMPENSATORY PROGRAMS
• CONAFE has expanded significantly and now serves 25 percent of schools, with positive results in closing learning gaps.
• Oportunidades has helped increased continuation rates between primary and lower secondary and improved equity.
• Telesecundaria programs show bad quality that is getting worse, yet is fastest growing sector to accommodate the increasing enrollment of poor rural students. A detailed review is needed.
• The Multicultural/Bilingual Program has implementation problems, but has the shown highest increase in scores for public schools over the past five years.
• Quality Schools Program (PEC) is expanding to 10 percent of schools and the design focuses on school autonomy, participation, and local resource mobilization are being scaled‐up by several states.
• Carrera Magisterial is a teacher quality improvement program that has yet to demonstrate positive results in learning after 15 years of implementation.

Decentralized Service Delivery for the Poor 3
CONCLUSIONS
• The focus of the better performing states and compensatory federal programs on schools, accountability, participation, evaluation, teacher training and increased inputs is backed up by hard evidence from national and international experiences.
• The National Agenda for Action should promote increased school autonomy, improved accountability and learning from assessments (international, national and state), which have been shown to favor the poor.
• Policy options within the current framework would include evaluation and dissemination of “best practices” at the state level and identification and evaluation of federal programs that would support implementation by other states, including channeling the flow of resources directly to schools and requiring matching grants.
• Policy options that would require changes in the current framework to accelerate improvements would include changes in the system of transfers to promote improved performance, reforming teacher work rules, and shifting hiring responsibilities closer to the school, perhaps devolved more fully to the states in the short term.

Decentralized Service Delivery for the Poor 4
I. INTRODUCTION
This paper reviews the delivery of basic education services to the poor in the context of decentralization. Because of the importance of education in alleviating poverty and due to the fact that some 70 percent of students in public education are from poor families, the study looks at the overall system for public basic education, as well as federal programs specifically targeted to poor and disadvantaged groups. The first section presents the rationale for including basic education, the basic outlines of the decentralization process begun in 1992, and the performance of basic education in terms of coverage, efficiency, equity and quality focusing on the past 15 years. The second section looks at the expenditures in basic education and their relation to performance. The third section looks at the institutional arrangements for service delivery and their evolution under decentralizing and the variation among states as to their performance and lessons learned. The fourth section looks at federal compensatory programs, their performance and lessons learned with regards to service delivery to the poor. The final section provides overall conclusions, policy options, and international experience.
Why include Basic Education in the Study? While it is not formally a poverty‐targeted program, basic education (primary and lower‐secondary) is fundamental for poverty alleviation. First, education is a major determinant of earnings; lack of it or low quality education contributes greatly to earnings inequality. Overall, returns to schooling, or the increase in income associated with an additional year of schooling, in Mexico, tend to fluctuate. However, returns have remained remarkably high over time as compared to other middle income countries (Psacharopoulos and Patrinos 2004). Secondly, education appears to compensate for lack of skills; that is, returns are highest for people at the bottom of the wage distribution (Patrinos and Metzger 2004; Zamudio 2001).

Decentralized Service Delivery for the Poor 5
Figure 1. Mexico Returns to Schooling by Income Quantile, 2002
0
2
4
6
8
10
12
10th Bottom 25th 50th 75th 90th Top
Percentiles
%
Source: Patrinos and Metzger 2004.
Moreover, there is evidence that quality of education increases these returns. Preliminary findings in Mexico show that the earnings of those educated in states with higher quality schools, as measured by variables such as teacher‐student ratios, teachers’ schooling and test scores, are positively impacted. Controlling these variables for indigenous and community schools shows a negative impact on earnings for these populations (Garcia, Knaul and Patrinos 2005).
Of course, the benefits of education to the poor go far beyond income. A review of data from developing countries shows that there are many social effects of education: including such relationships as a likely positive link between one’s own schooling and the schooling received by one’s children; a positive association between schooling and health status; a positive relationship between education and the efficiency of consumer choices; a relationship between schooling and fertility choices; and a relationship between schooling in one’s neighborhood and youth decisions regarding education, non‐marital childbearing and participation in criminal activities (Wolfe and Haveman 2001). The school environment is not limited to imparting academic learning. It also provides a crucial forum for children and youth to gain life skills, including citizenship, participation in economic activity and the ability to make informed decisions throughout their lives. Education also has powerful synergistic effects on other development objectives, including protection of the environment, better health, and good governance. It is also one of the most effective preventive weapons against HIV/AIDS (Sen 1999).
Basic education also warrants inclusion in this poverty study, because, de facto, it is a poverty program, with an estimated 70 percent of public school students (90 percent of the total) coming from poor families. With increasing access to the children of poor

Decentralized Service Delivery for the Poor 6
families, this share is on the rise. Indeed, public spending in basic education is one of the most equitable expenditures in Mexico (World Bank, 2004b). Moreover, given the absolute level of spending, basic education has a larger redistributive impact on household expenditures than any other public expenditure.
In summary, the performance and prospects of the system warrant analysis as one of the public sector’s most important tools for alleviating poverty.
Program and Performance Overview
As of 2000, average educational attainment of the total Mexican population aged 15 and over (adult population) was 7.3 years as compared with 7.6 in Chile, Uruguay, and Peru; 8.8 in Argentina; and 10 to 12 years for other, advanced OECD countries. Only 19 percent of the population 15 years or older completed upper secondary school. About 52 percent of the adult population in Mexico lacked the minimum basic skills and knowledge required for Mexico to remain a competitive economy, especially a knowledge‐based economy competing in global markets (World Bank 2003).
Decentralization of Basic Education
One of the most important developments in Mexico in recent years is the decentralization of its basic education system. In May 1992, the Federal Government, together with the 31 state governments and the National Union of Education Workers (SNTE), signed the National Agreement for the Modernization of Basic Education (ANMEB). The three main lines of action for the decentralization of basic education included: the reorganization of the basic education system, the reformulation of content and the revaluation of the teaching function.
For the states, decentralization meant the transfer of responsibility and budgets for almost, at that time, 113,000 institutions, 650,000 teachers, facilities, real estate, and materials.1 About 88% of financing for the system comes from federal transfers which cover, in theory, wages and some investment and operational costs, with a large variation in what individual states contribute, depending upon whether they continue to operate their own state systems (a full 26 states have such systems, which cover between 3 and 55 percent of teachers).
Noteworthy in the agreement is that wage negotiation with organized labor remains centralized and that increases in the number of teachers in the “federalized” system requires federal agreement, as both are linked to the amount and allocation of transfers.
1 Excluding Mexico D.F., which remains to date a subsecretariat within the Federal Ministry.

Decentralized Service Delivery for the Poor 7
In conjunction with being freed from direct responsibility for operating schools, the Federal Government began to reorient itself strategically towards promoting quality and equity with a series of measures during the past decade:
• Curricular reform that wholly reorganized the content and materials for basic education.
• Increasing the provision of teaching and learning materials, including large classroom libraries in most schools, and textbooks in indigenous students’ native language.
• Introducing information and communication technology in both primary and secondary schools through the use of satellite systems, technology‐based teacher‐in‐service training and new computers in schools.
• Creating the Teacher Career Program (Carrera Magisterial) and linking pay incentives to professional development and student outcomes.
• Emphasizing demand‐ and supply‐side interventions to promote rural education, including, for example, SEDESOL’s Progresa (now Oportunidades), and compensatory programs through the Consejo Nacional de Fomento Educativo (National Council for Educational Development, CONAFE).
• Promotion of quality and local participation through the Quality Schools Program (Programa Escuelas de Calidad, PEC), which focuses on disadvantaged urban and rural schools through an innovative school‐based management initiative.
Finally, the agreement also broke new ground by explicitly and legally supporting the advancement of parental participation in schools by mandating the establishment of school‐level social councils. Subsequently, in 1999 the National Social Participation Council was established.
II. COVERAGE AND EFFICIENCY
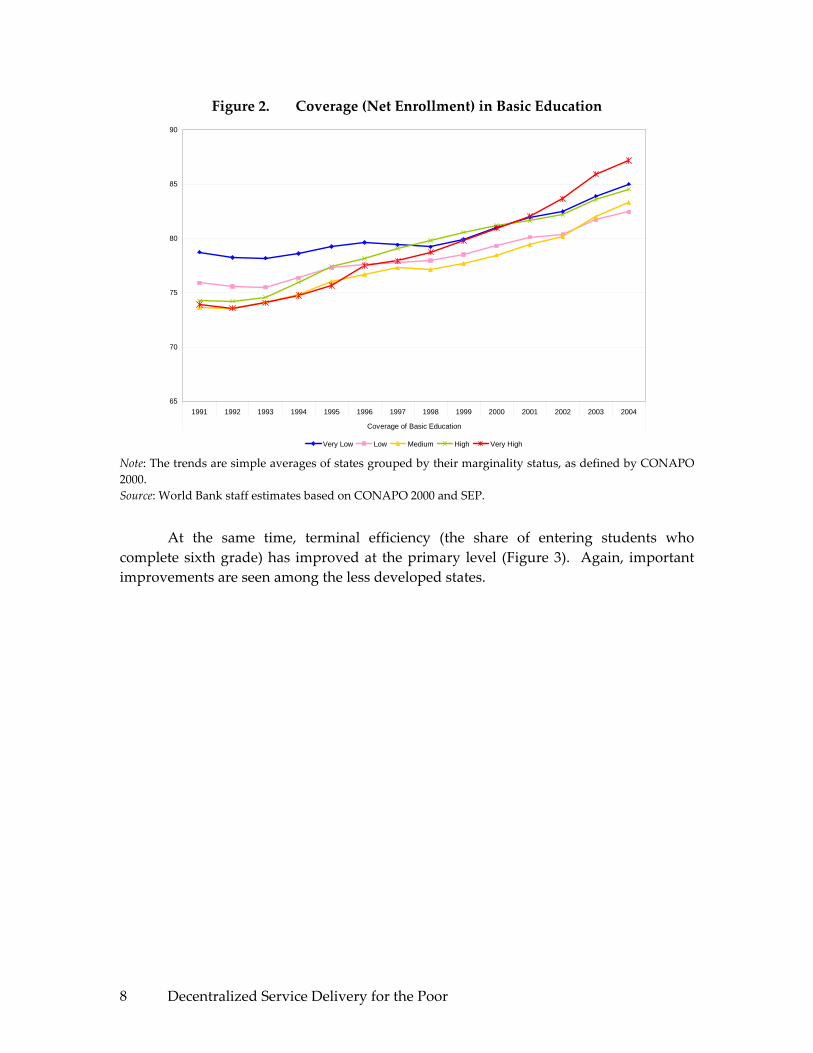
In the last fifteen years, Mexico has made substantial progress in expanding access to primary and secondary education, especially in poor rural areas. Increased coverage has been particularly impressive in the less developed regions of the country and the gaps between richer and poor states have declined or been eliminated.2
2 For figures 2, 3 and 4, an index of marginality among states for the Year 2000 is used: Very Low: Federal District, Nuevo Leon, Baja California and Coahuila; Low: Aguascalientes, Baja California Sur, Chihuahua, Jalisco, Sonora, Tamaulipas, Colima and Mexico; Average: Quintana Roo, Morelos, Tlaxcala, Durango, Queretero, and Sinaloa; High: Nayarit, Guanajuato, Zacatecas, Yucatan, Michoacan, Tabasco, Campeche, Puebla and San Luis Potosi; Very High: Hidalgo, Veracruz, Oaxaca, Guerrero and Chiapas.
Decentralized Service Delivery for the Poor 8
Figure 2. Coverage (Net Enrollment) in Basic Education
65
70
75
80
85
90
1991 1992 1993 1994 1995 1996 1997 1998 1999 2000 2001 2002 2003 2004
Coverage of Basic Education
Very Low Low Medium High Very High Note: The trends are simple averages of states grouped by their marginality status, as defined by CONAPO 2000. Source: World Bank staff estimates based on CONAPO 2000 and SEP.
At the same time, terminal efficiency (the share of entering students who complete sixth grade) has improved at the primary level (Figure 3). Again, important improvements are seen among the less developed states.

Decentralized Service Delivery for the Poor 9
Figure 3. Terminal Efficiency in Primary School
50
55
60
65
70
75
80
85
90
95
100
1990 1991 1992 1993 1994 1995 1996 1997 1998 1999 2000 2001 2002 2003 2004
Terminal Efficiency in Primary School
Very Low Low Medium High Very High Note: The trends are simple averages of states grouped by their marginality status, as defined by CONAPO 2000. Source: World Bank staff estimates based on CONAPO 2000 and SEP.
However, a very volatile and less steep upward trend in terminal efficiency has been experienced at the lower‐secondary level (students 12‐14).

Decentralized Service Delivery for the Poor 10
Figure 4. Terminal Efficiency in Lower Secondary
70
72
74
76
78
80
82
84
86
1990 1991 1992 1993 1994 1995 1996 1997 1998 1999 2000 2001 2002 2003 2004
Terminal Efficiency in Secondary School
Very Low Low Medium High Very High Note: The trends are simple averages of states grouped by their marginality status, as defined by CONAPO 2000. Source: World Bank staff estimates based on CONAPO 2000 and SEP.
This performance is encouraging, both in terms of the overall system and the closing of the gaps between the more marginal and less marginal states. Indeed, at the primary level, there is now little significant difference in net enrollment between urban and rural and poor and non‐poor students. Major gaps, however, do remain at the lower secondary level for the poor (Table 1).
Table 1. Enrollment Rates in Basic Education, 2004 Primary (ages 6–11) Lower secondary (ages 12–14) Poverty status Urban Rural National Urban Rural National Extreme poor 94.5 93.8 94.1 59.0 54.0 55.9 Moderate poor 96.1 96.8 96.4 74.1 66.8 71.2 Non‐poor 95.1 95.6 95.2 81.9 84.5 82.8 Total 95.4 95.3 95.4 75.5 68.2 72.3 Note: Poverty calculated using SEDESOL’s food‐ and asset‐based poverty lines and current income per capita, using trimester income as reported by INEGI. Urban areas are localities with 15,000 inhabitants or more, using INEGI’s classification. Source: World Bank staff calculations from ENIGH 2004.

Decentralized Service Delivery for the Poor 11
III. QUALITY
Rigorous analysis of the quality (defined here as student performance and its determinants) of the education being provided is relatively recent in Mexico. Available empirical evidence systematically reveals low levels of education achievement. Over the years, there has been an accumulation of data from tests given to samples of students at all educational levels, especially in primary schools. Unfortunately, these tests are generally not comparable over time, and there has been little effort to analyze the results and, until recently, very little information was disseminated. Today researchers have access to standardized tests that have been conducted by the General Directorate for Evaluation (DEG) in Mexico’s Secretariat of Public Education (SEP) since 1998. Since then, significant amounts of data have been collected and the technical capacity for measuring learning achievement has been developed.
Mexico’s participation in the OECD’s Program for International Student Assessment (PISA), beginning in 2000, provides a good basis for measuring, benchmarking, and assessing the determinants of the quality of education. PISA provides a measure of reading, mathematics and science achievement for a nationally representative sample, comparable across countries. PISA’s assessment focuses on young people’s ability to apply their knowledge and skills to real‐life problems and situations, rather than on how much curriculum‐based knowledge they possess.
Students from Mexico and other Latin American countries were amongst the worst performers. Overall, Mexican students, on average, perform as well as students from other Latin American (LAC) countries that participate on the PISA exam. In comparison to other participating countries, Mexico, on the PISA 2000, outperformed only three countries: Indonesia, FYR Macedonia, and Albania. Although students in high‐income countries generally perform better than low and middle‐income countries, wide variation remains.
On the 2003 PISA, overall, scores on all three subjects fell significantly. From Latin America, only Mexico, Brazil and Uruguay repeated the test. In comparison to other participating countries, Mexico outperformed only Indonesia, Tunisia, and Brazil in mathematics; Indonesia and Tunisia in reading; and Indonesia, Brazil and Tunisia in science. However, it should be noted that in Mexico more students participated in the 2003 PISA exam: 30,000, as compared to 4,600 in 2000. Also, Mexico increased enrollments among 15‐year‐olds, from 51.6 percent in 2000 to 56.1 percent in 2003. Mexico’s overall performance was as follows: there was a five percent decrease in reading scores; a 0.5 percent decrease in math scores; and a four percent decrease in science scores. This fall in scoring is associated with a 9 percent increase in enrollment.
In reading, 25 percent of Mexican students are below level 1 (level one being the lowest, and level six the highest, in terms of competencies), a result that is significantly

Decentralized Service Delivery for the Poor 12
worse than the OECD average of only 7 percent. Students at level 1, according to OECD, may be able to read but have not acquired the skills to use reading for learning. Less than 1 percent of students in Mexico are at level 5, a level at which they are able to evaluate information, build hypotheses, draw on specialized knowledge, and accommodate concepts contrary to expectations (Table 1). In contrast, on average, 8 percent of OECD students are at level 5. While 58 percent of students in OECD countries are either at or above Level 3 proficiency, only 20 percent of Mexican students are at or above Level 3. By comparison, Korea, which is one of the top performers, registers 77 percent at or above Level 3. In Mexico, similarly poor results are recorded in math (Table 2).
Table 2. Students by Level of Reading, selected countries (percent), PISA 2003 Country Below Level 1 Level 1 Level 2 Level 3 Level 4 Level 5Brazil 26.9 23.1 25.2 16.5 6.3 1.9Canada 2.3 7.3 18.3 31 28.6 12.6Italy 9.1 14.8 24.9 28.3 17.8 5.2Korea 1.4 5.4 16.8 33.5 30.8 12.2Mexico 24.9 27.1 27.5 15.6 4.3 0.5Spain 7.4 13.7 26.1 29.6 18.2 5United States 6.5 12.9 22.7 27.8 20.8 9.3Uruguay 20.2 19.6 23.9 19.8 11.2 5.3OECD average 6.7 12.4 22.8 28.7 21.3 8.3
Table 3. Students by Level of Math, selected countries (percent), PISA 2003 Country Below Level 1 Level 1 Level 2 Level 3 Level 4 Level 5 Level 6Brazil 53.3 21.9 14.1 6.8 2.7 0.9 0.3Canada 2.4 7.7 18.3 26.2 25.1 14.8 5.5Italy 13.2 18.7 24.7 22.9 13.4 5.5 1.5Korea 2.5 7.1 16.6 24.1 25 16.7 8.1Mexico 38.1 27.9 20.8 10.1 2.7 0.4 0.0Spain 8.1 14.9 24.7 26.7 17.7 6.5 1.4United States 10.2 15.5 23.9 23.8 16.6 8 2Uruguay 26.3 21.8 24.2 16.8 8.2 2.3 0.5OECD average 8.2 13.2 21.1 23.7 19.1 10.6 4
While Mexico is characterized by low relative results, these results have a very low dispersion, as compared to Brazil and Uruguay.3 If we look at the difference 3 The level of equity in Mexico has been a subject of debate. While some have noted (OECD, 2005) that Mexico’s enrollment is much lower than comparators such as Brazil, with many of the more disadvantaged children not attending school, simulations using the change in enrollment between PISA 2000 and 2003, indicate that while dispersion increased, Mexico remains in the quadrant occupied by countries with relatively low test score inequality and is not significantly different than Portugal and Spain. Additional

Decentralized Service Delivery for the Poor 13
between the top 5 percent and the bottom 5 percent, Figure 5 provides the results for math (reading and science show similar patterns).
Figure 5. Math Scores and Dispersion across Countries, PISA 2003
300
350
400
450
500
550
600
240 260 280 300 320 340 360 380
Dispersion (difference between top and bottom 5%)
Scor
e
MEXICO
Finland
Indonesia
Thailand
Tunisia
Serbia
Uruguay
Brazil
Turkey
Greece
Belgium
US
Italy
Hong Kong
GermanyIreland
Canada
Latvia
Macao
Korea
Netherlands
RussiaPortugal
Japan
Czech
Australia
HungarySwedenIceland
Denmark
Poland
Spain
SwitNew Zealand
Norway
AustriaFrance
The low dispersion in results is also seen among states. While there is a small group (3‐4) states of high relative performers, and a low performance group (4‐5), the vast majority of states in Mexico have broadly similar results. Within state dispersion appears to be a major issue in at least three states, but these are not clustered in any one performance group.
analysis based on relative performance by socioeconomic groups (Hamid, 2000), showed significantly less variation in Mexico as compared in Argentina and Brazil.

Decentralized Service Delivery for the Poor 14
Figure 6. Means of the Math Test Scores in PISA, by State, 2003
PISA results also indicate that in the Mexican education system, socioeconomic status is less of a determinant in the results, particularly as compared to other Latin American middle‐income countries such as Brazil and Argentina.

Decentralized Service Delivery for the Poor 15
Figure 7. Socio‐Economic Status
Note: Differences in the effect of socio‐economic conditions between the richest and the poorest (in terms of performance) measured by quintiles by country Source: World Bank calculations based upon PISA 2000 data
What then accounts for high equity in Mexico and what are the policy implications? International experience might provide some evidence. In the case of Korea, a high performer with very low dispersion in text scores, this could be the result of the secondary school equalization policy, which aims and achieves high performance and low inequality. While Mexico does not have such an equalization policy at the secondary level, there is evidence of specific policy interventions that tend to increase equity at the basic education level. SEP’s compensatory education interventions target schools in disadvantaged rural areas and increase resource allocations for those schools to give students more equal opportunities. Compensatory education programs tend to decrease dispersion in scores. Perhaps the cumulative impact of compensatory education from basic education is carried over to lower secondary schools, and explains in part the high equity observed in PISA results. On the policy front, this suggests the need to retain and expand the focus on schools, as opposed to students, for improving quality. It also means that with such high levels of equity there is more leeway for introducing quality measures usually associated with increased inequalities, such as more advanced technology.
-20 -10
0 10 20 30 40 50 60
Q10
Q25
Q50
Q75
Q90
Q10
Q25
Q50
Q75
Q90
Q10
Q25
Q50
Q75
Q90
Q10
Q25
Q50
Q75
Q90
Q10
Q25
Q50
Q75
Q90
Q10
Q25
Q50
Q75
Q90
Q10
Q25
Q50
Q75
Q90
Q10
Q25
Q50
Q75
Q90
Argentina Brazil Chile Indonesia Korea Mexico Peru Thailand

Decentralized Service Delivery for the Poor 16
Finally, while Mexico’s level of development is a major factor in explaining the results, in particular relative to other OECD members, its performance in relation to GDP per capita suggests that it is performing far under its potential.
Figure 8. Performance in Mathematics and GDP per Capita, PISA 2003
0
100
200
300
400
500
600
0 10000 20000 30000 40000 50000 60000
GDP per capita
Ave
rage
Mat
h Sc
ores Mexico
LuxembourgNorwa
Indonesia
Rep. of KoreaJapan
LatviaFrance USA
New
Source: PISA; EdStats
IV. EXPENDITURES AND REVENUES
Public spending in basic education (primary and lower secondary) is strongly pro poor (World Bank, 2004b) and has been increasingly so as enrollment rates are currently almost universal at the primary level. In 2005, the three levels of government spent 5.7 percent of GDP on education, and close to 72 percent of this was allocated to basic education. In 1990, education expenditures were just 3.7 percent of GDP. Figure 9 shows that the three levels of government increased education expenditures from 2004 Mx$10,600 per student in 1992 to Mx$15,500 per student in 2004.4 During the 1994 crisis, there was a substantial drop in spending, and the share financed by states has been increasing over time, while the municipal share has remained very small. The bulk of education spending is budgeted and distributed “inertially,” based on the stock of physical capital and employees belonging to the federal system before decentralization. This allocation does not consider demand of clients, the productivity of suppliers, or poverty.
4 The denominator is the number of students attending public schools only.

Decentralized Service Delivery for the Poor 17
Figure 9. Education Expenditures, 1990‐2005
8,000
9,000
10,000
11,000
12,000
13,000
14,000
15,000
16,000
1992 1993 1994 1995 1996 1997 1998 1999 2000 2001 2002 2003 2004
2004
MXP
per
stu
dent
Federal State Municipal
Source: SHCP.
Despite greater transparency in the allocation of federal transfers, marked differences among states persist in the proportion of federally financed transfers and the states’ own resources spent on basic education. Figure 9 also shows state resources as a proportion of total public spending on basic education. On average, states contribute 22.5 percent of total public spending on basic education apart than those obtained from federal transfers. However, differences among states in this regard remain significant. While states like Baja California and Estado de México contribute more than 40 percent of basic education expenditures, several other states contribute less than 10 percent.
These differences are mainly the result of the number of schools sustained by the state and federal governments before 1992, when the National Agreement for the Modernization of Basic Education was signed. As pointed out previously, the expansion of federal schools occurred at a different pace throughout the country, largely as a result of historical decisions by state and federal authorities. By basing federal transfers after decentralization on the registry of staff and schools transferred to the state government in 1992, the Fiscal Coordination System perpetuates a distribution of federal funds that is not related to the number of students, the cost of the education provided, the relative level of development of the states, educational lags, or the efficiency and quality of educational services, particularly with regard to the expansion of education services sustained by the federal or state governments.

Decentralized Service Delivery for the Poor 18
Figure 10. Public Expenditure per Student on Basic Education, 2002
0 2,000 4,000 6,000 8,000 10,000 12,000 14,000 16,000
PueblaGuanajuato
MéxicoQuerétaro
JaliscoOaxaca
MorelosSan Luis Potosí
HidalgoAguascalientes
ChiapasVeracruz
National AverageGuerreroTabascoYucatán
MichoacánQuintana Roo
SinaloaTlaxcala
ChihuahuaZacatecas
Nuevo LeónDistrito Federal
TamaulipasCampeche
SonoraColima
CoahuilaNayarit
DurangoBaja California
BCS
MxP per student
StateFederal
Source: Bank staff estimates based on data from SEP and SHCP.
There does not seem to be a relationship between expenditure per student and the proportion of federal or state financing (Figure 10).5 While expenditure per student in Baja California and Baja California Sur is almost equal and the highest in the country, in Baja California the state government contributes approximately 42 percent of total expenditure, whereas in Baja California Sur the state contributes barely 4 percent. In contrast, while the state’s contribution in Baja California and Estado de México is in both cases above 40 percent, the expenditure per student in Baja California is more than twice that in Estado de México.
Spending is heavily geared towards personnel costs, and, moreover, Mexican teachers enjoy a favorable position in terms of their earnings relative to per capita GDP.
5 In Figure 10, states are ranked from the one that spends the most per student to the one that spends the least. The proportion paid by the state is not correlated with the amount of total expenditures per student.

Decentralized Service Delivery for the Poor 19
Figure 11. Ratio of Teacher Salary With 15 years Experience Relative to GDP per capita, Year 2000
At more than 90 percent, the share of expenditures devoted to salaries is significantly higher than other OECD countries, which are mostly in the 65‐80 percent range. This is all the more worrisome, given limited access by Mexican students to learning materials and technology at home (less than 10 percent of households have access to a computer). At the same time, while several top performing OECD countries have lower student/teacher ratios than Mexico, Korea for example has about the same ratio (OECD, 2005).

Decentralized Service Delivery for the Poor 20
Figure 12. Distribution of Total and Current Expenditure on Educational Institutions in 2000
0%
20%
40%
60%
80%
100%
KOR
LUX
CH
L (2
)(4)
(6)
USA
NO
R (6
)JA
P (1
)C
ZE SWI
FIN
IRL
UK
FRA
(6)
AUS
DN
KH
UN
(6)
BRA
(6)
GER
(6)
SPA
SWE
POL
(6)
TUR
(6)
GR
C (6
)IT
AN
LD (6
)SV
KAU
TPO
R (6
)M
EX BEL
ARG
Compensation of teachers Compensation of other staf f
Other current expenditure Capital expenditure
1. Post‐secondary non‐tertiary included in both upper secondary and tertiary education. 2. Public institutions only. 3. Year of reference 2001. 4. Year of reference 2003. 5. Post‐secondary non‐tertiary included in tertiary education. 6. The breakdown of compensation of teachers and compensation of other staff is not available. By resource category in primary, secondary and post secondary non‐tertiary education Source: OECD, Education at a Glance 2005.
Figure 13 indicates that in spending for results, in this case math, Mexico lies firmly below the curve. A comparison with Poland is instructive, where the overall spending per student is at about the same level, but where the share of spending for salaries is below 70 percent. Korea and Finland, high performers above the curve, are notable for allocating 40‐45 percent of spending to non‐wage expenditures.

Decentralized Service Delivery for the Poor 21
Figure 13. Math Performance and Expenditure per Student, PISA 2003
0
100
200
300
400
500
600
0 2,000 4,000 6,000 8,000 10,000 12,000
Expenditure per student
Mea
n M
ath
Scor
es Mexico
Brazil
Finland
USA
SwitzerlandPoland
Rep. of Korea
Portugal
AustraliaIreland
Source: PISA; EdStats.
Given these relationships in spending and results in Mexico, it is not surprising that at a more disaggregated level it is difficult to find a correlation between the level of spending and student performance among states.
Figure 14. Average scores in national test for 2002‐2003 of students in sixth grade attending public urban schools
Source: SEP, SHCP e INEE.
V. INSTITUTIONAL DIMENSIONS
The 1992 agreement had little prescription regarding institutional arrangements for service delivery beyond the contract to transfer responsibility to the states. However, this responsibility, albeit with a major role retained by the Federal Government in setting wages and controlling expansion of the workforce, created a potential space for
Lectura
M ICH
CHIHSLP
GRO
QR
ZAC
HGO
VER
JAL
M EX
PUE
YUC
CHIS
OAX
QRO
TAB
NAY
CAM
DGO
N A LM OR
NL
COLSON
COAH
SIN
TAM
B CBCS
TLAX
AGS
GTO
445
450
455
460
465
470
475
480
485
490
495
500
6 7 8 9 10 11 12 13 14 15
Gasto por alumno en 2001 (miles de pesos)
Punt
aje
prom
edio
*
Matemáticas
GTO
AGS
TLAX
BCSB C
TAM
SIN
COAH
SON
COLNL
M ORN A L
DGO
CAM
NAY
TAB
QRO
OAX
CHIS
YUCPUE
M EX
JAL
VER
HGO
ZACQR
GRO
SLP
CHIH
M ICH
380
385
390
395
400
405
410
415
420
425
430
435
6 7 8 9 10 11 12 13 14 15
Gasto por alumno en 2001 (miles de pesos)
Punt
aje
prom
edio
*

Decentralized Service Delivery for the Poor 22
state actions related to institutional arrangements that has only slowly been exploited by few states.
Federal‐State Relations. The Federal Government still retains overall leadership in basic education, in particularly as regards budget, curriculum development and in the creation and implementation of compensatory programs. There is no formal deliberative body that includes state education authorities in the sector. The current administration, however, has attempted to promote consensus among the states with quarterly meetings to discuss the challenges faced by the sector and to promote exchanges among the states.
Human Resource Management. While responsibility for human resource management was largely transferred to the states, the decentralization of basic education did not fundamentally change the role and rights of organized labor. In fact, the retention of wage setting at the federal level and its link to state transfers seriously muddled accountability, both for the teachers and for the states. Furthermore, there were no changes to longstanding civil service regulations that entitle organized labor to select new employees and fill opened vacancies, including supervisory staff.
A comparison of relative wages among countries suggests a very powerful organized labor. Indeed, almost without exception, organized labor at the state level has successfully pressured state governments for additional benefits over and above that granted at the federal level. Several states have, at times, actually called for a recentralization of education because of local difficulties in dealing with organized labor. Others, however, have been able to negotiate labor’s acquiescence to local innovations.
The prior centralized system was characterized by the strong role of organized labor in the political/government apparatus, weak controls from the center, infamous abuses of work rules, and absenteeism. While decentralization (as well as political reform) has set the framework for improving human resource management, only 14 of the states have explicitly instituted administrative measures to increase control over personnel (basically attendance). However, some states have instituted requirements for testing teacher applicants and begun to establish competitive mechanisms for filling new slots under its authority (filling existing slots is uniformly under the control of organized labor).
State School Systems. As noted, some 26 states had their own systems at the time of the decentralization. Of these, about half have been able to integrate these systems together with the federalized schools. Most of the rest are dissuaded because of additional costs associated with equating wage/pension benefits between the two

Decentralized Service Delivery for the Poor 23
systems. In almost all other aspects, there is little formal difference between systems and results.
Further Decentralization. Seventeen states have decentralized administrative functions to regional or municipal levels, and seven have also decentralized pedagogical functions (supervision). Six have gone ever further to provide autonomy to schools.
Monitoring and Evaluation. A systematic approach to monitoring and evaluation was not formally agreed upon at the time of the decentralization. While the federal government implemented an instrument (estandares nacionales) it was rarely used in a meaningful manner to monitor the performance of the system. It was hampered by constant changes that undermined attempts to measure performance over time among students.
The current administration has given much more emphasis to the issue, starting with its participation in the PISA 2000. Subsequently it created the Instituto Nacional para la Evaluación de la Educación (National Institute for the Evaluation of Education, INEE) and reformed its internal structure to create a unit, reporting directly to the Secretary, for planning and studies. For the PISA 2003, it expanded the sample so that the results would be representative at the state level. Mexico’s continued participation on the PISA exam (the next testing will be in 2006) is commendable as several other Latin American countries have decided not to continue, given relatively poor results. Mexico, on the other hand, has embraced this international benchmarking tool and is beginning to use the assessment of the determinants of learning to shape policy. It is also setting high standards for itself by being unique among developing countries in including quality targets in its education MDGs.
The national evaluation system for education is composed of several institutions: the General Directorate for Evaluation (DGE); the State Offices for the Evaluation of Education; the INEE; and NGOs and academic institutions. DGE and INEE are especially important divisions because they are supported by the federal government and assume responsibility for collecting, analyzing, and disseminating information about the education system.
The DGE is a division of the Secretaría de Educación Pública (Ministry of Public Education, SEP), which was formerly in charge of the evaluation system. With the creation of INEE, DGE has been primarily devoted to the evaluation of SEP programs, collecting information for other system participants and informing the State Offices about their performance according to the evaluation results. Specific DGE responsibilities include: evaluation of the professional training and learning outcomes as result of The Teacher Career Program (Carrera Magisterial); testing for admission into lower secondary and teaching schools; children’s knowledge contests; preschool and
Decentralized Service Delivery for the Poor 24
initial education assessment; compensatory program evaluation; evaluating eligibility for applying tests for hiring or promoting teachers; and the Evaluation‐Diagnostic Census for all children at the beginning of the school cycle.
Only eight of the states currently have complementary M&E systems that provide feedback to schools, two of which use them as the basis for school‐level interventions to improve performance.
Do Institutional Variations Among States Matter? Using the same basic model as the World Bank (2005), but adding the institutional variables for each state, one can see how these variables, that can be manipulated by the states, can affect learning outcomes (Detailed results are presented in Annex 1). First, it is shown that further decentralization within the state has a significant impact on learning outcomes. Administrative decentralization – moving state oversight from the state capital to the municipal level – does not have an impact on its own, but pedagogical decentralization – allowing decision making to vary by locality – has a strong, positive, and significant impact. It could be argued that this is because accountability mechanisms that put people at the center of service provision can go a long way in making services work. Focusing on people enables clients to monitor and discipline service providers, amplifies their voice in policymaking, and strengthens the incentives for providers to serve them. The states that have decentralized functions to the municipal and school level seem to have been able to strengthen the short‐route to accountability, thus enabling beneficiaries to directly influence service providers.
Accountability systems – student testing, school rankings, school report cards – are shown to have a strong, positive, and significant impact on learning outcomes even among the poorest states. That is, states that do not rely only on important yet sample survey national student assessments carried out by INEE, controlling for everything else, have higher scores on PISA. Furthermore, authorities that use the results of their state‐wide assessment systems to inform policy, disseminate the results to the school, and use the results to design interventions, have registered a very large, positive and significant impact on learning outcomes. While student evaluations at the state level and evaluation systems that disseminate the results back to the school have positive and significant impacts, the greatest impact comes from more complete systems. Such systems not only use the results to inform policy and disseminate results, but also use the results to design specific interventions; this practice has a very large impact on learning outcomes. This makes it a particularly useful investment given its large contribution to learning outcomes as well as the fact that it is a very cheap (see Hoxby 2002).
State Level Innovation. Further analysis was undertaken among the highest performing states as regards to their efforts to improve the institutional environment.

Decentralized Service Delivery for the Poor 25
Aguascalientes. Many of the innovations of this state were subsequently incorporated into national policy and programs. The state’s efforts at innovation may have been facilitated by not having a significant state school system at the time of decentralization and only one section of organized labor to deal with. In any event, it was one of the early reformers in lengthening the school year to 200 days (several months before national legislation) and extending obligatory education to ten years (while national legislation subsequently increased it to nine years, it wasn’t until 2004 that it was also extended to pre‐school at the national level).
One of its early initiatives was also to further push decentralization of administration and pedagogy to the regional level. One of the benefits of this was to increase control over human resources and to gain fiscal resources (about 9 percent annually) to fund local initiatives. These include a program of teacher training that helped 32 percent of state teachers to pass the first national testing in 1996, as compared to only 8 percent nationwide; scholarships for disadvantaged students; the incorporation of learning technologies in the schools; student testing; and social participation. Indeed, the state’s focuses on school autonomy and parental participation was the genesis for the national program for school quality (PEC), launched by the federal government in 2001. More recent initiatives have included pushing for the incorporation of its schools into the national program Enciclomedia (basically inter‐active textbooks) and a locally‐financed effort to begin teaching English in primary school, in contrast to the national curriculum, where English is only incorporated in lower secondary.
Distrito Federal. Local opposition from organized labor precluded the decentralization in the Federal District. It is currently administrated by a federal decentralized entity. Reform efforts were only initiated in the year 2000, beginning with a diagnostic involving teachers and researchers that established two goals: increase student performance; and put the school at the center of the effort. The first initiative was generalized testing of students and the publication of results at the school level, together with client surveys of parents. School autonomy was pushed via active participation in the PEC, with 25 percent of the schools participating, as compared to 10 percent nationwide. Requirements for school diagnostics and performance plans were generalized and local funding was provided, though at a lower level than PEC.
Along with regionalization, the DF also created a special unit to respond to claims of corruption and abuse and strengthened local accountability through community councils at the school level.
Colima. This state has made notable achievements in student performance through a combination of traditional practices and strategic innovations. A small, well‐connected state, with just two major urban centers, Colima has undoubtedly benefited from these characteristics in its efforts to improve educational outcomes. Continuity has

Decentralized Service Delivery for the Poor 26
been another factor; the same secretary of education has remained in office for the past eight years (and four governors).
The starting point for Colima’s efforts is a well functioning information and planning system that benefits from unique files for each student and modern communications and computation systems. This has allowed for important decentralization to the municipal level; there are ten units providing administrative functions in personnel management, buildings, equipment and materials, and four regional centers in charge of teacher training, which also provide technical assistance.
Prior, and independent from the PEC program, almost all schools have benefited for a number of years from the promotion of school autonomy, with tools for diagnostics and activity planning. Supporting these local initiatives is a rather well developed system of assessment, which tests annually at five different grade levels, in every school. The results are made available for the subsequent school year for each student, grade, school, and municipality and provide for accountability and the targeting of incentives tied to results. The assessment results also provide feedback for quality enhancement activities undertaken by the school.
Local authorities also attribute their performance to two other innovations: competitive testing for half of all new teachers and agreement by organized labor not to rotate teachers during the school year (in other states, such rotations start a chain reaction that can result in some classes having 3‐4 different teachers during the year) .
Nuevo León. At the decentralization, the state had a large local school system, accounting for over 40 percent of teachers. Efforts to integrate the two systems have not been fully realized due largely to incompatibilities between the teacher pension systems, but administratively the two systems were quickly joined to avoid duplication. The management of human resources and dealings with organized labor were given prominence by the creation of a special subsecretariat to deal with these issues. The state was also quick to regionalize administrative functions. To facilitate planning, a far‐reaching information system was created.
An innovative “total quality” program was also created in 1993, which involves “collective leadership” at the school level and support from the private sector. Originally focused on improving management, the program was expanded to pedagogical issues and school‐level programs that were subsequently linked to PEC. Students were evaluated with the results publicized by schools, and feedback was incorporated into school‐level plans. Current plans include establishing a state‐level institute for evaluation patterned on the federal INEE.

Decentralized Service Delivery for the Poor 27
Participation in Nuevo León is notable. Parents, particularly in urban areas, place a high value on the quality of education. Historically the state has been pressured to improve service delivery, generally and at the school level through parent participation. This has apparently been an important force to counterbalance the resistance of organized labor to the reforms. In addition, reforms have been supported by financial contribution from parents and the private sector of roughly $200 million pesos annually.
Quintana Roo. The state did not initiate reform until 1999. Improvements since that time however have been notable, particularly in comparison to other southern states. The centerpiece of its efforts has been at the school level, where directors have been “empowered.” Along with accountability for school performance, directors have undergone extensive training from national and international experts on management, leadership, team work, and strategic planning. Fiscal resources have been channeled directly to schools and 80 percent have been incorporated in PEC. A trust fund has been created for handling contributions from parents and the private sector. An extensive system of student testing has been established for all grades in all schools with the results publicized and used as feedback for local plans aimed at quality improvement.
A state‐level council for social participation has been created with heavy involvement by education specialists and the private sector, which serves as an important counterbalance to resistance from organized labor. Municipal governments have also been enlisted in the effort with agreements to support construction and maintenance of school facilities.
Administrative reforms have facilitated this process, notably with programs of professional development for administrative staff and results‐based budgeting.
VI. FEDERAL COMPENSATORY PROGRAMS
There is a wide variety of federal programs designed to support improved access and quality in education. These include specifically poverty‐targeted supply and demand programs, as well as more general programs. The more important of these are reviewed in this section with regards to their objectives and performance, as well as lessons learned in regard to service delivery.
CONAFE. As early as 1971, Mexico began to address the challenge of including its most disadvantaged children by creating the National Council for Educational Development (CONAFE). In the early 1990s the Secretariat of Public Education (SEP) created the compensatory education programs (CPs) seeking to support the most disadvantaged schools and nearly all indigenous schools. CONAFE implements the CPs, which support more than three million students in pre‐primary, primary education

Decentralized Service Delivery for the Poor 28
and lower secondary education, including about one million indigenous primary school students. CONAFE selects schools for support based on the average income of the school’s community, the school’s isolation and access to public infrastructure, the school’s education indicators and other indicators of poverty. For schools that enroll indigenous students, CONAFE supports development of curricula, didactic materials, and textbooks in an indigenous language and Spanish to facilitate bilingual education. In most beneficiary schools, a group of community parents and leaders receive a grant that can be spent on the educational purpose selected by the group.
The role of CONAFE has increased substantially since the decentralization and its compensatory programs support around 30 percent of the country’s primary schools. Its support for lower‐secondary schools is much lower at around five percent.

Decentralized Service Delivery for the Poor 29
Figure 15. Coverage of CONAFE Programs
Coverage of CONAFE programs in primary education(percentage of total enrollment in primary)
0.0%
5.0%
10.0%
15.0%
20.0%
25.0%
30.0%
35.0%
1992
-93
1993
-94
1994
-95
1995
-96
1996
-97
1997
-98
1998
-99
1999
-00
2000
-01
2001
-02
2002
-03
2003
-04
2004
-05
School year
CO
NAF
E C
over
age
Educacion Comunitaria Compensatory Education
Coverage of CONAFE programs in lower-secondary education(percentage of total enrollment in lower-secondary)
0.00%
1.00%
2.00%
3.00%
4.00%
5.00%
6.00%
7.00%
1998
-99
1999
-00
2000
-01
2001
-02
2002
-03
2003
-04
2004
-05
School year
CO
NAF
E C
over
age
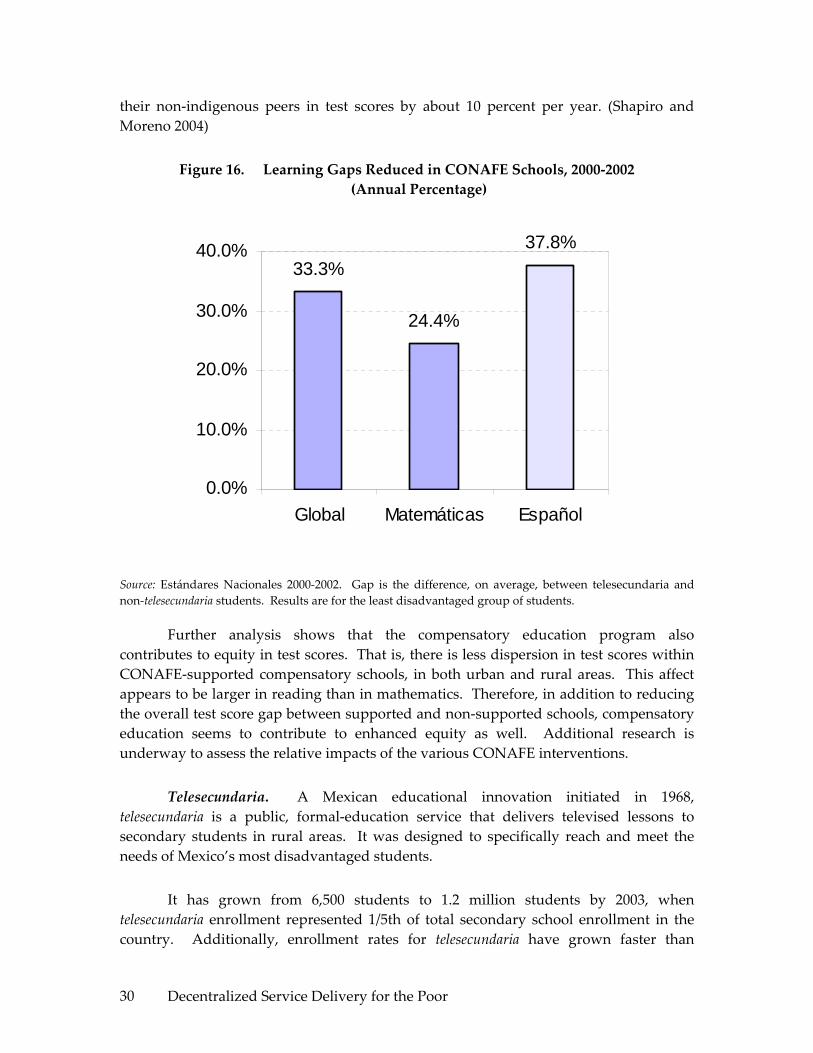
A recent evaluation of the impact of compensatory programs implemented by CONAFE finds that these programs are effective in improving primary school math learning and secondary school reading. In addition, the program has resulted in lower repetition and failure rates. The communities where supported schools are located have significantly lower levels of literacy, access to public services and industrial development than do the communities of non‐CONAFE schools. Yet, an evaluation found that indigenous students supported by the CONAFE schools were catching up to
Decentralized Service Delivery for the Poor 30
their non‐indigenous peers in test scores by about 10 percent per year. (Shapiro and Moreno 2004)
Figure 16. Learning Gaps Reduced in CONAFE Schools, 2000‐2002 (Annual Percentage)
Source: Estándares Nacionales 2000‐2002. Gap is the difference, on average, between telesecundaria and non‐telesecundaria students. Results are for the least disadvantaged group of students.
Further analysis shows that the compensatory education program also contributes to equity in test scores. That is, there is less dispersion in test scores within CONAFE‐supported compensatory schools, in both urban and rural areas. This affect appears to be larger in reading than in mathematics. Therefore, in addition to reducing the overall test score gap between supported and non‐supported schools, compensatory education seems to contribute to enhanced equity as well. Additional research is underway to assess the relative impacts of the various CONAFE interventions.
Telesecundaria. A Mexican educational innovation initiated in 1968, telesecundaria is a public, formal‐education service that delivers televised lessons to secondary students in rural areas. It was designed to specifically reach and meet the needs of Mexico’s most disadvantaged students.
It has grown from 6,500 students to 1.2 million students by 2003, when telesecundaria enrollment represented 1/5th of total secondary school enrollment in the country. Additionally, enrollment rates for telesecundaria have grown faster than
33.3%
24.4%
37.8%
0.0%
10.0%
20.0%
30.0%
40.0%
Global Matemáticas Español

Decentralized Service Delivery for the Poor 31
enrollment rates for traditional and technical secondary schools (Shapiro and Moreno 2004; Torres and Tenti 2000). Early results were positive, but the PISA 2003 results show that telesecundarias perform worse than almost all other types of secondary schools after controlling for other factors. This is particularly troubling considering that telesecundarias are the fastest growing sector in Mexico’s education system.
Math scores for students in telesecundarias are, on average, 100 points less than those of students in general high schools, almost 150 points less in reading, and about 100 points less in science. Since PISA 2003 is representative at the level of school type, one is able to see that telesecundarias produce the lowest raw scores. But the question is: what would happen if one controlled for other factors and compared them to other school types? Using a GLS model that controls for sex, mother’s education and work, home educational resources, city and state residence, private school attendance and school size, among other factors, it is documented that all other types of schools have a significant learning advantage over telesecundaria students. In math, the advantage is only statistically significant for upper secondary technical and general high schools, technical professional schools, and training for workers programs (bachillerato técnico, bachillerato general, profesional técnico and capacitación para el trabajo). That is, there is no significant difference between types of lower secondary school (secundaria general and técnica, and secundaria para trabajadores) once you control for other factors. But for science and reading, telesecundarias have a significant disadvantage relative to all other types (except training for workers). This analysis does not control for costs. Analysis of the PISA results undertaken by INEE also showed that telesecundarias performed worse than other types of schools: 89.3 percent of telesecundaria students were not competent in mathematics, compared to 71 percent of students in general secondary schools (INEE 2005).
However, a 15‐year‐old, the subject of PISA tests, should be in the first year of upper secondary. Those students who are in the first year of upper secondary perform significantly better than students still at the lower secondary (basic) education level. Students may be in lower secondary despite their age because of late entry or grade repetition, both associated with low performance. The large intake of disadvantaged students in recent years, partly due to the expansion of Oportunidades, may have exposed these new students to poor quality schooling. Thus, there is a need to couple efforts of expansion with programs to improve the quality of schooling, especially at the lower secondary level, and rapidly expanding modalities such as telesecundaria.
The problem, however, is that more and more children are entering this type of school, thus lowering overall scores, and their achievement levels are very low. A 15‐year‐old who is in the first year of upper secondary does relatively well on the PISA. Students who are still in lower secondary score poorly. Low learning levels limit their chances for success at higher levels of schooling or later on in the labor market.

Decentralized Service Delivery for the Poor 32
Since the PISA was not designed as an evaluation of secondary school types, and the exam only tests one point in time, it is recommended that Mexico undertake a rigorous assessment by type of secondary school, with particular focus on telesecundarias. More generally, the issue of increased enrollment into low quality schools must be a priority for further analysis. This is underscored by recent INEE evaluations which show that results are declining significantly. Between 2000 and 2005, reading gap between telesecundarias and others increased by 4 percentage points, and the representation of telesecundarias in lowest reading level increased from 33% to 42%.
Oportunidades. An innovative conditional cash transfer program created in 1997, Oportunidades (previously known as Progresa) provides monthly payments to poor families that, inter alia, keep their children in school. Operating, until recently, in rural areas, it has expanded to urban areas and currently has about five million participating families.
As currently designed, the program is primarily focused on income transfers, with human capital formation objectives important, but secondary. This is evident in the education component, where an estimated 65 percent of the recipients are likely to have had their children in school even without Oportunidades (World Bank, 2004a). Thus there has been little impact at the primary level, where coverage is already almost universal. On the other hand, the main impact has apparently been to help increase continuation rates between primary and secondary schooling, which increased from 67 to 76 percent in the studied communities and equalized the rates between the poor and the non‐poor. As noted elsewhere, the program has meant that more disadvantaged students stay in school and has dramatically increased attendance at telesecundarias which provide educational services to the rural poor. As noted above, particular attention to these schools is required.
Intercultural/Bilingual Education. There is no consensus on the number of indigenous languages in Mexico, but there are at least 56 languages with various regional dialects. The first bi‐lingual education program was established in 1951. Today, the Directorate of Indigenous Education in SEP (Dirección General de Educación Indígena ‐ DGEI) supports services for around 1.1 million children in pre‐school and primary, and CONAFE attends around 30,000 students through its Program for Indigenous Education (Programa de Atención Educativa a Población Indígena – PAEPI). DGEI provides services for primary students in 24 of the 31 states and is concentrated in Chiapas, Oaxaca, Guerrero y Veracruz. About one‐fourth of the primary schools are single‐classroom.
In 2002, an individual that lived in a municipality where 10 to 40 percent of the population is indigenous had an average income equivalent to 46 percent of the income of a person in a non‐indigenous municipality (Ramirez 2005). Similarly, an individual in

Decentralized Service Delivery for the Poor 33
a predominantly indigenous municipality (above 40 percent indigenous) had an income equivalent to only 26 percent of the income of a person in a non‐indigenous municipality. Even with similar education levels, indigenous peoples have a much higher probability of being poor than do non‐indigenous people. The indigenous population with no education is more than twice as likely to be extremely poor than the non‐indigenous population without education. Rather than narrowing with increased education, the poverty gap grows as higher educational levels are attained. For individuals with incomplete secondary schooling, the probability of being extremely poor is five times larger if you are indigenous compared to non‐indigenous, and almost ten times higher if they have completed secondary education (Ramirez 2005).
Despite significant improvements in education over the past several decades, considerable educational differences persist between the indigenous and non‐indigenous populations. Illiteracy rates and dropout rates continue to be substantially higher among the indigenous population. Similarly, average years of schooling are much lower for indigenous peoples. Educational gaps, however, are closing rapidly among the younger generations. The average non‐indigenous person born before 1939 has 120 percent more years of schooling than an indigenous person of the same age group. A non‐indigenous person born between 1979 and 1985, by contrast, has 26 percent more years of schooling than an indigenous person born in the same period. And, among 7‐14 year‐old children, the indigenous/non‐indigenous educational gap is 8 percent (Ramirez 2005).
Indigenous peoples’ returns to education are lower than for non‐indigenous people. In addition, indigenous peoples’ returns across the earnings distribution are relatively flat (Garcia and Patrinos 2005), unlike the situation for non‐indigenous people, which favors the less able. Therefore, despite advances in indigenous peoples’ schooling attainment over the last several decades, indigenous peoples will continue to lag behind the non‐indigenous because their schooling will result in lower labor market earnings. Part of the reason for the lower returns that indigenous peoples experience is the quality of schooling that they receive. Indigenous schools consistently obtain lower reading and mathematics scores than all other types of schools, regardless of area of residence. As evidenced by the scores, not only do indigenous schools obtain significantly lower scores than urban public and private schools, they also exhibit poorer test performance than rural public schools and CONAFE community schools. In 2002, a sixth grader from an indigenous school had 15 percent lower reading scores and 8 percent lower mathematics scores than the average sixth grader nationwide. When compared with students from urban public schools, sixth graders in indigenous schools had test results that were 16 percent lower in reading and 9 percent lower in mathematics. Even when compared with students from public rural schools, indigenous students performed poorly. The average sixth grader in an indigenous school had 10 percent lower reading test results and 6 percent lower results in mathematics than the average sixth grader in a public rural school (Ramirez 2005). Furthermore, indigenous students are about ten

Decentralized Service Delivery for the Poor 34
percentage points more likely to work than non‐indigenous students. The indigenous/non‐indigenous gap in reading and math scores is about 0.7 standard deviations in both exams. About three‐fourths of learning inequality between indigenous and non‐indigenous students can be explained by different levels of observed factors (parents’ education and teachers’ experience) and the language barrier.
A recent and on‐going qualitative and quantitative study of intercultural bilingual education (IBE) in Mexico showed that the degree of implementation of IBE policies is low, even in indigenous schools, and varies widely from one type of school to another (Yonker 2004). For example, only 1 to 6 percent of indigenous schools use indigenous language texts. Further, while the majority of teachers in all schools feel that it is important to teach indigenous languages, only about 1 percent of non‐indigenous schools teach an indigenous language, and 7 to 41 percent of the indigenous schools teach an indigenous language. It has also been found that most teachers have no knowledge of IBE policies. In non‐indigenous schools, only 3 percent of the teachers are aware of IBE policies. In indigenous schools, only between 45 to 59 percent of the teachers have some type of knowledge of IBE policies. Implementation of IBE policies is most common in Mayan‐language schools, which also exhibit the worst results on the 6th grade national exams. In addition, schools serving the poor, rural, indigenous, and marginalized urban poor lack critical inputs and have limited access to textbooks, learning materials and trained teachers. Finally, the majority of teachers graduating from pre‐service institutions refuse teaching positions in remote rural or indigenous schools, forcing the government to rely on untrained teachers to provide educational services in remote rural areas.
Thus, it is encouraging that a recent INEE evaluation indicates that between 2000 and 2005, indigenous schools improved, reducing the gap between them and average for the country by 3 percentage points in reading and 2 percentage points in math (grade six). Besides private schools, indigenous schools showed the largest increase in scores. Indigenous schools accomplished this by a massive move out of the low level 1, from 51% representation in 2000 to 29% in 2005 in reading, and in math from 51% in 2000 to 31% in 2005.
Program to Promote Quality in Schools. Created in 2001, the PEC is designed to empower the school community, and promote school autonomy and accountability, encouraging parents, teachers and directors to design and carryout school improvement projects that respond to the needs of the school and its students. The PEC awards a grant to finance the improvement projects in selected schools; these grants are jointly financed by SEP, local government and school communities. The program is open to all public basic education schools that apply on a voluntarily basis, but priority is given to disadvantaged schools located is poor urban areas.
Decentralized Service Delivery for the Poor 35
The program strategy assumes that improvements to the internal organization and decision‐making capacity of the schools are key elements to achieve higher quality of education. Starting with this basic concept, PEC promotes a model of school autonomy and school‐based management which emphasizes: (i) liberty to make school decisions; (ii) shared leadership; (iii) team work; (iv) flexible teaching practices; (v) collaborative planning; (vi) evaluation to inform continuous improvement; (vii) responsible social participation; and (viii) accountability. The PEC strategy recognizes that in order to succeed in achieving autonomy and school‐based management, schools must be willing to embark upon a process of change. As this is a voluntary decision on the part of the school, program participation is likewise voluntarily.
To join the program and qualify to receive a school grant, schools must prepare a strategic five‐year school improvement plan (Plan Estratégico de Transformación Escolar—PETE) where the school community defines the goals it wants to reach and the means that will be used to achieve these goals. To implement the PETE, schools must present, as an additional condition to qualify for the program, yearly work programs (Programa Anual de Trabajo—PAT) where they specify the investments and activities that will be carried out each year. Since the great majority of schools have no experience in strategic planning or in participatory management, the PEC provides technical assistance and training to all schools that express interest in participating in the program. The assistance is provided to schools by state education authorities through different means (including basic education supervisory teams), and focuses upon school management and planning, diagnostics of school needs and results evaluation.
Since its creation, the PEC has grown more than eight‐fold from 2,240 schools in 2001 to 21,307 schools in 2004. Although PEC covers 10.2 percent of all public basic education schools in the country, its total cost (including federal, states and private sector contributions) represents only 0.47 percent of the total public education spending and only 0.88 percent of the federal resources devoted to basic education. These numbers indicates that PEC does not have a significant fiscal impact on public finances.
PEC financing mechanism gives the right incentives to states, municipalities and the private sector to participate in program funding. The states have been steadily supporting program financing with increased contributions over the last five years. This behavior might be the result of the economic incentive provided by PEC, where each state peso is matched by three pesos from the federal government. In the case of local contributions from municipalities and the private sector, the economic incentive is a one‐to‐one match from federal and state sources, up to 50,000 Mexican pesos per year. As expected, there is a strong and positive relationship between the socioeconomic level of the school community and the average amount of the contribution that schools receive from parents. However, in the case of the municipalities, contributions are targeted relatively well since, on average, municipalities make larger contributions to more disadvantaged schools than to schools located in higher income areas. With respect to

Decentralized Service Delivery for the Poor 36
other local sources of financing, such as private firms, NGOs, etc., there is no evident association between the amount contributed and the socioeconomic level of the school community. In general, this data supports the hypothesis that the adoption of a school based management model helps schools raise funds from different community sources, independently of the socioeconomic level of the neighborhood where the school is located.
The use of PEC grants by the schools has changed over time. While the majority of expenditures financed by the grant pertain to infrastructure (comprising construction and equipment), the analysis of grant use over time clearly shows that the infrastructure categories have decreased, and the participation of expenditures for pedagogical enhancement and teacher training have become more important.
A rigorous impact evaluation on education quality has yet to be undertaken, due largely to the time lag required. Nonetheless, the results of the last qualitative evaluation of PEC show the following impacts observed during the 2001‐2004 period: (a) the perception of school staff and community members of pedagogical practices used in the school improved by 21 percent; (b) the perception of school staff and community members of school management practices improved by 3.3 percent; and (c) there was a modest but significant improvement in student scores in math (1 percent) and Spanish (0.5 percent) among third grade students in a sample of PEC schools.6
Also, preliminary results on the impact evaluation carried out by the Bank find that, on average, PEC decreases primary school drop‐out and repetition rates by 0.05 and 3.7 percent a year respectively—as measured by comparing PEC schools with comparable non‐PEC schools. This finding suggests that PEC improves the quality of teaching and school conditions leading to better learning outcomes, thereby reducing repetition and dropout rates, and resulting in potential fiscal savings.
In addition, there are several aspects of PEC’s design that may warrant replication in other federal and state programs, including the matching approach to finance and the focus on the school‐level for delivery.
Carrera Magisterial. The Carrera Magisterial (CM) was part of the 1993 agreement and represents a ground‐breaking attempt to provide incentives to teachers for improving their professional development and the test results of their students. The program is voluntary and includes a five step scale with increasing rewards from the first level at 24.5 percent of the base wage to the highest level at 197 percent. Promotion is based on a 100 point system, with a score of around seventy equivalent to passing,
6 “Evaluación Cualitativa del Programa Escuelas de Calidad: Cambios en las Escuelas del Programa Escuelas de Calidad.” Heurística Educativa 2005.

Decentralized Service Delivery for the Poor 37
depending upon the state, who administers the program. About 80 of the possible points are associated with the teacher’s experience, education, own test results, and peer review. While many of these factors are associated with better quality, the weight of actual student performance is 20 percent. (Vegas and Umansky, 2005)
There is little evidence that Carrera Magisterial has had a positive impact on student performance. As of 2001, about 65 percent of all teachers (about 921,600) had participated in the program and reached the first level (41 percent in the first two years). (Also 89,000 school principals, an estimated 95 percent of the total, were in the program). Thus, the program is very widespread. Indeed, some claim that it is essentially an across‐the‐board pay increase, as once a level is reached the higher wage is retained for the rest of the teacher’s career. A further review of the design, suggests that there is actually a very weak link between the program and incentives to increase efforts to improve student performance. Given the heavy weight to factors other than student tests, it has been estimated that only around 15 percent of teachers actually would have an incentive to increase their efforts (the other are either too far below in terms of other scoring or already pass based on the other factors) (McEwan and Santibanez, 2005).
While ground‐breaking in its intent to link incentives to performance, the evident failure to adequately link these in practice suggest that the CM requires, at the very least, a redesign. Because new teaching post and vacancies are largely non‐competitive, the notion that the CM serves as a general attraction for better qualified applicants into the teaching force, as an additional wage incentive, is largely without basis.
VII. CONCLUSIONS
Increased enrollments have improved equity in general, with the poor gaining access first at the primary level, but now increasingly at the secondary level. However, the quality of education in Mexico remains low – as evidenced in Mexico’s poor performance in international achievement tests and documented in the Bank’s analytical work on the quality of education. Thus, more of the same is unlikely to allow Mexico it meet its MDG targets, given the poor performance over the past decade. Moreover, overall public spending in education is already reaching OECD levels, and its share in the budget as a percentage of the GDP is already about double the average for OECD countries. Thus, continuing increases in spending at the current rate seems unlikely, particularly at the federal level.
Moreover, the current composition in spending offers little incentive for efficiency and quality. Mexico provides relatively high salaries, as compared to most countries, but with almost no guarantee of teacher quality, with a lack of control over human resource management and a program for professional development which might actually have perverse consequences on student learning. Changing the current system

Decentralized Service Delivery for the Poor 38
is a challenge, but other countries, such as Colombia (see box below) are making progress.
Box 1. Per Student Allocation of Education Transfers in Colombia
Much like Mexico, responsibility for providing basic education in Colombia is decentralized to departments (states) and larger municipalities, which receive tied transfers from the national government. Expenditure in education as a percentage of GDP between 1990 and 2004 increased from 2.4 to 5.5, but coverage increased slowly. In order to provide incentives for better performance, law 715 was promulgated in 2001 to increase efficiency in the system and promote quality. There was a transition period of about 2 years between the old and the new formula for the distribution of resources. This process has been gradual and adjusting to meet the targets set up in the law. In 2004, the transfers began to be distributed among territorial entities based on actual enrolment and a per student allocation. Random audits are carried every year to verify the validity of the enrollment numbers reported by the states. Two cases of misreporting were detected in Cartagena and Cali. In response, the Ministry of Education reduced the amount of resources transferred to these states.
The law 715 formalized the option to contract educational services with the private sector, based on successful local experiences. The new law has also reformed the teaching career, limiting the teachers’ salary and promotion scales and wage dynamics. Under the previous system, teachers would move rapidly up the salary scale, resulting in growing pressure on the budget. With the implementation of the reform, 50,000 new teachers are being appointed under new conditions, representing 20 percent of the total number of teachers currently employed in the public system.
Law 715 also guarantees a continuation of the upward trend in spending, which is targeted to increase by 2.5 percent more than GDP growth between 2006 and 2008. Territorial entities that improve efficiency in personnel administration, via higher student/teacher ratios or less expensive teachers, can plow savings back into quality enhancement. This is to be supported by a census‐based evaluation of competencies for grades 5 and 9, which correspond to the end of the primary and lower secondary cycles, in the areas of math, language, natural sciences, and citizen competencies. These are to be conducted nationwide every three years, with the results to be used by schools, municipalities and the Ministry of Education for the design and implementation of plans to improve the quality of education.
Law 715 is already working toward improving performance, resulting in 1,085,000 new enrollments in basic and secondary education levels over the past three years. Assessment and investment in quality is expected to result in improved student performance.
Reforms in this area would help to further empower the states to more adequately assume their responsibility in providing access to quality education. State‐

Decentralized Service Delivery for the Poor 39
level innovation and continued emphasis on federal compensatory programs have already been shown to work even within the current system, and is backed by hard evidence from both national and international experience.
National Experience. The analysis above on the impact of state‐level institutional variation and performance, particularly with regards to focusing on schools, accountability, participation, evaluation, teacher training and increased inputs is bolstered by analyzing the determinants of learning on the PISA 2000 and 2003 exams for Mexico and the evaluations of compensatory programs.
School climate played a significant role in the performance of low and high achievers indiscriminately on the PISA. Changes and improvements in the school climate (relations between students and teachers for example, belief in students’ ability to learn and support for that to happen) and current schooling practices are shown to have an impact on achievement even after controlling for family background and state variations. Increased autonomy may give schools the flexibility they need to empower teachers, thus improving the school climate as well as the relationship between students and teachers. The analyses also showed that parental involvement with schools and attitudes about their children’s schooling have an impact on educational achievement. Strengthened accountability mechanisms could create space for parents to actively participate in the education system and, if successful, raise aspirations for greater educational attainment levels for their children. In a simulation using PISA 2003, it is shown that changes and improvements in the school climate and current schooling practices increase the overall score of the bottom achievers by about 30 percent.
Moreover, evidence from Mexico’s compensatory programs shows that learning achievement of students in rural and indigenous schools can be raised substantially through interventions designed to improve the quality of teachers, principals and supervisors, and through the availability and proliferation of learning materials, according to two studies that use quasi‐experimental designs and propensity score matching (Paqueo and Lopez‐Acevedo 2003; Shapiro and Moreno 2004). PARE was effective in raising Spanish test scores in rural and indigenous schools (Paqueo and Lopez‐Acevedo 2003). Student scores increased by 95 percent in indigenous treatment schools compared to only 17 percent in indigenous control schools. The gains were less, though still sizeable in rural schools: scores increased by 56 percent in treatment schools and 40 percent in control schools. Factors that help explain the change in test scores include: school attendance, parent participation and the performance of teachers and principles. They found that school and educational system factors had large and significant impacts on student tests scores, especially in indigenous schools. After controlling for individual, family, community and school characteristics, it was found that, if implemented correctly, the PARE program could cause scores for the average rural students to increase by 19 to 38 percent, and by 45 to 90 percent for the average indigenous student. Demand‐side educational grants have also been found to reduce

Decentralized Service Delivery for the Poor 40
the gap between poor and non‐poor students, with the greatest impacts exhibited by students who face greater barriers to education, such as having uneducated parents and living far from school (Raymond and Sadoulet 2003).
Holding socioeconomic characteristics constant, Schmelkes’ (1997) case study found that there were significant differences in learning outcomes between the best and the worst schools within regions, but not always across regions. For example, for the fourth grade, there were no significant differences between the best schools in a disadvantaged urban region, an indigenous region, and an urban middle‐class region. This finding suggests that there are school improvements that could lead to reduction, if not elimination, of the barriers to greater equity in basic learning achievement. The existence of differences within regions indicates the importance of school management and of the dynamics and culture of the school.
International Experience. The institutional variations detailed above for high performing Mexican states is also underlined by cross‐country analysis which indicates that differences in educational institutions account for the large international differences in student achievement. Woessmann (2003), using TIMSS data, suggests that differences in educational institutions explain the large international differences in student performance in cognitive achievement tests. An econometric student‐level estimation based on data for more than 260,000 students from 39 countries reveals that positive effects on student performance stem from centralized examinations and control mechanisms, school autonomy in personnel and process decisions, competition from private educational institutions, scrutiny of achievement and teacher influence on teaching methods. A large influence of teacher unions on curriculum scope has negative effects on student performance. The findings imply that international differences in student performance are not caused by differences in schooling resources but are mainly due to differences in educational institutions. Taking all countries into consideration, he finds that the following factors positively impact science and mathematics learning:
• Central examinations
• Centralized control of curriculum and budget matters
• School autonomy in process and personnel
• Teaching methodology
• Limited influence of unions
• Scrutiny of student performance
• Parental interest
• Intermediate level of administration
• Competition from private sector

Decentralized Service Delivery for the Poor 41
An Agenda for Action
The agenda for action proposed is based on three main principles: (i) increased autonomy from the state‐level education secretariats to local schools, as well as shifting human resource management more fully to the states; (ii) implementation of accountability mechanisms between the federal and state education authorities, local schools, and communities, parents and students; (iii) constant assessment of student performance to inform education policy decisions, as well as better linking professional improvement in teachers to learning results. The objective is to improve service delivery. Improved service delivery will predominantly benefit the poor as shown below.
• Increased Autonomy
o To improve quality, Mexico needs to continue efforts to move decision‐making from the state level secretariats to the school level, thus increasing autonomy
o Increasing school autonomy can compensate disadvantaged schools o Autonomy can help raise the schooling outcomes of indigenous peoples o Schools need the autonomy to develop locally appropriate education
policies o School autonomy reinforces the role that attention given to homework,
instruction of effective learning styles and student’s perception of the future value of education play in raising student achievement levels
o With more autonomy, schools could determine the appropriate mix of resources and technology for their students
• Accountability
o Accountability mechanisms could improve learning outcomes by involving parents and communities in setting clear goals and visions for the school system, especially in disadvantaged communities
o Accountability mechanisms that put people at the center of service provision can go a long way in making services work and improving outcomes
o Flexible and wide‐ranging accountability mechanisms could encompass various types of services
o Continue to increase incentives for school enrollment, while improving accountability
• Assessment
o Assessment testing can be used to inform policy decisions—at the local, state and national levels

Decentralized Service Delivery for the Poor 42
o Analysis of assessments can foster public and civil society involvement in education reform, especially benefiting poor and disadvantaged communities
o State governments should be proactive in encouraging public debate using assessment results
o Mexico has made remarkable efforts to improve assessment of the education system and is encouraged to continue participating in international achievement tests and expand coverage of national assessments
More autonomy, accountability, and assessment also allow other policy actions to be more effective, particularly as regards the poor and disadvantaged, but also in improving cost‐effectiveness and efficiency of the system. Increasing autonomy would allow schools to determine locally appropriate policies, particularly in the case of schools that serve indigenous students and other disadvantaged schools. For example, more autonomous schools can implement appropriate language policy, thus fulfilling national guidelines for indigenous students. As noted, Mexico spends too little on non‐wage inputs to education. Greater school autonomy can increase the efficiency of existing resources by allowing schools to identify there own needs. Similarly, PEC requirements for matching funds in state/local contributions could provide an incentive for greater resource mobilization. States themselves could increase the efficiency of their current expenditures through tighter human resource management as demonstrated by Auguascalientes. A more accountable system will in turn encourage more active participation by parents and teachers, which is key to improving learning outcomes. This is particularly true for indigenous schools, for which decisions regarding curriculum are made at the federal level with little accountability. If accountability was delegated to the school level, with community participation, school quality could improve. Assessment can increase resource mobilization by fostering public and civil society involvement in education reform and schools. Finally, a system that is based on constant assessment and participation in international benchmarking exercises will improve cost‐effectiveness.
Policy Options
Policy options would be reviewed and presented in two, though not necessarily mutually exclusive sets. The first would assume that the institutional arrangements of the decentralization are not readily susceptible to change given the political economic context. Such options would include:
• Evaluation and dissemination of “best practices” at the state level and
• Identification and evaluation of federal programs that would support implementation by other states, including channeling the flow of resources directly to schools and requiring matching grants.

Decentralized Service Delivery for the Poor 43
An additional set of policy options would be based on the assumption that the overall institutional design of the decentralization is not conducive to sustainable improvements in quality at a pace required by Mexico to meet its MDG targets and increase the education and skills levels of its population to alleviate poverty and enhance its competitiveness. For example, even if all the states were able to adopt the practices and achieve the results of the best state performer in Mexico‐‐not a small or quick task‐‐, as a country it would still only rank at a level comparable to countries such as Turkey, Thailand and Russia. These options would still need to be firmly grounded in the political economic realities of Mexico and they would imply a move to increase consensus and collaboration between the federation, the states, teachers, organized labor and parents, as regards the problem and possible solutions, together with specific incremental measures to begin the process of change. Potential options might include:
• Changes in the system of transfers to promote improved performance.
• Reforming teacher work rules and shifting hiring responsibilities fully to the states.

Decentralized Service Delivery for the Poor 44
ANNEX: Institutional Effects as Determinants of Student’s Math Achievement: Coefficient estimate (and standard error)
Institutional factors 1 2 3 4 5 6 Administrative decentralization 1.7 (1.1) 1.8 (1.3) 1.0 (1.4) Pedagogical decentralization 4.8 (1.3)* 4.2 (2.0)** 5.4 (2.2)* Student evaluation 6.8 (1.5)* 7.0 (1.5) 6.6 (1.6)* Student evaluation (results used for policy) ‐1.9 (2.0) ‐3.9 (2.2) ‐4.4 (2.3) Student evaluation (results used and disseminated) 4.5 (1.6)* 1.0 (2.2) 1.3 (2.3) Student evaluation (results used, disseminated, and used to design interventions) 15.0 (2.3)* 10.0 (3.2)* 10.2 (3.2)* Parentsʹ participation (medium) 1.4 (1.3) 0.9 (1.3) Parentsʹ participation (high) 1.5 (1.9) ‐2.5 (2.3) Controls for:
Student characteristics incl. incl. incl.
incl.
incl.
incl.
Family background incl. incl. incl.
incl.
incl.
incl.
Home incentives and inputs incl. incl. incl.
incl.
incl.
incl.
Sample size 12,276 12,276 12,276 12,276 12,276 12,276 * indicates significance at the 1 % level; ** indicates significance at the 5% level Source: Computed with PISA 2003 and Mexican institutional variables

Decentralized Service Delivery for the Poor 45
REFERENCES
Abdul‐Hamid, H. 2005. “Mexico’s Performance in PISA.” Background report prepared for the Mexico Quality of Education Study. World Bank (processed).
Anderson, J.B. 2002. “The Effectiveness of Special Interventions in Latin American Public Primary Schools.” The Dante B. Fascell North‐South Center Working Paper Series, No. 5. University of Miami.
Fernandez, T. 2003. “Determinantes sociales y organizacionales del aprendizaje en la educación primaria de México en Tres estudios sobre determinantes del rendimiento escolar.” Instituto Nacional para la Evaluación de la Educación, México.
Garcia, V., F. Knaul and H.A. Patrinos. 2005. “Returns to Education and Quality of Education in Mexico.” World Bank (processed).
Garcia, V. and H.A. Patrinos. 2005. “Returns to Schooling across the Earnings Distribution: Indigenous and non‐Indigenous People in Mexico.” World Bank (processed).
Hernani‐Limarino, Werner. 2005. “Are Teachers Well Paid In Latin America and the Caribbean? Relative Wage and Structure of Returns of Teachers.” In E. Vegas, (Ed.), Incentives to Improve Teaching. Lessons from Latin America. The World Bank, Directions in Development Series. Washington, DC: The World Bank.
Hoxby, Caroline M. 2002. “The Cost of Accountability,” in W.M. Evers and H.J. Walberg, eds, School Accountability. Stanford: Hoover Institution Press.
Instituto Nacional para la Evaluacion de la Educacion. 2004b. Resultados de las Pruebas PISA 2000 y 2003 en México: Habilidades para la Vida en Estudiantes de 15 Años. México: Instituto Nacional para la Evaluación de la Educación.
Instituto Nacional para la Evaluacion de la Educacion. 2005. La Telesecundaria Mexicana: Desarrollo y Problemática Actual. México: Instituto Nacional para la Evaluación de la Educación.
McEwan, Patrick and Lucrecia Santibáñez. 2005. “Teacher and Principal Incentives in Mexico.” In E. Vegas, (Ed.), Incentives to Improve Teaching. Lessons from Latin America. The World Bank, Directions in Development Series. Washington, DC: The World Bank.
OECD. 2005. The Education Challenge in Mexico: delivering Good Quality Education to All. Economics Department Working Paper No. 447 authored by Stephanie Guichard. Paris: OECD.

Decentralized Service Delivery for the Poor 46
Ontiveros, M. 1998. “Eficiencia del Gasto Educativo. Una Evaluación utilizando la función de producción Educativa.” El Trimestre Económico 64(4) 535‐ 555.
Paqueo, V. and G. Lopez‐Acevedo. 2003. “Supply‐side School Improvement and the Learning Achievement of the Poorest Children in Indigenous and Rural Schools: the Case of PARE.” World Bank Policy Research Working Paper No. 3172. Washington, DC.
Patrinos, H.A. and S. Metzger. 2004. “Returns to Education in Mexico: An Update.” World Bank/Universidad de las Américas, México (processed).
Psacharopoulos, G. and H.A. Patrinos. 2004. “Returns to investment in education: a further update.” Education Economics 12(2): 111‐134.
Ramirez, A. 2005. “Mexico,” in G. Hall and H.A. Patrinos, eds., Indigenous People, Poverty and Human Development in Latin America: 1994‐2004. World Bank, forthcoming.
Raymond, M. and E. Sadoulet. 2003. “Educational Grants Closing the Gap in Schooling Attainment between Poor and Non‐Poor.” CUDARE Working Papers, No. 986. Department of Agricultural and Resource Economics, University of California, Berkeley.
Schmelkes, S. 1997. La Calidad de la Educación Primaria. Un Estudio de Caso. México: SEP/FCE.
Sen, A. 1999. Development as Freedom. New York: Alfred Knopf.
Shapiro, J. and J. Moreno Trevino. 2004. “Compensatory Education for Disadvantaged Mexican Students: An Impact Evaluation Using Propensity Score Matching.” World Bank Policy Research Working Paper No. 3334, Washington, D.C.
Woessmann, L. 2004. “The Effect Heterogeneity of Central Exams: Evidence from TIMSS, TIMSS‐Repeat and PISA.” CESIFO Working Paper No. 1330. Center for Economic Studies and IFO Institute for Economic Research, Munich.
Woessmann, L. 2003. “Schooling Resources, Educational Institutions, and Student Performance: The International Evidence.” Oxford Bulletin of Economics and Statistics 65(2): 117‐170.
World Bank. 2003. Lifelong Learning in the Global Knowledge Economy: Challenges for Developing Countries. Washington, D.C. http://www.congress‐lifelonglearning.org/frameset.htm.

Decentralized Service Delivery for the Poor 47
World Bank. 2004a. World Development Report: Making Services for Poor People. The World Bank, Washington, D.C.
World Bank. 2004b. Public Expenditure Review. Report No. 27894‐MX. Washington DC: The World Bank.
World Bank. 2005. Mexico: Determinants of Learning. The World Bank, Washington, D.C.

Decentralized Service Delivery for the Poor 48

Decentralized Service Delivery for the Poor 49
SERVICIOS DE SALUD PARA LOS POBRES EN UN CONTEXTO DESCENTRALIZADO:
EL CASO MEXICANO
Armando Arredondo, Carlos Hernández, y Carolina Álvarez
Las pasadas y recientes reformas en servicios de salud dirigidos a la población más marginada de México, bajo la estrategia de la descentralización en salud, entre otras, han planteado abordar cambios para llegar a una mayor equidad, mayor acceso, mayor cobertura y más recientemente, lograr mayor protección financiera para que los usuarios no incurran en gastos catastróficos al presentar daños a su salud. Estas estrategias, son parte del Plan Nacional de Desarrollo y del Programa Nacional de Salud, con un eje conductor en materia de justicia social para contribuir desde el sector salud, a la reducción de la pobreza y la desigualdad a través de una mayor protección social en salud. El efecto de estas estrategias es analizado en este documento con resultados de impacto positivo y resultados de impacto negativo. Entre los resultados de impacto positivo podemos mencionar los siguientes:
• En algunos estados la descentralización ha generado ganancias importantes en los índices de corresponsabilidad financiera y de mayor corresponsabilidad en la producción y participación en salud
• A partir de la descentralización se han registrado importantes incrementos en los montos del financiamiento en salud y cambios de mayor efectividad en los mecanismos de coordinación entre los niveles de gobierno en salud en la mayoría de los estados del país, estos cambios también han coincidido con ganancia positiva en algunos indicadores sociales y particularmente con mejora en los niveles de la mortalidad infantil, mortalidad materna y morbilidad por enfermedades crónicas e infecciosas
• En materia de equidad existe una nueva formula de asignación de recursos donde además el nivel estatal ha jugado un rol protagónico en su revisión, ajustes y aplicación para las adecuaciones sobre los recursos asignados y sobre el modelo de atención a la salud que cada estado adopta en función de sus necesidades
• La implementación de programas prioritarios de salud dirigidos a los grupos más vulnerables (Seguro Popular, IMSS‐Oportunidades, Arranque Parejo por la Vida, etc.) han contribuido de manera muy importante para garantizar mayor protección financiera, mayor acceso y mayor cobertura de las familias marginadas
• La estrategia de protección financiera en salud en algunos estados ha evitado gastos catastróficos en salud y por consecuente el mayor empobrecimiento de las familias más vulnerables

Decentralized Service Delivery for the Poor 50
• Existen evidencias de mejoría en indicadores del desempeño del sistema de salud que coinciden con la implementación de los cambios señalados; el Seguro Popular es una estrategia de financiamiento con un principio muy sólido de equidad, por primera vez el financiamiento sigue al usuario si se cambia de un estado a otro, esto es de particular relevancia en un país donde la migración interna de la población que no pertenece a la economía formal es tan alta.
Resultados de impacto negativo.
• Alto grado de dificultad en generar una efectividad mas o menos homogénea en todos los estados al implementar reformas y programas de salud dirigidas a grupos vulnerables
• Existe confusión entre los diferentes niveles de gobierno al momento de operacionalizar los cambios tanto en financiamiento como en la producción de servicios de salud, el nivel municipal manifiesta que el nivel estatal se ha convertido en el nivel central, el nivel estatal manifiesta que en varios programas de salud el nivel federal sigue centralizando todo el poder y el nivel federal manifiesta dificultad en los acuerdos, compromisos y corresponsabilidad entre los niveles de gobierno, particularmente en los recientes cambios para incorporar IMSS‐Oportunidades al Seguro Popular.
• La rendición de cuentas en el nivel federal aunque no está ausente se mantiene con un carácter triunfalista, mientras que en los estados y municipios aún está ausente un sistema de rendición de cuentas y de transparencia en la asignación de recursos.
• Aún no está claro el peso relativo de los cambios en el sistema de salud sobre las ganancias en los indicadores de impacto en salud a partir de la descentralización.
• Los principales programas prioritarios de salud dirigidos a grupos vulnerables operan con un manejo centralizado del nivel federal con efectos muy negativos y confusos sobre las ganancias que se habían generado en la descentralización del poder y con efectos también negativos en los mecanismos de coordinación y complementariedad de tales programas.
• Los conflictos entre los partidos políticos en el poder de los gobiernos federal y estatal se refleja en bajos niveles de gobernabilidad y dificultad en la conducción efectiva de los programas prioritarios y de otras estrategias de reforma.
Esto último ha generado escasos avances en la democratización de la salud con altos grados de confusión en las reglas y los roles con que operan los diferentes actores del sistema de salud; Existen evidencias de que a pesar de las ganancias en protección financiera, en algunos estados los usuarios de menor ingreso familiar son los que incurren en mayores gastos catastróficos en salud; Las medidas para avanzar en la equidad en la asignación de recursos para población no asegurada no han sido suficientes, continúan los altos índices de inequidad, particularmente en los estados de mayor marginación.

Decentralized Service Delivery for the Poor 51
I. INTRODUCCIÓN
Este documento presenta un análisis del rol que han tenido los servicios públicos de salud dirigidos a población no asegurada en el contexto de las reformas actuales del sistema de salud y particularmente a partir de la descentralización de la salud en México. La primera sección plantea de manera precisa las principales preguntas a responder y objetivos del análisis. La segunda sección incluye una descripción del universo de análisis, así como los criterios de selección y estados seleccionados como población de estudio. Se detallan los principales procedimientos metodológicos que permitieron la revisión de documentos sobre información cualitativa y cuantitativa, la selección de fuentes de información de datos secundarios y el desarrollo de entrevistas a directivos clave del sector salud en los estados. También se mencionan en esta sección los indicadores sociales, de salud y de financiamiento seleccionados para su análisis en los 6 estados bajo estudio.
En la tercera sección se resaltan los principales, iniciando por el análisis del rol del gobierno en el origen, cambios, evolución, principales estrategias de reforma en los años recientes en los servicios públicos de salud, resaltando programas de salud dirigidos a los más marginados. Se incluye un análisis descriptivo de los principales cambios y tendencias que en materia de políticas, programas y estrategias de reforma ha experimentado el sistema de salud desde la década de los 80s hasta la reciente propuesta de reforma del Plan Nacional de Salud 2001‐2006. Énfasis especial se hace a l análisis de la estrategia de descentralización de la salud y a los efectos de esta estrategia en posibles cambios en las relaciones entre los niveles de gobierno federal/estatal/municipal y de autoridades de salud.
La cuarta sección, plantea las características distintivas de dos de los programas prioritarios de salud dirigidos a combatir la desigualdad y a la reducción de la pobreza: el Seguro Popular de Salud y el IMSS‐Oportunidades. Para cada uno de estos programas se hace un análisis descriptivo y resumido de sus antecedentes, objetivos y metas, estructura organizacional, estructura financiera, modelo de atención y oferta de servicios, beneficiarios y principales resultados al 2005. Esta sección se cierra con un análisis comparativo de diferentes indicadores de estos programas de salud.
La quinta sección, incluye el análisis de los resultados de los cambios, tendencias y evidencias de los principales indicadores seleccionados antes y después de la descentralización tomando como año de corte 1995. Indicadores sociales: gasto en salud para población no asegurada, tasa de escolaridad, población económicamente activa, ingreso per cápita, agua potable, drenaje; Indicadores de financiamiento en salud: tendencias del financiamiento en salud (por tipo de fuente federal, estatal, municipal y hogares), tendencias del gasto en salud por objeto de gasto (atención preventiva, atención curativa, administración y gestión ); Indicadores de impacto en salud: mortalidad infantil, mortalidad materna, morbilidad por diabetes, morbilidad por infecciones respiratorias; Indicadores de desempeño del sistema de salud: cobertura, equidad y eficiencia.

Decentralized Service Delivery for the Poor 52
La última sección incluye la discusión y conclusiones sobre los efectos de la descentralización en las relaciones intergubernamentales y en las tendencias del gasto e indicadores de salud para población no asegurada; Efectos de la descentralización en la identificación de necesidades de salud, asignación de recursos y en la introducción de nuevas modalidades de proveer servicios a nivel local; Efectos del entorno político y la gobernabilidad en las decisiones y resultados en salud a nivel estatal; Efectos del Seguro Popular y el IMSS‐Oportunidades en la reducción de la pobreza y en la disponibilidad y distribución de los recursos para salud a nivel estatal y como afecta la distribución entre los estados. Finalmente para todos los indicadores analizados a manera de fortalezas y debilidades se plantean los principales efectos de impacto positivo y efectos de impacto negativo.
II. PLANTEAMIENTO DEL PROBLEMA Y OBJETIVOS
En los últimos 20 años el sistema de salud en México ha sido objeto de varios proyectos de reforma tanto en la manera de producir y ofertar los servicios de salud como en la manera de financiarlos y distribuirlos en la población. Partiendo de principios de equidad, protección financiera, eficiencia, accesibilidad, efectividad y calidad de la atención, dichas reformas han consolidado la diversificación de opciones de servicios de salud en tres subsistemas: el subsistema de servicios de salud para población asegurada (servicios públicos para población de la economía formal), el subsistema para población no asegurada (servicios públicos para población fuera de la economía formal y con los mayores índices de marginación) y el subsistema para población con poder de compra (sector privado).
El segundo subsistema, es decir el de los servicios públicos de salud dirigidos a los no asegurados, y particularmente los programas prioritarios a los grupos de mayor marginación, son justamente el objeto de análisis de análisis de este documento. En este sentido los objetivos y preguntas centrales a responder son:
Objetivos
“Desarrollar un análisis descriptivo sobre el origen, evolución y principales estrategias de reforma en la oferta y en el financiamiento del sector salud para usuarios no asegurados.”
“Identificar y analizar los efectos de la descentralización sobre los indicadores de salud, los mecanismos de producción, financiamiento y asignación de recursos en salud a partir de las reformas.”
“Identificar y analizar los efectos de programas prioritarios de salud generados en los últimos años, enfocados a la reducción de la pobreza y la desigualdad en salud en las comunidades mas marginadas de México.”

Decentralized Service Delivery for the Poor 53
Preguntas
¿De que manera la reforma en los servicios públicos de salud para no asegurados plantean el abordaje de equidad, protección financiera, mayor cobertura y mayor acceso a la salud para la población de mayor marginación en México?
¿Cuáles han sido los efectos en materia de financiamiento y cambios en las relaciones intergubernamentales a partir de la descentralización y la implementación de diferentes programas prioritarios para los grupos de mayor marginación en México?
¿Existen evidencias de efectos de los cambios en el financiamiento sobre las condiciones de salud y sobre el desempeño del sistema de salud para no asegurados, se pueden analizar en los diferentes estados del país?
¿Que efectos en materia de financiamiento, de asignación de recursos y de mecanismos de coordinación, han tenido programas prioritarios de salud como el IMSS‐Oportunidades y el Seguro Popular?
III. METODOLOGÍA
Para responder a los objetivos y preguntas de investigación planteadas se diseño un estudio de investigación evaluativa tomando como objeto de análisis los cambios, niveles, tendencias y efectos de estrategias/programas de servicios de salud, tanto en el sistema público de salud como en las condiciones de salud de los usuarios. Mediante técnicas de revisión documental de documentos oficiales, análisis de publicaciones con diferentes hallazgos empíricos y entrevistas a personal clave en los estados seleccionados, el modelo de análisis fue retrospectivo, cualitativo y cuantitativo.
Antes de entrar a las diferentes secciones de este apartado, es importante resaltar que para mayores detalles conceptuales o metodológicos de cada variable bajo análisis ver glosario de términos y aclaraciones metodológicas en los anexos.
Universo, población de estudio y criterios de selección
El universo de análisis fue la población no asegurada en México. La población de estudio se limitó a usuarios y servicios de salud para población abierta (población sin acceso a servicios de salud dirigidos a la población de la economía formal). Por razones de costos, temporalidad, y calidad de la información, el análisis se delimitó para 6 estados. Para dar representatividad de los resultados, la selección de los estados se realizó estratificando por nivel de ingreso (alto, medio y bajo), índice de marginación (alto, medio y bajo), área geopolítica y temporalidad de la descentralización (Fase I ó Fase II). Los estados se agruparon en 3 grupos: grupo A, 2 estados centro‐sur, PRI, de ingreso bajo y alta marginación (Hidalgo y Oaxaca), grupo B: 2 estados noroeste‐sureste, PRI‐PRD, de ingreso medio y marginación media (Tabasco y Colima), y grupo C: 2 estados norte, PRD‐PAN, con

Decentralized Service Delivery for the Poor 54
ingreso medio/alto y marginación baja (Baja California y Jalisco). Para el análisis de las tendencias (de indicadores de financiamiento y de salud) antes y después de la descentralización, 1995 es el año de corte para el período 1990‐2003.
Revisión documental y fuentes de información
Con el objeto de desarrollar un análisis descriptivo sobre los servicios públicos de salud para no asegurados y de identificar las características distintivas para dos programas de salud dirigidos a la población mas marginada de México se llevó a cabo un análisis documental de diferentes publicaciones. Para este proceso, después de una búsqueda sistematizada se seleccionaron 35 fuentes de información básica para el análisis. La principal fuente de información fueron los resultados de dos proyectos de investigación desarrollados en el INSP dentro de la línea de investigación de Equidad, Gobernabilidad y Protección Financiera en Salud: “Políticas de financiamiento en el contexto de la reforma de la salud en México” y “Equidad, Gobernabilidad, Financiamiento y Descentralización en Salud en México”. Como parte del proceso de revisión documental también se llevo a cabo la revisión y selección de documentos publicados que incluyeran datos oficiales sobre los principales indicadores a utilizar para el estudio de las tendencias y cambios en los estados bajo análisis.
Entrevista con personal clave
Para complementar la información cualitativa ya existente, sobre las relaciones intergubernamentales y cambios a partir de programas prioritarios de salud, se realizo una entrevista a personal clave en los estados. Fueron seleccionados directivos de alto nivel en los estados (directores de planeación/evaluación, directores del Seguro Popular y directores de Unidad de descentralización) a los que se aplicó una entrevista semiestructurada con los siguientes puntos: rol del gobierno estatal en el monitoreo de programas prioritarios de salud, nivel de información y de influencia de autoridades de salud en los programas de salud dirigidos a grupos prioritarios, principales instrumentos del gobierno central para influenciar el desempeño del estado en materia de salud, como afectan los programas como Seguro Popular, Arranque Parejo por la Vida, etc. los acuerdos institucionales (sobre todo con cambios en el nivel de autonomía y toma de decisiones a nivel estatal sobre estos programas. Estos resultados se procesaron analizaron con el software ATLAS‐TI.
Tendencias del gasto total en salud y de indicadores sociales por grupos de estados
Se realizó un análisis de tendencias de gasto total en salud en no asegurados para cada uno de los 6 estados en un periodo de 10 años (antes y después de la descentralización, tomando como año de referencia 1995). Se integraron en este mismo análisis las tendencias de 5 indicadores sociales para cada uno de los seis estados: Tasa de escolaridad, ingreso per cápita, tasa de urbanización/drenaje, agua potable y población económicamente activa. Para los indicadores sociales analizados solo existen datos para tendencias en 1990, 1995 y 2000.
Decentralized Service Delivery for the Poor 55
Tendencias del financiamiento en salud para población no asegurada
Para cada uno de los 6 estados, se analizaron las 4 principales fuentes de financiamiento de servicios de salud para población no asegurada: aportaciones del gobierno federal, aportaciones del gobierno estatal, aportaciones municipales y aportaciones de los usuarios (1990‐2003). También se analizaron las tendencias del peso relativo por fuente de financiamiento: al interior de cada estado y entre los 6 estados. El análisis de tendencias por objeto de gasto se realizó dividiendo la asignación del gasto en tres categorías: recursos para programas de atención preventiva, recursos para programas de atención curativa y recursos para la gestión y administración en salud.
Desde la perspectiva de diferentes actores sociales, se analizaron resultados de estudios previos sobre las principales alternativas de financiamiento y mecanismos de asignación que se han desarrollado a partir de la estrategia de descentralización y reforma de salud, resaltando la responsabilidad de los gobiernos estatales y gobiernos municipales.
Análisis y tendencias de indicadores de gasto e indicadores de impacto en salud
Para tratar de encontrar alguna correlación entre recursos financieros e impacto en salud, se realizó un análisis de tendencias del gasto en salud para no asegurados y tendencias de 4 indicadores de impacto en salud para el período 1990‐2003 en los tres grupos de estados y utilizando los siguientes indicadores: Mortalidad infantil, mortalidad materna, morbilidad por enfermedades crónicas (diabetes) y morbilidad por enfermedades infecciosas (IRAS).
Análisis y tendencias en el desempeño de los servicios para no asegurados
En esta sección se incluyó un análisis de indicadores de desempeño en los servicios de salud para población no asegurada, para un período de 5‐10 años, dependiendo del indicador (algunos datos sobre estos indicadores no estuvieron disponibles antes de 1998 o presentan problemas de falta de calidad y confiabilidad). Los indicadores de desempeño que se analizados fueron:
Indicadores de Cobertura: cobertura de vacunación, médicos por habitantes y camas censables.
Indicadores de Eficiencia: Tasa de ocupación hospitalaria, índice de rotación y tasa de promedio diario de consultas.
Indicadores de Equidad: Índice de inequidad en la asignación de recursos, gasto catastrófico por estado, índice de responsabilidad financiera gobierno federal /gobierno estatal, gasto per cápita por estado.

Decentralized Service Delivery for the Poor 56
Análisis de relación entre variaciones sobre gobernabilidad y desempeño
El análisis de gobernabilidad incluyó los resultados sobre 9 indicadores de gobernabilidad:
• Conocimiento y aceptación de diferentes programas de salud para no asegurados;
• Participación en toma de decisiones de programas de salud a nivel local;
• Capacidad de gestión y reasignación de recursos a nivel estatal;
• Rendición de Cuentas con participación de actores estatales y municipales;
• Participación de todos los actores en la gestión de nuevas fuentes de financiamiento;
• Grado de interacción entre actores sociales: proveedores, usuarios, gobiernos y ONGs;
• Transparencia en el uso de recursos para la gestión de programas de salud ;
• Mecanismos de coordinación entre programas de apoyo a necesidades locales de salud;
• Nivel de acuerdo entre actores de servicios de salud para no asegurados.
Este análisis se realizó en los 6 estados bajo estudio: Jalisco (Partido político en el gobierno estatal PAN), Colima, Oaxaca, Hidalgo y Tabasco (Partido político en el gobierno estatal PRI) y Baja California (Partido político en el gobierno estatal PRD).
IV. RESULTADOS
Los resultados de la revisión documental, de otros hallazgos empíricos y de las propias entrevistas a personal clave en los estados se presentan a continuación en diferentes secciones
Análisis del rol del gobierno en el origen, cambios, evolución y descentralización de los servicios públicos de salud en México.
Origen de los servicios públicos de salud. El actual sistema de servicios públicos de salud en México, desde sus orígenes estuvo basado en el principio de ciudadanía y en la acción gubernamental orientada por el Consejo Superior de Salubridad. Fue indispensable crear un organismo del Ejecutivo Federal con amplia capacidad para destinar recursos y normar acciones contra las epidemias y a favor del saneamiento urbano. Así nació el Departamento de Salubridad, dependiente del poder ejecutivo. Hasta 1929 este fue el principal marco de política que permitió establecer Unidades Cooperativas con estados y municipios.
Durante los años 30s se continuó con las líneas de política de salud trazadas después del periodo revolucionario, aunque también se generó un nuevo modelo de atención médica:

Decentralized Service Delivery for the Poor 57
la cogestión de servicios de salud entre gobierno, banca de desarrollo ejidal y los campesinos beneficiados por la colectivización de vastas extensiones de tierra. Bajo esta nueva política de salud, el Departamento de Salubridad procuró introducir la atención preventiva y armonizarla con la atención curativa referida.
Para la década de los 40s ya coexistían las tres líneas fundamentales para la asignación de recursos y producción de servicios públicos de salud, mismos que actualmente siguen vigentes: a) Recursos para problemas de salud muy específicos (programas prioritarios de salud para toda la población), caracterizado por las campañas sanitarias iniciadas en las Unidades Sanitarias Cooperativas; b) La asignación de recursos a servicios no personales y en menor medida asistenciales para la totalidad de residentes no asegurados en los estados y municipios, a través de los Servicios Coordinados de Salud Pública en los Estados; y c) La canalización de recursos públicos y privados para servicios personales de salud, en beneficio de grupos estratégicos para la producción (población asegurada), por medio de contribuciones de trabajadores, aportadores de capital y gobierno.
A partir de tales líneas de asignación de recursos y producción de servicios de salud, la fundación del actual sistema data de 1943, año en que fueron establecidos el Instituto Mexicano del Seguro Social (IMSS) y la Secretaría de Salubridad y Asistencia (SSA), los dos principales componentes del Sistema de Salud Mexicano. El IMSS se creó para canalizar contribuciones tripartitas (estado, empresas y trabajadores), en apoyo a la industrialización de las principales urbes, bajo la conducción gubernamental y la oferta pública de servicios integrales. La SSA fue creada con la fusión de la Secretaria de Asistencia y el Departamento de Salubridad. Su objetivo era el de asignar recursos a los Servicios Coordinados de Salud Pública. La misión asistencial se amplió para cubrir de manera más integral a la población que quedó al margen de la seguridad social, incluida la mayor parte de los campesinos, desempleados y trabajadores de la economía informal. Otro desarrollo significativo de esta época fue la creación en 1959 del Instituto de Seguridad y Servicios Sociales para los Trabajadores del Estado (ISSSTE), que consolidó la diversidad de sistemas de pensiones y prestaciones de los trabajadores del gobierno.
Posteriormente, en los 60s y 70s setenta se agudizó la sobreposición de responsabilidades oficiales entre los servicios de salud de la seguridad social y los servicios de salud para no asegurados, poniendo de manifiesto la dificultad para coordinar y normar a instituciones caracterizadas por su centralismo y su arraigada autonomía. De ahí que en 1983 se iniciaran los primeros esfuerzos para plantear estrategias de reforma como la descentralización del sistema de salud mexicano.
Cambios y evolución de estrategias de reforma de los servicios de salud para no asegurados. Los principales cambios en las políticas de salud de años recientes podemos englobarlas en cinco categorías de análisis: extensión de cobertura, participación estatal y municipal, implementación de un paquete básico de servicios, reorganización del modelo de atención a la salud y creación de un sistema universal de salud.

Decentralized Service Delivery for the Poor 58
En relación a la extensión de cobertura, la principal estrategia es la ampliación de la cobertura de la seguridad social. Para ello se propone un mecanismo que garantice mayor calidad a los usuarios a través de la elección, modificando el esquema de afiliación y reduciendo las participaciones de los patrones y de los trabajadores pero incrementando la participación del gobierno. Esto permitirá que la población, principalmente urbana, con capacidad de cotizar que no pertenece a la economía formal, tenga a su alcance un medio para su incorporación, en este sentido se realizaron las modificaciones a la Ley General de Salud y a la Ley del Seguro Social, llevando a la creación del Seguro Popular y del seguro de salud para la familia.
En lo referente a la participación estatal y municipal en la salud, se planteó que la participación organizada de grupos de proveedores y usuarios de servicios de salud, personas, organismos no gubernamentales e instituciones de diversa índole es un elemento fundamental en el mantenimiento de la salud colectiva. En este sentido la estrategia de municipio Saludable se constituyó en el mecanismo rector de las actividades para la participación organizada de la comunidad en la definición de prioridades, elaboración de programas de salud local, y la realización y evaluación de las actividades programadas.
La estrategia para ampliar la cobertura a través de un paquete básico, pretende acceder a los cerca de 10 millones de mexicanos con nulo o limitado acceso a servicios de salud, y como un elemento primordial de equidad y justicia social, la reforma plantea como objetivo fundamental llegar a este grupo de población con servicios esenciales de salud. Esta estrategia se basa en la adopción de lo que se denomina “paquete básico de servicios”, que se define como un conjunto esencial de intervenciones de salud que deben otorgarse a esta población en respuesta a sus necesidades prioritarias. En consistencia con la descentralización, esta estrategia de ampliación de la cobertura establece objetivos y metas en todo el país, con una operación descentralizada a los estados y municipios.
En donde no ha sido posible introducir servicios de aseguramiento a través del pago anticipado, las instituciones de atención a población no asegurada siguen teniendo un rol preponderante, pero deberán actuar sin duplicidades en forma integrada y descentralizada. Los cambios que la reforma plantea que los servicios públicos de salud para la población asegurada y la población no asegurada transformaran de raíz la conformación del Sistema de Salud en México
Las estrategias mencionadas fueron la base de la reforma propuesta desde los 80s, incluyendo el programa nacional de salud para el periodo 1995‐2000. Por otra parte desde el 2001, se ha implementado un nuevo proyecto de reforma que retomó algunas de estas estrategias a la vez que propuso nuevas estrategias, dando un giro al sistema nacional de salud en materia de producción y financiamiento de los servicios de salud proponiendo un sistema universal de salud. El nuevo programa de salud, propuesto en principio para implementarse en el periodo 2001‐2006, pero con un planteamiento estratégico de más largo plazo, plantea en esencia acabar con los problemas de equidad, calidad, acceso y cobertura del sistema nacional de salud. En este sentido enfatiza estrategias de aseguramiento en

Decentralized Service Delivery for the Poor 59
materia de protección financiera a los usuarios, particularmente para los usuarios de menor ingreso económico.
Cabe mencionar que el actual Programa Nacional de Salud, está hecho con una visión de 25 años, con objetivos y metas muy concretas en cuanto a los programas prioritarios de salud, tal es el caso del Seguro Popular. Por lo que toca a la construcción de un federalismo cooperativo en salud, el Plan Nacional de Salud parte de la base que se debe lograr una mayor democratización de la salud acompañada de una distribución más equitativa de recursos para la salud; por lo que las desigualdades entre instituciones, grupos de población, niveles de atención y estados exigen la revisión de los criterios y mecanismos de la repartición de recursos financieros.
En lo referente a protección financiera la propuesta del Sistema Universal de Salud, es fortalecer el aseguramiento y desalentar el “pago de bolsillo.” Lo anterior se pretende lograr mediante tres vertientes:
• La creación el Seguro Popular de Salud
• La ampliación de afiliación al IMSS y al IMSS‐Oportunidades
• El reordenamiento de los seguros privados
Se prevé que con estas tres formas todos los mexicanos para el 2025, tendrán acceso y cobertura total a la salud. El Seguro Popular y el IMSS‐Oportunidades, se constituyeron como la base de equidad y disponibilidad a servicios de salud y aseguramiento nacional de la población que está fuera de la economía formal. Evidentemente, su población objetivo son los hogares de menores ingresos.
En materia del nuevo modelo de atención según el proyecto gubernamental, se propone un nuevo modelo integrado de atención a la salud (MIDAS) que para el 2006 pretende que el 98 por ciento de la población esté adscrita a un médico familiar que sea el gestor de la salud de sus afiliados. Este mismo modelo de atención advierte que se trata de que los hospitales se conviertan en organismos autónomos y que el financiamiento se asigne al usuario en lugar de asignarse a los proveedores de los servicios.
Por otra parte, es importante resaltar en esta sección que la estructura actual del Sistema de Salud se encuentra estrechamente vinculada con las formas de producción. Los trabajadores asalariados de la economía formal cuentan con acceso a las instituciones de seguridad social, en tanto que el resto de la población recibe atención en instituciones públicas como la SSA y el Programa IMSS‐Oportunidades, con un financiamiento mixto donde participan aportaciones federales, estatales, y pago directo de los usuarios a través de cuotas de recuperación por estrato social. Por otra parte, el financiamiento de la seguridad social depende principalmente de las contribuciones de los empleados y los patrones, así como de las aportaciones del gobierno federal. En resumen como se puede apreciar en la Tabla 1, la cobertura y montos de financiamiento del actual sistema de salud no corresponden, como se verá mas adelante, con lo que desde sus inicios han propuesto las políticas y estrategias del
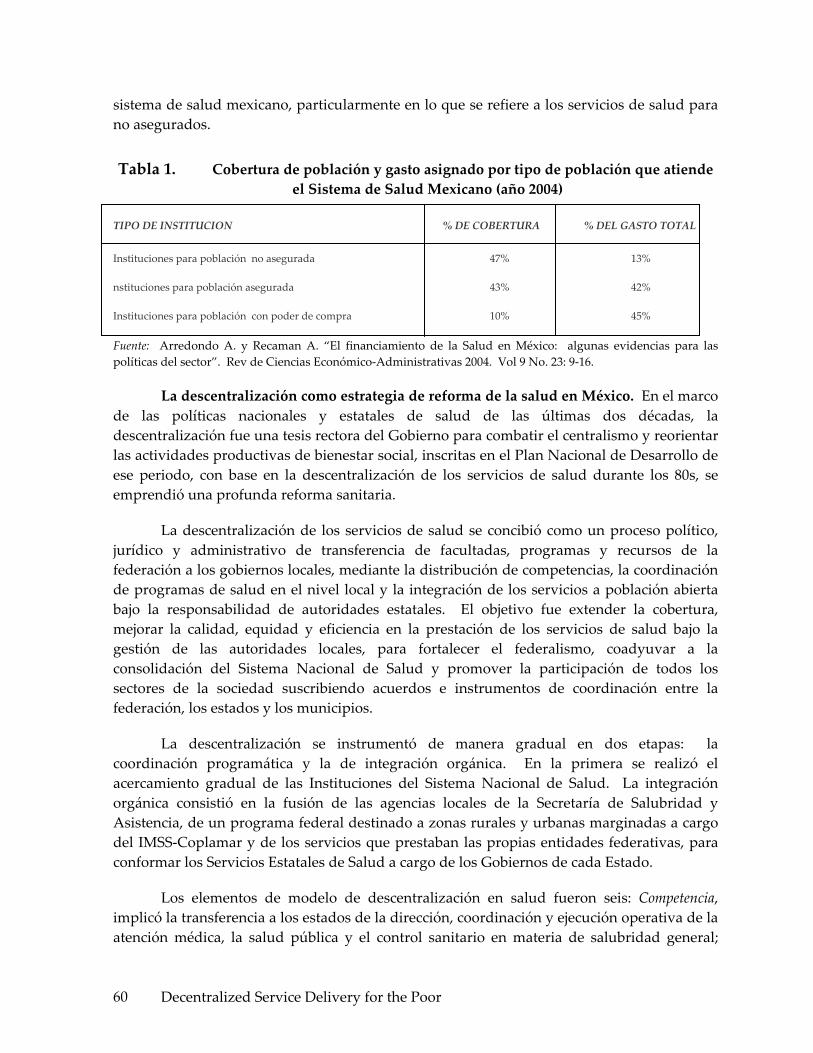
Decentralized Service Delivery for the Poor 60
sistema de salud mexicano, particularmente en lo que se refiere a los servicios de salud para no asegurados.
Tabla 1. Cobertura de población y gasto asignado por tipo de población que atiende el Sistema de Salud Mexicano (año 2004)
TIPO DE INSTITUCION % DE COBERTURA % DEL GASTO TOTAL Instituciones para población no asegurada 47% 13% nstituciones para población asegurada 43% 42% Instituciones para población con poder de compra 10% 45% Fuente: Arredondo A. y Recaman A. “El financiamiento de la Salud en México: algunas evidencias para las políticas del sector”. Rev de Ciencias Económico‐Administrativas 2004. Vol 9 No. 23: 9‐16.
La descentralización como estrategia de reforma de la salud en México. En el marco de las políticas nacionales y estatales de salud de las últimas dos décadas, la descentralización fue una tesis rectora del Gobierno para combatir el centralismo y reorientar las actividades productivas de bienestar social, inscritas en el Plan Nacional de Desarrollo de ese periodo, con base en la descentralización de los servicios de salud durante los 80s, se emprendió una profunda reforma sanitaria.
La descentralización de los servicios de salud se concibió como un proceso político, jurídico y administrativo de transferencia de facultadas, programas y recursos de la federación a los gobiernos locales, mediante la distribución de competencias, la coordinación de programas de salud en el nivel local y la integración de los servicios a población abierta bajo la responsabilidad de autoridades estatales. El objetivo fue extender la cobertura, mejorar la calidad, equidad y eficiencia en la prestación de los servicios de salud bajo la gestión de las autoridades locales, para fortalecer el federalismo, coadyuvar a la consolidación del Sistema Nacional de Salud y promover la participación de todos los sectores de la sociedad suscribiendo acuerdos e instrumentos de coordinación entre la federación, los estados y los municipios.
La descentralización se instrumentó de manera gradual en dos etapas: la coordinación programática y la de integración orgánica. En la primera se realizó el acercamiento gradual de las Instituciones del Sistema Nacional de Salud. La integración orgánica consistió en la fusión de las agencias locales de la Secretaría de Salubridad y Asistencia, de un programa federal destinado a zonas rurales y urbanas marginadas a cargo del IMSS‐Coplamar y de los servicios que prestaban las propias entidades federativas, para conformar los Servicios Estatales de Salud a cargo de los Gobiernos de cada Estado.
Los elementos de modelo de descentralización en salud fueron seis: Competencia, implicó la transferencia a los estados de la dirección, coordinación y ejecución operativa de la atención médica, la salud pública y el control sanitario en materia de salubridad general;

Decentralized Service Delivery for the Poor 61
Administrativa, se creó la estructura encargada de la operación de los Servicios Estatales de Salud; Patrimonial, se transfirió en uso gratuito la infraestructura federal a los Servicios Estatales de Salud; Laboral, se protegió a los trabajadores en el régimen laboral y de seguridad social y se delegó el ejercicio de las facultades patronales individuales respetando sus derechos adquiridos; Financiera, se estableció un sistema de cofinanciamiento con aportaciones de gobiernos federales, estatales y municipales; Logística, se adoptó el mecanismo para proporcionar los apoyos técnicos y logísticos requeridos por los servicios descentralizados para su consolidación y mejor desarrollo.
En el nivel central se trabajó en el Gabinete de Salud, cuerpo colegiado integrado para dictar, coordinar y evaluar las políticas y programas de la administración pública federal en materia de salud. El Comité de Descentralización de los Servicios de Salud a Población No Asegurada, para la puesta en práctica de las políticas y estrategias del programa de descentralización. El Consejo Nacional de Salud (CNS), conformado por el secretario de salud a nivel federal y los secretarios de salud en los estados, se integró por Acuerdo Presidencial en marzo de 1986. Es una instancia de coordinación entre la federación y los gobiernos estatales para la programación, presupuestación y evaluación de los programas de servicios públicos de salud, para lo cual sesiona trimestralmente.
Para la primera fase de la descentralización, entre 1985‐88, 14 estados firmaron los Acuerdos para la Integración Orgánica y Descentralización Operativa de los Servicios de Salud. Para la segunda fase el resto de los estados de la federación firmaron los mismos acuerdos y a partir de 1995, en teoría todos los estados habían quedado descentralizados. El proceso de descentralización requirió de estrategias de trabajo y de un programa de actividades y del fortalecimiento de los servicios estatales; cada entidad elaboró su diagnóstico para conocer la situación operativa, determinar las prioridades y acciones necesarias para mejorar su capacidad de gestión.
Como se ha señalado, la coordinación entre los dos sistemas de atención a población no asegurada y los servicios estatales de salud desde sus inicios hasta la fecha ha sido difícil. Ello genera duplicidades importantes, omisiones que podrían eliminarse y una gestión que padece de los problemas que conlleva el centralismo, el gigantismo y la burocratización de una estructura pesada que ya no puede seguir coartando las iniciativas locales. En virtud de lo anterior, y en consistencia con el Programa para un Nuevo Federalismo, se buscó la descentralización de los recursos federales destinados a la atención de la población no asegurada a través de la Secretaría de Salud y del IMSS‐Oportunidades. En este contexto, la descentralización planteó una definición más clara de las metas y responsabilidades, lo que permitió, a través del replanteamiento de los sistemas de evaluación, un seguimiento más preciso de la efectividad de las estrategias del Programa Nacional de Salud 2001‐2006 y particularmente de dos de lo principales proyectos de la reforma actual dirigidos a la población de menores recursos dentro de los no asegurados, el Seguro Popular y el IMSS Oportunidades.

Decentralized Service Delivery for the Poor 62
Análisis de las relaciones intergubernamentales en el ámbito de la salud
En México la toma de decisiones en salud, a pesar de los recientes avances democráticos, aún permanece muy centralizada. Históricamente, el poder ejecutivo tuvo una autoridad casi irrestricta sobre el poder legislativo y el judicial y sobre cualquier otro actor político. Hasta hace poco tiempo ambas cámaras del Congreso estaban dominadas por miembros del PRI y los miembros de la oposición reconocían que sus puntos de vista no serían decisivos para determinar la legislación y la acción en salud. Esta situación ha cambiado a partir del año 2000, presentándose un mayor equilibrio entre los diferentes partidos políticos. No obstante estos últimos cambios existe en México una cultura e inercia política donde el dominio del ejecutivo federal se ha extendido también a los niveles inferiores del gobierno, convirtiendo a los gobernadores estatales y por supuesto municipales en dependientes de las iniciativas presidenciales centralistas y colocando al municipio en el fondo de la pirámide federal‐estatal‐local en todo lo concerniente a las relaciones intergubernamentales y sobre todo en cuanto a la toma de decisiones en materia de políticas públicas de salud.
Hay que resaltar que para algunos autores el sistema intergubernamental en todos los sectores, y particularmente en materia de salud, tenía como principal bandera de acción administrar el poder de decisión desde el centro del país sin compartirlo con los estados y municipios, solo administrarlo. En efecto, el sistema político de México es muy centralizado, y aunque se otorga la primicia a los estados y los municipios (el municipio libre, de acuerdo a la Constitución Política), en la práctica el poder lo concentra el centro, particularmente la rama ejecutiva.
El presidente mexicano tiene facultades para actuar como un poder constituyente dotado de autoridad para enmendar la Constitución, actuar como legislador principal, establecerse como la autoridad última en cuestiones electorales, asumir jurisdicción y despedir a miembros del gabinete, gobernadores, presientes municipales y legisladores federales y estatales. Esta combinación de facultades constitucionales y meta‐constitucionales ha hecho del presidente mexicano y a las autoridades del nivel federal uno de los ejes más poderosos de cualquier democracia. El alto grado de centralización federal, sobre todo en las manos del presiente y su gabinete, reduce considerablemente la capacidad de la separación de poderes para actuar como un sistema de pesos y contrapesos con otros actores políticos y particularmente con los niveles de gobierno estatal y municipal. De hecho hay que resaltar que 3 de los principales programas actuales y prioritarios en salud (Sistema de Protección Social en Salud, Arranque Parejo por la Vida, IMSS‐Oportunidades), tienen su origen en la oficina de la presidencia aunque sean operados por el sector salud.
En tal contexto, las relaciones intergubernamentales en materia de salud entre los niveles federal, estatal y municipal, han estado determinadas por la naturaleza muy centralizada del sistema político de México, y además se han vuelto tan estables como el sistema mismo, a pesar de cambios de partido político en el poder a partir del 2000. Dado que la centralización del sistema de salud operó como una de las principales fuerzas
Decentralized Service Delivery for the Poor 63
determinantes de dicha estabilidad, difícilmente ha habido cambios en el campo de las relaciones entre los distintos niveles de gobierno.
El análisis de la relación entre el centro y los niveles locales, aunque todavía está relativamente descuidado, se considera ahora un elemento decisivo en el proceso de democratización y en la efectividad de las políticas de salud. En el caso de México, los esfuerzos de descentralización del último decenio han tratado fundamentalmente de cambiar el carácter de las relaciones intergubernamentales. Por otra parte la cuestión de “que partido político gobierna” tiene un interés especial porque la estructura del poder se refleja inevitablemente en las políticas de salud y particularmente en la capacidad de conducción de las principales estrategias y programas de reforma en salud.
Aunque la Constitución Política, plantea que los municipios serán autónomos, no establece específicamente como habrá de ejercerse esta autonomía por lo tanto, la cuestión fundamental del cambiante papel de estados y municipios del sistema federal mexicano se refiere al grado de autonomía que han rescatado del centro del país. Se acepta casi unánimemente, con algunas excepciones, que los estados han permanecido bajo el control de autoridades de salud del nivel federal, mientras que los municipios han estado bajo el control de autoridades de salud del nivel estatal.
Por otra parte, la dependencia política municipal frente al gobierno federal y estatal siempre ha estado relacionada directamente con la dependencia económica. Antiguamente, los municipios no podían recaudar impuestos a la propiedad o al ingreso, de modo que todas las recaudaciones iban a las manos del gobierno estatal y federal. Quedaba poco dinero para los proyectos iniciados localmente, y los gobierno municipales debían recurrir a otras fuentes de ingresos. La dependencia municipal aumentó cuando el gobierno federal asumió la responsabilidad de suministrar a las comunidades servicios públicos básicos como vivienda, educación, salud pública y atención médica. Así pues, el número de viviendas, escuelas, clínicas, hospitales y programas de salud de cada comunidad dependían o siguen dependiendo de la decisión de algún funcionario del nivel federal.
En este contexto, durante los últimos 25 años, el proceso de descentralización ha sido uno de los principales hilos conductores del régimen político mexicano. La reforma municipal de 1983 es decisiva no sólo porque puso las bases sobre los que se han construido los programas de descentralización subsecuentes, sino también porque inició el desarrollo de una “cultura de la descentralización” en México. A principios de los 80s se presenta una iniciativa para reformar el artículo 115 de la Constitución, que se ocupa del gobierno municipal.
El propósito básico de la reforma propuesta era garantizar a los municipios fuentes de recaudaciones fijas e intocables, lo que les permitiría suministrar servicios públicos y, lo que es más importante, fortalecer su independencia política y hasta cierto punto económica. Las áreas más directamente afectadas por la cada vez mayor autonomía municipal frente al gobierno federal eran la administración pública, los servicios públicos (particularmente salud

Decentralized Service Delivery for the Poor 64
y educación), el control financiero y la planeación del desarrollo. En lo político, la reforma trataba de dar mayor pluralismo al gobierno municipal. En lo administrativo, se permitía que los gobiernos municipales formularan sus propias reglas de gobierno internas.
Desde principios del decenio de 1980 hasta finales del siguiente, el gobierno mexicano emprendió un extenso programa de descentralización, como instrumento para conservar el poder político y fortalecer su legitimidad en riesgo. El principio de la descentralización para conservar el control político global (y, en efecto, para fortalecerlo) parecía particularmente prominente durante los 90s. En efecto, una descentralización genuina, se ha convertido en algo que no podía posponerse si el gobierno quería que su partido sobreviviera (PRI) y conservara el control del gobierno central.
Esta paradoja aparente—para conservar el poder se debe cederlo, o por lo menos dar esa apariencia—proporciona el marco para entender la distribución intergubernamental del poder en el México contemporáneo. Este fue, y algunas veces sigue siendo, el propósito subyacente de la política de descentralización en México: centralizar descentralizando. Tanto las particularidades del federalismo mexicano como la estructura del poder y la estrategia de descentralización, han tenido efectos significativos en la respuesta social organizada para satisfacer las necesidades de salud de los mexicanos y el proyecto de federalización del sistema de salud y en los efectos de las relaciones entre los diferentes niveles de gobierno en materia de salud.
En la Tablas 2 y 3, se presentan los resultados de entrevistas a profundidad con directivos clave de los sistemas estatales de salud de los estados bajo estudio para identificar algunos efectos o impactos de la descentralización en materia de salud. En la figura 1, el análisis está centrado en los efectos sobre las relaciones entre los diferentes niveles de gobierno. Sobre los efectos que fortalecieron las relaciones intergubernamentales hay que resaltar el rol mas proactivo, propositito y decidor del nivel estatal, pero resaltando el rol del partido político en el poder a nivel estatal y sus coincidencias con el nivel federal. Otro efecto relevante ha sido la posibilidad de mayor adecuación del modelo de atención e incluso de las intervenciones en salud que cada estado puede realizar a partir de los acuerdos de descentralización entre niveles federal y estatal.
El rol de mayor responsabilidad en el monitoreo de los programas estatales de salud ha tenido como resultado mayores índices de efectividad y cumplimiento de metas por el nivel estatal. La participación activa y el alto grado de influencia del gobierno federal en el monitoreo, seguimiento y desempeño del sistema estatal de salud se tomo como una fortaleza en la mayoría de los estados. Finalmente dentro de las fortalezas se resaltó cambios favorables en materia de financiamiento y producción de servicios, sobre todo sustentado con los nuevos mecanismos de financiamiento y los nuevos roles en la asignación de recursos por parte del nivel estatal.
Como principales debilidades se mencionaron los bajos niveles de coordinación entre niveles federal y estatal, cuando los partidos políticos en los diferentes niveles de gobierno

Decentralized Service Delivery for the Poor 65
son diferentes y sobre todo cuando son tan diferentes como de derecha y de izquierda. Cuando la diferencia está entre partidos de centro versus derecha, el nivel de desacuerdo es menor. La dificultad de acuerdos también se refleja de manera muy importante entre los niveles de gobierno estatal versus municipal. La principal evidencia es que desde la perspectiva de autoridades municipales, la descentralización sólo llego al nivel estatal y ahora el gobierno estatal se ha convertido en el nivel central que concentra todo el poder de decisiones dejando un margen muy bajo en el poder decisivo del nivel municipal y de las ONGs. Otra debilidad importante es que desde la perspectiva del nivel estatal hay un exceso de controles y seguimiento en algunos programas de salud, sobre todo en los programas prioritarios como el Seguro Popular y Arranque Parejo por la Vida.

Decentralized Service Delivery for the Poor 66
Tabla 2. Fortalezas y debilidades en algunos indicadores de efectos de la descentralización en las relaciones intergubernamentales a partir de las reformas
INDICADORES DE EFECTO FORTALEZAS DEBILIDADES Cambios en los mecanismos de coordinación entre nivel federal y estatal para acuerdos institucionales
‐Niveles adecuados de coordinación y mayor margen para la toma de decisiones en gobiernos estatales que asumen sin discusión los programas propuestos desde el nivel central y donde no hay conflicto de partidos políticos ‐Los nuevos acuerdos permiten mayor adecuación por el nivel estatal en el modelo de atención y en la reasignación de recursos financieros.
‐En situaciones de conflicto entre partidos políticos en los niveles de gobierno federal vs. estatal, los acuerdos no avanzan y existen bajos niveles de coordinación y generación de conflicto entre niveles de gobierno llegando a bloquear, detener o condicionar la implementación de estrategias de reforma o programas prioritarios.
Cambios en los mecanismos de coordinación entre nivel estatal y municipal/jurisdiccional
‐Los programas prioritarios de salud presentan mayor efectividad en el desempeño y hay mayor eficiencia en la asignación de recursos de acuerdo a las necesidades de salud a nivel estatal.
‐Los niveles estatal y municipal a veces no manejan con precisión y claridad los modelos de atención y los modelos técnicos de análisis que subyacen en programas prioritarios de salud o incluso en la misma reforma de salud.
Instrumentos de coordinación entre los tres niveles de gobierno
‐Análisis integral de la efectividad y cumplimiento de metas en salud en los documentos técnicos de informes estatales y federales de gobierno. ‐Acuerdos de gestión y seguimiento de Indicadores de evaluación del desempeño, de transparencia y de rendición de cuentas, solo a nivel federal.
‐Ausencia de instrumentos de evaluación del desempeño, de transparencia y de rendición de cuentas a nivel estatal y municipal. ‐No existen acuerdos de gestión entre nivel estatal y municipal.
Grado de influencia del gobierno federal en el monitoreo, seguimiento y desempeño del sistema estatal de salud
‐Rol de participación muy activa y decisiva, sobre todo en programas prioritarios de salud (Seguro Popular, Arranque Parejo por la Vida, etc.) y en la implementación del programa nacional de salud.
‐Rol pasivo en programas prioritarios de salud que no dependen directamente del nivel central de la SSA. Índice de corresponsabilidad muy baja en la mayoría de estados y municipios.
Efectos de nuevos programas federales de salud en los mecanismos de coordinación
‐Cambios en mecanismos de producción y financiamiento en salud. ‐Generación y promoción de nuevas alternativas de financiamiento y nuevos roles de decisión por niveles estatal y municipal de gobierno
‐Diseño, monitoreo, evaluación y control excesivo desde el nivel central, tanto en estrategias de reforma como en programas prioritarios de salud. ‐Efectos confusos al interactuar con los mismos recursos de otros programas de salud.
Fuentes: Resultados propios a partir de entrevistas con directivos clave de los 6 estados bajo análisis. Enero del 2006. Arredondo A. et al, Primer Informe Técnico. Proyecto Equidad, Gobernabilidad y Financiamiento en Salud a partir de la reforma de la salud en México. INSP, 2003‐2006.
Decentralized Service Delivery for the Poor 67
En lo referente a los efectos de impacto positivo versus impacto negativo de la descentralización sobre algunas variables sustantivas de los sistemas estatales de salud, el análisis se dirigió a los efectos sobre financiamiento, equidad, gobernabilidad, efectividad de los programas de salud, calidad de la atención y al impacto sobre indicadores epidemiológicos de salud. Las principales evidencias de impacto positivo o negativo se presentan en la Tabla 3. Entre evidencias de impacto positivo resaltan la mayor responsabilidad por parte del nivel estatal en el financiamiento de la salud ; la generación de una formula de asignación de recursos con amplia participación en ajustes y adecuaciones de dicha formula en función de las necesidades y recursos estatales de salud; la participación mas activa de todos los actores del nivel estatal con replanteamientos en los actores, los roles y las interacciones entre los diferentes actores del sistema federal y estatal de salud; El rol activo en el control, monitoreo y garantía de programa estatales de calidad de la atención y finalmente la mayor autonomía en el nivel estatal para las adecuaciones en el modelo de atención, las intervenciones a implementar y la reasignación de recursos para las intervenciones a implementar de manera mas acorde con las necesidades locales de salud.
Los principales efectos de impacto negativo se refieren sobre todo a que en el nivel municipal no ha habido cambios sustanciales ni en el financiamiento, ni en la efectividad de los distintos programas, ni en la manera en que se organizan los recursos para generar los servicios de salud. En efecto, sigue funcionando prácticamente de la misma manera en que se hacían las cosas desde antes de la descentralización. Si bien es cierto se ha avanzado poco en la determinación de necesidades en los niveles estatal y municipal, nada se ha avanzado en la generación de más y nuevos recursos en salud para y por el nivel municipal.
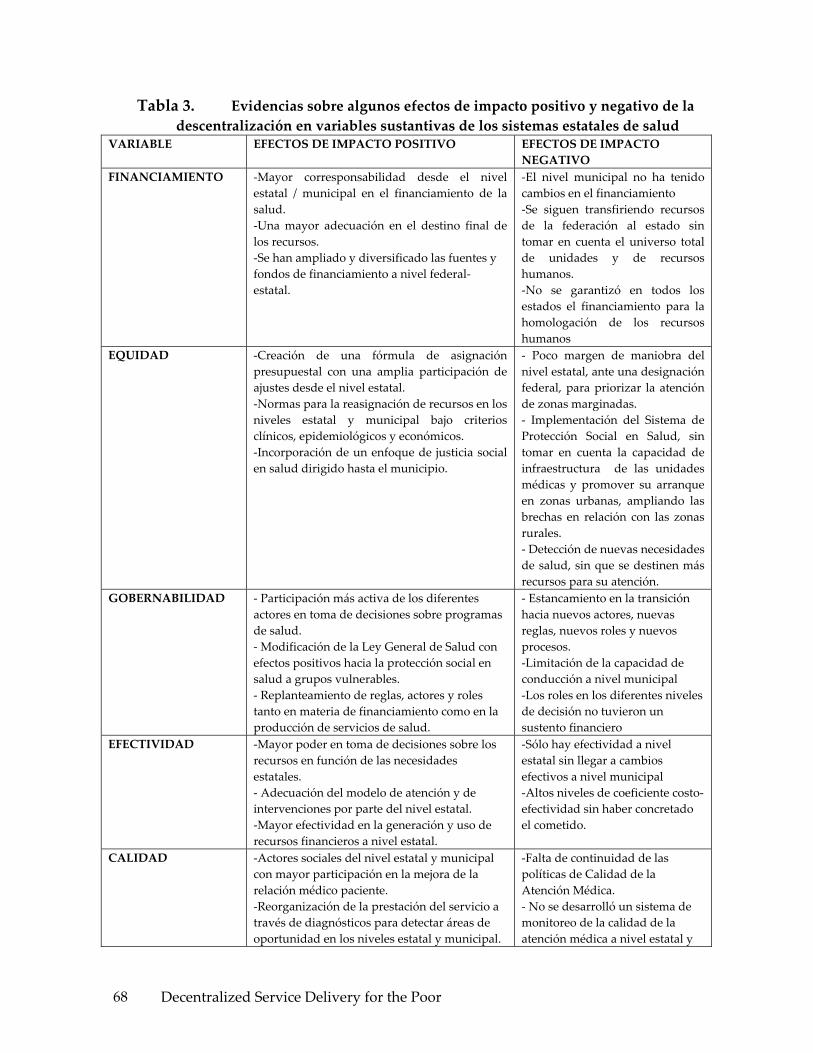
Decentralized Service Delivery for the Poor 68
Tabla 3. Evidencias sobre algunos efectos de impacto positivo y negativo de la descentralización en variables sustantivas de los sistemas estatales de salud
VARIABLE EFECTOS DE IMPACTO POSITIVO EFECTOS DE IMPACTO NEGATIVO
FINANCIAMIENTO
‐Mayor corresponsabilidad desde el nivel estatal / municipal en el financiamiento de la salud. ‐Una mayor adecuación en el destino final de los recursos. ‐Se han ampliado y diversificado las fuentes y fondos de financiamiento a nivel federal‐estatal.
‐El nivel municipal no ha tenido cambios en el financiamiento ‐Se siguen transfiriendo recursos de la federación al estado sin tomar en cuenta el universo total de unidades y de recursos humanos. ‐No se garantizó en todos los estados el financiamiento para la homologación de los recursos humanos
EQUIDAD ‐Creación de una fórmula de asignación presupuestal con una amplia participación de ajustes desde el nivel estatal. ‐Normas para la reasignación de recursos en los niveles estatal y municipal bajo criterios clínicos, epidemiológicos y económicos. ‐Incorporación de un enfoque de justicia social en salud dirigido hasta el municipio.
‐ Poco margen de maniobra del nivel estatal, ante una designación federal, para priorizar la atención de zonas marginadas. ‐ Implementación del Sistema de Protección Social en Salud, sin tomar en cuenta la capacidad de infraestructura de las unidades médicas y promover su arranque en zonas urbanas, ampliando las brechas en relación con las zonas rurales. ‐ Detección de nuevas necesidades de salud, sin que se destinen más recursos para su atención.
GOBERNABILIDAD
‐ Participación más activa de los diferentes actores en toma de decisiones sobre programas de salud. ‐ Modificación de la Ley General de Salud con efectos positivos hacia la protección social en salud a grupos vulnerables. ‐ Replanteamiento de reglas, actores y roles tanto en materia de financiamiento como en la producción de servicios de salud.
‐ Estancamiento en la transición hacia nuevos actores, nuevas reglas, nuevos roles y nuevos procesos. ‐Limitación de la capacidad de conducción a nivel municipal ‐Los roles en los diferentes niveles de decisión no tuvieron un sustento financiero
EFECTIVIDAD
‐Mayor poder en toma de decisiones sobre los recursos en función de las necesidades estatales. ‐ Adecuación del modelo de atención y de intervenciones por parte del nivel estatal. ‐Mayor efectividad en la generación y uso de recursos financieros a nivel estatal.
‐Sólo hay efectividad a nivel estatal sin llegar a cambios efectivos a nivel municipal ‐Altos niveles de coeficiente costo‐efectividad sin haber concretado el cometido.
CALIDAD
‐Actores sociales del nivel estatal y municipal con mayor participación en la mejora de la relación médico paciente. ‐Reorganización de la prestación del servicio a través de diagnósticos para detectar áreas de oportunidad en los niveles estatal y municipal.
‐Falta de continuidad de las políticas de Calidad de la Atención Médica. ‐ No se desarrolló un sistema de monitoreo de la calidad de la atención médica a nivel estatal y

Decentralized Service Delivery for the Poor 69
VARIABLE EFECTOS DE IMPACTO POSITIVO EFECTOS DE IMPACTO NEGATIVO
‐Mejora en la infraestructura de la atención médica a nivel estatal.
municipal.
INDICADORES EPIDEMIOLOGICOS DE SALUD
‐Autonomía a los estados de planificación de los servicios acorde a su perfil epidemiológico. ‐Intervención estatal más expedita para la solución de problemas de salud pública y brotes epidémicos sin esperar instrucciones del nivel federal. ‐Mayor cantidad de recursos para programas enfocados a la prevención de daños a la salud.
‐No todos los estados y municipios cuentan con el personal técnico capacitado para realizar adecuaciones del modelo de atención a partir del perfil epidemiológico , de las necesidades de salud y de lo recursos financieros y materiales en el nivel estatal
Fuentes: Resultados propios a partir de entrevistas con directivos clave de los 6 estados bajo análisis. Guadalajara, Enero del 2006. Arredondo A. et al, Primer Informe Técnico. Proyecto Equidad, Gobernabilidad y Financiamiento en Salud a partir de la reforma de la salud en México. INSP, 2003‐2006.
Análisis de las características distintivas de principales Programas de Salud para grupos marginados
En esta sección se presenta un análisis descriptivo y resumido de los principales componentes de dos de los programas prioritarios de salud dirigidos a la población de mayor marginación en México: el Seguro Popular y el IMSS Oportunidades.
El Seguro Popular de Salud
Antecedentes. La creación del Seguro Popular, tuvo como principal propósito brindar atención médica a la población de bajos recursos y que actualmente carece de un sistema de protección social en salud. Parte del principio de falta de protección financiera para más de 48 millones de mexicanos que no tienen una cobertura de servicios de salud. En efecto, a pesar de los avances de la seguridad social, más de la mitad del gasto en salud en México procede directamente del bolsillo de las personas, quienes deben pagar por su atención en el momento mismo de usar los servicios. Esto deja a millones de familias ante la disyuntiva de empobrecerse o padecer alguna enfermedad y dolor por falta de recursos económicos.
Desde esta perspectiva, el gobierno federal y los gobiernos estatales han desarrollado esfuerzos de ampliación de cobertura de los servicios de salud, brindado acceso a la atención médica a la gran mayoría de los mexicanos. A pesar de ello, entre 2 y 3 millones de familias se empobrecen anualmente debido a que emplean más de la tercera parte de su ingreso para solventar sus gastos en salud. Este gasto de bolsillo cuyo desembolso se destina principalmente a la compra de medicamentos y consultas médicas afecta sobre todo a los hogares de bajos ingresos.
Según el registro del censo de población y vivienda 2000 el 57.8 por ciento del total de la población del país no está asegurada por alguna institución de seguridad social, por lo cual en la mayoría de los casos posterga e incluso deja de atenderse por el alto costo que el
Decentralized Service Delivery for the Poor 70
tratamiento involucra y el limitado patrimonio del que disponen. Este amplio sector de no asegurados se encuentra en mayor riesgo de empobrecimiento por gastos catastróficos en salud. Con la reforma la Ley General de Salud, la actual administración imprime una innovación al sistema de salud en México ya que busca que se extienda a todos los mexicanos a través de la implementación de un nuevo sistema integrado por tres seguros públicos de salud:
• Para los asalariados del sector privado formal de la economía
• Un seguro para los trabajadores al servicio del estado
• Otro seguro para los auto‐empleados
• Los trabajadores del sector informal y los desempleados sin acceso a la seguridad social
Así, la reforma posibilitó garantizar el derecho constitucional de la protección de la salud por medio del Sistema de Protección Social en Salud, el cual sirvió de instrumento para financiar la atención de la población que carece de una relación laboral o de un empleo y hasta hoy excluida de las instituciones de seguridad social. Con este tercer seguro público, como nuevo componente financiero del (SNS), se alcanza el ideal de la universalidad de la protección social en materia de salud, ya que el Sistema de Protección Social en Salud ofrece la oportunidad de que las familias no aseguradas qué estén interesadas, se incorporen a un esquema de protección social en salud operado de manera estatal, bajo la coordinación de la Federación.
Objetivos y metas. Es en este contexto que en el 2001 se creó El Seguro Popular de Salud, periodo en el cual se llevó a cabo una prueba piloto en cinco estados del país: Aguascalientes, Campeche, Colima, Jalisco y Tabasco. En 2002 fueron afiliadas 296 mil familias en 20 entidades federativas. Para el 2003, el Sistema operó en 24 estados, logrando que 614 mil familias se afiliaran. Fue hasta diciembre del 2005 que el Seguro Popular se logró implementar en los 31 estados con una cobertura de 3, 000,000 de familias en todo el país. El Seguro Popular responde al menos a tres grandes objetivos fundamentales: Brindar protección financiera a la población que carece de seguridad social a través de la opción de aseguramiento público en materia de salud; Crear una cultura de prepago en los beneficiarios del Seguro Popular y de corresponsabilidad financiera entre los niveles federal, estatal y usuarios; Disminuir el número de familias que se empobrecen anualmente al enfrentar gastos de salud.
En todos los estados, el Seguro Popular se caracterizó por ser un seguro público y voluntario, dirigido a las familias sin seguridad social en materia de salud, con el fin de evitar su empobrecimiento por causa de gastos catastróficos en salud. La operación del Seguro Popular incorporó a las familias de bajos ingresos ubicadas en los primeros seis deciles de la distribución del ingreso. Como todo esquema de aseguramiento, el Seguro Popular ofreció una serie de beneficios explícitos a los cuales el asegurado tuvo acceso en caso de

Decentralized Service Delivery for the Poor 71
padecer algún evento que lesionará su salud, siempre y cuando dicho evento este comprendido en la cobertura otorgada y sus derechos estuvieran vigentes.
Estructura organizacional. En cuanto a la estructura organizacional, el Seguro Popular depende directamente de dos instancias del nivel federal : El Consejo Nacional de Protección Social en Salud integrado principalmente por 6 miembros del gabinete federal y algunos secretarios estatales de salud; está facultado para opinar sobre el financiamiento del Seguro Popular, proponer medidas sobre el mejor funcionamiento y desempeño y acordar la creación de grupos de trabajo para el análisis de temas que el propio Consejo considere urgentes de tratar y resolver. Este Consejo, es el órgano colegiado consultivo en materia de protección social en salud, es presidido por el Secretario Federal de Salud.
La segunda instancia es La Comisión Nacional de Protección Social en Salud, órgano desconcentrado de la Secretaria de Salud, cuyo Reglamento Interno plantea que es esta instancia quién debe coordinar, supervisar, monitorear y seguir la operación del Seguro Popular, como principal brazo operativo del Sistema de Protección Social en Salud, a través de su estructura central con una dirección general y direcciones de área dependientes del nivel federal, en coordinación con las 30 coordinadores estatales del Seguro Popular, mismos que dependen del nivel estatal.
Los miembros del CNPSS también pueden formar parte de la Comisión Nacional de Protección Social en Salud y es esta última que como órgano desconcentrado, tiene como tareas fundamentales instrumentar todas las políticas de protección social, entre ellas el Seguro Popular, el plan estratégico para el desarrollo e implementación, evaluación y monitoreo del Seguro Popular. Es también esta comisión quién promueve y desarrolla los acuerdos de coordinación del Seguro Popular entre las autoridades del nivel federal y nivel estatal. Esta comisión tiene unidades de gestión, planeación y evaluación cuya tarea fundamental es el monitoreo y evaluación del desempeño del Seguro Popular.
El Convenio de Coordinación para el Establecimiento del Sistema de Protección Social en Salud es firmado entre el Secretario Nacional de Salud, el Secretario Estatal de Salud y el Gobernador. El actor social que maneja de manera directa el programa es el nivel central. En efecto el nivel central gira la instrucción a los estados y entra en un proceso de negociación para firmar los acuerdos de gestión del Seguro Popular. Son funcionaros e infraestructura del nivel estatal de la SSA que operacionalizan el programa, no hay staff e instalaciones separadas del nivel estatal de la SSA.
Estructura financiera. Para la implementación y operación del Seguro Popular se parte del principio de corresponsabilidad en el financiamiento de la salud y están consideradas tres fuentes de financiamiento:
1) Financiamiento del Gobierno Federal a través de la Secretaría de Salud. Cubre anualmente una cuota social por cada familia beneficiaria del Seguro Popular equivalente al quince por ciento de un salario mínimo general vigente en el Distrito Federal, la cantidad

Decentralized Service Delivery for the Poor 72
resultante se actualiza trimestralmente de acuerdo a las variaciones del Índice Nacional de Precios al Consumidor; adicionalmente, entrega una aportación solidaria mediante la distribución del Fondo de Aportaciones para los Servicios de Salud a la Persona, misma que representa al menos una y media veces el monto de la cuota social referida.
2) Financiamiento del Gobierno de los Estados. Los gobiernos estatales que implementan el Seguro Popular, aportan una cuota equivalente a la mitad de la cuota social que destine el gobierno federal.
3) Financiamiento de Usuarios. Los usuarios del Seguro Popular, participan con una cuota familiar que se entrega de manera anticipada, anual y progresiva, la cual se determina por su condición socioeconómica, y puede liquidarse de forma trimestral. La base para definir la cuota familiar es el nivel de ingreso o la carencia de éste; de acuerdo a su evaluación, existen familias exentas de la aportación. Las familias de deciles I y II de la distribución de ingreso, pertenecen al régimen no contributivo. La responsabilidad de colectar la cuota familiar es para el Sistema Estatal de Salud por medio de módulos y personal del área estatal del Sistema de Protección Social en Salud.
Oferta de Servicios de Salud y Modelo de Atención El modelo de salud de este programa se basa en un modelo médico asistencial mediante acciones de atención médica directa con el usuario y acciones de salud pública en cuanto a la prevención y detección oportuna de daños a la salud, así como acciones de mantenimiento del buen estado de salud. En cuanto a la producción de los servicios que ofrece, la operación y estimación de costos de producción fue regulada en un inicio por el Catálogo de Beneficios Médicos (CABEME) que establecía el servicio para 78 intervenciones diferentes, seleccionadas con base en su importancia epidemiológica, la demanda de atención y la capacidad instalada para proporcionar estos servicios. Para el 2004 fue sustituido por el Catálogo de Servicios Esenciales de Salud (CASES), que incrementó a 91 intervenciones el servicio que se proporciona; con ello se estima que se cubre el 90 por ciento de la atención médica que se registra anualmente en los estados y a nivel nacional. Las 91 intervenciones se llevan a cabo en las instalaciones físicas de los servicios estatales de salud para población no asegurada. Los recursos humanos de nivel directivo son personal de base de la SSA mientras que todos los recursos humanos de nivel operativo son contratados de manera temporal, por honorarios y a través de un proceso de reclutamiento por un comité de selección y contratación de personal.
Beneficiarios. Los beneficios del Seguro Popular están dirigidos fundamentalmente a toda población que carezca de protección social en salud y se otorga a las familias cuyos integrantes, en lo particular, reúnan los siguientes requisitos:
• Ser residente en el territorio nacional
• No ser asegurado de la seguridad social
• Cubrir las cuotas familiares correspondientes

Decentralized Service Delivery for the Poor 73
• Cumplir con las obligaciones que se le marquen
Los derechos y obligaciones de los beneficiarios sobre las 91 intervenciones del Seguro Popular son:
• Recibir sin discriminación los servicios de salud, medicamentos e insumos
• Recibir el servicio integral de salud
• Acceso igualitario a la salud
• Trato digno
• Información suficiente, clara, oportuna y veraz
• Orientación necesaria respecto de su salud
• Hacer uso de la credencial que lo acredite como beneficiario
• Cubrir su cuota familiar oportunamente
• Informar su estatus laboral.
Será dado de baja cuando el principal sostén de la familia se incorpore a alguna institución de seguridad social federal o estatal.
El procedimiento para ubicar a familias por deciles se basa en la aplicación de una encuesta automatizada con diferentes preguntas para establecer el nivel socioeconómico de las familias. El decil de ingreso aparece de manera automatizada una vez que se captura la información clave en un software desarrollado para tal efecto. Se carece de un mecanismo que verifique la efectividad de la ubicación y la veracidad de la información. La población puede mentir falseando la información, o bien el personal que afilia puede ‘ayudar’ a la familia solicitante no registrando indicadores clave y así ubicarlo en los deciles de gratuidad. Por otra parte es importante resaltar que no hay mecanismos que garanticen la permanencia de las familias en el programa.
Adicionalmente, se podrán considerar sujetos de incorporación al régimen no contributivo aquellas familias que:
• Sean beneficiarias de los programas de combate a la pobreza extrema del Gobierno Federal, residentes en localidades rurales (Oportunidades)
• Sean residentes de localidades de muy alta marginación con menos de doscientos cincuenta habitantes
• Las familias que determine la Comisión Nacional de Protección Social en Salud
Algunos Indicadores de Afiliación y Resultados del Seguro Popular: Para el primer semestre de 2005 es del 99.2 por ciento, con respecto a la meta establecida para el mismo periodo. Casi la totalidad de los estados cumplió con la cobertura de afiliación programada para el 2005, en Sonora se registró el avance menor con el 80.2 por ciento. Las familias que ya
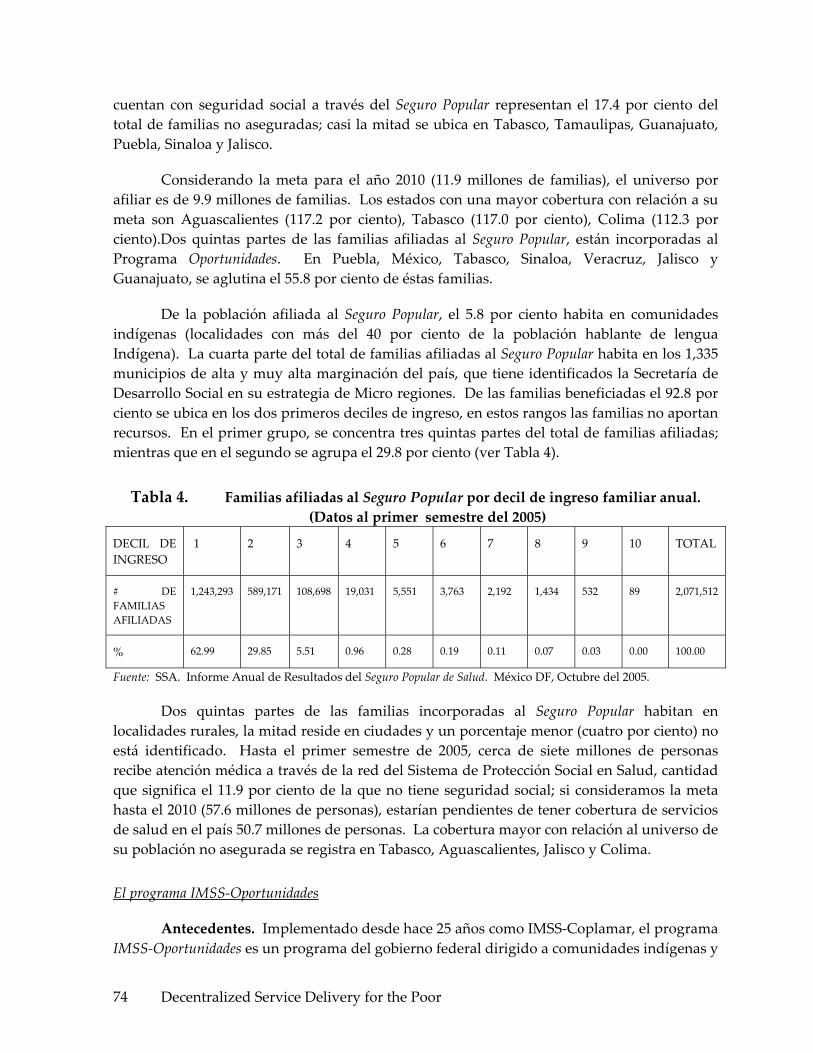
Decentralized Service Delivery for the Poor 74
cuentan con seguridad social a través del Seguro Popular representan el 17.4 por ciento del total de familias no aseguradas; casi la mitad se ubica en Tabasco, Tamaulipas, Guanajuato, Puebla, Sinaloa y Jalisco.
Considerando la meta para el año 2010 (11.9 millones de familias), el universo por afiliar es de 9.9 millones de familias. Los estados con una mayor cobertura con relación a su meta son Aguascalientes (117.2 por ciento), Tabasco (117.0 por ciento), Colima (112.3 por ciento).Dos quintas partes de las familias afiliadas al Seguro Popular, están incorporadas al Programa Oportunidades. En Puebla, México, Tabasco, Sinaloa, Veracruz, Jalisco y Guanajuato, se aglutina el 55.8 por ciento de éstas familias.
De la población afiliada al Seguro Popular, el 5.8 por ciento habita en comunidades indígenas (localidades con más del 40 por ciento de la población hablante de lengua Indígena). La cuarta parte del total de familias afiliadas al Seguro Popular habita en los 1,335 municipios de alta y muy alta marginación del país, que tiene identificados la Secretaría de Desarrollo Social en su estrategia de Micro regiones. De las familias beneficiadas el 92.8 por ciento se ubica en los dos primeros deciles de ingreso, en estos rangos las familias no aportan recursos. En el primer grupo, se concentra tres quintas partes del total de familias afiliadas; mientras que en el segundo se agrupa el 29.8 por ciento (ver Tabla 4).
Tabla 4. Familias afiliadas al Seguro Popular por decil de ingreso familiar anual. (Datos al primer semestre del 2005)
DECIL DE INGRESO
1 2 3 4 5 6 7 8 9 10 TOTAL
# DE FAMILIAS AFILIADAS
1,243,293 589,171 108,698 19,031 5,551 3,763 2,192 1,434 532 89 2,071,512
% 62.99 29.85 5.51 0.96 0.28 0.19 0.11 0.07 0.03 0.00 100.00
Fuente: SSA. Informe Anual de Resultados del Seguro Popular de Salud. México DF, Octubre del 2005.
Dos quintas partes de las familias incorporadas al Seguro Popular habitan en localidades rurales, la mitad reside en ciudades y un porcentaje menor (cuatro por ciento) no está identificado. Hasta el primer semestre de 2005, cerca de siete millones de personas recibe atención médica a través de la red del Sistema de Protección Social en Salud, cantidad que significa el 11.9 por ciento de la que no tiene seguridad social; si consideramos la meta hasta el 2010 (57.6 millones de personas), estarían pendientes de tener cobertura de servicios de salud en el país 50.7 millones de personas. La cobertura mayor con relación al universo de su población no asegurada se registra en Tabasco, Aguascalientes, Jalisco y Colima.
El programa IMSS‐Oportunidades
Antecedentes. Implementado desde hace 25 años como IMSS‐Coplamar, el programa IMSS‐Oportunidades es un programa del gobierno federal dirigido a comunidades indígenas y

Decentralized Service Delivery for the Poor 75
campesinas de las zonas mas marginadas de México. El programa es un instrumento de la política social del gobierno federal para llevar servicios y bienestar social a las zonas marginadas rurales. Es a su vez un programa de seguridad social para campesinos de grandes grupos poblacionales mediante acciones de atención primaria a la salud. Articula sus acciones a la estrategia “Contigo” y al programa de Desarrollo Humano Oportunidades, a fin de alcanzar un auténtico desarrollo humano integral, promoviendo una población beneficiaria de los servicios para el desarrollo de sus capacidades y Oportunidades con equidad y justicia para todos.
Desde su origen fue desconcentrado de la Secretaría de Salud y administrado por el Instituto Mexicano del Seguro Social. Atiende a 10.2 millones de mexicanos que no cuentan con acceso a los servicios de seguridad social. Del total de usuarios, 3.5 millones son indígenas y 1.2 millones de familias son beneficiarias del programa de Desarrollo Humano Oportunidades.
La operación de este programa se inscribe dentro de los objetivos y lineamientos del Programa Nacional de Salud 2001‐2006. Lo fundamental de este programa es la participación comunitaria para el autocuidado de la salud, logrando vincular así las acciones comunitarias con las acciones médicas.
La conexión de este programa con los servicios tradicionales del IMSS y con la SSA esta dada en dos sentidos: Hasta el mes de enero del 2006 dependió totalmente del IMSS; Solo existió una relación con la SSA a través del Comité Estatal de Salud para la coordinación en actividades de salud pública.
Existe la propuesta, de carácter oficial que a partir de marzo del 2006 cambiaran las reglas de operación y financiamiento del IMSS‐Oportunidades. Aparentemente todos los usuarios de servicios de salud de este programa pasaran al Seguro Popular. Lo plantea el nivel central y el nivel estatal está de acuerdo a reserva de que se aclaren diferentes grados de confusión en el mecanismo de financiamiento de los servicios de salud para familias procedentes de IMSS‐Oportunidades. Cuando una familia de Oportunidades pasa al Seguro Popular solo trae el financiamiento de aportación solidaria federal mas no el financiamiento que recibe el IMSS‐Oportunidades por ser afiliado a este programa. La propuesta actual plantea transferir los recursos económicos de manera parcial. El conflicto está en el financiamiento porque aparentemente todo el dinero que se daba para esas familias quedará en el IMSS y no en la SSA que es quien asumirá la oferta total de servicios de salud a familias que estaban en el IMMS‐Oportunidades.
Objetivos y metas. Para responder a las necesidades de la población beneficiaria y en apego a las estrategias de atención primaria a la salud, se instrumentó un Modelo de atención cuyos servicios son gratuitos. Los objetivos centrales de este programa consisten en proporcionar servicios de salud integrales de primer y segundo nivel de atención, oportunos y de calidad a la población no asegurada, de zonas rurales marginadas, a través de un modelo de atención que sustenta fundamentalmente la participación comunitaria para

Decentralized Service Delivery for the Poor 76
realizar actividades tendientes a mejorar las condiciones de salud de los individuos y su entorno familiar y comunitario. Para ello se proponen las siguientes metas:
• Enfrentar las causas de la pérdida de la salud así como sus consecuencias.
• Proporcionar atención médica integral, disponible, adecuada y continua, a un costo factible para el país y que sea aceptada por la comunidad.
• Promover la participación de la comunidad, en el cuidado de la salud, individual, familiar y colectiva.
• Propiciar el aprovechamiento de los recursos de salud disponibles, incluidos los de la medicina tradicional y fomentar el empleo de tecnologías apropiadas de bajo costo y alto impacto social.
• Disponer de mecanismos de información y evaluación permanentes en los distintos niveles de la organización del Programa, que permitan determinar su impacto en la salud de la población.
• La participación consciente, voluntaria y organizada de la comunidad a través de grupos de voluntarios que promueven la salud individual, familiar y colectiva.
Estructura Organizacional. El IMSS a través de su estructura institucional dispone de la normatividad específica para la administración de todos los recursos humanos, financieros y materiales que utiliza el IMSS‐Oportunidades. La estructura organizacional del programa tiene como principales órganos de control un Coordinador general del programa, del cual dependen cuatro coordinadores (todos ellos a nivel nacional): coordinador de atención médica, coordinador de acción comunitaria, coordinador administrativo y coordinador de planeación y evaluación, todos ellos de nivel federal. Existe una interacción permanente entre los 4 coordinadores, el coordinador general y los 7 niveles delegacionales. El nivel mas operativo utiliza diferentes directores regionales para la coordinación, gestión, monitoreo, evaluación y contratación de recursos humanos para el desarrollo del programa. Los recursos humanos y mecanismos de coordinación se distribuyen en dos niveles, el primero corresponde a la Unidad Médica Rural y Unidad Médica Urbana que cuentan con un equipo de salud integrado por un médico en servicio social y dos auxiliares. El reclutamiento de los médicos se realiza bajo el esquema del servicio social. Existe un médico supervisor (personal contratado) de varias unidades que se coordina con los directores regionales.
Las Unidades que no logran cubrirse con médicos en servicio social, se ocupan mediante contrataciones temporales con médicos titulados. El personal auxiliar son dos habitantes de la comunidad sede, con escolaridad primaria o secundaria y con dominio del idioma local cuando se trata de comunidades indígenas. Los auxiliares reciben adiestramiento continuo por el médico responsable de la unidad médica. Los hospitales rurales cuentan con una capacidad instalada de 20‐70 camas y se organizan con la estructura de un cuerpo de gobierno compuesto por un director, un administrador, un jefe de enfermeras y un médico residente. El resto del personal son diferentes profesionales de la salud en servicio social.

Decentralized Service Delivery for the Poor 77
Para el monitoreo y control de todas las estrategias del programa, se cuenta con equipos directivos con estrecha interacción y reuniones semestrales o bimestrales entre: nivel central, delegacional, hospitalario y zonal, siempre bajo la dirección de la coordinación general y los cuatro coordinadores adjuntos a nivel nacional. Son los equipos que efectúan las acciones de planeación, capacitación, supervisión, presupuestación, control, seguimiento y contratación de recursos y cumplimiento de todos los compromisos del programa.
Para fines de coordinación real, los voluntarios, personal contratado y comités de salud dependen de instancias asignadas desde el nivel estatal del IMSS en los municipios donde está el programa. A su vez las delegaciones estatales rinden cuentas y son monitoreadas y controladas desde el nivel central a través de la Coordinación Nacional de IMSS‐Oportunidades. Para fines prácticos, a la fecha no hay evidencias de alguna relación formal‐organizacional‐institucional entre este programa y el resto de autoridades estatales de salud.
Respecto a la contratación de recursos humanos para este programa, recientemente se llevó a cabo la revisión contractual entre los representantes del IMSS y el SNTSS, con lo cual se regularizó la situación jurídico‐laboral de los trabajadores del Programa; para ello se incorporaron en el Contrato Colectivo de Trabajo los documentos normativos denominados: “Reglamento para los Trabajadores del Programa IMSS‐Oportunidades” y los “Reglamentos que fijan las Bases para la Creación y Transformación de las Plazas N34 en plazas de Categoría Autónoma de Médico General para el Programa IMSS‐Oportunidades y del Esquema de Solidaridad Social”, con los respectivos derechos a jubilaciones y pensiones.
Estructura Financiera. Todos los recursos financieros de este programa provienen del nivel federal. Los recursos son otorgados en su totalidad por el Gobierno Federal, por lo que su gasto se ejerce conforme a la Ley del Seguro Social y a los lineamientos que cada año establece el Decreto del presupuesto de Egresos de la Federación. El IMSS, a través de una coordinación nacional, es quién tiene la responsabilidad del ejercicio de estos recursos.
Oferta de servicios de salud y modelo de atención: El Programa fundamenta su operación en el Modelo de Atención Integral a la Salud, que se sustenta en la participación comunitaria, a través de más de 260 mil voluntarios que actúan como vínculo entre las unidades médicas y la comunidad, la gratuidad de los servicios para los beneficiarios se otorga a cambio del autocuidado de su salud; para lo cual el Programa cuenta con una red regionalizada de servicios integrada por 3,540 unidades médicas rurales y 69 Hospitales Rurales. El Programa está dirigido a los estados con las comunidades de mayor índice de marginación, con ausencia de infraestructura de servicios de salud de la SSA pero que contaron con un mínimo de infraestructura de clínicas del IMSS‐Coplamar. La cobertura se encuentra en más de 16 mil localidades pertenecientes a 1,264 municipios en 17 Estados de la República.
El Programa IMSS Oportunidades opera un Modelo de Atención, basado en los lineamientos de la Atención Primaria a la Salud. Parte de un Diagnóstico de Salud para
Decentralized Service Delivery for the Poor 78
atender las prioridades de las localidades comparadas con la plena participación de la población. El modelo de atención integral a la Salud que opera el Programa IMSS Oportunidades se fundamenta en la participación organizada de la comunidad contando con un ejército de 260,770 voluntarios
Actualmente la organización comunitaria, eje y parte fundamental en la aplicación del Modelo de Atención Integral a la Salud la conforman 17,035 comités de salud, 150,012 promotores sociales voluntarios, que orientan a un promedio de 13 familias, incluida la propia, así como los 13,785 asistentes rurales de salud ya mencionados. Además se mantiene interrelación con 5,708 parteras y 2,016 terapeutas tradicionales. Los voluntarios asumen un rol de promotores de salud principalmente en actividades de promoción y de autocuidado para prevenir daños o complicaciones de daños a la salud en las familias adscritas. Los Comités de Salud, incluyendo promotores y asistentes de salud, diseñan, implementan y monitorean actividades de prevención, promoción y curación que determinan los programas de salud a partir discusiones y consensos comunitarios sobre las necesidades de salud a nivel local.
Las prioridades y estrategias de este programa son: Prioridades: Salud reproductiva y materno infantil, Desarrollo Humano Oportunidades y nutrición, Atención Integral al Adolescente, Atención Integral a la Salud Ginecológica y Comunidades Saludables y Proyectos Productivos. Estrategias: PREVENIMSS Rural, Comunicación Educativa “De la gente para la gente,” Transferencia tecnológica (Saneamiento Ambiental) y Tecnología Informática al medio rural. Partiendo de estas prioridades y estrategias, el Programa IMSS‐Oportunidades promueve un puente firmemente construido, que conjunta las acciones médicas con las acciones de la comunidad, para potenciar las capacidades y generar la igualdad de Oportunidades a través de las siguientes acciones de atención médica.

Decentralized Service Delivery for the Poor 79
Gráfico 1. Cinco Principales acciones de atención médica de IMSS‐Oportunidades a partir de la integración de prioridades y estrategias
ACCIONES DE ATENCIÓN MÉDICA
Nutrición Salud Reproductiva
‐ Centro de Educ. Nutr. ‐ Suplemento alimentario ‐ Sesiones educativas ‐ Preparación y consumo de alimentos
‐ Información ‐ Consejería en planificación familiar ‐ Atención prenatal
Atención Integral al Adolescente
Salud Ginecológica Crónico Degenerativas
Información sobre: ‐ Salud sexual y reproductiva ‐ CARA ‐ Comités juveniles ‐ Sesiones educativas ‐ Talleres
‐ Exploración ginecológica ‐ Visualización de Cervix ‐ Detecciones de cáncer cérvico uterino y de mama
‐ Diabetes ‐ Hipertensión ‐ Tuberculosis
Fuente: IMSS. Manual de organización de la Coordinación General del Programa IMSS‐Oportunidades. México DF, Octubre del 2003.
Beneficiarios. Los servicios de este programa son abiertos a la población en general, dentro del ámbito de las unidades médicas rurales o de los hospitales rurales, es decir cualquier persona puede acudir a sus instalaciones y de manera gratuita demandar servicios de atención médica. Por lo tanto no hay requisitos o criterios de selección, aunque si hay criterios de adscripción: cada unidad médica/hospital rural tienen su población objetivo y se adscribe a través de la tarjeta de adscripción a unidades médicas, a toda la población universo de trabajo, demande o no la atención; Para la población que vive en el resto del área de influencia y demanda atención médica, se le incorpora al igual que la población adscrita; Existe un registro diario de población adscrita que solicita atención médica y que forma parte del sistema de información en salud para no asegurados.
Los usuarios tienen derecho a recibir cualquier servicio de la atención médica integral que sustenta el programa (acciones dirigidas al individuo, a la familia y a la comunidad). Se exime totalmente a la población usuaria del cobro de cuotas de recuperación. Los usuarios de este programa deben asumir el compromiso de participar en la realización de acciones que contribuyen a mejorar sus condiciones de salud.
Algunos Indicadores de Resultados de IMSS‐Oportunidades: Se ha continuado la aplicación del Componente Salud del Programa Desarrollo Humano Oportunidades del Gobierno Federal mediante el beneficio a usuarios de servicio de salud de 1’156,509 familias. Para atender a las familias de las localidades lejanas que no tienen servicios de salud (225 microrregiones en 2,541 localidades de México), cuenta con equipos auxiliares de supervisión integrados cada uno por una enfermera general y un promotor de acción comunitaria,

Decentralized Service Delivery for the Poor 80
responsables de supervisar a los asistentes rurales de las microrregiones y proporcionarles apoyo, asesoría y dotación de insumos.
Como uno de los objetivos primordiales del Programa Arranque Parejo por la Vida se enfatizó la prevención de daños a la salud del binomio madre – hijo, una de las acciones sustantivas para lograr este objetivo es la vigilancia del embarazo a través del control prenatal, lo que permite identificar, prevenir y en su caso manejar oportunamente todos aquellos factores que aumentan el riesgo para su salud.
Se puso en marcha en todas las comunidades en las que opera el Programa la estrategia PREVENIMSS Rural, a fin de incentivar la creación de una cultura de cuidado corresponsable de la salud. Con ello, a la equidad curativa que ya procura el Programa con los Encuentros Quirúrgicos se suma ahora la equidad preventiva entre el régimen obligatorio e IMSS Oportunidades.
En áreas rurales donde tiene presencia IMSS‐Oportunidades opera la estrategia de Contraloría Social mediante la cual se escucha la opinión de la población rural sobre los servicios que recibe y se reconocen sus insatisfacciones y quejas. El índice de resolución y atención de quejas ha mejorado y para el período que se informa el 91%, de las 7,009 quejas fueron resueltas.
Como parte de la sección de programas prioritarios de salud para población no asegurada a continuación se presenta en la Tabla 5, un análisis comparativo de las características distintivas de los programas revisados en comparación con los servicios de salud para toda la población no asegurada.

Decentralized Service Delivery for the Poor 81
Tabla 5. Análisis comparativo de SS públicos, Seguro Popular e IMSS Oportunidades. México 2005
Fuente: Resultados propios a partir reidentificación de características distintivas entre los principales programas de salud dirigidos a la población de mayor marginación en México. Diciembre del 2005.
PROGRAMA
Principios y efectos en reducción de desigualdades
Tipo de servicios
Cobertura
Beneficiarios Fuentes de financiamiento
Participación por nivel de gobierno
Participación Comunitaria
Programa de Servicios Públicos de salud a toda la población
Se basa en el principio de Ciudadanía. Promueve la desigualdad al interior de los no asegurados
Paquete Básico de 71 intervenciones y todos los servicios de primer, segundo y tercer nivel que soliciten y puedan pagar los usuarios. El rango de servicios varía en los estados.
12 000000 de familias
Todos los usuarios que demanden atención a la salud y que preferentemente no cuenten con seguridad social
Federal, Estatal, Municipal y Usuarios (dependiendo del Estado o Municipio).
Federal, Estatal y Municipal
Participación pasiva y dirigida por los proveedores de servicios de salud
Seguro Popular de Salud
Se basa e principios de Ciudadanía y Pobreza. Tiene efecto positivo en protección financiera, el dinero sigue al usuario. Reproduce todos los efectos negativos del modelo clásico de atención a la salud.
Servicios de salud para las 150 intervenciones especificadas en el catalogo de servicios del Seguro Popular. (más en primer y segundo que en tercer nivel )
3 500 000 de familias
Familias sin seguridad social adscritas al programa
Federal Estatal Hogares (dependiendo del decil de ingreso familiar anual)
Federal Estatal
Participación pasiva en el proceso de atención médica pero activa en el financiamiento dependiendo del decil de ingreso
IMSS Oportunidades
Basado en principios de Ciudadanía, Pobreza extrema y Grupo prioritario. Efecto populista y paternalista sobre el sistema de salud y sobre los usuarios
Servicios de primer y segundo nivel que demanden los usuarios en el rango de las 5 acciones de Atención Médica del programa.
1 156 509 familias
Familias sin seguridad social que residen en el área de influencia de las unidades médicas del programa (comunidades mas marginadas)
Federal
Federal
Participación muy activa, constante y permanente en la mejora de condiciones de salud a nivel individual y colectivo
Decentralized Service Delivery for the Poor 82
Resultados sobre el análisis de indicadores sociales, de financiamiento en salud, de gobernabilidad y de impacto en salud para los estados bajo estudio
Tendencias del gasto en salud e indicadores sociales
Respecto a las tendencias y cambios en el gasto en salud e indicadores sociales seleccionados, los resultados presentan diferencias dependiendo del tipo de estado que se trate (ver gráficas 1‐5). En efecto, para los dos estados de ingreso bajo se observa para 1995 una tendencia decreciente tanto para gasto en salud como para ingreso per cápita. En el resto de indicadores no hay tendencias decrecientes significativas, más bien se observa una tendencia mínima creciente y constante de 1990 al 2002. En otras palabras podemos decir que en los estados de ingreso bajo analizados aparentemente no existe correlación entre tendencias de indicadores económicos y efectos en indicadores sociales.
Para los estados de ingreso medio, se observa el mismo tipo de tendencia decreciente para 1995 sin aparentes efectos sobre el resto de indicadores sociales. Una diferencia importante en comparación con los estados de ingreso bajo, es la más rápida recuperación de la tendencia creciente tanto del gasto en salud como del ingreso per cápita. Por otra parte en Colima llama la atención la tendencia tan irregular del ingreso per cápita. En los estados de alto ingreso, igualmente se presenta la tendencia decreciente para 1995 para gasto en salud e ingreso per cápita. Una diferencia importante en estos estados, en relación a los de ingreso bajo y medio, es la tendencia decreciente que estos estados vuelven a presentar al final del período de estudio.
Tendencias de los diferentes indicadores de financiamiento en salud
Sobre el comportamiento de los montos de las aportaciones federales al gasto en salud para no asegurados, para todo el período de análisis, Tabasco es el único estado que desde el inicio de la descentralización muestra evidencias con tasas crecientes constantes de responsabilidad financiera desde las aportaciones del nivel estatal al gasto en salud (ver gráfica 6). En efecto este estado desde el principio de la descentralización asumió alrededor del 50 % del gasto en salud. El otro estado que asumió esta responsabilidad es el estado de Jalisco a partir de 1995, año en que se reactiva la segunda fase de la descentralización. En el resto de los estados el gasto total en salud depende en su mayoría del nivel federal (entre el 93 y 95 %). Estos resultados también se han observado en otros países cuando se han implementado cambios en las políticas de financiamiento o en reformas a la producción de servicios de salud.
Para el caso de Baja California, se observó una tendencia creciente con una caída importante para 1995 pero con una rápida recuperación a partir de 1996, llegando a incrementos importantes del gasto en salud para el 2003. Respecto a las aportaciones del nivel federal al gasto en salud para el periodo 1990‐2003 en el estado de Baja California, presentó tendencias irregulares. Durante la primera parte del período (1990‐1995) se observan tendencias decrecientes que a partir de 1996 tienden a recuperarse, tanto en pesos
Decentralized Service Delivery for the Poor 83
constantes como en dólares. Decrecientes. Sobre las aportaciones federales llama la atención que al final del período se incrementa la participación financiera del nivel federal contrario a lo que se esperaría a medida que avanza la reforma y la descentralización de la salud en este estado.
Sobre el aporte del nivel estatal al financiamiento de la salud también se observa una tendencia irregular con incrementos y decrementos dependiendo del año bajo estudio. No obstante podría decirse que en la primera parte del periodo se observa una tendencia al incremento misma que tiende a estabilizarse durante la segunda parte del período (ver gráfica 9).
Es evidente y significativa la diferencia de aportación monetaria al compararlo con el nivel federal. Llama la atención que, aunque mínima, si se mantiene una tendencia incremental en este tipo de aportaciones. En lo que se refiere al aporte del nivel municipales hasta 1997 que se inicia con la responsabilidad financiera de la salud desde el nivel municipal. Aunque el aporte en este estado es mínima (del 1.2%), es importante resaltar que mantiene una tendencia al incremento y se espera que en los próximos años se mantenga. Finalmente en cuanto al aporte de los hogares a través de las cuotas de recuperación que se pagan a los centros de atención a la salud para población no asegurada, resalta el hecho de una tendencia al incremento en la primera mitad del período con una tendencia en franco decremento en la segunda mitad del período pasando de 11.8% en el año de mayor aporte a 3.1% en el último año del estudio. Esto es de particular importancia porque significa que la participación de los hogares en el financiamiento de la salud para este estado decreció en aproximadamente un 80%.
Para el caso de Colima, las tendencias del gasto en salud para población no asegurada presenta una tendencia regular e incremental y constante sin ninguna caída significativa en ningún año del periodo. La aportación del nivel federal al financiamiento de la salud en este estado es relativamente alta y presenta tendencias irregulares. En efecto mientras que al principio del periodo el aporte federal representó el 94.7% del gasto total en salud, para 1994 el nivel de participación bajo al 87.9, volviendo a subir al final del período y en el año 2002 este mismo aporte representó el 94.7 del gasto total en salud. El aporte del nivel estatal al gasto en salud se mantiene con cambios importantes. Para 1990 fue del 2.5%, llegando a su máximo en 1994 con un 5.7% para volver a caer a 3.1 en el 2002‐2003. Llama la atención no solo los cambios tan irregulares en las tendencias de este tipo de aporte financiero sino también en el peso relativo tan bajo de este aporte sobre el total del gasto en salud. Algo similar sucede con el aporte del nivel municipal. Este aporte inicia con una cantidad muy baja en 1999 y no solo no se mantiene sino que tiende a disminuir pasando de .5 a .2 como % del gasto total en salud.
Respecto al aporte de los hogares al financiamiento de la salud en Colima, al igual que en el resto de aportaciones se observan tendencias muy irregulares iniciando el periodo con 2.6, llegando a mitad del período con 6.9 y cayendo al final del período para el año 2003 al 2.1% del gasto total en salud. Evidentemente llama la atención no solo la irregular

Decentralized Service Delivery for the Poor 84
participación de los hogares en este estado, también llama la atención la caída del 50% de la participación de hogares en el financiamiento en salud al final del período. Lo que más llama la atención en el caso del estado de Colima es la caída de más del 100% de la participación de los hogares en el gasto en salud, justamente después de la reforma y de la descentralización en salud (ver gráfica 8).
En cuanto a los resultados para Jalisco, este es uno de los estados donde se presentan tendencias con incrementos constantes y de peso importante en el gasto total en salud. Sobre los cambios en los montos financieros que aporta el nivel federal se observan tendencias decrecientes en el peso relativo de la aportación del nivel federal; estas tendencias se mantienen constantes desde el primero hasta el último año del período de estudio pasando del 95.5% en 1990 a 59.0% en el 2002. A diferencia de los cambios en el nivel federal, los cambios en la participación financiera del nivel estatal, presentan tendencias crecientes. Para el primer año del estudio, 1990 la participación estatal fue del 1.5%, presentando una tendencia creciente constante y llegando a representar para el año 2002 el 28.7% del gasto total en salud. Algo similar sucede con las tendencias de los montos financieros del nivel municipal. Aunque el aporte financiero del nivel municipal a la salud en Jalisco aparece en 1996 las tendencias se mantienen crecientes y constantes pasando de .5 a 1.6% del gasto total en salud al final del período. En cuanto al aporte de los hogares para el financiamiento en salud, al igual que en las aportaciones de niveles estatal y municipal se observan tendencias crecientes constantes desde al inicio hasta el final del período de estudio.
Respecto a las tendencias comparativas por variable de estudio, sobre las tendencias del aporte federal al financiamiento de la salud, son los estados de Tabasco y Jalisco que presentan tendencias decrecientes con mayor énfasis a partir de 1995, justamente el año de corte del período de estudio. Respecto a los resultados comparativos del aporte estatal, llama fuertemente la atención la diferencia tan marcada a partir de 1996 de incremento de la responsabilidad financiera del gobierno del estado de Jalisco en la salud y la d Tabasco desde principios del período. El caso de Oaxaca, Hidalgo, Colima y Baja California se mantienen mas o menos con las mismas tendencias decrecientes para el final del período de estudio. Los resultados sobre el aporte municipal, evidencian incrementos importantes en Tabasco, Jalisco y Baja California, con descensos en el caso de Colima, Oaxaca e Hidalgo. Llama la atención la tendencia decreciente tan marcada de la aportación de los hogares en los casos de Colima, Tabasco y Baja California, así como la tendencia creciente constante por los hogares en el caso de Jalisco, Oaxaca e Hidalgo.
El análisis comparativo de las tendencias del gasto total en salud para cada estado bajo estudio, muestra evidencias de que en los 6 estados se observan tendencias crecientes constantes y sólo en el caso de Colima, Oaxaca e Hidalgo se dio una caída significativa en el año 1996, misma que se recupera inmediatamente en el año 1997‐98. También es importante resaltar que en todos los estados las tendencias crecientes son mucho más importantes a partir del año 1997. Es Jalisco el estado que recibe mas recursos aunque al hacer el análisis por gasto per cápita al final del período, es el estado de Baja California el que representa un

Decentralized Service Delivery for the Poor 85
mayor gasto per cápita (208 USD), seguidos de Colima (147 USD), Tabasco (146 USD), Jalisco (107 USD), Hidalgo (88 USD) y en último lugar Oaxaca (77 USD)
En cuanto a las tendencias de los montos de financiamiento por objeto de gasto en el estado de Baja California, es importante resaltar que los montos de inversión para atención preventiva presentan tendencias crecientes, aunque un tanto irregulares. La atención curativa en este mismo tipo de población representó el rubro con mayor inversión y con tendencias crecientes constantes. En lo referente a montos de inversión para atención curativa se observaron tendencias decrecientes que pasan de 65.0% en 1990 a 68.3% en el 2003. Lo contrario sucede para las tendencias de montos de inversión en gastos de administración, pasando estos de 27.9% en 1990 a 18.0% en el 2003. Dos evidencias llaman la atención: en primer lugar, la inversión en atención curativa es relativamente muy alta; en segundo lugar, los gastos de administración y personal también son muy altos, aunque tienden a decrecer al final del período (ver gráficas 9, 10 y 11).
Respecto a las tendencias para población no asegurada en Colima, los montos invertidos en atención preventiva presentaron tendencias crecientes constantes pasando del 10.3% al 25.6% para el final del período de estudio. Lo anterior significó un incremento del 100% durante todo el período de estudio. En el caso de la atención curativa se observaron tendencias con cambios irregulares pero que al final del período un mínimo descenso (paso de 56.7% al 55.0%). Diferentes fueron los resultados para gastos de administración; en efecto, estos presentaron tendencias con cambios decrecientes constantes que pasaron del 33.0% en 1990 a 23.4% en el 2003. En este estado, existe un alto porcentaje asignado a atención curativa y altos gastos de administración para población no asegurada, que aunque tienden a decrecer son significativamente diferentes del mismo tipo de gastos para población asegurada.
El destino final de los recursos en el estado de Jalisco presenta cambios con tendencias muy irregulares en todos los rubros. En atención curativa se presentan tendencias con altas y bajas inconstantes de tal forma que el primer y último año resultó en el 12% del gasto total en salud, con máximos y mínimos que varían desde 8% al 18% dependiendo del año bajo estudio. En las tendencias del destino final para atención curativa se observan cambios crecientes constantes pasando de 72% en 1990 al 73.1% en el 2003. Llama la atención que a diferencia de los otros dos estados en este, los gastos de administración presentan tendencias con cambios crecientes constantes pasando del 4% al 11% y representando un incremento de poco mas del 100% en gastos de administración.
Tendencias del gasto en salud e indicadores de salud
En esta sección se analizan posibles relaciones entre tendencias del gasto en salud con tendencias en los siguientes indicadores de impacto en salud: Incidencia (casos) de Mortalidad Infantil (menores de 1 año) y Mortalidad Materna (todas las causas). Tasa de morbilidad por Diabetes Mellitus tipo II (DMII) e Infecciones Respiratorias Agudas (IRAs), por 100,000 habitantes.
Decentralized Service Delivery for the Poor 86
La mortalidad es el indicador que, paradójicamente, mejor describe las ganancias y la situación de la salud de la población. En México el descenso de la mortalidad se observa en forma sostenida desde poco antes de 1940; sin embargo esta disminución no se ha dado de manera homogénea en todos los estados del país, como se verá mas adelante, siendo las áreas rurales y en particular los grupos étnicos los menos favorecidos en la mejora de estos indicadores de salud.
Mortalidad Infantil: En los 6 estados, se observan importantes descensos en la tendencia de este indicador comparados con los cambios del gasto en salud realizado en ese periodo. Se observa que entre 1995 y 1996 hubo un descenso del gasto en salud, de 200,000 a 120,000 USD, pero a partir de 1997 el incremento del gasto es notorio, hasta alcanzar más de 250,000 USD en el 2002. Por otra parte, la mortalidad infantil nacional, muestra una tendencia ascendente de 1990 a 1993, de 245 a más de 1000 muertes por cada 100,000 nacidos vivos, para disminuir a 328 muertes por 100,000 nacidos vivos, y ahí nuevamente incrementarse, hasta estabilizarse en alrededor de 500, en el año 2003. Si bien hay Estados en donde la tendencia ha sido notoriamente más baja que la media nacional, Jalisco (125 en 2003), existen otros Estados con importantes variaciones, como Tabasco, Oaxaca e Hidalgo, en donde se observan los mayores casos de mortalidad materna, de los 6 Estados comparados, arriba de la media nacional. En Tabasco se observa las mayores tasas de mortalidad, arriba de 1,000 en todo el período observado, incluso llegar a 1936 muertes por 100,000 en 1991. A partir del año 2000 parece observarse una tendencia a la estabilización alrededor de 1000 casos por 100,000. En Oaxaca se observa una tendencia ascendente en la tasa de alrededor de 950 casos en 1991 a más de 1400 casos por 100,000 nacidos vivos en 1993, y a partir de allí una tendencia descendiente hasta alrededor de 450 casos en el 2003. En forma similar el estado de Hidalgo muestra un incremento en la tasa por este indicador arriba de 1,000 entre 1991 y 1993, para entonces mostrar una tendencia decreciente hasta menos de 300 en 1999, para luego repuntar hasta 578 en el 2003. Por otra parte en Jalisco se ha observado una tendencia en la tasa de mortalidad infantil, menor a la media nacional. Se observa un incremento importante entre 1993 y 1994 (de 509 a 729 muertes por 100,000), para descender a menos de 200 en 1994, y mantener esa tendencia estable hasta el 2003 (125 por 100,000). Los estados de Colima y Baja California Sur muestran una tendencia estable intermedia, similares a la media nacional, para el período observado. (Ver gráfica 12)
Mortalidad materna: Considerado los seis estados analizados, se observan también cambios de este indicador en relación al gasto en salud. El gasto en salud tuvo un incremento entre 150 mil USD en 1990 a 250 mil USD en 1994, descendiendo a 120 mil USD en 1995, para luego repuntar a más de 260 mil USD en 2003. La tendencia nacional muestra variaciones entre 5 y 10 casos de MM anuales. Sin embargo, al comparar los seis estados, se observan mayores variaciones, en los Estados de Jalisco, Oaxaca y Tabasco, que llegaron a reportar entre 20 y 30 casos de MM anuales. En Tabasco se observó un repunte de 5 a más de 20 casos entre 1990 y 1991 y nuevamente de 12 a más de 20 casos nuevamente entre 1999 y 2000; en Oaxaca de 25 a 33 entre 1993 y 1994; y en Jalisco de menos de 5 casos en 1995 a 30 en 1996. A partir del 2001 se observa que en estos tres Estados los indicadores se acercan o disminuyen con la media nacional. En relación a los otros tres estados, Hidalgo, Colima y
Decentralized Service Delivery for the Poor 87
Baja California Sur, en el periodo observado la tendencia se ha mostrado estable, menor a la nacional, en alrededor de tres casos de MM reportados anualmente1 descender Dados los pocos caos reportados a nivel estatal, no se observan mayores cambios en el período. Sin embargo al comparar con el reporte nacional de casos, si se observa una tendencia a la baja de este indicador entre 1994‐96, un repunte en 1997‐98, y nuevamente una tendencia al descenso a partir del año 2000, comparado con un incremento en el gasto en salud a partir de 1996 (ver gráfica 13).
Incidencia DMII (tasa por 100,000 habitantes). También se observan importantes diferencias entre el indicador del gasto en salud y la tasa de morbilidad por esta patología. En los 6 estados se observan comportamientos irregulares entre 1990 y 1995, y mostrando una tendencia más estable de 1996 al 2003, acercándose a la media nacional. El Estado que mayores cambios muestra en este periodo es Baja California Sur, con reportes de más de 600 casos en 1990 a 100 en 1991, incrementar a 500 en 1992, descender a alrededor de 100 casos en 1994 y estabilizarse en alrededor de 100 casos a partir de 1995. En todo el periodo ha permanecido arriba de la media nacional. En Colima también se observan fluctuaciones arriba de la media nacional en el período de 1990 a 1994. Estados como Oaxaca y Tabasco muestran tendencias inferiores a la media nacional, alrededor de 100 casos o menos en todo el periodo observado (ver gráfica 14).
Incidencia IRAs (tasa por 100,000 habitantes). Considerando que se trata de una patología de ocurrencia y reporte frecuentes, se observan comportamientos irregulares para todos los estados. En los Estados de Hidalgo y Colima se observan variaciones importantes arriba de la media nacional en el periodo 1991‐1996 (ver gráfica 15).
En Oaxaca se observa una tendencia ascendente entre 300 y 600 mil USD anuales, incrementándose a partir de 1999 a más de 1 millón 200 mil USD en 1999. Esto se relaciona con cambios en los indicadores de salud. Se observa un importante descenso en la tendencia de mortalidad infantil, de 420 casos en 1997 a 276 en el 2001. El total de casos de MM reportado, se ha mantenido con una tendencia estable. Respecto a la tasa incidencia de DMII e IRAs también se observa un descenso, a partir de 1992. Para el Estado de Hidalgo también se observa un importante descenso en la mortalidad infantil de más de 250 casos en 1992, a 200 en el 2001, relacionado posiblemente, con el incremento en el gasto en salud, a partir de 1993.
En Colima se observan tasas estables para la mortalidad infantil (alrededor de 50) y mortalidad materna. La gráfica muestra una tendencia irregular para incidencia por DMII e IRAs, estabilizándose a partir de 1996 (descenso de 417.7 en 1990 a 115.9 en 2001 para DMII, y descenso de 23672.8 en 1990 a 12784.5 en 2001). La inversión del gasto en salud tuvo un pequeño ascenso entre 1992 y 1994, decreció 3 años, para repuntar nuevamente a partir de 1997 (incremento de 100,000 USD en 1997 a más de 300,000 USD en 2001). En tabasco se observa una tendencia de tasas altas de mortalidad infantil alrededor de 700 muertes anuales). Los demás indicadores de salud, MM, incidencia DMII e IRAs, muestran tendencia

Decentralized Service Delivery for the Poor 88
estable. EL gasto en salud tuvo un incremento notorio a partir de 1997 (de 200 mil USD a más de 650 mil USD en 2001).
Para Baja California Sur, se observa un importante descenso en las tasas de incidencia de DMII e IRAs a partir de 1994. (De 650.4 en 1990 a 88.3 en 1994 para DMII, y de 30,800.5 en 1990 a 8029.5 en 1994 para IRAs). Aunque en los últimos años ha habido incremento en los casos reportados, las tendencias se mantienen estables. En el caso de la mortalidad materna e infantil, las tendencias permanecen estables a lo largo del período. La inversión del gasto en salud se incrementó notoriamente desde 1996, de 170 mil USD a 500 mil USD en 2001. Para el Estado de Jalisco se observa un descenso en tres indicadores de salud (mortalidad infantil, incidencia de DMII e IRAs), entre 1992 y 1994, y a partir de 1998 se observa nuevamente una tendencia al incremento. La MM se mantiene estable. La inversión del gasto en salud inicio con 300 mil USD en 1990 teniendo un incremento importante a partir de 1996 (400 mil USD en 1996 a 800 mil USD en 2001.).
Tendencias de indicadores de cobertura en salud
Respecto a la cobertura en el número de médicos por 1000 habitantes, Jalisco y Tabasco son los que cuentan con más médicos por habas., seguidos de Oaxaca e Hidalgo. Estos 4 estados están por arriba de la media nacional mientras que baja California Sur y Colima están inmediatamente por debajo de la media nacional. No deja de llamar la atención que los dos estados de mayor ingreso se encuentran en el extremo inferior y extremo superior respecto a este indicador (ver gráfica 16). En efecto, el estado de Jalisco es el que cuenta con el indicador mas alto mientras que Baja California Sur con el indicador más bajo. En cuanto a las tendencias de camas censables como indicador de cobertura, en términos generales se observan las mismas tendencias que para el caso de médicos por habitantes, llamando la atención de una brusca caída con pronta recuperación para 1999 y manteniéndose constante hasta el 2003. El cambio creciente tan brusco en el caso de Jalisco, se debe al hecho de que a partir de 1997 el hospital civil de Guadalajara, con más de 1300 camas censables pasa a formar parte de la infraestructura de los servicios de la SSA‐estatal (ver gráfica 17). Sobre la cobertura del programa ampliado de vacunación, el punto a resaltar es que todos los estados están por debajo de la media nacional, solo se presentan dos tendencias crecientes, una para 1991 en el estado de Tabasco y otra para 1994 en el estado de Hidalgo (ver gráfica 18).
Tendencias de indicadores de eficiencia en salud
Sobre las tendencias de tasa de ocupación hospitalaria, llama la atención que Hidalgo, Tabasco, Oaxaca y Colima presentan tasas de ocupación por arriba de la media mientras que Jalisco y Baja California Sur, por debajo de la media (ver gráfica 19). Aquí hay que resaltar que estos dos últimos estados son los de mayor ingreso per cápita y donde la mayoría de la población o cuenta con seguridad social o cuenta con poder adquisitivo para atenderse en hospitales privados. Sobre el índice de rotación como indicador de eficiencia (camas censables vs. egresos hospitalarios), las tendencias son similares pero con una tendencia mas

Decentralized Service Delivery for the Poor 89
marcada por debajo de la media para Jalisco y Baja California Sur (ver gráfica 20). Asimismo la tendencia más marcada por arriba de la media corresponde al estado de Hidalgo y Oaxaca, al principio del período aunque al final del período solo se mantiene Hidalgo, ya que Oaxaca presenta una tendencia más irregular aunque sigue estando por arriba de la media. Esto significa que a menor índice de rotación mayor eficiencia como resultado de la atención médica y viceversa. Sobre el indicador de promedio diario de consultas a no asegurados, con excepción del estado de Jalisco, el resto de los estados están por arriba de la media, y de manera muy marcada el caso de baja California Sur, que para todo el período se mantiene en primer lugar por arriba de la media (ver gráfica 21).
Tendencias de indicadores de equidad en salud
Respecto a gasto público en salud todos los estados incluidos, excepto Oaxaca e Hidalgo, presentaron un gasto público por arriba de la media nacional. Por otra parte el gasto público en salud como proporción del gasto total en salud, resalta que en los estados de tabasco y Yucatán este gasto está muy por arriba de la media y casi al doble de lo que representa este mismo gasto para estados como Jalisco, donde ciertamente se está muy por debajo de la media nacional. En cuanto al per cápita para población no asegurada llama la atención el estado de Baja California por el alto monto, mientras que los estados de Oaxaca e Hidalgo por su bajo monto per cápita. Respecto al índice de corresponsabilidad financiera, es en los estados de Jalisco y de Tabasco donde se encuentra un índice más favorable de acuerdo a los cambios esperados en estos momentos de la reforma de la salud; particularmente de la descentralización financiera en términos de equidad en la asignación de recursos para la salud (ver gráficas 22‐26).
En lo referente al gasto catastrófico en salud a nivel nacional y diferenciando por tipo de población, es evidente que las tendencias de mayor gasto están en la población no asegurada, tal como se aprecia en la gráfica 27. El otro punto que llama la atención es que contrario a lo que debería ser es la población del quintil de menor ingreso familiar la que realiza un mayor gasto catastrófico en salud. Sobre las tendencias del gasto catastrófico en población no asegurada por estado bajo estudio, Oaxaca resultó con el mayor gasto, mientras que Colima con el gasto menor (ver gráfica 28).
Respecto a los resultados del índice de inequidad en la asignación de recursos por estado (ver notas en anexos), los estados que resultaron con el índice de mayor inequidad fueron Oaxaca e Hidalgo, seguidos en orden decreciente por Colima, Tabasco, Baja California Sur y Jalisco (ver gráfica 29).
El análisis cualitativo sobre cambios en los mecanismos de asignación solo se realizó para 3 estados. La información analizada mostró la referencia por parte de proveedores de servicios del uso de criterios históricos en la asignación financiera en Baja California Sur y Colima. Estos criterios se refieren esencialmente a la asignación tomando como parámetro los ejercicios anteriores. En este caso, Jalisco y Baja California Sur refirieron mayor trabajo gubernamental relacionado con modificar la asignación financiera mediante el empleo de

Decentralized Service Delivery for the Poor 90
criterios técnicos (clínicos, epidemiológicos y económicos) en la asignación de los recursos; sobre todo a nivel jurisdiccional ante evidencias de brotes epidemiológicos.
Se refirieron iniciativas locales con el uso de criterios clínicos en la asignación de recursos. Particularmente en Jalisco, orientadas a mejorar la producción de servicios para población específica, particularmente población que vive con cáncer. Este tipo de dinámicas han sido promovidas recientemente desde el nivel federal, promoviéndose la creación de un fondo sectorial orientado a prevenir los efectos de los gastos en salud de padecimientos que el sistema sanitario ha evaluado como costosos con efectos directos en la economía de los pacientes. La implantación de mecanismos económicos se encuentra aun en etapa de estudio en los 3 estados.
Tendencias de indicadores de gobernabilidad en salud
Revisando las fortalezas, Jalisco y Tabasco presentan de alto a medio grado de impacto de cambios en los diferentes indicadores de gobernabilidad; los estados de Hidalgo y Colima de medio a bajo y el estado de Baja California Sur y Oaxaca de bajo a nulo impacto de los cambios. Las principales fortalezas se presentaron en la identificación de estrategias de reforma, pasando por la solicitud de mayores mecanismos de transparencia en el uso y asignación de recursos, mayores espacios de participación de todos los actores sociales en la toma de decisiones en todo el ámbito de la salud, sobre todo en programas con un alto componente de participación comunitaria como el IMSS‐Oportunidades, en Oaxaca e Hidalgo, o Oportunidades componente salud (antes PROGRESA) en Baja California Sur, Jalisco, Tabasco y Colima. .
También se observaron fortalezas relevantes en materia de asignación y reasignación de recursos, mayor interacción de actores, presencia de sistemas de rendición de cuentas y nuevos mecanismos de mediación para apoyo a grupos vulnerables, resaltan do como ejemplo el Seguro Popular. Como fortaleza importante, se refirió la existencia de iniciativas comunitarias para mejorar el bienestar, el reconocimiento de espacios para la participación comunitaria vinculados a programas gubernamentales (IMSS‐Oportunidades, Oportunidades‐salud y Comités Promotores de Salud), el apoyo de trabajo comunitario para mejorar las unidades de salud, coordinación intersectorial y la existencia de mecanismos de mediación para apoyar a grupos vulnerables. En los tres estados se refirió el fortalecimiento del nivel local para la toma de decisiones. Particularmente se resaltó que las nuevas iniciativas como el Seguro Popular de Salud empoderan más a los usuarios debido a que suponen aportaciones directas y beneficios específicos, así como la preocupación por una mayor ciudadanización de de la atención a la salud. (Ver figuras 4 y 5)
A diferencia de las fortalezas, las principales debilidades se observaron en Baja California Sur Ocaza, Hidalgo y Colima con alto‐medio impacto; seguidos de Jalisco y Tabasco con bajo‐nulo impacto dependiendo del indicador. Las mayores debilidades se presentaron en el desconocimiento y rechazo de programas prioritarios de salud por la mayoría de los actores sociales, particularmente de usuarios y proveedores en el nivel

Decentralized Service Delivery for the Poor 91
municipal. Resaltó también el conflicto de diferentes niveles de gobierno en la conducción de los programas de salud, la asignación discrecional de recursos, sobre todo el uso político de programas prioritarios de salud como el Seguro Popular, particularmente en Colima; la participación social pasiva y dirigida por los proveedores de salud dejando un escaso o nulo margen de acción en diferentes comunidades, sobre todo en las comunidades mas marginadas; la escasa capacidad de negociar y gestionar recursos desde los niveles estatal y municipal; la falta de precisión y claridad en la aplicación de la formula de asignación de recursos con equidad desde el nivel central hacia el nivel estatal de salud; el desinterés de actores en el abordaje Inter. Sectorial o interinstitucional de los problemas y programas de salud. Finalmente la falta de espacios de participación en la gestión de recursos financieros (ver Tabla 6). Algunas debilidades con implicaciones complejas se refirieron a la posibilidad de politizar los recursos y el gasto en salud, así como a que la participación social esté concebida únicamente dentro de cauces oficiales, a lo que se agregó el centralismo federal. Para los casos de Oaxaca, Hidalgo, Baja California Sur y Colima se refirió un manejo limitado del marco legal y sus alcances, así como la falta de un planteamiento explícito orientado a una mayor gestión de recursos financieros y la falta de mecanismos para monitorear el uso de los recursos entre prestadores de servicios.

Decentralized Service Delivery for the Poor 92
Tabla 6. Fortalezas de Gobernabilidad en salud en 6 estados de México. Fortalezas BC SUR COLIMA JALISCO OAXACA HIDALGO TABASCO
Identificación y uso de marcos legales y normativos de estrategias de reforma
‐ + ++ + + ++
Participación en toma de decisiones a nivel local
‐+ + ++ ‐ ‐ ++
Capacidad de gestión y reasignación de recursos a nivel estatal
‐ + +++ + ++ +++
Rendición de Cuentas con participación de actores estatales y municipales
‐ ‐ ++ ‐ ‐ ‐+
Participación de todos los actores en la gestión de nuevas fuentes de $
‐ + ++ ‐+ + ++
Mayor interacción entre actores sociales: proveedores, usuarios, gobiernos y ONGs.
‐ ‐ ++ + + +++
Transparencia en la gestión de programas y recursos públicos
+ + +++ ‐ ‐ ‐+
Mecanismos de mediación para apoyar a grupos vulnerables/prioritarios.
‐ + +++ ++ ++ ++
Nivel de acuerdo y estabilidad política entre actores y sus interacciones
+ + +++ ‐ + +++
Alto= +++ Medio= ++ Bajo = + Nulo = ‐ Fuentes: Arredondo A. et al, Primer Informe Técnico. Proyecto Equidad, Gobernabilidad y Financiamiento en Salud a partir de la reforma de la salud en México. INSP, 2003‐2006. Entrevistas con Directivos, Seminario nacional de Financiamiento, Gobernabilidad y Equidad en Salud, Guadalajara, Enero 2006.

Decentralized Service Delivery for the Poor 93
Tabla 7. Debilidades de Gobernabilidad en salud en 6 estados de México Debilidades BC SUR COLIMA JALISCO OAXACA HIDALGO TABASCO
Desconocimiento y rechazo de programas prioritarios de salud
+++ ++ + ++ ++ ‐
Conflicto en diferentes niveles de gobierno
+++ ++ + +++ ++ +
Ausencia de mecanismos para monitorear el uso de los recursos
+++ ++ + +++ + +
Asignación de recursos con discrecionalidad
+++ +++ + +++ ++ ++
Intereses en función de partidos políticos en el poder federal, estatal‐municipal
++ +++ + +++ + ++
Participación social dirigida por el proveedor (participación pasiva y sin poder de decisión)
+++ +++ + + ++ +
Imposibilidad de negociar los recursos y reasignar el gasto en salud
+++ +++ + ++ ++ ‐
Desinterés de actores en el abordaje integral‐interinstitucional de problemas comunes de salud a nivel estatal
+++ +++ + +++ ++ ‐
Falta de espacios de participación y gestión de financiamiento
+++ +- + ++ ++ ‐
Alto= +++ Medio= ++ Bajo = + Nulo = ‐ Fuentes: Arredondo A. et al, Primer Informe Técnico. Proyecto Equidad, Gobernabilidad y Financiamiento en Salud a partir de la reforma de la salud en México. INSP, 2003‐2006. Entrevistas con Directivos, Seminario nacional de Financiamiento, Gobernabilidad y Equidad en Salud, Guadalajara, Enero 2006.
V. DISCUSIÓN Y CONCLUSIONES
Tratando de responder a los objetivos y preguntas planteadas en la primera sección de este documento, en esta sección se presentan los principales efectos de la descentralización y programas prioritarios de salud para grupos vulnerables sobre 4 niveles de

Decentralized Service Delivery for the Poor 94
efectos/impactos: sobre las relaciones intergubernamentales y la participación social; sobre los indicadores de impacto en las condiciones de salud y desempeño del sistema de salud; sobre los cambios en el financiamiento en salud y sobre los efectos (en términos de equidad, cobertura, acceso y protección financiera) en la reducción de la pobreza y la desigualdad en salud en las comunidades mas marginadas de México. En el cierre de esta sección se resaltan de manera integral algunos de los principales efectos de impacto positivo y efectos de impacto negativo.
Efectos de la descentralización y la implementación de programas de salud para grupos vulnerables sobre las relaciones intergubernamentales y la participación social
Desde que se firmaron formalmente los convenios de descentralización en salud con los gobernadores de los estados, uno de los principales puntos de conflicto fue que la transferencia de recursos y responsabilidades del gobierno federal a los estados implicó una redistribución del poder que no se ha podido concretar principalmente por dos factores: la ausencia de los mecanismos viables para la nueva estructura de poder y la necesidad de un replanteamiento efectivo en las relaciones entre los gobiernos, instituciones y usuarios de servicios de salud. En efecto, a pesar de los avances en la democratización, del replanteamiento de las relaciones intergubernamentales con la descentralización en el contexto de un nuevo federalismo, el factor más importante en la estructura del poder en México, continúa siendo el nivel federal del poder ejecutivo: presidente y secretario de salud. En efecto el control del ejecutivo federal sobre las relaciones intergubernamentales persiste y se fundamenta en una gran diversidad de facultades formales e informales del nivel federal sobre el nivel estatal.
El curso de los últimos años muestra que el Gobierno, las Instituciones de Salud y la Sociedad, aún no han establecido de manera clara y estructurada los nuevos mecanismos mediante los cuales establecerán su relación y las nuevas reglas de intercambio político para una óptima conducción de estrategias de reforma como la descentralización. El planteamiento de la política de descentralización en salud, pretendió acabar con el sentido centralista de las estructuras de gobierno, tal como se comentó en las primeras secciones de este documento, sin embargo los hallazgos presentados hacen ver que los niveles estatales y municipales de salud continúan con una relación dependiente del centro y solo es en algunas excepciones, como los estados de Tabasco, Baja California Sur y de Jalisco, donde se ha podido concretar y desarrollar cambios importantes en las relaciones de gobiernos/autoridades.
Las relaciones intergubernamentales para los acuerdos entre los diferentes niveles de gobierno dependen en gran medida de los partidos políticos en el poder. En estados donde gobierna el PAN, partido en el poder federal, las relaciones intergubernamentales continúan bajo la misma estructura de poder del centro a los estados y municipios. En estados donde el partido en el poder es el PRI, partido aliado en muchos ámbitos con el PAN, las relaciones intergubernamentales siguen la misma estructura con algunos matices dependiendo; finalmente en los estados donde gobierna el PRD, las relaciones intergubernamentales si han

Decentralized Service Delivery for the Poor 95
sido efectivamente replanteadas, con diferentes niveles de negociación, acuerdos y desacuerdos entre nivel federal y estatal, incluso ha habido situaciones donde los programas de salud como el Seguro Popular han sido cuestionados y replanteados tanto en su estructura organizacional como en su estructura financiera, llegando a estar totalmente cancelados de manera temporal hasta que no se lleguen a acuerdos concretos entre los diferentes niveles de gobierno y autoridades de salud.
Sobre la capacidad de conducción de estrategias de reforma en el planteamiento de nuevas reglas y roles para los actores sociales, los resultados sugieren que los niveles de gobernabilidad entre los diferentes actores del actual sistema de salud, constituyen uno de los mayores espacios a replantear en el proceso de evaluación, monitoreo y ajustes de reforma y democratización de la salud en México. Analizando de manera integral los indicadores de gobernabilidad utilizados, no es posible diferenciar efectos de la descentralización en materia de participación social en salud. Hay un efecto muy marginal y este se limita a la participación pasiva de algunos líderes comunitarios en comités estatales de salud. La evidencia que si se pudo identificar es que el éxito en la conducción de la reforma en salud depende del grado y tipo de participación de los diferentes actores del sistema de salud, particularmente de los partidos políticos en el poder.
La participación en salud y rol de los usuarios depende en gran medida del tipo de programa de salud en el que se demanden servicios o al que haya adscripción, del tipo de responsabilidad financiera y del modelo de atención. Por ejemplo los usuarios que se han adscrito al Seguro Popular, en todos los estados se observa un rol de participación muy pasiva y dirigida por los proveedores, sobre todo a nivel de la salud individual. Los usuarios que se inscriben en IMSS‐Oportunidades, tienen una participación mas activa, dirigida por los mismos usuarios/líderes comunitarios y con un enfoque individual y colectivo sobre las condiciones de salud. La participación activa de la población usuaria, también se vio fuertemente asociado al grado de marginación social del estado y a la capacidad de interacción y negociación de los diferentes actores políticos del gobierno, en función de la coincidencia o diferencia de partidos políticos en los diferentes niveles de gobierno (federal, estatal y municipal).
Las nuevas modalidades o programas de proveer servicios de salud a nivel local (Seguro Popular, IMSS‐Oportunidades, Arranque Parejo por la Vida, etc.) más que responder a decisiones de gobiernos y necesidades locales, responden y son producto de programas verticales y centralizados y no a una estrategia descentralizadora. Más aún estos programas se constituyen, se coordinan y se mantienen en los niveles centrales de la administración federal en turno, ejemplo claro es el IMSS Oportunidades, que cambian desde el nombre hasta mecanismos de operación y gestión dependiendo de la filosofía y lineamientos de la administración federal en turno y del momento político.
Como principal efecto de la gobernabilidad en las decisiones y resultados en salud a nivel estatal, retomamos las evidencias que presentamos sobre la conducción de la reforma. Es decir que en aquellos estados donde existe el mismo partido político en poder de los

Decentralized Service Delivery for the Poor 96
niveles de gobierno municipal, estatal y federal, existe un alto acuerdo entre los diferentes actores (niveles de gobierno, proveedores, usuarios y líderes de ONGs) y por consecuente el avance en la conducción de la reforma ha sido mayor.
Efectos de la descentralización sobre los mecanismos de producción, financiamiento y asignación de recursos en salud a partir de las reformas, incluyendo efectos que han tenido programas prioritarios de salud como el IMSS‐Oportunidades y el Seguro Popular
En los servicios públicos para no asegurados, la regla es que tanto la producción de servicios como el financiamiento y asignación de recursos sigue operando desde el nivel central del país. Hay escasas evidencias de un rol de participación activa en la toma de decisiones a nivel local. La capacidad de gestión, rendición de cuentas y la transparencia en la asignación de recursos son procesos aún ausentes en la mayoría de los estados bajo estudio. En lo relativo al Seguro Popular, dada la corresponsabilidad de su estructura financiera, las autoridades estatales de salud tienen un mayor poder de decisión en la gestión, en los mecanismos para apoyo a grupos más vulnerables, y en el nivel de acuerdo entre los principales actores políticos, incluyendo autoridades del gobierno estatal. Para el caso del IMSS‐Oportunidades, sólo hay que reiterar que este es un programa financiado y coordinado totalmente desde el nivel central sin ninguna prerrogativa al nivel estatal o local; excepto que recientemente se está replanteando algún tipo de acuerdo con el nivel estatal del Seguro Popular para la atención de algunos usuarios.
Respecto a las tendencias del gasto en salud y la distribución porcentual de las diferentes fuentes de financiamiento, se observa una situación muy irregular. Los cambios en el marco legal para adecuar más el sistema de salud a las necesidades locales de salud han tenido diferentes niveles de efectividad en cada estado del país. Por ejemplo si contrastamos Tabasco y Jalisco con el resto de los estados, llama la atención la participación tan importante del gobierno estatal en el financiamiento en salud para Tabasco y Jalisco, mientras que en el resto, a pesar de que el nivel estatal debería tener una participación de por lo menos el 30% del gasto estatal en salud, casi el 100% del gasto depende del gobierno federal. Por otra parte hay estados donde existe una participación relativamente importante de los usuarios en el financiamiento de los servicios de salud, sobre todo en Oaxaca e Hidalgo. Esto último es muy contradictorio, porque justamente en los dos estados más pobres y de mayor marginación social existe la participación más importante del gasto en salud, en relación a los otros estados de menor marginación social y de un ingreso per cápita mayor.
Sobre los efectos que en materia de financiamiento y asignación de recursos han tenido programas prioritarios de salud como el IMSS‐Oportunidades y el Seguro Popular, existen evidencias de que a partir de la implementación de tales programas, en algunos estados las tendencias al incremento se presentaron tanto en los aportes federales como en los estatales y en los aportes de los usuarios. Por ejemplo el caso de estados como Colima o Yucatán la mayor parte de los efectos se ve sobre el aporte federal, mientras que en los casos como Jalisco y tabasco hay importantes efectos sobre los aportes estatales. Esto de alguna manera responde también a la cultura de corresponsabilidad financiera que estos dos estados

Decentralized Service Delivery for the Poor 97
han implementado desde la descentralización. Sin embargo hay que resaltar que hasta no aclarar los nuevos cambios (a partir de enero del 2006) en el financiamiento y asignación de recursos para el IMSS‐Oportunidades y Seguro Popular, no se conocerán los posibles efectos en los próximos flujos financieros de estos programas.
A partir de la descentralización es posible identificar dos patrones de cambio en el financiamiento: Un patrón A, donde la principal fuente de financiamiento ha sido el nivel federal, pero con cambios muy importantes a partir de la segunda mitad del período (1995). Estos cambios, aunque mínimos, representan una tendencia creciente y constante desde los aportes financieros del nivel estatal y municipal, acompañados de cambios con tendencias irregulares desde las aportaciones de los hogares. Este patrón es el caso de Oaxaca, Hidalgo, Baja California y Colima. Un patrón B, donde los aportes de financiamiento del nivel federal presentan una clara tendencia decreciente combinado con una clara tendencia creciente tanto de los aportes financieros de los niveles estatal, municipal y de los hogares; pero con mayor significancia del nivel estatal. Este patrón es el caso de Jalisco y Tabasco.
En lo referente al destino final de los recursos por rubro de gasto para población no asegurada también se pudo identificar dos patrones de destino final de los recursos. Un patrón A (Colima, Oaxaca, Hidalgo y Baja California), donde las tendencias presentaron cambios crecientes constantes para los gastos en atención preventiva, sin cambios significativos para atención curativa y cambios decrecientes constantes para gastos de administración. Un patrón B (Jalisco, Tabasco), cambios muy irregulares en las tendencias de los tres rubros de gasto.
Efectos de los cambios en el financiamiento a partir de la descentralización sobre las condiciones de salud y sobre el desempeño del sistema de salud para no asegurados
En algunos estados hay efectos de impacto positivo tanto en el financiamiento como en la producción de los servicios y el replanteamiento del rol de los diferentes actores del sistema de salud. A partir de la implementación de la descentralización existe mayor corresponsabilidad financiera de los estados y en algunos casos municipios y hogares en las tendencias del gasto en salud para población no asegurada. Por otra parte, la descentralización en salud ha permitido la participación de proveedores a nivel estatal y municipal en la identificación de necesidades de salud, en la priorización de algunas actividades de salud y en la reasignación de algunos recursos para programas específicos de salud sobre todo ante la presencia de algunos brotes epidémicos.
Respecto a los efectos y cambios del gasto en salud sobre los indicadores de impacto en salud, en los 6 Estados, se observa una relación directa, aunque no proporcional, entre incremento en gasto en salud y descenso en los indicadores de salud (mortalidad materna, incidencia por DM e IRAs). Este efecto, en relación a la mortalidad infantil y materna se observa con mayor claridad en los Estados de Oaxaca, Hidalgo y Jalisco. Para la incidencia de morbilidad por DM e IRAs, se observan descensos en las tendencias, en Oaxaca, Colima, Baja California Sur y Jalisco. En Tabasco aunque se observa un importante incremento en el

Decentralized Service Delivery for the Poor 98
gasto en salud, los indicadores de salud, permanecen estables. Aquí para una mayor precisión de los efectos de incremento en el gasto en salud sobre indicadores de impacto en salud es necesario desarrollar un análisis aplicando un modelo multicausal que permita explicar las diferencias encontradas entre los estados bajo estudio.
El incremento del gasto en salud, puede tener un impacto positivo en el nivel de salud de los habitantes, reflejándose globalmente en una tendencia decreciente en los indicadores de morbilidad y mortalidad, como se observó en algunos Estados. Es importante notar, que los cambios en las tendencias de los indicadores de salud, tienen otros factores relacionados: mejoras en los registros, disminución de los retrasos y subregistros en la notificación de los casos. Sin embargo este ejercicio de graficar los indicadores en salud y gasto en salud, nos permite estimar su tendencia y sugerir una posible explicación de que el gasto en salud tiene un impacto positivo en estos indicadores, como se observa en el período 1990‐2003 en los Estados bajo estudio.
No se identificaron mecanismos orientados a combinar recursos para lograr mayores impactos en la atención a la población. La información recopilada mostró que los programas asistenciales operan paralelamente en la estructura de los servicios de salud estatales ocasionando dificultades operativas relacionadas con la racionalidad con que operan las distintas dependencias gubernamentales.
En varios de los estados, al interior de las dependencias se esta generando un conflicto atribuible al mecanismo mediante el cual se realizaban algunas actividades operativas del sistema de salud. La naturaleza de tal conflicto mostró que al contratar recursos humanos para IMSS‐Oportunidades, se generan conflictos con el personal así como traslapes organizacionales que sugieren la necesidad de revisar mecanismos de coordinación de actividades, recursos y estrategias de distintos programas y dependencias gubernamentales (como el Seguro Popular) que realizan tareas similares o que podrían ser complementarias. Situaciones de mayor conflicto se presentan en estados donde los usuarios adscritos al IMSS‐Oportunidades, por instrucciones del nivel central han pasado a ser usuarios adscritos al Seguro Popular sin ninguna discusión ni acuerdos previos en financiamiento y producción de servicios entre autoridades de salud y gobiernos en los niveles federal, estatal y municipal.
Los acuerdos sobre cambios en el financiamiento y producción de servicios de salud para incorporar usuarios de IMSS‐Oportunidades al Seguro Popular, se realizarán a partir de febrero del 2006 entre los niveles federal de la CNSPSS y la Coordinación Nacional del IMSS‐Oportunidades. A la fecha las autoridades estatales de salud no cuentan con información detallada, solo han recibido la instrucción del cambio pero sin ninguna otra precisión. Se plantea a priori que toda la infraestructura del IMSS‐Oportunidades pasará al Seguro Popular y que una parte del financiamiento que tenía IMSS‐Oportunidades también pasara al Seguro Popular pero no la totalidad del financiamiento. Esto último ha sido el elemento de mayor conflicto con la nueva propuesta de integración de estos programas y justo en un año electoral donde las decisiones y las relaciones entre niveles de gobierno son muy ambiguas.
Decentralized Service Delivery for the Poor 99
Efectos en materia de equidad, protección financiera, cobertura y acceso a programas/servicios enfocados a la reducción de la pobreza y la desigualdad en salud
Los incrementos en los montos financieros son más altos en unos estados que en otros y esto no guarda relación estrecha ni con el gasto per cápita en salud ni mucho menos con las necesidades de salud de la población. Por ejemplo, Hidalgo y Oaxaca son de los estados con mayor índice de marginación del país, sin embargo son los estados menos favorecidos en cuanto a incremento del gasto en salud y tienen los menores gastos per cápita en salud. Estos mismos estados también presentan los índices de inequidad más altos y los índices de corresponsabilidad financiera menos favorables. La población no asegurada de estos estados, presentan los índices de gasto catastrófico más alto de los seis estados bajo análisis. Contrariamente, Jalisco y Baja California Sur son los estados de mayor ingreso y también los de menor índice de inequidad en la asignación de recursos y de menor gasto catastrófico en su población no asegurada.
Sobre los efectos de los programas de servicios públicos de salud, como el Seguro Popular e IMSS –Oportunidades, en la reducción de la pobreza y la disminución de desigualdades, si bien es cierto aún no hay los alcances esperados, podemos hablar de algunos logros importantes. En el caso del Seguro Popular, en materia de equidad, no es muy evidente la diferencia con el sistema anterior de cuotas de recuperación, donde también los usuarios de los deciles de menor ingreso recibían los servicios gratuitos; pero si es muy evidente el hecho de que la nueva estructura de financiamiento de este programa plantea un avance muy positivo en materia de asignación de recursos con mayor equidad: el financiamiento sigue al usuario, es decir que la cuota estatal y federal se va a donde se mueve el usuario, algo que anteriormente no sucedía.
En términos de equidad y protección financiera en salud, podemos hablar de la generación de efectos determinantes en la disminución del gasto catastrófico por los usuarios del decil 1, particularmente en los usuarios de los estados de Oaxaca e Hidalgo donde se presentan los mayores índices de gasto catastrófico por usuarios no asegurados y los mayores índices de inequidad en la asignación de recursos. El gasto catastrófico en estos estados, como también lo demuestran análisis de la Encuesta Nacional de Salud, representa mas de 2 salarios mínimos para una población que en el mejor de los caso puede tener de 1 a 2 salarios mínimos en su ingreso. Desde una perspectiva de mayor equidad, esta situación evidentemente tiene ya efectos sobre el abatimiento de la desigualdad aunque no necesariamente sobre la reducción de la pobreza. Para esto último habrá que esperar a una evaluación más sobre cambios en los índices de gasto catastrófico para el 2005.
Los hallazgos empíricos que se presentaron para analizar las tendencias de acuerdo a las nuevas estrategias políticas, nos ayudan a evidenciar que la efectividad de la propuesta de cambios en las políticas de financiamiento para la SSA, queda en entredicho al contrastar los hallazgos incluidos en la sección de resultados del documento. Según los lineamientos de política del plan nacional de desarrollo y del mismo programa nacional de salud, se plantea una estrategia de protección financiera al usuario con menor ingreso; sin embargo como se

Decentralized Service Delivery for the Poor 100
pudo ilustrar con evidencias empíricas, el usuario de menor ingreso es el que mas paga por el consumo de servicios de salud. Mas aún, respecto a la población no asegurada en todo el país el mayor gasto catastrófico en salud se presenta en dos de los estados mas pobres de México: Oaxaca e Hidalgo.
Sobre la implementación del Seguro Popular y el IMSS‐Oportunidades, hay efectos en la disponibilidad y distribución de los recursos para salud a nivel estatal y en la propia distribución entre los estados. En el caso del Seguro Popular, hay más recursos del nivel federal pero también hay mayor responsabilidad del nivel estatal en el financiamiento. En otros estados se han generado situaciones de mayor apoyo financiero del nivel federal como producto de negociaciones de apoyo político de diputados y senadores del estado en la aprobación de cambios y reformas a la ley general de salud propuestas por el nivel federal.
En relación al IMSS‐Oportunidades, no hay efectos en la distribución y disponibilidad de recursos para el nivel estatal, toda vez que el manejo de recursos para este programa es en su totalidad desde el nivel central. Un efecto reciente que esta en la mesa de discusión y negociaciones entre los niveles federal y estatal es la reciente propuesta en algunos estados de que los adscritos al IMSS Oportunidades pasen ahora a recibir atención por el Sistema de Protección Social en Salud, sin ninguna responsabilidad financiera adicional por parte del nivel federal.
Las variaciones en los indicadores de gobernabilidad y sobre los indicadores de financiamiento que se presentaron en la sección de resultados, aparentemente tienen algunos efectos positivos sobre los indicadores de impacto en el estado de salud, así como en indicadores del desempeño del sistema de salud (eficiencia, cobertura y equidad). No se observan efectos aparentes en los indicadores sociales que se analizaron. Independientemente de la hipótesis anterior, para tener evidencias mas contundentes es necesario desarrollar un análisis de regresión de todos los indicadores analizados
Hay otras diferencias significativas en términos de cobertura, acceso y protección financiera en los programas de salud para la población de mayor marginación en México. Comparando servicios de salud de la misma SSA para los adscritos vs. los no adscritos al Seguro Popular, existen diferencias en materia de protección financiera y de calidad de la atención. Desde la perspectiva de personal clave en salud, se observa un trato más personalizado en el Seguro Popular y mayores recursos en medicamentos y estudios en el primer nivel. En el segundo nivel hay estados donde en el Seguro Popular hay limitaciones en el tratamiento medico y no se protege el pago de medicamentos. También hay diferencias importantes en cuanto al tipo de intervenciones. En los adscritos al Seguro Popular se les ofrecen pocas intervenciones de tercer nivel en el Seguro Popular, mientras que los no adscritos pueden tener más opciones del tercer nivel. El IMSS‐Oportunidades es el programa que ofrece menos intervenciones y todas se limitan al primer nivel de atención y excepcionalmente, al segundo nivel de atención.

Decentralized Service Delivery for the Poor 101
Finalmente, integrando los 4 niveles de efectos discutidos en esta sección a continuación se resaltan a manera de cierre las principales conclusiones sobre efectos de impacto positivo (fortalezas) y efectos de impacto negativo (debilidades) de la descentralización e implementación de programas prioritarios de salud sobre la conducción de las reformas dirigidas a los grupos vulnerables en México
Resultados de impacto positivo. En algunos estados la descentralización ha generado ganancias importantes en los índices de corresponsabilidad financiera y de mayor corresponsabilidad en la producción y participación en salud; A partir de la descentralización se han registrado importantes incrementos en los montos del financiamiento en salud y cambios de mayor efectividad en los mecanismos de coordinación entre los niveles de gobierno en salud en la mayoría de los estados del país, estos cambios también han coincidido con ganancia positiva en algunos indicadores sociales y particularmente con mejora en los niveles de la mortalidad infantil, mortalidad materna y morbilidad por enfermedades crónicas e infecciosas; En materia de equidad existe una nueva formula de asignación de recursos donde además el nivel estatal ha jugado un rol protagónico en su revisión, ajustes y aplicación para las adecuaciones sobre los recursos asignados y sobre el modelo de atención a la salud que cada estado adopta en función de sus necesidades; La implementación de programas prioritarios de salud dirigidos a los grupos mas vulnerables (Seguro Popular, IMSS‐Oportunidades, Arranque Parejo por la Vida, etc.) han contribuido de manera muy importante para garantizar mayor protección financiera, mayor acceso y mayor cobertura de las familias marginadas; La estrategia de protección financiera en salud en algunos estados ha evitado gastos catastróficos en salud y por consecuente el mayor empobrecimiento de las familias más vulnerables; Existen evidencias de mejoría en indicadores del desempeño del sistema de salud que coinciden con la implementación de los cambios señalados; el Seguro Popular es una estrategia de financiamiento con un principio muy sólido de equidad, por primera vez el financiamiento sigue al usuario si se cambia de un estado a otro, esto es de particular relevancia en un país donde la migración interna de la población que no pertenece a la economía formal es tan alta.
Resultados de impacto negativo. Alto grado de dificultad en generar una efectividad mas o menos homogénea en todos los estados al implementar reformas y programas de salud dirigidas a grupos vulnerables; Existe confusión entre los diferentes niveles de gobierno al momento de operacionalizar los cambios tanto en financiamiento como en la producción de servicios de salud, el nivel municipal manifiesta que el nivel estatal se ha convertido en el nivel central, el nivel estatal manifiesta que en varios programas de salud el nivel federal sigue centralizando todo el poder y el nivel federal manifiesta dificultad en los acuerdos, compromisos y corresponsabilidad entre los niveles de gobierno, particularmente en los recientes cambios para incorporar IMSS‐Oportunidades al Seguro Popular; La rendición de cuentas en el nivel federal aunque no está ausente se mantiene con un carácter triunfalista, mientras que en los estados y municipios aún está ausente un sistema de rendición de cuentas y de transparencia en la asignación de recursos; Aún no está claro el peso relativo de los cambios en el sistema de salud sobre las ganancias en los indicadores de impacto en salud a partir de la descentralización; Los principales programas prioritarios de salud dirigidos a

Decentralized Service Delivery for the Poor 102
grupos vulnerables operan con un manejo centralizado del nivel federal con efectos muy negativos y confusos sobre las ganancias que se habían generado en la descentralización del poder y con efectos también negativos en los mecanismos de coordinación y complementariedad de tales programas; Los conflictos entre los partidos políticos en el poder de los gobiernos federal y estatal se refleja en bajos niveles de gobernabilidad y dificultad en la conducción efectiva de los programas prioritarios y de otras estrategias de reforma. Esto último ha generado escasos avances en la democratización de la salud con altos grados de confusión en las reglas y los roles con que operan los diferentes actores del sistema de salud; Existen evidencias de que a pesar de las ganancias en protección financiera, en algunos estados los usuarios de menor ingreso familiar son los que incurren en mayores gastos catastróficos en salud; Las medidas para avanzar en la equidad en la asignación de recursos para población no asegurada no han sido suficientes, continúan los altos índices de inequidad, particularmente en los estados de mayor marginación.

Decentralized Service Delivery for the Poor 103
ANEXO I: GLOSARIO DE TERMINOS Y ACLARACIONES SOBRE PROCEDIMIENTOS METODOLÓGICAS Y/O FUENTES DE INFORMACIÓN
1) POBLACIÓN NO ASEGURADA: Se refiere a todos los usuarios de servicios de salud que no pertenecen a la economía formal y que demandan servicios de salud en el sector público para no asegurados (SSA, Seguro Popular, IMSS‐Oportunidades) o bien en cualquier centro de atención privada. Los datos sobre esta variable proceden de los anuarios estadísticos de la SSA para el período 1990‐2004.
2) POBLACIÓN ASEGURADA. Se refiere a todos los usuarios de servicios de salud que pertenecen a la economía formal y que demandan servicios de salud en el sector público para asegurados (IMSS e ISSSTE principalmente) Los datos sobre esta variable proceden de los anuarios estadísticos de la SSA para el período 1990‐2004.
3) GASTO PÚBLICO EN SALUD. Incluye el total de recursos financieros vía impuestos procedentes de los niveles de gobierno federal, estatal y municipal. Sus fuentes de información son bases de datos del proyecto Equidad, Financiamiento y Gobernabilidad en Salud 1990‐2004 del INSP, Anuarios Estadísticos Estatales de la SSA 1990‐2003 y Anuarios Estadísticos 1990‐2004 del INEGI. Todos los datos sobre gasto en salud se convirtieron en dólares de EUA con el siguiente tipo de cambio: 1990‐2665.00,1991‐2948.00,1992‐3090.00,1993‐3.11,1994‐3.39,1995‐6.26,1996‐7.58,1997‐7.95,1998‐8.98,1999‐9.44,2000‐9.37, 2001‐10.30, 2002‐11.00, 2003‐11.02.
4) ESCOLARIDAD. Se refiere al porcentaje de la población que sabe leer y escribir y que asistió hasta el primer grado de primaria. La tasa promedio es el resultado de los Informes quinquenales del Censo de Población del INEGI, 1990, 1995 y 2000.
5) POBLACIÓN ECONOMICAMENTE ACTIVA. Incluye a toda la población mayor de 15 años que contó con un empleo al momento de la encuesta de hogares de los censos de población. La fuente de información son los resultados de Informes quinquenales del Censo de Población del INEGI, 1990, 1995 y 2000.
6) AGUA POTABLE. Proporción de casas que tienen agua potable y entubada al domicilio particular de las familias en cada estado. La fuente de información son los resultados de Informes quinquenales del Censo de Población del INEGI, 1990, 1995 y 2000.
7) DRENAJE. Proporción de casas que tienen instalaciones de alcantarillado/drenaje al domicilio particular de las familias en cada estado. La fuente de información son los resultados de Informes quinquenales del Censo de Población del INEGI, 1990, 1995 y 2000.
8) FINANCIAMIENTO FEDERAL. Aportaciones financieras del nivel federal al gasto total en salud para cada estado del estudio. El indicador se presenta en función del peso relativo sobre el gasto total en relación al resto de aportaciones financieras. Las fuentes de información son: bases de datos del proyecto Equidad, Financiamiento y Gobernabilidad en
Decentralized Service Delivery for the Poor 104
Salud 1990‐2004 del INSP, Anuarios Estadísticos Estatales de la SSA 1990‐2003 y Anuarios Estadísticos 1990‐2004 del INEGI.
9) FINANCIAMIENTO ESTATAL. Aportaciones financieras del nivel estatal al gasto total en salud para cada estado del estudio. El indicador se presenta en función del peso relativo sobre el gasto total en relación al resto de aportaciones financieras. Las fuentes de información son: bases de datos del proyecto Equidad, Financiamiento y Gobernabilidad en Salud 1990‐2004 del INSP, Anuarios Estadísticos Estatales de la SSA 1990‐2003 y Anuarios Estadísticos 1990‐2004 del INEGI.
10) FINANCIAMIENTO MUNICIPAL. Aportaciones financieras del nivel municipal al gasto total en salud para cada estado del estudio. El indicador se presenta en función del peso relativo sobre el gasto total en relación al resto de aportaciones financieras. Las fuentes de información son: bases de datos del proyecto Equidad, Financiamiento y Gobernabilidad en Salud 1990‐2004 del INSP, Anuarios Estadísticos Estatales de la SSA 1990‐2003 y Registros Estadísticos 1990‐2004 de las Jurisdicciones Sanitarias en los Estados bajo estudio.
11) FINANCIAMIENTO HOGARES. Aportaciones financieras de los usuarios de servicios de salud a través del sistema de cuotas de recuperación. El indicador se presenta en función del peso relativo sobre el gasto total en relación al resto de aportaciones financieras. Las fuentes de información son: bases de datos del proyecto Equidad, Financiamiento y Gobernabilidad en Salud 1990‐2004 del INSP, Anuarios Estadísticos Estatales de la SSA 1990‐2003 y Registros Estadísticos 1990‐2004 de las Jurisdicciones Sanitarias en los Estados bajo estudio.
12) GASTO EN ATENCIÓN PREVENTIVA. Se refiere al monto financiero asignado y gastado en programas de atención promoción y prevención de daños a la salud, principalmente acciones de salud pública para cada estado. Las fuentes de información son: bases de datos del proyecto Equidad, Financiamiento y Gobernabilidad en Salud 1990‐2004 del INSP.
13) GASTO EN ATENCIÓN CURATIVA. Se refiere al monto financiero asignado y gastado en programas y acciones de atención a la salud dirigidas a curar y rehabilitar daños a la salud, en cada estado. Las fuentes de información son: bases de datos del proyecto Equidad, Financiamiento y Gobernabilidad en Salud 1990‐2004 del INSP.
14) GASTO EN ADMINISTRACIÓN Y GESTIÓN DE PROGRAMAS DE SALUD. Se refiere al monto financiero asignado y gastado en la administración y gestión de recursos humanos, materiales y financieros sobre todos los programas y acciones de atención a la salud en cada estado. Las fuentes de información son: bases de datos del proyecto Equidad, Financiamiento y Gobernabilidad en Salud 1990‐2004 del INSP.
15) MORTALIDAD INFANTIL. Es el número de muertes por todas las causas, por año y en menores de 1 año. Este indicador se determinó dividiendo el total de muertes reportadas por la población menor de 1 año de ambos sexos en cada estado y a nivel nacional por 100

Decentralized Service Delivery for the Poor 105
000 nacidos vivos. Las fuentes de información fueron los informes anuales de la SSA sobre daños a la salud, los anuarios estadísticos de INEGI, reportes de los Censos Nacionales/estatales de población y reportes de tendencias de población por grupo de edad de CONAPO. Todas las fuentes de datos son del período 1990‐2004.
16) MORTALIDAD MATERNA. Se refiere al total de muertes por todas las causas en mujeres en edad reproductiva por estado para el período 1990‐2003. Las fuentes de información fueron los informes anuales de la SSA sobre daños a la salud, los anuarios estadísticos de INEGI, reportes de los Censos Nacionales/estatales de población y reportes de tendencias de población por grupo de edad de CONAPO. Todas las fuentes de datos son del período 1990‐2004.
17) MORBILIDAD POR DIABETES. Es el número de casos diagnosticados, registrados y bajo control de diabetes mellitus tipo II acumulados para cada año durante el período 1990‐2004. Las fuentes de información fueron los informes anuales federales y estatales de la SSA sobre daños a la salud.
18) MORBILIDAD POR INFECCIONES RESPIRATORIAS AGUDAS. Es el número de casos diagnosticados, registrados y tratados de IRAS reportados para cada año durante el período 1990‐2004. Las fuentes de información fueron los informes anuales federales y estatales de la SSA sobre daños a la salud.
19) GOBERNABILIDAD. La variable gobernabilidad se define como la capacidad política de conducción de los programas y estrategias de salud. Se refiere al análisis de los actores, los roles, las reglas y las interacciones entre actores que resultan de la implementación de programas de salud. Su medición se realizó a partir de 8 baterías de preguntas en una guía para entrevistas a profundidad con los diferentes actores del sistema de salud en los estados bajo estudio de la segunda fase (Jalisco, Colima y Baja California Sur): usuarios, proveedores, autoridades de gobierno, líderes comunitarios, líderes de ONGs y líderes del poder legislativo. Los indicadores que se estudiaron en este análisis fueron los siguientes:
a.‐ Capacidad del planeamiento y de formulación de políticas: existencia de agenda ministerial con temas con permanencia, direccionalidad de políticas de los secretarios estatales de salud y existencia de planes estratégicos.
b.‐ Capacidad legislativa sectorial: tiempo para formular dispositivos de reforma nacional, estatal y municipal, tiempo para reglamentar nuevas leyes y tipos de dispositivos que emite el sector.
c.‐ Capacidad operativa de gobierno: producción y productividad, financiamiento sectorial, distribución de los recursos, y capacidad operativa de programas y proyectos en los diferentes niveles de gobierno.

Decentralized Service Delivery for the Poor 106
d.‐ Capacidad y habilidad directiva del funcionario líder y los decisores: especialización de los directivos en administración y gobierno en salud, tipo de selección del personal directivo, régimen laboral y salarial de directivos.
e.‐ Estabilidad política y conflictiva sectorial: número de paros, huelgas y de otros conflictos sindicales en el sector.
f.‐ Relación de proveedores con usuarios y la sociedad civil en general: capacidad de concentración sectorial, espacios de interacción proveedores‐usuarios, relaciones con los núcleos activos de la sociedad civil: ONGs y Colegio/Asociaciones Médicas.
g.‐ Participación social en salud: existencia y amplitud del voluntariado en salud, lideres de ONGs, peso y desarrollo de la participación comunitaria y situación de los órganos sectoriales dedicados a la promoción y monitoreo de la participación social.
h.‐Transparencia en la gestión: existencia de mecanismos de rendición de cuentas, formulación abierta/cerrada de dispositivos jurídicos de reformas y porcentaje de resoluciones sectoriales emitidas que son publicadas en el diario oficial del Estado y de acceso a la opinión pública.
i.‐ Participación directa en salud: niveles de participación de los diferentes actores sociales en las decisiones sobre programas y proyectos de salud.
20) RECURSOS HUMANOS MEDICOS. Se refiere a los médicos por 1000 habitantes por estado y a nivel nacional. El dato se obtuvo de los anuarios estadísticos sobre recursos humanos para la SSA a nivel estatal y municipal, 1990‐2004.
21) CAMAS CENSABLES. Representa el total de camas disponibles a nivel estatal y nacional para atención hospitalaria preventiva, correctiva o de rehabilitación de cualquier daño a la salud. La fuente de información son los anuarios estadísticos sobre recursos físicos para la SSA a nivel estatal y municipal, 1990‐2004 y Registros Anuales de la SSA a nivel de los estados, 1990‐2004.
22) APLICACIÓN DE BIOLÓGICOS. Número total de vacunas aplicadas a nivel estatal y nacional siguiendo las metas del programa ampliado de inmunizaciones. El dato se obtuvo de los anuarios estadísticos sobre servicios otorgados por la SSA a nivel estatal y municipal, 1990‐2004.
23) TASA DE OCUPACIÓN HOSPITALARIA. Promedio de camas censables que fueron ocupadas durante cada año del período 1995‐2003. El dato se obtuvo del Reporte Anual de Indicadores de Eficiencia y Evaluación del Desempeño, SSA‐2004.
24) INDICE DE ROTACIÓN HOSPITALARIA. Es la relación que existe entre los ingresos vs. egresos hospitalarios de acuerdo a días de estancia hospitalaria. El dato se obtuvo del Reporte Anual de Indicadores de Eficiencia y Evaluación del Desempeño, SSA‐2004.

Decentralized Service Delivery for the Poor 107
25) PROMEDIO DIARIO DE CONSULTAS. Es la sumatoria anual de la media diaria de consultas de primera vez para población no asegurada que se atiende en la SSA nacional y estatal. El dato se obtuvo del Reporte Anual de Indicadores de Eficiencia y Evaluación del Desempeño, SSA‐2004.
26) INDICE DE CORRESPONSABILIDAD FINANCIERA. Relación que existe entre el peso relativo de la aportación financiera federal vs. aportación financiera estatal al total del gasto en salud para los sistemas estatales de salud en población no asegurada. La fuente de información son los anuarios estadísticos sobre recursos financieros para la SSA a nivel federal‐estatal, 1990‐2004 y reportes y Síntesis Ejecutiva sobre Cuentas Estatales en Salud, SSA, 2003.
27) GASTO CATASTRÓFICO EN SALUD. Es el gasto en salud que realizan las familias directamente de su bolsillo en el proceso de búsqueda, obtención y seguimiento de la atención médica para atender daños a la salud. Para que el monto gastado se defina como “gasto catastrófico” deberá rebasar el 30% del ingreso familiar anual. La fuente de información son los informes salud 2003‐2004 de la SSA, y Síntesis Ejecutiva sobre Gasto catastrófico/protección Financiera en Salud 2003.
28) INDICE DE INEQUIDAD EN SALUD. El Índice de Inequidad en la asignación de recursos para la salud en los estados se definió como el grado de ajuste entre recursos para la salud y necesidades de salud de la población a nivel estatal. Se construyó en base a la
determinación de un algoritmo a partir del cálculo de la desviación media relativa:
Donde: ISi es el índice de inequidad en salud de cada estado
μ es la media nacional para cada indicador
Yi la sumatoria de valores de los 11 indicadores de gasto y asignación de recursos en salud a nivel estatal
n es el número de Estados
Utilizando su forma ajustada, el Índice de Inequidad se estimó mediante la siguiente ecuación:
Los 11 indicadores de gasto en salud que se utilizaron a nivel estatal fueron:
1) Coeficiente del público en salud como % del PIB.
ii Yd −= μ
μμ nYIS i
n
i−= ∑
=1

Decentralized Service Delivery for the Poor 108
2) Coeficiente del Gasto privado en salud como % del PIB
3) Coeficiente del Gasto total en salud como % del PIB
4) Coeficiente del Gasto público en salud % del gasto total en salud
5) Coeficiente del Gasto privado en salud como % del gasto total en salud
6) Coeficiente del Gasto total en salud como % del gasto total en salud
7) Coeficiente del Gasto público en salud per cápita para población asegurada
8) Coeficiente del Gasto público en salud per cápita para población no asegurada
9) Coeficiente del Gasto público en salud per cápita total
10) Coeficiente del Gasto privado en salud per cápita total
11) Coeficiente del Gasto catastrófico en salud: % de familias
El resultado de este indicador se combinó con el tipo de rezago epidemiológico en el que se encuentra cada estado bajo estudio y a partir de esta combinación se creo una escala de baja, media y alta inequidad con los siguientes rangos y tipo de transición epidemiológica: Baja de 1‐11 (Región de transición avanzada e intermedia); Media de 12‐21 (Región de transición incipiente); Alta de 22‐31 (Región de rezago infantil y rezago extremo).
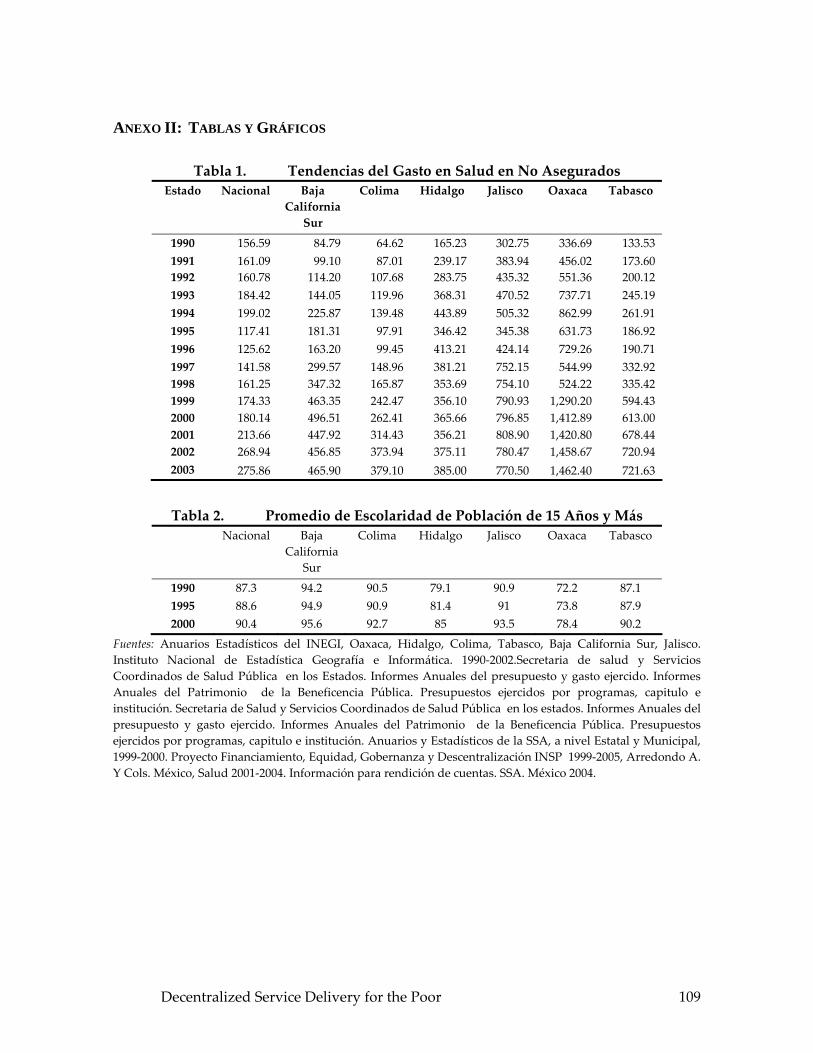
ANEXO II: TABLAS Y GRÁFICOS
Tabla 1. Tendencias del Gasto en Salud en No Asegurados Estado Nacional Baja
California Sur
Colima Hidalgo Jalisco Oaxaca Tabasco
1990 156.59 84.79 64.62 165.23 302.75 336.69 133.53 1991 161.09 99.10 87.01 239.17 383.94 456.02 173.60 1992 160.78 114.20 107.68 283.75 435.32 551.36 200.12 1993 184.42 144.05 119.96 368.31 470.52 737.71 245.19 1994 199.02 225.87 139.48 443.89 505.32 862.99 261.91 1995 117.41 181.31 97.91 346.42 345.38 631.73 186.92 1996 125.62 163.20 99.45 413.21 424.14 729.26 190.71 1997 141.58 299.57 148.96 381.21 752.15 544.99 332.92 1998 161.25 347.32 165.87 353.69 754.10 524.22 335.42 1999 174.33 463.35 242.47 356.10 790.93 1,290.20 594.43 2000 180.14 496.51 262.41 365.66 796.85 1,412.89 613.00 2001 213.66 447.92 314.43 356.21 808.90 1,420.80 678.44 2002 268.94 456.85 373.94 375.11 780.47 1,458.67 720.94 2003 275.86 465.90 379.10 385.00 770.50 1,462.40 721.63
Tabla 2. Promedio de Escolaridad de Población de 15 Años y Más Nacional Baja
California Sur
Colima Hidalgo Jalisco Oaxaca Tabasco
1990 87.3 94.2 90.5 79.1 90.9 72.2 87.1 1995 88.6 94.9 90.9 81.4 91 73.8 87.9 2000 90.4 95.6 92.7 85 93.5 78.4 90.2
Fuentes: Anuarios Estadísticos del INEGI, Oaxaca, Hidalgo, Colima, Tabasco, Baja California Sur, Jalisco. Instituto Nacional de Estadística Geografía e Informática. 1990‐2002.Secretaria de salud y Servicios Coordinados de Salud Pública en los Estados. Informes Anuales del presupuesto y gasto ejercido. Informes Anuales del Patrimonio de la Beneficencia Pública. Presupuestos ejercidos por programas, capitulo e institución. Secretaria de Salud y Servicios Coordinados de Salud Pública en los estados. Informes Anuales del presupuesto y gasto ejercido. Informes Anuales del Patrimonio de la Beneficencia Pública. Presupuestos ejercidos por programas, capitulo e institución. Anuarios y Estadísticos de la SSA, a nivel Estatal y Municipal, 1999‐2000. Proyecto Financiamiento, Equidad, Gobernanza y Descentralización INSP 1999‐2005, Arredondo A. Y Cols. México, Salud 2001‐2004. Información para rendición de cuentas. SSA. México 2004.
Decentralized Service Delivery for the Poor 109

Tabla 3. PIB per Cápita Estado Nacional Baja
California Sur
Colima Hidalgo Jalisco Oaxaca Tabasco
1990 13,055 15,670 13,004 7,150 12,620 5,601 8,156 1991 12,980 15,910 12,000 7,830 12,900 5,236 8,041 1992 13,100 16,500 13,400 8,163 13,050 5,903 8,413 1993 13, 205 17,300 13,661 8,586 13,211 6,104 8,958 1994 13,466 17,277 13,957 8,626 13,330 6,223 8,977 1995 12,415 16,844 13,155 7,510 12,060 5,884 8,756 1996 12,864 17,854 13,966 8,094 12,456 5,916 8,678 1997 13,540 18,094 14,116 8,427 13,081 5,864 8,901 1998 14,025 17,756 14,549 8,978 13,931 6,020 8,788 1999 14,360 17,920 15,098 9,090 14,369 6,141 8,861 2000 15,140 18,845 15,151 9,386 15,020 6,373 9,181 2001 14,954 19,011 14,436 9,110 14,931 6,401 9,118 2002 14,897 18,591 14,623 8,979 14,839 6,275 8,840 2003 14,946 19,210 14,436 8,982 14,705 6,281 8,834
Tabla 4. Población Económicamente Activa Estado Nacional Baja
California Sur
Colima Hidalgo Jalisco Oaxaca Tabasco
1990 43 47.2 45.9 40.5 43.8 39.2 41.6 1995 45.1 50.2 48.7 41.4 45 40.6 41.9 2000 49.3 54.9 53.4 46.4 52.6 44.8 45.5
Fuentes: Anuarios Estadísticos del INEGI, Oaxaca, Hidalgo, Colima, Tabasco, Baja California Sur, Jalisco. Instituto Nacional de Estadística Geografía e Informática. 1990‐2002.Secretaria de salud y Servicios Coordinados de Salud Pública en los Estados. Informes Anuales del presupuesto y gasto ejercido. Informes Anuales del Patrimonio de la Beneficencia Pública. Presupuestos ejercidos por programas, capitulo e institución. Secretaria de Salud y Servicios Coordinados de Salud Pública en los estados. Informes Anuales del presupuesto y gasto ejercido. Informes Anuales del Patrimonio de la Beneficencia Pública. Presupuestos ejercidos por programas, capitulo e institución. Anuarios y Estadísticos de la SSA, a nivel Estatal y Municipal, 1999‐2000. Proyecto Financiamiento, Equidad, Gobernanza y Descentralización INSP 1999‐2005, Arredondo A. Y Cols. México, Salud 2001‐2004. Información para rendición de cuentas. SSA. México 2004.
Tabla 5. Proporción de Viviendas con Agua PotableEstado Nacional Baja
California Sur
Colima Hidalgo Jalisco Oaxaca Tabasco
1990 83 86.9 91 67 84.5 51.3 56.7 1995 86.3 87 92.4 71.7 84.8 56.9 59.7 2000 89.9 87.1 94 79.6 89.2 65.5 69.3
Decentralized Service Delivery for the Poor 110

Tabla 6. Proporción de Viviendas con Drenaje Estado Nacional Baja
California Sur
Colima Hidalgo Jalisco Oaxaca Tabasco
1990 74 65.7 82.3 43.5 81.2 37.6 63.2 1995 79.4 68 85.1 49.3 84.5 39.8 67 2000 86.3 80.6 93.2 65.7 91.8 45.6 85.4
Fuentes: Anuarios Estadísticos del INEGI, Oaxaca, Hidalgo, Colima, Tabasco, Baja California Sur, Jalisco. Instituto Nacional de Estadística Geografía e Informática. 1990‐2002.Secretaria de salud y Servicios Coordinados de Salud Pública en los Estados. Informes Anuales del presupuesto y gasto ejercido. Informes Anuales del Patrimonio de la Beneficencia Pública. Presupuestos ejercidos por programas, capitulo e institución. Secretaria de Salud y Servicios Coordinados de Salud Pública en los estados. Informes Anuales del presupuesto y gasto ejercido. Informes Anuales del Patrimonio de la Beneficencia Pública. Presupuestos ejercidos por programas, capitulo e institución. Anuarios y Estadísticos de la SSA, a nivel Estatal y Municipal, 1999‐2000. Proyecto Financiamiento, Equidad, Gobernanza y Descentralización INSP 1999‐2005, Arredondo A. Y Cols. México, Salud 2001‐2004. Información para rendición de cuentas. SSA. México 2004.Tendencias por
Tipo de Fuente de Financiamiento Federal Estado Baja California
Sur Colima Hidalgo Jalisco Oaxaca Tabasco
1990 88.0 94.9 94.0 95.5 94.9 47.5 1991 87.4 94.4 93.8 95.0 94.4 44.3 1992 86.0 94.3 93.9 93.4 94.3 43.6 1993 86.3 93.8 93.3 92.8 93.8 42.4 1994 85.6 87.9 92.7 91.9 92.4 41.3 1995 83.1 89.5 92.6 90.8 91.3 40.8 1996 85.3 90.8 92.3 90.0 92.8 39.7 1997 87.1 89.2 92.1 86.3 89.2 38.8 1998 88.2 91.3 91.3 80.4 88.6 38.3 1999 88.0 91.5 90.5 72.0 91.5 38.0 2000 89.1 92.5 90.1 66.6 92.5 36.8 2001 90.0 93.4 91.3 63.0 93.1 37.0 2002 90.5 94.7 91.8 59.0 93.6 36.5 2003 90.5 94.7 91.8 56.0 93.5 33.5
Decentralized Service Delivery for the Poor 111

Tabla 8. Tendencias por Tipo de Fuente de Financiamiento Estatal Estado Baja
California Sur
Colima Hidalgo Jalisco Oaxaca Tabasco
1990 3.0 2.5 0.0 1.5 2.5 49.6 1991 3.5 3.3 0.0 1.8 3.3 52.6 1992 4.2 2.7 0.0 2.0 2.7 53.2 1993 4.0 3.0 0.0 1.7 3.0 53.9 1994 3.9 5.7 0.0 2.1 3.7 54.9 1995 5.1 4.9 0.5 2.1 3.8 56.9 1996 4.1 3.1 1.5 2.3 3.1 57.8 1997 4.2 3.9 1.5 5.0 3.9 57.9 1998 4.0 3.2 1.6 11.3 3.9 58.0 1999 4.6 4.5 1.8 17.0 4.5 58.1 2000 4.8 3.9 1.9 22.0 3.9 58.6 2001 4.5 3.7 1.9 25.0 4.1 58.2 2002 5.2 3.1 2.0 28.7 4.0 58.0 2003 5.2 3.0 2.7 31.7 3.8 61.0
Fuentes: Secretaria de Salud y Servicios Coordinados de Salud Pública en los Estados. Informes Anuales del presupuesto y gasto ejercido. Informes Anuales del Patrimonio de la Beneficencia Pública. Presupuestos ejercidos por programas, capitulo e institución. Secretaria de Salud y Servicios Coordinados de Salud Pública en los estados. Informes Anuales del presupuesto y gasto ejercido. Informes Anuales del Patrimonio de la Beneficencia Pública. Presupuestos ejercidos por programas, capitulo e institución. Anuarios y Estadísticos de la SSA, a nivel Estatal y Municipal, 1999‐2000. Proyecto Financiamiento, Equidad, Gobernanza y Descentralización INSP 1999‐2005, Arredondo A. Y Cols. México, Salud 2001‐2004. Información para rendición de cuentas. SSA. México 2004.
Tabla 9. Tendencias por Tipo de Fuente de Financiamiento Hogares Estado Baja
California Sur
Colima Hidalgo Jalisco Oaxaca Tabasco
1990 9.0 2.6 6.0 3.0 2.6 2.9 1991 9.1 2.3 6.2 3.2 2.3 3.1 1992 9.8 3.0 6.1 4.6 3.0 2.7 1993 9.7 3.2 6.7 5.5 3.2 3.4 1994 10.5 6.4 7.3 6.8 3.9 3.5 1995 11.8 5.6 6.9 7.1 4.9 1.7 1996 10.6 6.1 6.2 7.2 4.1 2.0 1997 8.4 6.9 6.4 8.2 6.9 2.8 1998 7.3 5.5 7.1 7.8 7.5 3.2 1999 6.5 3.5 7.4 10.3 3.5 3.2 2000 5.1 3.1 7.5 10.3 3.1 3.5 2001 4.3 2.6 7.7 10.8 3.1 4.5 2002 3.1 2.0 7.7 10.7 2.0 4.6 2003 3.0 2.6 6.9 9.9 2.0 5.1
Decentralized Service Delivery for the Poor 112

Tabla 10. Tendencias de Asignación en Atención Preventiva Estado Baja
California Sur
Colima Jalisco Oaxaca
1990 7.1 10.3 12.0 32.0 1991 10.6 11.7 13.6 30.0 1992 9.3 11.6 10.6 31.0 1993 7.8 12.3 8.6 20.0 1994 7.6 15.4 10.6 19.0 1995 6.9 14.5 10.5 22.0 1996 7.7 14.3 11.0 31.0 1997 14.3 14.5 8.7 20.0 1998 23.0 14.3 14.4 12.0 1999 14.3 21.3 15.5 16.0 2000 14.1 21.4 12.6 15.0 2001 16.6 23.4 18.9 12.0 2002 12.6 20.6 12.6 12.0 2003 13.7 25.6 15.1 12.0
Fuentes: Secretaria de Salud y Servicios Coordinados de Salud Pública en los Estados. Informes Anuales del presupuesto y gasto ejercido. Informes Anuales del Patrimonio de la Beneficencia Pública. Presupuestos ejercidos por programas, capitulo e institución. Secretaria de Salud y Servicios Coordinados de Salud Pública en los estados. Informes Anuales del presupuesto y gasto ejercido. Informes Anuales del Patrimonio de la Beneficencia Pública. Presupuestos ejercidos por programas, capitulo e institución. Anuarios y Estadísticos de la SSA, a nivel Estatal y Municipal, 1999‐2000. Proyecto Financiamiento, Equidad, Gobernanza y Descentralización INSP 1999‐2005, Arredondo A. Y Cols. México, Salud 2001‐2004. Información para rendición de cuentas. SSA. México 2004.
Tabla 11. Tendencias en Atención CurativaEstado Baja
California Sur
Colima Jalisco Oaxaca
1990 65.0 56.7 72.9 58.0 1991 62.3 58.7 71.0 58.0 1992 65.3 59.7 73.0 56.0 1993 66.8 55.1 72.8 55.0 1994 66.8 50.6 69.0 60.0 1995 61.9 54.1 70.5 53.0 1996 66.5 56.3 73.0 53.0 1997 58.0 54.4 81.5 67.0 1998 62.6 65.7 76.3 73.0 1999 67.7 61.2 75.3 72.0 2000 67.8 58.4 77.6 67.0 2001 68.3 56.2 70.7 69.0 2002 69.5 55.2 76.1 67.0 2003 68.3 50.0 73.1 66.5
Decentralized Service Delivery for the Poor 113

Tabla 12. Tendencias por Gastos de Administración/Gestión de Programas de Salud
Estado Baja California
Sur
Colima Jalisco Oaxaca
1990 27.9 33.0 4.4 10.0 1991 27.1 29.6 4.6 12.0 1992 25.3 28.7 4.5 13.0 1993 25.4 32.6 2.1 15.0 1994 25.7 34.0 20.5 21.0 1995 31.2 31.4 1.9 25.0 1996 25.8 29.4 1.6 16.0 1997 27.6 31.1 9.8 13.0 1998 14.4 20.0 9.3 15.0 1999 18.1 17.5 4.9 12.0 2000 18.1 20.2 9.8 18.0 2001 15.1 20.3 10.4 18.0 2002 17.9 24.2 11.2 20.0 2003 18.0 23.4 11.0 19.0
Fuentes: Secretaria de Salud y Servicios Coordinados de Salud Pública en los Estados. Informes Anuales del presupuesto y gasto ejercido. Informes Anuales del Patrimonio de la Beneficencia Pública. Presupuestos ejercidos por programas, capitulo e institución. Secretaria de Salud y Servicios Coordinados de Salud Pública en los estados. Informes Anuales del presupuesto y gasto ejercido. Informes Anuales del Patrimonio de la Beneficencia Pública. Presupuestos ejercidos por programas, capitulo e institución. Anuarios y Estadísticos de la SSA, a nivel Estatal y Municipal, 1999‐2000. Proyecto Financiamiento, Equidad, Gobernanza y Descentralización INSP 1999‐2005, Arredondo A. Y Cols. México, Salud 2001‐2004. Información para rendición de cuentas. SSA. México 2004.
Tabla 13. Tasa de Mortalidad Infantil (Menores De 1 Año) Estado Nacional Baja
California Sur
Colima Hidalgo Jalisco Oaxaca Tabasco
1990 245.1 500.3 690.7 340.2 67.6 201.7 1,316.8 1991 678.6 719.4 729.0 1,364.7 372.6 952.0 1,936.8 1992 798.0 622.1 829.0 1,495.9 509.3 1,114.0 1,110.9 1993 1,009.1 752.0 748.6 1,250.1 726.6 1,761.2 1,432.8 1994 326.0 375.9 389.0 352.0 194.6 323.9 1,248.7 1995 327.0 371.0 389.2 353.6 195.3 326.8 1,244.0 1996 323.9 522.9 353.2 420.6 58.7 406.3 1,083.6 1997 418.0 430.5 233.9 410.2 33.1 486.5 1,088.4 1998 469.1 453.1 319.0 374.9 98.1 399.7 1,165.7 1999 454.2 549.7 296.2 282.4 89.8 330.7 978.7 2000 464.0 636.3 443.0 377.6 100.9 359.4 1,250.4 2001 470.5 586.2 477.8 460.7 117.3 355.2 1,229.8 2002 511.3 509.4 653.0 538.5 113.3 591.5 1,054.1 2003 506.6 753.8 559.7 578.6 125.2 449.1 1,020.7
Decentralized Service Delivery for the Poor 114

Tabla 14. Mortalidad Materna: Total De Casos Estado Nacional Baja
California Sur
Colima Hidalgo Jalisco Oaxaca Tabasco
1990 6.0 2.0 3.0 6.0 1.0 7.0 6.0 1991 6.1 1.0 0.0 8.0 4.0 16.0 22.0 1992 6.4 0.0 2.0 6.0 9.0 9.0 4.0 1993 8.1 1.0 4.0 12.0 9.0 14.0 20.0 1994 9.6 0.0 1.0 10.0 3.0 32.0 13.0 1995 9.8 0.0 2.0 14.0 1.0 24.0 9.0 1996 6.8 0.0 3.0 7.0 3.0 7.0 7.0 1997 7.3 2.0 3.0 9.0 3.0 14.0 13.0 1998 10.1 1.0 2.0 11.0 5.0 14.0 13.0 1999 9.8 1.0 3.0 11.0 5.0 9.0 13.0 2000 9.2 0.0 0.0 8.0 9.0 17.0 22.0 2001 8.4 2.0 3.0 8.0 7.0 4.0 9.0 2002 8.3 2.0 2.0 7.0 7.0 15.0 20.0 2003 7.8 2.0 3.0 8.0 6.0 9.0 7.0
Fuentes: Anuarios Estadísticos de la Secretaria de Salud, Oaxaca, Hidalgo, Colima, Tabasco, Baja California Sur, Jalisco. 1990‐2002. Secretaria de salud y Servicios Coordinados de Salud Pública en los Estados. Informes Anuales del presupuesto y gasto ejercido. Informes Anuales del Patrimonio de la Beneficencia Pública. Presupuestos ejercidos por programas, capitulo e institución. Secretaria de Salud y Servicios Coordinados de Salud Pública en los estados. Informes Anuales del presupuesto y gasto ejercido. Informes Anuales del Patrimonio de la Beneficencia Pública. Presupuestos ejercidos por programas, capitulo e institución. Anuarios y Estadísticos de la SSA, a nivel Estatal y Municipal, 1999‐2000. Proyecto Financiamiento, Equidad, Gobernanza y Descentralización INSP 1999‐2005, Arredondo A. Y Cols. México, Salud 2001‐2004. Información para rendición de cuentas. SSA. México 2004.Morbilidad por Diabetes
Estado Nacional Baja California
Sur
Colima Hidalgo Jalisco Oaxaca Tabasco
1990 164.5 650.4 417.8 65.7 155.4 82.2 69.2 1991 57.4 105.9 92.0 31.1 58.3 38.3 57.2 1992 209.2 501.2 388.7 120.7 224.3 128.6 124.9 1993 73.5 474.9 295.5 96.9 297.0 118.9 137.6 1994 204.6 88.3 83.2 37.5 63.0 63.2 72.4 1995 70.9 109.7 256.6 122.3 105.6 74.5 101.7 1996 70.1 103.2 101.2 40.9 52.6 63.5 99.5 1997 80.6 92.0 89.6 49.2 54.8 59.8 104.5 1998 89.4 105.5 73.5 65.2 85.3 56.8 127.5 1999 107.1 123.0 112.0 92.0 97.0 80.0 159.0 2000 103.3 124.4 115.8 104.1 117.0 72.2 121.6 2001 108.7 114.9 115.9 120.2 103.2 91.6 149.4 2002 110.0 119.0 120.0 118.0 102.0 92.0 127.0 2003 110.0 115.0 121.0 119.0 101.0 94.0 130.0
Decentralized Service Delivery for the Poor 115

Tabla 16. Infecciones Respiratorias Agudas Estado Nacional Baja
California Sur
Colima Hidalgo Jalisco Oaxaca Tabasco
1990 11,417.8 30,800.5 23,672.8 12,112.3 14,001.4 8,228.3 13,156.5 1991 4,122.5 8,472.6 9,688.6 6,535.1 3,708.4 4,425.6 7,331.9 1992 13,320.5 33,236.9 26,044.2 11,016.0 17,549.2 7,601.7 11,449.5 1993 4,577.9 35,705.6 22,816.1 12,754.6 22,864.3 8,882.5 13,709.2 1994 14,766.0 8,029.5 8,732.4 7,507.3 3,749.5 4,357.4 9,097.4 1995 10,581.0 8,651.7 9,105.0 7,058.3 4,231.0 5,100.7 12,901.0 1996 4,883.6 8,018.1 11,791.6 8,255.4 3,630.5 5,435.9 11,504.5 1997 6,116.4 8,919.3 12,307.7 9,405.5 4,156.4 5,920.7 12,755.5 1998 6,697.3 8,301.5 12,366.2 10,675.2 4,684.4 6,792.1 13,295.5 1999 8,445.0 9,984.0 13,304.0 14,473.0 6,534.0 8,768.0 12,964.0 2000 8,718.3 9,795.7 12,634.6 16,074.8 7,349.0 8,591.6 14,156.3 2001 8,411.4 9,944.8 12,784.5 13,929.6 7,835.3 8,822.0 14,415.4 2002 7,809.0 9,115.0 12,602.0 14,505.0 8,911.0 9,167.0 13,191.0 2003 8,015.0 9,007.0 12,610.0 13,708.0 7,971.0 9,511.0 14,511.0
Fuentes: Anuarios Estadísticos de la Secretaria de Salud, Oaxaca, Hidalgo, Colima, Tabasco, Baja California Sur, Jalisco. 1990‐2002. Secretaria de salud y Servicios Coordinados de Salud Pública en los Estados. Informes Anuales del presupuesto y gasto ejercido. Informes Anuales del Patrimonio de la Beneficencia Pública. Presupuestos ejercidos por programas, capitulo e institución. Secretaria de Salud y Servicios Coordinados de Salud Pública en los estados. Informes Anuales del presupuesto y gasto ejercido. Informes Anuales del Patrimonio de la Beneficencia Pública. Presupuestos ejercidos por programas, capitulo e institución. Anuarios y Estadísticos de la SSA, a nivel Estatal y Municipal, 1999‐2000. Proyecto Financiamiento, Equidad, Gobernanza y Descentralización INSP 1999‐2005, Arredondo A. Y Cols. México, Salud 2001‐2004. Información para rendición de cuentas. SSA. México 2004.Indicadores de Recursos Humanos
MédicosEstado Nacional Baja
California Sur
Colima Hidalgo Jalisco Oaxaca Tabasco
1990 23,519 178 233 614 1,446 505 960 1991 25,040 197 239 698 1,404 640 1,041 1992 29,529 231 305 704 1,692 713 1,120 1993 31,065 260 315 731 1,744 742 1,288 1994 32,889 270 318 738 1,813 860 1,301 1995 36,213 288 359 738 1,962 984 1,609 1996 34,378 296 324 762 1,845 1,036 1,597 1997 43,731 308 347 887 2,967 1,227 1,703 1998 45,461 333 375 1,048 3,691 1,332 1,736 1999 50,309 357 416 1,262 3,992 1,473 1,866 2000 49,700 350 421 1,228 3,618 1,390 1,886 2001 51,443 359 433 1,306 3,856 1,672 1,907 2002 58,513 401 479 1,499 4,201 1,662 2,165 2003 59,305 423 509 1,414 4,207 2,048 1,310
Decentralized Service Delivery for the Poor 116

Tabla 18. Camas Censables Estado Nacional Baja
California Sur
Colima Hidalgo Jalisco Oaxaca Tabasco
1990 21,342 209 174 959 748 849 774 1991 22,942 219 181 928 588 821 782 1992 23,566 221 181 1,106 701 941 816 1993 22,882 212 181 630 701 656 777 1994 23,160 221 199 632 725 636 761 1995 24,862 220 199 622 750 711 782 1996 23,674 217 199 664 749 724 810 1997 31,064 214 201 706 2,484 741 803 1998 30,770 221 201 720 2,490 752 879 1999 16,650 169 199 345 2,459 584 524 2000 31,487 231 299 593 2,543 784 832 2001 31,914 231 247 593 2,618 868 867 2002 32,207 225 249 611 2,640 868 902 2003 31,549 225 249 611 2,640 868 869
Fuentes: Anuarios Estadísticos de la Secretaria de Salud, Oaxaca, Hidalgo, Colima, Tabasco, Baja California Sur, Jalisco. 1990‐2004.Cobertura de Vacunación
Estado Nacional Baja California
Sur
Colima Hidalgo Jalisco Oaxaca Tabasco
1990 43,194,685 130,609 456,532 1,209,006 2,805,224 1,267,020 1,716,105 1991 42,999,409 146,026 314,350 1,281,128 2,544,520 1,064,177 1,149,193 1992 53,334,820 195,425 1,207,817 1,324,156 3,639,553 1,378,750 1,728,913 1993 47,672,384 166,555 467,329 2,732,204 1,284,923 1,464,166 1,495,462 1994 36,404,357 112,881 207,995 883,507 2,232,356 1,137,417 1,099,393 1995 40,664,984 141,871 191,962 1,055,406 2,381,465 1,288,655 1,272,151 1996 35,594,80 133,810 235,791 1,100,369 2,387,289 1,267,190 1,100,385 1997 36,516,494 134,749 193,100 1,063,127 2,317,888 1,206,781 1,048,031 1998 40,838,075 158,130 238,125 1,261,246 2,374,343 1,577,202 1,449,963 1999 36,831,467 137,142 206,912 1,022,431 2,362,374 1,304,195 1,250,036 2000 37,209,302 144,967 193,840 964,108 2,491,581 1,403,516 1,130,671 2001 41,472,231 143,183 226,076 1,152,132 2,585,163 1,443,253 1,272,395 2002 41,000,309 142,101 198,511 1,231,007 2,391,790 1,561,192 1,125,250 2003 41,150,302 139,511 219,110 1,192,501 2,461,183 1,572,901 1,111,908
Decentralized Service Delivery for the Poor 117

Tabla 20. Tasa de Ocupación Hospitalaria Estado Nacional Baja
California Sur
Colima Hidalgo Jalisco Oaxaca Tabasco
1995 66 55 64 87 53 65 69 1996 69 67 75 88 59 71 78 1997 66 62 71 82 45 69 74 1998 65 63 69 80 44 66 74 1999 67 62 70 80 46 65 75 2000 68 62 73 78 49 65 76 2001 68 50 61 83 56 60 76 2002 70 54 65 78 58 61 79 2003 70 54 68 79 56 60 78
Fuentes: Anuarios Estadísticos de la Secretaria de Salud, Oaxaca, Hidalgo, Colima, Tabasco, Baja California Sur, Jalisco. 1990‐2004.
Tabla 21. Índice de Rotación Estado Nacional Baja
California Sur
Colima Hidalgo Jalisco Oaxaca Tabasco
1999 60 55 66 79 50 71 69 2000 55 54 68 76 49 70 67 2001 57 56 73 79 48 69 70 2002 58 58 75 75 47 65 71 2003 64 64 71 87 51 72 72
Tabla 22. Tasa de Promedio Diario de Consultas y por Día Estado Nacional Baja
California Sur
Colima Hidalgo Jalisco Oaxaca Tabasco
1995 1,363 2,153 1,821 1,192 1,331 968 1,780 1996 1,300 1,435 1,800 1,059 1,341 986 1,600 1997 1,380 2,007 1,759 1,115 1,382 1,011 1,920 1998 1,407 2,312 1,770 1,203 1,320 1,110 2,014 1999 1,410 2,308 1,701 1,620 1,270 1,320 1,930 2000 1,581 2,401 1,612 1,979 1,248 1,700 2,100 2001 1,690 2,412 1,841 2,019 1,535 1,609 2,214 2002 1,715 2,214 1,907 2,057 1,537 1,654 2,431 2003 1,850 2,511 2,005 2,110 1,539 1,702 2,011
Fuentes: Anuarios Estadísticos de la Secretaria de Salud, Oaxaca, Hidalgo, Colima, Tabasco, Baja California Sur, Jalisco. 1990‐2004.
Decentralized Service Delivery for the Poor 118

Tabla 23. Gasto per Capita en Salud Estado Nacional Baja
California Sur
Colima Hidalgo Jalisco Oaxaca Tabasco
1990 33 25 23 13 16 60 15 1991 60 41 31 38 20 76 18 1992 58 56 36 38 22 87 19 1993 66 67 41 50 24 111 22 1994 69 99 49 58 26 124 22 1995 60 82 37 43 17 75 15 1996 51 35 47 48 20 70 15 1997 40 108 42 38 32 45 25 1998 42 133 45 33 31 39 24 1999 44 163 62 32 32 86 41 2000 63 170 97 72 91 48 41 2001 82 185 135 63 52 96 50 2002 102 208 147 88 107 77 146 2003 112 215 161 87 110 83 131
Tabla 24. Índice de Responsabilidad Financiera: Gobierno Federal/Gobierno Estatal
Estado Baja California Sur
Colima Hidalgo Jalisco Oaxaca Tabasco
1994 5.1 8.6 12.0 9.3 9.8 1.3 1995 4.8 9.1 13.2 10.1 10.1 1.6 1996 5.6 10.1 11.5 9.0 13.9 1.6 1997 6.6 8.9 11.5 6.4 8.0 1.5 1998 7.3 10.1 10.9 4.0 7.3 1.8 1999 6.5 11.5 9.0 2.5 10.9 1.6 2000 8.9 12.5 10.1 1.9 11.5 1.3 2001 9.2 13.3 9.0 1.7 12.6 1.6 2002 9.6 13.8 9.0 1.7 13.8 1.5 2003 11.5 22.3 14.0 1.7 16.0 1.3
Fuentes: Anuarios Estadísticos de la secretaria de Salud, Oaxaca, Hidalgo, Colima, Tabasco, Baja California Sur, Jalisco. 1990‐2002. Secretaria de salud y Servicios Coordinados de Salud Pública en los Estados. Informes Anuales del presupuesto y gasto ejercido. Informes Anuales del Patrimonio de la Beneficencia Pública. Presupuestos ejercidos por programas, capitulo e institución. Secretaria de Salud y Servicios Coordinados de Salud Pública en los estados. Informes Anuales del presupuesto y gasto ejercido. Informes Anuales del Patrimonio de la Beneficencia Pública. Presupuestos ejercidos por programas, capitulo e institución. Anuarios y Estadísticos de la SSA, a nivel Estatal y Municipal, 1999‐2000. Proyecto Financiamiento, Equidad, Gobernanza y Descentralización INS 1999‐2005, Arredondo A. Y Cols. México, Salud 2001‐2004. Información para rendición de cuentas. SSA. México 2004.
Decentralized Service Delivery for the Poor 119
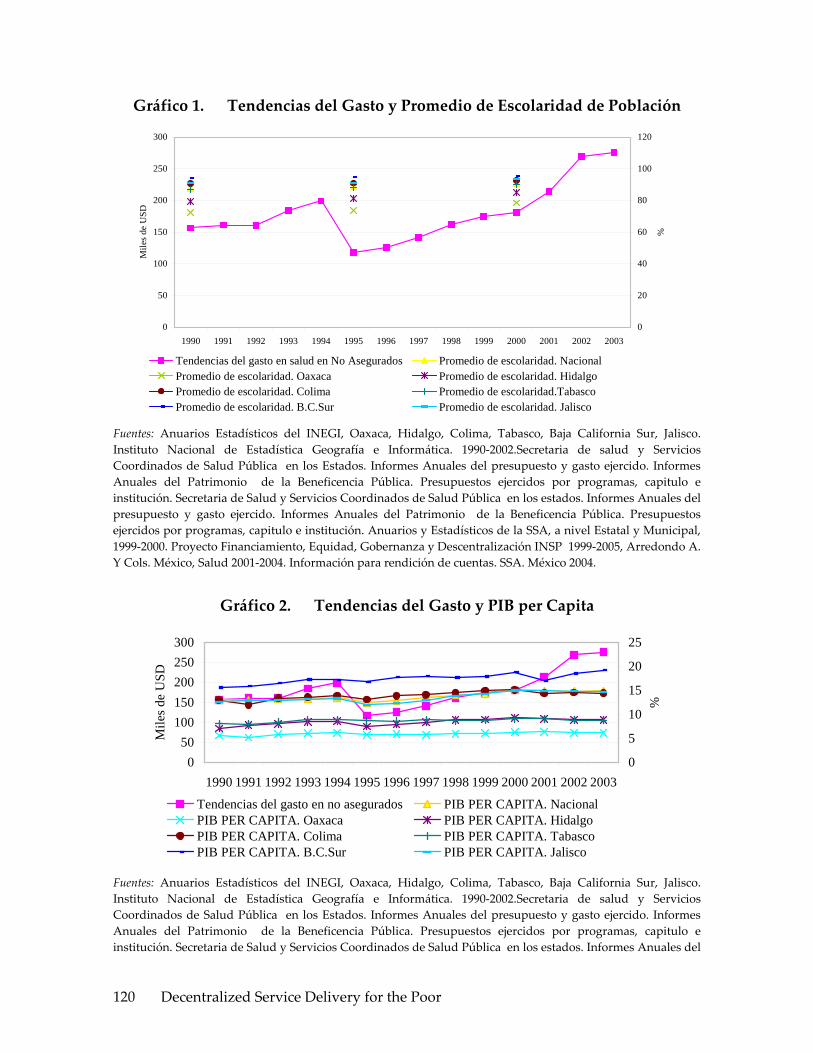
Gráfico 1. Tendencias del Gasto y Promedio de Escolaridad de Población
0
50
100
150
200
250
300
1990 1991 1992 1993 1994 1995 1996 1997 1998 1999 2000 2001 2002 2003
Mile
s de
USD
0
20
40
60
80
100
120
%
Tendencias del gasto en salud en No Asegurados Promedio de escolaridad. NacionalPromedio de escolaridad. Oaxaca Promedio de escolaridad. HidalgoPromedio de escolaridad. Colima Promedio de escolaridad.TabascoPromedio de escolaridad. B.C.Sur Promedio de escolaridad. Jalisco
Fuentes: Anuarios Estadísticos del INEGI, Oaxaca, Hidalgo, Colima, Tabasco, Baja California Sur, Jalisco. Instituto Nacional de Estadística Geografía e Informática. 1990‐2002.Secretaria de salud y Servicios Coordinados de Salud Pública en los Estados. Informes Anuales del presupuesto y gasto ejercido. Informes Anuales del Patrimonio de la Beneficencia Pública. Presupuestos ejercidos por programas, capitulo e institución. Secretaria de Salud y Servicios Coordinados de Salud Pública en los estados. Informes Anuales del presupuesto y gasto ejercido. Informes Anuales del Patrimonio de la Beneficencia Pública. Presupuestos ejercidos por programas, capitulo e institución. Anuarios y Estadísticos de la SSA, a nivel Estatal y Municipal, 1999‐2000. Proyecto Financiamiento, Equidad, Gobernanza y Descentralización INSP 1999‐2005, Arredondo A. Y Cols. México, Salud 2001‐2004. Información para rendición de cuentas. SSA. México 2004.
Gráfico 2. Tendencias del Gasto y PIB per Capita
050
100150200250300
1990 1991 1992 1993 1994 1995 1996 1997 1998 1999 2000 2001 2002 2003
Mile
s de
USD
0
5
10
15
20
25%
Tendencias del gasto en no asegurados PIB PER CAPITA. NacionalPIB PER CAPITA. Oaxaca PIB PER CAPITA. HidalgoPIB PER CAPITA. Colima PIB PER CAPITA. TabascoPIB PER CAPITA. B.C.Sur PIB PER CAPITA. Jalisco
Fuentes: Anuarios Estadísticos del INEGI, Oaxaca, Hidalgo, Colima, Tabasco, Baja California Sur, Jalisco. Instituto Nacional de Estadística Geografía e Informática. 1990‐2002.Secretaria de salud y Servicios Coordinados de Salud Pública en los Estados. Informes Anuales del presupuesto y gasto ejercido. Informes Anuales del Patrimonio de la Beneficencia Pública. Presupuestos ejercidos por programas, capitulo e institución. Secretaria de Salud y Servicios Coordinados de Salud Pública en los estados. Informes Anuales del
Decentralized Service Delivery for the Poor 120
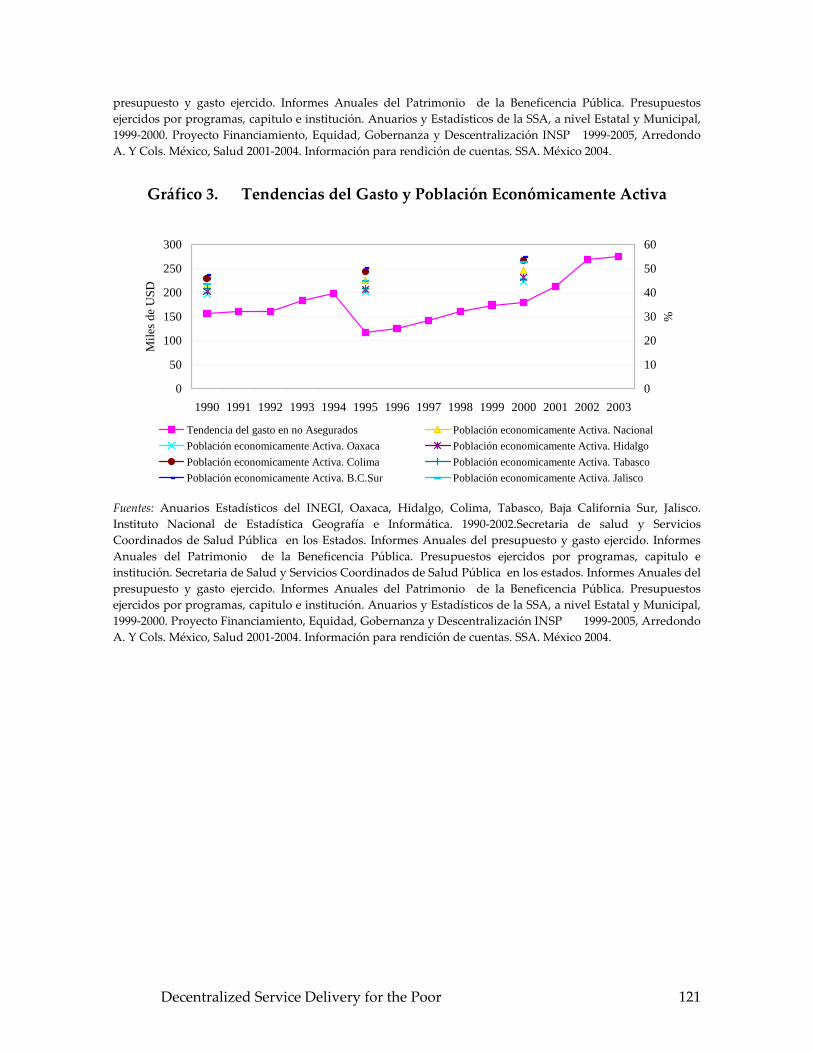
presupuesto y gasto ejercido. Informes Anuales del Patrimonio de la Beneficencia Pública. Presupuestos ejercidos por programas, capitulo e institución. Anuarios y Estadísticos de la SSA, a nivel Estatal y Municipal, 1999‐2000. Proyecto Financiamiento, Equidad, Gobernanza y Descentralización INSP 1999‐2005, Arredondo A. Y Cols. México, Salud 2001‐2004. Información para rendición de cuentas. SSA. México 2004.
Gráfico 3. Tendencias del Gasto y Población Económicamente Activa
0
50
100
150
200
250
300
1990 1991 1992 1993 1994 1995 1996 1997 1998 1999 2000 2001 2002 2003
Mile
s de
USD
0
10
20
30
40
50
60
%
Tendencia del gasto en no Asegurados Población economicamente Activa. NacionalPoblación economicamente Activa. Oaxaca Población economicamente Activa. HidalgoPoblación economicamente Activa. Colima Población economicamente Activa. TabascoPoblación economicamente Activa. B.C.Sur Población economicamente Activa. Jalisco
Fuentes: Anuarios Estadísticos del INEGI, Oaxaca, Hidalgo, Colima, Tabasco, Baja California Sur, Jalisco. Instituto Nacional de Estadística Geografía e Informática. 1990‐2002.Secretaria de salud y Servicios Coordinados de Salud Pública en los Estados. Informes Anuales del presupuesto y gasto ejercido. Informes Anuales del Patrimonio de la Beneficencia Pública. Presupuestos ejercidos por programas, capitulo e institución. Secretaria de Salud y Servicios Coordinados de Salud Pública en los estados. Informes Anuales del presupuesto y gasto ejercido. Informes Anuales del Patrimonio de la Beneficencia Pública. Presupuestos ejercidos por programas, capitulo e institución. Anuarios y Estadísticos de la SSA, a nivel Estatal y Municipal, 1999‐2000. Proyecto Financiamiento, Equidad, Gobernanza y Descentralización INSP 1999‐2005, Arredondo A. Y Cols. México, Salud 2001‐2004. Información para rendición de cuentas. SSA. México 2004.
Decentralized Service Delivery for the Poor 121
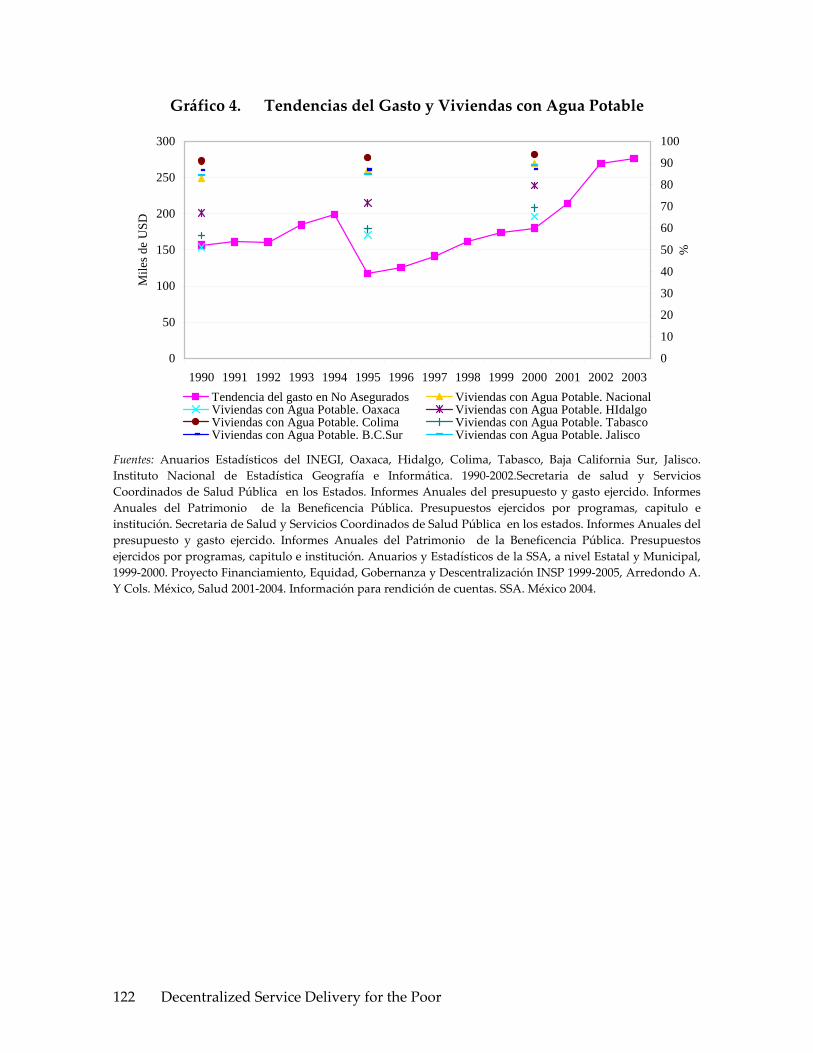
Gráfico 4. Tendencias del Gasto y Viviendas con Agua Potable
0
50
100
150
200
250
300
1990 1991 1992 1993 1994 1995 1996 1997 1998 1999 2000 2001 2002 2003
Mile
s de
USD
0
10
20
30
40
50
60
70
80
90
100
%
Tendencia del gasto en No Asegurados Viviendas con Agua Potable. NacionalViviendas con Agua Potable. Oaxaca Viviendas con Agua Potable. HIdalgoViviendas con Agua Potable. Colima Viviendas con Agua Potable. TabascoViviendas con Agua Potable. B.C.Sur Viviendas con Agua Potable. Jalisco
Fuentes: Anuarios Estadísticos del INEGI, Oaxaca, Hidalgo, Colima, Tabasco, Baja California Sur, Jalisco. Instituto Nacional de Estadística Geografía e Informática. 1990‐2002.Secretaria de salud y Servicios Coordinados de Salud Pública en los Estados. Informes Anuales del presupuesto y gasto ejercido. Informes Anuales del Patrimonio de la Beneficencia Pública. Presupuestos ejercidos por programas, capitulo e institución. Secretaria de Salud y Servicios Coordinados de Salud Pública en los estados. Informes Anuales del presupuesto y gasto ejercido. Informes Anuales del Patrimonio de la Beneficencia Pública. Presupuestos ejercidos por programas, capitulo e institución. Anuarios y Estadísticos de la SSA, a nivel Estatal y Municipal, 1999‐2000. Proyecto Financiamiento, Equidad, Gobernanza y Descentralización INSP 1999‐2005, Arredondo A. Y Cols. México, Salud 2001‐2004. Información para rendición de cuentas. SSA. México 2004.
Decentralized Service Delivery for the Poor 122

Gráfico 5. Tendencias del Gasto y Viviendas con Drenaje
0
50
100
150
200
250
300
1990 1991 1992 1993 1994 1995 1996 1997 1998 1999 2000 2001 2002 2003
Mile
s de
USD
0102030405060708090100
%
Tendencia del gasto en No Asegurados Viviendas con drenaje. NacionalViviendas con Drenaje. Oaxaca Viviendas con Drenaje. HidalgoViviendas con Drenaje. Colima Viviendas con Drenaje. TabascoViviendas con Drenaje. B.C. Sur Viviendas con Drenaje. Jalisco
Fuentes: Anuarios Estadísticos del INEGI, Oaxaca, Hidalgo, Colima, Tabasco, Baja California Sur, Jalisco. Instituto Nacional de Estadística Geografía e Informática. 1990‐2002.Secretaria de salud y Servicios Coordinados de Salud Pública en los Estados. Informes Anuales del presupuesto y gasto ejercido. Informes Anuales del Patrimonio de la Beneficencia Pública. Presupuestos ejercidos por programas, capitulo e institución. Secretaria de Salud y Servicios Coordinados de Salud Pública en los estados. Informes Anuales del presupuesto y gasto ejercido. Informes Anuales del Patrimonio de la Beneficencia Pública. Presupuestos ejercidos por programas, capitulo e institución. Anuarios y Estadísticos de la SSA, a nivel Estatal y Municipal, 1999‐2000. Proyecto Financiamiento, Equidad, Gobernanza y Descentralización INSP 1999‐2005, Arredondo A. Y Cols. México, Salud 2001‐2004. Información para rendición de cuentas. SSA. México 2004.
Gráfico 6. Tendencias del Peso Relativo del Gasto Total en Salud por Tipo de Fuente de Financiamiento Federal
0
10
20
30
40
50
60
70
80
90
100
1990 1991 1992 1993 1994 1995 1996 1997 1998 1999 2000 2001 2002 2003Fuente de Financiamiento Federal. Oaxaca Fuente de Financiamiento Federal. HidalgoFuente de Financiamiento Federal. Colima Fuente de Financiamiento Federal. TabascoFuente de Financiamiento Federal. Baja C. Sur Fuente de Financiamiento Federal. Jalisco
Fuentes: Secretaria de Salud y Servicios Coordinados de Salud Pública en los Estados. Informes Anuales del presupuesto y gasto ejercido. Informes Anuales del Patrimonio de la Beneficencia Pública. Presupuestos ejercidos por programas, capitulo e institución. Secretaria de Salud y Servicios Coordinados de Salud Pública
Decentralized Service Delivery for the Poor 123

en los estados. Informes Anuales del presupuesto y gasto ejercido. Informes Anuales del Patrimonio de la Beneficencia Pública. Presupuestos ejercidos por programas, capitulo e institución. Anuarios y Estadísticos de la SSA, a nivel Estatal y Municipal, 1999‐2000. Proyecto Financiamiento, Equidad, Gobernanza y Descentralización INSP 1999‐2005, Arredondo A. Y Cols. México, Salud 2001‐2004. Información para rendición de cuentas. SSA. México 2004.
Gráfico 7. Tendencias del Peso Relativo del Gasto en Salud por Tipo de Fuente de Financiamiento Estatal
0
10
20
30
40
50
60
70
1990 1991 1992 1993 1994 1995 1996 1997 1998 1999 2000 2001 2002 2003
Fuente de Financiamiento Estatal. Oaxaca Fuente de Financiamiento Estatal. HidalgoFuente de Financiamiento Estatal. Colima Fuente de Financiamiento Estatal. Tabasco
Fuente de Financiamiento Estatal. B.C. Sur Fuente de Financiamiento Estatal. Jalisco
Fuentes: Secretaria de Salud y Servicios Coordinados de Salud Pública en los Estados. Informes Anuales del presupuesto y gasto ejercido. Informes Anuales del Patrimonio de la Beneficencia Pública. Presupuestos ejercidos por programas, capitulo e institución. Secretaria de Salud y Servicios Coordinados de Salud Pública en los estados. Informes Anuales del presupuesto y gasto ejercido. Informes Anuales del Patrimonio de la Beneficencia Pública. Presupuestos ejercidos por programas, capitulo e institución. Anuarios y Estadísticos de la SSA, a nivel Estatal y Municipal, 1999‐2000. Proyecto Financiamiento, Equidad, Gobernanza y Descentralización INSP 1999‐2005, Arredondo A. Y Cols. México, Salud 2001‐2004. Información para rendición de cuentas. SSA. México 2004.
Decentralized Service Delivery for the Poor 124
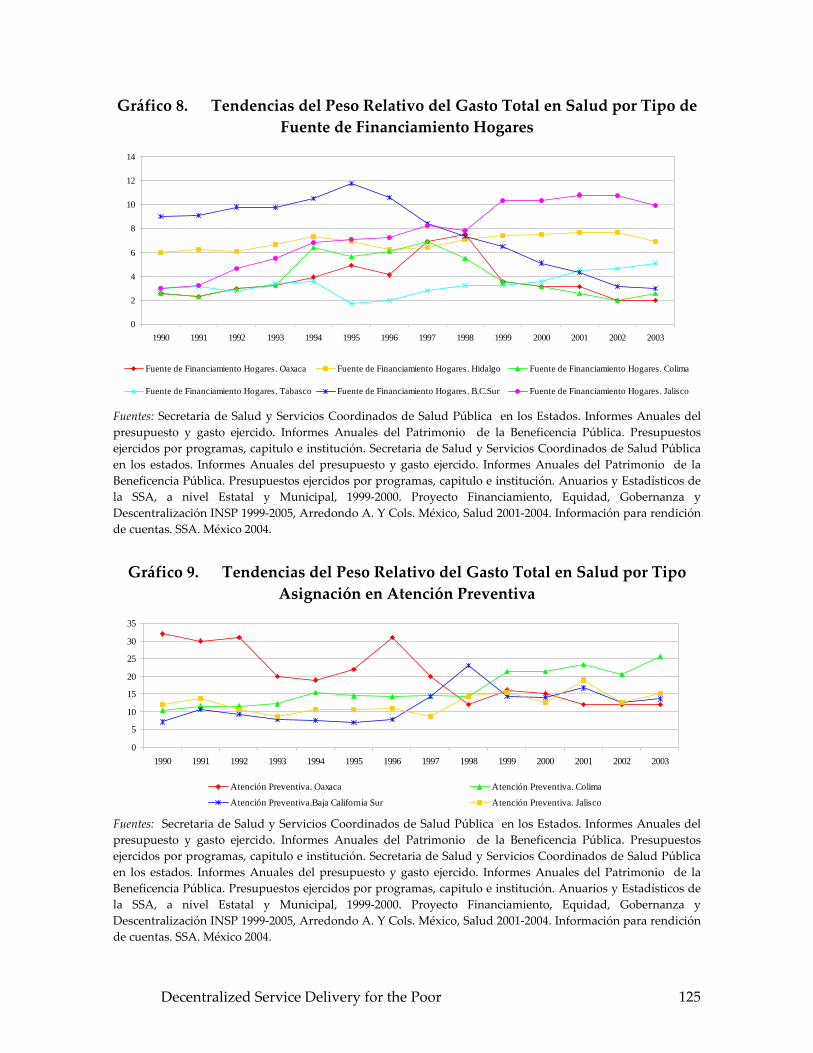
Gráfico 8. Tendencias del Peso Relativo del Gasto Total en Salud por Tipo de Fuente de Financiamiento Hogares
0
2
4
6
8
10
12
14
1990 1991 1992 1993 1994 1995 1996 1997 1998 1999 2000 2001 2002 2003
Fuente de Financiamiento Hogares. Oaxaca Fuente de Financiamiento Hogares. Hidalgo Fuente de Financiamiento Hogares. Colima
Fuente de Financiamiento Hogares. Tabasco Fuente de Financiamiento Hogares. B.C.Sur Fuente de Financiamiento Hogares. Jalisco
Fuentes: Secretaria de Salud y Servicios Coordinados de Salud Pública en los Estados. Informes Anuales del presupuesto y gasto ejercido. Informes Anuales del Patrimonio de la Beneficencia Pública. Presupuestos ejercidos por programas, capitulo e institución. Secretaria de Salud y Servicios Coordinados de Salud Pública en los estados. Informes Anuales del presupuesto y gasto ejercido. Informes Anuales del Patrimonio de la Beneficencia Pública. Presupuestos ejercidos por programas, capitulo e institución. Anuarios y Estadísticos de la SSA, a nivel Estatal y Municipal, 1999‐2000. Proyecto Financiamiento, Equidad, Gobernanza y Descentralización INSP 1999‐2005, Arredondo A. Y Cols. México, Salud 2001‐2004. Información para rendición de cuentas. SSA. México 2004.
Gráfico 9. Tendencias del Peso Relativo del Gasto Total en Salud por Tipo Asignación en Atención Preventiva
0
5
10
15
20
25
30
35
1990 1991 1992 1993 1994 1995 1996 1997 1998 1999 2000 2001 2002 2003
Atención Preventiva. Oaxaca Atención Preventiva. Colima
Atención Preventiva.Baja California Sur Atención Preventiva. Jalisco Fuentes: Secretaria de Salud y Servicios Coordinados de Salud Pública en los Estados. Informes Anuales del presupuesto y gasto ejercido. Informes Anuales del Patrimonio de la Beneficencia Pública. Presupuestos ejercidos por programas, capitulo e institución. Secretaria de Salud y Servicios Coordinados de Salud Pública en los estados. Informes Anuales del presupuesto y gasto ejercido. Informes Anuales del Patrimonio de la Beneficencia Pública. Presupuestos ejercidos por programas, capitulo e institución. Anuarios y Estadísticos de la SSA, a nivel Estatal y Municipal, 1999‐2000. Proyecto Financiamiento, Equidad, Gobernanza y Descentralización INSP 1999‐2005, Arredondo A. Y Cols. México, Salud 2001‐2004. Información para rendición de cuentas. SSA. México 2004.
Decentralized Service Delivery for the Poor 125

Gráfico 10. Tendencias del Peso Relativo del Gasto Total en Salud por Tipo de Asignación en Atención Curativa
0
10
20
30
40
50
60
70
80
90
1990 1991 1992 1993 1994 1995 1996 1997 1998 1999 2000 2001 2002 2003
Atención Curativa. Oaxaca Atención Curativa.Colima Atención Curativa. Baja California Sur Atención Curativa. Jalisco Fuentes: Secretaria de Salud y Servicios Coordinados de Salud Pública en los Estados. Informes Anuales del presupuesto y gasto ejercido. Informes Anuales del Patrimonio de la Beneficencia Pública. Presupuestos ejercidos por programas, capitulo e institución. Secretaria de Salud y Servicios Coordinados de Salud Pública en los estados. Informes Anuales del presupuesto y gasto ejercido. Informes Anuales del Patrimonio de la Beneficencia Pública. Presupuestos ejercidos por programas, capitulo e institución. Anuarios y Estadísticos de la SSA, a nivel Estatal y Municipal, 1999‐2000. Proyecto Financiamiento, Equidad, Gobernanza y Descentralización INSP 1999‐2005, Arredondo A. Y Cols. México, Salud 2001‐2004. Información para rendición de cuentas. SSA. México 2004.
Gráfico 11. Tendencias del Peso Relativo del Gasto Total en Salud por Gastos de Administración/Gestión de Programas de Salud
0
5
10
15
20
25
30
35
40
1990 1991 1992 1993 1994 1995 1996 1997 1998 1999 2000 2001 2002 2003Gastos de Administración. Oaxaca Gastos de Administración. ColimaGastos de Administración.Baja California Sur Gastos de Administración. Jalisco
Fuentes: Secretaria de Salud y Servicios Coordinados de Salud Pública en los Estados. Informes Anuales del presupuesto y gasto ejercido. Informes Anuales del Patrimonio de la Beneficencia Pública. Presupuestos ejercidos por programas, capitulo e institución. Secretaria de Salud y Servicios Coordinados de Salud Pública en los estados. Informes Anuales del presupuesto y gasto ejercido. Informes Anuales del Patrimonio de la Beneficencia Pública. Presupuestos ejercidos por programas, capitulo e institución. Anuarios y Estadísticos de la SSA, a nivel Estatal y Municipal, 1999‐2000. Proyecto Financiamiento, Equidad, Gobernanza y Descentralización INSP 1999‐2005, Arredondo A. Y Cols. México, Salud 2001‐2004. Información para rendición de cuentas. SSA. México 2004.
Decentralized Service Delivery for the Poor 126

Gráfico 12. Tendencias del Gasto en Salud y Tasa de Mortalidad Infantil
0
50
100
150
200
250
300
1990 1991 1992 1993 1994 1995 1996 1997 1998 1999 2000 2001 2002 2003
Mile
s de
USD
0
200
400
600
800
1000
1200
1400
1600
1800
2000
Tasa
de
Mor
talid
ad In
fant
il
Tendencias del gasto en salud en No Asegurados Tasa de Mortalidad Infantil. NacionalTasa de Mortalidad Infantil. Oaxaca Tasa de Mortalidad Infantil. HidalgoTasa de Mortalidad Infantil. Colima Tasa de Mortalidad Infantil.TabascoTasa de Mortalidad Infantil. B.C.Sur Tasa de Mortalidad Infantil. Jalisco
Fuentes: Anuarios Estadísticos de la secretaria de Salud, Oaxaca, Hidalgo, Colima, Tabasco, Baja California Sur, Jalisco. 1990‐2002. Secretaria de salud y Servicios Coordinados de Salud Pública en los Estados. Informes Anuales del presupuesto y gasto ejercido. Informes Anuales del Patrimonio de la Beneficencia Pública. Presupuestos ejercidos por programas, capitulo e institución. Secretaria de Salud y Servicios Coordinados de Salud Pública en los estados. Informes Anuales del presupuesto y gasto ejercido. Informes Anuales del Patrimonio de la Beneficencia Pública. Presupuestos ejercidos por programas, capitulo e institución. Anuarios y Estadísticos de la SSA, a nivel Estatal y Municipal, 1999‐2000. Proyecto Financiamiento, Equidad, Gobernanza y Descentralización INSP 1999‐2005, Arredondo A. Y Cols. México, Salud 2001‐2004. Información para rendición de cuentas. SSA. México 2004.
Decentralized Service Delivery for the Poor 127

Gráfico 13. Tendencias del Gasto en Salud y Mortalidad Materna
0
50
100
150
200
250
300
1990 1991 1992 1993 1994 1995 1996 1997 1998 1999 2000 2001 2002 2003
Mile
s de
USD
0
5
10
15
20
25
30
35
Tasa
de
Mor
talid
ad M
ater
na
Tendencia del gasto en no Asegurados Casos de Mortalidad Materna. NacionalCasos de Mortalidad Materna. Oaxaca Casos de Mortalidad Materna.HidalgoCasos de Mortalidad Materna.Colima Casos de Mortalidad Materna. TabascoCasos de Mortalidad Materna.Baja California Sur Casos de Mortalidad Materna. Jalisco
Fuentes: Anuarios Estadísticos de la secretaria de Salud, Oaxaca, Hidalgo, Colima, Tabasco, Baja California Sur, Jalisco. 1990‐2002. Secretaria de salud y Servicios Coordinados de Salud Pública en los Estados. Informes Anuales del presupuesto y gasto ejercido. Informes Anuales del Patrimonio de la Beneficencia Pública. Presupuestos ejercidos por programas, capitulo e institución. Secretaria de Salud y Servicios Coordinados de Salud Pública en los estados. Informes Anuales del presupuesto y gasto ejercido. Informes Anuales del Patrimonio de la Beneficencia Pública. Presupuestos ejercidos por programas, capitulo e institución. Anuarios y Estadísticos de la SSA, a nivel Estatal y Municipal, 1999‐2000. Proyecto Financiamiento, Equidad, Gobernanza y Descentralización INSP 1999‐2005, Arredondo A. Y Cols. México, Salud 2001‐2004. Información para rendición de cuentas. SSA. México 2004.
Decentralized Service Delivery for the Poor 128

Gráfico 14. Tendencias del Gasto en Salud y Morbilidad por Diabetes
0
50
100
150
200
250
300
1990 1991 1992 1993 1994 1995 1996 1997 1998 1999 2000 2001 2002 2003
Mile
s de
USD
0
100
200
300
400
500
600
700
Mor
bilid
ad p
or D
iabe
tes
Tendencia del gasto en No Asegurados Tasa de Morbilidad po Diabetes.NacionalTasa de Morbilidad por Diabetes.Oaxaca Tasa de Morbilidad por Diabetes.HidalgoTasa de Morbilidad por Diabetes. Colima Tasa de Morbilidad por Diabetes. TabascoTasa de Morbilidad por Diabetes. B.C.Sur Tasa de Morbilidad por Diabetes. Jalisco
Fuentes: Anuarios Estadísticos de la secretaria de Salud, Oaxaca, Hidalgo, Colima, Tabasco, Baja California Sur, Jalisco. 1990‐2002. Secretaria de salud y Servicios Coordinados de Salud Pública en los Estados. Informes Anuales del presupuesto y gasto ejercido. Informes Anuales del Patrimonio de la Beneficencia Pública. Presupuestos ejercidos por programas, capitulo e institución. Secretaria de Salud y Servicios Coordinados de Salud Pública en los estados. Informes Anuales del presupuesto y gasto ejercido. Informes Anuales del Patrimonio de la Beneficencia Pública. Presupuestos ejercidos por programas, capitulo e institución. Anuarios y Estadísticos de la SSA, a nivel Estatal y Municipal, 1999‐2000. Proyecto Financiamiento, Equidad, Gobernanza y Descentralización INSP 1999‐2005, Arredondo A. Y Cols. México, Salud 2001‐2004. Información para rendición de cuentas. SSA. México 2004.
Decentralized Service Delivery for the Poor 129

Gráfico 15. Tendencias de Gasto en Salud y Morbilidad por Infecciones Respiratorias Agudas
0
50
100
150
200
250
300
1990 1991 1992 1993 1994 1995 1996 1997 1998 1999 2000 2001 2002 2003
Mile
s de
USD
0
50
100
150
200
250
300
350
400
Mor
bilid
ad p
or In
fecc
ione
s R
espi
rato
rias A
guda
s
Tendencias del gasto en salud en No Asegurados Infecciones repiratorias agudas.NacionalInfecciones respiratorias agudas. Oaxaca Infecciones respiratorias agudas. HidalgoInfecciones respiratorias agudas. Colima Infecciones respiratorias agudas. TabascoInfecciones respiratorias agudas. B.C.Sur Infecciones respiratorias agudas. Jalisco
Fuentes: Anuarios Estadísticos de la secretaria de Salud, Oaxaca, Hidalgo, Colima, Tabasco, Baja California Sur, Jalisco. 1990‐2002. Secretaria de salud y Servicios Coordinados de Salud Pública en los Estados. Informes Anuales del presupuesto y gasto ejercido. Informes Anuales del Patrimonio de la Beneficencia Pública. Presupuestos ejercidos por programas, capitulo e institución. Secretaria de Salud y Servicios Coordinados de Salud Pública en los estados. Informes Anuales del presupuesto y gasto ejercido. Informes Anuales del Patrimonio de la Beneficencia Pública. Presupuestos ejercidos por programas, capitulo e institución. Anuarios y Estadísticos de la SSA, a nivel Estatal y Municipal, 1999‐2000. Proyecto Financiamiento, Equidad, Gobernanza y Descentralización INSP 1999‐2005, Arredondo A. Y Cols. México, Salud 2001‐2004. Información para rendición de cuentas. SSA. México 2004.
Gráfico 16. Tendencias de Cobertura en Salud. Indicadores de Recursos Humanos Médicos
0
500
1,000
1,500
2,000
2,500
3,000
3,500
4,000
4,500
1990 1991 1992 1993 1994 1995 1996 1997 1998 1999 2000 2001 2002 2003
Recursos Humanos Médicos. Nacional Recursos Humanos Médicos. Oaxaca Recursos Humanos Médicos. HidalgoRecursos Humanos Médicos. Colima Recursos Humanos Médicos. Tabasco Recursos Humanos Médicos. B.C. SurRecursos Humanos Médicos. Jalisco
Fuentes: Anuarios Estadísticos de la Secretaria de Salud, Oaxaca, Hidalgo, Colima, Tabasco, Baja California Sur, Jalisco. 1990‐2004.
Decentralized Service Delivery for the Poor 130
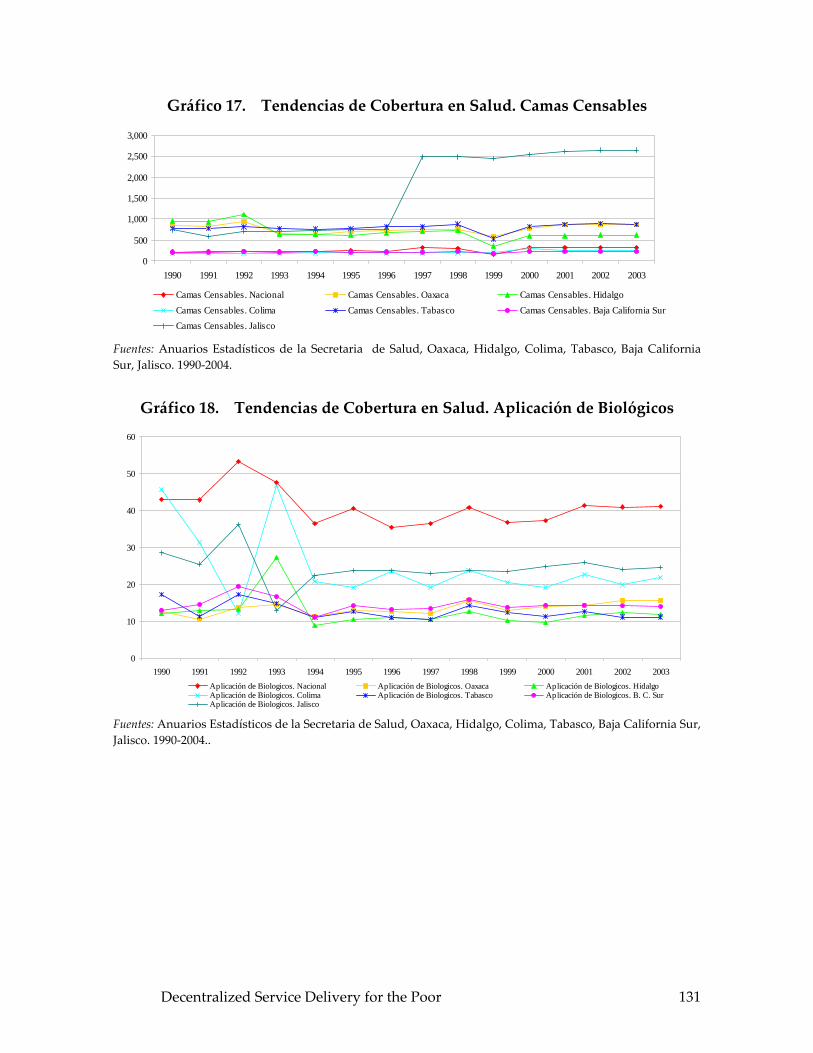
Gráfico 17. Tendencias de Cobertura en Salud. Camas Censables
0
500
1,000
1,500
2,000
2,500
3,000
1990 1991 1992 1993 1994 1995 1996 1997 1998 1999 2000 2001 2002 2003
Camas Censables. Nacional Camas Censables. Oaxaca Camas Censables. HidalgoCamas Censables. Colima Camas Censables. Tabasco Camas Censables. Baja California SurCamas Censables. Jalisco
Fuentes: Anuarios Estadísticos de la Secretaria de Salud, Oaxaca, Hidalgo, Colima, Tabasco, Baja California Sur, Jalisco. 1990‐2004.
Gráfico 18. Tendencias de Cobertura en Salud. Aplicación de Biológicos
0
10
20
30
40
50
60
1990 1991 1992 1993 1994 1995 1996 1997 1998 1999 2000 2001 2002 2003Aplicación de Biologicos. Nacional Aplicación de Biologicos. Oaxaca Aplicación de Biologicos. HidalgoAplicación de Biologicos. Colima Aplicación de Biologicos. Tabasco Aplicación de Biologicos. B. C. SurAplicación de Biologicos. Jalisco
Fuentes: Anuarios Estadísticos de la Secretaria de Salud, Oaxaca, Hidalgo, Colima, Tabasco, Baja California Sur, Jalisco. 1990‐2004..
Decentralized Service Delivery for the Poor 131
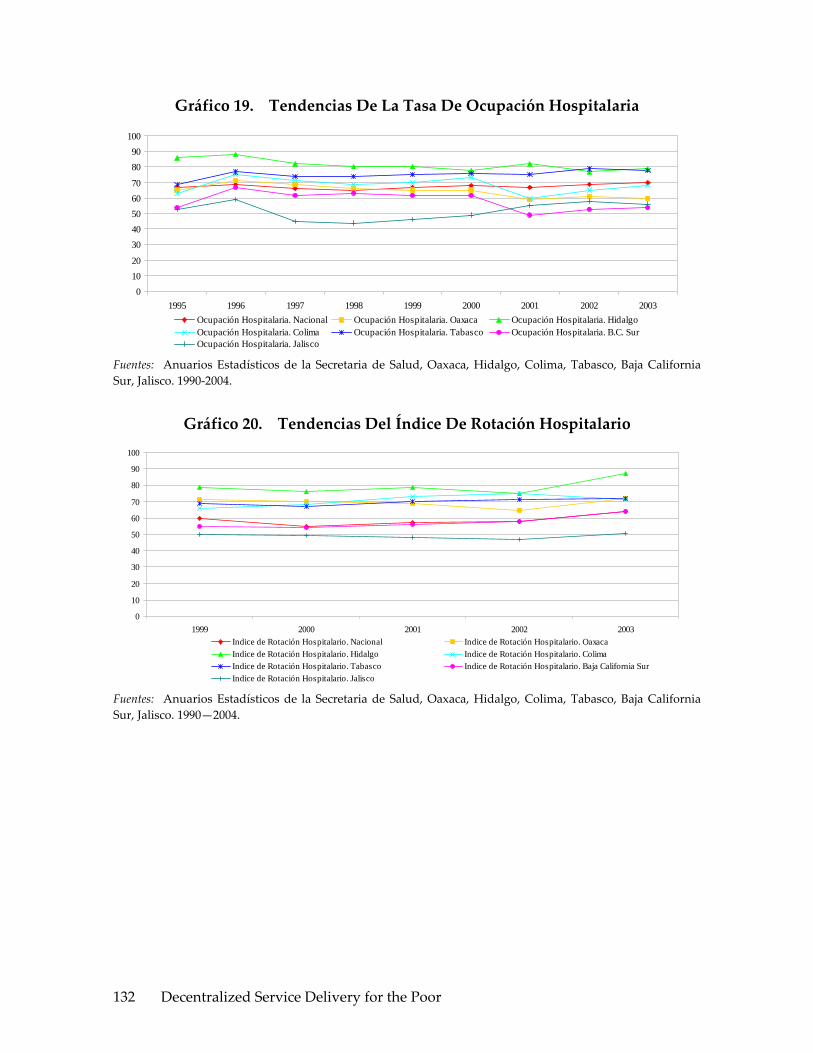
Gráfico 19. Tendencias De La Tasa De Ocupación Hospitalaria
01020
3040506070
8090
100
1995 1996 1997 1998 1999 2000 2001 2002 2003Ocupación Hospitalaria. Nacional Ocupación Hospitalaria. Oaxaca Ocupación Hospitalaria. HidalgoOcupación Hospitalaria. Colima Ocupación Hospitalaria. Tabasco Ocupación Hospitalaria. B.C. SurOcupación Hospitalaria. Jalisco
Fuentes: Anuarios Estadísticos de la Secretaria de Salud, Oaxaca, Hidalgo, Colima, Tabasco, Baja California Sur, Jalisco. 1990‐2004.
Gráfico 20. Tendencias Del Índice De Rotación Hospitalario
0
10
20
30
40
50
60
70
80
90
100
1999 2000 2001 2002 2003Indice de Rotación Hospitalario. Nacional Indice de Rotación Hospitalario. OaxacaIndice de Rotación Hospitalario. Hidalgo Indice de Rotación Hospitalario. ColimaIndice de Rotación Hospitalario. Tabasco Indice de Rotación Hospitalario. Baja California SurIndice de Rotación Hospitalario. Jalisco
Fuentes: Anuarios Estadísticos de la Secretaria de Salud, Oaxaca, Hidalgo, Colima, Tabasco, Baja California Sur, Jalisco. 1990—2004.
Decentralized Service Delivery for the Poor 132

Gráfico 21. Tendencias Del Promedio Diario De Consultas
0500
1,0001,500
2,0002,500
3,000
1995 1996 1997 1998 1999 2000 2001 2002 2003Promedio de Consultas. Nacional Promedio de Consultas. OaxacaPromedio de Consultas. Hidalgo Promedio de Consultas. ColimaPromedio de Consultas. Tabasco Promedio de Consultas. B.C. SurPromedio de Consultas. Jalisco
Fuentes: Anuarios Estadísticos de la Secretaria de Salud, Oaxaca, Hidalgo, Colima, Tabasco, Baja California Sur, Jalisco. 1990‐2004.
Gráfico 22. Tendencias Del Gasto Per Capita En Salud
0
50
100
150
200
250
1990 1991 1992 1993 1994 1995 1996 1997 1998 1999 2000 2001 2002 2003Gasto Per Capita. Nacional Gasto Per Capita. OaxacaGasto Per Capita. Hidalgo Gasto Per Capita. ColimaGasto Per Capita. Tabasco Gasto Per Capita. Baja California SurGasto Per Capita. Jalisco
Fuentes: Anuarios Estadísticos de la Secretaria de Salud, Oaxaca, Hidalgo, Colima, Tabasco, Baja California Sur, Jalisco. 1990‐2002. Secretaria de salud y Servicios Coordinados de Salud Pública en los Estados. Informes Anuales del presupuesto y gasto ejercido. Informes Anuales del Patrimonio de la Beneficencia Pública. Presupuestos ejercidos por programas, capitulo e institución. Secretaria de Salud y Servicios Coordinados de Salud Pública en los estados. Informes Anuales del presupuesto y gasto ejercido. Informes Anuales del Patrimonio de la Beneficencia Pública. Presupuestos ejercidos por programas, capitulo e institución. Anuarios y Estadísticos de la SSA, a nivel Estatal y Municipal, 1999‐2000. Proyecto Financiamiento, Equidad, Gobernanza y Descentralización INS 1999‐2005, Arredondo A. Y Cols. México, Salud 2001‐2004. Información para rendición de cuentas. SSA. México 2004..
Decentralized Service Delivery for the Poor 133

Gráfico 23. TENDENCIAS DEL INDICE DE RESPONSABILIDAD FINANCIERA
Gobierno FEDERAL/ Gobierno ESTATAL
0
5
10
15
20
25
1994 1995 1996 1997 1998 1999 2000 2001 2002 2003Indice Responsabilidad Financiera.OaxacaIndice Responsabilidad Financiera.HidalgoIndice Responsabilidad Financiera.ColimaIndice Responsabilidad Financiera.TabascoIndice Responsabilidad Financiera. B.C. Sur
Fuentes: Anuarios Estadísticos de la Secretaria de Salud, Oaxaca, Hidalgo, Colima, Tabasco, Baja California Sur, Jalisco. 1990‐2002. Secretaria de salud y Servicios Coordinados de Salud Pública en los Estados. Informes Anuales del presupuesto y gasto ejercido. Informes Anuales del Patrimonio de la Beneficencia Pública. Presupuestos ejercidos por programas, capitulo e institución. Secretaria de Salud y Servicios Coordinados de Salud Pública en los estados. Informes Anuales del presupuesto y gasto ejercido. Informes Anuales del Patrimonio de la Beneficencia Pública. Presupuestos ejercidos por programas, capitulo e institución. Anuarios y Estadísticos de la SSA, a nivel Estatal y Municipal, 1999‐2000. Proyecto Financiamiento, Equidad, Gobernanza y Descentralización INS 1999‐2005, Arredondo A. Y Cols. México, Salud 2001‐2004. Información para rendición de cuentas. SSA. México 2004.
Gráfico 24. Gasto Público En Salud Per Capita Para Población Asegurada (2003).
1,741.29
2,470.24
1,743.61
1,389.531,623.02
1,140.97
1,928.48 2,009.30
$0
$500
$1,000
$1,500
$2,000
$2,500
$3,000
Nacional BajaCalifornia
Sur
Colima Hidalgo Jalisco Oaxaca Tabasco Yucatán
Fuentes: Secretaria de Salud y Servicios Coordinados de Salud Pública en los Estados. Informes Anuales del Presupuesto y gasto ejercido. Informes Anuales del Patrimonio de la Beneficencia Pública. Presupuestos
Decentralized Service Delivery for the Poor 134

ejercidos por Programas, capitulo e institución. Anuarios y estadísticos de la SSA a nivel Estatal y Municipal, 1999‐2000. Proyecto Financiamiento, Equidad, Gobernanza y Descentralización INSP 1999‐2005, Arredondo A. y Cols. México, Salud 2001‐2004. Información para la rendición de cuentas. SSA. México 2004.
Gráfico 25. Gasto Público En Salud Per Capita Para Población No Asegurada (2003)
(943.47)(1,129.53)
(2,516.77)
(1,793.74)
(1,093.02)
(1,345.71)(1,726.64)
0
$500
$1,000
$1,500
$2,000
$2,500
$3,000
Valor B.C. Sur Colima Hidalgo Jalisco Oaxaca Tabasco Fuentes: Secretaria de Salud y Servicios Coordinados de Salud Pública en los Estados. Informes Anuales del Presupuesto y gasto ejercido. Informes Anuales del Patrimonio de la Beneficencia Pública. Presupuestos ejercidos por Programas, capitulo e institución. Anuarios y estadísticos de la SSA a nivel Estatal y Municipal, 1999‐2000. Proyecto Financiamiento, Equidad, Gobernanza y Descentralización INSP 1999‐2005, Arredondo A. y Cols. México, Salud 2001‐2004. Información para la rendición de cuentas. SSA. México 2004.
Gráfico 26. Gasto Público En Per Capita Total (2003)
(1 ,441.52)
(2,484.24)
(1 ,772.50)
(1 ,202.43)
(1 ,501.56)
(1 ,000.55)
(1,806.57)
0
$500
$1,0000
$1,500
$2 ,000
$2 ,500
V alor N acionalB .C . Sur C olim a H idalgo Jalisco O axaca T abasco
(1 ,441.52)
(2,484.24)
(1 ,772.50)
(1 ,202.43)
(1 ,501.56)
(1 ,000.55)
(1,806.57)
0
$500
$1,0000
$1,500
$2 ,000
$2 ,500
V alor N acionalB .C . Sur C olim a H idalgo Jalisco O axaca T abasco Fuentes: Secretaria de Salud y Servicios Coordinados de Salud Pública en los Estados. Informes Anuales del Presupuesto y gasto ejercido. Informes Anuales del Patrimonio de la Beneficencia Pública. Presupuestos ejercidos por Programas, capitulo e institución. Anuarios y estadísticos de la SSA a nivel Estatal y Municipal, 1999‐2000. Proyecto Financiamiento, Equidad, Gobernanza y Descentralización INSP 1999‐2005, Arredondo A. y Cols. México, Salud 2001‐2004. Información para la rendición de cuentas. SSA. México 2004.
Decentralized Service Delivery for the Poor 135

Gráfico 27. Gasto Catastrófico Por Tipo De Población A Nivel Nacional (2003)
5.104.50
4.804.50 4.30
3.2
2.5 2.72.2
2.8
0
1
2
3
4
5
6
I II III IV V
%
No Asegurados Asegurados
Fuentes: Secretaria de Salud y Servicios Coordinados de Salud Publica en los Estados. Informes Anuales del Presupuesto y gasto ejercido. Informes Anuales del Patrimonio de la Beneficencia Pública. Presupuestos ejercidos por Programas, capitulo e institución. Anuarios y estadisticos de la SSA a nivel Estatal y Municipal, 1999‐2000. Proyecto Politicas de Financiamiento y Descentralización INSP 1999‐2005, Arredondo A. y Cols. México, Salud 2001‐2004. Información para la rendición de cuentas. SSA. México 2004.
Gráfico 28. Gasto Catastrofico Por Estado (2003)
%
0
1
2
3
4
5
6
B .C . S u r C o lim a H id a lg o Ja lis c o O a x a c a T a b a s c o
(4 .1 )%
(2 .3 )%
(4 .2 )%(4 .7 )%
(5 .3 )%(4 .8 )%
%
0
1
2
3
4
5
6
B .C . S u r C o lim a H id a lg o Ja lis c o O a x a c a T a b a s c o
(4 .1 )%
(2 .3 )%
(4 .2 )%(4 .7 )%
(5 .3 )%(4 .8 )%
0
1
2
3
4
5
6
B .C . S u r C o lim a H id a lg o Ja lis c o O a x a c a T a b a s c o
(4 .1 )%
(2 .3 )%
(4 .2 )%(4 .7 )%
(5 .3 )%(4 .8 )%
Fuentes: Secretaria de Salud y Servicios Coordinados de Salud Pública en los Estados. Informes Anuales del Presupuesto y gasto ejercido. Informes Anuales del Patrimonio de la Beneficencia Pública. Presupuestos ejercidos por Programas, capitulo e institución. Anuarios y estadísticos de la SSA a nivel Estatal y Municipal, 1999‐2000. Proyecto Financiamiento, Equidad, Gobernanza y Descentralización INSP 1999‐2005, Arredondo A. y Cols. México, Salud 2001‐2004. Información para la rendición de cuentas. SSA. México 2004.
Decentralized Service Delivery for the Poor 136

Gráfico 29. Índice De Desigualdad En Salud En Los 7 Estados Bajo Estudio (2003)
Jalisco
(Baja)
%
0
5
10
15
20
25
30
(10.8)%
(17.8)%
(23.6)%
(8.27)%
(27.6)%
(14.2)%
B.C. Sur
(Baja)
Colim a
(M edia)
Hidalgo
(Alta)
Oaxaca
(Alta)
Tabasco
(M edia)Baja de 1-11M edia de 12-21Alta de 22-31
Jalisco
(Baja)
%
0
5
10
15
20
25
30
(10.8)%
(17.8)%
(23.6)%
(8.27)%
(27.6)%
(14.2)%
B.C. Sur
(Baja)
Colim a
(M edia)
Hidalgo
(Alta)
Oaxaca
(Alta)
Tabasco
(M edia)Baja de 1-11M edia de 12-21Alta de 22-31
Fuentes: Secretaria de Salud y Servicios Coordinados de Salud Pública en los Estados. Informes Anuales del Presupuesto y gasto ejercido. Informes Anuales del Patrimonio de la Beneficencia Pública. Presupuestos ejercidos por Programas, capitulo e institución. Anuarios y estadísticos de la SSA a nivel Estatal y Municipal, 1999‐2000. Proyecto Financiamiento, Equidad, Gobernanza y Descentralización INSP 1999‐2005, Arredondo A. y Cols. México, Salud 2001‐2004. Información para la rendición de cuentas. SSA. México 2004.
Decentralized Service Delivery for the Poor 137
REFERENCIAS
Abel‐Smith B and Dua A. 1988. Community financing in developing countries: the potential for health sector. Health Policy and Planning, 3:95‐108.
Alliance for Health Policy and System Research. 2004. Strengthening health Systems: the role and promise of policy and systems research. pp: 51‐75.
Alonso J., et. al., El Nuevo Estado Mexicano, Universidad de Guadalajara Nueva Imagen CIESAS, México, 1992.
Alvarez R. 1990. Implementing decentralization of health services: a case study from Mexico. In Mills A. et al. Health System Decentralization. Concepts, issues and country experience. World Health Organization. Geneve. pp : 67‐71.
Arredondo A., 2003. Estudio de caso sobre la descentralización en salud en México. En : Federalismo, políticas de salud, descentralización y relaciones intergubernamentales desde una perspectiva comparada. Forum of Federations. Otawa, Canada. 2003:125‐143
Arredondo A. y Orozco E. Effects of health decentralization, financing and governance in Mexico. Rev Sau Pub de Brasil, 2006. Vol 40, No. 1: 152‐60.
Arredondo A. y Recaman A. el financiamiento de la Salud en México: algunas evidencias para las políticas del sector. Hitos en Ciencias Económico‐Administrativas. 2004. Vol 9 No. 23 : 9‐16.
Arredondo A. and Nájera P. Who pays more for health services in middle income countries: lessons from Mexico. Jou of Public Health, 2005. Vol 119 No 8: 39‐43.
Arredondo A. Health Financing in the context of health care decentralization: a comparative study in Latin American countries. Univesrsity of Montreal‐University of Tabasco. ISBN: 968‐5748‐55‐1. 2005.
Arredondo A, De Icaza E. and Orozco E. Evidences on weaknesses and strengths from health
financing: lessons from Latin American countries. International Jou of Health Planning, 2005. Vol 20(3):45‐52
Arredondo A., Orozco E. y Castañeda X. Gobernanza en sistemas de salud y participación social. Rev. Hitos en Ciencias Ec Adm. 2005, Vol 29(1): 5‐12.
Decentralized Service Delivery for the Poor 138

Arredondo A., Profils dʹassignation de ressources à la santé en fonction dʹindicateurs dʹefficience et des coûts de production: Une proposition pour les pays de lʹamérique latine. Rev. Ruptures, Univ. De Montreal. Vol. 6,No. 3, 2000.
Banco Nacional de México. México Social. 11a. edición. México, D.F.: División de Estudios Económicos y Sociales. BANAMEX, 1998
Berman P. 1996. National health Accounts in Developing Countries: Appropriate Methods and Recent Applications. Data for Decision Making. Harvard School of Public Health. pp : 31‐48.
Bobadilla J.L. 1998. Assessment issues. Closing the equity gap. Searching for essential health services in low and middle income countries. A review of recent studies on health priorities. Interamerican Development Bank. Washington D.C., No. Soc‐106. June . 25‐48.
Bobadilla J. and Lozano R. 1990. Future Changes in Demographic, Epidemiologic and Social Factors , in The Epidemiological Transition and Health Priorities , Health Sector Priorities Review; The World Bank. Washington, D.C. : 14‐16.
Bloom G. 2005. Health and Social Protection: Meeting the Needs of the Very Poor. In : Social protection for Chronic Poverty Conference.Institute for Development Policy and Management. Risk, Needs, Rights in Health Research University of manchester, Social Protection for Chronic Poverty Conference, February 2005.
Bossert T et al., 2003. Decentralization and equity resource allocation. Evidence from Colombia and Chile. Bull of WHO Vol. 81 No. 2 : 95‐100.
Brailovsky V., El comportamiento económico de la medicina privada en México: análisis comparativo con el sector público, Capítulo 8 del Observatorio de la Salud, Funsalud, México, 1997.
Braveman P and Gruskin S. 2003. Poverty, equity, human rights and health. Bulletin of the World Health Organization, 81 (7):539‐545.
Bronfman M. , et al. La Salud de los pueblos indígenas, Secretaría de Salud, México, 1994.
Cassels A. 1995. Health sector reform: key issues in less developed countries. Journal of International Development, 7(3)329‐347.
Cogan John F, Hubbard Glenn, Kessler Daniel P, Making Markets Work. 2005. Health Affairs Vol 24 (6):1447‐1457.
Collins, C. And Green A.. 1994. Decentralization and primary health care: some negative implications for developing countries. Interntional Journal of Health Services, 24:459‐475.
Decentralized Service Delivery for the Poor 139

Consejo Nacional de Población. La situación demográfica de México 2004. México,
Consejo Nacional de Población. Situación actual de las y los jóvenes en México. Diagnóstico sociodemográfico. México, D.F.: CONAPO, 2004.
Consejo Nacional de Vacunación. Programa de Atención a la Salud del Niño. Manual de procedimientos técnicos. México, D.F.: CONAVA, SSA, 1998.
Contandriopoulos André Pierre et al. Entendiendo las Transformaciones de los Sistemas de Salud:Una Perspectiva Canadiense. Universidad de Montreal . Junio del 2000. ISBN: 2‐922521‐03‐6.
Constitución Política de los Estados Unidos Mexicanos. 133 edición. México, D.F.: Ed Porrúa, 2000.
De la Fuente J.R., Juan M., La Descentralización de los Servicios de Salud: Una responsabilidad compartida, Secretaría de Salud, Consejo Nacional de Salud, México, 1996.
Diario Oficial de la Federación‐Instituto Mexicano del Seguro Social, 2005. Acuerdo por el que la Coordinación General del programa IMSS‐ Oportunidades. Reglas de operación del programa IMSS‐Oportunidades, Segunda Edición, Marzo 2005: 24‐27.
Diario Oficial de la Federación, 2004. Reglamento Interno del Consejo Nacional de Protección Social en Salud, Julio del 2004: 1‐5.
Dolowitz D, Marsh D. (1996) Who learns what from whom: a review of the policy transfer literature. Political Studies 1996; 44:343‐357
European Observatory of Health Systems. 2005. Health Care Systems in Transition, Organizational structure and management, Spain. Pp: 17‐73
Exelle Ben D, Herdt Tom De, 2005. The Fairness Concerns in Social Protection and Poverty Reduction, Institute of Development Policy and Management‐ University of Antwerp, Belgium :2‐5.
Franco A, Gil D, Álvarez C. 2005. Tamaño del Estado(gasto público) y salud en el mundo, 1990‐2000. Rev ac Sanit , Vol 19(3): 186‐92.
Frenk J. 1994. Dimension of Health system reform. Health Policy 27 p: 19‐34 .
Frenk J., Zurita B., Franco F, Arredondo A., Quisser M., Ramírez R. Demanda y oferta de servicios médicos: Obstáculos a la mejoría del sistema de salud en México. FUNSALUD, Proyecto Economía y Salud. Junio de 1994.
Decentralized Service Delivery for the Poor 140

Frenk J., et al. ʺEconomía y Salud: propuestas para el avance del sistema de salud en Méxicoʺ Informe Final. FUNSALUD. Noviembre de 1994. ISBN 968‐6186‐29‐8. México.
Frenk J, 2005. Asegura que bajó la tasa de Mortalidad Infantil, La Crónica, 16 de Diciembre del 2005:
Frenk J., 2005. Creció mas del doble el presupuesto a salud en este gobierno, La Crónica , 1 de Diciembre del 2005: 14.
Frenk J, 2005. Comunicado de Prensa No. 717, Fortalece”Arranque Parejo por la Vida” acciones en todo el país, Capacitación y campañas intensivas, acciones fundamentales para la atención de mujeres embarazadas y niños menores de dos años, 19 de Diciembre 2005.
Frenk J, 2005. Conferencia de Prensa del Secretario de Salud, Dr. Julio Frenk Mora , en el Salón Venustiano Carranza de la residencia oficial de los pinos, 15/Diciembre del 2005.
Frenk J, 2005. Define presidencia cinco prioridades para fin de sexenio, El Universal, Ciudad de México, 1 de Diciembre 2005.
Gonzalez‐Block MA. 1992. La decentralization de los servicios de salud en Mexico: Alcances y limitaciones. Sal Pub de Mex. Suplemento Vol 34: 117‐125.
González Block M.A.. Descentralización de los Sistemas de los Servicios de Salud, Secretaría de Salud, México, 1994.
González Block M.A. y Brown A., Hacia la asignación equitativa de los recursos federales para la salud Capítulo 6 del Observatorio de la Salud, Funsalud, México, 1997.
Gonzalez‐Block MA, Mills A, 2003. Assessing capacity for health policy and systems research in low and middle income countries. Health Research Policy and Systems No. 1: 2‐20.
González J.A., et. al., Descentralización de los Servicios de Salud a las Entidades Federativas, Memoria 1995‐2000, Secretaría de Salud, México.
Harvard School of Public Health. 2005. Health Disparities and the Body Politic, A Series of International Symposia. Pp: 24‐40.
Horvath Tamás. 2003. Decentralization: experiments and reforms. Local government and public service reform initiative. The Open Society Institute. OSI/LGI: 3‐11.
Decentralized Service Delivery for the Poor 141

Hurley J. 1995. Geographically‐decentralized planning and management in health care: some informational issues and their implications for efficiency. Soc Sci and Medicine, 41(1)3‐11.
IMSS, 2003. Manual de la Organización de la Coordinación General del Programa IMSS‐ Oportunidades, Noviembre 2003: 4‐17.
IMSS, 2003. Anuario estadístico de servicios médicos. México, D.F.: IMSS, 1980‐2003.
Instituto Nacional de Estadística. Geografía e Informática. Anuarios Estadísticos por estado: Oaxaca, Colima, Hidalgo, Tabasco, Baja California Sur y Jalisco. 1990‐2005.
Instituto Nacional de Estadística. Geografía e Informática. Encuesta Nacional de la Dinámica Demográfica. Aguascalientes, México: INEGI, 1997.
Instituto Nacional de Salud Pública. Encuesta Nacional de Nutrición 1999. Niños menores de cinco años. Cuernavaca, Morelos: INSP, 2000.
Instituto de Seguridad y Servicios Sociales para los Trabajadores del Estado. Anuario Estadístico. México, D.F.: ISSSTE, 1980‐1998.
Jamison D. and Mosley H. 1991. Disease control priorities in developing countries: health policy responses to epidemiological change. Am. Journal of Public Health. 81:15‐22.
Khaleghian R. 2003. Decentralization on Public Services. Working Paper Number 2989, March. World Bank (2003): 3‐9.
Ke Xu et al. 2003. Household catastrophic health expenditure: a multicountry análisis. The Lancet, 362: 111‐117.
Ley General de Salud. 16 edición actualizada. México, D.F.: Editorial Porrúa, 2000.
Martínez A., La dimensión política en los procesos de reforma del sector salud, Capítulo 16 del Observatorio de la Salud, Funsalud, México, 1997,
Méndez J.L.,(copilador) Lecturas básicas de administración y políticas públicas, El Colegio de México, México, 2000.
Merlis M. 2003. Family out‐of‐pocket spending for health services: a continuing source of financial insecurity. Working Paper. The Commonwealth Fund: 23‐46.
Morris, S. Corruption and the Mexican political system: continuity and change. Third World Quarterly. June 1999. 20(3): 623‐643.
Moser Kath A, Leon DA, Gwatkin DR, 2005. How does progress towards the child mortality millennium development goal affect inequalities between the poorest
Decentralized Service Delivery for the Poor 142

and least poor? Analysis of Demographic and health Survey Data. BMJ vol 331: 1180‐1182.
Musgrove P. 1990. The economic crisis and its impact on health and health care in Latin America and the Caribbean, International Journal of Health Services. Vol. 17:3 : 411‐441.
Musgrove P, Zeramdini R, and Carrin G. 2002. Basic patterns in national expenditure. Bulletin of the World Health Organization, 80 (2): 134‐146.
National Population Council (Consejo Nacional de Población). La Marginación en los Municipios de México, 1990‐2000. México: Secretaría de Gobernación; 2002 p. 35‐63.
Nathan Richard P, 2005. Federalism and Health Policy. Health Affairs,Volume 24, Number 6: 1458‐1465.
OCDE, Estudios de la OCDE sobre los Sistemas de Salud, México, 2005: 33‐66.
O´Donnell G, Schmitter P. Transiciones desde un gobierno autoritario. Buenos Aires. Paidos. 1991.
Organización Mundial de la Salud. Informes sobre la salud en el mundo 2000. Mejorar el desempeño de los sistemas de salud. Ginebra: OMS, 2000.
Organización Panamericana de la Salud. Situación de salud en las Américas: Indicadores Básicos de Salud 1999, Ginebra: OPS‐OMS, 1999.
Padua J., Vanneph A. (copiladores) Poder Local, Poder Regional, El Colegio de México/CEMCA, México, 1986.
Poder Ejecutivo Federal. Plan Nacional de Desarrollo 2001‐2006. México, D.F.: Presidencia de la República, 2001.
Poullier Jean‐Pierre, 2000. Estimates of National Health Accounts (NHA). Methodological Considerations. GPE Discussion Paper Series : NO. 27. EIP/GPE/FAR. World Health Organization. pp :17‐29.
Programa de Reforma del Sector Salud 1995‐2000, 2001‐2006. Poder Ejecutivo Federal, México.
Puga C., et. al., Evolución del Estado Mexicano, Consolidación 1940‐1983 Tomo III, Ediciones El Caballito, México,1986.
Ramesh G., Chellaraj G, and Murray Ch. . 1997. Health expenditures in Latin America and the Caribbean. Soc Sci and Medicine, 44(2)157‐169.
Decentralized Service Delivery for the Poor 143

Ranson K. 2002. Reduction of catastrophic health care expenditures by a community‐based health insurance scheme in Gujarat, India: current experiences and challenges. Bull World Health Organ, 80: 613‐21.
Rodríguez V. La descentralización en México, Fondo de la Cultura Económica, México, 1999.
Ruelas E., y Alonso A., Tendencias a futuro de la organización de la atención médica en México, Capítulo 17 del Observatorio de la Salud, Funsalud, México, 1997.
Sassi F. et al. 2001. Equity across social groups with different levels of health. In Equity and the economic evaluation of health care. National Coordinating Centre for Health Technology Assessment. London. Chap. 2 (2001), p. 22‐34.
Secretaría de Salud. Anuario Estadístico 1993‐1999. México, D.F.: Dirección General de Estadística e Informática, SSA, 1994‐1999.
Secretaría de Salud. Compendio histórico. Estadísticas Vitales 1893‐1993 EUM. México, D.F.: Dirección General de Estadística, Informática y Evaluación, SSA, 1993.
Secretaría de Salud. Descentralización de los servicios de salud en las entidades federativas. Memoria 1995‐2000. México, D.F.: SSA, 2001.
Secretaría de Salud. Normas Oficiales Mexicanas en Materia de Salud. México, D.F.: SSA, 1990‐2000.
Secretaría de Salud‐Instituto Mexicano del Seguro Social‐Instituto de Servicios y Seguridad Social para los Trabajadores del Estado. Programa Nacional de Salud 2001‐2006. México D.F., Julio del 2001.
Serrano M. y Bulmer‐Thomas V., La reconstrucción del Estado México después de Salinas, Fondo de Cultura Económica, México, 1996.
SSA, 2004. Secretaría de Salud‐Instituto Mexicano del Seguro Social‐Instituto de Servicios y Seguridad Social para los Trabajadores del Estado. Programa Nacional de Salud 2001‐2006. México D.F.: 26‐29.
SSA, 2000. Recursos para la salud en unidades de la Secretaría de Salud. Sistema Nacional de Salud. Salud Pública de México, Vol 42, No. 3 :252‐259.
SSA, 2000. Información básica sobre recursos y servicios del Sistema Nacional de Salud. Salud Pública de México, Vol 42, No. 1 : 68‐76.
SSA. Debate: Seguro Popular de Salud Siete Perspectivas, Salud Pública de México, Volumen 46, Numero 6, Diciembre 2004:585‐588.
Decentralized Service Delivery for the Poor 144

SSA. Seguro Popular, Edición especial, gaceta Interna de la SSA,Noviembre 2005: 5‐7.
Sistema Nacional de Salud. Boletín de información estadística. México, D.F.: Dirección General de Estadística, Informática y Evaluación, SSA, 1991‐2005.
WHO Equity team, 2005., Priorities for research to take forward the health equity policy agenda, Bulletin of the World Health Organization , vol 83 (12): 948‐953.
WHO. 2000. World Health Report 2000, Health Systems: Improving Performance. Chapter 4: What resources are needed. World Health Organization . Geneva, 2000: 73‐77.
Decentralized Service Delivery for the Poor 145

Decentralized Service Delivery for the Poor 146

Decentralized Service Delivery for the Poor 147
SEGURO POPULAR INCIDENCE ANALYSIS
John Scott
I. INTRODUCTION1
This paper presents a preliminary evaluation of the distribution of the coverage of Seguro Popular and its effect on use of public health services, private health spending, and incidence of catastrophic health expenditures among poorer households. The analysis is relevant in the present context (decentralization and service delivery to the poor) for two principal reasons. First, the creation and rapid expansion of Seguro Popular is of interest in its own right, arguably representing the most ambitious effort to extend coverage of basic health to the uninsured since the creation of the Secretaría de Salud (SSA) in 1943. Secondly, the decentralized design of the Seguro Popular reform implies both opportunities and challenges which may be of more general cross‐sectional interest.
The paper is structured as follows. Section II describes the objectives, identification criteria and selection procedures of the program as specified in its affiliation and operational rules (DOF, 15.4.05). Section III reviews the distributive indicators of the program obtained from administrative records and presents the first benefit incidence analysis available for this program, based on nationally representative household survey data (the “Módulo de Programas Sociales” commissioned by SEDESOL as part of ENIGH 2004).2 The distribution of benefits from the program is estimated separately and jointly with complementary and substitute programs (Oportunidades and formal sector social security). Section IV presents preliminary evidence comparing the uninsured with and without Seguro Popular, and the insured, in terms of use of public health services, private health spending, and the incidence of catastrophic health expenditures. Section V presents conclusions and policy recommendations.
II. IDENTIFICATION AND AFFILIATION OF BENEFICIARIES
Seguro Popular specifies distributive objectives at both the state and household level. At the state level a stated objective of Seguro Popular is to reduce inequalities in
1 This paper benefited from very useful comments from Health Secretary Julio Frenk in a presentation to the Comisión Nacional de Protección Social en Salud on February 13, 2006, as well as detailed written comments and corrections from the Unidad de Análisis Económico, SSA. All remaining limitations and errors are of course the sole responsibility of the author. 2 Access to this Module, provided by Mónica Orozco from SEDESOL, is gratefully acknowledged.

Decentralized Service Delivery for the Poor 148
public per capita health spending across states (as well as across public health insurance schemes). At the household level the aim is to achieve full coverage of the uninsured, minimizing vulnerability to catastrophic and impoverishing health expenditures, thus reducing inequalities of basic health opportunities. One immediate challenge for the present analysis is that the program is in an (early) transition phase (2004‐2010) towards these objectives, to be reached only by the end of the current decade. Before full coverage is achieved, the identification of beneficiary families through socioeconomic characteristics is necessary for two purposes: (i) to target the most vulnerable and needy first,3 and (ii) to assign beneficiaries to the relevant contributory bracket.
According to the rules of the program, state governments play an important role in this process. First, the number of beneficiaries to be affiliated, and thus the allocation of federal Seguro Popular funds to the states and the corresponding state contributions, is jointly defined by the federal and state governments through an Acuerdo de Coordinación. Secondly, state health ministries set up Regímenes Estatales de Protección Social en Salud (REPSS) which are responsible for the promotion of the program and affiliation of beneficiaries. According to the rules of Seguro Popular, affiliation should be implemented in modules where a socioeconomic questionnaire4 is applied to identify and classify applying beneficiaries into income deciles and thus contributory categories, through a statistical model of discriminant analysis provided by the Comisión Nacional de Protección Social en Salud (CNPSS), the central coordinating agency.5 According to SSA, this instrument and the statistical procedure is similar to the one used by Oportunidades to select beneficiaries.
In contrast to the latter program, however, the operational rules of Seguro Popular allow exceptions to this procedure, opening up the door for some discretionality at the federal or state level. The rules allow for the automatic affiliation of beneficiaries of other federal social programs. In the case of Oportunidades this is bound to improve the targeting of Seguro Popular, as will be seen below, but in the absence of a unified identification system, the targeting criteria of other programs, like LICONSA, may be much less effective.6 For example, the government of the Distrito Federal has used the Liconsa network to direct its beneficiaries for affiliation to Seguro Popular modules in health clinics.
3 “La promoción para la afiliación tendrá como prioridad, en los primeros años, a la población de las áreas de mayor marginación, zonas rurales e indígenas.” (CNPSS 2005). 4 Cédula de Características Socioeconómicas del Hogar (CECASOEH). 5 “Para llevar a cabo la promoción y afiliación de las familias susceptibles de incorporarse al Sistema, los REPSS deberán crear Módulos de Afiliación y Orientación (MAO), así como brigadas que se encarguen de estas tareas. Los MAO y las brigadas estarán bajo la responsabilidad de las entidades federativas y su número dependerá de la meta de afiliación establecida en los Acuerdos de Coordinación.” (CNPSS 2005). 6 See Scott (2005) for an incidence analysis of targeted social programs in Mexico based on the ENIGH 2002‐Módulo Social, revealing wide differences in targeting performance, from Oportunidades, in one extreme, to Liconsa, in the other, which at least in 2002 lacked any degree of progressivity.

Decentralized Service Delivery for the Poor 149
More surprisingly, the rules allow for collective affiliations of specific groups, without individual evaluations. These may be negotiated by any government organization,7 but also, in principle, by unions, production organizations or any other NGO.8
III. TARGETING OF SEGURO POPULAR
To analyze the targeting of Seguro Popular at the household level we will consider and contrast two different sources of information: a) the monitoring information generated by the program, based on its administrative identification procedures and used to allocate beneficiaries by income deciles to determine their contributory status,9 and b) the Encuesta Nacional de Ingreso y Gasto de los Hogares (ENIGH) for 2004, a nationally (and rural/urban) representative income and expenditure survey with a sample of 25,000 households. The published ENIGH 2004 questionnaire only ask about Seguro Popular in its expenditure module, and thus captures contributing households exclusively, which represent only 7% of all beneficiaries according to administrative records, and 4.7% in the ENIGH sample. Fortunately, a module on targeted social programs (“Módulo de Programas Sociales”, MPS) was commissioned by SEDESOL as part of ENIGH 2004, which includes all beneficiaries of Seguro Popular, contributory or not.10 This Module was applied to all households in the ENIGH sample.
The sample of Seguro Popular beneficiary households captured in the MPS includes 920, representing 890,382 households nationally, while administrative records report 1.5 million families affiliates by the end of 2004. The difference may be explained by various factors. First, the ENIGH goes to the field in the third trimester, but the Seguro Popular increased its affiliation from 800 to 1.5 million in the second semester of 2004. Second, the concept of household used in ENIGH does not correspond exactly to the concept of beneficiary family (or “family nucleus”) used by the program,11 which allows the possibility of more than one beneficiary “family” per household. Finally, there may of course be large sampling errors given the relatively small coverage of the program at this stage.
7 “…cualquier institución gubernamental podrá gestionar la afiliación colectiva al Sistema de familias susceptibles de incorporación” (Lineamientos, 19) 8 The administrative reports of the program do not identify the number of beneficiaries affiliated through either of these procedures, but apparently no affiliation of the latter type has as yet been implemented (comment by Hector Peña, Unidad de Análisis Económico, SSA, 2/9/2006). 9 The latest administrative report available when the present study was completed was dated June 30, 2005. 10 The specific question asked is: “¿Algún miembro de este hogar o su hogar está inscrito en el Seguro Popular de salud?”. Though the module was also included in the ENIGH 2002, it did not include a question about Seguro Popular, which then had a reported coverage of only 300’000 households by the end of that year. 11 Art. 77 bis 4, Ley General de Salud.

Decentralized Service Delivery for the Poor 150
The distributions by deciles (or coarser partitions, when needed) based on this data presented in the tables and figures in this paper use total current income per capita net of public monetary transfers as the welfare (ordering) concept, and households as the relevant unit to be ordered. Netting monetary transfers is required to obtain a common welfare concept for public transfers which is unaffected by the transfers themselves. This is the concept adopted in the cross‐sectoral benefit incidence analysis applied in the Mexico Public Expenditure Review (World Bank 2004). It is especially relevant in the present context because we will compare this distribution with Oportunidades, which represents a significant monetary transfer for the poor. Households are used as the relevant unit in order to make these orderings comparable with the deciles generated by the program, though it should be noted that poorer households are on average larger than richer (ordered by per capita income), so household deciles overestimate the share allocated to the poorest population deciles (for this reason, World Bank (2004) reports benefit incidence by population deciles).
According to the administrative records of Seguro Popular, of the 2 million beneficiary families affiliated by June 2005, 93% were classified in the first quintile of the income distribution. Around half of the states report almost 100% targeting at this income group, and only five report targeting close to or below 80% (Figure 1). In all but three states the majority of beneficiaries are even classified in the first decile, and in five of them more than 90% are so classified. There is a clear correlation between the percentage of affiliates classified in this income group and the percentage of affiliates who are also Oportunidades beneficiaries, and the two states classifying close to 100% of affiliates in the first decile (Puebla and Querétaro) report almost identical percentages of Oportunidades beneficiaries, suggesting that they may be classifying the latter automatically into this decile. On the other hand, there are cases like Oaxaca, which classifies almost 70% of affiliates in the first decile, but reports less than 20% of affiliates in Oportunidades.
Figure 1. Seguro Popular beneficiaries in first two income deciles and Oportunidades (% of total beneficiaries in state)
0%
10%
20%
30%
40%
50%
60%
70%
80%
90%
100%
21 P
UE
22 Q
RO
31 Y
UC
13 H
GO
19 N
L
07 C
HIS
17 M
OR
16 M
ICH
30 V
ER
15 M
EX
24 S
LP
08 C
HIH
29 T
LAX
32 Z
AC
23 Q
RO
O
20 O
AX
04 C
AM
P
25 S
IN
26 S
ON
12 G
RO
11 G
TO
14 J
AL
28 T
AM
PS
02 B
CN
18 N
AY
03 B
CS
10 D
GO
06 C
OL
27 T
AB
01 A
GS
05 C
OA
H
First decile Second decile Oportunidades beneficiaries Source: CNPSS (2005).

Decentralized Service Delivery for the Poor 151
It should be obvious that these levels of targeting efficiency are highly improbable even before they are tested against independent survey data. It would imply that all states gave absolute priority to selecting the extreme poor and turn back practically all applicants above the second decile, that they achieved this targeting objective with an unprecedented degree of success, and that almost full coverage of Seguro Popular among the extreme poor has already been achieved nationally, and even “overshot” in some states. This result is also inconsistent with the more observable (than income) socioeconomic characteristics of beneficiaries reported in the administrative data (Table 1): 60% of beneficiaries live in urban areas, only 25% in high or very high marginality areas, 6% in indigenous communities, and 40% are also Oportunidades beneficiaries.
Table 1. Selected characteristics of Seguro Popular Beneficiaries (30 June 2005) Total 1,973,754 Rural 840,254 40.6% With Oportunidades 812,893 39.2% In High or Very High Marginality Localities
522,652 25.2%
In Indigenous Communities (40% or more of the population)
119,764 5.8%
Source: CNPSS (2005).
Table 2 compares the distribution of beneficiary families reported by the program, with the distribution of beneficiary households observed in ENIGH, considering different income concepts and units. The distribution is not very sensitive to the income concept, but it is to the choice of unit. The distribution obtained from ENIGH is still progressive, but the share of the poorest quintile is less than half of what the program reports: 45% in terms of household deciles (37% in population deciles). The difference may reflect in part methodological and statistical differences between the discriminant analysis used to impute income in Seguro Popular and the income data reported in ENIGH 2004, as is also observed in the case of Oportunidades.12 However, a difference of this magnitude suggests a substantial targeting error associated with the (decentralized) operation of the program’s identification procedures. This will be taken up in the concluding section.
12 The discriminant analysis used in 2004 were based on the ENIGH 2002. The rules of the program require this analysis to be updated using the current ENIGH (Lineamientos, Cap. VII).

Decentralized Service Delivery for the Poor 152
Table 2. Distribution of Seguro Popular beneficiaries by household (or family) deciles ordered by income per capita: Administrative records vs. ENIGH 2004
Administrative Records*
ENIGH (Módulo Social) 2004
2004 2005 (June)
Households ordered by income per capita
Households ordered by income per capita net
of transfers
Population ordered by income per capita net
of transfers 1 67.6% 63.0% 26.1% 26.2% 19.6% 2 27.4% 29.9% 19.2% 19.6% 17.6% 3 4.7% 5.5% 17.5% 14.8% 15.4% 4 0.1% 1.0% 10.3% 11.2% 13.0% 5 0.1% 0.3% 7.8% 8.1% 8.1% 6 0.0% 0.2% 6.9% 7.0% 8.3% 7 0.0% 0.1% 5.0% 5.4% 6.2% 8 0.0% 0.1% 3.1% 3.3% 4.9% 9 0.0% 0.0% 3.6% 3.8% 5.6% 10 0.0% 0.0% 0.4% 0.6% 1.2%
Total 100.0% 100.0% 100.0% 100.0% 100.0% Note: The decile distribution of beneficiaries reported from the administrative records of the program is described as “families per income decile affiliated between the first semester of 2004 and the first semester of 2005”. Source: Author’s calculations using the Módulo Social of ENIGH 2004; administrative records reported in CNPSS (2005)
To place the observed distribution of Seguro Popular in context, Figure 2 and Figure 3 compare it with de distribution of the uninsured,13 of Oportunidades, and of the (use of the) principal health services for the uninsured (SSA, IMSS‐Oportunidades, Institutos Nacionales de Salud), and for the insured (IMSS, ISSSTE, PEMEX).14 On the one hand, Seguro Popular affiliation in 2004 was more progressive (pro‐poor) than both the overall use of (untargeted) SSA services and the distribution of the uninsured—the long‐term target population of the program. On the other, however, the observed degree of progressiveness of Seguro Popular falls short of that achieved by both Oportunidades and IMSS‐Oportunidades.
13 In this paper a household is classified as insured if at least one of its members is covered by any of the public social security schemes or private health insurance, and uninsured otherwise. 14 All of these are obtained from ENIGH on a common methodological basis, except utilization of health services in IMSS‐Oportunidades clinics and Institutos Nacionales, which are obtained from the Encuesta Nacional de Salud 2000 (ENSA).

Decentralized Service Delivery for the Poor 153
Figure 2. Distribution of Seguro Popular and Oportunidades beneficiary households, of (use of) SSA health services, and of the uninsured population
(household deciles ordered by income per capita net of transfers)
0%
5%
10%
15%
20%
25%
30%
35%
40%
45%
1 2 3 4 5 6 7 8 9 10
Seguro PopularUninsuredOportunidadesSP + OPUse of health services for the uninsured (SSA)
Source: Author’s calculations using the Módulo Social of ENIGH 2004.
Figure 3. Concentration Coefficients for Seguro Popular and other health programs and uninsured population (population ordered by income per capita net of
transfers)
Oportunidades
IMSS-Oportunidades
Seguro Popular
SSA total
Uninsured
IMSS
Pemex
SSA - Institutos Nacionales de Salud
ISSSTE
-0.6 -0.4 -0.2 0.0 0.2 0.4 0.6
Progressive (pro-poor) Regressive (pro-rich) Note: In the case of health service providers, reported distributions refer to use of services. Source: Oportunidades, Seguro Popular, SSA, and Uninsured: author’s calculations using ENIGH 2004 (including Módulo de Programas Sociales). The rest: Scott (2005), using ENIGH 2002 (including Módulo de Programas Sociales), except IMSS‐Oportunidades and Institutos Nacionales, which were obtained from ENSA (2000).
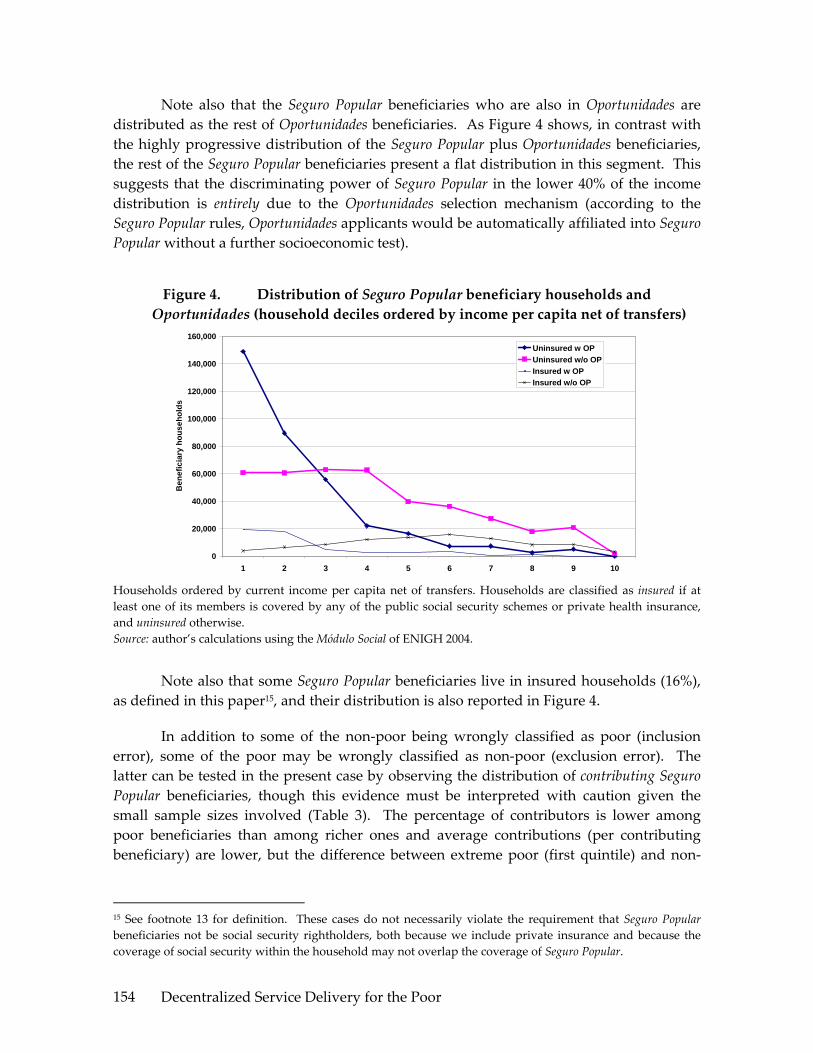
Decentralized Service Delivery for the Poor 154
Note also that the Seguro Popular beneficiaries who are also in Oportunidades are distributed as the rest of Oportunidades beneficiaries. As Figure 4 shows, in contrast with the highly progressive distribution of the Seguro Popular plus Oportunidades beneficiaries, the rest of the Seguro Popular beneficiaries present a flat distribution in this segment. This suggests that the discriminating power of Seguro Popular in the lower 40% of the income distribution is entirely due to the Oportunidades selection mechanism (according to the Seguro Popular rules, Oportunidades applicants would be automatically affiliated into Seguro Popular without a further socioeconomic test).
Figure 4. Distribution of Seguro Popular beneficiary households and Oportunidades (household deciles ordered by income per capita net of transfers)
0
20,000
40,000
60,000
80,000
100,000
120,000
140,000
160,000
1 2 3 4 5 6 7 8 9 10
Ben
efic
iary
hou
seho
lds
Uninsured w OPUninsured w/o OPInsured w OPInsured w/o OP
Households ordered by current income per capita net of transfers. Households are classified as insured if at least one of its members is covered by any of the public social security schemes or private health insurance, and uninsured otherwise. Source: author’s calculations using the Módulo Social of ENIGH 2004.
Note also that some Seguro Popular beneficiaries live in insured households (16%), as defined in this paper15, and their distribution is also reported in Figure 4.
In addition to some of the non‐poor being wrongly classified as poor (inclusion error), some of the poor may be wrongly classified as non‐poor (exclusion error). The latter can be tested in the present case by observing the distribution of contributing Seguro Popular beneficiaries, though this evidence must be interpreted with caution given the small sample sizes involved (Table 3). The percentage of contributors is lower among poor beneficiaries than among richer ones and average contributions (per contributing beneficiary) are lower, but the difference between extreme poor (first quintile) and non‐
15 See footnote 13 for definition. These cases do not necessarily violate the requirement that Seguro Popular beneficiaries not be social security rightholders, both because we include private insurance and because the coverage of social security within the household may not overlap the coverage of Seguro Popular.

Decentralized Service Delivery for the Poor 155
poor beneficiaries is relatively small, and the former should of course not be making any contributions according to the Seguro Popular rules.16
Table 3. Family contributions to Seguro Popular (“Cuota familiar”)
Percentage of beneficiaries contributing
Average observed contribution (of contributing beneficiaries)
Average contribution implied by Seguro Popular Rules (given observed
distribution of beneficiaries) 20% poorest 3.2% 228 0 40% poorest 3.4% 236 235 60% richest 8.0% 393 989
Households ordered by current income per capita net of transfers. Source: author’s calculations using the Módulo Social of ENIGH 2004.
Demographically (Table 4), Seguro Popular benefits children and youngsters disproportionately, but the old are only slightly overrepresented in the program with respect to their share in total population.
Table 4. Distribution by age groups: 2005
Population Seguro Popular
0‐10 21.8% 27.7% 11‐20 20.7% 24.1% 21‐30 18.2% 11.7% 31‐40 14.8% 13.5% 41‐50 10.8% 9.5% 51‐60 6.6% 5.9% 61+ 7.1% 7.5%
Sources: CONAPO 2000‐2050 population projections. CNPSS (2005).
Finally, while Seguro Popular has now been introduced in all states,17 at present, coverage and spending levels differ widely between states (Table 5, Figure 5 and Figure 6), and the observed differences are not consistent with the compensatory objective of converging towards equal spending per capita across states. While some states report coverage rates above 100% of their estimated uninsured (Tabasco, Colima,
16 In addition to the small sample size, the wide variation of reported contributions is inconsistent with the range of contributions specified by the rules of the program, suggesting that some households may have misreported these contributions (for example, confusing annual and trimester amounts). Also, since some households may contain more than one beneficiary family, they may be reporting multiple contributions. 17 Note that in the case of DF, which accepted the program only in 2005, and does not appear in 2005 administrative coverage and spending data, nevertheless the 2004 ENIGH reports 34,622 households claiming to be beneficiaries of Seguro Popular (39 households in the sample). A probable explanation for this is that Seguro Popular was confused with the program of Apoyos para Adultos Mayores of the DF government, offering health coverage and a pension to all persons of 70 or above.
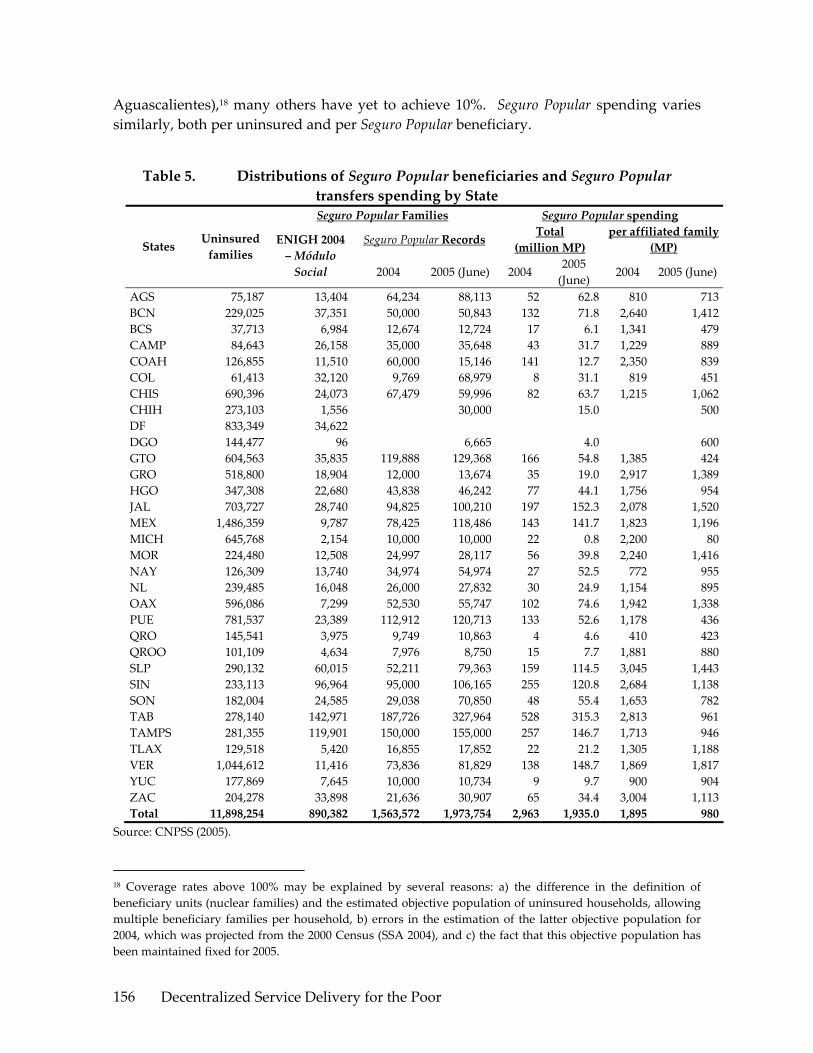
Decentralized Service Delivery for the Poor 156
Aguascalientes),18 many others have yet to achieve 10%. Seguro Popular spending varies similarly, both per uninsured and per Seguro Popular beneficiary.
Table 5. Distributions of Seguro Popular beneficiaries and Seguro Popular transfers spending by State Seguro Popular Families Seguro Popular spending
Seguro Popular Records Total (million MP)
per affiliated family (MP) States Uninsured
families ENIGH 2004 – Módulo Social 2004 2005 (June) 2004
2005 (June)
2004 2005 (June)
AGS 75,187 13,404 64,234 88,113 52 62.8 810 713BCN 229,025 37,351 50,000 50,843 132 71.8 2,640 1,412BCS 37,713 6,984 12,674 12,724 17 6.1 1,341 479CAMP 84,643 26,158 35,000 35,648 43 31.7 1,229 889COAH 126,855 11,510 60,000 15,146 141 12.7 2,350 839COL 61,413 32,120 9,769 68,979 8 31.1 819 451CHIS 690,396 24,073 67,479 59,996 82 63.7 1,215 1,062CHIH 273,103 1,556 30,000 15.0 500DF 833,349 34,622 DGO 144,477 96 6,665 4.0 600GTO 604,563 35,835 119,888 129,368 166 54.8 1,385 424GRO 518,800 18,904 12,000 13,674 35 19.0 2,917 1,389HGO 347,308 22,680 43,838 46,242 77 44.1 1,756 954JAL 703,727 28,740 94,825 100,210 197 152.3 2,078 1,520MEX 1,486,359 9,787 78,425 118,486 143 141.7 1,823 1,196MICH 645,768 2,154 10,000 10,000 22 0.8 2,200 80MOR 224,480 12,508 24,997 28,117 56 39.8 2,240 1,416NAY 126,309 13,740 34,974 54,974 27 52.5 772 955NL 239,485 16,048 26,000 27,832 30 24.9 1,154 895OAX 596,086 7,299 52,530 55,747 102 74.6 1,942 1,338PUE 781,537 23,389 112,912 120,713 133 52.6 1,178 436QRO 145,541 3,975 9,749 10,863 4 4.6 410 423QROO 101,109 4,634 7,976 8,750 15 7.7 1,881 880SLP 290,132 60,015 52,211 79,363 159 114.5 3,045 1,443SIN 233,113 96,964 95,000 106,165 255 120.8 2,684 1,138SON 182,004 24,585 29,038 70,850 48 55.4 1,653 782TAB 278,140 142,971 187,726 327,964 528 315.3 2,813 961TAMPS 281,355 119,901 150,000 155,000 257 146.7 1,713 946TLAX 129,518 5,420 16,855 17,852 22 21.2 1,305 1,188VER 1,044,612 11,416 73,836 81,829 138 148.7 1,869 1,817YUC 177,869 7,645 10,000 10,734 9 9.7 900 904ZAC 204,278 33,898 21,636 30,907 65 34.4 3,004 1,113Total 11,898,254 890,382 1,563,572 1,973,754 2,963 1,935.0 1,895 980
Source: CNPSS (2005).
18 Coverage rates above 100% may be explained by several reasons: a) the difference in the definition of beneficiary units (nuclear families) and the estimated objective population of uninsured households, allowing multiple beneficiary families per household, b) errors in the estimation of the latter objective population for 2004, which was projected from the 2000 Census (SSA 2004), and c) the fact that this objective population has been maintained fixed for 2005.

Decentralized Service Delivery for the Poor 157
Figure 5. Seguro Popular, federal and state public spending per uninsured
0
500
1000
1500
2000
2500
21 P
UE
11 G
TO
16 M
ICH
30 V
ER
14 J
AL
17 M
OR
12 G
RO
15 M
EX
07 C
HIS
02 B
CN
29 T
LAX
27 T
AB
24 S
LP
20 O
AX
19 N
L
32 Z
AC
22 Q
RO
08 C
HIH
25 S
IN
13 H
GO
18 N
AY
28 T
AM
PS
31 Y
UC
26 S
ON
23 Q
RO
O
05 C
OA
H
01 A
GS
10 D
GO
09 D
F
04 C
AM
P
06 C
OL
03 B
CS
Uninsured State Uninsured FederalSP 2005 (first semester)SP 2004
Note: Seguro Popular 2005 spending per beneficiary refers to the first semester only. Source: CNPSS (2005), SSA (2005).
Figure 6. Seguro Popular coverage and federal Seguro Popular spending per uninsured (2002‐June 2005)
0
500
1000
1500
2000
2500
3000
3500
4000
27 T
AB
06 C
OL
25 S
IN01
AG
S28
TA
MPS
05 C
OA
H24
SLP
02 B
CN
04 C
AM
P03
BC
S26
SO
N32
ZA
C18
NA
Y14
JA
L17
MO
R13
HG
O23
QR
OO
11 G
TO29
TLA
X20
OA
X07
CH
IS30
VER
21 P
UE
19 N
L15
MEX
12 G
RO
31 Y
UC
22 Q
RO
08 C
HIH
16 M
ICH
10 D
GO
09 D
F
spen
ding
per
uni
nsur
ed
0%
20%
40%
60%
80%
100%
120%
140%
Cov
erag
e
Coverage (% uninsured)
Spending/uninsured
Source: CNPSS (2005).
IV. USE OF PUBLIC HEALTH SERVICES, PRIVATE HEALTH EXPENDITURES, AND INCIDENCE OF CATASTROPHIC HEALTH EXPENDITURES: PRELIMINARY EVIDENCE
This section presents preliminary evidence on some of the variables which Seguro Popular is expected to affect: use of public health services, private health expenditures, and incidence of catastrophic health expenditures. Given that coverage of Seguro Popular was still relatively low in 2004, the limited sample of beneficiaries in the ENIGH survey, and

Decentralized Service Delivery for the Poor 158
that health use and spending (especially catastrophic spending) are infrequent events, these results will be presented in coarser household partitions by income (quintiles 1 and 2, and 3‐5 grouped), and should in any case be interpreted with care, especially when observed differences are small. It should also be clear that this is not an impact evaluation, since we lack appropriate control groups.19 It is therefore possible that the observed differences when comparing Seguro Popular beneficiaries and non‐beneficiaries reflect in part underlying differences in the characteristics of these groups rather than an effect of the program. One important underlying difference is Oportunidades affiliation, which is considered here for non‐ Seguro Popular beneficiaries only, because the sample of Seguro Popular beneficiaries reporting health service utilization/expenditures in ENIGH 2004 is too small to analyze differences between beneficiaries and non‐beneficiaries of Oportunidades within this group. Finally, in contrast to previous versions of ENIGH, which reported use of SSA services even when these did not involve monetary outlays (in its non‐monetary module), for some reason the ENIGH 2004 only reports use of SSA health services involving monetary outlays, thus probably underrepresenting use of health services by Seguro Popular beneficiaries. A more robust analysis will be possible in the near future with the Encuesta Nacional de Salud y Nutrición 2005 (ENSANUT), which was unfortunately not available at the time of this study.
Having noted these limitations, we should expect Seguro Popular beneficiaries in each income group to present higher levels of utilization of public health services, lower levels of out‐of pocket health expenditures, and a lower incidence of catastrophic health expenditures, compared to the rest of the uninsured. The evidence presented in the following figures is consistent with these expectations. Utilization rates of SSA services are higher for Seguro Popular affiliates, though the increase in user rates is significantly higher for higher income groups than for the first quintile (Figure 7). This could reflect an impact of the program, but also perhaps some “adverse selection” of less healthy population. Affiliating households with previously unattended health needs would of course be perfectly consistent with the objectives of the program, indicating effective targeting in this dimension, though the term “adverse” might still be relevant from the point of view of the program’s finances. Note also that part of the difference in utilization rates may be accounted for by Oportunidades, which partially conditions its monetary transfers on such participation.
19 An impact evaluation of Seguro Popular, by the Harvard Institute for Global Health, is currently under way, and will be completed by the end of 2006.
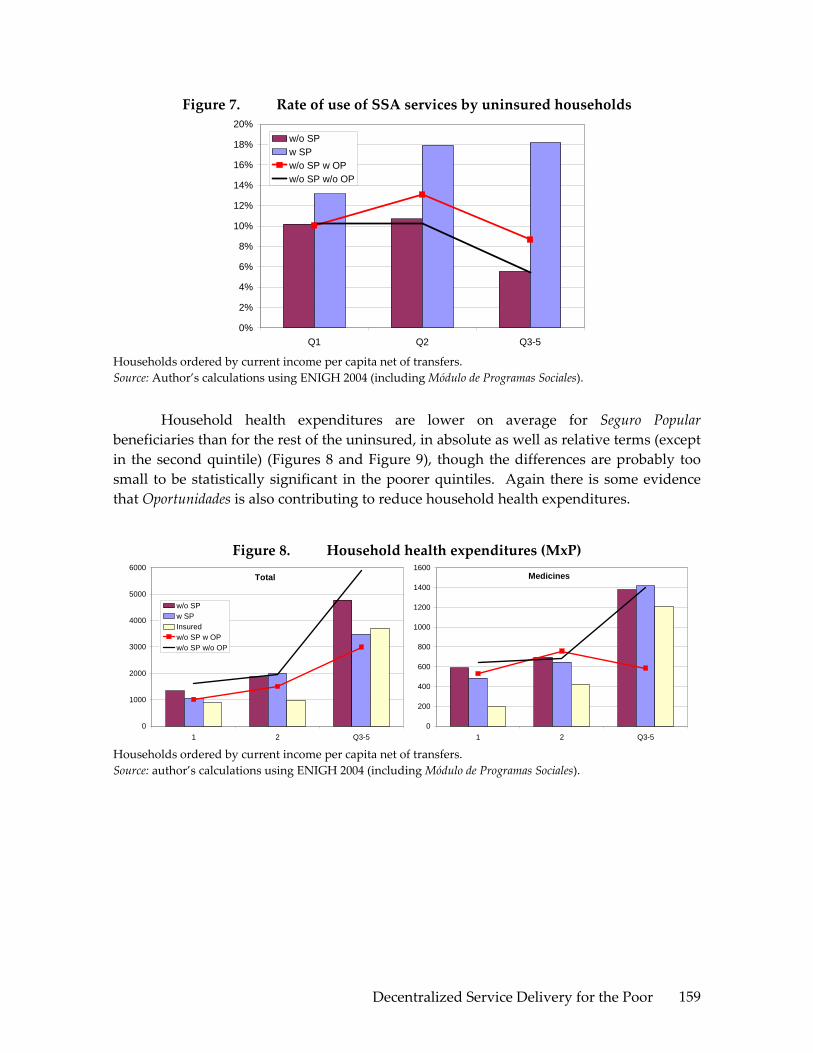
Decentralized Service Delivery for the Poor 159
Figure 7. Rate of use of SSA services by uninsured households
0%
2%
4%
6%
8%
10%
12%
14%
16%
18%
20%
Q1 Q2 Q3-5
w/o SPw SPw/o SP w OPw/o SP w/o OP
Households ordered by current income per capita net of transfers. Source: Author’s calculations using ENIGH 2004 (including Módulo de Programas Sociales).
Household health expenditures are lower on average for Seguro Popular beneficiaries than for the rest of the uninsured, in absolute as well as relative terms (except in the second quintile) (Figures 8 and Figure 9), though the differences are probably too small to be statistically significant in the poorer quintiles. Again there is some evidence that Oportunidades is also contributing to reduce household health expenditures.
Figure 8. Household health expenditures (MxP)
Total
0
1000
2000
3000
4000
5000
6000
1 2 Q3-5
w/o SPw SPInsuredw/o SP w OPw/o SP w/o OP
Medicines
0
200
400
600
800
1000
1200
1400
1600
1 2 Q3-5 Households ordered by current income per capita net of transfers. Source: author’s calculations using ENIGH 2004 (including Módulo de Programas Sociales).

Decentralized Service Delivery for the Poor 160
Figure 9. Household health expenditures as percentage of income
0.0%
0.5%
1.0%
1.5%
2.0%
2.5%
3.0%
3.5%
4.0%
4.5%
5.0%
1 2 Q3-5
w/o SP w SPInsured w/o SP w OPw/o SP w/o OP
Households ordered by current income per capita net of transfers. Source: author’s calculations using ENIGH 2004 (including Módulo de Programas Sociales).
Finally, Figure 10 shows that the incidence of catastrophic health expenditures is lower across deciles for Seguro Popular beneficiaries than for the rest of the uninsured.20
Figure 10. Incidence of catastrophic health expenditures (more than 30% of household income net of food poverty line)
0%
1%
2%
3%
4%
5%
6%
7%
8%
9%
1 2 Q3-5
w/o SPw SPInsured
Households ordered by current income per capita net of transfers. Source: author’s calculations using ENIGH 2004 (including Módulo de Programas Sociales).
20 Catastrophic health expenditures are defined here as expenditures representing more than 30% of disposable household income, defined in turn as current income net of the food poverty line, which represents the cost of a minimum food basket. This definition is not comparable to the more complex concept used by the SSA.

Decentralized Service Delivery for the Poor 161
V. CONCLUSIONS AND RECOMMENDATIONS
In principle, an optimal division of responsibilities between federal and local levels of government would allocate to the former the definition of overall (national) distributive criteria and rules of operation, as well as the powers to enforce them, and to the latter the application of these resources and rules to local circumstances. In practice, if the distributive criteria are unclear or ambiguous, and the federal regulative capacity is limited, there may be a conflict between decentralization and equitable distribution—both at the national and local levels—as weakly regulated local administrations undermine the implementation of national distributive criteria.
The preliminary evidence presented here suggests that the decentralization of Seguro Popular may be constrained by just this kind of trade‐off. At least in the present phase of the program, the selection of beneficiaries does not target the poorest states and households as effectively as its (transitional) objectives would require, nor, especially, as its administrative records suggest. The distribution of Seguro Popular affiliation is more progressive than both, the utilization of SSA health services and the distribution of uninsured households, but falls short of the targeting achieved by Oportunidades as well as (the utilization of) IMSS‐Oportunidades health services. The proportion of Seguro Popular beneficiaries in extreme poverty (first quintile) according to ENIGH (45%), is less then half of the proportion reported by the program (93%). In addition to this “inclusion error”, there is some evidence of an “exclusion error”, as a third of the contributive burden is absorbed by the poorest quintile.
The case of Seguro Popular may be usefully compared and contrasted in this context with the two largest (in budgetary terms) anti‐poverty programs/funds currently operating in Mexico. On the one hand, FAIS presents a similar trade‐off, where a reasonable degree of municipal allocative freedom is achieved but distributive equity (and allocative and technical efficiency) within municipalities cannot be effectively monitored, and thus enforced. On the other, the noted trade‐off is one reason why the principal federal anti‐poverty program implemented in Mexico in the last two administrations—originating as Progresa, today Oportunidades—was designed to be centrally administered, and has staunchly resisted political pressures to decentralize.
Noting this trade‐off is not meant as an argument against the decentralization of anti‐poverty or social protection programs, but for the definition of clear distributive criteria and institutionalization of unambiguous regulative responsibilities and capacities for an effective decentralization of social services to the poor. It should also be noted, on the other hand, that the decentralization of social and productive services and basic infrastructure in Mexico has led to increased equity in the devolution of funds to the states simply by making these distributions transparent, and more directly through the use of explicit compensatory criteria, as is exemplified by FAIS. As has been shown above, in its present phase Seguro Popular has yet to achieve the objective of inter‐state equity postulated in the health reform law which gave birth to it. But the postulation of this

Decentralized Service Delivery for the Poor 162
objective and the transparency of Seguro Popular transfers to the states (published on a biannual basis as part of the monitoring indicators of the program) are the first necessary steps to achieve such equity.
Accounting for these targeting errors will require further investigation. They could reflect design problems in the socioeconomic questionnaire and statistical method used to classify households into income groups, which should be carefully revised. Given that this instrument is adapted from the Oportunidades selection instrument, the difference between the two programs in targeting performance more probably reflects differences in the application of the instrument. As was noted in section 2, the affiliation rules are ambiguous and allow for much discretionality in the use of this instrument, in the case of group affiliations, beneficiaries of other social programs, or demands of government agencies. In particular, the following issues are unclear at present, due to ambiguities in the rules as well as lack of information, and should be the subject of future operational evaluations of Seguro Popular:
a) What is the proportion of beneficiaries affiliated without identification of socio‐economic status through the established proxy‐means test?
b) At what level do demands for untested affiliations originate (beneficiary clients, state government, or federal government), how are they processed, and who (state or federal health authorities) has final responsibility for accepting or rejecting them?
c) What are the restrictions limiting the participation of the extreme poor, despite the offer of fully subsidized basic health insurance to this group: i) information about the program and access to affiliation modules (diffusion and location of modules is a local responsibility), ii) poor households may be misidentified as non‐poor and thus charged a contribution which they are not willing to pay (Table 3 above), iii) there may be supply restrictions, as health units may not be available in small poor localities and/or Seguro Popular may not yet cover health units in such localities.
d) Given present Seguro Popular institutional and financing arrangements, incentives faced by state governments may be to maximize non‐contributive affiliation, since state governments currently bear a relatively small burden of Seguro Popular financing. By the rules of the program, the mandatory state contribution per beneficiary family (“Aportación Solidaria Estatal”) represents only 16.7% of the total public cost per beneficiary family (table 6). The incentive to expand (non‐contributive) coverage is especially strong for states which already allocate significant resources to health, like Tabasco, which can finance this contribution with existing resources. In contrast, this design may hamper the coverage‐expansion efforts of those states which spend little on health, and would thus require allocating fresh resources to finance the required contribution.
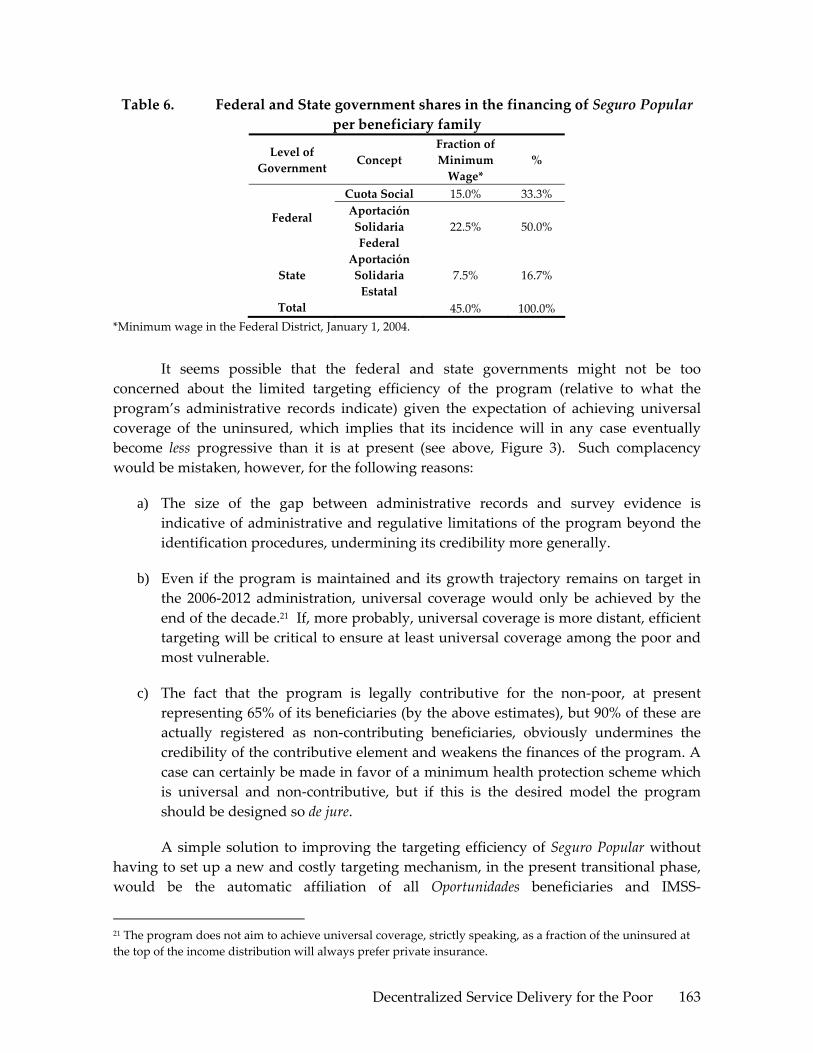
Decentralized Service Delivery for the Poor 163
Table 6. Federal and State government shares in the financing of Seguro Popular per beneficiary family
Level of Government Concept
Fraction of Minimum Wage*
%
Cuota Social 15.0% 33.3%
Federal Aportación Solidaria Federal
22.5% 50.0%
State Aportación Solidaria Estatal
7.5% 16.7%
Total 45.0% 100.0% *Minimum wage in the Federal District, January 1, 2004.
It seems possible that the federal and state governments might not be too concerned about the limited targeting efficiency of the program (relative to what the program’s administrative records indicate) given the expectation of achieving universal coverage of the uninsured, which implies that its incidence will in any case eventually become less progressive than it is at present (see above, Figure 3). Such complacency would be mistaken, however, for the following reasons:
a) The size of the gap between administrative records and survey evidence is indicative of administrative and regulative limitations of the program beyond the identification procedures, undermining its credibility more generally.
b) Even if the program is maintained and its growth trajectory remains on target in the 2006‐2012 administration, universal coverage would only be achieved by the end of the decade.21 If, more probably, universal coverage is more distant, efficient targeting will be critical to ensure at least universal coverage among the poor and most vulnerable.
c) The fact that the program is legally contributive for the non‐poor, at present representing 65% of its beneficiaries (by the above estimates), but 90% of these are actually registered as non‐contributing beneficiaries, obviously undermines the credibility of the contributive element and weakens the finances of the program. A case can certainly be made in favor of a minimum health protection scheme which is universal and non‐contributive, but if this is the desired model the program should be designed so de jure.
A simple solution to improving the targeting efficiency of Seguro Popular without having to set up a new and costly targeting mechanism, in the present transitional phase, would be the automatic affiliation of all Oportunidades beneficiaries and IMSS‐
21 The program does not aim to achieve universal coverage, strictly speaking, as a fraction of the uninsured at the top of the income distribution will always prefer private insurance.
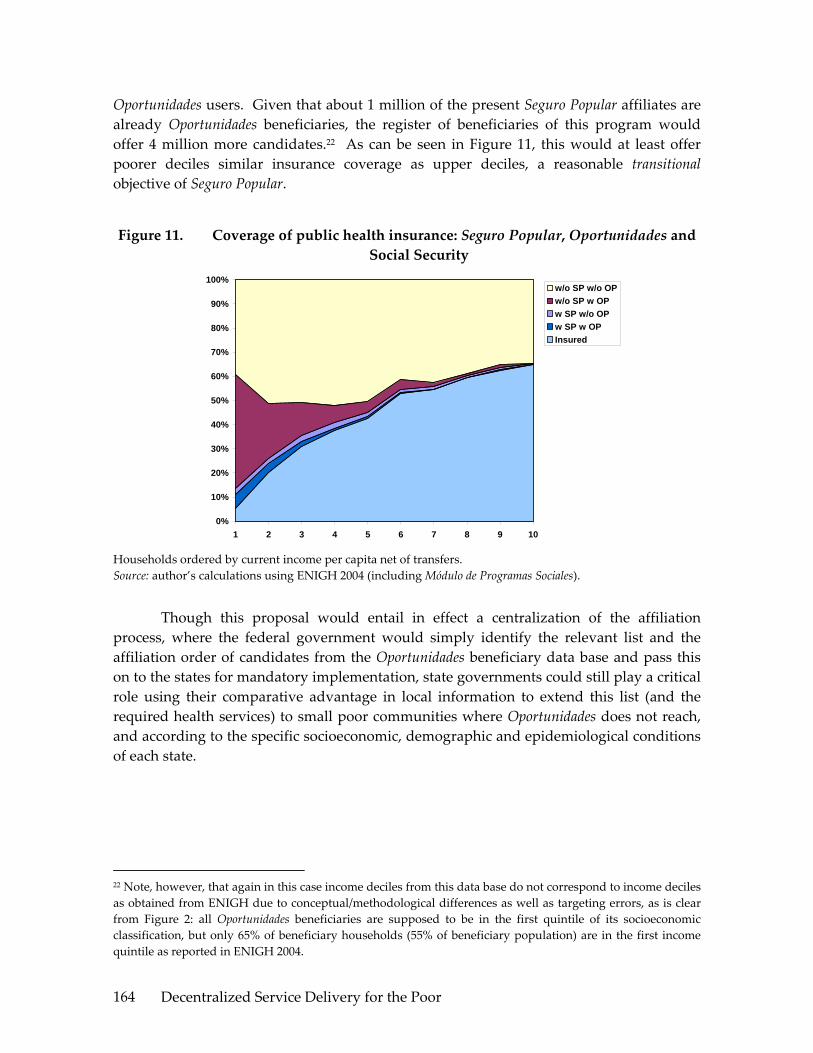
Decentralized Service Delivery for the Poor 164
Oportunidades users. Given that about 1 million of the present Seguro Popular affiliates are already Oportunidades beneficiaries, the register of beneficiaries of this program would offer 4 million more candidates.22 As can be seen in Figure 11, this would at least offer poorer deciles similar insurance coverage as upper deciles, a reasonable transitional objective of Seguro Popular.
Figure 11. Coverage of public health insurance: Seguro Popular, Oportunidades and Social Security
0%
10%
20%
30%
40%
50%
60%
70%
80%
90%
100%
1 2 3 4 5 6 7 8 9 10
w/o SP w/o OPw/o SP w OPw SP w/o OPw SP w OPInsured
Households ordered by current income per capita net of transfers. Source: author’s calculations using ENIGH 2004 (including Módulo de Programas Sociales).
Though this proposal would entail in effect a centralization of the affiliation process, where the federal government would simply identify the relevant list and the affiliation order of candidates from the Oportunidades beneficiary data base and pass this on to the states for mandatory implementation, state governments could still play a critical role using their comparative advantage in local information to extend this list (and the required health services) to small poor communities where Oportunidades does not reach, and according to the specific socioeconomic, demographic and epidemiological conditions of each state.
22 Note, however, that again in this case income deciles from this data base do not correspond to income deciles as obtained from ENIGH due to conceptual/methodological differences as well as targeting errors, as is clear from Figure 2: all Oportunidades beneficiaries are supposed to be in the first quintile of its socioeconomic classification, but only 65% of beneficiary households (55% of beneficiary population) are in the first income quintile as reported in ENIGH 2004.

Decentralized Service Delivery for the Poor 165
REFERENCES
Scott, J. R. 2005, “Desigualdad en Salud y en los Recursos para la Salud en México”, Documento de Trabajo 302, División de Economía, CIDE (Trabajo Técnico para el Reporte de la Comisión Mexicana de Macroeconomía y Salud)
SSA 2004, “Población no asegurada y núcleos familiares sujetos a afiliación al Sistema de Protección Social en Salud”, Secretaría de Salud, Subsecretaría de Innovación y Calidad, Dirección General de Información de Salud.
CNPSS 2005, Comisión Nacional de Protección Social en Salud: Indicadores de Resultados, Primer Semestre 2005,
DOF 15.4.05, “Lineamientos para la Afiliacion, Operacion, Integracion del Padron Nacional de Beneficiarios y Determinacion de la Cuota Familiar del Sistema de Proteccion Social en Salud”, Diario Oficial de la Federación, Viernes 15 de abril de 2005.
World Bank 2004, “The Distribution of Benefits from Public Expenditure”, Ch. 2, Mexico Public Expenditure Review.

Decentralized Service Delivery for the Poor 166

Decentralized Service Delivery for the Poor 167
SOCIAL INFRASTRUCTURE: FONDO DE APORTACIONES PARA LA INFRAESTRUCTURA
SOCIAL (FAIS)
Anna Wellenstein, Angélica Núñez, and Luis Andrés
I. INTRODUCTION
During the 1990s, Mexico began decentralizing basic services as well as infrastructure expenditures. Decentralization of education and health started between the years of 19921 and 19962. In 1997, the Mexican Congress passed the Ramo 33 law that contains as one of its components, the creation of the Social Infrastructure Contributions Fund (FAIS – Fondo de Aportaciones para Infrastructura Social) with the objective of funding investments in infrastructure that directly benefit the poorer population.
This report focuses on the analysis of the FAIS and provides suggestions for increasing its effectiveness. The report focuses on the following questions: (a) What can be learn about this program with the available information in terms of municipal decisions on social investments? (b) What can be improved in this fund to benefit those in extreme poverty, and (c) Which are the barriers (if any) that limit FAIS efficiency? To answer those questions, the report provides a general overview of the infrastructure sectors in Mexico and the relative importance of FAIS at the municipal level. In addition, the institutional arrangements in a sample of ten states are reviewed to understand the accountability relationships that shape the program. The report further explores the relationship between FAIS funds and allocation to better understand the main beneficiaries, using different approaches such as several poverty measurements and qualitative and econometric techniques. The report is based on data from different sources in order to obtain a comprehensive picture as well as to explore additional features not considered in previous analyses of this fund. New sources of information analyzed include: financial information at municipal level that includes sources of income and expenditure for the years 1989 to 2003, FISM (FAIS funding directly to municipalities) allocations based on the Encuestas a Presidentes Municipales (2000, 2002, and 2004), census information at locality and municipal level that allows for disaggregated analysis of particular of characteristics, such as water and electricity
1 A first step was the 1992 voluntary agreement (not a law) signed among political parties, the Federal Government, national teacher’s union and state governors, entitled, Acuerdo Nacional para la Modernizacion de la Educación Basica. Initially Congress did not participate, although in 1993 the main elements of the Acuerdo were incorporated in the Ley General de Educacion (Annex to Volume I). 2 Legally codified decentralized was initiated by the 1996 Acuerdo Nacional para la Descentralizacion de los Servicios de Salud, which involved a similar set of players as that of Education. (Annex to Volume I)

Decentralized Service Delivery for the Poor 168
coverage and use of FISM funds, at the level of each jurisdiction and legislation at state level.
This report has four main conclusions:
a. FAIS targeting to the poor presents significant improvements over previous programs, however, additional targeting will be important to fully capitalize on the program’s poverty alleviation potential. The following facts illustrate this issue: (i) FAIS resources have been increasing remarkably across time as have the shares received by the poorest states. However, the distribution of funds is biased towards favoring the poorest states, while not necessarily benefiting the poorest municipalities across the country; (ii) Per capita FISM resources favor people in the poorest municipalities in particular those in poor states. However, the gap between, and, within municipalities has been converging to a similar amount per poor; and (iii) 54 percent of FISM resources are spent outside the cabeceras (county capital), where there is typically a higher poverty rate. Two out of three people live in the cabeceras, while resources per capita are roughly three times higher outside the cabeceras. In general, localities outside the cabeceras are behind in basic services coverage (as expected). As a result, the gap between the resources per poor in cabeceras and other localities will be smaller than the resources per capita.
b. The efficiency of FAIS allocations within the municipality could be improved. FAIS allocations in the water and electricity sectors seem to be correlationed with lack of access to these services, though no correlation was observed in sanitation. After evaluating the coefficients in the mean of the sample, only responses to different levels in electricity coverage are, somehow, remarkable. Some of the main explanations for this behavior are the lack of incentives to target certain objectives and limited accountability, among other caveats.
c. Clearer rules of the game should be accompanied by increasing institutional capacity, information, and incentives for pro‐poor investments. Most states are playing a much larger role than originally envisaged in the 1998 reform and have introduced some type of regulation for FISM expenditures. Municipalities have to comply also with federal and sector‐specific regulation and in some cases with municipal‐level codes. This has created confusion and a lack of clarity over the main objective of the program, the eligible expenditure categories, and reporting to the federal government3. In addition, poor institutional capacity in small and, or, poorer
3 Few of the states reviewed include in their local legislation a poverty objective for FAIS and in some cases, state‐level legislation includes expenditure categories that are not allowed by the federal law.
Decentralized Service Delivery for the Poor 169
municipalities seems to be a significant barrier to improve planning, prioritizing, and implementation. The current focus of state legislation on fiduciary aspects can be enhanced to improve the quality of the projects financed, align projects with the poverty alleviation objective, promote capacity building at local level, and increase downward accountability.
d. Stronger accountability is needed at the local level through evaluation of results, monitoring spending efficiency, and incorporating learning by doing. Information on FAIS investments is scarce, inconsistent and focused on informing the upper levels of government. There are little or no mechanisms to ensure accountability to citizens. Municipalities report monthly to states however, accountability with citizens is limited to the planning process. In general, reporting is not results focused nor is it used by states or the federal government to evaluate or benchmark municipal or state spending efficiency. Improving the quality of the information can be used to better monitor results and create incentives for municipalities to improve those aspects that are impeding the accountability relationships to function properly, such as promoting better spending efficiency, incorporating participatory auditing mechanisms or same‐time sharing of information with supervision authorities. States can create incentive schemes to promote spending efficiency through counterpart funding programs or through lessening the supervision requirements in those municipalities that improve their performance. Over the long run, this upward accountability should be replaced by greater accountability to beneficiaries. This could then support phasing out of the middle layer of regulation, leaving just a minimum set of upward information accountability to ensure transparency
The report is structured as follows. First, it contains an overview of the programs and performance of the infrastructure sectors in Mexico. Second, it focuses on the institutional dimensions of the FAIS resources, describing the organization of sub‐national spending on infrastructure and how these shape accountability between agents. Third, it identifies of some features related to targeting and allocation of the resources. The report concludes with some brief policy recommendations.
II. PROGRAMS AND PERFORMANCE OVERVIEW
Infrastructure overview
FAIS’ aim to increase social infrastructure forms a key aspect of Mexico’s poverty reduction strategy. Infrastructure plays a role in assuring basic subsistence, as in the case of potable water, and health, in the case of sanitary disposal of waste and electricity for cooking and safe heating. It is also crucial for accessing employment and markets, via transitable roads, and for human development, via roads to access

Decentralized Service Delivery for the Poor 170
education and health facilities, and electricity to allow these facilities to function adequately. Calderón and Servén find that infrastructure has an important effect in reducing inequality. For example, the impact for Mexico of improving its infrastructure to Korea’s level and quality is estimated to be a reduction of the Gini coefficient by 0.06 from a level close to 0.57 (Milanovich 2002)4.
Mexican infrastructure investment and coverage are higher than the Latin America and Caribbean (LAC) average. In 2003, the Government of Mexico spent roughly 1.2 percent of its GDP on infrastructure investment and maintenance (including: electricity, transport, water supply, and sanitation), as it also provided 0.7 percent of GDP on untargeted consumption subsidies for the electricity sector. Although not very high by world standards, this is one of the highest levels of investment in the Latin American and Caribbean region.
There has been significant improvement in terms of access to basic services. Table 1 presents the components of the marginality index for several years. In particular it reports on water and electricity coverage. In 1990, 21 percent of the population had no access to improved water, while ten years later, this ratio became 11%. Electricity coverage increased from 87% to 95% over the same period.
Table 1. Marginality Index, 1990, 1995, and 2000 Components of the Marginality Index 1990 2000 Illiterate population 15 years or older (%) 12.44 9.46 Population 15 years or older lacking primary education (%) 36.95 28.46 Residents in settlements without either sewerage or individual sanitation solution (%) 21.47 9.90 Population living without electricity (%) 12.99 4.79 Population in settlements without running water (%) 20.97 11.23 Settlements with some levels of crowding (%) 57.1 45.94 Occupant in settlements with dirt floors (%) 20.92 14.79 Population settlements with less than 5,000 inhabitants (%) 34.38 30.97 Population earning up to 2 minimum wages (%) 63.22 50.99 Marginalization Index 31.16 22.95
Source: CONAPO.
Although Mexico shows reasonable levels of coverage relative to Latin America, millions of Mexicans still lack access to basic services and the quality and reliability of infrastructure services are generally below expected levels for upper‐middle‐income countries. Almost 10 million people lack access to an improved water
4 The World Bank (2004) estimated the overall impact on the distribution of spending under two assumptions for autonomous spending: using actual measures in the ENIGH and adjusting upwards all spending equi‐proportionately to bring it in line with the national accounts. Including public transfers in cash and kind leads to large reductions in inequalities with the share of the poor rising significantly and the overall Gini falling from 0.48 for autonomous spending to between 0.39 or 0.43, depending on the assumptions.

Decentralized Service Delivery for the Poor 171
source, 9 million lack any type of sewerage or an improved sewerage connection, and over one million are without electricity (see Table 2).
Table 2. Household Indicators ‐ Electricity, Water, Floor and Sanitation (1992‐2004)
National Urban Rural
1992 2002 2004 1992 2002 2004 1992 2002 2004
Electricity Yes 92.4 98.0 98.7 98.5 99.5 99.5 76.2 93.5 95.8
No 7.6 2.0 1.3 1.5 0.5 0.5 23.8 6.5 4.2 Water Improved
water source 80.7 89.9 90.1 92.2 96.2 94.4 50.3 70.6 75.6
Non‐improved water source
19.3 10.1 9.9 7.8 3.8 5.6 49.7 29.4 24.4
Sewerage Improved sewage
65.4 77.0 91.2 81.6 91.1 95.3 22.5 34.2 ..
Non‐improved sewage
6.0 3.9 1.5 4.0 1.9 1.1 11.3 9.8 2.9
No sewerage 28.6 19.1 7.3 14.4 7.0 3.6 66.2 56.0 21.5
Source: WB staff estimation using ENIGH surveys (several years).
The most visible and striking disparities across quartiles of municipalities refer to he lack of access of basic services available to the poor. Table 2 shows a very positive evolution in the last 14 years in all indicators and in rural and urban settings, although rural areas are in terms of W&S coverage. Table 3 depicts marginality index data and suggests that among lower quartile of the population, 14.0 percent have no access to electricity, 28.9 percent do not have access to improved water, and 26.7 percent do not have sanitation. These proportions are higher for the poorest municipalities. In contrast, for the top quartile, only 0.6 percent have no electricity, 2.1 percent lack access to an improved water source and 1.1 percent lack access to sanitation.
Table 3. Access to Basic Services by Group of Municipalities (2000) I
(poorest) II III IV
(richest) Whole Sample
% of population without electricity
13.99 3.21 1.32 0.63 4.79
% of population without improved water
28.86 10.03 4.04 2.07 11.23
% of population without sanitation
26.72 9.33 2.49 1.06 9.89
% of population living in loc. with less than 5,000 inhab.
77.02 36.28 7.95 2.75 30.97
Total Population 24.3M 24.3M 24.0M 24.7M 97.4M # Municipalities 1,553 669 132 56 2,410
Note: Own elaboration based on CONAPO information at municipal level. Percentages were weighted by population in the municipality.

Decentralized Service Delivery for the Poor 172
Access to water has steadily increased over the last 12 years, reaching above some regional LAC averages, while still below comparable countries in the hemisphere. Table 4 shows that Mexico has been reducing significantly their gap in terms of water coverage in both, rural and urban areas. Sanitation coverage, as may be seen in the previous table, also has been increasing steadily coverage from 65 percent in 1992 to 91 percent in 2004. This level of coverage is significantly above the 77 percent average in the region (World Bank 2005).
Table 4. Access to Improved Water Source % or urban population with access % or rural population with access Country
1990 2002 1990 2002 Argentina 97 97 73 .. Brazil 93 96 55 58 Chile 98 100 49 59 Colombia 98 99 78 71 Mexico 90 96 48 71 LAC Avg. 93 96 58 69 Source: WDI (2005) and WB staff estimation using ENIGH surveys.
The quality of infrastructure is still below that of comparable countries in the region, especially in the supplying of electricity. The World Economic Forum (2004) produced a survey on subjective evaluation in different infrastructure quality components, building an index where higher scores represent better quality service. Mexico’s overall score of 3.4 is lower than the higher marks attained by Chile, Brazil, and Argentina. Mexico ranked among the five lowest scoring countries in the quality of the electricity supply (see Table 5).
Table 5. Comparative Survey on the quality of the service (2003) Country Overall
Infrastructure Quality
Water [2000]
Electricity Supply Quality
Argentina 3.6 5.4 4.2 Brazil 3.5 5.2 4.9 Chile 4.9 5.1 5.7 Colombia 2.9 4.7 4.7 Mexico 3.4 4.7 3.9 Sample Avg. 3.7 4.7 4.7
Source: WEF (2004) and Estache and Goicoechea (2005).
Funding Infrastructure: The Role of FAIS in Infrastructure Investment
Infrastructure investments in Mexico are mostly funded by the federal government. Public investment in 2003 accounted for more than 90 percent of the total investment in infrastructure (see Table 6). In this sense, Federal government has been

Decentralized Service Delivery for the Poor 173
the main player in increasing capacity in basic services. However, following the decentralization process of the mid 1990s, state and municipal governments have been increasing their participation in social infrastructure investment.
Since 1994, the private sector has been increasing its participation and financing of transport, electricity, water, and sanitation in Mexico, though still low by compared to its peers. Despite this expansion, private participation in Mexico remains lower than that of Mexico’s peers in Latin America (Argentina, Brazil, Chile, and Colombia). Mexico is one of the first countries in Latin America to attract significant private participation in infrastructure (PPI), which decreased and has remained modest after the road‐concession program collapse in the early 1990s, with an exception in the telecommunication sector. Compared to other countries, Mexico has not experienced significant private investment in energy and water distribution services. Most private financing has been allocated to the sectors of energy and transport, especially, for railroads and airports. The very modest private investments in water supply and sanitation concentrated mainly on build‐operate‐transfer (BOT) schemes for wastewater treatment plants (IPER 2005).
FAIS funds only 10 percent of overall infrastructure investment, while the private sector contributes close to 9 percent. FAIS participation in electricity and transport is relatively modest (less than 10%); however, in water, it accounts for 29 percent of the investment.
Table 6 shows that total investment in infrastructure (excluding telecommunications) was MX$91 billion, or 1.4 percent of Mexico GDP in 2003. The main investment is electricity where their share in the total investment is 47 percent, followed by transport with 35 percent, and water and sanitation with 18 percent.
Box 1. How effectively does FAIS leverage private investment?
Global experience points to several factors for effective leveraging of public resources for infrastructure investment.
i. Public investment needs more effective use of taxpayer resources and refocusing on areas untouched by private sector finance.
ii. Incremental public funding released through greater resource efficiency should focus on three areas: maintenance and rehabilitation, strategic bottleneck infrastructure segments, and extension of basic services to the poor.
iii. Improving outcomes through better designed and selected investment programs.
iv. Mobilizing greater amounts of private finance to leverage public resources.

Decentralized Service Delivery for the Poor 174
v. Requiring enhancement of federal credit for attracting sizable sums of private funding from domestic and international sources, while mandating design and functioning revision.
vi. Closely regulating tariffs and service quality, thus improving the incentives for public sector providers and creating an environment that makes good use of private investment as well as the opening of new legal opportunities.
vii. Moving forward on the above recommendations will require greater accountability and better information on performance outcomes.
FAIS is in line with these recommendations in terms of focusing public investment in areas untouched by the private sector, and specifically on services and infrastructure for the poor. It falls behind best practices in terms of incentives for better design and selectivity, as the funds are largely passed to municipalities without project design requirements. Some States have been putting in place regulations and providing technical assistance to improve project quality. Accountability is also a weak spot in the FAIS program, as municipalities are not held accountable to the Federal Government for the use or impact of FAIS spending, and citizen voice on FAIS is weak (see more details below).
Source: Adapted from IPER‐MX (2005).
Table 6. Public Infrastructure Investment by Sector, Excluded Telecommunications (in millions of MX$) ‐ 2003
Private TotalInvestment Non-FAIS FAIS*
Water and Sanitation 4,000 7,872 4,876 16,748 Row % 23.9% 47.0% 29.1% 100.0% Col % 51.3% 10.7% 51.4% 18.5%Electricity n.a 39,921 2,341 42,262 Row % 94.5% 5.5% 100.0% Col % 54.4% 24.7% 46.6%Road 0 24,200 2,277 26,477 Row % 0.0% 91.4% 8.6% 100.0% Col % 0.0% 33.0% 24.0% 29.2%Ports and Railroads 3,800 1,330 0 5,130 Row % 74.1% 25.9% 0.0% 100.0% Col % 48.7% 1.8% 0.0% 5.7%Total 7,800 73,323 9,494 90,617 Row % 8.6% 80.9% 10.5% 100.0% Col % 100.0% 100.0% 100.0% 100.0%
Public Investment
Note: (*) Only WSS, electricity and road expenditure were included in this total. Based in Encuesta a presidentes Municipales 2002 .Source: Own elaboration based on IPER, 2005.
Some background of FAIS
FAIS has evolved from programs started nearly two decades ago, and marks important progress in terms of transparency and stability in municipal funding. These efforts began in 1988 as President Salinas proposed the PRONASOL Program as a
Decentralized Service Delivery for the Poor 175
new model of social assistance designed to channel funds for public works projects to the poorest sectors of the population, both rural and urban. The program targeted basic services in health, nutrition, education, social services, social infrastructure, and small enterprise development. PRONASOL represented a move from universal protection to targeted assistance and from a redirection from traditional organizational corporatist forms towards a pluralist, democratic, and sovereign model.
However, transparency and accountability problems persisted with PRONASOL. The program remained highly centralized, especially in the figure of the President. The initiative did not have a pre‐established and systematic formula to identify beneficiaries, resulting in highly discretional disbursements. Evidence suggests that the program did not reach those living in extreme poverty but rather responded to the political criteria of politicians. (see esp. Weldon and Molinar in Cornelius, Craig, and Fox, eds. 1994).
Learning from and aiming to improve on this experience, President Zedillo (1994‐2000) proposed a two‐pronged approach to social welfare reforms. He replaced PRONASOL with Progresa and created Ramo 33, which decentralized most of the funds previously assigned to PRONASOL and other federal programs (see Table 7). The Fox administration (2000‐present) has continued with the policies of his predecessor, renaming Progresa “Oportunidades” (translated from Spanish means “Oportunities”) and continuing the promotion of decentralization, especially, under the Ramo 33.
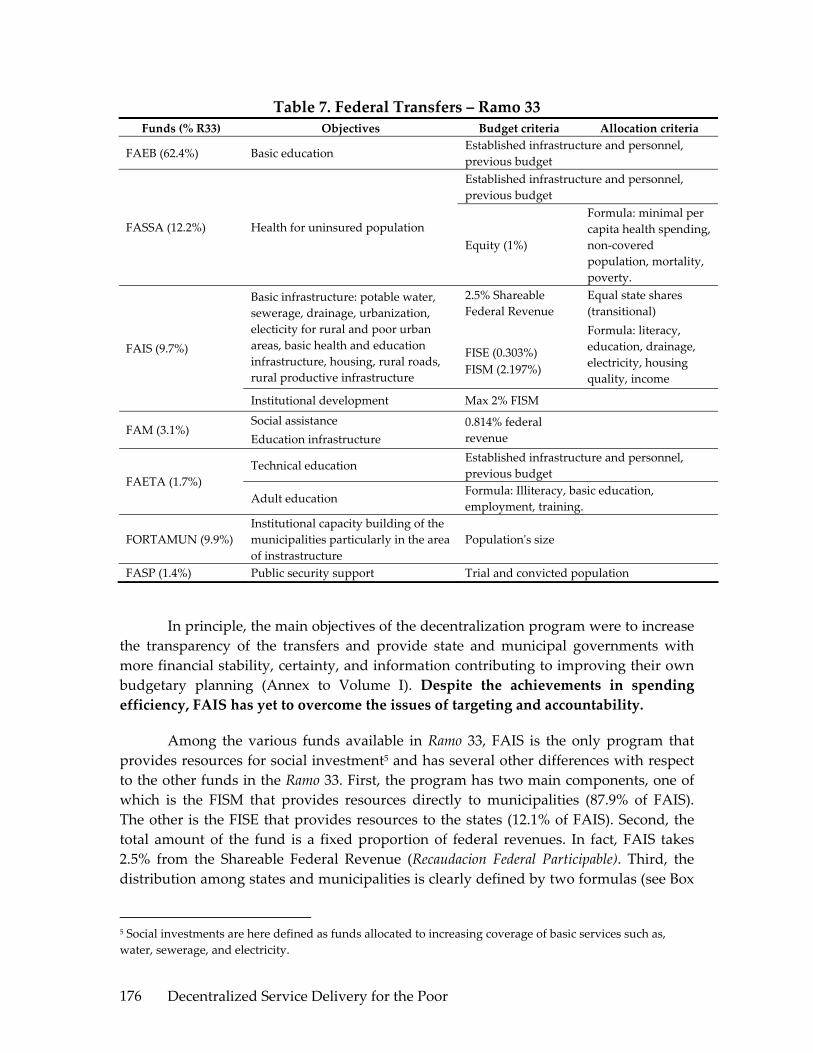
Decentralized Service Delivery for the Poor 176
Table 7. Federal Transfers – Ramo 33 Funds (% R33) Objectives Budget criteria Allocation criteria
FAEB (62.4%) Basic education Established infrastructure and personnel, previous budget Established infrastructure and personnel, previous budget
FASSA (12.2%) Health for uninsured population Equity (1%)
Formula: minimal per capita health spending, non‐covered population, mortality, poverty.
2.5% Shareable Federal Revenue
Equal state shares (transitional)
FISE (0.303%)
Basic infrastructure: potable water, sewerage, drainage, urbanization, electicity for rural and poor urban areas, basic health and education infrastructure, housing, rural roads, rural productive infrastructure
FISM (2.197%)
Formula: literacy, education, drainage, electricity, housing quality, income
FAIS (9.7%)
Institutional development Max 2% FISM
Social assistance FAM (3.1%)
Education infrastructure 0.814% federal revenue
Technical education Established infrastructure and personnel, previous budget
FAETA (1.7%) Adult education
Formula: Illiteracy, basic education, employment, training.
FORTAMUN (9.9%) Institutional capacity building of the municipalities particularly in the area of instrastructure
Populationʹs size
FASP (1.4%) Public security support Trial and convicted population
In principle, the main objectives of the decentralization program were to increase the transparency of the transfers and provide state and municipal governments with more financial stability, certainty, and information contributing to improving their own budgetary planning (Annex to Volume I). Despite the achievements in spending efficiency, FAIS has yet to overcome the issues of targeting and accountability.
Among the various funds available in Ramo 33, FAIS is the only program that provides resources for social investment5 and has several other differences with respect to the other funds in the Ramo 33. First, the program has two main components, one of which is the FISM that provides resources directly to municipalities (87.9% of FAIS). The other is the FISE that provides resources to the states (12.1% of FAIS). Second, the total amount of the fund is a fixed proportion of federal revenues. In fact, FAIS takes 2.5% from the Shareable Federal Revenue (Recaudacion Federal Participable). Third, the distribution among states and municipalities is clearly defined by two formulas (see Box
5 Social investments are here defined as funds allocated to increasing coverage of basic services such as, water, sewerage, and electricity.

Decentralized Service Delivery for the Poor 177
2). Finally, municipalities must specify their use of FISM into twelve categories, such as water and sanitation, rural roads, and rural electrification.6
Box 2: FAIS’ Formulas for Allocating Funds to the State and Municipal Governments
The FAIS allocation formulas establish how the program funds are to be distributed among municipalities. Although there were some predecessors programs (see Scott 2004), the 1998 reform established FAIS as the first significant fund to be distributed directly to the municipalities.
In turn the Ley de Coordinacion Fiscal establishes two formulas, from which the states can choose to allocate funds from the state to the municipal level. The first formula builds on the Gross Municipal Deficit, (Masa Carencial Municipal), with indicators for income, education, housing, sanitation, and electricity. These indicators are used to define the share of FAIS funding for each municipality. The formula computes the Global Poverty Index for each household as follows:
∑=
=5
1ijiij PIGP β
where j identifies each household, Pji is the gap with respect to the reference for
household j and indicator i, and iβ is the weight for each component of the formula7. The square of this index is multiplied by the number of people in extreme poverty in the household to obtain the deficient mass for household j. These masses are aggregated at municipal and state level to obtain the deficient mass in each of these levels. Then each state receives a proportional amount of the fund according to their share in the gross national deficient.
The Law establishes also provides for use of a simpler formula for states which do not have sufficient information. The alternative formula entails four equally weighted components8 . The majority of states have opted for this simplified formula, with only twelve states using first formula 9 in 2005.
The formulas represent several important advances in terms of allocation of resources. They have:
⇒ Increase transparency and de‐politicize distribution of resources from the federal to the municipal level.
6 There are ten infrastructure categories plus provisions, subject to a cap: indirect costs and institutional development. 7 The weights are β1=0.4616 for Income, β2=0.1250 for Education, β3=0.2386 for Housing, β4=0.0608 for Sewerage, and β5=0.1140 for Electricity. 8 These components include: the employed population with less than two minimum wages, the illiterate population 15 years or older, population in settlements without sewerage, and population living in settlements without electricity. 9 Aguascalientes, Coahuila, Chiapas, Guanajuato, Hidalgo, México, Michoacán, Nayarit, Puebla, San Luis Potosí, Sonora, and Tamaulipas use the more complex formula.

Decentralized Service Delivery for the Poor 178
⇒ Provide stability and predictability of funding, important for planning and budgeting processes.
⇒ Increased progressiveness in funding with municipalities with greater social infrastructures needs receiving more funds, though still far from ideal (for further discussion, see paragraph 52 below).
The formulas also have several drawbacks. First, the information used to estimate the formula is updated through the census data, thus being not responsive to recent developments; there are also some technical issues such as how the weights are defined and that some of the variables are not related with the objectives of this fund (see Scott, 2004). Second, the objectives of the program are not aligned with the components of the formula, providing limited incentives to target access to basic services. The more relevant the components in the formula to infrastructural needs and the more frequent the up‐dating of information, the more disincentives for efficient use in the absence of explicit incentives that would reward improvements in the provision of services. Third, the formulas lack incentives for a better use/allocation of the funds. There are no penalties for failing to report how municipalities spent the funds or for reporting expenditures not allowed by law. Most importantly, improving the distribution of the fund calls for providing incentives to municipalities to target spending in line with the objectives of the fund.
Two additional characteristics make FAIS substantially different from the Ramo 33 education program, FAEB, or the Ramo 33 health program, FASA. First, FAIS was not preceded by any decentralization agreement (acuerdo) with states or municipalities. PRONASOL was created by a presidential decision in 1988; and subsequently, via a 1996 presidential decree, a large share of FAIS funds was distributed to sub‐national governments according to an explicit formula. Congress converted the program to FAIS in 1998 as part of the reforms of the Ley de Coordinación Fiscal (LCF), a process in which there was no intervention by any national trade union and hardly any participation by state governors. Second, FAIS resources are not tied to a wage bill, as is the case with practically all of FAEB or FASA. These two characteristics implied a very different political process, with substantially less constraints on the depth of decentralization achieved. This course permitted an explicit statement in the LCF, targeting these resources directly to poverty alleviation. It has also permitted transferring most of the funds directly to municipalities rather than to states. (Annex to Volume I).
FAIS resources have grown steadily, reaching MX$26,639 millions in 2005, up from the original nominal value of MX$10,403 millions (MX$16,238 millions in 2004’s prices). Steady growth has been recorded with an exception in 200310. These funds make
10 An exploration of the data suggests that despite the fact that the Recaudacion Federal Participable (RFP) increased by 11.3% in real terms and that FAIS is a fixed proportion of the RFP, this drop was caused by a difference between the estimated and actual RFP in both years. FAIS allocations every year are based on the estimated RFP and not on the actual available resources. In fact, the Fiscal Coordination Law establishes that FAIS will obtain a 2.5 percent of RFP as a reference (Art. 32°), regardless of the latter’s fluctuation during the
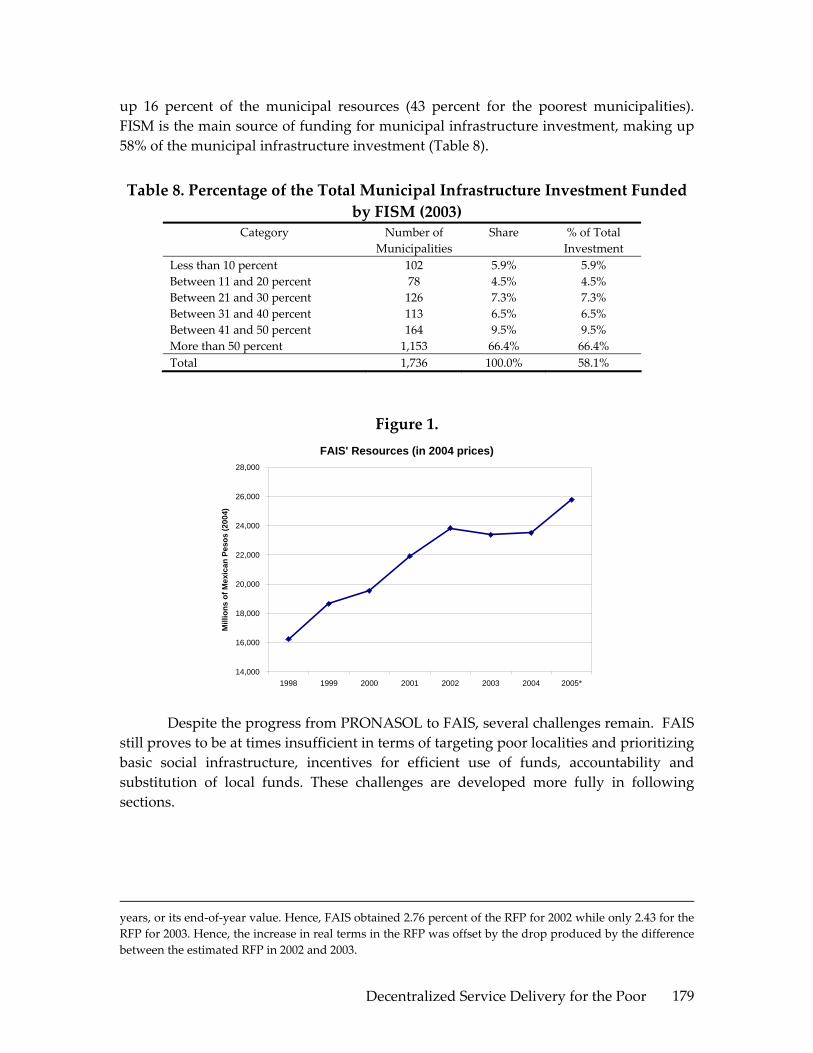
Decentralized Service Delivery for the Poor 179
up 16 percent of the municipal resources (43 percent for the poorest municipalities). FISM is the main source of funding for municipal infrastructure investment, making up 58% of the municipal infrastructure investment (Table 8).
Table 8. Percentage of the Total Municipal Infrastructure Investment Funded by FISM (2003)
Category Number of Municipalities
Share % of Total Investment
Less than 10 percent 102 5.9% 5.9% Between 11 and 20 percent 78 4.5% 4.5% Between 21 and 30 percent 126 7.3% 7.3% Between 31 and 40 percent 113 6.5% 6.5% Between 41 and 50 percent 164 9.5% 9.5% More than 50 percent 1,153 66.4% 66.4% Total 1,736 100.0% 58.1%
Figure 1. FAIS' Resources (in 2004 prices)
14,000
16,000
18,000
20,000
22,000
24,000
26,000
28,000
1998 1999 2000 2001 2002 2003 2004 2005*
Mill
ions
of M
exic
an P
esos
(200
4)
Despite the progress from PRONASOL to FAIS, several challenges remain. FAIS still proves to be at times insufficient in terms of targeting poor localities and prioritizing basic social infrastructure, incentives for efficient use of funds, accountability and substitution of local funds. These challenges are developed more fully in following sections.
years, or its end‐of‐year value. Hence, FAIS obtained 2.76 percent of the RFP for 2002 while only 2.43 for the RFP for 2003. Hence, the increase in real terms in the RFP was offset by the drop produced by the difference between the estimated RFP in 2002 and 2003.

Decentralized Service Delivery for the Poor 180
III. INSTITUTIONAL ARRANGEMENTS
This section reviews the existing institutional arrangements for the planning, implementation and supervision and monitoring of FAIS. The main objective is to assess how the institutional design is supporting infrastructure delivery at local level ‐ differentiating for the roles and accountability mechanisms that allow for voice and client power11. Specifically, this section will seek to answer the following questions: How are the existing institutional arrangements shaping the allocation and use of FAIS funds and the quality of the projects financed? Are the roles of the different participating levels of government supporting effective project implementation?, And finally, how effective are the monitoring and supervision arrangements in terms of strengthening accountability and citizen’s voice?
The 1998 reform sought to neutralize investment from federal political pressure empowering the local governments with decision making authority for planning, implementation and supervision. As outlined above, the federally managed PRONASOL program evolved into a decentralized fund allocated on the basis of a formula to increase access to basic infrastructure for the poorest segments of the population to be implemented by states in the case of FISE and municipalities in the case of FISM.
The federal government has a limited role in FAIS. Mainly, it distributes the funds to the states and sets general guidelines for the program. The Federal Government calculates the amount of funding per state based on the formula described in the LCF (See Figure 3). This mechanism increased downward accountability since the formula and information for its calculation are publicly available. SEDESOL also supports the states in the calculation of the amount of FISM to be distributed within their municipalities, and provides general guidelines for local governments as to how to carry out projects. Since FAIS funds by law belong to the states and municipalities, no upper level of government can, in theory, condition their use, although this is not always the case.
The Fiscal Coordination Law requires local governments to disclose to the general public information of the works financed within the community ex ante and ex post, promote beneficiary community participation in programming, implementing, monitoring and evaluation of the works financed, seek to finance works which are compatible with the preservation of the ecosystem and promote sustainable development, and inform the federal government on the use of FAIS funds in each state and municipality. SEDESOL is responsible for requesting local governments to inform quarterly on the use of funds. The way in which these requirements should be met is left
11 As defined in the WDR 04, client power is the relationship of accountability connecting clients to service, or in this case infrastructure providers, based on the transactions through which clients express their demand for services and can monitor supply. Voice is the relationship connecting citizen and politicians and comprising many formal and informal processes, including voting.

Decentralized Service Delivery for the Poor 181
up to the local government. This regulation, strictly speaking, is only a recommendation, which the local governments choose to follow or ignore.
The primary role of states is to carry out FISE funded projects and distribute FISM within their municipalities. Twelve percent of FAIS funds is transferred to states to support regional and inter‐municipal projects implemented at state level through FISE. These funds can finance works, basic social actions, and investments that benefit the poor. Additionally, investments should have a regional or intermunicipal scope. FISE funds complement the state’s own and federal resources for infrastructure or other sector investments. In reality, FISE does no represent an important share of the total expenditures on public works. In 2003 for example, FISE accounted only for 2% of the total public infrastructure12. Given FISE’s relatively low importance, most states have not implemented special institutional arrangements for FISE funds, rather they are commonly guided by the states’ regulatory and institutional arrangements applicable to all other state investments.
States are also responsible for distributing funds to their municipalities. For this purpose, they can replicate the formula used by the federal government or use an “alternative” and more simplified calculation of a simple arithmetic mean of municipal (carencias) (see Box 2 for details on the formula). Originally, states used this simpler version because there was no information available to apply the more complex formula. Although this is no longer the case, it is likely that states continue to use the simpler calculation for continuity sake and for lack of incentives to change to the more complex formula. The simplified formula is based on municipal data, which implies a population bias. It seems unlikely that states are comparing both formulas before choosing the simplified one; as the list of states using the simplified formula includes both highly populated and relatively unpopulated ones. Moreover, states are not competing with other states for resources but rather use this formula only to distribute funds within their municipalities. In all cases, SEDESOL supports each state with the data and calculation of the amounts of FISM to be distributed amongst their municipalities, which should be published in the state’s official gazette.
Upward and downward accountability for FISE is low, as reporting is low and infrequent.
Table 9 shows the number of states that have reported to the federal government on the allocation of FISE funds since 2001 (states that report in one year do not necessarily report in the following years). Moreover, in most cases each state has used their own accounting systems and reporting templates making comparisons difficult. As a consequence there is very weak accountability of states to the federal government on efficiency expenditure of FISE funded projects. Downward accountability towards the population varies according to the transparency and accountability mechanisms set
12 Source: SEDESOL. Total public infrastructure as defined for Table 6.

Decentralized Service Delivery for the Poor 182
in each state for infrastructure investments. It is interesting to note that only 35% of municipal governments report any involvement in FISE funded projects in their state, a figure that would seem low considering that FISE is earmarked for inter‐municipal or regional projects13.
Table 9. FISE Reporting 2001 2002 2003 2004 2005
Number of states 2 7 8 5 7
Municipalities play the most important role in implementing FAIS–funded projects via FISM. Municipalities receive 88% of FAIS funds, which accounts for 58% of municipal spending in infrastructure. FISM funds are part of the pool of money accessible to municipalities through other federal, state or own programs to finance infrastructure works, although FISM is one of the few with a poverty alleviation objective. FISM funds are treated as the municipality’s own resources. Strictly speaking, this means that the municipality has the autonomy to decide on allocation of the funds –within the infrastructure categories described in the LCF‐ using its own planning, implementing and supervision procedures.
By allocating the bulk of the FAIS funds into FISM, the decentralization reform implicitly recognized that municipalities are the level of government best placed to identify and tackle the main basic infrastructure gaps, despite the heterogeneity of existing institutional capacity. In the case of FISM, the provider of infrastructure is the local government; aligning infrastructure delivery responsibilities to political boundaries; which could in turn further strengthen voice and accountability. It is important to note however, that if no mechanism to clearly differentiate between the roles of the policy makers and the provider is established, decentralization may simply transfer patronage to local levels.
Municipalities form a highly heterogeneous group with varying degrees of institutional capacity. Mexico has 2,438 municipalities of which 45% have less than 10,000 inhabitants. Size and level of institutional capacity varies widely between municipalities. Overall, small and poor municipalities have less human capital, information and ability to efficiently allocate the limited amount of FISM resources into infrastructure projects for poverty alleviation. This is characterized by fewer staff, with lower years of schooling than their peers in low marginality municipalities. Perhaps more importantly, decision making staff in high marginality municipalities is less experienced in public sector. Only 31% of the municipal presidents in municipalities with high marginality have previous experience in public offices, compared to 53% for
13 Based on the 1,680 municipalites that answered question 43 of the Encuesta de Presidentes Municipales 2004.

Decentralized Service Delivery for the Poor 183
municipalities with low marginality. This is important especially considering that poorer municipalities are also those in which the institutional framework is weaker.14
FISM can support capacity building for municipalities, but preliminary data suggests local governments are not taking advantage of this option. Decentralization in the absence of adequate local capacity can bring little change in results, although this does not mean that these cannot be done at the same time, experience shows that local capacities expand best as decentralized systems mature, even though sequencing remains difficult15. As much as 2% of FISM funds can be allocated by municipalities to support institutional capacity building programs. Only for this expenditure are municipalities required to agree on an institutional development plan with the state and federal authorities before spending the money. This requirement probably helps to explain why municipalities are not allocating the funds for this purpose, particularly given that they can allocate the funds to the remaining categories if not spent in capacity building. There is no data on expenditure for capacity building and hence it is difficult to know which are the main issues addressed through spending in this area16. Available information for the state of Veracruz suggests that the share of this category is very low; 0.64% of FISM allocated to institutional development. This figure decreases to 0.25% if only the 30 poorest municipalities are considered.
Upper levels of government are best placed to foster capacity at local levels by providing incentives for municipalities to match demand‐driven capacity growth with the provision of supply‐side assistance and financing. States play usually this role, building partnerships with municipal governments or co‐financing institutional development programs. Although not necessarily FISM‐specific this can have an impact in FISM projects. Overall, 74% of municipalities report to have received training from state governments, compared to 34% from the federal government.
Apart from their primary role distributing the funds, states play an active role in FISM implementation by regulating planning, implementation and supervision of projects, a role not anticipated in the decentralization reform. As early as 1998, the first state issued its own local regulatory mechanism regarding planning, operation, implementation, reporting and even disbursement of FISM funds to municipalities. Since 2000, more states have issued operational guidelines or manuals either by state initiative, or by reaching agreements with their municipalities. Since then, states have developed different incentives schemes, planning criteria and reporting and supervision mechanisms, learning from other states and from their own experience. States are now playing an important role in the implementation arrangements of FISM. This can have positive results, for example, by leveraging state investment, promoting alignment with
14 Lack of institutional capacity is show, for example, by the number of existing reglamentos. 15 WDR 2004, Chapter 10, p. 191 16 EPM reports three main areas in which municipalities have received capacity training, not necessarily funded via FISM: Accounting and Finance, Regulation and Administrative skills.

Decentralized Service Delivery for the Poor 184
the state development plan, supporting municipalities with the technical aspects of infrastructure investments, directing spending to certain state priority objectives, or ensuring transparency, supervision and reporting. While these interventions can improve the quality of FISM expenditures, it is at the cost of moving away from the decentralization model supported by the 1998 reform and could create opportunity for states to exercise political control by obstructing projects in municipalities from different political parties or groups. Moreover, local regulations could contradict the federal Fiscal Coordination Law.
State issued FIMS regulation has added one layer of complexity for municipalities resulting in lack of clarity of norms and objectives. State regulatory mechanisms take several forms across states, varying between laws, operational guidelines or rules, state decrees issued by the finance secretariat, social development secretariat, Development Planning Councils (COPLADEM), or state congress audit offices (ORFIS). In some cases, these regulatory mechanisms are only valid for a certain period of time, depending on the legal nature of the document17. In addition to these, states have to comply with several layers of regulation when executing FISM funds, including guidelines from the federal LCF, federal and state regulation for sector‐specific investments and in some cases municipal reglamentos for certain investments. This has created confusion and lack of clarity over the rules of the game in particular regarding the allowed expenditure categories, the general objectives of infrastructure financing (not all infrastructure investments have a poverty alleviation focus) and the reporting mechanisms, to the extent that some of the state issued regulation in some cases allows for expenditure categories that are not permitted by the federal law, such as scholarships for basic education or pensions for the elderly. Results in the EPM show lack of access and clarity in the regulation is the most frequently identified problem when operating FISM. Moreover, within the same state, municipal presidents seem to be unclear as to if there is FISM‐specific regulation applicable18.
The existing institutional arrangements for FISM were reviewed in ten states in order to better understand the accountability relationships that occur at this level. Table 10 includes a summary of the main findings. In eight out of the 10 cases the state has issued FISM‐specific regulations. For the two states remaining, the sources of information were state‐level laws and decrees and informal procedural arrangements between the state and its municipalities. The following paragraphs are also based on the information provided by this state documentation. For the purpose of this study, and given that there is no systematic information on results or an evaluation of the funds, this section will only review how these arrangements currently in place allow for accountability between the provider of the infrastructure and the client or citizen.
17 If no new regulation is issued usually municipalities take the expired document as still valid. 18 In the 24 states sampled (who responded to the survey), municipal presidents in the same states responded differently when asked if there was FISM –specific regulation in their state.

Decentralized Service Delivery for the Poor 185
At the planning stage, all the municipalities are required to and have in place mechanisms to incorporate client voice in FISM funded projects. Participatory planning is a mandatory process for all local governments. There are two main channels: (i) Comite de Planeacion para el Desarrollo Municipal (COPLADEMUN) and (ii) Comité Comunitario (CC) in the case of urban areas and Comités de Desarrollo Rural (CDR) in the case of rural areas. COPLADEMUNs are headed by the municipal president and generally include technical staff from the municipal government as well as representatives of groups of localities designated by vote in each of the localities19. CCs are councils which do not include government officials and hence can be more “grass root” than the first category. A preliminary list of works to be financed during the course of a year is prepared by the COPLADEMUN in some cases (23% of the municipalities20) the CC also participates. The list of works is subject to prioritization as soon as the precise amount of funds to be received by each municipality is published, which is usually done in January each year. This process is done in most cases by the same planning institutions, although in some cases the state planning agency also participates21. It is difficult to gauge the extent to which these planning and prioritizing arrangements are indeed participatory and allow for full representation. First, informal as well as formal institutional arrangements, which vary from state to state and within municipalities, may exert a influence on investment choices. Second, there is no information on how projects are evaluated and the main reasons for rejection.
19 The exact composition and voting powers of the members of these councils varies in each state. In some cases state representatives are also involved as advisors with no voting power, in others representatives from localities are grouped by geographical distribution or by population. 20 Encuesta de Presidentes Municipales 21 This process varies from state to state and even amongst state with equal institutional arrangements. Sometimes the state has voice but no vote in the comités, and this can be enough to exercise enough influence within the comité.

Decentralized Service Delivery for the Poor 186
Table 10. FISM Institutional Arrangements in Selected States. Audit
List of works prepared by
Priorization of works by
"Validation" of works required by State
Requierd to be Integrated into state development plan
Technical revision of works
by state Reporting to Periodicity
Use of electronic systems
Includes formats
Supervision by Periodicity
Provisions for social audit or
community supervision Audit by
Aguascalientes 11 XOperational guidelines 2002
Consejo de Desarrollo Municipal
Consejo de Desarrollo Municipal X X X
State Planning Secretariat
monthly or quarterly depending on the type of information X X
State controlaría Not specified X
State congress
Coahuila de Zaragoza 38 X
Operational manual 2003 COPLADEMUN COPLADEC (State) X X X
State Finance Secretariat quarterly X X
State controller and finance (only when there is state money) Quarterly
State congress
Chiapas 118 XOperational manual 2005 COPLADEMUN COPLADEMUN X X X
State Finance Secretariat quarterly X
Municipal & state contralorias X
State congress
Guanajuato 46 COPLADEMUN COPLADEMUN
X (exludes small works
as defined by estimated cost by
State)
State Social and Human Development Secretariat monthly X X
State development secretariat and contraloria Not specified
State congress
Guerrero 76 XOperational manual 2005 COPLADEMUN COPLADEMUN X
X (only for health,
education, water and electrification
projects)
State Social Development Secretariat monthly X Not specified Not specified X
State congress
México 122 XOperational manual 2004
Consejo de Participación Ciudadana (no gov officials) & COPLADEMUN
Consejo de Participación Ciudadana (no gov officials) & COPLADEMUN X
X (only for health and
education)State Finance Secretariat monthly X X
Municipal contraloria Quarterly X
State congress
Puebla 218 X
Law and reglamento & operational manual 2005 COPLADEMUN COPLADEMUN X X
X (required for
disbursement of funds)
State Social Development Secretariat monthly X
State controlaría Not specified X
State congress and controller's office
Tlaxcala 60 Comite Comunitario Municipal government officials X
State Congress and COPLADE quarterly X Not specified Not specified
State congress
Veracruz de Ignacio de la Llave 210 X
Operational Manual 2000 Comite Comunitario COPLADEMUN
X (If there is a
normative State agency)
Audit Office of State Congress quarterly X
Municipality (on the basis of list of works prepared by State) Not specified X
State congress
Zacatecas 58 XOperational guidelines 2005 Asamblea Comunitaria CIPLADEMUN X
X (required for
disbursement of funds)
State Planning and Regional Development Secretariat monthly X
Planning secretariat and Contraloria agree on annual supervision plan Not specified X
State congress
Reporting SupervisionPlanning
State
Number of municipalities
State issued FIMS regulation Type Year issued /
latest update
Source: Own elaboration based on sources described in Annex 7.

Decentralized Service Delivery for the Poor 187
There is little prioritizing of FISM‐funded works according to potential poverty impacts or relevance to the state or municipalities development plan. Although funds are allocated on the basis of a formula to the poorer municipalities, once the funds reach the municipality, local mechanisms or criteria to ensure the allocation of resources amongst the expenditures, consistent with the poverty alleviation objective of FAIS, are lacking. This situation is worse in poorer municipalities which normally lack institutional capacity. Adequate information can support the decision making process when selecting the works financed and can help to counteract pressure from political groups. At this early stage the pro‐poor objective of FISM seems to be watered down, and FISM becomes another source of infrastructure investment for the municipality. In only five of the states reviewed, FISM‐funded projects are required be consistent or embedded in a strategic planning for the state, although in practice there is no evidence of rejecting projects for failing to meet this requirement. Overall, 75% of municipalities report having a municipal development plan, although this number hides an important difference between low and high marginality municipalities, with 92% and 62% reporting to have a development plan respectively.
Some states manuals and laws address these issues by providing guidance to improve the prioritization and sequencing of investments. The impact of the different efforts should be further evaluated and best practices disseminated. A notable example is the state of Chiapas, which incorporates into their manual the minimum criteria that municipal presidents should consider when planning and prioritizing investments, such as the latest diagnosis on poverty for the municipality, the municipal and state development plans, and available statistical and geographical data. Building on this information, the manual goes on to recommends a general sequence of investments, prioritization of water and sewerage over pavement or urbanization, and stresses the poverty alleviation objective of FISM. In the states of Guerrero and Aguascalientes, to ensure minimum levels of investment outside the municipal capital (cabecera municipal), and hence in poorer localities, the states suggest a minimum percentage (based on population distribution) of funds to be invested in localities outside the cabecera. In addition municipalities in Guerrero must spend at least 10% of FISM in rural projects. To promote better sequencing of investments some states have also incorporated into their manuals caps for certain type of expenditure categories. For example, in Puebla, municipalities are not allowed to spend more than 30% on urbanization, and cannot pave roads if there is no sewerage already in place. Aguascalientes prevents municipalities from investing in new infrastructure if existing infrastructure for water and sewerage is not working due to lack of maintenance. Chiapas, Coahuila, Guerrero and Zacatecas require a higher level of counterpart community funding ‐ a policy element that proved to be very successful in the previous PRONASOL program and that is still present in some current FISM state manuals ‐ for projects that aim improve the city image, such as parks or refurbishing of plazas. The
Decentralized Service Delivery for the Poor 188
latter scheme has the added benefit of increasing community supervision and evaluation and hence accountability between of the municipality as a provider to its citizens. States have also tested implementing counterpart funding programs to create incentives for municipalities to address certain priority investments. Preliminary evidence suggests that municipal governments are responsive to these schemes (See Box 3). A detail and systematic evaluation of the different mechanisms currently being applied by states would merit a separate study in order to compile a data base of the different approach and their impact and disseminate best practices.
Inter municipal association, which can facilitate import economies of scale for some investment, is infrequent due to the lack of multiannual FISM funded projects. Devolving responsibilities to local governments can often lead to loss of economies of scale. Fragmentation can be partly addressed by permitting inter‐municipal agreements. Within the context of FISM, inter‐municipal investments are allowed, but appear not to be common practice. Overall only 19% of the municipalities report to have been associated with others to co‐fund basic infrastructure via FISM, mostly for water and sewerage. This figure increases to 26% if only the low marginality municipalities are considered. There are at least two reasons that help explain this: lack of institutional capacity and the short municipal government period which allows for very short‐term planning and the lack of a culture of regional or inter‐municipal investments. States are best placed and can do more to address this issue, promote inter‐municipal investment and best practice within their municipalities
In all cases reviewed, municipalities maintain a constant dialogue with the state regarding FISM‐financed projects. On the other hand, downward accountability and access to information towards citizens appears to be limited to the planning process. States are not entitled to condition FISM transfers to municipalities but in practice at least two states—Puebla and Zacatecas—have additional requirements. Apart from the conditioning of disbursements, the process and flow of information between the two levels of government is remarkably similar to the rest of the states. Even if no disbursement condition is established, in most cases, municipalities submit the technical project files of each project to the state for a “technical” supervision, in particular for those sectors where there is a state regulating entity. This serves to ensure that the state is always informed about FISM projects and has the ability to enquire about project related issues. It can also provide valuable support for municipalities with lower capacity and provide a mechanism for coordination between the municipal and state governments to ensure a more balanced investment throughout the region. On the other hand, this diminishes the autonomy of the municipality and can provide for opportunities for the states to exercise political pressure on municipalities (for example if the state and municipality belong to a different party). In the longer term, increased transparency in the technical revision of projects can reduce the risk of political misuse from the states; however, today the methodology used for this revision is not public and

Decentralized Service Delivery for the Poor 189
the information on the project technical file is only available ex‐post to the state’s congressional audit office. In contrast, the information flow and accountability between the municipality and its citizens seems limited to two points: the planning process described above, and an ex‐post report once the infrastructure work is finished, limiting citizen’s voice and ownership of the works financed. It is likely that citizens use informal channels to exercise their voice and client power within their local government. Given that detailed regulatory schemes already exist, this can be enhanced with mechanisms that incorporate the voice of the clients in FISM execution, such as community based systematic supervision of works.
Reporting mechanisms are focused on informing the upper level of government, with no systematic access to information for citizens. Despite states receiving periodic information on FISM projects, most do not share it with the federal government. This is part due to the fact that SEDESOL had not issued any reporting standards or templates until very recently. In mid 2005, SEDESOL issued a new reporting mechanism–Sistema de Información del Fondo de Aportaciones a la Infraestructura Social (SIFAIS)–comprised of an electronic template distributed to all states and municipalities. The first results from this exercise are expected to be available early 2006. In the states reviewed, most municipalities report monthly to the state on the physical and financial status of the works undertaken with FISM resources. All states reviewed have issued standardized reporting procedures for their municipalities and in some cases they have provided technical assistance for the municipalities to do on‐line reporting22. There has been much less focus from all level of governments on reporting to citizens. This is left mostly to a demand‐driven exercise where citizens have to submit applications for information on the basis of the access to information law.
Transparency and access to information can create an opportunity to benchmark performance and use fiscal resources and reputation as rewards to support efficient provision of infrastructure. This tool could be developed further to improve alignment of FISM expenditures with its objectives. For this purpose, data needs to be consistent and comparable, and focused on achieved results. States could use their reporting systems already in place to incorporate additional data to be collected from municipalities to construct a set of indicators that can help focus FAIS monitoring on results. This could allow for better policy making when trying to design and implement incentive or grant schemes (as in the case of Puebla) and to provide better technical assistance focused on improving results.
22 Data from the recent survey shows that during the last two years access to computer systems has expanded substantially amongst municipalities, with 91% of all municipalities covered. The latter facilitates same time reporting for monitoring to the state agency and the state Congress audit office (in charge of auditing FISM funds), a procedure that is currently being tested in the state of Guanajuato.

Decentralized Service Delivery for the Poor 190
Supervision arrangements are complex and in some cases overlap. Since the three levels of government have some form or responsibility under FAIS, several agencies are responsible for supervision and monitoring arrangements.
Table 11 summarizes the supervision, monitoring and auditing responsibilities at each stage as described in the LCF. Only the congressional branches have full sanctioning mandates. The various controllers’ office can only sanction the level of government to which they pertain and only for missprocurement practices. As can be seen, municipalities are subject to more revisions since they spend most of FAIS funds. At any point one municipality can be audited by its own controller office, the state congress audit and the state’s controller office. These audits are done on a sample basis subject to the capacity constraints of state and congress audit staff. Overall there is no systematic coordination between supervision agencies and in practice these can review the same project three times, which can be a stretch of resources in particular for smaller municipalities which tend to have limited staff.
Several issues are preventing a more comprehensive supervision of the projects financed. In the case of FISE, as described above, lack of data collection does not allow for any supervision of state implementation of funds. For FISM, data collected and disclosed is always related to infrastructure units built (kilometers or roads, water connection, sidewalks paved, etc) and procurement and budget accounting issues making a poverty impact evaluation difficult. Moreover, supervision and audits by the State Congress are done ex post, and the information flow is from municipality to the state, who in turn compiles the reports on public accounts which are then sent to congress for audit. This mechanism results in congressional audits normally occurring with a two year lag or more. Considering the three year municipal government cycle, the only mechanisms to enforce any misuse of resources will likely happen when the responsible public officials are already out of office.

Decentralized Service Delivery for the Poor 191
Table 11. Supervision and auditing arrangements for FAIS Stage Responsible entity Reports to Scope
Allocation of resources from the federal budget and until these funds reach each State
Federal Internal Control Office (Secretaria de la Función Pública)
Federal executive branch
Supervisión and monitoring
Since the states receive the funds and until they are fully disbursed by either the state (FISE) or the municipality (FISM)
State or municipal office of internal control (Arrangements vary amongst states and within municipalities since some municipalities have their own controller; in such cases coordination agreements for supervision exist)
Local executive branch Federal Internal Control office when irregularities occur
Supervisión and monitoring
State and municipal expenditures (Cuenta Publica)
Audit office of the local legislative branch
Local legislative branch Audit office of the federal legislative branch when irregularities occur
Audit
All federal expenditures (including all items in the federal budget)
Audit office of the federal legislative branch
Federal legislative branch
Audit (for state and municipal implementation of federal transfers, responsibility is delegated to the local legislative audit office)
Program evaluation and dissemination of best practices could strengthen the accountability between citizens and levels of government. Improving the quality of information and aligning supervision with the program objectives could have a larger impact if shared with citizens who in turn could exercise client power with their local authorities. In the case of FISE there are no current mechanisms in place, but some states have included certain evaluation and dissemination procedures in their FISM manuals for social audits, which merit further analysis.
Decentralized Service Delivery for the Poor 192
IV. REVENUES AND EXPENDITURES
Given these institutional arrangements, the next section looks at results. In particular, the section below reviews the allocation of FAIS expenditures in relation to municipal revenues, how are these aligned with needs, its targeting of the poor, and its contribution to infrastructure investments.
Correlation of Revenues with Social Indicators
Own source revenue for the poorest municipalities is extremely low. Aportaciones has become their main source of income. Figure 2 and Figure 3 show the average distribution of sources of income per group of municipalities and the amount per capita received from each revenue source for the years 1998 and 2003. Participaciones and Aportaciones represent 68 percent of the income for an average municipality. However, for the poorest municipalities, both contribute as much as 86 percent. For the richest ones, there is a 52 percent contribution. Own Revenues and Rights were less than 2 percent for the poorest municipalities in contrast to 18 percent for the richest. An additional and yet notable element are the changes between 1998 and 2003 of the Aportaciones’ shares. While in 1998 disparities across groups of municipalities where not remarkable, for instance, the share for Aportaciones in poor municipalities was 15.7 percent, while for richest ones was 7.4 percent, five years later, these shares changed dramatically in favor of the poorest municipalities. When Aportaciones was 50.0 percent for the poorest municipalities, for those in the top quartile, Aportaciones was 18.4 percent. Moreover, Table 12 shows that the composition of the Aportaciones changes significantly across groups. For instance, while for the poorest municipalities, 61.5 percent of Aportaciones in 2003 originated by FISM, while for the wealthiest ones this ratio was 20.0 percent. These imply that FISM is one of the main sources of income for the poorest municipalities with an average of 32 percent in 2003. This proportion increases with the marginality. For instance, for the ten municipalities with most marginality, FISM funds accounted for 60.4 percent of their total resources.

Decentralized Service Delivery for the Poor 193
Figure 2. Source of income per municipality by group (1998)
Poorest Municipalities [1998]
4.5%
63.7%
15.7%
16.1%
Revenues and Rights Participaciones Aportaciones Others
Wealthiest Municipalities [1998]
26.1%
40.9%
7.4%
25.6%
Revenues and Rights Participaciones Aportaciones Others
Figure 3.Source of Income per Municipality by Group (2003)
Poorest Municipalities [2003]
2.9%
35.8%
50.0%
11.3%
Revenues and Rights Participaciones Aportaciones Others
Wealthiest Municipalities [2003]
26.3%
33.5%
18.4%
21.8%
Revenues and Rights Participaciones Aportaciones Others Source: Own elaboration. See Annex 6 for the more details.
Table 12. Source of Income per Municipality by Group (1998 and 2003) Source of income per municipality ‐ Avg % 1 2 3 4 Total Aportaciones [1998] 100.0% 100.0% 100.0% 100.0% 100.0% ‐ FISM 65.6% 51.5% 43.9% 34.7% 55.0% ‐ Others 34.4% 48.5% 56.1% 65.3% 45.0 Aportaciones [2003] 100.0% 100.0% 100.0% 100.0% 100.0% ‐ FISM 61.5% 38.3% 25.4% 20.0% 51.9% ‐ Others 38.5% 61.7% 74.6% 80.0% 48.1% # Municipalities 1,325 595 123 45 2,088
Note: Aportaciones are actual expenditure while FISM are the funds distributed to each municipality that may differ with actual expenditure. This may overstate FISM’s shares. Only those municipalities with financial information were used.
FAIS resources have been increasing remarkably across time as have the shares received by the poorest states (Figure 4). Table 13 shows the total 1998 funds at MX$16.2 billion in 2004 prices (MX$10.4 billion in nominal terms). Six years later, the programs increased 45 percent in real terms; however, such increases have been uneven

Decentralized Service Delivery for the Poor 194
across the states. According to the Marginality Index 2000, the richest states decreased their funds by 7 percent in real terms, while the eight poorest states have increased their resources provided through FAIS by 74 percent. These charges increased the poorest states’ shares of FAIS funds from 46 percent to 55 percent of the program. Annex 1 presents the same table at the state level. These proportions provide evidence that the distribution of the funds has been evolving in favor of poor states.
Figure 4. FAIS Distribution of Funds per Group of States, millions of MX$ (2004)
050
0010
000
1500
0
1998 2000 2002 2004year
I - 8 Poorest states II III IV - 8 Richest st.
Millions of MX$ (2004)FAIS' distribution of funds per group of states
Table 13. FAIS’ Transfers per Group of States in MX$ 2004 Value (1998‐2004) Group of states 1998 1999 2000 2001 2002 2003 2004I - 8 poorest states 7,490.19 9,314.43 10,505.68 11,776.75 13,268.88 12,941.29 13,047.28
Col % 46.1% 49.9% 53.7% 53.7% 55.7% 55.4% 55.5%Row index 1.00 1.24 1.40 1.57 1.77 1.73 1.74
II 3,714.64 4,165.41 4,257.93 4,773.56 4,949.46 4,868.81 4,889.04 Col % 22.9% 22.3% 21.8% 21.8% 20.8% 20.8% 20.8%Row index 1.00 1.12 1.15 1.29 1.33 1.31 1.32
III 2,935.91 3,102.54 2,968.84 3,327.72 3,647.30 3,625.80 3,623.16 Col % 18.1% 16.6% 15.2% 15.2% 15.3% 15.5% 15.4%Row index 1.00 1.06 1.01 1.13 1.24 1.23 1.23
IV - 8 richest states 2,097.54 2,071.93 1,818.15 2,037.88 1,977.38 1,944.55 1,952.16 Col % 12.9% 11.1% 9.3% 9.3% 8.3% 8.3% 8.3%Row index 1.00 0.99 0.87 0.97 0.94 0.93 0.93
Total 16,238.28 18,654.30 19,550.61 21,915.90 23,843.02 23,380.45 23,511.64 Col % 100.0% 100.0% 100.0% 100.0% 100.0% 100.0% 100.0%Row index 1.00 1.15 1.20 1.35 1.47 1.44 1.45
Source: Own elaboration based on official data.
However, the distribution of funds is biased in favor of the poorest states, not necessarily in favor of the poorest municipalities across the country. Equally poor municipalities across states received different increments of the FISM funds. Table 14 shows that the poorest municipalities among the poorest states received the highest raise, totaling 91.8 percent in 2004, while the poorest municipalities in the richest states

Decentralized Service Delivery for the Poor 195
decreased resources in real terms by 2.3 percent. The average ranking in the marginality index for 2000 for the 235 municipalities in the former group was 1,675, close to the average ranking in the marginality terms of the third quartile of the poorest states, while the latter received a total increase in real terms of 65.1 percent.
Table 14. Average change of funds transfers to the municipalities in real terms (1998 and 2004)
I(Poorestmunicip.)
II III IV(Richestmunicip.)
I - 8 poorest States% change in FISM 91.8% 73.1% 65.1% 48.5% 74.2%Avg ranking (IM2000) 351 1069 1749 2265 882Total population 7.3 7.3 7.3 7.3 29.3# Municipalities 624 482 186 58 1,350
II% change in FISM 27.3% 32.2% 34.8% 53.1% 31.6%Avg ranking (IM2000) 935 1,693 2,141 2,326 1,335 Total population 3.9 3.8 3.8 4.1 15.6# Municipalities 216 133 36 10 395
III% change in FISM 20.6% 27.7% 27.8% 1.4% 23.4%Avg ranking (IM2000) 1,609 2,271 2,380 2,423 1,813 Total population 8.4 8.4 8.3 8.8 33.9# Municipalities 278 71 21 20 390
IV - 8 richest states% change in FISM -2.3% -32.3% -16.4% -11.3% -6.9%Avg ranking (IM2000) 1,674 2,315 2,408 2,433 1,821 Total population 4.6 3.6 5.4 4.8 18.4# Municipalities 235 47 13 6 301
Source: Own elaboration based on official data.
Quartiles within group (by population) Total
A more detailed analysis of the changes suggests that most of the increase in funding for the poorest municipalities within the poorest states happened during the first two years of the program. Table 15 below presents a desegregation of the changes between 1998 and 2004 for the average municipality in each quartile for each group of states. The table suggests that almost half of the increase in FISM funds for the poorest municipalities happened in the first three years of the program. The law establishing the program provided for a two year period of transition during which the new distribution formula came into effect. A clause establishes that for the first year of the program, one percent of the fund will be disbursed for each state, and the difference would be distributed among them according to the marginality index. For 1999, this clause was also used, but the difference was that only one half of percent was assigned for each state, which the rest distributed according to the marginality index. After this period of transition, municipalities in similar conditions of poverty should receive the same amount from FAIS because of the formula; the only differences should be due to the choice between the two formulas. Additional changes occurred in 2002 as a consequence of the actualization of the marginality index with the information collected during the
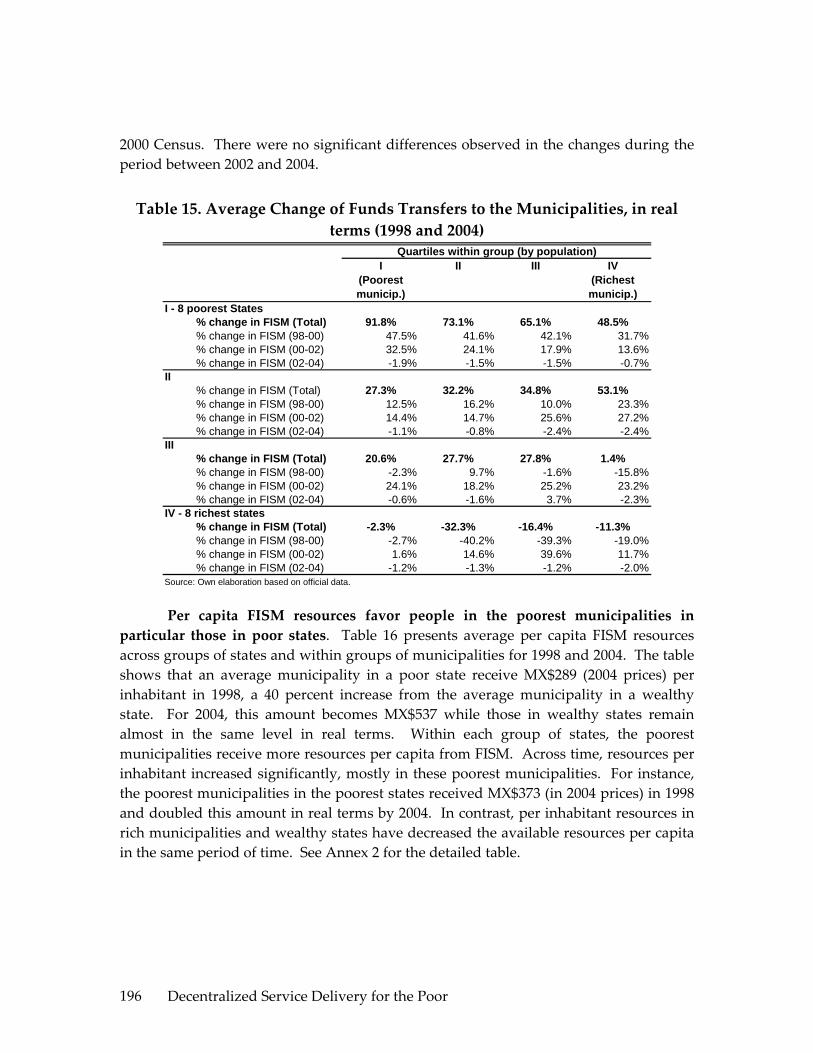
Decentralized Service Delivery for the Poor 196
2000 Census. There were no significant differences observed in the changes during the period between 2002 and 2004.
Table 15. Average Change of Funds Transfers to the Municipalities, in real terms (1998 and 2004)
I(Poorestmunicip.)
II III IV(Richestmunicip.)
I - 8 poorest States% change in FISM (Total) 91.8% 73.1% 65.1% 48.5%% change in FISM (98-00) 47.5% 41.6% 42.1% 31.7%% change in FISM (00-02) 32.5% 24.1% 17.9% 13.6%% change in FISM (02-04) -1.9% -1.5% -1.5% -0.7%
II% change in FISM (Total) 27.3% 32.2% 34.8% 53.1%% change in FISM (98-00) 12.5% 16.2% 10.0% 23.3%% change in FISM (00-02) 14.4% 14.7% 25.6% 27.2%% change in FISM (02-04) -1.1% -0.8% -2.4% -2.4%
III% change in FISM (Total) 20.6% 27.7% 27.8% 1.4%% change in FISM (98-00) -2.3% 9.7% -1.6% -15.8%% change in FISM (00-02) 24.1% 18.2% 25.2% 23.2%% change in FISM (02-04) -0.6% -1.6% 3.7% -2.3%
IV - 8 richest states% change in FISM (Total) -2.3% -32.3% -16.4% -11.3%% change in FISM (98-00) -2.7% -40.2% -39.3% -19.0%% change in FISM (00-02) 1.6% 14.6% 39.6% 11.7%% change in FISM (02-04) -1.2% -1.3% -1.2% -2.0%
Source: Own elaboration based on official data.
Quartiles within group (by population)
Per capita FISM resources favor people in the poorest municipalities in particular those in poor states. Table 16 presents average per capita FISM resources across groups of states and within groups of municipalities for 1998 and 2004. The table shows that an average municipality in a poor state receive MX$289 (2004 prices) per inhabitant in 1998, a 40 percent increase from the average municipality in a wealthy state. For 2004, this amount becomes MX$537 while those in wealthy states remain almost in the same level in real terms. Within each group of states, the poorest municipalities receive more resources per capita from FISM. Across time, resources per inhabitant increased significantly, mostly in these poorest municipalities. For instance, the poorest municipalities in the poorest states received MX$373 (in 2004 prices) in 1998 and doubled this amount in real terms by 2004. In contrast, per inhabitant resources in rich municipalities and wealthy states have decreased the available resources per capita in the same period of time. See Annex 2 for the detailed table.

Decentralized Service Delivery for the Poor 197
Table 16. Average per Capita FISM Resources across Groups of Municipalities and States, in real terms (1998 and 2004)
I(poorest municip.)
II III IV(richest
municip.)
Total
1998 I - 8 poorest states 373.4 260.0 178.3 105.0 289.0II 365.9 222.2 138.8 100.6 291.3III 259.1 112.8 79.7 68.0 205.1IV - 8 richest states 229.9 106.9 63.9 41.1 206.4Total 322.6 227.7 162.6 92.6 265.8
2004 I - 8 poorest states 714.6 473.2 309.2 153.3 537.2II 430.1 261.8 158.6 91.8 341.5III 278.5 111.5 71.9 49.8 216.1IV - 8 richest states 224.9 72.9 42.3 32.2 197.3
Total Total 488.4 373.4 262.9 116.5 412.1
FISM funds per person (2004 MX$)
Source: Authors’ calculations. Annex 2 shows the same table for all the years.
FISM resources per structural poor favor people in the wealthy municipalities. However, the gap between and within municipalities have been converging to a similar amount per poor. For this analysis, we explore two different measures of poverty using the same methodology23:
a. Percentage of people below the poverty line in each municipality based on Szekely Pardo et al (2005)24 25,
b. Percentage of structural poor defined as the average of people without access to improved water, sanitation or electricity based on the Marginality Index components for 2000 [see Annex 5 for details on the index]26.
23 The methodology was to build the percentage of poor people in each municipality for the four measures and we assumed that these ratios were constant across time. Then using Conapo population projections for each municipality for each year between 2000 and 2005, we impute these ratios to compute the number of persons in each of the definitions. Then we divided the total funds received by each municipality and each year by all the four estimations of numbers of poor. Note that we assume that there were no significant changes across time in the rate of structural poor in each municipality. Similar results may be obtained if there is some improvement in coverage in any of the services, but these changes are proportionally similar for all the municipalities. 24 Zekely Pardo et al (2005) estimate poverty ratios and inequality measures for Mexico based on Lopez‐Calva et al (2005), who proposed a method to estimate income indicators at the household level using Census and ENIGH data. 25 As a robustness test we also run the same specification using the share of people with less than two minimum wages in 2000, based on the Marginality Index’s components. These tables are shown in Annex 3, and the results are qualitatively similar. 26 As a robustness test we also defined an additional definition of structural poor with a variation of the previous one. In this case we used the maximum among the three indicators of access to basic services

Decentralized Service Delivery for the Poor 198
In terms of the first indicator, Table 17 presents the average FISM funding poor. In this case, we use the first definition of income poverty where we applied Szekely et al (2005)’s estimation at municipal level. As shown in some of the previous tables, the estimations are presented per groupings of states, from the eight poorest to the eight wealthiest states, and then within each group of states, further broken down into groups of municipalities according to marginality. Table 16 presents the values for 1998 and 2004. Annex 2 shows the complete series of these indicators. The table suggests no significant difference in expenditure per poor across different groups of municipalities within the poorest states in 1998. Six years later, these lacks of differences persist. In contrast for the municipalities within wealthier states, the table suggests that poorest municipalities are receiving more FISM resource per poor than those in rich municipalities. More precisely, while the poorest municipalities in rich states received MX$2,273 per poor in 1998 (in 2004 prices), those in the wealthy municipalities in the same states received MX$901. The same year also shows remarkable differences per poor across states. While the average resource per poor in municipalities in poor states was MX$746 in 1998, those in the fourth group of municipalities received MX$2,233, a three times greater transfer per poor. While these differences across groups persisted in 2004, some of these gaps were reduced, improving the transfer per poor in municipalities with higher marginality. The most remarkable change was that on average, the transfer per poor in states with higher marginality was MX$1,359 while those in the wealthiest ones was MX$1,864, only a 37 percent difference, in contrast to the situation in 1998 where the difference was 199 percent.
Table 18 presents the income resource per poor, per percentage of the population in structure poverty. In this case, we define the poor as the average share of population without coverage in basic services27. The analysis suggests that poor municipalities receive fewer resources per structural poor both between and within groups of states. For instance, an average municipality in a poor state receive MX$2,109 (in 2004 prices) per structural poor in 1998 while in the same period, a municipality in a wealthy state received MX$3,552. This point is well illustrated by looking at the case of the poorest group of states. Within this group, poorest municipalities received MX$1,572 per structural poor in contrast to MX$2,865 for the poorest in rich municipalities. For recent years, these patterns continue. However, the gap among groups was reduced significantly. More over, most of the groups were close to the global mean of MX$3,59728 implying some convergence.
instead of their average. Annex 3 and 4 show these results and results are qualitatively similar to those presented by the above definition. 27 See Annex 3 and 4 for the complete table. 28 In fact, 12 out of the 16 groups are within a 25 percent interval of the mean. Note that most of the exceptions are the richest municipalities in rich states, given the fact that they make up a very small

Decentralized Service Delivery for the Poor 199
Table 17. Average FISM Resources per Poor (below poverty line) across Groups of Municipalities and States, in real terms (1998 and 2004)
I(poorest municip.)
II III IV(richest
municip.)
Total
1998 I - 8 poorest states 700.3 765.9 823.3 762.7 746.2II 1,072.8 1,209.3 873.6 679.8 1,083.0III 1,086.4 806.5 618.7 559.0 969.7IV - 8 richest states 2,373.5 1,733.7 1,047.6 901.4 2,233.3Total 1,161.7 898.6 821.9 719.1 1,025.8
2004 I - 8 poorest states 1,343.4 1,391.3 1,412.9 1,071.4 1,359.3II 1,262.7 1,400.9 1,022.3 632.6 1,263.2III 1,161.7 779.4 568.6 400.3 1,003.3IV - 8 richest states 2,031.8 1,168.1 702.2 593.6 1,863.8
Total Total 1,428.1 1,307.2 1,275.2 856.3 1,351.3
FISM funds per poor by income [Szekely's def.](2004 MX$)
Source: Authors’ calculations. Annex 2 shows the same table for all the years.
Table 18. Average FISM Resources per Structural Poor (without access to services) across Groups of Municipalities and States, in real terms (1998 and
2004)
I(poorest municip.)
II III IV(richest
municip.)
Total
1998 I - 8 poorest states 1,571.1 2,254.1 3,047.4 2,865.4 2,109.2II 2,182.1 3,574.9 3,492.8 3,584.9 2,778.1III 3,168.3 4,248.7 4,271.7 8,646.3 3,775.8IV - 8 richest states 3,154.3 4,080.3 5,285.1 14,436.2 3,552.3Total 2,287.8 2,824.3 3,266.8 4,906.9 2,668.5
2004 I - 8 poorest states 3,062.8 4,235.8 5,135.8 3,965.7 3,852.2II 2,641.3 4,074.7 3,878.8 3,330.3 3,227.3III 2,993.9 4,316.3 4,121.2 7,158.5 3,586.9IV - 8 richest states 2,794.8 2,961.3 3,388.9 9,299.0 2,981.6
Total Total 2,926.4 4,151.7 4,833.3 4,966.0 3,597.3
FISM funds per structural poor (2004 MX$)
FISM Contribution to Infrastructure Investment
FISM contributed significantly to increasing basic infrastructure through funding public works in poor municipalities. The following Figure 5 shows the (weighed) percentage spent by the municipalities in public works by group of municipalities classified by their marginality ranking. It highlights some interesting results. The percentage of the expenditure allocated in the end of the 80s was fairly high. More specifically, for the poorest municipalities, around 30 percent of municipal income was spent in public works; this is in comparison to only 21 and 23 percent in the other two groups of municipalities. All groups reported significant reduction in these expenditures around the time of the Tequila crisis, reaching the lowest level around 1995 proportion of structural poor (for example, the ratio was 0.4% for the richest municipalities [see Annex 3]) may overstate the funds per poor for the group.

Decentralized Service Delivery for the Poor 200
with shares between 13 and 17 percent of the total expenditure. There were no significant increases in this share until 1998 when the decentralization reform took place, after which all the groups reported significant increase in the share of their expenditure allocated to public works. In fact, by 2000, most of the groups returned to their pre‐crisis level of expenditure. More remarkably, the poorest municipalities, where FISM represent an important part of revenues, have the highest share of expenditures in public works in the last 15 years. Note that for recent years, FISM funds represent 70 percent of the total amount spent in public works for the poorest group of municipalities, while for the richest group, FISM transfers represent about 30 percent of these investments.
Figure 5. Average Percentage Spent in Public Works Avg Percentage Spent in Public Works
10%
15%
20%
25%
30%
35%
1989 1990 1991 1992 1993 1994 1995 1996 1997 1998 1999 2000 2001 2002 2003
I - Poorest municipalitiesIIIIIIV - Richest municipalities
Table 19 below presents the allocations per FISM investment category for an average municipality as well as for the total funds distributed to the municipalities for the years 1999, 2001, and 2003. The table indicates that in 2003 45 percent of the funds are allocated in water and sanitation, electricity and roads. This is followed by 26 percent spent in municipal urbanization and 29 percent in other categories that include basic health and education infrastructure as well as housing. Changes in shares across time were not remarkable. While the water and sanitation sectors shares increased by 1.4 percentage points and rural roads category by 3.1 points, electrification’s share dropped by 1.2 points. Differences in allocations across groups of states and municipalities according to their marginality were not significant.
Municipal urbanization is one of the main areas of expenditures of FAIS resources. The last survey of municipal presidents provides some additional information on how the municipalities spent these resources. Of the total resources allocated in this category, 51 percent was spent in roads and sidewalks, 8.6 percent in
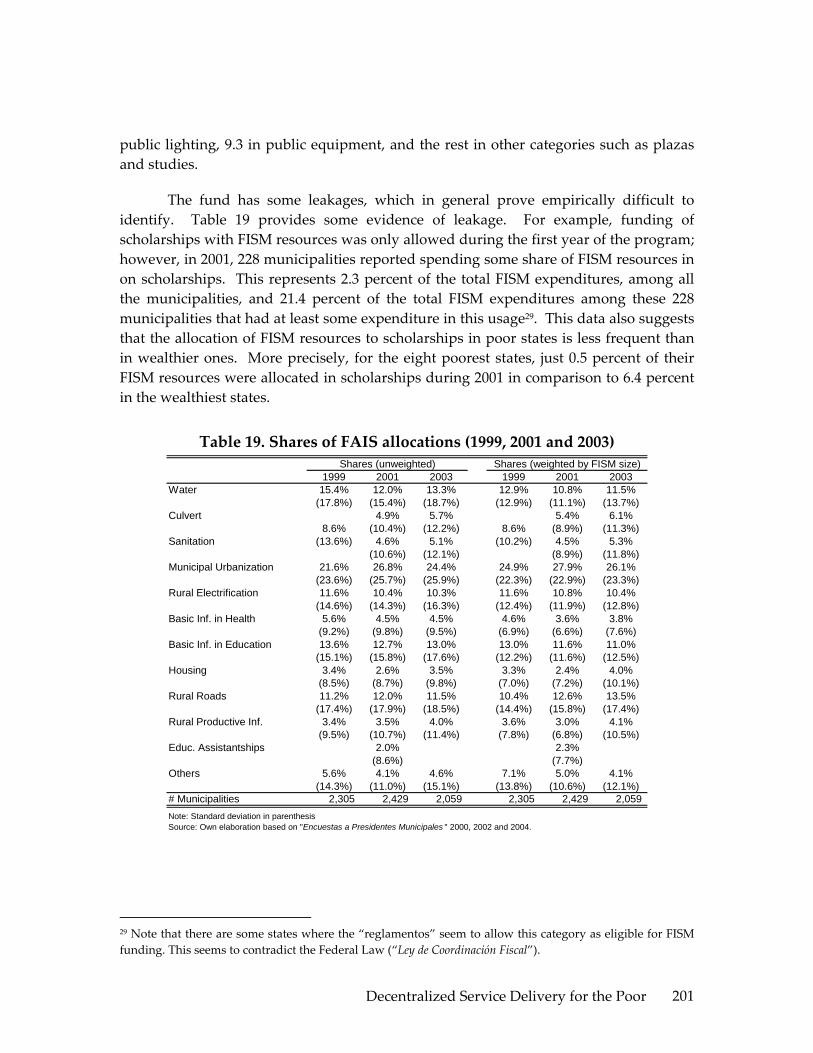
Decentralized Service Delivery for the Poor 201
public lighting, 9.3 in public equipment, and the rest in other categories such as plazas and studies.
The fund has some leakages, which in general prove empirically difficult to identify. Table 19 provides some evidence of leakage. For example, funding of scholarships with FISM resources was only allowed during the first year of the program; however, in 2001, 228 municipalities reported spending some share of FISM resources in on scholarships. This represents 2.3 percent of the total FISM expenditures, among all the municipalities, and 21.4 percent of the total FISM expenditures among these 228 municipalities that had at least some expenditure in this usage29. This data also suggests that the allocation of FISM resources to scholarships in poor states is less frequent than in wealthier ones. More precisely, for the eight poorest states, just 0.5 percent of their FISM resources were allocated in scholarships during 2001 in comparison to 6.4 percent in the wealthiest states.
Table 19. Shares of FAIS allocations (1999, 2001 and 2003)
1999 2001 2003 1999 2001 2003Water 15.4% 12.0% 13.3% 12.9% 10.8% 11.5%
(17.8%) (15.4%) (18.7%) (12.9%) (11.1%) (13.7%)Culvert 4.9% 5.7% 5.4% 6.1%
8.6% (10.4%) (12.2%) 8.6% (8.9%) (11.3%)Sanitation (13.6%) 4.6% 5.1% (10.2%) 4.5% 5.3%
(10.6%) (12.1%) (8.9%) (11.8%)Municipal Urbanization 21.6% 26.8% 24.4% 24.9% 27.9% 26.1%
(23.6%) (25.7%) (25.9%) (22.3%) (22.9%) (23.3%)Rural Electrification 11.6% 10.4% 10.3% 11.6% 10.8% 10.4%
(14.6%) (14.3%) (16.3%) (12.4%) (11.9%) (12.8%)Basic Inf. in Health 5.6% 4.5% 4.5% 4.6% 3.6% 3.8%
(9.2%) (9.8%) (9.5%) (6.9%) (6.6%) (7.6%)Basic Inf. in Education 13.6% 12.7% 13.0% 13.0% 11.6% 11.0%
(15.1%) (15.8%) (17.6%) (12.2%) (11.6%) (12.5%)Housing 3.4% 2.6% 3.5% 3.3% 2.4% 4.0%
(8.5%) (8.7%) (9.8%) (7.0%) (7.2%) (10.1%)Rural Roads 11.2% 12.0% 11.5% 10.4% 12.6% 13.5%
(17.4%) (17.9%) (18.5%) (14.4%) (15.8%) (17.4%)Rural Productive Inf. 3.4% 3.5% 4.0% 3.6% 3.0% 4.1%
(9.5%) (10.7%) (11.4%) (7.8%) (6.8%) (10.5%)Educ. Assistantships 2.0% 2.3%
(8.6%) (7.7%)Others 5.6% 4.1% 4.6% 7.1% 5.0% 4.1%
(14.3%) (11.0%) (15.1%) (13.8%) (10.6%) (12.1%)# Municipalities 2,305 2,429 2,059 2,305 2,429 2,059
Shares (unweighted) Shares (weighted by FISM size)
Note: Standard deviation in parenthesisSource: Own elaboration based on "Encuestas a Presidentes Municipales " 2000, 2002 and 2004.
29 Note that there are some states where the “reglamentos” seem to allow this category as eligible for FISM funding. This seems to contradict the Federal Law (“Ley de Coordinación Fiscal”).

Decentralized Service Delivery for the Poor 202
Expenditure Correlation with Social Indicators
Municipalities with higher marginality spend relatively higher share of their FISM resources on water and rural roads than those municipalities with lower marginality scores. Table 20 shows the allocations to different categories of FISM expenditure by municipalities by their degree of marginality. While the poorest municipalities spent 16.6 percent of their resources in water projects during 1999, those with low marginality spent 12.2 percent during the same year. Similarly, expenditures in rural roads were 14.3 of the total FISM resources in poor municipalities in contrast to 6.5 percent in wealthier ones. Urbanization is still the category with higher shares, ranging between 21 and 30 percent, with high marginality municipalities spending toward the bottom of this range. Other categories such as sanitation, electrification and basic health and education infrastructure do not present significant differences across groups of municipalities. It is worth noting that that these shares are qualitatively similar in 1999 and 2003, implying that there is no clear trend in any of the categories.
Table 20. Shares of FAIS allocations by group of states (1999 and 2003)
I - PoorestStates
II III IV - RichestStates
I - PoorestStates
II III IV - RichestStates
Water 16.6% 15.3% 13.7% 12.2% 14.9% 12.9% 9.3% 11.0%Culvert 5.2% 6.4% 6.1% 6.7%Sanitation 5.4% 2.9% 5.9% 5.4%Municipal Urbanization 18.3% 24.6% 26.3% 25.9% 21.5% 30.1% 28.0% 26.4%Rural Electrification 12.3% 11.9% 8.8% 11.3% 10.8% 9.0% 9.9% 10.8%Basic Inf. in Health 6.3% 4.8% 4.4% 5.2% 4.8% 4.2% 4.1% 4.0%Basic Inf. in Education 13.3% 12.2% 13.6% 16.9% 13.7% 11.0% 12.4% 13.4%Housing 3.5% 2.7% 4.1% 3.3% 3.1% 3.7% 5.6% 2.7%Rural Roads 14.3% 8.9% 6.8% 6.5% 13.5% 11.5% 7.9% 6.3%Rural Productive Inf. 3.6% 4.3% 2.5% 2.9% 3.9% 3.3% 4.4% 4.9%Others 3.3% 7.6% 9.4% 7.7% 3.2% 5.1% 6.5% 8.3%# Municipalities 1,262 389 357 291 1,168 344 292 249
1999
Source: Own elaboration based on "Encuestas a Presidentes Municipales " 2000 and 2004.
2003
8.5% 7.7% 10.5% 8.0%
FAIS allocations in the water and electricity sectors are correlated with the lack of access to these services, however, correlations were not observed in sanitation. After evaluating the coefficients in the mean of the sample, it is worth pointing out that the responses to different levels in electricity coverage were somewhat remarkable. Table 21 presents the elasticities of coverage and FISM shares in each of the services. Hence, the coefficient will indicate the percentage change in FISM share within each sector as a response to a percentage change in coverage.30 More precisely, the table indicates that after controlling for the coverage in other sectors as well as in the income 30 Note that all the specification controls by income level for the corresponding year for each of the municipalities. Other specifications have been run and they all have had qualitatively similar results. Also, for each year and sector, two specifications are shown. The first specification contains only the levels of coverage in the sector that we are analyzing; while the second also includes coverage information in the other two segments.

Decentralized Service Delivery for the Poor 203
of the municipality, water elasticities are significantly negative with coefficients between ‐0.13 and ‐0.26. This implies that municipalities with 1 percent higher water coverage, will reduce their share of FISM on water investments by 0.23‐0.26 percent. However, a 10 percent change in coverage implies a reduction of only 0.12 to 0.24 percentage points31 in FISM allocations in this sector. Results in the sanitations sector present mixed interpretations. On one hand, when only the sanitation coverage is included, the elasticity becomes significantly positive, implying that those with higher coverage spent more resources in this sector. However, when we control for the coverage in the other two sectors (water and electricity), the elasticities lose significance. Electricity estimates were analogous to those for the water sector. Table 21 suggests one percent additional electricity coverage, results in a 0.41 go 0.84 percentage reduction in sector allocations. Similarly to the water sector, municipalities with 10 percent more electricity coverage, reduce FISM allocation to electricity investments by 0.41 to 0.85 percent.
31 These estimates were calculated using the range described and the average water coverage for the municipalities in the eight poorest municipalities, 73.3% (See Annex 3) and the average allocation in the sector funded by FISM, 12.9% (see Table 19).

Decentralized Service Delivery for the Poor 204
Table 21. Elasticities of FISM Allocations with Respect to Services Coverage (1999, 2001 and 2003)
2000 2000 2002 2002 2004 2004Water Coverage - 2000 (log) -0.169** -0.207*** -0.023 -0.132* -0.148* -0.256***
(0.068) (0.075) (0.070) (0.076) (0.079) (0.088)Sanitation Coverage - 2000 (log) -0.263** -0.319*** -0.410***
(0.103) (0.107) (0.124)Electricity Coverage - 2000 (log) 0.265** 0.654*** 0.656***
(0.130) (0.139) (0.156)Constant 3.357*** 3.477*** 2.491*** 1.414** 3.049*** 2.352***
(0.297) (0.624) (0.305) (0.654) (0.344) (0.732)Observations 1663 1663 1485 1481 1477 1473
2000 2000 2002 2002 2004 2004Water Coverage - 2000 (log) 0.182* 0.020 0.242
(0.108) (0.151) (0.160)Sanitation Coverage - 2000 (log) 0.068 -0.165 0.516*** 0.168 0.567*** 0.329
(0.133) (0.141) (0.186) (0.206) (0.189) (0.215)Electricity Coverage - 2000 (log) 0.715*** 1.241*** 0.429
(0.206) (0.347) (0.303)Constant 2.015*** -0.980 -0.297 -4.462*** -0.390 -2.345**
(0.581) (0.862) (0.813) (1.320) (0.827) (1.180)Observations 1274 1265 768 758 842 833
2000 2000 2002 2002 2004 2004Water Coverage - 2000 (log) -0.271*** -0.007 0.097
(0.071) (0.077) (0.096)Sanitation Coverage - 2000 (log) -0.234** 0.085 -0.118
(0.108) (0.114) (0.144)Electricity Coverage - 2000 (log) -0.664*** -0.409*** -0.802*** -0.830*** -0.800*** -0.844***
(0.115) (0.127) (0.116) (0.130) (0.142) (0.160)Constant 5.485*** 6.545*** 5.992*** 5.776*** 5.849*** 6.133***
(0.516) (0.622) (0.517) (0.626) (0.635) (0.778)Observations 1463 1453 1281 1270 1255 1241
Share of FISM spent in Water (log)
Share of FISM spent in Sanitation (log)
Share of FISM spent in Electricity (log)
Source: Own elaboration using IM and INEGI data.Note: Standard errors in parentheses. * significant at 10%; ** significant at 5%; *** significant at 1%. All the specification were controlled by total income for the municipality for each year. Other specificationswere run with qualitatively similar results.
The following graphs illustrate the above results, using a simpler linear regression (Figure 6). The first graph indicates that changes are not so remarkable despite a negative slope when water coverage increases. In the case of sanitation, differences in expenditure across municipalities with different levels of sanitation coverage were not significant. Finally, the case of electricity suggests a better targeting of the resources according to the needs of the municipalities. We observe a significant reduction in the share of expenditures as coverage increases.

Decentralized Service Delivery for the Poor 205
Figure 6. Water, Electricity and Sanitation Relations Ship between Spending and Need
020
4060
8010
0S
hare
FIS
M a
lloca
ted
in W
ater
0 20 40 60 80 100Water coverage
Actual data Regression
Water
020
4060
8010
0S
hare
FIS
M a
lloca
ted
in S
anita
tion
20 40 60 80 100Sanitation coverage
Actual data Regression
Sanitation
020
4060
8010
0S
hare
FIS
M a
lloca
ted
in E
lect
ricity
0 20 40 60 80 100Electricity coverage
Actual data Regression
Electricity
Source: Own elaboration based on information of the Encuestas a Presidentes Municiaples and Census data. The parameters for the lines were calculated with an OLS regression of shares of FISM allocations on the level of coverage for each sector.
How efficiently FISM is targeted to infrastructure needs is unclear. While earlier evidence suggested that FISM contributed to increasing basic infrastructure assets (see paragraph 57), with an exception of electricity, the relationships between needs and allocation are weak. Recent coverage information is not available, precluding further analysis that could yield stronger conclusions on this issue. Small correlations between spending and coverage gaps suggest poor allocated efficiency. That is, even if funds were technically and efficiently used – which is unlikely given the limited monitoring and/or accountability – the impact of overall funding on more urgent basic infrastructure would be limited. Increases in coverage may still be observed without the presence of FISM contributions, considering that, for example, FAIS funded just 29 percent of water investments (see Table 5).
There are at least three main explanations for the lack of correlation between needs and allocations. First, there are other funds that target similar objectives.

Decentralized Service Delivery for the Poor 206
Municipality may receive sufficient resources from other programs for a particular infrastructure need, leading them to spend FISM funds on investments not covered by other programs. As we already mentioned, FISM contributes with 29 percent of investment in the water sector and only 5.5 of the investment in the electricity sector. Second, there are some political, technical, budgetary (e.g. resources transferred in 10 monthly payments) and institutional issues that make it difficult for municipalities to plan for larger expensive projects. Projects are funded at the municipal level and on one‐year cycles without allowing for jointly funded projects among more than one municipality. Finally, there limited accountability to beneficiaries or the federal government to motivate efficient spending (for further discussion on accountability, see paragraphs 29 above).
Beyond targeting of specific infrastructure gaps, geographic targeting of FISM resources within the municipalities points to greater per capita spending outside of the capital (cabecera), where there are also greater infrastructure needs. FISM is spent less in the municipal capital per capita than in the rest of the localities in the municipality. Table 22 indicates that an average municipality equally allocates FISM resources between the capital and the remaining localities. However, when population is considered, spending appears much more weighted to localities outside of the capital. Table 23 presents the poverty weighted (?) allocations per person using different measures of poverty for those in and outside the municipal capitals. Given the fact that the share of resources allocated in the capital is similar to that of the other localities, and that two out of three people live in the capitals,32 resources per capita is roughly three times higher outside the capital. More specifically, while resources per capita were MX$122 in the capitals in 2003, those in other localities received MX$359 in the same period. However, in general, other localities report higher poverty rates and lags in service coverage than in the capitals; therefore, the gap between the resources per poor will be smaller than the resources per capita. For instance, during 2003, FAIS allocated MX$270 for capital residents with less than two minimum wages, while distributing MX$461 for the same income group in other localities. However, when we estimate the average resource per structural poor we find higher allocation per capita in the capital.33 This may explained by the higher concentration with basics needs in other localities. It may also be explained by the fact that some investments in the capital actually benefit surrounding localities. This may be the case with infrastructure that builds or provides access to markets in which goods produced in other localities can be commercialized. Road infrastructure in the capital improving the localities with access to school and health facilities is another example.
32 Using information from CONAPO we estimated that 66.9% of the people live in the cabeceras. 33 These results are qualitatively consistent across time.
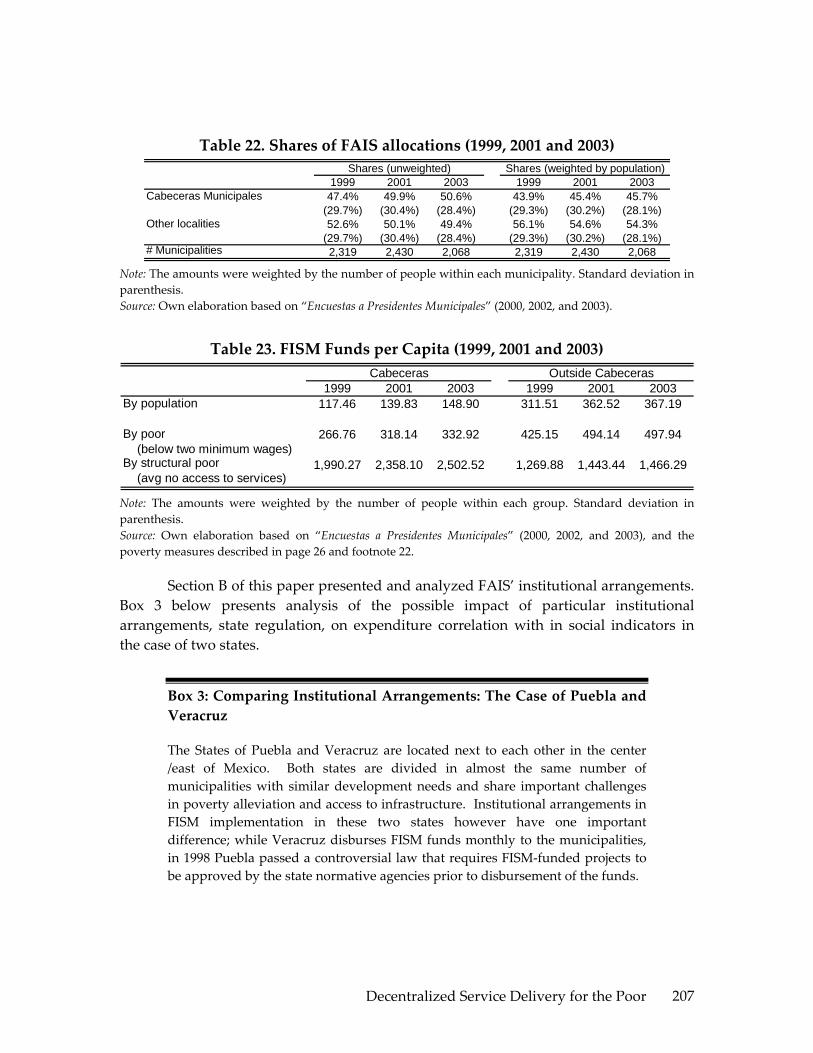
Decentralized Service Delivery for the Poor 207
Table 22. Shares of FAIS allocations (1999, 2001 and 2003)
1999 2001 2003 1999 2001 2003Cabeceras Municipales 47.4% 49.9% 50.6% 43.9% 45.4% 45.7%
(29.7%) (30.4%) (28.4%) (29.3%) (30.2%) (28.1%)Other localities 52.6% 50.1% 49.4% 56.1% 54.6% 54.3%
(29.7%) (30.4%) (28.4%) (29.3%) (30.2%) (28.1%)# Municipalities 2,319 2,430 2,068 2,319 2,430 2,068
Shares (unweighted) Shares (weighted by population)
Note: The amounts were weighted by the number of people within each municipality. Standard deviation in parenthesis. Source: Own elaboration based on “Encuestas a Presidentes Municipales” (2000, 2002, and 2003).
Table 23. FISM Funds per Capita (1999, 2001 and 2003)
1999 2001 2003 1999 2001 2003By population 117.46 139.83 148.90 311.51 362.52 367.19
By poor (below two minimum wages)
266.76 318.14 332.92 425.15 494.14 497.94
By structural poor (avg no access to services)
1,990.27 2,358.10 2,502.52 1,269.88 1,443.44 1,466.29
Cabeceras Outside Cabeceras
Note: The amounts were weighted by the number of people within each group. Standard deviation in parenthesis. Source: Own elaboration based on “Encuestas a Presidentes Municipales” (2000, 2002, and 2003), and the poverty measures described in page 26 and footnote 22.
Section B of this paper presented and analyzed FAIS’ institutional arrangements. Box 3 below presents analysis of the possible impact of particular institutional arrangements, state regulation, on expenditure correlation with in social indicators in the case of two states.
Box 3: Comparing Institutional Arrangements: The Case of Puebla and Veracruz
The States of Puebla and Veracruz are located next to each other in the center /east of Mexico. Both states are divided in almost the same number of municipalities with similar development needs and share important challenges in poverty alleviation and access to infrastructure. Institutional arrangements in FISM implementation in these two states however have one important difference; while Veracruz disburses FISM funds monthly to the municipalities, in 1998 Puebla passed a controversial law that requires FISM‐funded projects to be approved by the state normative agencies prior to disbursement of the funds.
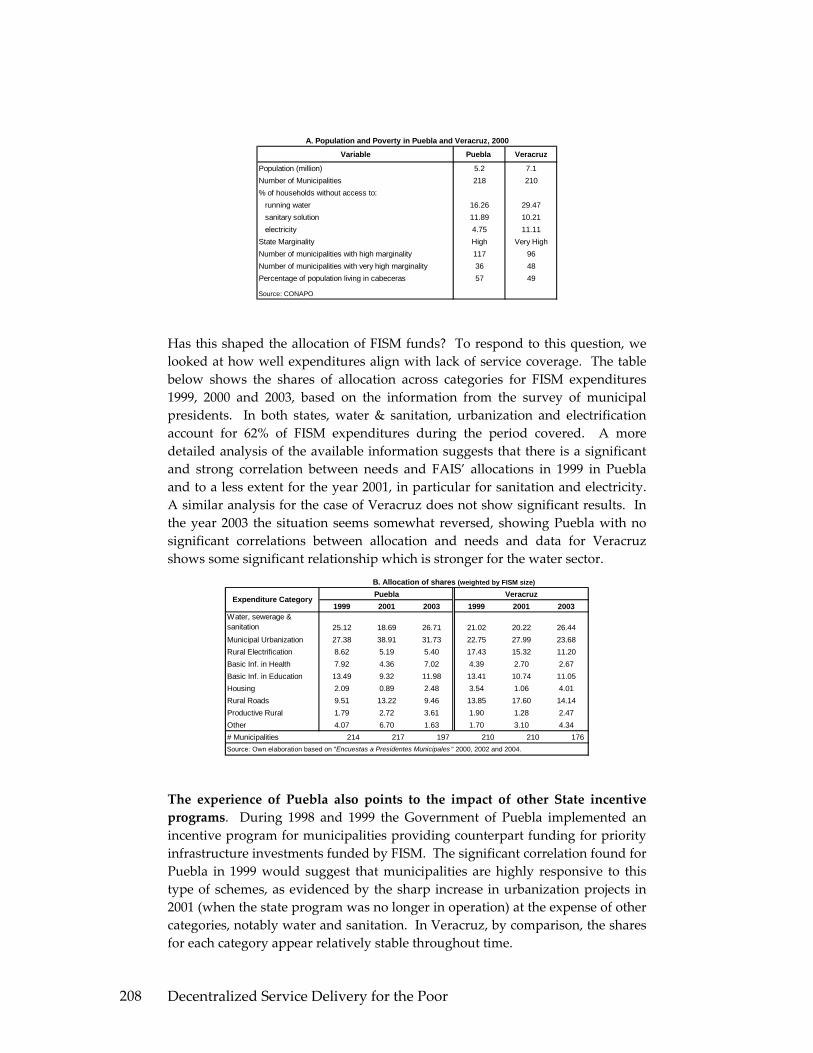
Decentralized Service Delivery for the Poor 208
Variable Puebla Veracruz
Population (million) 5.2 7.1Number of Municipalities 218 210% of households without access to: running water 16.26 29.47 sanitary solution 11.89 10.21 electricity 4.75 11.11State Marginality High Very HighNumber of municipalities with high marginality 117 96Number of municipalities with very high marginality 36 48Percentage of population living in cabeceras 57 49
Source: CONAPO
A. Population and Poverty in Puebla and Veracruz, 2000
Has this shaped the allocation of FISM funds? To respond to this question, we looked at how well expenditures align with lack of service coverage. The table below shows the shares of allocation across categories for FISM expenditures 1999, 2000 and 2003, based on the information from the survey of municipal presidents. In both states, water & sanitation, urbanization and electrification account for 62% of FISM expenditures during the period covered. A more detailed analysis of the available information suggests that there is a significant and strong correlation between needs and FAIS’ allocations in 1999 in Puebla and to a less extent for the year 2001, in particular for sanitation and electricity. A similar analysis for the case of Veracruz does not show significant results. In the year 2003 the situation seems somewhat reversed, showing Puebla with no significant correlations between allocation and needs and data for Veracruz shows some significant relationship which is stronger for the water sector.
1999 2001 2003 1999 2001 2003Water, sewerage & sanitation 25.12 18.69 26.71 21.02 20.22 26.44Municipal Urbanization 27.38 38.91 31.73 22.75 27.99 23.68Rural Electrification 8.62 5.19 5.40 17.43 15.32 11.20Basic Inf. in Health 7.92 4.36 7.02 4.39 2.70 2.67Basic Inf. in Education 13.49 9.32 11.98 13.41 10.74 11.05Housing 2.09 0.89 2.48 3.54 1.06 4.01Rural Roads 9.51 13.22 9.46 13.85 17.60 14.14Productive Rural 1.79 2.72 3.61 1.90 1.28 2.47Other 4.07 6.70 1.63 1.70 3.10 4.34# Municipalities 214 217 197 210 210 176 Source: Own elaboration based on "Encuestas a Presidentes Municipales " 2000, 2002 and 2004.
Expenditure Category
B. Allocation of shares (weighted by FISM size)
VeracruzPuebla
The experience of Puebla also points to the impact of other State incentive programs. During 1998 and 1999 the Government of Puebla implemented an incentive program for municipalities providing counterpart funding for priority infrastructure investments funded by FISM. The significant correlation found for Puebla in 1999 would suggest that municipalities are highly responsive to this type of schemes, as evidenced by the sharp increase in urbanization projects in 2001 (when the state program was no longer in operation) at the expense of other categories, notably water and sanitation. In Veracruz, by comparison, the shares for each category appear relatively stable throughout time.
Decentralized Service Delivery for the Poor 209
Overall, this brief analysis did not find conclusive evidence that allocation of FISM resources in relation to infrastructure needs responds to conditioning of fund transfers to municipalities from the state. The available information does not allow for an assessment on the quality of the projects funded by FISM where the state’s intervention may have some influence.
V. CONCLUSION AND RECOMMENDATIONS
Allocation of Funds
FAIS targeting to the poor presents significant improvements over previous programs. FAIS resources have been increasing remarkably across time as have the shares received by the poorest states. However, the distribution of funds is biased towards favoring the poorest states, while not necessarily benefiting the poorest municipalities across the country. After the period of transition during which the new distribution formula came into effect, municipalities in similar conditions of poverty should receive the same amount from FAIS because of the formula; the only differences should be due to the choice between the two formulas.
FAIS target’s infrastructure poor areas. Per capita FISM resources favor people in the poorest municipalities in particular those in poor states. However, the gap between, and, within municipalities has been converging to a similar amount per poor and 54 percent of FISM resources are spent outside the municipal cabecera, where there is typically a higher poverty rate. Two out of three people live in the capitals, while resources per capita are roughly three times higher outside the capitals. In general, other localities report higher poverty rates than the capitals, and they are behind in basic services coverage. As a result, the gap between the resources per poor in capital and other localities will be smaller than the resources per capita.
FAIS could improve the targeting of its resources toward key infrastructure deficits. FAIS allocations in the water and electricity sectors seem to be correlated with lack of access to these services, though no correlation was observed in sanitation. Greater allocative efficiency could be achieved through technical assistance from states to municipalities, as is the case of Puebla and Chiapas. Greater accountability to the federal level via mandatory report would be helpful. Even more important would be greater accountability to beneficiaries via transparency in revenues and expenditures and regular reporting.
Subproject Quality
The program needs clearer rules of the game. Multiple and often conflicting regulations from the federal and state level should be streamlined to reduce confusion,

Decentralized Service Delivery for the Poor 210
and provide clear guidance. Efforts to standardize regulations from the federal level are underway, but many states have existing reporting based on their own planning and budgeting systems and before implementing new systems the existing mechanisms should be reviewed. Streamlining the regulations and reporting across all states will require considerable consultation, consensus building and transition to be effective.
Technical assistance in identifying needs, programming, subproject execution, and evaluation is crucial, especially small, and poor municipalities where weak institutional capacity appears to be a significant barrier to implementing better projects and complying with regulations. Programs such as that of Chiapas and Puebla offer strong models for rolling out this technical assistance. The federal government has an important role to play in terms of analyzing and sharing these practices to allow states to develop their own models and learn from the experiences of others. Federal government could also provide simple and clear information to support states and municipalities in their planning process, sequencing of investments, efficiency of infrastructure spending, and identification of pro‐ poor investments.
Stronger accountability is needed both upward and downward through systematic evaluation of results, monitoring spending efficiency, and incorporating learning by doing. Reporting to the federal level is required by the Federal Coordination Law; however, information is scarce and inconsistent. Most municipalities report monthly to states and many of them through electronic systems; however, the reporting is not results focused nor is it used by states or the federal government to evaluate or benchmark municipal spending efficiency. There are wide variations in oversight arrangements, in general done by the state, however, without sufficient human capacity to thoroughly review investments. There is very limited access to information on spending and results to citizens.
States are playing a much larger role in FISM implementation than the one anticipated by the decentralization reform, by creating a middle layer of regulatory requirements which the municipalities follow, in the majority of cases even without real enforcement mandates from state governments. Although these are strictly speaking contrary to the original spirit of the 1998 reform, these mechanisms already in place can be used to improve the quality of the projects financed, align the projects with poverty alleviation objectives, increase capacity at local level, and promote greater downward accountability and systematic evaluation. Assuring the effectiveness of these regulations requires a comprehensive in depth evaluation of the institutional arrangements in the 31 states and their impact, reaching consensus with the different levels of government within each state on a set of standardized procedures that can generate sufficient information for a systematic project evaluation and benchmarking. States can use this information to create incentives for municipalities to improve those aspects that are impeding the accountability relationships to function properly, such as promoting better

Decentralized Service Delivery for the Poor 211
spending efficiency, incorporating participatory auditing mechanisms or same time sharing of information with state congresses. This may be through counterpart funding programs from state or through lessening the supervision requirements in those municipalities that improve their performance.
Over the long run, this upward accountability should be replaced by greater accountability to beneficiaries. This could be achieved through transparency, mechanisms for citizen voice in investment decision making, execution and monitoring and greater mayoral electoral accountability through re‐election and or longer terms in office. This could then support phasing out of the middle layer of regulation, leaving just a minimum set of upward information accountability to ensure transparency.

Decentralized Service Delivery for the Poor 212
ANNEX 1: FAIS’ TRANSFERS PER STATE. 1998-2004. MX$ (2004) 1998 1999 2000 2001 2002 2003 2004
Aguascalientes 190.42 147.00 78.86 88.40 88.88 89.62 88.99 Col % 1.26% 0.85% 0.44% 0.44% 0.40% 0.42% 0.41%Row index 1.00 0.77 0.41 0.46 0.47 0.47 0.47
Baja California 207.28 169.89 106.74 119.67 176.00 172.01 173.12 Col % 1.37% 0.99% 0.60% 0.60% 0.80% 0.80% 0.80%Row index 1.00 0.82 0.51 0.58 0.85 0.83 0.84
Baja California Sur 157.80 102.42 25.07 27.94 36.78 36.22 36.37 Col % 1.05% 0.60% 0.14% 0.14% 0.17% 0.17% 0.17%Row index 1.00 0.65 0.16 0.18 0.23 0.23 0.23
Campeche 274.08 261.20 217.40 243.71 228.54 226.34 226.69 Col % 1.82% 1.52% 1.22% 1.22% 1.04% 1.05% 1.05%Row index 1.00 0.95 0.79 0.89 0.83 0.83 0.83
Coahuila 257.13 238.04 189.40 212.21 190.45 191.06 190.11 Col % 1.70% 1.38% 1.06% 1.06% 0.87% 0.89% 0.88%Row index 1.00 0.93 0.74 0.83 0.74 0.74 0.74
Colima 169.32 118.22 44.02 49.32 57.46 57.79 57.46 Col % 1.12% 0.69% 0.25% 0.25% 0.26% 0.27% 0.27%Row index 1.00 0.70 0.26 0.29 0.34 0.34 0.34
Chiapas 1,254.48 1,598.26 1,839.80 2,062.25 2,743.66 2,652.90 2,685.12 Col % 8.31% 9.29% 10.29% 10.29% 12.49% 12.30% 12.39%Row index 1.00 1.27 1.47 1.64 2.19 2.11 2.14
Chihuahua 345.13 358.00 335.02 375.57 495.71 479.49 485.01 Col % 2.29% 2.08% 1.87% 1.87% 2.26% 2.22% 2.24%Row index 1.00 1.04 0.97 1.09 1.44 1.39 1.41
Durango 335.42 344.74 318.88 357.52 391.51 380.66 384.19 Col % 2.22% 2.00% 1.78% 1.78% 1.78% 1.77% 1.77%Row index 1.00 1.03 0.95 1.07 1.17 1.13 1.15
Guanajuato 770.12 937.70 1,038.19 1,163.96 1,204.42 1,177.89 1,185.81 Col % 5.10% 5.45% 5.80% 5.81% 5.48% 5.46% 5.47%Row index 1.00 1.22 1.35 1.51 1.56 1.53 1.54
Guerrero 1,148.93 1,454.34 1,665.07 1,866.59 1,882.81 1,817.45 1,840.65 Col % 7.61% 8.46% 9.31% 9.31% 8.57% 8.43% 8.49%Row index 1.00 1.27 1.45 1.62 1.64 1.58 1.60
Hidalgo 555.66 645.17 683.37 766.09 768.69 759.23 761.25 Col % 3.68% 3.75% 3.82% 3.82% 3.50% 3.52% 3.51%Row index 1.00 1.16 1.23 1.38 1.38 1.37 1.37
Jalisco 611.22 721.08 775.56 869.20 761.03 749.70 752.06 Col % 4.05% 4.19% 4.34% 4.34% 3.47% 3.48% 3.47%Row index 1.00 1.18 1.27 1.42 1.25 1.23 1.23
México 1,087.75 1,370.93 1,563.83 1,753.01 1,948.37 1,940.57 1,937.48 Col % 7.21% 7.97% 8.74% 8.74% 8.87% 9.00% 8.94%Row index 1.00 1.26 1.44 1.61 1.79 1.78 1.78
Michoacán 815.69 999.95 1,113.76 1,248.45 1,241.85 1,217.15 1,224.14 Col % 5.41% 5.81% 6.23% 6.23% 5.66% 5.64% 5.65%Row index 1.00 1.23 1.37 1.53 1.52 1.49 1.50
Morelos 253.79 233.35 183.65 205.89 271.22 271.36 270.41 Col % 1.68% 1.36% 1.03% 1.03% 1.24% 1.26% 1.25%Row index 1.00 0.92 0.72 0.81 1.07 1.07 1.07
Nayarit 238.50 212.87 158.71 177.96 202.05 199.02 199.66 Col % 1.58% 1.24% 0.89% 0.89% 0.92% 0.92% 0.92%Row index 1.00 0.89 0.67 0.75 0.85 0.83 0.84
[cont…]

Decentralized Service Delivery for the Poor 213
[…cont]
1998 1999 2000 2001 2002 2003 2004Nuevo León 328.56 335.50 307.51 344.88 228.54 226.45 226.50
Col % 2.18% 1.95% 1.72% 1.72% 1.04% 1.05% 1.05%Row index 1.00 1.02 0.94 1.05 0.70 0.69 0.69
Oaxaca 1,091.34 1,375.75 1,569.82 1,759.68 2,323.14 2,239.68 2,269.65 Col % 7.23% 8.00% 8.78% 8.78% 10.58% 10.39% 10.47%Row index 1.00 1.26 1.44 1.61 2.13 2.05 2.08
Puebla 1,086.34 1,369.19 1,561.63 1,750.71 1,866.83 1,838.50 1,845.48 Col % 7.20% 7.96% 8.73% 8.73% 8.50% 8.53% 8.52%Row index 1.00 1.26 1.44 1.61 1.72 1.69 1.70
Querétaro 317.79 320.64 289.54 324.53 321.14 315.33 316.90 Col % 2.11% 1.86% 1.62% 1.62% 1.46% 1.46% 1.46%Row index 1.00 1.01 0.91 1.02 1.01 0.99 1.00
Quintana Roo 225.39 194.66 136.94 153.47 168.23 166.25 166.59 Col % 1.49% 1.13% 0.77% 0.77% 0.77% 0.77% 0.77%Row index 1.00 0.86 0.61 0.68 0.75 0.74 0.74
San Luis Potosí 549.88 637.13 673.71 755.17 833.92 819.95 823.72 Col % 3.64% 3.70% 3.77% 3.77% 3.80% 3.80% 3.80%Row index 1.00 1.16 1.23 1.37 1.52 1.49 1.50
Sinaloa 307.80 307.25 273.27 306.48 385.49 383.91 383.29 Col % 2.04% 1.79% 1.53% 1.53% 1.76% 1.78% 1.77%Row index 1.00 1.00 0.89 1.00 1.25 1.25 1.25
Sonora 256.60 237.24 188.30 211.18 228.32 228.02 227.33 Col % 1.70% 1.38% 1.05% 1.05% 1.04% 1.06% 1.05%Row index 1.00 0.92 0.73 0.82 0.89 0.89 0.89
Tabasco 428.29 471.53 472.57 529.85 637.24 628.68 630.67 Col % 2.84% 2.74% 2.64% 2.64% 2.90% 2.92% 2.91%Row index 1.00 1.10 1.10 1.24 1.49 1.47 1.47
Tamaulipas 361.49 380.35 362.04 405.58 386.70 384.53 384.20 Col % 2.40% 2.21% 2.02% 2.02% 1.76% 1.78% 1.77%Row index 1.00 1.05 1.00 1.12 1.07 1.06 1.06
Tlaxcala 246.14 223.04 171.18 191.75 195.48 196.61 195.50 Col % 1.63% 1.30% 0.96% 0.96% 0.89% 0.91% 0.90%Row index 1.00 0.91 0.70 0.78 0.79 0.80 0.79
Veracruz 1,529.47 1,973.39 2,294.89 2,572.55 2,621.29 2,587.25 2,594.73 Col % 10.14% 11.47% 12.83% 12.83% 11.94% 12.00% 11.97%Row index 1.00 1.29 1.50 1.68 1.71 1.69 1.70
Yucatán 463.88 519.99 531.51 595.83 497.14 497.92 496.06 Col % 3.07% 3.02% 2.97% 2.97% 2.26% 2.31% 2.29%Row index 1.00 1.12 1.15 1.28 1.07 1.07 1.07
Zacatecas 372.57 395.48 380.38 426.50 460.14 448.92 452.51 Col % 2.47% 2.30% 2.13% 2.13% 2.10% 2.08% 2.09%Row index 1.00 1.06 1.02 1.14 1.24 1.20 1.21
Total 15,089.35 17,199.97 17,885.53 20,049.31 21,960.21 21,562.99 21,670.99 Col % 100.00% 100.00% 100.00% 100.00% 100.00% 100.00% 100.00%Row index 1.00 1.14 1.19 1.33 1.46 1.43 1.44
Source: Own elaboration based of official information.
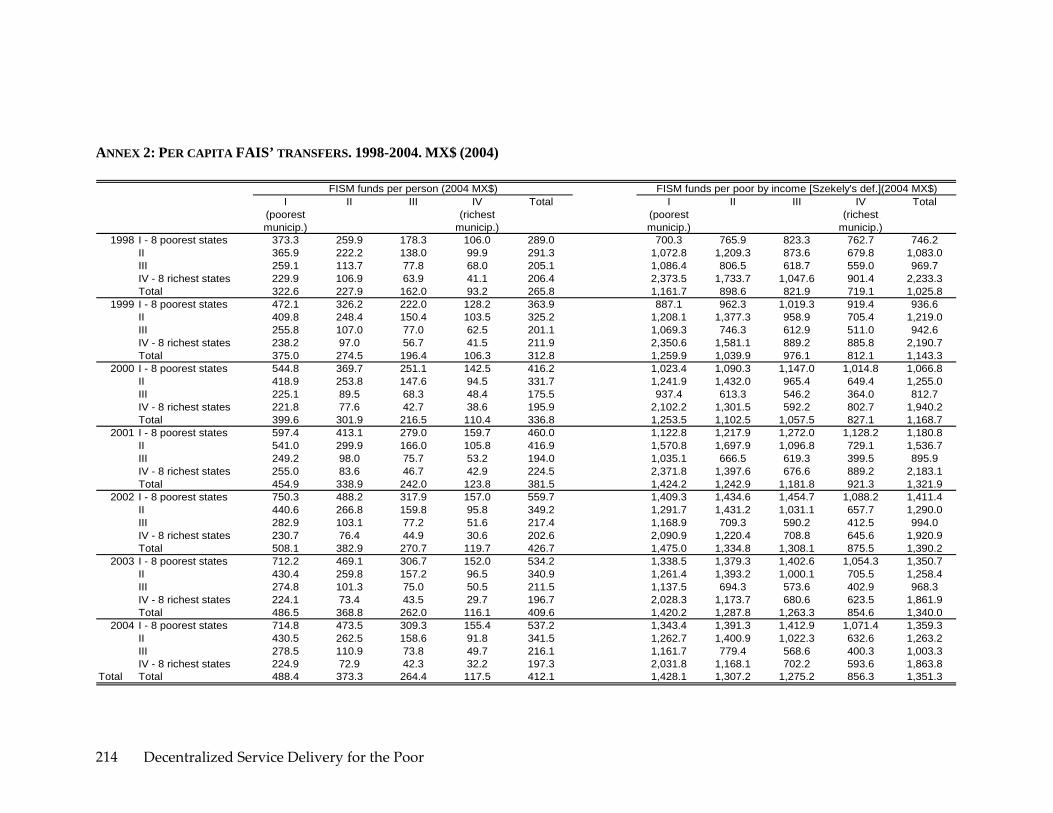
Decentralized Service Delivery for the Poor 214
ANNEX 2: PER CAPITA FAIS’ TRANSFERS. 1998-2004. MX$ (2004)
I(poorest municip.)
II III IV(richest
municip.)
Total I(poorest municip.)
II III IV(richest
municip.)
Total
1998 I - 8 poorest states 373.3 259.9 178.3 106.0 289.0 700.3 765.9 823.3 762.7 746.2II 365.9 222.2 138.0 99.9 291.3 1,072.8 1,209.3 873.6 679.8 1,083.0III 259.1 113.7 77.8 68.0 205.1 1,086.4 806.5 618.7 559.0 969.7IV - 8 richest states 229.9 106.9 63.9 41.1 206.4 2,373.5 1,733.7 1,047.6 901.4 2,233.3Total 322.6 227.9 162.0 93.2 265.8 1,161.7 898.6 821.9 719.1 1,025.8
1999 I - 8 poorest states 472.1 326.2 222.0 128.2 363.9 887.1 962.3 1,019.3 919.4 936.6II 409.8 248.4 150.4 103.5 325.2 1,208.1 1,377.3 958.9 705.4 1,219.0III 255.8 107.0 77.0 62.5 201.1 1,069.3 746.3 612.9 511.0 942.6IV - 8 richest states 238.2 97.0 56.7 41.5 211.9 2,350.6 1,581.1 889.2 885.8 2,190.7Total 375.0 274.5 196.4 106.3 312.8 1,259.9 1,039.9 976.1 812.1 1,143.3
2000 I - 8 poorest states 544.8 369.7 251.1 142.5 416.2 1,023.4 1,090.3 1,147.0 1,014.8 1,066.8II 418.9 253.8 147.6 94.5 331.7 1,241.9 1,432.0 965.4 649.4 1,255.0III 225.1 89.5 68.3 48.4 175.5 937.4 613.3 546.2 364.0 812.7IV - 8 richest states 221.8 77.6 42.7 38.6 195.9 2,102.2 1,301.5 592.2 802.7 1,940.2Total 399.6 301.9 216.5 110.4 336.8 1,253.5 1,102.5 1,057.5 827.1 1,168.7
2001 I - 8 poorest states 597.4 413.1 279.0 159.7 460.0 1,122.8 1,217.9 1,272.0 1,128.2 1,180.8II 541.0 299.9 166.0 105.8 416.9 1,570.8 1,697.9 1,096.8 729.1 1,536.7III 249.2 98.0 75.7 53.2 194.0 1,035.1 666.5 619.3 399.5 895.9IV - 8 richest states 255.0 83.6 46.7 42.9 224.5 2,371.8 1,397.6 676.6 889.2 2,183.1Total 454.9 338.9 242.0 123.8 381.5 1,424.2 1,242.9 1,181.8 921.3 1,321.9
2002 I - 8 poorest states 750.3 488.2 317.9 157.0 559.7 1,409.3 1,434.6 1,454.7 1,088.2 1,411.4II 440.6 266.8 159.8 95.8 349.2 1,291.7 1,431.2 1,031.1 657.7 1,290.0III 282.9 103.1 77.2 51.6 217.4 1,168.9 709.3 590.2 412.5 994.0IV - 8 richest states 230.7 76.4 44.9 30.6 202.6 2,090.9 1,220.4 708.8 645.6 1,920.9Total 508.1 382.9 270.7 119.7 426.7 1,475.0 1,334.8 1,308.1 875.5 1,390.2
2003 I - 8 poorest states 712.2 469.1 306.7 152.0 534.2 1,338.5 1,379.3 1,402.6 1,054.3 1,350.7II 430.4 259.8 157.2 96.5 340.9 1,261.4 1,393.2 1,000.1 705.5 1,258.4III 274.8 101.3 75.0 50.5 211.5 1,137.5 694.3 573.6 402.9 968.3IV - 8 richest states 224.1 73.4 43.5 29.7 196.7 2,028.3 1,173.7 680.6 623.5 1,861.9Total 486.5 368.8 262.0 116.1 409.6 1,420.2 1,287.8 1,263.3 854.6 1,340.0
2004 I - 8 poorest states 714.8 473.5 309.3 155.4 537.2 1,343.4 1,391.3 1,412.9 1,071.4 1,359.3II 430.5 262.5 158.6 91.8 341.5 1,262.7 1,400.9 1,022.3 632.6 1,263.2III 278.5 110.9 73.8 49.7 216.1 1,161.7 779.4 568.6 400.3 1,003.3IV - 8 richest states 224.9 72.9 42.3 32.2 197.3 2,031.8 1,168.1 702.2 593.6 1,863.8
Total Total 488.4 373.3 264.4 117.5 412.1 1,428.1 1,307.2 1,275.2 856.3 1,351.3
FISM funds per person (2004 MX$) FISM funds per poor by income [Szekely's def.](2004 MX$)

Decentralized Service Delivery for the Poor 215
ANNEX 3: PER CAPITA FAIS’ TRANSFERS. 1998-2004. MX$ (2004)
I(poorest municip.)
II III IV(richest
municip.)
Total I(poorest municip.)
II III IV(richest
municip.)
Total
1998 I - 8 poorest states 421.7 318.2 260.1 206.8 348.7 1,571.1 2,254.1 3,047.4 2,865.4 2,109.2II 465.4 339.0 257.7 254.6 399.6 2,182.1 3,574.9 3,492.8 3,584.9 2,778.1III 373.1 223.2 191.0 187.2 318.3 3,168.3 4,248.7 4,271.7 8,646.3 3,775.8IV - 8 richest states 385.5 308.0 250.8 170.8 368.0 3,154.3 4,080.3 5,285.1 14,436.2 3,552.3Total 412.8 309.4 254.5 205.3 354.5 2,287.8 2,824.3 3,266.8 4,906.9 2,668.5
1999 I - 8 poorest states 533.4 399.1 323.5 250.5 438.5 1,990.5 2,845.2 3,816.5 3,519.9 2,656.5II 521.8 378.8 281.8 262.7 446.0 2,478.9 4,099.7 3,794.3 3,694.7 3,138.7III 368.5 210.0 189.4 171.3 311.3 2,955.7 4,067.8 5,453.9 7,533.8 3,588.5IV - 8 richest states 396.7 278.4 219.2 170.6 372.8 3,106.2 3,754.3 4,771.4 14,976.7 3,469.2Total 473.4 366.0 304.8 230.1 411.3 2,474.2 3,259.0 3,960.1 5,106.9 2,987.8
2000 I - 8 poorest states 615.1 452.0 365.4 278.9 501.0 2,306.0 3,235.8 4,342.6 3,915.4 3,037.0II 534.2 388.0 278.7 238.9 455.1 2,571.2 4,280.4 3,798.2 3,377.9 3,238.7III 324.6 175.6 165.9 130.1 270.8 2,396.9 3,458.6 3,948.2 7,363.5 2,996.6IV - 8 richest states 367.9 222.5 156.0 157.1 340.3 2,795.4 3,065.8 3,695.4 14,157.7 3,082.1Total 497.7 396.2 332.0 234.6 436.9 2,462.5 3,432.6 4,213.3 5,253.8 3,069.4
2001 I - 8 poorest states 674.9 504.9 405.2 312.3 553.9 2,512.7 3,626.9 4,838.7 4,311.1 3,362.8II 702.7 458.9 316.6 267.8 576.6 3,219.9 5,052.3 4,260.0 3,787.6 3,898.6III 358.7 192.0 185.5 142.9 298.8 2,649.2 3,788.3 4,374.6 8,129.0 3,302.8IV - 8 richest states 421.6 238.6 176.2 174.5 388.0 3,307.6 3,375.6 4,043.3 15,766.9 3,585.5Total 569.9 445.1 370.7 262.5 496.4 2,811.8 3,876.1 4,697.5 5,792.3 3,469.5
2002 I - 8 poorest states 845.0 594.7 459.5 313.4 668.9 3,207.0 4,374.2 5,292.6 4,054.4 3,993.9II 568.4 409.9 304.6 244.5 484.0 2,697.9 4,163.1 3,881.3 3,474.5 3,286.3III 405.5 202.0 190.5 139.5 332.1 2,916.9 3,935.3 4,288.9 7,214.3 3,459.4IV - 8 richest states 379.3 217.6 177.2 124.9 348.8 2,822.1 3,096.4 3,466.7 10,618.7 3,029.7Total 624.0 496.3 410.6 256.4 545.5 2,990.2 4,215.7 4,961.7 5,095.5 3,670.4
2003 I - 8 poorest states 802.0 571.6 443.1 302.6 638.8 3,048.7 4,201.3 5,077.1 3,947.8 3,823.5II 554.6 398.8 298.1 242.1 472.0 2,637.4 4,058.2 3,842.0 3,347.5 3,211.7III 394.0 198.4 184.9 136.2 323.2 2,853.1 3,876.7 4,175.5 7,108.8 3,392.0IV - 8 richest states 368.5 208.8 170.9 121.0 338.5 2,788.0 2,976.3 3,363.4 10,354.5 2,978.6Total 598.2 478.3 397.0 248.5 524.2 2,890.7 4,071.5 4,786.0 4,960.3 3,547.3
2004 I - 8 poorest states 804.8 577.0 446.2 309.0 642.5 3,062.8 4,235.8 5,135.8 3,965.7 3,852.2II 554.7 402.9 301.8 234.3 473.2 2,641.3 4,074.7 3,878.8 3,330.3 3,227.3III 399.9 214.1 180.9 134.8 330.5 2,993.9 4,316.3 4,121.2 7,158.5 3,586.9IV - 8 richest states 369.5 207.3 165.2 130.7 339.1 2,794.8 2,961.3 3,388.9 9,299.0 2,981.6
Total Total 600.7 484.4 399.7 251.3 527.7 2,926.4 4,151.7 4,833.3 4,966.0 3,597.3
FISM funds per structural poor (2004 MX$)FISM funds per poor by income [2 min wages] (2004 MX$)

Decentralized Service Delivery for the Poor 216
ANNEX 4: PER CAPITA FAIS’ TRANSFERS. 1998-2004. MX$ (2004)
I(poorest municip.)
II III IV(richest
municip.)
Total
1998 I - 8 poorest states 1,004.6 1,432.0 2,146.9 1,818.8 1,379.8II 1,215.6 1,877.9 2,011.4 2,337.6 1,529.8III 1,939.9 2,728.5 2,787.1 5,968.6 2,387.0IV - 8 richest states 2,035.6 2,713.3 3,365.3 8,449.3 2,283.8Total 1,418.1 1,729.2 2,207.5 3,180.8 1,676.3
1999 I - 8 poorest states 1,272.6 1,808.9 2,695.8 2,242.8 1,739.8II 1,378.4 2,136.0 2,203.2 2,394.8 1,722.2III 1,806.0 2,592.5 3,553.2 5,198.0 2,260.2IV - 8 richest states 2,010.1 2,478.1 3,029.7 8,731.8 2,230.2Total 1,534.3 1,993.3 2,694.0 3,290.8 1,880.3
2000 I - 8 poorest states 1,472.8 2,059.3 3,075.2 2,503.2 1,990.3II 1,426.9 2,225.2 2,197.6 2,174.2 1,770.3III 1,459.4 2,193.8 2,582.5 4,896.4 1,876.8IV - 8 richest states 1,807.7 2,007.5 2,396.2 8,230.2 1,977.7Total 1,526.1 2,100.6 2,892.0 3,350.4 1,934.8
2001 I - 8 poorest states 1,607.1 2,305.7 3,431.6 2,755.2 2,205.3II 1,775.5 2,581.7 2,484.8 2,436.3 2,112.6III 1,614.1 2,395.5 2,901.8 5,402.7 2,069.1IV - 8 richest states 2,126.4 2,219.4 2,554.6 9,166.3 2,290.3Total 1,735.8 2,358.0 3,232.4 3,692.1 2,179.0
2002 I - 8 poorest states 2,044.6 2,800.4 3,536.9 2,600.5 2,583.6II 1,527.9 2,237.3 2,251.5 2,243.9 1,838.5III 1,792.6 2,483.8 2,819.7 4,860.0 2,173.9IV - 8 richest states 1,834.5 2,039.2 2,182.1 6,209.9 1,956.9Total 1,867.7 2,630.0 3,262.9 3,283.2 2,319.5
2003 I - 8 poorest states 1,943.0 2,689.3 3,394.6 2,532.3 2,473.4II 1,493.4 2,182.0 2,230.5 2,112.6 1,796.4III 1,752.2 2,447.5 2,746.2 4,786.9 2,130.9IV - 8 richest states 1,812.9 1,961.8 2,114.5 6,053.3 1,924.5Total 1,804.6 2,539.0 3,148.3 3,190.6 2,240.7
2004 I - 8 poorest states 1,951.1 2,714.9 3,439.8 2,541.0 2,493.8II 1,495.9 2,192.9 2,247.7 2,141.4 1,805.7III 1,841.3 2,731.6 2,714.1 4,810.9 2,255.7IV - 8 richest states 1,817.4 1,952.3 2,080.5 5,500.6 1,926.5
Total Total 1,827.0 2,592.0 3,181.6 3,198.1 2,273.7
FISM funds per structural(2) poor (2004 MX$)
Note: This table uses a variation of the previous definition of structural poor. In this case, we defined as the percentage of structural poor using the maximum proportion of people without access to any of these three basic services.

Decentralized Service Delivery for the Poor 217
ANNEX 5: ACCESS TO BASIC SERVICES AND STRUCTURAL POVERTY DEFINITION (2000)
I(poorest municip.)
II III IV(richest
municip.)
Total
I - 8 poorest states% population without water 38.2% 19.9% 15.2% 7.8% 26.7%% population without sewerage 27.3% 20.6% 11.2% 4.6% 21.3%% population without electricity 21.1% 8.2% 4.6% 2.3% 13.0%% structural poor 28.9% 16.5% 10.4% 4.9% 20.4%# municipalities 578 459 213 60 1,310
II% population without water 15.0% 7.6% 4.9% 3.2% 11.4%% population without sewerage 36.1% 14.0% 7.5% 4.4% 25.5%% population without electricity 9.5% 3.3% 2.1% 1.4% 6.6%% structural poor 20.2% 8.3% 4.8% 3.0% 14.5%# municipalities 223 119 42 10 394
III% population without water 11.8% 3.8% 2.4% 2.3% 8.9%% population without sewerage 19.3% 4.1% 2.4% 1.1% 13.9%% population without electricity 7.2% 2.1% 2.0% 1.0% 5.4%% structural poor 12.8% 3.3% 2.2% 1.5% 9.4%# municipalities 254 88 21 21 384
IV - 8 richest states% population without water 11.7% 4.7% 2.6% 0.5% 10.3%% population without sewerage 13.8% 3.0% 1.3% 0.4% 11.8%% population without electricity 9.3% 2.0% 0.9% 0.2% 8.0%% structural poor 11.6% 3.2% 1.6% 0.4% 10.1%# municipalities 248 37 8 6 299
Total% population without water 24.1% 15.0% 12.4% 5.7% 19.3%% population without sewerage 24.7% 16.6% 9.7% 3.6% 19.6%% population without electricity 14.2% 6.3% 3.9% 1.8% 10.1%% structural poor 21.0% 12.8% 8.7% 3.7% 16.4%# municipalities 1,303 703 284 97 2,387
Note: We defined structural poor as the average proportion of people with access to water, sanitation and/or electricity.

Decentralized Service Delivery for the Poor 218
ANNEX 6
Source of income per municipality by group (1998) Source of income per municipality ‐ Avg % (1998)
I Poorest
municipalities
II III IV Richest
Municipalities
Whole Sample
Own Revenues 2.7% 8.8% 14.2% 17.0% 11.2% Rights 1.8% 5.0% 6.6% 9.1% 5.9% Participaciones 63.7% 55.4% 48.4% 40.9% 51.3% Aportaciones 15.7% 12.1% 9.4% 7.4% 10.9% Others 16.1% 18.7% 21.5% 25.6% 20.8% Total 100.0% 100.0% 100.0% 100.0% 100.0% Average Income 7.4M 20.0M 101.8M 306.2M 22.02M Total Pop. (1998)* 23.6M 23.8M 21.3M 18.8M 87.5M # Municipalities 1456 649 126 46 2277
Note: Population is the projection for each year and municipality published by CONAPO. Only those municipalities with financial information were considered.
Source of income per municipality by group (2003) Source of income per municipality ‐ Avg % (2003)
I Poorest
municipalities
II III IV Richest
Municipalities
Whole Sample
Own Revenues 1.6% 7.5% 12.9% 18.0% 9.8% Rights 1.3% 5.4% 7.2% 8.3% 5.5% Participaciones 35.8% 39.7% 37.1% 33.5% 36.5% Aportaciones 50.0% 32.7% 22.7% 18.4% 31.4% Others 11.3% 14.8% 20.0% 21.8% 16.8% Total 100.0% 100.0% 100.0% 100.0% 100.0% Average Income 22.9M 49.4M 264.4M 706.7M 55.9M Total Pop.(2003)* 25.9M 25.9M 23.2M 20.3M 95.4M # Municipalities 1581 672 128 46 2427
Note: Population is the projection for each year and municipality published by CONAPO. Only those municipalities with financial information were considered.

Decentralized Service Delivery for the Poor 219
ANNEX 7: SOURCES USED IN THIS REPORT FOR TABLE 10.
Aguascalientes:
o Secretaría de Planeación, Guía Operativa del Fondo para la Infraestructura Social Municipal 1998‐2004
Chiapas:
o Poder Ejecutivo del Estado de Chiapas, Acuerdo por el que se emite el Manual de Operación del Ramo 33, Fondos III “FISM” y IV “FAFM”, para el ejercicio 2005, 200
Coahuila:
o Congreso del Estado Independiente, Libre y Soberano de Coahuila de Zaragoza, Ley que establece las bases y los lineamientos generales para la recepción de las aportaciones federales, y la creación distribución, aplicación y seguimiento de esos recursos en “Los fondos estatales para el desarrollo social en Coahuila”, 1998,2003
o Congreso del Estado Independiente, Libre y Soberano de Coahuila de Zaragoza, Ley para la distribución de Participaciones y Aportaciones Federales a los Municipios del Estado de Coahuila, 2002
Estado de México:
o Gaceta del Gobierno, Acuerdo por el que se da a conocer la fórmula, metodología, distribución y calendario, de las asignaciones por municipio que corresponden al Fondo para la Infraestructura Social Municipal, para el Ejercicio fiscal del Año 2004, Enero 2004
o Gaceta del Gobierno, Manual de Operación de los Fondos para la Infraestructura Social Municipal y de aportaciones para le Fortalecimiento de los Municipios y de las Demarcaciones Territoriales del Distrito Federal para los ejercicios fiscales del ano 2004 a 2006, Enero 2004
Guanajuato:
o Periódico Oficial del Estado de Guanajuato, Ley para el Ejercicio y Control de los Recursos Públicos para el Estado y los Municipios de Guanajuato, 2003
o Secretaria de Desarrollo Social y Humano, Reglas de Operación del Programa de Apoyo para la Infraestructura Social para el Ejercicio Fiscal 2005
Guerrero:

Decentralized Service Delivery for the Poor 220
o Comité de Planeación para el Desarrollo del Estado de Guerrero, Manual Unico de Operación, 2005
Puebla:
o Periódico Oficial del Estado de Puebla, Ley para el Federalismo Hacendario del Estado de Puebla, Febrero 2000
o Secretaría de Desarrollo Social, Secretaría de Desarrollo, Evaluación y Control de la Administración Pública, Organo de Fiscalización Superior del Estado de Puebla, Reglas de Operación de los Fondos Municipales del Ramo 33, 2005
o Ley del Organo de Fiscalización Superior del Estado de Puebla,
Veracruz:
o Organo de Fiscalización Superior del Estado de Veracruz, Manual del Ramo 033 FISM y FAM”, 2000
Zacactecas:
o Secretaría de Planeación y Desarrollo Regional, Guía para la Opearción de los Fondos III y IV del Ramo General 33, 2005

Decentralized Service Delivery for the Poor 221
REFERENCES
Calderón, Cesar and Luis Servén (2004) “Trends in Infrastructure in Latin America, 1980‐2001.” Policy Research Working Paper Series 3401. World Bank, Washington D.C. Processed.
Cámara de Diputados del H Congreso de la Unión, Ley de Fiscalización Superior de la Federación, Diciembre 2000
Diario Oficial de la Federación, Ley de Coordinación Fiscal, 1978, última modificación 2005.
Estache, A. and Ana Goicoechea (2005) “A ‘Research’ Database on Infrastructure Economic Performance,” Working Papers Series # 3646, The World Bank.
Lopez‐Calva, Luis, Alvaro Melendez Martinez, Ericka Rascon Ramirez, Lourdes Rodriguez‐Chamussy, and Miguel Szekely Pardo (2005), “Poniendo al Ingreso de los Hogares en el Mapa de Mexico”. Unpublished manuscript.
Milanovic, B. (2002), ʺWorlds Apart: Inter‐National and World Inequality 1950‐2000.ʺ Washington, DC: The World Bank.
Scott, John (2004a), “Decentralization, Social Spending and Poverty in Mexico.” Gestión y Política Pública, Vol XIII, Nro 3, 2nd semester, 2004.
——— (2004b), “Eficiencia redestributiva de los programas contra la pobreza en Mexico,” Documento de Trabajo Bro307, División de Economía, CIDE, November 2004.
Secretaría de la Función Pública, Programa de Contraloría Social en el Fondo de Aportaciones para la Infraestructura Social
SEDESOL (2004), “Encuesta Nacional de Gobiernos Municipales”
SEDESOL (2005) “Fondo de Aportaciones para la Infraestructura Social: Información para Funcionarios Municipales”, Diciembre 2005.
Szekely Pardo, Miguel, Luis Lopez‐Calva, Alvaro Melendez Martinez, Ericka Rascon Ramirez, and Lourdes Rodriguez‐Chamussy (2005), “Poniendo a la Pobreza de Ingresos y a la Desigualdad en el Mapa de Mexico”. Unpublished manuscript.
World Bank (2004a), “Poverty in Mexico: An assessment of conditions, trends and government strategy”. Report No 28612‐ME
——— (2004b). “World Development Report: Making Services Work for the Poor.” Washington, D.C., The World Bank, Oxford University Press.

Decentralized Service Delivery for the Poor 222
——— (2005), “Mexico: Infrastructure Public Expenditure review (IPER)”, report No. 33483‐MX.
——— (2006), “Background Notes on Expenditure Decentralization and Poverty Alleviation in Mexico”, The World Bank.
World Development Indicators (2005), World Bank, Washington D.C.
World Economic Forum (2004), World Economic Survey.

Decentralized Service Delivery for the Poor 223
MEXICO: DECENTRALIZATION OF RURAL DEVELOPMENT PROGRAMS
José María Caballero1
EXECUTIVE SUMMARY
Poverty incidence is high in the rural areas of Mexico. The incidence, characteristics, and dynamics of Mexican rural poverty were examined in a study carried out by the World Bank in 2005 of which the present report can be considered an expansion. Particular attention is given in this report to the relation between decentralization and production‐oriented rural development (RD) programs, in the understanding that further decentralization would result in better programs and these would in turn help revitalize the rural economy and reduce rural poverty.
Federal spending in rural areas in Mexico is very large, with a budget estimate for 2005 of the order of USD 14 billion or approximately USD 560 per head of rural population. Of this total, some USD 4.5 billion, equivalent to an annual investment of around USD 800 per rural family, corresponds to productive programs. Most of these programs are oriented to low income sectors but we do not know the proportion of resources that is actually targeted. The impact, however, on the rural economy of this massive expenditure effort is not evident. Contrary to the situation in other countries in Latin America, in Mexico the main problem is not the shortage of fiscal resources devoted to rural areas, but the efficiency in the use of those resources.
One element of inefficiency is the multiplicity of programs and the lack of coordination and harmonization among them. Thus, in the Programa Especial Concurrente for 2005 there are some 267 federal RD programs, many of which have their own subprograms. Many of these programs are duplicative. Programa Especial Concurrente was introduced in 2003 as an instrument for bringing more coordination and joint action (concurrencia) to rural programs, and is a step forward in this direction. So far, however, it has only been used as a formal accounting tool, not to carry out effective
1 The report was prepared by José María Caballero (Lead Agricultural Economist, LCSER) with the assistance of Carlos Moreno (consultant) and George Dyer (consultant). The report is part of the Third Phase of the “Mexico: Programmatic Poverty Work”, which is being carried out by the World Bank in collaboration with the Government of Mexico. The report benefited from comments by Armado Ríos Piter, Secretary of Agriculture of the State of Guerrero. We want to express our most sincere gratitude to all of those who helped us organize and carry out our field work in the states of Guerrero, Jalisco and Veracruz, and to the many government officers and other actors at the federal and state level who patiently answered our questions. We are also grateful to SAGARPA for the provision of quantitative information on Alianza and the Programa Especial Concurrente, and to the FAO Alianza evaluation project for making available to us their data base.

Decentralized Service Delivery for the Poor 224
coordination. Proliferation and lack of coordination of RD programs is a critical problem standing on the way of effective public spending in rural areas. Each federal program has its own regulations, timing, implementation unit and, often, ad hoc participation committees. Furthermore, there is no national RD strategy that would facilitate convergence. Lack of horizontal coordination at the federal level complicates vertical coordination between federal and state governments, and hence effective decentralization, because state governments must deal separately with each federal program authority. It is very difficult for state governments to design coherent RD strategies under these circumstances.
Important progress has been made over the last decade, particularly in the last five years, in the decentralization of RD productive programs. SAGARPA’s Alianza program has been at the forefront of this process, being in fact the main vehicle for it. Decentralization was intended to cover not only program implementation and funds but also the transfer to the states of SAGARPA’s staff, infrastructures, and other resources –the so‐called proceso de federalización. This is, however, a protracted process ridden with difficulties, which has advanced partially only. Decentralization of RD programs of other federal secretarias has advanced little. Some progress, however, has been made in deconcentration, i.e. assigning larger roles to the delegaciones (the state offices of federal secretarías). The situation varies much across programs because of the different institutional arrangements under which they operate. Programs are multidimensional phenomena, and the degrees of decentralization can be very different along the dimensions involved.
The 2001 Ley de Desarrollo Rural Sustentable (LDRS) was a step forward in decentralization to the extent that it created institutional platforms, like state, district, and municipal rural development councils. LDRS also mandates the signing of convenios between federal secretarías and the states to implement sectoral programs. Furthermore, the operation rules of Alianza have strengthened the state and municipal councils by making active use of them for program management, and have added new decentralizations platforms such as the fideicomisos.
Progress has also taken place in transparency and the use of objective rules for program implementation. Thus, the use of objective allocation criteria is now the rule when program funds are distributed across states or municipalities. Also, the creation of RD councils at various levels is an advance in transparency since it allows representatives from civil society and sub‐national governments to partake in decision‐making in the implementation of some programs. This discourages arbitrary decision‐making and makes decisions more transparent. Finally, detailed program operation rules have brought more transparency to the criteria for beneficiary eligibility, selection of investment proposals, and other aspects of program implementation. To some extent, however, this is achieved at the expense of operational and decentralization effectiveness, because the length and complexity of program norms introduces operational rigidities, makes it difficult for local agents to adapt program objectives to
Decentralized Service Delivery for the Poor 225
local conditions, and hampers the understanding by potential beneficiaries of the characteristics of the programs. There is hence a trade‐off between transparency, on the one hand, and effectiveness and local empowerment, on the other.
Altogether, notwithstanding the progress made in decentralization and transparency over the last decade, the degree of decentralization of rural programs is rather limited. The important point is that, as things stand today, it is not possible for state governments to have adequate control of the rural agenda in their states. The majority of public funds spent on rural areas come from federal sources, and the capacity of state governments to influence the allocation of these funds is small. Their ability to shape the regulations under which rural programs operate in their states is also very limited. State governments can in some occasions negotiate and agree with central authorities the distribution of resources among sub‐programs of a certain program. They can also try to attract more funds from federal programs, mostly through the offering of counterpart funding or through sheer political negotiation. They may also participate in the decision‐making process through which priorities are established and proposals approved in some demand‐driven programs. Where state governments are powerless is (1) in the design of programs and their operation rules, and (2) in the transferring of resources across programs, even if they are from the same secretaría, although there may be more room for negotiation in this case.
The analysis of Alianza decentralized programs—the Agriculture, Livestock, and, especially, the Rural Development Programs—allows us to illustrate some of the issues and challenges found in the implementation of production‐oriented RD programs. These can be summarized as follows:
• State and municipal authorities tend to contribute few counterpart funds to RD programs. Thus, on average in 1996‐2004 state governments contributed 16 percent of the entire resources of Alianza’s decentralized programs. Different factors seem to influence the decision of state governments to contribute counterpart funds, which explains the considerable dispersion of contributions that exists across time and space.
• State level platforms such as the Consejos Estatales de Desarrollo Rural Sustentable (CEDRS) and the Comités Técnicos of the fideicomisos have shown to be useful for government officers from the state and federal entities to interact and discuss issues related to RD in the states. The Comités Técnicos also play a valuable role in the concrete implementation of decentralized programs. The effectiveness of these platforms varies much across states. In general, technical committees of fideicomisos, which are smaller bodies with clearly defined functions, work reasonably well in most states. More variance exists in CEDRS, but on the whole they have not been able to ensure good coordination within the state of RD programs from different federal secretarías or the harmonization of funding.
Decentralized Service Delivery for the Poor 226
• Notwithstanding the existence of an objective formula for the allocation of Alianza funds to the states, this allocation, when measured per capita of rural population and compared with the marginality index of the states, is regressive.
• Late approval and release of implementation norms and lengthy implement‐ation procedures considerably delay the release of funds, which often occurs the following year. It would seem that the decentralized programs of Alianza (and other decentralized programs which benefit from a fideicomiso) tend to follow in practice a different fiscal year: one that goes from May to May or June to June, rather than from January to December.
• The measured impact of Alianza supports regarding the income, employment, assets and technology position of beneficiaries is noticeable. It is greater on income, technology and assets (averages from 13 to 21 percent) than on employment (average 3 percent), and larger for poorer than for better‐off beneficiaries.
• Multiplicity and overlapping of programs, complexity of operation rules, and frequent changes in program characteristics and eligibility criteria, make it difficult for beneficiaries and even for program operators and sub‐national authorities to be aware of the available government offer of RD support. Potential beneficiaries have to rely on information from intermediaries who may not understand well the norms and may have their own agendas. This reinforces clientelistic ties and discriminates against those with less access to information.
• Private providers of technical services are the main interface between programs and beneficiaries, and the main conveyors of information of program opportunities and rules. Their situation, as well as that of field level government operators who are normally recruited on short‐term ad hoc contracts, is different from that of teachers or health workers. They are not unionized, have no entitlement to secure employment or social security benefits, and receive little economic or moral incentives to do a good job. Nor do they receive technical backstopping, systematic effective training or support to operate as networks. These “street level” operators are the weakest link in the implementation chain.
• Being Alianza decentralized programs demand‐led, investment support proposals come from rural producers. In principle, in view of the shortage of funds, funding decisions must be made according to quality and cost‐efficiency criteria. In practice, however, it is difficult to prioritize investment using these criteria when there are a myriad of small and often very similar proposals. Hence, the most frequent rationing mechanism used consists of first‐come‐first‐served and completeness‐of‐documentation criteria. Priority

Decentralized Service Delivery for the Poor 227
is given to producers who are first in presenting proposals duly completed and with all the attachments required, when the window opens.
• The Consejos Municipales de Desarrollo Rural Sustentable (CMDRS) are a step forward in the creation of decentralized participatory structures for the implementation of rural policies and programs, and to build public‐private‐civil society alliances. Unfortunately, most municipal councils do not have the capacity to become effective promoters of local economic development. The underlying problem seems to be that the municipal level is not the most appropriate one for this purpose. Small rural municipalities do not have the technical staff and sophistication required to carry out strategic planning and the design of innovative rural agendas. CMDRS find it difficult to articulate sound economic criteria to prioritize investment demands. When they have to exercise a rationing authority they tend to fall back into simplistic equalitarian rules of the type “one community one project”, independently of the objective merits of the proposals and of the needs of the communities. Also, CMDRS do not seem to have the capacity to formulate clustering strategies for investment proposals; the spontaneous tendency at this micro level is to promote atomized rather than clustered investments. The municipal rural space in Mexico is too small and municipal administrations are too weak and focused on other activities for municipal councils to be effective economic governance entities.
• The Consejos Distritales de Desarrollo Rural Sustentable (CDDRS), operating at a regional level, would be in a much better position to promote local economic development –a role in a way foreseen in the Ley de Desarrollo Rural Sustentable. Unfortunately, insufficient attention and powers have been given so far to these councils, much less than to the municipal ones. Although they have been created in most states, their existence is either little noticeable or they serve more to exchange information among government offices and municipal authorities of the region. This seems to be due to the lack of a technical body responsible to the CDDR and to the lack of command of these councils over investment resources.
Further decentralization of production‐oriented RD programs is needed. A shortcoming of the present situation is that since state governments do not have effective control of the rural agenda, they do not interiorize the political and economic costs and benefits of rural development actions, successes and failures. There is an ambiguous state of affairs where neither the federal government nor state governments feel truly responsible for RD outcomes.
We believe that a decentralized system with a strong role of state governments, where they would be driving the rural agenda, would be the best way, probably the only one, to overcome the problems of lack of program coordination and no harmonization of funding. Also, by making state governments truly accountable of

Decentralized Service Delivery for the Poor 228
rural development outcomes in their states, decentralization would move them to interiorize all costs and benefits, hence favoring efficiency and equity in resource use. Finally, devolution to the states of RD resources and regulatory functions would greatly facilitate the application of a territorial approach to rural development.
We propose a decentralization model of the type existing in various countries of Europe, like Spain, Italy, and Germany, where the equivalent to the Mexican states –the autonomías, regioni or lander—are the pivotal entities of RD authority and policy making. In order to achieve this type of devolution four things would be required:
1. Transferring to the states most of the funds of production‐oriented RD programs of federal secretarías. This would be done in the form of block grants where the funds from different programs would be merged. The national government would still reserve for itself funds to carry out RD programs and regulatory activities considered to be strategic and to require national‐level implementation. The distribution of funds to the states would be done according to an objective formula, based on demand considerations, which would not be regressive.
2. Dismantling the corresponding federal RD programs and letting state governments replace them with their own programs, so that they can be true masters of the RD agendas in their states. State programs would be instruments to carry out state RD strategies with verifiable objectives and outcomes.
3. Pushing ahead with federalización, so as to transfer to state governments the assets, staff and other operational resources of federal secretarías required for them to design and implement their own RD agendas.
4. Establishing (i) national minimum standards and benchmarks to be respected by the states; (ii) an agreed upon formula for the distribution of funds among the states; and (ii) a national monitoring and evaluation system.
It is clear that a transition period would be necessary to carry out the above, but this could in our view be reasonably short, circumscribed to a political administration.
Under this scheme, federal regulations in the RD productive area would consist of broad guidelines, in which national minimum standards could be set for the design and operation of RD programs by the states. In particular, federal norms could (i) promote geographical equity; (ii) prevent disproportionate disparities across regions in the type and amount of benefits received by program beneficiaries, and (iii) prevent the creation of situations where producers from different states are treated differently vis‐à‐vis international competitors. The federal government could also monitor and evaluate independently the RD strategies designed and implemented by the state governments. By focusing on strategic issues only, federal norms would allow states to create their

Decentralized Service Delivery for the Poor 229
own regulatory instruments, thereby reflecting more accurately local needs and priorities.
State governments would have the initiative in policy making for rural development in the states. They would prepare a long‐term RD strategy and monitor its implementation and outcomes, design and implement the RD programs that they consider most appropriate, and allocate resources to them. The objective of coordination and harmonization of funding would look very different under the decentralization system proposed, since all (or at least most) RD programs operating in a state would be designed within the state and subject to state authority. State governments or the CEDRS could decide to move resources across programs as well as to create and oversee the necessary coordination mechanisms.
The regional level could become much more important for productive RD than at present. Strengthening the institutional capacity of CDDRS could be a crucial part of the rural decentralization agenda. Ideally, CDDRS would combine participatory principles with sound technical and market criteria to design long‐term development strategies for their regions. These strategies would be based on the potential offered by territorial assets and the identification of the main development axes around which investment support should cluster. CDDRS could design regional programs consistent with the development axes for the practical implementation of their long‐term strategies. They could also have the function of linking up territorial programs with production chains.
To be able to fulfill the above functions, CDDRS should have a sufficient cadre of professional staff with good technical credentials. The participation of civil society should be strengthened so that CDDRS become an effective platform for concertación and economic governance of the territory where they operate.
The municipal level would continue to be involved, with CMDRS serving as a forum for social participation and discussion, and also as an arena to prioritize the allocation of resources, but within the framework of the long‐term territorial strategy and the regional programs established by CDDRS and under their guidelines. CMDRS would be represented in CDDRS, of which they would be important members. There is need, however, to work towards ensuring that (i) more decision‐making power within CMDRS is in the hands of local producers rather than municipal presidents or technical coordinators, (ii) they are better informed of programs and program opportunities, and (iii) the representation system is improved to ensure more continuity of representatives, and manageable numbers.
The above proposal is clearly a big departure from the current system, and implementing it would require considerable political courage. We do not think, however, that it requires constitutional or other major legal changes, and believe that the progress made in decentralization and transparency over the last years is a good basis for this drastic change. The proposal would have a positive impact on the efficiency of

Decentralized Service Delivery for the Poor 230
RD public spending, improving its allocation, its supply or x‐efficiency, and its dynamic impact. It is also expected to improve geographic redistribution and to be neutral with respect to macroeconomic stability.
We can anticipate several problems and risks in the implementation of our proposal. The first problem is to agree in the amount of resources to be transferred to the states and in the distribution formula to be used. The second problem is the political difficulty of stripping federal secretarías, especially some of them, of a good part of their resources and policy‐making powers. Finally, in any decentralization reform there is always the risk of the local elite capturing a good part of the benefits, with the central authorities being left with few instruments to prevent this from happening.
Decentralized Service Delivery for the Poor 231
INTRODUCTION
Poverty is widespread in the rural areas of Mexico. In 2004, 28 percent of rural dwellers were extremely poor and 57 moderately poor2. Poverty is much more prevalent in rural than in urban areas. Thus, although only one fourth of Mexicans are rural residents, the rural poor account for 61 percent of Mexico’s extreme poor and 46 percent of the moderate poor. Furthermore, poverty intensity and severity are more than double in rural than in urban areas3.
The “Study of Rural Poverty in Mexico” carried out by the World Bank in 20054 examined the characteristics and evolution of rural poverty. It also proposed policy options to fight it, highlighting the importance of enlarging and improving production‐oriented programs for rural areas (i.e. programs to generate farm and non‐farm employment and income opportunities for rural dwellers). Possible actions were signaled to revitalize the rural economy in favor of the poor, and to deepen the territorial approach as a way to promote local economic development in the rural space. Options were also suggested to improve the entire system of design and implementation of rural development (RD) programs.
The present report builds on the analysis and conclusions of the rural poverty study and is in a way a logical extension of it. We examine here in more detail some of the design and implementation issues of RD programs outlined in the poverty study, concentrating on decentralization aspects. In particular, we investigate the degree of centralization or decentralization of RD programs, and the progress made in this respect over the last decade. We also draw attention to the need of strong action to further decentralize RD responsibilities and resources in order to improve the quality of RD expenditure and enhance political accountability of the RD agenda.
We concentrate our analysis on production‐oriented programs, which are run by different federal secretarías, mostly SAGARPA (and related entities like FIRCO or ASERCA), SEDESOL, SRA, CDI, SE, and SEMARNAT (and related entities like CONAFOR). Most of these programs are demand‐driven, with potential beneficiaries presenting applications and competing for the support from the respective funds. One important area of productive expenditure using federal funds not included in our analysis is the irrigation investments carried out by CNA. The reason for not including it here is that they are not demand‐driven programs of the Alianza type, and that
2 Extreme poverty refers to individuals below SEDESOL’s food poverty line, and moderate poverty to those under SEDESOL’s assets poverty line. For the definition of these lines and the use of different poverty measures see The World Bank: Poverty in Mexico: An Assessment of Conditions, Trends and Governments Strategy. The World Bank, Washington DC, 2004. 3 See World Bank: Income Generation and Social Protection for the Poor, A Study of Rural Poverty in Mexico, Chapter 2. The World Bank, Mexico, 2005 4 World Bank, 2005, Op. Cit.

Decentralized Service Delivery for the Poor 232
decentralization in the field of irrigation raises specific issues and problems which merit separate attention and cannot be dealt with in this report.
Not all production‐oriented RD programs are targeted to the poor. Some agricultural programs, like the price and marketing supports from ASERCA, mostly benefit middle and large commercial farmers. Others, like the agriculture and livestock programs of Alianza, jointly have roughly one half of better‐off farmers among the beneficiaries. On the whole, however, most of these programs are oriented to small producers. Even those not specifically targeted have an indirect impact on poverty through employment and wage effects, the provision of services such as plant and animal health or the integration of production chains. Furthermore, the rural poverty study showed the strong impact of agricultural growth on poverty reduction in Mexico, as well as the importance for the rural poor of employment and income opportunities in non‐farm rural activities. Programs supporting farm and non‐farm investments are therefore generally favorable to the poor.
For these reasons we consider in this report production‐oriented RD programs in general, without limiting ourselves to those targeted to low income producers. For the purpose, however, of understanding better the decentralization process and its implications for the implementation of RD programs, we give privileged attention to the decentralized programs of Alianza, which is where decentralization has advanced most, and in particular to Alianza’s “Rural Development Program”. This is a targeted program and the only production‐oriented one to have been decentralized to the municipal level. The relevant conclusions arrived at in this report with respect to the need to further decentralize RD resources and decision‐making refer, nonetheless, to production‐oriented RD programs in general.
To prepare this report, we carried out interviews with officers responsible for various RD programs at the national level in different federal secretarías. We also carried out field work in three states, Guerrero, Jalisco and Veracruz. In these states, we visited several municipalities, discussed with municipal authorities, observed meetings of RD councils, interviewed federal and sate officers responsible for the implementation of RD programs in the state, met with local farmers’ associations and NGOs, and held separate focus group meetings with independent service providers, and with state and federal government staff directly involved in the implementation of RD programs at the field level.

Decentralized Service Delivery for the Poor 233
PROGRAM AND PERFORMANCE OVERVIEW
I. PUBLIC EXPENDITURE IN RURAL AREAS
1. Importance
The total amount spent by the federal government in rural areas is large. In 2005, the total federal rural budget was close to USD 14 billion or some USD 560 per head of rural population.
Considering exclusively the expenditure going to the agricultural sector and taking the average of 1996‐2000, whichever way this expenditure is measured, per hectare, per agricultural worker or per unit of national GDP, it is bigger in Mexico than in other countries of Latin America. Figure 1.1 compares LAC countries according to an “agricultural orientation index”, built by dividing the share of agricultural public spending in total public spending by the share of agriculture in GDP, which indicates the intensity of the fiscal effort in agriculture relative to the economic importance of the sector. A value of less than one means expenditure “discrimination” against agriculture, and the opposite for more than one. Mexico is the only country included in the study with an index of more than one, which is in fact more than four times larger than those of the next countries, Bolivia, Chile, and Dominican Republic. Mexico, hence, practices public expenditure discrimination in favor of its agriculture5.
Figure 1.1. Agriculture Orientation Index in LAC Countries, Average 1996‐2000
0.000.200.400.600.801.001.201.401.601.802.00
Brazil
Mexico
Bolivia
Colombia
Perú
Argentin
aChil
e
Costa Rica
El Salv
ador
Guatemala
Nicarag
ua
Dom. R
epu.
Average L
AC
Inde
x, A
vera
ge 1
996-
2000
Source: Based on data from Kerrigan (2001).
Furthermore, high levels of rural public expending have been kept for many years. The impact, however, on the rural economy of this massive expenditure effort is 5 See World Bank, 2005, Op. Cit. Chapter 4. The index refers to agriculture, not to all rural expenditure.

Decentralized Service Delivery for the Poor 234
not evident. In Mexico, the main problem is not the shortage of fiscal resources devoted to rural areas, as is the case in other Latin American countries, but the efficiency in the use of the resources.
In June 2002, as a corollary of the Ley de Desarrollo Rural Sustentable (LDRS), legislation was issued mandating the preparation of a Programa Especial Concurrente (PEC) under the responsibility of the Comisión Intersecretarial para el Desarrollo Rural Sustentable6 (CIDRS) on which more is said later on in this document. The aim of Programa Especial Concurrente is to coordinate the rural development (RD) actions of the relevant secretarías. As a result, a document has been published with the objectives and goals of all main federal RD programs7, and the amounts of federal budgetary resources going to rural areas of the various secretarías have been estimated and added up for years 2003, 2004 and 2005. Table 1.1 shows these amounts broken down by the categories in which public expenditure in rural areas is organized in Programa Especial Concurrente. Table 1.2 shows the same amounts broken down by federal secretarías, and compares them with their total budgets. Table 1.3 shows the amount budgeted in 2005 for the largest programs (those of more than MxP 5 thousand million). Annex Table 1 shows the main programs by secretaría included in the Programa Especial Concurrente, according to Annex 17 of the Presupuesto de Egresos de la Federación.
Table 1.1: Programa Especial Concurrente by Expenditure Categories
Programa Especial Concurrente, million MxP Expenditure Category 2003 2004 2005 Total % Total % Total % Social Conditions 45,343 38.7 61,704 51.9 75,301 51.3Labor Conditions 2,874 2.5 976 0.8 485 0.3Land Policies 3,257 2.8 3,071 2.6 4,191 2.9Production Support 50,687 43.3 45,705 38.4 47,715 32.5Basic & Productive Infrastructure 10,032 8.6 5,978 5.0 13,145 9.0Environment 4,905 4.2 1,457 1.2 5,928 4.0Total 117,097 100.0 118,892 100.0 146,765 100.0
Source: SAGARPA for 2003 and Federal Budget for 2004 and 2005.
Some considerations are in order to interpret these figures. First, all kind of programs are included, ranging from infrastructure and direct cash transfers to farm
6 This committee is formed by the secretaries of all federal secretarías directly involved in the development of rural areas. Included are SAGARPA, SE, SEMARNAT, SHCP, SCT, Salud, SEDESOL, SRA, and SEP. It is chaired by the Secretary of SAGARPA (art. 21 of the LDRS). 7 SAGARPA: Programa Especial Concurrente para el Desarrollo Rural Sustentable, 2002‐2006. México DF, 2002.

Decentralized Service Delivery for the Poor 235
subsidies and official credit programs. Municipal infrastructure under Ramo 33 is included, and so are the relevant operating expenditures of secretarías and programs. Second, the categories in which figures are broken down in Table 1 are rather hazy and must be taken as an approximation only. Most programs do not fall comfortably into one single category, either because activities may fit into more than one category or because programs may have different activities belonging to separate categories.
Table1.2: Programa Especial Concurrente by Secretarías Programa Especial Concurrente, Million MxP
2003 2004 2005 Administrative Budget
Million MxP SECRETARIA Amount % Amount % Amount % 2003 2004 2005 SE 576 0.5 965 0.8 1,016 0.7 5,404 5,380 7,018 SAGARPA 40,583 34.7 43,814 36.9 49,221 33.5 41,783 36,373 48,396 SALUD 6,829 5.8 6,827 5.7 14,206 9.7 20,867 20,973 34,024 SCT 1,092 0.9 2,948 2.5 2,151 1.5 23,124 22,746 36,694 SEDESOL 15,574 13.3 13,449 11.3 17,448 11.9 18,978 21,099 23,744 SEMARNAT 8,977 7.7 8,004 6.7 11,305 7.7 17,404 16,008 24,483 SEP 17,554 15.0 17,443 14.7 23,830 16.2 106,355 113,414 127,668SHCP 10,310 8.8 4,539 3.8 6,918 4.7 21,785 23,620 26,916 SRA 3,566 3.0 3,505 2.9 4,856 3.3 2,759 2,806 4,856 STPS 866 0.7 126 0.1 75 0.1 3,151 3,328 3,185 TURISMO 16 0.0 75 0.1 4 0.0 1,459 1,230 1,147 Others 11,153 9.5 17,196 14.5 15,735 10.7 Total 117,097 100.0 118,892 100.0 146,765 100.0 263,068 266,978 338,133% of Adm. Bdgt. 44.5 44.5 43.4 100.0 100.0 100.0 Source: SAGARPA for 2003 and Federal Budget for 2004 and 2005.
The importance of federal rural spending is highlighted by the fact that in 2005 it amounted to 43 percent of the sum of the administrative budgets of the secretarías active in rural areas, one half of agricultural GDP, and close to 2 percent of national GDP8.
8 According to GDP estimates available on‐line from INEGI, 2005 GDP was MxP 288,513 million for agriculture and MxP 8,374,349 million for the entire economy.

Decentralized Service Delivery for the Poor 236
Table 1.3: 2005 Budget for Main Rural Programs in Mexico
Source: Federal Budget 2005
According to Table 1.1, the amount going to production support programs, which are the ones that concern us most here, oscillated between MxP 46 to 51 billion. Because of the problems mentioned to unambiguously classify the programs, it is difficult to know the true figure. The presumption is that it is bigger than stated because some programs included under environment and land policies are at least partially production‐oriented.
No systematic data exist on the targeting of RD programs. There is information broken down by type of beneficiary for Alianza decentralized programs (examined later in this document), but not for other programs. This is an area where more research is urgently needed. As observed in the introduction, most of the productive programs (from SEDESOL, CONAFOR, CDI, SRA, SE, and many of those from SAGARPA) are oriented to small producers, but the targeted part of the total amount of federal expenditure going to production‐oriented RD programs is not known.
2. Multiplicity of Programs and Coordination Issues
An outstanding feature of Programa Especial Concurrente is the large number of programs encompassed. There are some 267 RD programs in the 2005 Programa Especial Concurrente, of which 111 from SAGARPA and 156 from other federal government entities. Many of these programs have their own subprograms. If subprograms are considered and the states’ own programs are added, a guess of the order of magnitude of the current number of rural programs in Mexico can be of five hundred. Many of these programs are duplicative. Credit programs, programs to support women groups, and programs to support group processing enterprises are typical examples of this.
“Special programs” are envisaged in the Mexican planning system (Art. 26 of the Ley de Planeación) as an instrument to carry out integrated actions involving more than
Major Program Million Responsible (above MxP 5 bn) MxP Government Unit
Oportunidades 27,924 SEP, Salud, SEDESOL Procampo 14,885 SAGARPA FISM 12,045 Federal Contribution Desarrollo Capacidades 9,976 SEP, Salud Alianza 8,164 SAGARPA Aserca 6,755 SAGARPA SPSS 5,395 Salud Hidroagrarian Infrastructure 5,105 SEMARNAT Total 90,249
Decentralized Service Delivery for the Poor 237
one secretaria. Programa Especial Concurrente is one of these “special programs”. It is meant to be a coordination tool for this collection of RD programs. Ideally, RD programs should be jointly planned and budgeted and their implementation tightly coordinated. In practice, however, Programa Especial Concurrente has not managed to become a RD strategy or plan or joint budgeting mechanism; it has not its own objectives, and simply collects the objectives, policies, strategies and lines of action of the relevant federal secretarías. Although a joint budget for Programa Especial Concurrente is presented to Congress by the Comisión Intersecretarial, no joint programming or budgeting takes place. SHCP prepares sectoral budgets in discussion with federal secretarías, and these budgets (or the parts relevant to rural areas) are then added together in the overall Programa Especial Concurrente budget9.
Programa Especial Concurrente, hence, is an instrument for bringing more coordination and joint action (concurrencia) to rural programs, but so far it has only been used as a formal accounting tool, not to carry out effective coordination. There are various reasons for this, the most important probably being the reluctance of federal secretarías to relinquish design and budgetary authority to a joint RD planning and budgetary body like the Comisión Intersecretarial (CIDRS), which is responsible for Programa Especial Concurrente. Other reason is that CIDRS has no operational tools to carry out its function, for it has no budget and no technical staff. Also, it is difficult for SAGARPA, which chairs the CIDRS, to compel other secretarías to carry out joint programming and budgeting exercises. Different would probably be the case if CIDRS were chaired by SHCP or Presidencia.
Proliferation and lack of coordination of RD programs is a critical problem standing on the way of effective public spending in rural areas. Each federal program has its own regulations, timing, implementation units and, often, ad hoc participation committees. Furthermore, there is no national RD strategy that would facilitate convergence. Lack of horizontal coordination at the federal level complicates vertical coordination between federal and state governments, because the latter must deal separately with each federal program authority. It is very difficult for state governments to design coherent RD strategies under these circumstances.
II. THE STATE OF DECENTRALIZATION OF RURAL DEVELOPMENT PROGRAMS
1. Advances in Decentralization
Steps towards decentralization of rural programs started in the mid‐90s and accelerated from 2001 onwards. SAGARPA’s Alianza program has been at the forefront of decentralization; it has in fact been the main vehicle for it. The three main decentralized programs, the so‐called programas federalizados of Alianza, which are the Agriculture, Livestock, and Rural Development programs, represented on average 61 9 Programa Especial Concurrente figures appear as Annex 17 of the federal expenditures budget.

Decentralized Service Delivery for the Poor 238
percent of all Alianza public resources (i.e. contributed by the federal and state governments) in 1999‐200410. The Rural Development Program of Alianza is the only production‐oriented rural program in the country that has been decentralized (partly) to the municipal level.
The rural decentralization process started in the mid‐90s and was intended to cover not only program implementation and program funds but also the transfer to state governments of SAGARPA’s staff, infrastructures and other resources, usually referred to as proceso de federalización. This is logical because transferring program responsibilities to state governments required additional resources to discharge those responsibilities.
Federalización, however, is a protracted process ridden with difficulties, which has advanced partially only. The main problems are: (i) differences in salary and other labor conditions between SAGARPA and state administrations, which create problems with the unions; (ii) reluctance of state governments to take on SAGARPA staff many of whom are aged; (iv) administrative difficulties to pass on to the states the budgetary resources to cover the operational costs of the staff and infrastructures transferred; and (iv) the cost of the entire operation (compensation for staff laid off, salary increases to level off staff, revamping of infrastructures, and others). The strength, nevertheless, of state secretarías in charge of agriculture and rural development (ARD) is higher now than it was a decade ago. Also, SAGARPA interacts and shares decision making with these secretarías much more than it used to be the case. There are three pilot states (Jalisco, Michocán and Nuevo León) where SAGARPA staff are in principle equally accountable to SAGARPA and to state governments.
Decentralization of programs of other federal secretarias active in ARD has advanced little. Some progress, however, has been made in deconcentration, i.e. assigning larger roles to the delegaciones (state offices of the federal secretarías). SAGARPA itself runs in a centralized way more than one third of the funds of Alianza (the so‐called programs of ejecución nacional), as well as most programs other than Alianza. The situation, however, varies much across RD programs because of the different institutional arrangements under which they operate. Programs are multidimensional phenomena, and the degrees of decentralization can be very different along the dimensions involved. This is examined in Box 1.
Box 1: Dimensions in the Decentralization of Rural Development Programs in Mexico
The many rural sector programs that exist in Mexico operate under different institutional arrangements. Some devolve decision‐making power to sub‐
10 See Table 3.3. of Chapter 3. Other Alianza programs have also been decentralized but to a lesser extent. The above three programs are the main ones, and account for an overwhelming proportion of decentralized funds. The precise meaning of decentralization of Alianza programs is explained further down.
Decentralized Service Delivery for the Poor 239
national governments to various extents, while others keep most or all aspects under the control of central authorities. A simple centralization/decentralization dichotomy is insufficient to describe how rural programs work, for program processes move along several dimensions, some of which may be under the control of central authorities, while others are under that of sub‐national governments. We review below these dimensions and offer some examples.
a) Funding source. Funding of rural programs may come from one, two, or all three levels of government. For most programs the federal level provides all or most of the resources. The programs, for instance, of SRA (PROMUSAG and FAPPA) and SE (FONAES) do not have as a rule state or municipal counterpart funding. When two government levels contribute, they are usually the federal and state governments. This is the case with the Agriculture and Livestock programs of Alianza or the PRODEFOR program of CONAFOR. A combination of federal and municipal funding, like in FIRCO’s Microcuencas program, is possible but uncommon. In hardly any program do all three levels of government contribute funds, with the mayor exception of Alianza’s Rural Development Program (RDP). Only in the case of states’ own programs, like the fertilizer program of the Secretaría de Desarrollo Rural in Guerrero or the Núcleos de Desarrollo Comunitario program of the Secretaría de Desarrollo Humano in Jalisco, does funding come exclusively from state sources. Rural Development programs financed entirely by municipalities are rare.
b) Regulatory authority. Program operation rules serve to design program objectives and decide on implementation issues, ranging from the eligibility criteria to the amount and type of benefits. Except for states’ own programs, rules are issued by the federal government. All RD programs from federal secretarías operate under centralized rules. When states and municipalities are involved in program funding, additional criteria may be agreed between the government levels involved, formalized as convenios and anexos técnicos, which usually include budgetary and programmatic provisions. Alianza’s decentralized programs are an example of this.
c) Allocation of funds to States. Most RD programs operate on a demand basis, i.e. producers have to apply and compete for funding. In the case of centralized programs, competition may be at the national level, in which case no allocation or indicative disbursement figure is given to the states. This is for instance the case with CONAFOR’s PRODEPLAN. In other cases, like in SEDESOL’s Oportunidaes Productivas and in FONAES, annual expenditure ceilings are established for each state, and proposals compete at the state‐level within those ceilings. Funds, however, are kept at the federal level. In the case of decentralized programs, not only funds are allocated to the sates but they are actually transferred to fideicomisos located in the states where they are mixed with local funds.
d) Spending authority. Even when funds come from federal sources, prioritization and selection of proposals may involve sub‐national governments. The most centralized scenario is when the selection process is carried out centrally by federal secretarías. This can be done with the previous advice of a state‐level joint committee, like in the SRA’s programs, or without it, like in the

Decentralized Service Delivery for the Poor 240
Integración Productiva, Agencias de Desarrollo Local and Fondo de Financiamiento Social programs of SEDESOL’s Oportunidades Productivas. In other cases, like in FONAES, proposals under certain amount are decided upon by the state offices of the corresponding secretaría. In more decentralized scenarios, joint state‐federal committees may preliminarily select proposals with the final decision being left to the federal level. A more decentralized process is when, like in Alianza’s decentralized programs or in CONAFOR’s PRODEFOR program, state‐level joint committees or even municipal‐level committees have the last word. Total decentralization occurs when the use of resources is decided by sub‐national authorities alone, but this only happens with state’s own programs.
e) Operational tasks. RD programs entail a number of operational tasks, such as promotion and dissemination, reception and processing of applications, technical formulation of proposals, and supervision of activities. Once more, different government levels may take part in these tasks, which are usually supported by private providers of services.
The advance of deconcentration has been modest because it requires the deployment of central staff to the states and, possibly, recruiting additional staff to beef up state offices. Both things are difficult to do. Local staff has mixed feelings vis‐à‐vis deconcentration: they like it because it gives them more power and they feel it allows them to do a better job, but they also resent it because it increases their work load.
The 2001 Ley de Desarrollo Rural Sustentable (LDRS) was a step forward in decentralization to the extent that it created institutional platforms, like state, district, and municipal rural development councils (Art. 24), analyzed further down in this document, which help giving sub‐national authorities more stake in the decision‐making process in rural programs. Also, LDRS mandates the signing of convenios (legal agreements) between federal secretarías and the states to implement sectoral programs (Art. 27).
The operation rules of Alianza have strengthened state and municipal councils by making active use of them for program management, and have added new decentralization platforms such as the fideicomisos11. A positive function of the RD councils is to facilitate discussion and the reaching of ad hoc cooperation agreements between sub‐national authorities and staff from federal secretarias. Little by little, programs other than Alianza are making use of these platforms, but this is only starting.
11 These are trust funds created in financial institutions where the incumbent federal secretaría and the state government deposit the funds required to implement an agreed program. Fideicomisos have two advantages: (i) once they enter the fideicomiso, funds become mixed and indistinguishable, independently of their source; and (ii) they are not subjected to ordinary budgetary procedures, and hence funds need not be returned to the national treasury if they are not spent within the fiscal year. The use of fideicomiso funds is authorized by a joint committee known as Comité Técnico, and can be audited by the Secretaría de la Función Pública, under Mexico’s transparency legislation.

Decentralized Service Delivery for the Poor 241
Altogether, notwithstanding the progress made during the last decade, the degree of decentralization of rural programs can be considered rather limited12. The important point is that, as things stand today, it is not possible for state governments to have adequate control of the rural agenda in their states. The majority of public funds spent on rural areas come from federal sources, and the capacity of state governments to influence the allocation of these funds is small. Their ability to shape the objectives and rules under which rural programs operate in their states is also very limited. State governments can in some occasions negotiate and agree with central authorities the distribution of resources among sub‐programs of a certain program. That is, for instance, the case with the decentralized programs of Alianza, but not with most other programs from SAGARPA or other secretarías. They can also try to attract more funds for the state from federal programs, mostly through the offering of counterpart funding or through sheer political negotiation. State governments may also participate in the decision‐making process through which priorities are established and proposals approved in some demand‐driven programs. This is the case with the decentralized programs of Alianza, and is slowly starting to occur in programs from other secretarías. Where state governments are powerless is (1) in the design of the programs and their operation rules, and (2) in the transferring of resources across programs, even across programs of the same secretaría, although there may be more room for negotiation in this case.
Hence, at present, with exceptions, state governments are mainly observers of the RD programs that federal secretarias carry out in their states. To have some say in these programs, they have to contribute counterpart funds. This would in principle be reasonable, if only state governments had enough funds to contribute to all the many programs. In other cases, state contributions are simply not envisaged, the programs being by design strictly national. In no case do state governments decide on the operation rules of federal programs or decide on the allocation among different ARD activities of the sum total of funds spent in the state by federal scretarías. As mentioned before, the situation is slowly improving, with Alianza being the main break through. The creation of new institutional platforms and fideicomisos is an important step forward, but their true empowerment and their generalized use in many different programs is only starting.
2. Transparency and Objectiveness
Progress has been made in the use of transparent and objective criteria for the allocation of program funds, more perhaps than in other areas. When program funds
12 Unfortunately, figures do not exist of public expenditure in rural programs broken down by their degree of centralization/decentralization. Building a typology of program situations according to decentralization dimensions like those indicated in Box 1, and calculating the public expenditure going to each type of program would be an extremely useful line of research to provide better knowledge of the advance of decentralization of RD programs in the country.

Decentralized Service Delivery for the Poor 242
are distributed across states, the use of objective criteria is now the rule. Thus, for instance, Alianza funds, which used to be allocated according to bilateral negotiations between SAGARPA and the states, started being apportioned according to an objective formula in 2001. The formula has changed somewhat over the years. That used in 2005 is explained in Box 2.
The creation of RD councils at the state, district and municipal level, mandated by the LDRS, is also an advance in transparency because it allows representatives from civil society and sub‐national governments to partake in decision‐making in the implementation of some ARD programs. Such participation discourages arbitrary decision‐making and makes decisions more transparent. The weakness, however, of these councils, examined further down in this document, impairs their operation as a strong system of check and balances.
Program operation rules have brought more transparency to the eligibility criteria of beneficiaries, the selection of proposals, and the various processes involved in program implementation. To some extent, however, this is achieved at the expense of operational effectiveness and of the devolution to sub‐national governments and government‐society decision‐making platforms of the ability to locally decide on priorities and the use of funds. The extreme length and complexity of the operation rules of most programs13, designed to keep off any discretionary powers on the part of project operators, make the process more transparent to those capable of reading and understanding the rules, but introduces many operational rigidities and makes it difficult for local agents to adapt program objectives to local conditions.
Complexity of the rules makes it also difficult for potential beneficiaries to understand the characteristics of the programs. Hence, they tend to rely on information from intermediaries, like municipal authorities, government agents, officials from unions or other rural organizations, and service providers, who may themselves not understand well the rules and may have their own agendas. Complexity, thus, by militating against dissemination, reinforces clientelistic ties and discriminates against those who, because of educational level, time constraints, or remote location, have less access to information.
Box 2: Formula used in 2005 for the Allocation to the States of Alianza Funds
From the total Alianza budget, only the part executed jointly with the states or federalizada is distributed to them to be placed in the fideicomisos. In 2005 this part was MxP 5,114 million, 62.6% of the total MxP 8,164 million Alianza budget. Not all this amount is distributed according to a formula. To smooth the passage
13 Thus, for instance, the 2003 operation norms of Alianza, currently in use (with a few amendments), have 124 articles many of which are one or more than one pages long,

Decentralized Service Delivery for the Poor 243
from the previous negotiated allocation system to the new formula‐based one, it was decided to apply the formula to increasing proportions of the funds annually allocated to the states. Each year the formula is applied to a quantity equal to a certain proportion of the funds allocated to the states in the previous year. That proportion has been increasing steadily over time. Thus, in 2001, the first year when the formula was used, the proportion was 20% of the funds distributed to the states in 2000. In 2005 it was 60% of the funds distributed in 2004.
The part of Alianza funds allocated to the states using the formula is calculated as the weighted sum of two components. Component 1 (75% weight) is related to objective indicators of the needs of the states for support for agriculture and rural development. Component 2 (25% weight) is related to performance indicators of the states vis‐à‐vis the Alianza program. The amounts allocated under each component are calculated as a weighted sum of various indicators. The way in which the funds allocated are used in the states is independent of the way in which the allocations are calculated.
Component 1: 75% of the total amount of funds allocated using the formula go to this component. These funds are allocated to the states according to indicators relevant to (1) agricultural development needs (31.31% weight), (2) livestock development needs (19.17% weight), and rural development needs (49.52% weight). The agricultural indicators are (i) percentage of irrigated land in the state in 2003 in all irrigated lands in the country (25% weight); (ii) percentage of rain‐fed lands in the state in 2003 in all rain‐fed lands in the country (25% weight); and (iii) percentage of the gross value of crop output of the state in 2003 in the country’s gross value of crop output (50% weight). The livestock indicators are: (i) percentage of the state’s animal stock in 2001 in the country’s animal stock, measured in animal units (65% weight); and (ii) percentage of the gross value of livestock output of the state in 2003 in the country’s gross value of livestock output (35% weight). The rural development indicators are: (i) percentage of the state’s rural population (settlements < 2,500 residents) in the country’s total rural population, according to the 2000 population census plus natural growth (40% weight); (ii) percentage of state farms in all farms in the country, according to the 1991 agricultural census (30% weight); and (iii) percentage of indigenous population in the state in all indigenous population in the country, based on the 2000 population census plus natural growth (30% weight).
Component 2: 25% of the total amount of funds allocated using the formula go to this component. These funds are allocated to the states according to three performance indicators: (i) percentage of state contribution to Alianza in 2004 in the overall contribution of states to Alianza that year (25% weight); (ii) percentage of Alianza funds available to the state in 2004 disbursed by December 31 of that year relative to the corresponding national average (25% weight); and (iii) percentage of the contribution committed by the state to Alianza in 2005 in the total amount allocated by formula to the states by Alianza in 2004 relative to the corresponding national average (50% weight).

Decentralized Service Delivery for the Poor 244
Source: SAGARPA: “Fórmula de distribución de recursos a las entidades financieras para los programas federalizados de Alianza para el Campo 2005”. DOF January 31, 2005, and interview with Ricardo Boisson form SAGARPA.
How to handle this trade off between transparency, on the one hand, and effectiveness and local empowerment, on the other, to avoid the excessive microregulation of all possible program aspects, is a difficult matter which warrants more attention than it has received so far.
Program evaluation is an area related to transparency where progress has also been made in the last years. There is a requirement from Congress that all programs be annually evaluated by external evaluators, usually university departments or consulting firms. Evaluations are of unequal quality, but some have good professional standards, like those, for instance, of Alianza, Oportunidades, and Opciones Productivas. The good practice should be noted of evaluation documents being made available to the public, usually in the Internet page of the corresponding program or secretaría. Evaluations have proved useful to give feedback to program designers and operators, and to disseminate information to the public of program characteristics and performance.
The main limitation of the current system is that there is no follow up mechanism for evaluation results. To make evaluations truly relevant, an agenda of program improvements based on the results of the evaluation exercise should be agreed among the incumbent secretaría, the evaluators, and a third party (from Congress, SHCP or Presidencia), and action on this agenda should be monitored14. For the evaluation system to operate efficiently, annual evaluations seem excessive; it would be better to concentrate resources on carrying out good biannual evaluations.
III. ALIANZA CONTIGO
1. Why Alianza?
To give a sense of the aspects involved in the design and operation of RD programs in relation to decentralization, we have chosen to examine the Alianza Contigo (or simply Alianza) program15 and, more in particular, its Rural Development Program (RDP). There are several reasons for this. First, Alianza is the flagship program of SAGARPA, and one which has been operating since 1996, across presidential administrations. Second, most program funds have been decentralized to the states, and part of them (the majority of RDP funding) to the municipalities16. Third, RDP is a
14 See World Bank 2005 Op. Cit. Chapter 6, on this and other aspects of the evaluation of rural programs in Mexico. 15 The program used to be called Alianza para el Campo before the Contigo strategy was introduced. 16 We use the term “decentralized” here in the sense in which the term federalizado is commonly used in Mexico, i.e. important aspects of program implementation have been devolved to the state or municipal levels, and sub‐national governments contribute to funding.

Decentralized Service Delivery for the Poor 245
targeted program meant to favor small producers and low income rural dwellers in general, with special attention to marginal areas and vulnerable groups (women, youth, the old, indigenous families, and handicapped rural dwellers). RDP has, hence, the double advantage as object of study of being decentralized to municipalities and targeted to the poor. Four, Alianza is a production‐oriented program. This gives it the design and operational complexity typical of programs aimed at promoting independent entrepreneurial activity, which per force mostly deal with private goods. For success, these programs require numerous and committed staff and plenty expenditure in organization, training and technical assistance, which makes them difficult to operate and costly in terms of recurrent costs17. Alianza is a good case to examine the design and implementation issues associated with this type of programs. Finally, FAO has been carrying out quality evaluations of Alianza for a number of years, which contain relevant analyses and statistical material18.
2. General Characteristics and Trends
Alianza was started in 1996 to help Mexican farmers face the new competitiveness conditions created by NAFTA. It has evolved substantially over the years. In general, during the 1990s the program tended to increase in complexity and number of sub‐programs, a situation that was reversed in the following decade. Alianza consists of a collection of separate and rather independent programs, which cover the majority of ARD promotion activity carried out by SAGARPA. Most of the programs consist of subsidies for farm improvements or for the establishment of transformation or marketing facilities, and are demand‐driven, with funds being allocated to beneficiaries upon the presentation of a request with the corresponding technical backing, through a competitive process of selection of proposals which acts as a fund rationing mechanism.
From the point of view of decentralization, there are two basic types of programs: the decentralized (federalizados) and the national (de ejecución nacional) ones19. As already indicated, the main decentralized programs are the Agriculture, Livestock and Rural Development ones.
Federal resources going into Alianza more than tripled between 1996 and 2004, while the total amount of resources (i.e. public resources from the federal and state governments, plus those contributed by beneficiaries) almost doubled. Those supplied by the states remained rather constant, at an average level of MxP 1.7 billion. On
17 More on the importance of this type of programs and the requirements and difficulties to implement them can be read in World Bank 2005, op. cit. Rural Poverty Study, Chapters 6 and 8. 18 For the purpose of the evaluations, FAO has carried out quantitative surveys of beneficiaries and systematic interviews with relevant actors in various years, in cooperation with the evaluation teams of the different states, and has compiled a large data base. With the agreement of SAGARPA, FAO kindly agreed to make this data base available to us, keeping the anonymity of the interviewees. We are grateful for this. 19 It is possible that part of the funds of a decentralized program be reserved for national execution. This is indeed the case with RDP.

Decentralized Service Delivery for the Poor 246
average, for the entire period, 41 percent of resources were supplied by producers, 43 percent by the federal government, and 16 percent by state governments (Table 3.1). In the case of RDP (Table 3.2), the proportion financed by producers was smaller (27 percent), and that financed by the federal government larger (56 percent). Smaller contributions from producers are consistent with the targeted character of RDP and the higher levels of subsidy provided by this program compared to others in Alianza.
Table 3.1: Alianza Resources by Sources of Funding, million MxP of 2004
All Alianza Resorces
Year Federal States Producers Total 1996 2,439.5 1,372.5 3,820.8 7,632.8 1997 2,759.4 1,917.6 3,742.7 8,419.8 1998 2,826.9 1,619.7 4,438.3 8,884.9 1999 3,284.3 1,923.4 4,240.0 9,447.7 2000 3,249.9 1,720.4 4,244.2 9,214.5 2001 4,678.0 1,955.2 4,872.9 11,506.1 2002 7,592.1 1,678.5 3,422.0 12,692.6 2003 6,895.7 1,660.0 5,466.9 14,022.6 2004 7,735.1 1,629.5 5,197.1 14,561,6 All 41,460.9 15,476.8 39,444.9 96,382.6 % 43.0 16.1 40.9 100.0
Source: Presidential Reports.
Federal funds allocated to RDP grew rapidly between 1996 and 2001 and more slowly thereafter. Altogether, they increased nearly fivefold between 1996 and 2004 (Table 3.2). On average, for the entire period, RDP accounted for 31 percent of all Alianza funds20 (Table 3.3).
RDP is the most important of the three main decentralized programs. It absorbed, on average, slightly above50 percent of the resources allocated to all three programs in 1999‐04. These three programs absorbed, in turn, 61 percent of the public resources going into Alianza in that period (Table 3.3).
20 There is some discrepancy between the Alianza data reported in the Presidential Reports, used in Tables 3.1 and 3.2, and those provided by SAGARPA, used in Table 3.3. For that reason the figures for RDP resources in Table 3.3 do not equal the sum of federal and state contributions to RDP in Table 3.2.

Decentralized Service Delivery for the Poor 247
Table 3.2: RDP Resources by Sources of Funding, million MxP of 2004
Resources of Rural Development Program Year Federal States Producers Total 1996 616.9 373.9 452.1 1,442.9 1997 814.8 596.8 505.4 1,917.0 1998 954.8 479.2 828.6 2,262.6 1999 1,342.7 565.8 681.7 2,590.2 2000 1,787.1 520.6 926.1 3,233.8 2001 2,344.3 648.0 870.7 3,863.0 2002 2,512.8 599.2 838.6 3,950.6 2003 2,427.9 563.0 1,202.0 4,192.9 2004 2,955.1 473.1 1,142.7 4,570.9 All 15,756.4 4,819.6 7,447.9 28,023.9 % 56.2 17.2 26.6 100.0
Source: Presidential Reports.
Table 3.3: Public Resources of Decentralized Programs, million 2004 MxP Decentralized Programs %
Year Agriculture Livestock Rural Dev. All All Alianza Decentral. 1999 1,305.0 657.0 1,770.0 3,732.0 5,207.6 71.7 2000 897.2 650.6 2,574.3 4,122.1 4,970.3 82.9 2001 1,152.3 732.2 1,932.0 3,816.5 6,633.2 57.5 2002 1,481.8 789.5 2,288.3 4,559.6 9,270.6 49.2 2003 1,757.8 894.7 2,305.7 4,958.2 8,555.7 58.0 2004 1,920.4 1,056.9 2,710.4 5,687.7 9,364.6 60.7
Total/average 8,514.5. 4,780,9 13,580.7 26,876.1 44,002.0 61.1 Note: Only federal and state contributions included. SOURCE: Based on SAGARPA figures
3. Contribution of State Governments to Alianza
We investigated in our national interviews and during field work in the states the incentives for states to contribute to Alianza, in order to understand why their contribution is small –only around one sixth of the total. We notice, first, that state contributions are voluntary, not a fixed proportion of federal funding as is the case in other programs where a state pari passu is demanded. Before 2001, state contributions were part of the negotiation with SAGARPA for the allocation of federal funds. As explained before, after 2001 a formula was applied which included state counterpart funding as part of the criteria for allocating funds to the states (see Box 2). The formula is seen by SAGARPA as an incentive to increase state contributions. Whether it is a sufficient incentive is doubtful, however. We do not know what the contribution would have been in the absence of it, but we know that (1) according to the formula, the part of funds allocated in relation to counterpart state funding in the current year (compared with the average contribution from all states) was only 7.5 percent in 2005, and less in

Decentralized Service Delivery for the Poor 248
the years before21, and (2) the total funding from all states decreased from 2001 onwards (Table 3.1).
During field work we have come across three points of view with respect to the incentives for state governments to contribute counterpart funds. One is that the federal contribution stimulates counterpart funding because of the formula. The second is that federal funding crowds out state funding; i.e. states do not invest much in certain programs because there is already a substantial investment from the federal level. A third reason is that states do not contribute more because either the funds available for ARD activities are already committed in on‐going programs (this is for instance the case with the fertilizer program in Guerrero) or they prefer to apply them to programs of their own design (like with the Núcleos de Desarrollo Comunitario program in Jalisco).
Looking at state and federal contributions per capita of rural population in Figure 3.1, we see that (1) there is significant dispersion in the size of state contributions, and (2) the amount of funding from both sources moves in the same direction. The coefficient of variation of state contributions and the squared correlation coefficient of state and federal contributions are in fact large, 1.85 and 0.70 respectively. Two explanations are possible for the high correlation. One is that the two sources of funding are complementary, one calling for the other. The second is that, presumably, better off states have more resources available to invest in Alianza, and hence contribute more funds, but they also receive larger federal allocations (see below).
Figure 3.1: Distribution of States According to their Contributions to Decentralized Alianza Funds per Head of
Rural Population. Average 2001‐05
R2 = 0.6951
0
50
100
150
200
250
0 100 200 300 400 500 600Federal Contribution (MxP)
Stat
e con
tribu
tion
(MxP
)
Source: Calculated from SAGARPA figures
21 Thus, only 25% of the 60% distributed according to the formula is allocated according to performance indicators, of which one, with 50% weight, refers to the contribution of the state in the current year compared to the contribution from all states (see Box 2).
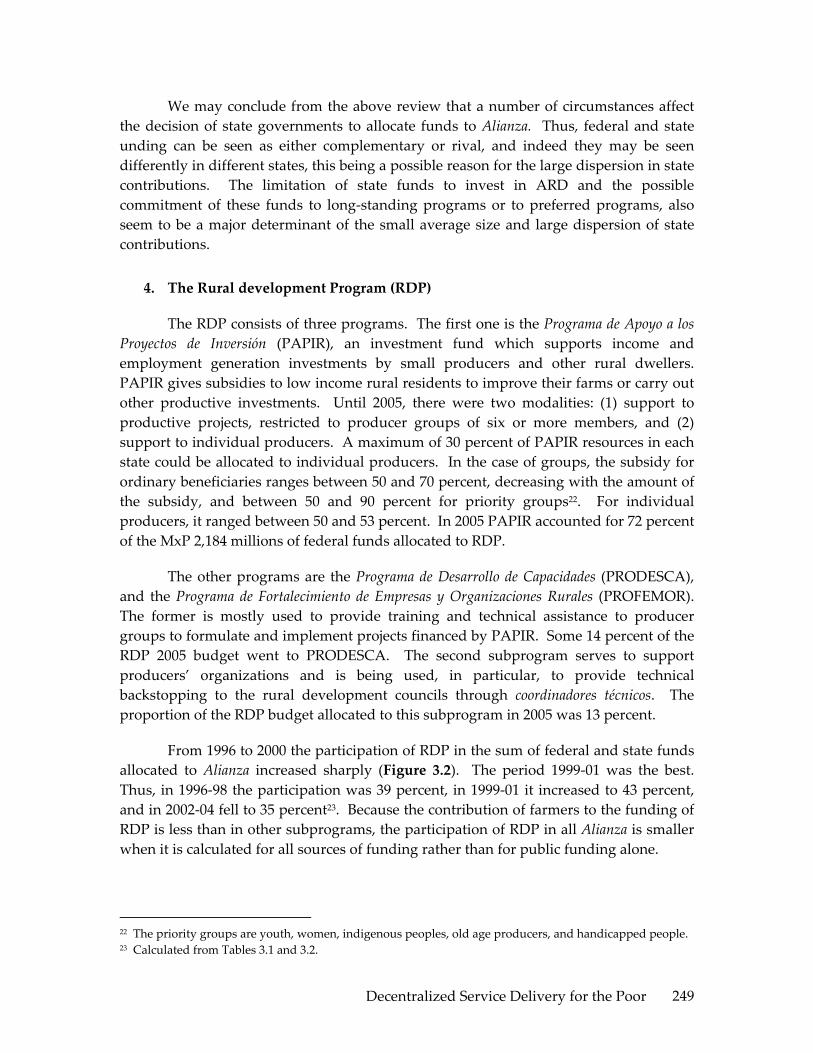
Decentralized Service Delivery for the Poor 249
We may conclude from the above review that a number of circumstances affect the decision of state governments to allocate funds to Alianza. Thus, federal and state unding can be seen as either complementary or rival, and indeed they may be seen differently in different states, this being a possible reason for the large dispersion in state contributions. The limitation of state funds to invest in ARD and the possible commitment of these funds to long‐standing programs or to preferred programs, also seem to be a major determinant of the small average size and large dispersion of state contributions.
4. The Rural development Program (RDP)
The RDP consists of three programs. The first one is the Programa de Apoyo a los Proyectos de Inversión (PAPIR), an investment fund which supports income and employment generation investments by small producers and other rural dwellers. PAPIR gives subsidies to low income rural residents to improve their farms or carry out other productive investments. Until 2005, there were two modalities: (1) support to productive projects, restricted to producer groups of six or more members, and (2) support to individual producers. A maximum of 30 percent of PAPIR resources in each state could be allocated to individual producers. In the case of groups, the subsidy for ordinary beneficiaries ranges between 50 and 70 percent, decreasing with the amount of the subsidy, and between 50 and 90 percent for priority groups22. For individual producers, it ranged between 50 and 53 percent. In 2005 PAPIR accounted for 72 percent of the MxP 2,184 millions of federal funds allocated to RDP.
The other programs are the Programa de Desarrollo de Capacidades (PRODESCA), and the Programa de Fortalecimiento de Empresas y Organizaciones Rurales (PROFEMOR). The former is mostly used to provide training and technical assistance to producer groups to formulate and implement projects financed by PAPIR. Some 14 percent of the RDP 2005 budget went to PRODESCA. The second subprogram serves to support producers’ organizations and is being used, in particular, to provide technical backstopping to the rural development councils through coordinadores técnicos. The proportion of the RDP budget allocated to this subprogram in 2005 was 13 percent.
From 1996 to 2000 the participation of RDP in the sum of federal and state funds allocated to Alianza increased sharply (Figure 3.2). The period 1999‐01 was the best. Thus, in 1996‐98 the participation was 39 percent, in 1999‐01 it increased to 43 percent, and in 2002‐04 fell to 35 percent23. Because the contribution of farmers to the funding of RDP is less than in other subprograms, the participation of RDP in all Alianza is smaller when it is calculated for all sources of funding rather than for public funding alone.
22 The priority groups are youth, women, indigenous peoples, old age producers, and handicapped people. 23 Calculated from Tables 3.1 and 3.2.
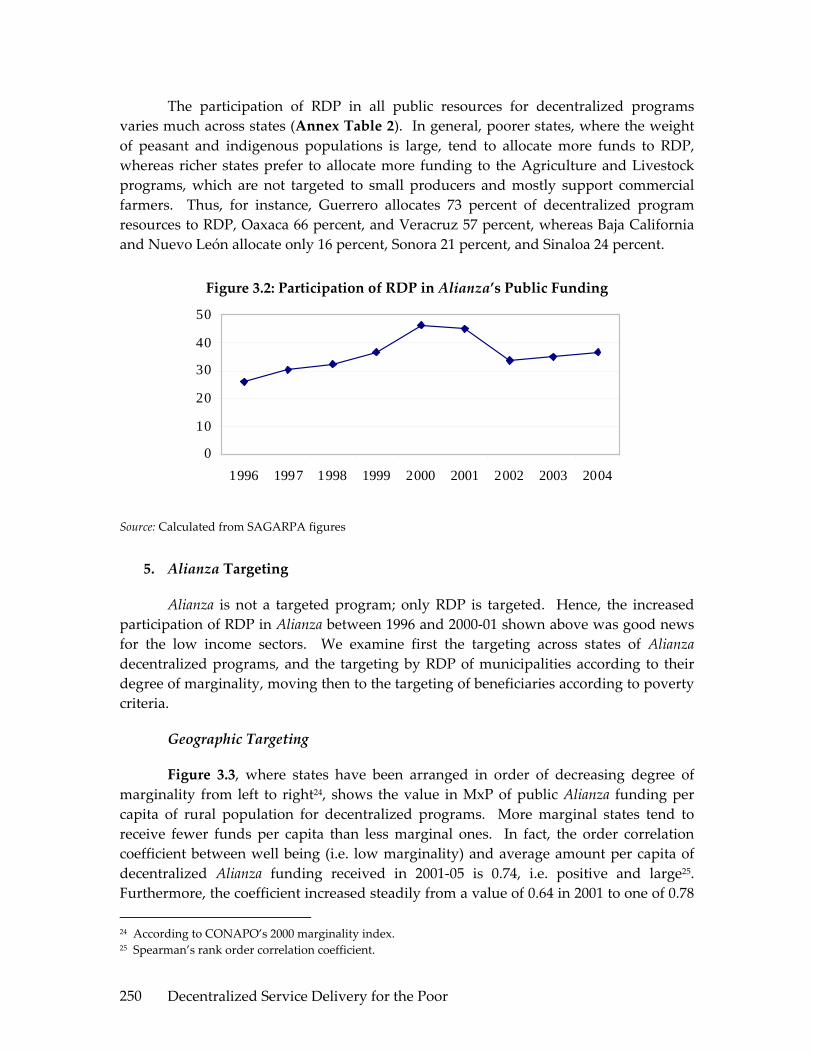
Decentralized Service Delivery for the Poor 250
The participation of RDP in all public resources for decentralized programs varies much across states (Annex Table 2). In general, poorer states, where the weight of peasant and indigenous populations is large, tend to allocate more funds to RDP, whereas richer states prefer to allocate more funding to the Agriculture and Livestock programs, which are not targeted to small producers and mostly support commercial farmers. Thus, for instance, Guerrero allocates 73 percent of decentralized program resources to RDP, Oaxaca 66 percent, and Veracruz 57 percent, whereas Baja California and Nuevo León allocate only 16 percent, Sonora 21 percent, and Sinaloa 24 percent.
Figure 3.2: Participation of RDP in Alianza’s Public Funding
0
10
20
30
40
50
1996 1997 1998 1999 2000 2001 2002 2003 2004
Source: Calculated from SAGARPA figures
5. Alianza Targeting
Alianza is not a targeted program; only RDP is targeted. Hence, the increased participation of RDP in Alianza between 1996 and 2000‐01 shown above was good news for the low income sectors. We examine first the targeting across states of Alianza decentralized programs, and the targeting by RDP of municipalities according to their degree of marginality, moving then to the targeting of beneficiaries according to poverty criteria.
Geographic Targeting
Figure 3.3, where states have been arranged in order of decreasing degree of marginality from left to right24, shows the value in MxP of public Alianza funding per capita of rural population for decentralized programs. More marginal states tend to receive fewer funds per capita than less marginal ones. In fact, the order correlation coefficient between well being (i.e. low marginality) and average amount per capita of decentralized Alianza funding received in 2001‐05 is 0.74, i.e. positive and large25. Furthermore, the coefficient increased steadily from a value of 0.64 in 2001 to one of 0.78 24 According to CONAPO’s 2000 marginality index. 25 Spearman’s rank order correlation coefficient.

Decentralized Service Delivery for the Poor 251
in 2005 (Annex Table 3). On the whole, hence, according to a targeting criteria based on state marginality, the decentralized funding of Alianza is regressive, and increasingly so.
We turn the attention now to RDP and look at the level of marginality of the municipality of residence of beneficiaries. Of all 2004 beneficiaries, 47 percent lived in very high or high marginality areas (where 49 percent of the rural population lives), and a similar proportion of beneficiaries live in municipalities of medium or low marginality, compared to 39 percent of the rural population (Figure 3.4). This is in spite of the fact that the operation rules of the Program indicate that 70 percent of the Program funds managed by the states should go to localities of high or very high marginality. As shown in Figure 3.4, the distribution of funds is more regressive than that of beneficiaries.
Figure 3.3: Decentralized Alianza Funds per Head of Rural Population. Federal and State Contributions. Average 2001‐05
in MxP
0
100
200
300
400
500
600
700
800
Chiapa
s
Guerre
ro
Oaxaca
Veracru
z
Hidalgo
S. Luis
Potosí
Puebla
Campe
che
Tabasc
o
Michoa
cán
Yucatá
n
Zacatec
as
Guana
juato
Nayari
t
Sinaloa
Querét
aro
Durang
o
Tlaxcal
a
Morelos
Quintan
a Ro
México
Colima
Tamau
lipas
Sonora
Jalisc
o
Chihua
hua
Baja Cali
fornia
Sur
Aguasc
alien
tes
Coahu
ila
Baja Cali
fornia
Nuevo
León
Averag
e
MxP
per
Uni
t of R
ural
Pop
ulat
ion
Federal State
Source: Calculated from SAGARPA figures

Decentralized Service Delivery for the Poor 252
Figure 3.4: Distribution of Beneficiaries and Funds of the RDP According to the Marginality of their Area of Residence
05
10
152025
30354045
Very High High Medium Low Very Low
Perc
enta
ges
Beneficiaries Funds
Source: FAO: Informe de Evaluación de la Alianza para el Campo, 2004
In Table 3.4 we compare the distribution of (1) RDP beneficiaries, (2) RDP funds accruing to these beneficiaries, and (3) the rural population, according to the marginality index of the municipality of residence. There are not big differences in the distribution by the marginality index of RDP beneficiaries and the rural population. The main ones are in the extremes: RDP has difficulty in reaching municipalities of very high marginality but tends to stay away from municipalities of very low marginality. On the whole, the distribution of RDP according to the marginality of the municipality of residence seems to be neutral. The picture is different when we look at the distribution of funds, which is biased in favor of residents in municipalities with low marginality. Thus, 44.9 percent of the funds are allocated to residents in municipalities of low and very low marginality, and 31.9 percent to residents in municipalities of high and very high marginality index. Beneficiaries in the first two types of municipalities receive subsidies that are 53% higher than the average, whereas those in the latter two receive subsidies that are 32% lower than the average.
Table 3.4: Distribution of the Beneficiaries and Funds of RDP and of the Rural Population by Marginality of the Area of Residence
Marginality level Shares of Very high High Medium Low Very low
Rural population 13.9 35.5 22.7 16.7 11.2 Beneficiaries 6.7 40.1 23.8 23.3 6.0 Funds 1.7 30.2 23.3 37.1 7.8
Note: Rural population is defined as those living in localities of less than 5,000 inhabitants. Source: FAO, Informe de Evaluación de la Alianza, 2004 and World Bank staff estimates based on CONAPO 2000 and Székely and others 2005.

Decentralized Service Delivery for the Poor 253
Personal Targeting
FAO evaluations of Alianza distinguish five types of beneficiaries. The classification is designed to capture the poverty/wealth situation of beneficiaries, and is based on a composite index calculated from five variables: education, value of assets, livestock, land, and (an index indicator of) technology26. The average level of these characteristics for the 2004 sample of RDP beneficiaries is shown in Table 3.5. Roughly, Types I and II can be considered small producers, Type III middle producers, and Types IV and V large and very large producers.
Table 3.5: Characteristics of RDP Beneficiaries by Type, 2004 Type of Beneficiary Average Characteristics I II III IV V Total Beneficiaries (%) 37.8 41.9 17.8 2.5 0.0 100.0 Age (years) 45.2 45.3 45.9 53.9 43.0 45.3 Education (Years) 4.8 6.3 8.9 14.3 19.0 6.5 Value of Assets (MxP) 1,799 56,557 208,853 662,765 512,000 83,503 Number of Equivalent Cattle Units 5.6 8.3 13.8 28.6 71.0 8.9 Irrigated land Equivalent (hectare) 0.8 3.0 11.1 33.1 10.0 4.6 Technological Level 0.2 0.3 0.5 0.6 0.8 0.3 Source: FAO: Informe de Evaluación de la Alianza para el Campo, 2004
From Figure 3.5 it is apparent that RDP is the best targeted program of Alianza. Some 80 percent of RDP beneficiaries belong to Types I and II, compared with 56 percent of the beneficiaries of the Agriculture program and 34 percent of the Livestock program. The distribution of beneficiaries by type for the entire Alianza program is very similar to that of the Agriculture program.
26 The FAO evaluation of Alianza for 2004 was based on a sample of beneficiaries of 30 states with two sampling frameworks, one for beneficiaries of Alianza in 2002, which included 15,898 producers, and the other for beneficiaries of Alianza in 2004, which included 12,109 producers. The first sampling framework was used to estimate the impact of the 2002 Alianza program. Both samples included beneficiaries from the Agriculture, Livestock and Rural Development programs. Interviews were carried out in April‐June 2005.

Decentralized Service Delivery for the Poor 254
Figure 3.5: Distribution of 2004 Alianza Beneficiaries by Program and Type
05
101520253035404550
Type 1 Type 2 Type 3 Type 4 Type 5
Perc
enta
ge o
f Ben
efic
iarie
s
Agriculture Livestock Rural Develop. All Alianza
Source: FAO: Informe de Evaluación de la Alianza para el Campo, 2004
The difference between the distribution of beneficiaries and funds is clear in Figure 3.6. The percentage of funds accruing to beneficiaries of Types I and II is smaller than that of the number of beneficiaries of these types, while the opposite is true for Types III and IV. There are hardly any Type V beneficiaries of RDP.
Figure 3.6: RDP 2004: Beneficiary and Fund Distribution by Type
0
10
20
30
40
50
Type 1 Type 2 Type 3 Type 4 Type 5
Perc
enta
ge o
f Ben
efic
iari
es
Beneficiaries Funds
Source: FAO: Informe de Evaluación de la Alianza para el Campo, 2004
We do not have systematic information on the distribution of beneficiaries by state, and hence we do not know how consistent is the pattern shown in Figure 3.5 across states. From our field work and national interviews, there is the impression that the better off the state the more biased the distribution in favor of higher type beneficiaries. Thus, for instance, we observed that leakage of benefits to producers not in the target group of RDP was a concern of program operators in Jalisco, because they

Decentralized Service Delivery for the Poor 255
thought it to be large, but not in Guerrero and Veracruz, because they did not think it was important.
A limitation of the FAO database is that it only contains data of Alianza beneficiaries, without a control group. It is not possible, therefore, to compare the distribution of beneficiaries with that of the control group. We have tried to overcome this by comparing the distribution of RDP beneficiaries with that of the rural population captured by ENHRUM27. To do this, we classify the overall rural population (as surveyed by ENHRUM) in the same 5 types of the FAO evaluation, and compare the distribution by types of RDP beneficiaries with that of the rural population28. Results are shown in Figure 3.7.
Figure 3.7: Comparison of the Distribution by Type of the Rural Population (families) and the Population of RDP Beneficiaries
01020304050607080
I II III IV V
Beneficiary Type
Perc
enet
age
Poblacion Rural Beneficiarios Apoyos
Source: Calculated on the basis of Alianza RDP evaluation report and ENHRUM data
The two distributions are different. The poorest households (those in Type I) are under‐represented in the population of RDP beneficiaries, while those in Types III and IV are over‐represented, both in terms of families and of funds. Based on the ENHRUM sample, we have estimated the average household expenditure and its standard deviation for families in the first three beneficiary types29. On the basis of this and of the poverty lines, and assuming that household expenditure is normally distributed, we have estimated the percentage of RDP beneficiaries under the poverty lines, i.e. who are extreme or moderate poor. The results are shown in Table 3.6.
27 The Encuesta Nacional de Hogares Rurales de México (ENHRUM), taken in 2002 in collaboration between INEGI and El Colegio de México, covers some 1,800 rural households and is representative at the national and large regional levels. 28 Unfortunately, the variables used to construct the technology level indicator included in the FAO typology were not available in the ENHRUM database. The ENHRUM‐based typology was thus constructed without this indicator. 29 The number of observations for families in types IV and V in the ENHRUM sample was too small for meaningful analysis.

Decentralized Service Delivery for the Poor 256
Table 3.6: Average Annual Household Expenditure in 2002 (in 2002 Pesos) and Percentage of Poor Households in Types I to III
of RDP and Alianza Beneficiaries
Region Type I Type II Type III Avg. I to III RDP
Avg. I to III Alianza
National Average HH Expenditure 29,132 51,997 183,604 69,620 93,170 % Extreme Poor 45.9 29.6 13.4 32.4 27.6 % Moderate Poor 64.2 42.8 16.3 45.4 38.3 South East Average HH Expenditure 17,326 35,762 nd nd nd % Extreme Poor 63.8 38.3 nd nd nd % Moderate Poor 87.4 58.0 nd nd nd Center‐West Average HH Expenditure 38,080 62,925 nd nd nd % Extreme Poor 34.6 22.7 nd nd nd % Moderate Poor 56.0 34.6 nd nd nd Notes: (1) 2002 annual household poverty lines: Extreme = MxP 25,244; Moderate = MxP 42,942 (2) nd indicates that the number of cases in the sample were too few for meaningful estimates (3) Percentage of poor estimated from poverty lines and household distribution parameters assuming normality in the distribution. Source: ENHRUM for household expenditure and World Bank 2004 for expenditure poverty lines.
Table 3.6 confirms the connection between beneficiary type according to the FAO classification and household welfare measured by the level of household expenditure30. It also confirms that RDP is better targeted than the entire Alianza (i.e. including also the Agriculture and Livestock programs). RDP itself, however, is not well targeted. At the national level, an estimate of only 32 percent of ARD beneficiaries are extreme poor and 45 percent moderate poor.
There are various reasons for the inadequate targeting of RDP. The main ones seem to be three. First, because of its core design as a farm subsidy program, RDP mostly benefits farmers, even if mainly small ones. Farmers who apply to the program have already some level of productive assets; the nearly assetless at the bottom of the income pyramid have little to obtain from the program and would not normally apply. Second, Alianza operates on a matching grant basis. The poorest potential beneficiaries may not have counterpart matching resources to offer. Finally, the way RDP is implemented may also contribute to the targeting bias. Thus, dissemination is often inappropriate, harming poor rural dwellers that tend to have less access to information.
30 We use expenditure rather than income because of higher measurement reliability in the ENHRUM survey and because it is a better welfare indicator of household welfare.

Decentralized Service Delivery for the Poor 257
Also, private service providers who play a key role in the dissemination of the program and the preparation of proposals do usually find it easier to work with comparatively larger farmers.
We can observe, however, big regional differences in Table 3.6. Thus, in the poor South East region income levels for the same type of beneficiaries are much smaller, approximately half the levels registered in the rich Centre‐West region. Accordingly, the percentage of poor in Types I and II is much higher in the former than in the latter region. RDP seems hence to be better targeted in poorer regions.
From the evidence here presented it would seem that the RDP has been good at reaching beneficiaries of Type II, but has found difficulties in reaching those of Type I, and has benefited more than a fair share of the population in Types III and IV.
6. Economic Impact
Alianza subsidies had a significant measurable impact on the economy of beneficiaries. Based on data from the 2004 FAO evaluation, we show in Figures 3.8 and 3.9 the impact of Alianza subsidies on gross income, employment, assets, and technology of beneficiaries of the 2002 Agriculture, Livestock and Rural Development programs. Impact relates to the period expanding between when the beneficiary received Alianza’s support in the second part of 2002 and when he/she was interviewed in the first part of 2005. Figures are based on beneficiaries’ perceptions (stated during the evaluation interviews) of how Alianza impacted the above variables.
On average, Alianza helped expand beneficiaries’ gross income by close to 17 percent, much more than employment, which increased 3 percent only31. The impact on income was particularly noticeable in Type II and III beneficiaries, and was bigger in rural development than in other programs. The impact on employment was bigger for Type I beneficiaries, and small for all other beneficiary categories.
31 Most of the impact on gross income (76%) was due to output growth, following increases in scale (73%) and yields (37%). The remaining 24% was due to improvement in prices due to marketing and quality enhancing investments.

Decentralized Service Delivery for the Poor 258
Figure 3.8: Percentage Increase in Employment and Gross Income of Alianza 2002 Beneficiaries between 2002 and 2005
05
101520253035
Type I
Type I
I
Type III
Type I
V
Type V
Agricu
lture
Livestock
Rur. D
ev.
All Alia
nza
Employment G. Income
Source: FAO: Informe de Evaluación de la Alianza para el Campo, 2004
Figure 3.9: Percentage Increase in Assets and Technology Level of Alianza 2002 Beneficiaries between 2002 and 2005
0102030405060708090
100
Type I
Type II
Type III
Type IV
Type V
Agricu
lture
Livestock
Rur. Dev
.
All Alia
nza
Assets Technology
Source: FAO: Informe de Evaluación de la Alianza para el Campo, 2004
As a consequence of Alianza support, the value of beneficiaries’ assets increased 13 percent32, and the impact on a technology index33 was 21 percent. Not surprisingly, Alianza’s impact on assets and technology is largest for Type I beneficiaries, decreasing
32 This includes the value of the assets supplied with Alianza support and an additional increase of 43 percent in the value of beneficiaries’ assets that they ascribe to the effect of Alianza. 33 In the case of agriculture, the index of technology level includes indicators of quality of planting material, use of machinery, availability and type of irrigation, and use of fertilizer. In the case of livestock, the elements included are quality of the stock, type of feeding used, and type of infrastructure. The indices move between 0 and 1. We have calculated the technology impact as the percentage change in the value of the index between 2002, before Alianza support, and 2005.
Decentralized Service Delivery for the Poor 259
rapidly as the beneficiary category increases, and is larger for RDP than for the other programs.
There is no information on the aggregate impact of Alianza on national employment and output, but it is expected to be small in view of the limited number of beneficiaries compared to the total number of producers. Thus, the annual number of direct beneficiaries with investment subsidies of the three main decentralized programs of Alianza in 2002 was 165 thousand individuals34, compared to a rural labor force of the order of ten million and an agricultural labor force of the order of six million. Since the number of direct beneficiaries and that of workers in the rural labor force have not changed much over the last years, we can conclude that, each year, some 1.7 percent of the labor force in rural areas and some 2.7 percent of those employed in agriculture received direct investment support from decentralized Alianza programs.
IV. MUNICIPAL DECENTRALIZATION
Since 2002, an increasing proportion of RDP funds was decentralized to municipalities. Municipal decentralization or municipalización was promoted by SAGARPA in order to involve municipalities in ARD undertakings and strengthen the Consejos Municipales de Desarrollo Rural Sustentable (CMDRS) –the municipal RD councils‐‐ created by LDRS. Not all states entered municipal decentralization in 2002, but by 2005 state governments had all decentralized Alianza RDP funds to their municipalities to a greater or lesser extent. Municipal decentralization is formalized through a document signed by the corresponding state authorities, municipal authorities and SAGARPA authorities in the state, where the respective obligations are stated. Municipal govern‐ments are supposed to contribute counterpart funds, but this is not compulsory. In some cases, like in Guerrero, which was one of the first states to decentralize, municipalización was seen as a way to increase the counterpart contribution from the state to federal Alianza funding, since funds from state governments and municipalities were added together as “state counterpart”.
1. Alianza Funding of Municipalities
In the 2005 budget, the municipally decentralized funds amounted to MxP 1,817 million. This is equivalent to two thirds of the public funding of RDP, and one fourth of that of the entire Alianza (see Annex Table 4).
The percentage of public funding of Alianza and RDP going to municipalities varies much across states (Figure 4.1). There seems to be some association between state
34 Calculated by dividing the total amount of resources going into the three main decentralized programs of Alianza in 2002, which was MxP 8,278 million, into the average value per beneficiary of Alianza resources for these programs in that year, which was MxP 50 thousand (both figures include the contribution from SAGARPA, state governments, and beneficiaries).
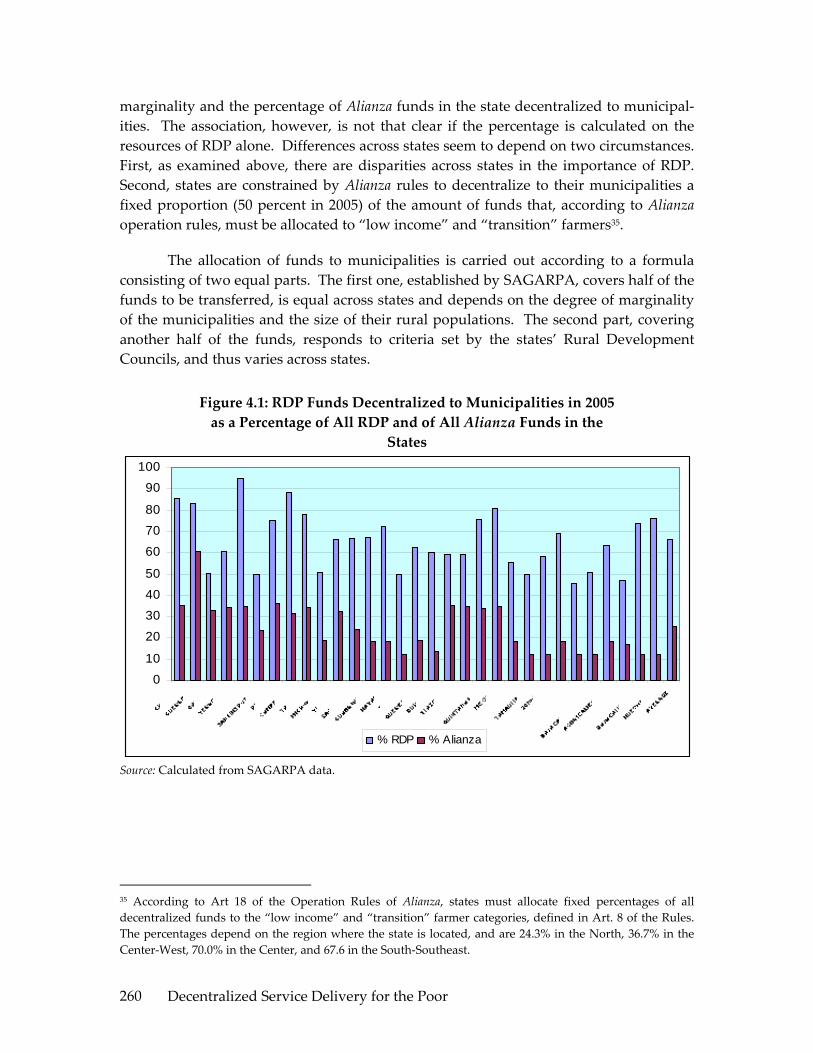
Decentralized Service Delivery for the Poor 260
marginality and the percentage of Alianza funds in the state decentralized to municipal‐ities. The association, however, is not that clear if the percentage is calculated on the resources of RDP alone. Differences across states seem to depend on two circumstances. First, as examined above, there are disparities across states in the importance of RDP. Second, states are constrained by Alianza rules to decentralize to their municipalities a fixed proportion (50 percent in 2005) of the amount of funds that, according to Alianza operation rules, must be allocated to “low income” and “transition” farmers35.
The allocation of funds to municipalities is carried out according to a formula consisting of two equal parts. The first one, established by SAGARPA, covers half of the funds to be transferred, is equal across states and depends on the degree of marginality of the municipalities and the size of their rural populations. The second part, covering another half of the funds, responds to criteria set by the states’ Rural Development Councils, and thus varies across states.
Figure 4.1: RDP Funds Decentralized to Municipalities in 2005 as a Percentage of All RDP and of All Alianza Funds in the
States
0
10
20
3040
50
60
7080
90
100
% RDP % Alianza
Source: Calculated from SAGARPA data.
35 According to Art 18 of the Operation Rules of Alianza, states must allocate fixed percentages of all decentralized funds to the “low income” and “transition” farmer categories, defined in Art. 8 of the Rules. The percentages depend on the region where the state is located, and are 24.3% in the North, 36.7% in the Center‐West, 70.0% in the Center, and 67.6 in the South‐Southeast.

Decentralized Service Delivery for the Poor 261
2. Municipal Decentralization Systems
There are two systems of municipal decentralization, of which only the first can be properly considered decentralized. In both systems, the approval of funding requests from producers resident in a municipality is constrained by the resources allocated to that municipality by the decentralization formula. Under the first system, however, (i) funds are transferred to a municipal account, and (ii) the entire cycle of reception, screening, prioritization and selection of requests, and disbursement of funds, is carried out at the municipal level. In the second system, no separate account is opened. Requests are received and preliminarily screened and prioritized in the municipality, but the final selection is performed at state level by the technical committee of Alianza’s fideicomiso, which also disburses the funds.
The first system is restricted to municipalities satisfying certain conditions. These conditions are: (1) the existence and functioning of a CMDRS, (2) the existence of a rural development plan of the municipality, validated by the CMDRS, (3) the existence of a rural development department within the municipal administration, and (4) the existence of a programmed budget for the current year. This system relies heavily on CMDRS and also on the strength of municipal administrations, which, as explained below, incur into many obligations.
3. The Role of RD Councils and Municipal Authorities
CMDRS are part of the complex architecture for economic governance and the execution of public policy in rural areas set up by LDRS. This architecture has a sectoral or product‐based axis consisting of product chains and their governance organizations (the Comités de Sistema Producto), and a territorial‐based axis formed by a three‐level system of rural development councils: the municipal, district and state RD councils. At the top of the system are (1) the inter‐secretarial committee chaired by SGARPA, the CIDRS, integrated by federal secretaries related to rural development, as explained above, which has strong policy functions, and (2) the national‐level rural development council, the Consejo Mexicano para el Desarrollo Rural Sustentable, with consultative functions, where national producer organizations, academic and research entities, product chain representatives, and the private sector are represented alongside the federal secretarías included in CIDRS. This governance structure is complemented by a collection of national systems governing the provision of rural services (such as rural finance, agricultural research an innovation, sanitary and phytosanitary services, technical assistance and training, information, social wellbeing, and others), usually chaired by SAGARPA, which include members from other federal entities and civil society.
Since the approval of LDRS in December 2001, SAGARPA has been busy helping create the RD councils indicated in the law. State‐level councils are now in operation in all states, and municipal councils have been created in most rural municipalities.

Decentralized Service Delivery for the Poor 262
District‐level councils have also been created in most states, but more attention is being given by SAGARPA to the creation or strengthening of municipal than of district councils36.
Functions and Weaknesses of Municipal RD Councils
CMDRS are integrated by (i) the municipal president and other representatives from the municipality, usually the person responsible for the municipal rural development office, (ii) representatives of state government offices and of the federal offices related to rural development operating in the municipality, and (iii) representatives of social and private associations active in ARD in the municipality. They are usually –but not necessarily—chaired by the presidente municipal, and are generally assisted by a technical coordinator (normally an agronomist or veterinarian), appointed by de council from among technicians suggested by SAGARPA, the state government or both, who are generally paid with funds from Alianza’s RDP (from the PROFEMOR program).
Although the functions of CMDRS are not explicitly stated in LDRS, from the operation rules of Alianza, and from their statutes we can infer that municipal councils are supposed to: (i) be a locus for rural development planning in the municipality, (ii) facilitate the operation of state or federal ARD programs in the municipality, (iii) run demand‐driven programs such as RDP, receiving, prioritizing and approving funding proposals from producers, and disbursing the funds, (iv) be a locus for the local coordination of different rural programs and the local harmonization of funding, and (v) be an instance of representation of local rural interests. These are important functions which would make CMDRS a formidable instrument of decentralized rural economic governance if they were able to fulfill them well.
There is no doubt that CMDRS are a step forward in the creation of decentralized participatory structures for the implementation of ARD policies and programs, and to build public‐private‐civil society alliances. Unfortunately, most municipal councils are not able to discharge the above functions in an effective manner, although, of course, local situations vary considerably in this respect.
From our field work and national interviews there appear to be some recurrent weaknesses of CMDRS. First, they do not have the technical capacity to perform an effective planning role and establish a medium or long term rural development agenda for the municipality. They are, thus, mostly confined to act as passive recipients of atomized requests from local producers, and as disseminators to their communities and other constituencies of government rules and instructions. Second, more often than not councils are dominated by presidentes municipals, technical coordinators or members
36 This is surprising because the Law places more emphasis on district councils, to which a whole chapter (Chapter IV) is devoted.

Decentralized Service Delivery for the Poor 263
representing SAGARPA or the state’s rural administration. We have seen this in municipal council meetings in Guerrero, Jalisco and Veracruz, and it was confirmed to us by local actors during focus group meetings. Councils, thus, often behave as arms of government (municipal, state or federal) rather than as constructions of rural society. Third, members from ejidos and communities, who are the majority of civil society participants in most councils, rotate frequently, usually every year. This makes it very difficult for them to understand the purpose and workings of the councils, assimilate the basic rules of the programs, and participate effectively. Forth, asymmetry of information dominates municipal councils. Thus, federal and state government participants, who are responsible for the implementation of programs and the application of program rules, know these rules better than municipal authorities, although some authorities may also be informed, and much better than civil society participants. The play field is, hence, not leveled.
Finally, state and federal government entities different from SAGARPA and the states’ rural administrations are not normally interested in CMDRS, and do not usually participate in them. The councils, and to a large extent the entire governance structure delineated by LDRS, is commonly seen as something alien by other government entities. This is part of the long‐standing segmentation of government in Mexico, explained by a long tradition of strong sectoral authorities responding to a strong presidency. In the imaginario colectivo of the Mexican public administration class, LDRS is perceived as pertaining to SAGARPA and, to some extent also, to state rural administrations, in the same way in which other laws are seen as pertaining to other secretarías, like the Ley de Desarrollo Social to SEDESOL. This is in spite of the fact that the top RD government body, CIDRS, includes all relevant secretarías, and so does the Consejo Mexicano para el Desarrollo Rural Sustentable. As a result, municipal councils cannot exercise the functions of program coordination and funding harmonization that would be so useful. In practice, they are normally limited to the implementation of one program only: Alianza’s RDP.
In view of these weaknesses, there are legitimate grounds to suspect that most municipal councils will never be able to properly fulfill the desired functions, unless there are dramatic changes. The underlying problem seems to be that the municipal level is not the most appropriate one for the discharge of these functions. Thus, it is difficult to imagine that small rural municipalities will ever have the technical staff and sophistication required to carry out strategic planning and the design of an innovative rural agenda. Or that they will be able to organize in a structured manner the joint budgeting exercises required for a true harmonization of funding. The municipal rural space in Mexico is far too small, and the municipal administration far too weak and committed to other activities for municipal councils to be effective economic governance entities in the above sense. CMDRS are useful public‐private platforms, which can play important roles in RD, and they certainly are a step forward in decentralization and civil society participation, but their functions need to be adjusted. District councils, operating

Decentralized Service Delivery for the Poor 264
in larger rural spaces, seem a more appropriate territorial entity for broad economic governance. We explore more this theme later in this document.
Issues in the Involvement of Municipal Authorities
Municipal authorities are given many more responsibilities in rural development, in the implementation of Alianza in particular, than is usually acknowledged. They do not just participate in and often chair and animate CMDRS, but they must also perform a long series of activities indicated in LDRS, in the operation norms of Alianza and in the convenios de ejecución of different rural programs. Two issues may be highlighted in this respect.
First, municipal authorities are not in a strong position to carry out rural development activities. In the tradition of municipal government in Mexico, as in that of most countries, service provision and the development of urban centers are the focus of municipal activity. Supporting economic development in rural areas is not a field where municipal governments have experience or feel comfortable37. Rural development, or economic development for that matter, is not an area explicitly included among the many municipal functions listed in Art. 115 of the Mexican Constitution. Also, the Mexican system of three year municipal administrations with no reelection is inimical to the long term perspective required by rural development.
Second, as argued by Merino and Macedo38, the numerous additional activities required from municipalities by the new normative instruments39 have been established with little regard to the administrative restrictions, procedures, and routines of municipal governments40. As a consequence, these governments have “adapted the new policy to their own routines instead of modifying their behavior in relation to the new
37 For an analysis of the lack of involvement and difficulties faced by municipal governments in Mexico, particularly in small municipalities, to promote local economic development, see Jesús Arroyo Alejandre and Antonio Sánchez Bernal: “Políticas municipales para la promoción del desarrollo económico regional”, in Enrique Cabrero Mendoza (ed.): Políticas públicas municipales: una agenda en construcción. CIDE, Mexico DF, 2003. 38 Mauricio Merino and Ignacio Macedo: “La política autista. Crítica a la red de implementación municipal de la Ley de Desarrollo Rural Sustentable”. CIDE’s working paper series No. 168, CIDE, Mexico DF, August 2005. 39 These instruments are: the Ley de Desarrollo Rural Sustentable, the Programa Especial Concurrente, the operation rules of Alianza, the convenios signed with the states, the statutes of the district councils, and the statutes of the municipal councils. 40 Merino and Macedo identify ten new activities to be carried out by municipalities in connection with the new ARD normative instruments. To carry out these activities municipalities must implement five organizational tasks: “(1) establish a collective body of citizens and federal, state and municipal authorities to partake in the rural development strategy; (2) have a plan and a budget with resources exclusively devoted to the rural development strategy; (3) appoint a formal entity to take charge of the administrative demands deriving from the implementation of the rural strategy; (4) identify producers’ organizations and promote their participation in the rural development strategy; and (5) establish specific procedures to handle the requests from producers with an intensive use of information and registry systems” (page 25).

Decentralized Service Delivery for the Poor 265
policy”. In order not to be left out of the benefits deriving from the new polices –mainly that of being able to expand the range of services available to rural producers in the municipality—and facing many difficulties to follow the letter of the law of the new normative instruments, they decided to adapt the new policy to the old routines. The implementation of new rural policies tend thus to be “swallowed” by the machine of municipal administration rather than generate qualitative change.
INSTITUTIONAL ASPECTS
V. INSTITUTIONAL FRAMEWORK
The following chart illustrates the network of relations that take place in the decentralized operation of rural development programs in Mexico. Arrows indicate the inputs that each level conveys to the others.
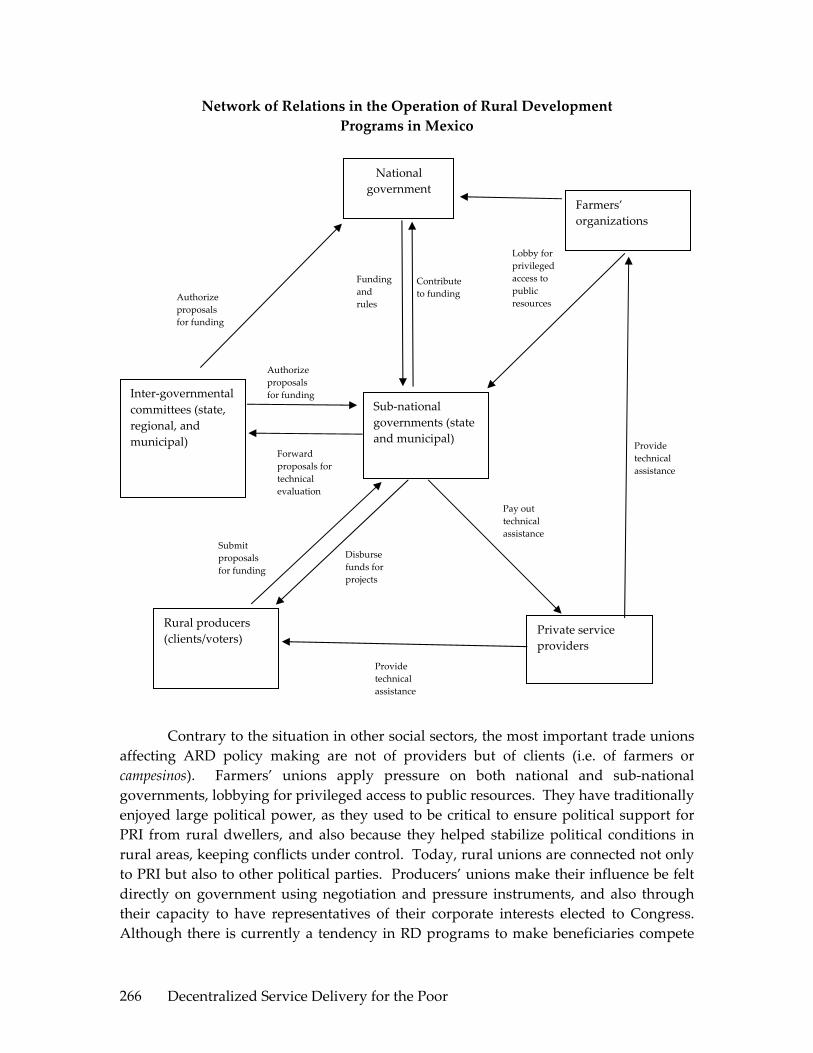
Decentralized Service Delivery for the Poor 266
Network of Relations in the Operation of Rural Development Programs in Mexico
Contrary to the situation in other social sectors, the most important trade unions affecting ARD policy making are not of providers but of clients (i.e. of farmers or campesinos). Farmers’ unions apply pressure on both national and sub‐national governments, lobbying for privileged access to public resources. They have traditionally enjoyed large political power, as they used to be critical to ensure political support for PRI from rural dwellers, and also because they helped stabilize political conditions in rural areas, keeping conflicts under control. Today, rural unions are connected not only to PRI but also to other political parties. Producers’ unions make their influence be felt directly on government using negotiation and pressure instruments, and also through their capacity to have representatives of their corporate interests elected to Congress. Although there is currently a tendency in RD programs to make beneficiaries compete
National government
Sub‐national governments (state and municipal)
Farmers’ organizations
Inter‐governmental committees (state, regional, and municipal)
Rural producers (clients/voters)
Private service providers
Funding and rules
Contribute to funding
Lobby for privileged access to public resources Authorize
proposals for funding
Authorize proposals for funding
Submit proposals for funding
Provide technical assistance
Provide technical assistance
Pay out technical assistance
Forward proposals for technical evaluation
Disburse funds for projects

Decentralized Service Delivery for the Poor 267
for resources with demand‐driven systems directly administrated by government or by joint committees, some rural programs, like many of the Alianza programs of ejecución nacional, set aside funds for farmers’ organizations, and implement programs through them41.
Two are the main roles that the federal government always plays in RD programs: to provide the funding, and to establish the rules of operation. Federal secretarías also participate in program implementation, but this may be shared with sub‐national authorities and civil society representatives. Program rules are mandatory for all players throughout the country. As explained before, in the case of decentralized programs, state and municipal governments are expected to contribute to funding, as well as to participate in decision‐making on the allocation of program resources. This is carried out through joint committees, such as the state and municipal RD councils or the technical committees of the fideicomisos, which establish rural development priorities and evaluate the quality of investment proposals submitted by producers.
Technical assistance to producers for the preparation of investment proposals and their implementation is given by service providers, who constitute the main interface between program government officials and beneficiaries. Service providers are also the main conveyors of information to producers on program opportunities and rules. They are hired under short‐term contracts by the federal or sub‐national governments or by producers themselves (with funds provided by the programs). Their pay usually comes from programs’ resources. In some cases, they may be employed on a more or less regular basis by farmer organizations, possibly unions, or associative enterprises. Service providers often use in their own advantage their position as intermediaries between government and producers and their superior information, but they are weak and disorganized as a corporate group, unable to act as one. Their situation is in this respect totally different from that of teachers or health workers. Thus, for instance, they are not unionized, are unprotected, and have no entitlement to secure employment or social security benefits. The position of service providers is thus extremely weak, and they receive little economic or moral incentives to do a good job. Nor do they receive technical backstopping, systematic and effective training, or support to operate as networks. These “street level” operators are probably the weakest link in the implementation chain.
VI. PROGRAM COMPACTS
We examine in this section the set of relations established in connection with ARD programs among different levels of government and between government and
41 Part also of the funding of RDP is not decentralized to states and municipalities but directly executed by SAGARPA´s national offices, who allocate the resources to farmers´ unions to carry out specific programs.
Decentralized Service Delivery for the Poor 268
“street level” program operators42. Of particular importance are the system of incentives, and the issues related to transparency and client accountability. Some of the issues to be examined have already been anticipated in PART I of this documents. For completeness, we will mention them here again but only briefly to avoid repetition.
1. The Federal‐State Compact
Three main aspects can be examined in this compact: the normative instruments; the funding and budgetary procedures; and the joint platforms.
Normative Instruments
As indicated before, operation rules are the basic normative instrument of programs. There is one set of rules per program issued annually by the responsible federal secretaría, after having been cleared by SHCP. They can change from year to year, and often do, but once issued they have legal force. Operation rules establish the objectives of programs, the eligibility conditions, the amount and type of benefits, and the implementation procedures, including the responsibilities of the various entities involved. All this is decided at the federal level, since, as already observed, state governments have no participation in the drafting of rules.
We came across three common complains during field work in connection to operation rules. The first one refers to their complexity. As observed in PART I, this makes rules difficult to understand by producers, especially low income ones who tend to be less educated and have less access to information. It strengthens, therefore, the dependency of beneficiaries on intermediaries, reinforcing clientelistic ties and increasing the effect of asymmetries of information in the working of councils.
The second complain refers to the difficulty often experienced by operators to adapt the rules to local circumstances, and the distortions that this introduces in the working of programs. One example repeatedly given to us is that of the need of producers to form groups of six persons or more and submit a joint investment proposal in order to qualify as beneficiaries of RDP. Since in many cases producers are not keen to form groups and carry out a collective investment, they form fake groups and disguise as a collective project what are in fact a set of individual investments. Service providers have become experts at preparing this type of projects, and government operators are inclined to turn a blind eye in order to facilitate program implementation and not to antagonize producers43.
42 We use here the framework of the World Development Report 2004: Making Services Work for the Poor, The World Bank, Washington, 2004, and that in Chapter 6 of the Rural Poverty report in World Bank, 2005, op. cit. 43 The rationale for the need to form groups is to concentrate investments. SAGARPA contrasts investment projects, which are sizable investments proposals technically prepared, to scattered support to small

Decentralized Service Delivery for the Poor 269
Finally, a matter of concern is also the stability of rules. Frequent changes in program characteristics and eligibility criteria enhance information problems and introduce uncertainty among operators and potential beneficiaries. They also delay implementation, because program operators tend to abstain from action until they know if and what changes have been made in the rules.
Funding and Budgetary Aspects
As indicated in PART I, the allocation of federal funds to the states is decided at the federal level, often through a centrally designed formula, like the one used for Alianza funding explained in Box 1.
For the implementation of Alianza, SAGARPA signs convenios with state governments, which serve for several years. In addition, SAGARPA and state governments sign annual anexos técnicos establishing program goals and the respective funding contributions applicable to the particular year for the various programs included under the Alianza umbrella. Anexos técnicos are a good instrument because they favor transparency and accountability, but they suffer from the weakness that no sanctions are applied in case of contract breach.
An important funding issue in demand‐driven programs, where demand for funds usually exceeds, is the rationing mechanism used. Two dimensions may be distinguished in rationing: global rationing and individual rationing.
Global rationing may operate on a geographic basis (as in the establishment of ceilings for states and municipalities) and also on the basis of beneficiary classes. Global rationing can be used as a mechanism to promote geographic equity and also as a targeting criterion. Thus, for instance, RDP establishes that for the part of the program directly implemented by the states at least 70 percent of funds should go to regions of high or very high marginality indexes, 20 percent to priority groups (youth, women, indigenous groups, old producers, and handicapped rural people), 35 percent to investments on priority production chains characterized by alta inclusión social, another 35 to projects proposed by CMDRS, and 25 percent to low income producers in non‐marginal regions44 (art. 74 of Alianza’s operation rules).
requests from individual producers, and rightly argues that the latter do little to generate new sustainable income and employment opportunities. To concentrate investments, SAGARPA strongly promotes the formation of groups to carry out collective investments. Investment clustering is certainly needed to promote local economic development. The question is how to achieve it. Forced group formation is not necessarily the best way. An option would be to identify jointly with producers’ representatives and other local actors relevant development/investment axes for the particular territory, prepare support programs for the production and marketing of the activities included in these investment axes, and offer individual producers support (and, most importantly, access to credit facilities) to carry out on‐ or off‐farm investments consistent with those programs. Group formation would be welcomed, provided it is voluntary. 44 Percentages add up to more than 100 because there is overlapping among the categories.

Decentralized Service Delivery for the Poor 270
Individual rationing takes place within geographic or producer class ceilings. The ideal principle, and the one in theory favored in Mexico, is to ration according to the quality of the proposals, established according to criteria and evaluation procedures determined by appropriate bodies, such as the technical committees of the fideicomisos. In practice, however, it is very difficult and time consuming to discriminate among small and often similar proposals, and hence the quality principle breaks down. In actual fact, proper quality screening normally takes place only when programs admit large and complex investment proposals. In most other circumstances ad hoc rationing mechanisms are used. Principal among them is timeliness in the presentation of proposals. Priority is given to producers who are first in presenting proposals duly completed and with all the attachments required, when the window opens. Hence, good information on window opening and of the documents required, and the ability to get a project formally prepared on time for the opening of the window become determinant elements for producers to benefit from programs45.
The main budgetary issue is the frequent delay in the disbursement of funds. This is partially explained by factors beyond the control of sub‐national governments, and partly due to the lengthy processes involved and the protracted decision‐making taking place within states to receive and evaluate proposals.
Many of our informants indicated as the main cause of the delays the fact that Alianza’s rules are not published promptly. Operators have to wait until March, April or even May for rules to be issued and become known. Even if rules undergo only minor adjustments, operators cannot start their work before the new rules are known, especially since the forms to be used are generally part of the rules. The following paragraph illustrates the lengthy processes with the case of the operation of Alianza decentralized programs in Veracruz in 2005.
After the disclosure in March of the operation rules, the state had to sign with SAGARPA the anexo técnico, which took place in May. The program was then disseminated in the state and applications started being received (window opening) in June – a process that lasted between eight and 15 days. Once proposals were collected and checked for completeness, they were submitted to the Unidad Técnica de Operación Estatal (UTOE), which is the state’s technical office in charge of Alianza, to check compliance with all technical requirements. Finally, proposals were submitted to the technical committee of Alianza’s fideicomiso in the state. This committee started approving the projects around September and instructed the fideicomiso to disburse the funds. Disbursement started in December and went into the first part of the following year. Transferring disbursements to the next year was possible because funds were deposited in the fideicomiso.
45 The usual practice is for windows to open during one to four weeks. It is common for producers to queue up, in occasions for several days, waiting for the window to open.

Decentralized Service Delivery for the Poor 271
Hence, what happens in practice is that the decentralized programs of Alianza (and also other decentralized programs operating through a state fideicomiso) tend follow a different fiscal year from the official one: a fiscal year that goes from May to May or June to June.
Joint Platforms
An important aspect of the federal‐state compact is the existence of consultation and decision‐making platforms where state and federal officials participate, and often also civil society representatives. In the case of Alianza, there are two such relevant state‐level platforms: the technical committee of the fideicomiso, and the Consejo Estatal de Desarrollo Rural Sustentable (CEDRS). The former platform is an exclusively Alianza body, which serves to decide the allocation of funding among individual proposals. It is chaired by a representative of the state’s ARD office, with a representative from SAGARPA acting as technical secretary. It may or may not include civil society representatives, according to the sate. The latter platform is an overall consultation and orientation body, created by the LDRS. It is meant to guide ARD policy in the state. CEDRS, which are chaired by SAGARPA, are integrated by representatives from all the secretarías included in the CIDRS, alongside representatives from relevant offices in the state government, and of civil society organizations involved in ARD in the state.
The effectiveness of these platforms varies much across states. In general, technical committees of fideicomisos, which are smaller bodies with clearly defined functions, work reasonably well in most states. More variance exists in CEDRS, but on the whole they have not been able to ensure coordination within the state of programs from different secretarías or the harmonization of funding.
2. The State‐Municipal Compact
This compact works around the decentralization to municipalities of Alianza’s RDP, started in 2002. Municipalización, has worked with important differences across states. Thus, for instance, Guerrero is a case of extreme municipal decentralization because it started in 2002 and all municipalities operate under the first of the two systems explained in PART I. Veracruz is an intermediate case since municipalización started in 2004 and only some municipalities have been authorized to operate under system one. Finally, municipalización only started in 2005 in Jalisco, with all municipalities operating under system 2.
Funding
The allocation of funds from states to municipalities —either through the direct transfer of funds, under system one, or through the establishment of a ceiling, under system two—may be made through a formula or through direct negotiation. As already mentioned, in the case of RDP, funds are allocated according to a centrally designed
Decentralized Service Delivery for the Poor 272
formula, which establishes criteria for half of the funds and lets states establish other criteria for the remaining half.
From a formal perspective, municipalización requires that municipal governments sign an agreement with state governments similar to the convenios signed between the federal and state governments.
The contribution of municipal funds to RDP is the result of a negotiation process with state governments and is usually problematic. First, there is the problem that rural municipalities have little funds to contribute46, and normally prefer to devote to public works, which are more visible, FISM and other funds not committed to current expenditures. Also, the operation rules of Alianza are often felt as a straitjacket by presidentes municipales, not allowing them to allocate funds the way they think is economically more suitable or politically more effective. Furthermore, they have to share decision‐making on those funds with members of CMDRS. Hence, municipal governments generally try to get away with the smallest possible contribution. Second, presidentes municipales finishing their three year mandate do not like to contribute funds because Alianza subsidies will normally be disbursed the following year, when they will not be in office.
Joint Platforms
The core platform of the state‐municipal compact are the Consejos Municipales de Desarrollo Rural Sustentable (CMDRS) analyzed in PART I. We examined there the composition, functions and weaknesses of these councils and will not repeat them here, but three consequences of those weaknesses, observed during our field work, are worth highlighting.
First, councils find it difficult to articulate criteria to prioritize investment demands. When they have to exercise a rationing authority and select proposals for funding, they often fall back into simplistic equalitarian rules of the type “one community one project”, independently of the objective merits of the projects and of the needs of the communities.
Second, CMDRS seem not to be capable in many cases of preventing biases in favor of residents of municipal capitals and neighboring communities, either because they have better access to information on the programs or because they have more
46 Under Art. 115 of the Mexican Constitution, municipalities have three sources of fiscal resources: transfers from the federal government or participaciones, income from the provision of services, and a tax on landed property, the impuesto predial. Since this tax is only applied to urban property, which has little value in rural municipalities, and the income that they receive from the provision of services is also very small, participaciones are the main fiscal resource. Because of this, municipal contributions to RDP usually come from FISM resources, which according to LCF can be partly invested in productive projects.

Decentralized Service Delivery for the Poor 273
means to influence council’s decisions, including a better disposition from presidentes municipales to favor them.
Finally, the spontaneous tendency at this micro level is to prioritize atomized rather than clustered investments. This is partly because municipal authorities find it politically more rewarding to benefit many producers with small amounts than to benefit fewer producers with larger amounts, forcing them to form groups. Also, CMDRS do not usually have the capacity to articulate a clustering strategy for investment proposals. The case of Guerrero is paradigmatic in this connection. From 2002 to 2004 municipalities in Guerrero operated RDP in a fully atomized way, in contravention to Alianza norms. This was the result of a negotiation between municipalities and the state government: a quid pro quo whereby the state government contributed very little or nothing at all to Alianza while municipalities co‐financed the lion’s share of overall state funding, in exchange for letting municipal governments run RDP their own way. When in 2005 a new state government decided to apply Alianza norms, this created confusion in CMDRS and was resented by municipal authorities.
Another platform to be mentioned here, one which falls between the municipal and state levels, is the district RD councils, the Consejos Distritales de Desarrollo Rural Sustentable (CDDRS). There is one council per each of the regions into which states are normally divided, comprising a variable number of municipalities. The geographich coverage of districts usually –but not always—coincides with the administrative divisions of SAGARPA. CDDRS have developed slowly and have not yet found their proper place in the rural economic governance system delineated by LDRS. There are differences, however, across states. Thus, for instance, in Guerrero and Veracruz CDDRS do not seem to play any particular role and their existence is little noticeable. In Jalisco, instead, they are much more active, meeting frequently, often once per month. But even in this case, CDDRS do not seem to serve to delineate a joint RD strategy for the district area to be jointly implemented by the concerned federal and state secretarías. They serve more as locus for the exchange of information, and hence to improve transparency, among different government offices and local municipal authorities, with little participation from producers. This is unfortunate because of the crucial role that CDDRS could play as territorial entities of economic governance –a role in a way foreseen by LDRS.
A problem with CDDRS is that they are very much associated in peoples’ minds with SAGARPA, or with SAGARPA and the ADR administration of the states, of which they are considered a tool. Hence, other government entities do not feel truly committed towards them. Another problem is the difficulty to articulate a strong participation of producers and other non‐government stake holders in CDDRS.
Decentralized Service Delivery for the Poor 274
A POSSIBLE WAY TO DECENTRALIZE RURAL DEVELOMENT PROGRAMS
VII. INTRODUCTION
We have seen in PARTS I and II that many advances have been made over the last decade, and particularly in the last five years, in the decentralization of ARD programs, although decentralization has affected more the power to expend than the power to regulate. In particular, programs have started to move funds to the states and to the municipalities, and to involve them in the implementation process. Perhaps more importantly, new platforms have been created that serve for joint decision making among different levels of government and for the participation of a variety of stake holders.
Notwithstanding these advances, program decentralization is only starting and much remains to be done. In particular, (i) the immense majority of funding for RD programs comes from federal secretarías, and it would be naïve to think that it could come without strings attached; (2) many programs are still not decentralized to any degree; and (3) operation rules are fully decided at the central level. Furthermore, issues related to decentralization are closely linked to issues of lack of coordination and harmonization of funding of different programs from different federal secretarías. Progress has also been made in this respect, for instance through the launching of Programa Especial Concurrente, but this is a tool not still properly used. Lack of sufficient decentralization of RD programs prevent state governments from being true masters of the rural agenda in their states. Even a progressive law such as LDRS, which insists much on federal‐state coordination and creates instruments for such coordination, gives no participation to state governments in the top RD governance bodies, the CIDRS and the Consejo Mexicano Para el Desarrollo Rural Sustentable, and also locates at the federal level the initiative in the various aspects of RD policy.
A shortcoming of the present situation is that since state governments do not have control of the rural agenda, they do not interiorize the political and economic costs and benefits of rural development actions, successes and failures. There is an ambiguous state of affairs where neither the federal government nor state governments feel truly responsible for RD outcomes.
We believe that a decentralized system with a strong role of state governments, where they would be driving the rural agenda, would be the best way, probably the only one, to overcome the problem of lack of program coordination and harmonization of funding. Also, by making state governments truly accountable of rural development outcomes in their states, decentralization would force them to interiorize all costs and benefits, thus promoting efficiency and equity in resource use. Finally, devolution to the
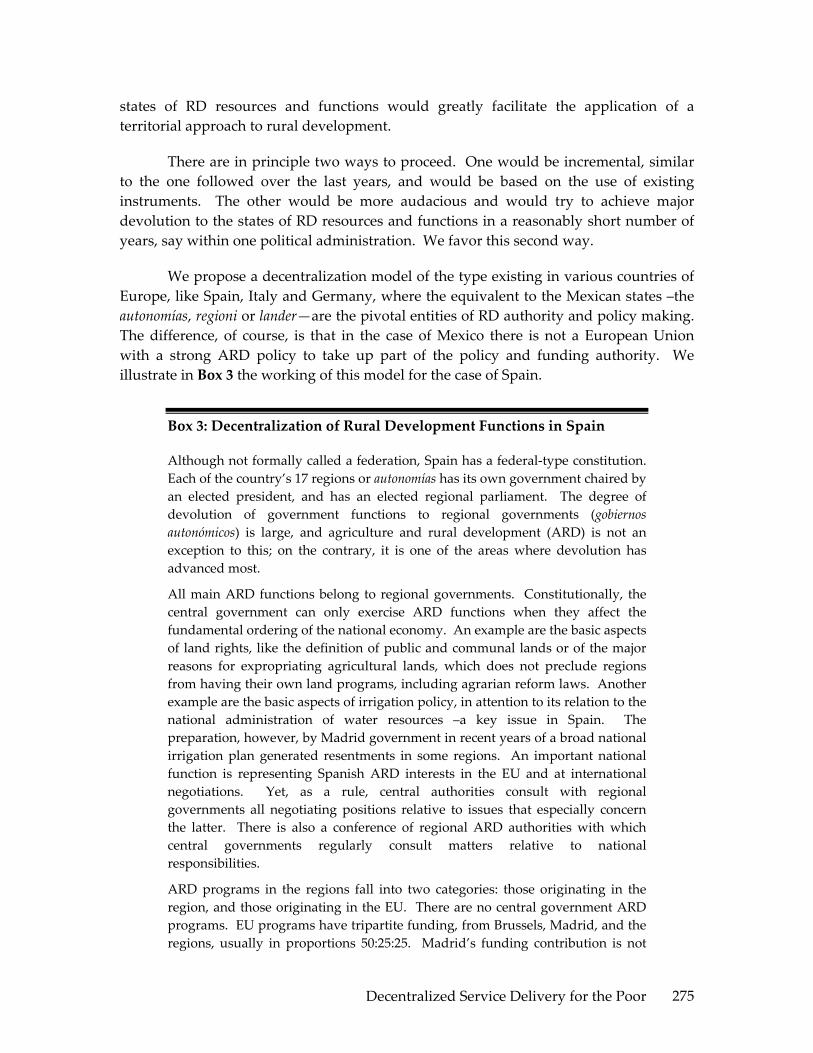
Decentralized Service Delivery for the Poor 275
states of RD resources and functions would greatly facilitate the application of a territorial approach to rural development.
There are in principle two ways to proceed. One would be incremental, similar to the one followed over the last years, and would be based on the use of existing instruments. The other would be more audacious and would try to achieve major devolution to the states of RD resources and functions in a reasonably short number of years, say within one political administration. We favor this second way.
We propose a decentralization model of the type existing in various countries of Europe, like Spain, Italy and Germany, where the equivalent to the Mexican states –the autonomías, regioni or lander—are the pivotal entities of RD authority and policy making. The difference, of course, is that in the case of Mexico there is not a European Union with a strong ARD policy to take up part of the policy and funding authority. We illustrate in Box 3 the working of this model for the case of Spain.
Box 3: Decentralization of Rural Development Functions in Spain
Although not formally called a federation, Spain has a federal‐type constitution. Each of the country’s 17 regions or autonomías has its own government chaired by an elected president, and has an elected regional parliament. The degree of devolution of government functions to regional governments (gobiernos autonómicos) is large, and agriculture and rural development (ARD) is not an exception to this; on the contrary, it is one of the areas where devolution has advanced most.
All main ARD functions belong to regional governments. Constitutionally, the central government can only exercise ARD functions when they affect the fundamental ordering of the national economy. An example are the basic aspects of land rights, like the definition of public and communal lands or of the major reasons for expropriating agricultural lands, which does not preclude regions from having their own land programs, including agrarian reform laws. Another example are the basic aspects of irrigation policy, in attention to its relation to the national administration of water resources –a key issue in Spain. The preparation, however, by Madrid government in recent years of a broad national irrigation plan generated resentments in some regions. An important national function is representing Spanish ARD interests in the EU and at international negotiations. Yet, as a rule, central authorities consult with regional governments all negotiating positions relative to issues that especially concern the latter. There is also a conference of regional ARD authorities with which central governments regularly consult matters relative to national responsibilities.
ARD programs in the regions fall into two categories: those originating in the region, and those originating in the EU. There are no central government ARD programs. EU programs have tripartite funding, from Brussels, Madrid, and the regions, usually in proportions 50:25:25. Madrid’s funding contribution is not

Decentralized Service Delivery for the Poor 276
mandatory; the gobiernos autonómicos can provide the entire counterpart to EU funds, in which case the national government has no say in the program. Usually, programs come with 50% funding and overall objectives and guidelines from Brussels, Madrid adds 25% funding and some general adaptation of Brussels’ norms to Spanish circumstances, and the regional government contributes the remaining 25% of funds, does the concrete design, and prepares the regional implementation plan. Programs originating in the regions are designed and financed by the gobiernos autonómicos. There are no fiscal transfers to sub‐national governments in Spain earmarked for ARD activities outside the contribution to EU programs; other ARD activities carried out by regional governments are financed from their regular budgets.
Municipal authorities barely have ARD functions or programs in Spain. Rural municipalities are usually small and lack the resources and competence to invest in ARD. In general, their main participation is through their presence in and eventual financial contribution to the Local Action Group of the European Leader program –a territorially based rural development program to promote off‐farm innovative employment and income sources in rural areas.
In order to achieve this type of devolution four things would be required:
1. Transferring to the states most of the funds of production‐oriented RD programs of federal secretarías. This would be done in the form of block grants where the funds from different programs would be merged. The national government would still reserve for itself funds to carry out RD programs and regulatory activities considered to be strategic and to require national‐level implementation. The distribution of funds to the states would be done according to an objective formula, based on demand considerations, which would not be regressive.
2. Dismantling the corresponding federal RD programs and letting state governments replace them with their own programs, so that they can be true masters of the RD agendas in their states. State programs would be instruments to carry out state RD strategies with verifiable objectives and outcomes.
3. Pushing ahead with federalización, so as to transfer to state governments the assets, staff and other operational resources of federal secretarías required for them to design and implement their own RD agendas.
4. Establishing (i) national minimum standards and benchmarks to be respected by the states. (ii) an agreed upon formula for the distribution of funds among the states, and (ii) a national monitoring and evaluation system.
It is clear that a transition period would be necessary to carry out the above, but this could in our view be reasonably short, circumscribed to a political administration.

Decentralized Service Delivery for the Poor 277
VIII. THE PROPOSAL
We examine below the functions envisaged under the decentralized system proposed. We concentrate on functions related to the operation of RD programs oriented to the creation of income and employment opportunities. We leave aside areas such as land policy and the regulation of property rights, natural resources management, sanitary and phytosanitary systems, agricultural research, international trade, and other areas relative to national regulatory systems or the supply of national public goods. Each of these areas would require different levels and forms of decentralization (or centralization) which cannot be discussed in this document47
1. The Federal Level
For an effective operation of the system, the federal government would have to modify its regulatory role in a way consistent with the devolution to lower levels of government of the design and operation of programs. The stringency characterizing the current regulatory framework does not guarantee the attainment of policy goals. As we have seen, the rules of operation have created a complex implementation system that is difficult to oversee. Under the current framework, policy responsibilities are often obscured because of the multiplicity of players involved in the implementation process.
Under the scheme proposed, federal regulations regarding RD productive activities would consist of broad guidelines, in which minimum standards could be set for the design and operation of RD programs by the states. In particular, federal norms could (i) promote geographic equity; (ii) prevent disproportionate disparities across regions in the type and amount of benefits received by program beneficiaries, and (iii) prevent the creation of situations where producers from different states are treated differently vis‐à‐vis international competitors. The federal government could also monitor and evaluate independently the RD strategies designed and implemented by the state governments. By focusing on strategic issues only, federal norms would allow states to create their own regulatory instruments, thereby reflecting more accurately local needs and priorities.
To the extent that the main sources of fiscal revenue continue to be federal, funding of RD programs would still be a federal responsibility. This brings with it the additional responsibility of ensuring that the allocation of funds across states is based on sound equity and efficiency criteria.
A drastic shift would need to be made from the current funding system to one that truly devolves decision‐making power to sub‐national levels of government. Under the prevailing system, each budget line is earmarked for certain purposes, precluding
47 Thus, for instance, the optimal decentralization of natural resources management is a very complex issue which must be approached in a different way from the decentralization of productive RD programs.

Decentralized Service Delivery for the Poor 278
sub‐national governments from making adjustments. Federal funds for RD could, instead, be transferred as a block grant not linked to any particular program. Only in this way could sub‐national governments have real influence on the allocation of resources and exploit the potential benefits of devolution. To ensure transparency, the allocation of funds could continue to be regulated by a federal formula. The formula could be stable over time and include mechanisms to sanction states that do not comply with their budgetary commitments.
The devolution to state governments of program design and implementation and the adoption of a block grant approach to RD funding would necessarily imply the transfer to state government of the relevant staff, facilities and other resources from the concerned secretarías, alongside with the recurrent costs to operate them, so that state governments have the means to design and implement their rural agendas.
The federal government could continue to have an important role in the evaluation of RD programs, independently of whether state governments choose or not to carry out their own evaluations. Since state RD programs would be largely funded by federal resources allocated by Congress through the budgetary process, SHCP and Congress would still have a duty to monitor the proper use of those resources and the quality of the investments. The evaluation process is part and parcel of this. Federal authorities could be involved in the discussion of the action agendas deriving from the evaluation exercises, and in monitoring the implementation of those agendas. The formulation by state governments of RD strategies and of the programs to implement them, with verifiable objectives and outcomes, as a condition for fund transfers, would facilitate M&E from the federal government. Auditing of the proper use of block grants would be a federal responsibility, independently of the auditing that state legislative bodies would like to impose.
There would still be room for the federal government to design and operate certain RD programs that are considered strategic and in need of nation‐wide implementation, as well as to design and operate pilot programs.
2. The State Level
State governments would have the initiative in policy making for rural development in the states. They would prepare a long‐term RD strategy and monitor its implementation and outcomes, design and implement the RD programs that they consider most appropriate for the state, and allocate resources to them.
Decision‐making commissions at the state level could become focal entities in the design and coordination of rural development programs. Under a more flexible federal regulatory framework, the Consejos Estatales de Desarrollo Rural Sustentable (CEDRS) could generate more specific rules for the operation of rural programs within the states
Decentralized Service Delivery for the Poor 279
and be in charge of their oversight. They could also be the platform where states’ RD strategies are discussed and validated.
The objective of coordination and harmonization of funding would look very different under the decentralization system proposed, since most RD programs operating in a state would be designed within the state. State governments or the CEDRS could decide to move resources across programs as well as to create and oversee the necessary coordination mechanisms.
CEDRS could also play a more active role in establishing formal mechanisms for resource prioritization. For instance, the stratification of rural producers is an important planning instrument included in Alianza rules, which at the moment few states use. There would be a much grater incentive to use this or similar instruments under decentralization.
Another responsibility of the states would be the setting of quality standards to regulate the provision of technical assistance, and the promotion of an improved market of technical services. At the present time, as indicated before, private providers of services operate in an uncoordinated fashion, without or with little access to training, specialized technical advice, organized links to research outfits and research information, and with no networking. They also lack the incentives to improve their performance. If states are provided with the necessary decision‐making authority and resources for the operation of rural programs, they could introduce innovative compensation schemes to reward good performance, and design coherent strategies for the transfer of technology to the rural sector.
3. The Regional Level
Meso‐level economic coordination institutions of mixed public‐private‐civil society composition are required to implement a territorial approach to rural development. The collection of municipalities, usually called “regions”, in which state governments divide their states for planning purposes generally seem of appropriate dimensions and sufficient identity to be adequate territorial areas for the purposes of a territorial approach to RD. Thus, they seem suitable for investment clustering and to implement strategic programs to promote rural economic development. The existence of strong regional economic coordination institutions is very important to that effect. Some states, for instance Michoacán, have already created regional development councils. If sufficiently strengthened with technical capabilities and provided with funds to co‐finance productive programs for their rural areas, these councils could become the focal point for rural economic development in their territories.
In most states, however, the coordination entities that currently exist for rural development at the regional level are the Consejos Distritales para el Desarrollo Rural Sustentable (CDDRS). These councils could potentially become excellent meso‐level

Decentralized Service Delivery for the Poor 280
entities for economic coordination within a territorial approach to rural development48. Unfortunately, at present, CDDRS are probably the weakest element in the RD system in Mexico, for more priority has been given to municipal than to district RD councils. Strengthening the institutional capacity of CDDRS could be an important part of the rural decentralization agenda. They could be equipped to design and implement rural development strategies within their territories. Ideally, CDDRS could combine participatory principles with sound technical and market criteria to design long‐term territorial strategies. These strategies would be based on the potential offered by territorial assets and the identification of the main development axes around which investment support should cluster. CDDRS could also design regional programs for the practical implementation of their long term strategies in line with the development axes selected. The identification of priorities and the allocation of investment support at lower RD levels, basically by municipal RD councils, could be carried out within the framework of the long‐term territorial strategy and the specific programs established by CDDRS.
CDDRS could also have the function of linking up territorial programs with production chains. They could, for instance, promote the development of regional production chains in their territories and their insertion in larger chains. Similarly, CDDRS could also design and help set in motion large projects which could become triggers of regional development. In a way, thus, CDDRS and in general the regional level would be the main vehicle to operationalize the RD strategies and policies of the states.
To be able to fulfill the above functions, CDDRS would need to have a sufficient cadre of professional staff with good technical credentials. The participation of civil society would need to be strengthened so that CDDRS become effective platforms for concertación and economic governance of their territories.
4. The Municipal Level
As indicated before, a number of institutional features of municipal governments in Mexico prevent them from effectively serving as the territorial coordinators of RD policies. The evidence collected during fieldwork revealed that CMDRS tend to atomize 48 The area of operation of CDDRS roughly corresponds to that of state government “regions” in most states. This correspondence, however, is far from perfect and would need to be adjusted. Most state governments have tried over the last years, with varying degrees of determination and uneven success, to establish unique regionalization systems, negotiating with federal secretarias their division of the states for their own operational purposes in the same geographic regions as state governments. Advances in this respect are encouraging but much however remains to be done. Achieving a unique regionalization system is an important step towards promoting strong regional development and rural territorial development as part of it. Also important in this respect is the harmonization of the overlapping system of development councils created by the Ley de Planificación (which created the development planning councils, COPLADES), the Ley de Desarrollo Rural Sustentable (which created the rural development councils), and the Ley de Desarrollo Social (which created the social development councils).

Decentralized Service Delivery for the Poor 281
RD resources to satisfy the demands from local producers, without creating enduring productive effects. This shortcoming is partly due to the absence of adequate mechanisms for resource prioritization at the municipal level, and to a marked bias among municipal governments in favor of urban development and service investments49. Also, CMDRS tend to be undermined by “localism” (Cossio, 2006), and the prevailing institutional arrangements preclude the creation of policy partnerships between nearby municipalities, which would be required for RD projects to have a large‐scale territorial effect. In consequence, it is preferable that the economic coordination of RD strategies be under the responsibility of an entity with broader jurisdiction, such as CDDRS.
The above does not imply that the municipal level should not participate in the formulation and implementation of RD policies. First of all, CMDRS would be represented in the CDDRS, of which they would be important members. Second, our evidence indicates that CMDRS are becoming a relevant site for policy dialogue and program dissemination, where local producers can participate expressing their needs and priorities. CMDRS would continue to serve as a forum for social participation and discussion, and also as an arena to prioritize the allocation of resources, but within the framework of the long‐term territorial strategy and the regional programs established by CDDRS and under their guidelines. It is important, however, to work towards ensuring that (i) more decision‐making power within CMDRS is in the hands of local producers rather than municipal presidents or technical coordinators, (ii) they are better informed of programs and program opportunities, and (iii) the representation system is improved to ensure more continuity of representatives, and manageable numbers.
IX. THE CASE FOR RD DECENTRALIZATION: FINAL REMARKS
The above proposal is clearly a big departure from the current system, and implementing it would require considerable political courage. We believe, however, that it does not require constitutional or other major legal changes, although some adjustments to LDRS could be needed. We also believe that the progress made in decentralization and transparency over the last years provides a good basis for such a drastic reform.
There are several grounds on which we can argue the merits of a decentralization proposal of RD programs like the one outlined above. Efficiency considerations are important. We believe that our proposal would improve allocative efficiency in the use
49 ʺIn a recent work, Moreno (2005) provides empirical evidence suggesting that the investment decisions of municipal governments in Mexico are not targeted to localities with higher poverty rates, and that the allocation of municipal budgets responds, in part, to electoral motivationsʺ. See Moreno, Carlos: ʺDecentralization, Electoral Competition, and Local Government Performance in Mexicoʺ. Ph.D. Dissertation, LBJ School of Public Affairs, The University of Texas at Austin, 2005.
Decentralized Service Delivery for the Poor 282
of public funds in RD in Mexico because by letting state governments design and carry out their own programs, program design and implementation would be brought closer to the needs and preferences of beneficiaries, which vary considerably across states. Gains would also be made in supply efficiency or x‐efficiency because the current overlapping and lack of coordination of federal programs could be overcome by letting state governments substitute the multiplicity of federal RD programs by a reduced number of state programs designed to implement a concrete RD strategy for the state. Finally, dynamic efficiency would also be improved because state programs would be at the service of a long‐term RD strategy for the state, and because investment clustering and economic coordination would be enhanced trough a territorial approach to RD based on strengthened CDDRS.
Other theoretical arguments have been advance in favor of decentralization (for instance Tanzi, 1995). Important among them are that (1) “accountability brings responsibility”, and (2) decentralization allows experimentation and hence the introduction and dissemination of improvements in the supply of development services. These arguments apply well to our decentralization proposal. As indicated by Joumard (2005), experimentation by the states and the dissemination of good practices is already taking place in Mexico in areas where decentralization has advanced.
Redistribution and macroeconomic stability are matters that may be affected by decentralization (Prud’home, 1994). In the present case, redistribution could be enhanced by our proposal of distributing RD funds to the states sing an agreed formula if this formula is progressive and demand based, duly considering state needs. We have seen in Chapter 3 that the current geographic targeting of Alianza’s decentralized funds is regressive. The type of decentralization here proposed could reverse this. With respect to macroeconomic stability, there is no reason to believe that it would be affected by our proposal, because we advocate distributing to the states funds that are currently spent by federal secretarías, without need to increase public expenditure either at the national or sub‐national level.
Other concerns often raised about decentralization are the lack of sufficient local level capabilities to provide adequate development services, and the existence of externalities and spillovers in public expenditure. With respect to the former, the lack of sufficient capabilities to design and implement RD programs is not an important issue with state government administrations in Mexico. It is instead an issue with municipal administrations, but our proposal is to focus the RD mandate in the states not in the municipal governments. As indicated above, the municipal level would have a role in the decentralized system proposed through the CMDDS, but under the guidance and within the regional programs established by CDDRS. District Councils would play a crucial role in internalizing the externalities and spillovers that may exist at the municipal level, and in the clustering of investments around the most promising development axes identified for the states’ regions.

Decentralized Service Delivery for the Poor 283
It is true that by transferring additional funds to state governments the present proposal would increase the current imbalance between the taxing capacities of state governments ant their spending levels (Joumard, 2005). However, the system proposed of transferring to the states block grants earmarked for RD could be seen as a transitory arrangement until a more decentralized fiscal system is established in Mexico capable of bringing more balance between the states’ financial autonomy and their expending responsibilities.
We can anticipate several problems and risks in the implementation of our proposal. The first problem is to agree in the amount of resources to be transferred to the states, and in the distribution formula to be used. The second problem is the political difficulty of stripping federal secretarías of a good part of their resources, policy‐making powers, and regulatory powers. We believe that a new government is better placed to overcome this difficulty, because if a decentralization reform of the type outlined above were included from the beginning in the new government’s program, the new secretaries would come into office knowing that their powers would be trimmed. Finally, in any decentralization reform there is always the risk of the local elite capturing a good part of the benefits, with the central authorities being left with few instruments to prevent this happening. This will largely depend on the attitude of state governments, because, on the one hand, they could be part of the problem, but, on the other, they are in a much better position than the national government to prevent elite capturing. Sub‐national governments cannot be considered a priori better or worst intentioned than central governments. All we know is that they are closer to citizens and, hence, on fundamentals, if we believe in the subsidiarity principle, we are bound to favor taking the risk.

Decentralized Service Delivery for the Poor 284
ANNEX TABLES
Annex Table 1: Programa Especial Concurrente 2005 2005 Programa Especial Concurrente by Government Units and Programs – SAGARPA
Million % of % of % of Programs Pesos Programs SAGARPA PEC
PROCAMPO 14.885 100,0 30,8 10,2 Alianza para el Campo 8.164 100,0 16,9 5,6 Desarrollo Rural 2.959 36,2 Fomento Agrícola 1.534 18,8 Pesca y acuicultura 1.413 17,3 Integración de Cadenas 1.280 15,7 Fomento ganadero 510 6,2 Sanidad 282 3,5 Atn. Factores Críticos 160 2,0 Sistema Nal. Información 26 0,3 Apoyos a la Comercialización 6.755 100,0 14,0 4,6 Ingreso Objetivo 4.281 63,4 Coberturas 470 7,0 Pignoración 267 4,0 Conversión productiva 192 2,8 Rastros 173 2,6 Otros 1.372 20,3 Apoyos Comptivdad. Ramas Ptvas. 2.496 100,0 5,2 1,7 Programa Ganadero 1.708 100,0 3,5 1,2 Sistema Financiero Rural 850 100,0 1,8 0,6 Apoyo Areas Siniestralidad Rcrte. 598 100,0 1,2 0,4 Extensión Agropecuaria y Rural 396 100,0 0,8 0,3 Contingencias Climatológicas 369 100,0 0,8 0,3 Apoyo Organizaciones Sociales 273 100,0 0,6 0,2 Promoción de Semillas 124 100,0 0,3 0,1 Programa Empleo Temporal 124 100,0 0,3 0,1 Fondos Regionales Combate Pobreza 99 100,0 0,2 0,1 Programa Apícola 50 100,0 0,1 0,0 Promoagro (Proexporta) 50 100,0 0,1 0,0 Propesca 50 100,0 0,1 0,0 Gastos Operativos Sagarpa 11.405 100,0 23,6 7,8 Universidades Agrarias 2.253 19,8 Firco 1.656 14,5 Inifap 1.076 9,4 Compesca 960 8,4 Senasica 841 7,4 Aserca 336 2,9 Inpesca 188 1,6 Inca Rural 34 0,3 Otros 4.061 35,6 TOTAL SAGARPA 48.396 100,0 33,2

Decentralized Service Delivery for the Poor 285
Annex Table 1: Programa Especial Concurrente 2005 (Continuation)
2005 Programa Especial Concurrente by Government Units and Programs ‐ Other Government Entities Million % of Million % of
Programs Pesos PEC Programs Pesos PEC SEP 23.829 16,3 Sectur 4 0,0 Oportunidades 14.622 Aportaciones Federales 15.117 10,4 Desarrollo Capacidades 5.250 FISM 12.045 Educación Agropecuaria 3.903 FORTAMUN 3.037 Programa Educación Rural 54 Ctro. Estu. Rurales Cam Dip.) 35 Salud 14.206 9,7 SHCP 6.919 4,7 Oportunidades 3.209 CONADEPI 4.213 Desarrollo Capacidaes 4.726 Financiami. & Seguro Rurales 1.660 SPSS 5.396 INEGI (Censo Ag y Procede) 1.046 Otros Programas 875 SCT 2.151 Secretaría Trabajo 75 0,1 PET 1.168 Jornaleros Agrícolas 60 Caminos Rurales 962 Migrantes Exterior 15 Telefonía Rural 21 Secretaría Reforma Agraria 4.858 3,3 Secretaría de Economía 1.016 0,7 Conflictos Agrarios 990 FONAES 669 Procuraduría Agraria 525 FOMMUR 124 RAN y Catastro 518 Otros Programas 223 Procede 501 SEDESOL 17.447 12,0 Promusag 495 Oportunidades 10.093 Fondo Tierras y JER 445 Programas Alimentarios 4.514 Fappa 396 Vivienda Rural 886 Fomento Organizaci. Agrar. 223 Opciones Productivas 596 Gastos Operación SRA 765 Adultos Mayores 592 Tribunal Superios Agrario 574 Microrregiones 461 SEMARNAT 11.305 7,7 PET 149 Infraestructura Hidroagrícola 5.109 Jornaleros Agrícolas 139 Programas Hidráluicos 2.731 Fonart 17 Programas Forestales 1.875 Secretaría Rela. Exteriores 79 0,1 Areas Naturales Protegidas 471 IMTA 218 TOTAL PEC 145.976 100,0 Profepa 139 Dllo. Regional Sustentable 113 PET 103 Recuperación Suelos DF 99 Programa Vida Silvícola 69 SEMARNAT‐CONACYT 50 Otros Programas Ambienta. 328

Decentralized Service Delivery for the Poor 286
Annex Table 2
Resources of Decentralized Alianza Programs by Program and by State in 2005, Total and per Capita of Rural Population Total Value of Resources Per capita of Rural Population Total RDP Other Programs
State Total MxP 000
% Total MxP 000
% Total MxP 000
%
Rural Popul‐ ation (000)
Total MxP
RDP MxP
Other Progr. MxP
Aguascalientes 119,246 1.7 34,374 1.3 84,872 2.0 180.1 662.1 190.9 471.2 Baja California 98,322 1.4 16,164 0.6 82,158 1.9 369.4 266.2 43.8 222.4 Baja California Sur 61,551 0.9 14,802 0.5 46,749 1.1 183.3 335.8 80.8 255.0 Campeche 121,373 1.7 43,000 1.6 78,373 1.8 364.9 332.6 117.8 214.8 Coahuila 155,407 2.2 55,519 2.0 99,888 2.3 240.5 646.2 230.8 415.3 Colima 65,443 0.9 21,494 0.8 43,950 1.0 116.4 562.2 184.7 377.6 Chiapas 424,840 6.0 175,798 6.5 249,043 5.7 3003.5 141.4 58.5 82.9 Chihuahua 317,597 4.5 84,000 3.1 233,597 5.4 725.4 437.8 115.8 322.0 Durango 185,769 2.6 43,017 1.6 142,752 3.3 601 309.1 71.6 237.5 Guanajuato 387,558 5.5 105,364 3.9 282,194 6.5 1,659 233.6 63.5 170.1 Guerrero 256,868 3.6 186,971 6.9 69,897 1.6 1,789 143.6 104.5 39.1 Hidalgo 254,009 3.6 93,750 3.4 160,259 3.7 1,240 204.9 75.6 129.3 Jalisco 398,897 5.6 106,500 3.9 292,397 6.7 1,568 254.4 67.9 186.5 Mexico 329,849 4.7 143,114 5.3 186,735 4.3 1,767 186.7 81.0 105.7 Michoacan 330,895 4.7 124,023 4.6 206,872 4.8 2,073 159.6 59.8 99.8 Morelos 133,284 1.9 79,066 2.9 54,218 1.2 354 376.7 223.5 153.2 Nayarit 179,719 2.5 45,551 1.7 134,168 3.1 429 419.1 106.2 312.9 Nuevo Leon 165,806 2.3 26,414 1.0 139,391 3.2 329 503.8 80.3 423.6 Oaxaca 340,802 4.8 224,550 8.3 116,252 2.7 2,709 125.8 82.9 42.9 Puebla 290,390 4.1 140,000 5.2 150,390 3.5 2,653 109.4 52.8 56.7 Queretaro 143,218 2.0 42,300 1.6 100,918 2.3 537 266.9 78.8 188.1 Quintana Roo 80,705 1.1 36,009 1.3 44,696 1.0 232 347.9 155.2 192.7 San Luis Potosi 183,115 2.6 87,484 3.2 95,631 2.2 1,128 162.4 77.6 84.8 Sinaloa 288,303 4.1 70,058 2.6 218,246 5.0 1,305 221.0 53.7 167.3 Sonora 289,091 4.1 60,766 2.2 228,325 5.3 619 466.9 98.1 368.7 Tabasco 235,545 3.3 104,000 3.8 131,545 3.0 1,046 225.2 99.4 125.8 Tamaulipas 269,685 3.8 66,612 2.5 203,072 4.7 513 525.4 129.8 395.6 Tlaxcala 85,172 1.2 50,945 1.9 34,227 0.8 327 260.8 156.0 104.8 Veracruz 459,812 6.5 263,000 9.7 196,812 4.5 3,230 142.3 81.4 60.9 Yucatan 204,643 2.9 99,000 3.6 105,643 2.4 646 316.7 153.2 163.5 Zacatecas 205,385 2.9 74,500 2.7 130,885 3.0 869 236.3 85.7 150.6 Total/Average 7,062,299 100.0 2,718,145 100.0 4,344,155 100.0 32,806 215.3 82.9 132.4

Decentralized Service Delivery for the Poor 287
Annex Table 3 Resources of Alianza Decentralized Programs, Total and Per Capita of Rural Population in 2001‐05, at Constant 2005 Mexican Pesos
2005 2004 2003 2002 2001 Average 2001‐2005 States
Margi, Index Order
Rural Popul. (000) Total (000)
Per Capita Order Total (000)
Per Capita Order Total (000)
Per Capita Order Total (000)
Per Capita Order Total (000)
Per Capita Order Total (000)
Per Capita Order
Aguascalientes 28 180.1 119,246 662.1 31 92,871 515.7 28 55,539 308.4 18 48,866 271.3 16 47,393 263.1 19 72,783 404.1 26Baja California 30 369.4 98,322 266.2 16 96,579 261.4 14 83,395 225.8 11 86,742 234.8 15 99,141 268.4 21 92,836 251.3 15Baja California Sur 27 183.3 61,551 335.8 21 62,094 338.8 21 66,240 361.4 22 80,356 438.4 27 66,341 361.9 25 67,316 367.2 23Campeche 8 364.9 121,373 332.6 20 129,936 356.1 23 132,705 363.7 23 131,254 359.7 24 129,184 354.0 24 128,890 353.2 21Coahuila 29 240.5 155,407 646.2 30 181,933 756.5 31 171,122 711.5 30 155,789 647.8 31 153,728 639.2 31 163,596 680.2 31Colima 22 116.4 65,443 562.2 29 64,045 550.2 29 57,859 497.1 28 65,182 560.0 29 55,548 477.2 27 61,615 529.3 29Chiapas 1 3003.5 424,840 141.4 3 404,907 134.8 3 448,981 149.5 5 447,315 148.9 6 468,407 156.0 7 438,890 146.1 5Chihuahua 26 725.4 317,597 437.8 25 231,617 319.3 18 259,228 357.4 21 223,658 308.3 20 193,458 266.7 20 245,112 337.9 20Durango 17 601 185,769 309.1 18 188,500 313.6 17 188,290 313.3 19 174,944 291.1 18 155,662 259.0 18 178,633 297.2 18Guanajuato 13 1,659 387,558 233.6 12 422,505 254.6 12 408,756 246.4 14 351,101 211.6 10 401,120 241.8 16 394,208 237.6 14Guerrero 2 1,789 256,868 143.6 5 324,441 181.3 5 244,865 136.9 3 225,299 125.9 3 187,648 104.9 2 247,824 138.5 4Hidalgo 5 1,240 254,009 204.9 9 290,882 234.7 10 284,526 229.5 12 275,671 222.4 13 267,459 215.8 13 274,510 221.5 9Jalisco 25 1,568 398,897 254.4 14 404,961 258.3 13 390,087 248.8 15 345,878 220.6 12 321,748 205.2 11 372,314 237.5 13Mexico 21 1,767 327,349 185.2 8 347,415 196.6 8 352,723 199.6 8 294,913 166.9 7 270,110 152.9 6 318,502 180.2 8Michoacan 10 2,073 334,930 161.6 6 403,632 194.7 6 325,279 156.9 7 284,829 137.4 5 250,196 120.7 4 319,773 154.3 6Morelos 19 354 133,284 376.7 23 164,449 464.8 25 160,533 453.7 27 150,954 426.7 26 136,158 384.8 26 149,076 421.4 27Nayarit 14 429 179,719 419.1 24 154,174 359.5 24 158,708 370.1 24 152,407 355.4 23 137,181 319.9 23 156,438 364.8 22Nuevo Leon 31 329 165,806 503.8 27 158,021 480.2 26 123,903 376.5 26 101,795 309.3 22 77,714 236.1 15 125,448 381.2 24Oaxaca 3 2,709 340,802 125.8 2 328,835 121.4 2 309,909 114.4 1 339,133 125.2 2 339,848 125.5 5 331,705 122.5 2Puebla 7 2,653 290,390 109.4 1 303,646 114.4 1 307,733 116.0 2 281,133 106.0 1 253,696 95.6 1 287,320 108.3 1Queretaro 16 537 144,218 268.8 17 131,950 245.9 11 126,928 236.5 13 116,968 218.0 11 113,037 210.7 12 126,620 236.0 12Quintana Roo 20 232 80,705 347.9 22 79,667 343.4 22 81,139 349.7 20 97,600 420.7 25 114,830 495.0 28 90,788 391.3 25San Luis Potosi 6 1,128 183,115 162.4 7 220,478 195.5 7 174,133 154.4 6 193,489 171.5 8 181,862 161.2 8 190,616 169.0 7Sinaloa 15 1,305 288,303 221.0 10 298,913 229.1 9 292,664 224.3 10 292,721 224.4 14 297,944 228.4 14 294,109 225.4 11Sonora 24 619 290,591 469.3 26 354,658 572.8 30 499,041 805.9 31 360,762 582.6 30 360,622 582.4 30 373,135 602.6 30Tabasco 9 1,046 235,545 225.2 11 279,688 267.4 15 230,190 220.1 9 213,005 203.6 9 201,782 192.9 10 232,042 221.8 10Tamaulipas 23 513 269,685 525.4 28 251,376 489.7 27 296,348 577.3 29 236,691 461.1 28 257,635 501.9 29 262,347 511.1 28Tlaxcala 18 327 85,172 260.8 15 106,778 326.9 19 100,375 307.3 17 93,739 287.0 17 81,784 250.4 17 93,569 286.5 17Veracruz 4 3,230 459,812 142.3 4 446,893 138.3 4 443,835 137.4 4 408,745 126.5 4 362,912 112.3 3 424,439 131.4 3Yucatan 11 646 204,643 316.7 19 214,780 332.4 20 241,499 373.7 25 199,869 309.3 21 195,662 302.8 22 211,290 327.0 19Zacatecas 12 869 205,385 236.3 13 261,540 301.0 16 241,906 278.4 16 265,873 306.0 19 163,604 188.3 9 227,662 262.0 16Total/Average 32,806 7,066,333 215.4 7,402,167 225.6 7,258,443 225.6 6,696,681 221.3 6,343,414 204.1 6,953,408 212.0 Rank Correlation 2005 = 0.782 Rank Correlation 2004 = 0.707 Rank Correlation 2003 = 0.663 Rank Correlation 2002 = 0.654 Rank Correlation 2001 = = 0.643 Rank Correlation Avg 2001‐05 = 0.741
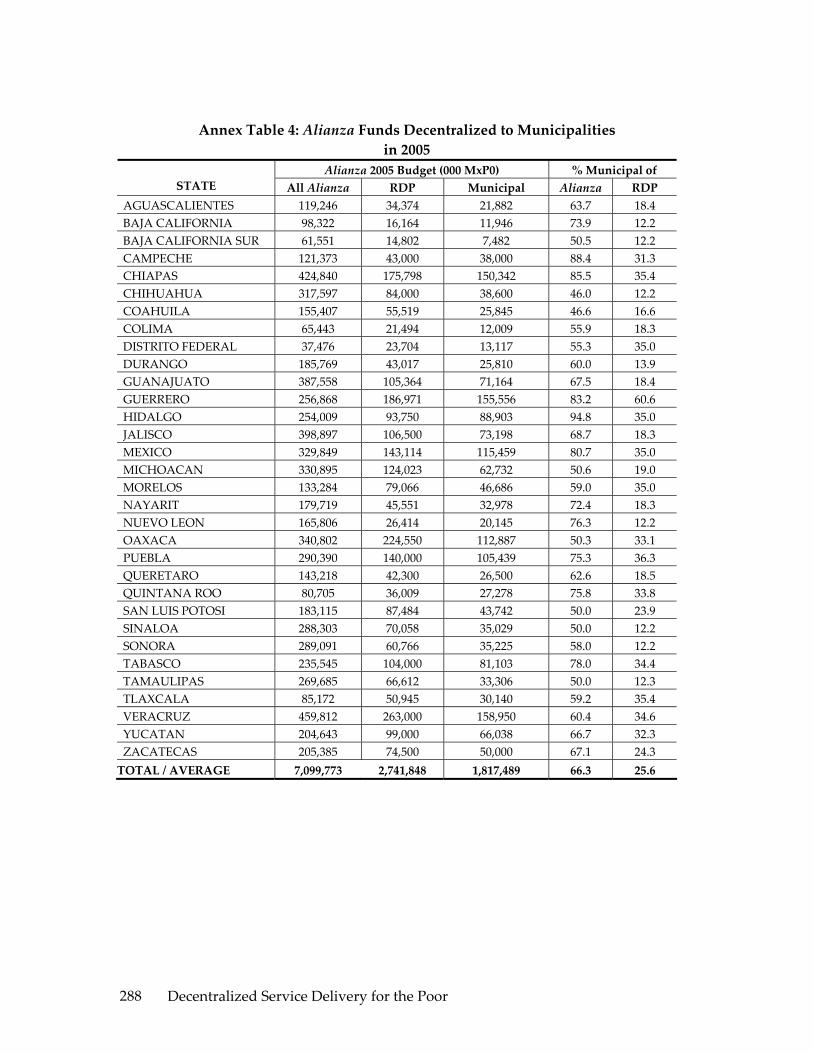
Decentralized Service Delivery for the Poor 288
Annex Table 4: Alianza Funds Decentralized to Municipalities in 2005
Alianza 2005 Budget (000 MxP0) % Municipal of STATE All Alianza RDP Municipal Alianza RDP
AGUASCALIENTES 119,246 34,374 21,882 63.7 18.4 BAJA CALIFORNIA 98,322 16,164 11,946 73.9 12.2 BAJA CALIFORNIA SUR 61,551 14,802 7,482 50.5 12.2 CAMPECHE 121,373 43,000 38,000 88.4 31.3 CHIAPAS 424,840 175,798 150,342 85.5 35.4 CHIHUAHUA 317,597 84,000 38,600 46.0 12.2 COAHUILA 155,407 55,519 25,845 46.6 16.6 COLIMA 65,443 21,494 12,009 55.9 18.3 DISTRITO FEDERAL 37,476 23,704 13,117 55.3 35.0 DURANGO 185,769 43,017 25,810 60.0 13.9 GUANAJUATO 387,558 105,364 71,164 67.5 18.4 GUERRERO 256,868 186,971 155,556 83.2 60.6 HIDALGO 254,009 93,750 88,903 94.8 35.0 JALISCO 398,897 106,500 73,198 68.7 18.3 MEXICO 329,849 143,114 115,459 80.7 35.0 MICHOACAN 330,895 124,023 62,732 50.6 19.0 MORELOS 133,284 79,066 46,686 59.0 35.0 NAYARIT 179,719 45,551 32,978 72.4 18.3 NUEVO LEON 165,806 26,414 20,145 76.3 12.2 OAXACA 340,802 224,550 112,887 50.3 33.1 PUEBLA 290,390 140,000 105,439 75.3 36.3 QUERETARO 143,218 42,300 26,500 62.6 18.5 QUINTANA ROO 80,705 36,009 27,278 75.8 33.8 SAN LUIS POTOSI 183,115 87,484 43,742 50.0 23.9 SINALOA 288,303 70,058 35,029 50.0 12.2 SONORA 289,091 60,766 35,225 58.0 12.2 TABASCO 235,545 104,000 81,103 78.0 34.4 TAMAULIPAS 269,685 66,612 33,306 50.0 12.3 TLAXCALA 85,172 50,945 30,140 59.2 35.4 VERACRUZ 459,812 263,000 158,950 60.4 34.6 YUCATAN 204,643 99,000 66,038 66.7 32.3 ZACATECAS 205,385 74,500 50,000 67.1 24.3 TOTAL / AVERAGE 7,099,773 2,741,848 1,817,489 66.3 25.6

Decentralized Service Delivery for the Poor 289
REFERENCES
Arroyo Alejandre, Jesús and Sánchez Bernal, Antonio: “Políticas municipales para la promoción del desarrollo económico regional”, in Enrique Cabrero Mendoza (ed.): Políticas públicas municipales: una agenda en construcción. CIDE, México D. F., 2003.
Cossio Cortez, Iván: “Descentralización y Desarrollo Rural en México”. Paper presented to the Seminario Internacional sobre Desarrollo Rural y Sector Agroalimentario: Estrategias de Futuro, Querétaro, March 23‐25, 2006
FAO: Informe de Evaluación de la Alianza para el Campo, 2004. SAGARPA, México DF, 2005.
Joumard, Isabelle: “Getting the Most Out of Public Sector Decentralization in Mexico”. Economics Department Working Paper No. 453. OECD, Paris, October 2005.
Kerrigan, George: “Public spending for the Agricultura Sector and Development of Rural Areas: LAC, Trends and Challenges. FAO, Santiago de Chile, 2001
Merino, Mauricio and Macedo, Ignacio: “La política autista. Crítica a la red de implementación municipal de la Ley de Desarrollo Rural Sustentable”. CIDE’s working paper series No. 168, CIDE, Mexico D. F., August 2005
Moreno, Carlos: “Decentralization, Electoral Competition, and Local Government Performance in Mexico”. Ph.D. Dissertation, LBJ School of Public Affairs, The University of Texas at Austin, 2005.
Prud’homme, Rémy: “On the Dangers of Decentralization” Policy Research Working Paper 1252. The World Bank Transportation, Water and Urban Development Department. Transportation Division. The World Bank, Washington DC, February 1994.
SAGARPA: Programa Especial Concurrente para el Desarrollo Rural Sustentable, 2002‐2006. México D. F., 2002
Tanzi, Vito: “Fiscal federalism and Decentralization: A Review of Some Efficiency and macroeconomic Aspects”, in Michael Bruno and Boris Pleskovic Annual World bank Conference on Development Economics, 1995. The World Bank, Washington, 1995.
The World Bank: Income Generation and Social Protection for the Poor, A Study of Rural Poverty in Mexico, Chapter 2. The World Bank, Mexico, 2005
Decentralized Service Delivery for the Poor 290
The World Bank: Poverty in Mexico: An Assessment of Conditions, Trends and Governments Strategy. The World Bank, Washington DC, 2004
The World Development Report 2004: Making Services Work for the Poor, The World Bank, Washington, 2004.


Decentralized Service Delivery for the Poor: Reports Finished printing August, 2006 in IMPRIME TUS IDEAS, S.A. de C.V., Horacio 340,
Polanco, CP. 11560, México, D.F. [email protected] Edition 200 copies