Public bikes in Barcelona - IMPACTS Pineda... · More than 10 times Between 5 and 10 times ... Each...
16
Public bikes in Barcelona ELENA PLA PINEDA Mobility Department Public bikes in Barcelona Barcelona: Mobility basic information Barcelona is the center of one of the biggest metropolitan areas in Europe: the Metropolitan Region of Barcelona that integrate 164 municipalities and 4.4 millions of inhabitants. (density: 1.359 inhabitants/km 2 ). Barcelona is a city with a high demographic density, with 1.600.000 inhabitants in 101 km 2 (density: 15.963 inhabitants/km 2 ).
Transcript of Public bikes in Barcelona - IMPACTS Pineda... · More than 10 times Between 5 and 10 times ... Each...

Public bikes in Barcelona
Public bikes in Barcelona
ELENA PLA PINEDAMobility Department
Public bikes in Barcelona
Barcelona: Mobility basic information
Barcelona is the center of one of the biggest metropolitan areas in Europe: the Metropolitan Region of Barcelona that integrate 164 municipalities and 4.4 millions of inhabitants. (density: 1.359 inhabitants/km2).
Barcelona is a city with a high demographic density, with 1.600.000 inhabitants in 101 km2 (density: 15.963 inhabitants/km2).

Public bikes in Barcelona
51,5%2.253.024
32,7%1.428.856
15,8%691.993
The non-motorized modes of transport (51,5%) and the public transport (32,7%) are the most used on intern displacements
In the connection displacements, the public transport(49,5%) and the private transport (47,5%) have very similar proportions of use.
1,66 millions
4,37 millionsNon-motorized mode Public TransportPrivate Transport
49,5%822.984
47,5%789.780
3,0%50.346
Barcelona: Modal Distribution
Public bikes in Barcelona
Beginning on March 2007
• 6000 bicycles
• 400 stations
• Coverage 49 km2
• Coverage Range 197 m
• Slope< 4%
MUNICIPALITY TERRITORIAL COVERAGE

Public bikes in Barcelona
TPI contracting-financing forms
The public bicycle system is integrated in the advertising contract, as a part of the canon. The control mechanism is subject to the principal aim of the advertising contract.
The public bicycle service system is an open request for tenders as a providing of a public service. The administration have a direct control all over the system.
1. Using a service rendering contract: Barcelona, Brussels, Sidney … models
2. Included on the advertising contracts:Oslo, Lyon, Paris … models
Public bikes in Barcelona
Bicing is financed with the excess of the integral regulation parking system, the “Àrea Verda”, in accordance with the Fiscal Orderly establishes.
Object:Safe, Sustainable, Equitable, Efficient Mobility
Car use restriction instruments:Parking Integral Regulation
More sustainable modes promotion: Project
financing

Public bikes in Barcelona
2 years later...
Public bikes in Barcelona
- 187.375 joins.- 6.000 bicycles.- 400 stations.
On May 2009:
customers
1.500 3.000 4.500 6.000 Bicycles: 300
6 € 24 € 30 €
(Annual subscription)

Public bikes in Barcelona
PROFESSION % CUSTOMERS
Student 15,86%
Administrative 9,38%Engineer 7,12%
Civil Service 4,86%
Self-employed 4,12%Artist 3,69%
Teacher 3,22%
Economist 3,12%Arquitect and quantity
surveyor 2,48%
Manager / Director 2,26%
Customers description
• Change in the bicycle customer role
• 59% of customers are older than 30 years old.
• Professional diversification
After :
Before :
Professional diversification and increase of the bicycle customer average age. Use due
to comfort and speed.
Mainly users are young students involved with sustainability and environment.
Public bikes in Barcelona
JOURNEY FEATURES WITH BICING
Journey
Average length
Working days: 14,1 minutesHolidays: 17,8 minutes
Distance 3 km
Rush HourExample:Zona universitaria
Journey features
Every day 97.139 bicycle displacements take place in Barcelona
Displacements / day type
Summer (june)
Winter (january)
Working day 47,069 34,150
Holiday 32,127 19,244
48,45 % of bicycle journeys during a favourable climate working day by BICING

Public bikes in Barcelona
8,3%
19,1%
43,5%
29,1%
0% 10% 20% 30% 40% 50%
More than 10 times
Between 5 and 10times
Between 1 and 5 times
Once or less
Use characteristics
• A high percentage of customers don’t usebicing usually (29,1%)
• There are a large part of customers that use bicing as their habitual transport mode (27,4%)
• Most of the customers use bicing regularly changing with other transport modes (43,5%)
DIARY USES
Public bikes in Barcelona
INTERMODALITY
• 63% are realized exclusively with Bicing
• 37% combines Bicing with other transport modes
• 68,2% are obligated mobilityjourneys (work, studies, etc.)
• Bicing has assumed the role of an usual urban transport mode for all displacement reasons.
Use characteristics

Public bikes in Barcelona
Importance and Evaluation
6,39
6,57
7,00
7,07
7,18
7,24
7,33
7,34
7,45
7,83
8,42
8,62
8,70
0 2 4 6 8 10
Fare when the first half an hour expires
Bicycle model adaptation to the use given
Customer service at the Bicing offices
Annual subscription fare
Bicycle comfort and ergonomics
Use and operation information at the stations
Station maintenance state
The answer received after a Bicing complaint
The easy use of the stations (take and leave bicycles)
Bicycles mechanic reliability
Stations location in relation to your needs
Bicycles availability at origin
Parking availability at destination stations
4,54
4,90
5,53
5,88
6,09
6,25
6,44
6,63
6,84
6,98
7,04
7,26
7,36
0 2 4 6 8 10
Parking availability at destination stations
Bicycles availability at origin
The answer received after a Bicing complaint
Fare when the first half an hour expires
Bicycles mechanic reliability
Stations maintenance state
Use and operation information at the stations
Customer service at the Bicing offices
Annual subscription fare
Bicycle comfort and ergonomics
The easy use of the stations (take and leave bicycles)
Stations location in relation to your needs
Bicycle model adaptation to the use given
The two points considered the most important (availability)
are less valuated
Studies for improve:
• System compensation(Anchorages / Bicycles≈2)• Distribution logistics
Stations location (coverage) have a high valuation
6,29
Average Valuation
Public bikes in Barcelona
Improvement priority matrix
EFFORTS TO MAINTAIN
STRONG POINTS
SECONDARY PRIORITY
PRIORITY ACTIONS
Lower than average
Higher than average
IMPORTANCE
Stations locations in relation to your needs
Bicycles availability at origin
Parking availability at destination stations
Stations maintenance state
The easy use of the stations (take and leave bicycles)
Bicycle comfort and ergonomics
Bicycles mechanic reliability
Bicycle model adaptation to the use given
Annual subscription fare
Fare when the first half an hour expires
Customer service at the Bicing offices
The answer received after a Bicing complaint
Use and operation information at the stations
• Studies development• Actions
Public bikes in Barcelona
18013.7%
7.10148,6%
1.04032.2%
3.58743,7%
3.560
50,4%
27115,4%
194,3%
62144,9%
24019,4%
527
22,4%
DISTRICTS RELATION. TRIPS / TOTAL WORKING DAY
Public bikes in Barcelona
Each circle diameter indicate the volume of generated trips, whereas the colour represent the α value.
DAILY ASYMMETRY PER STATION DURING A WORKING DAYAsymmetry (α) is represented as the relation between generated trips (G) and attracted trips (A):
α = G / A 49% of stations have a balanced asymmetric rate.
Problemas de acumulación
Problemas de reposicionamiento
STATIONS CLASSIFICATION BY ASYMMETRY LEVEL
3%4%
14%22%
27%14%
5%2%2%
3%3%
0% 5% 10% 15% 20% 25% 30%
< 0,60
0,60 a 0,75
0,75 a 0,90
0,90 a 1,00
1,00 a 1,10
1,10 a 1,25
1,25 a 1,40
1,40 a 1,70
1,70 a 2,00
2,00 a 3,00
> 3,00
'A
sim
met
ry ra
te
(Orig
in/D
estin
atio
n)
% stations
EVALUATION OF SERVICES PROVIDED
Public bikes in Barcelona
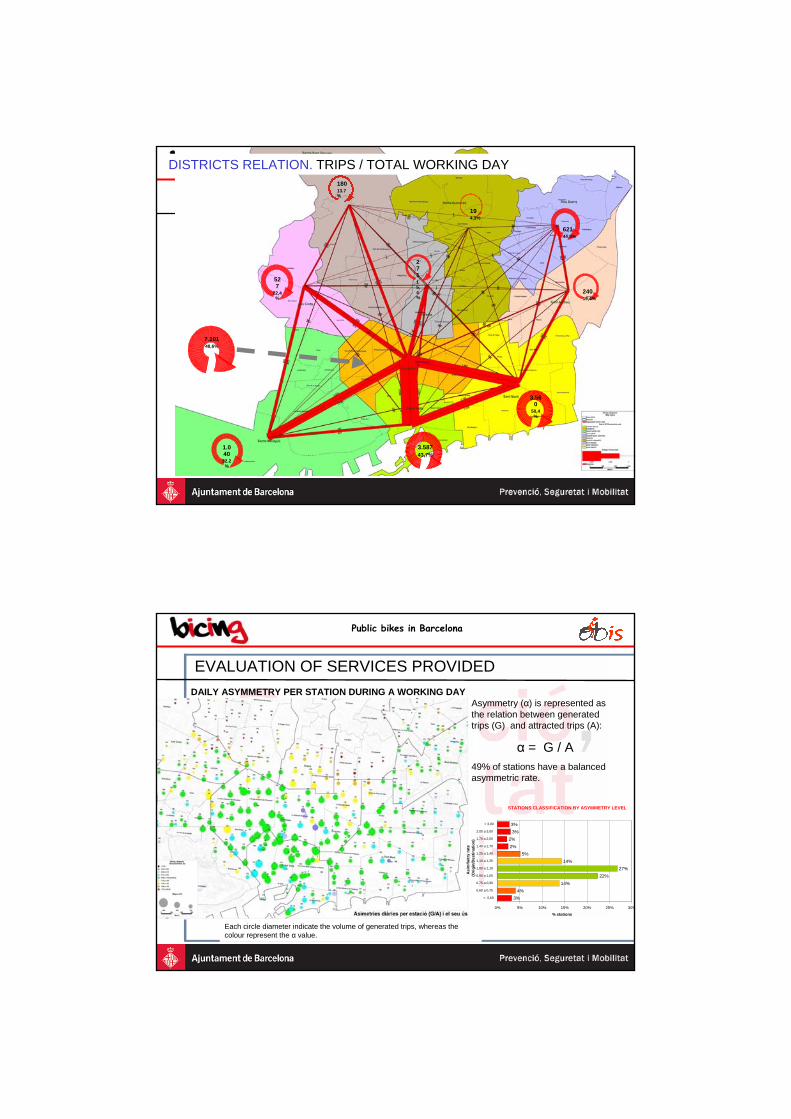
STATIONS OCCUPATION.WORKING DAY
Blue circles represents the empty stations during the day, the red ones represents the completely full stations and its diameter represents the number of hours that have been full.
EVALUATION OF SERVICES PROVIDED
Public bikes in Barcelona
Sants-Montjuïc
anca-Port
Sant Martí
Eixample
Sant Andreu
Les Corts
Ciutat Vella
Gràcia
Parc de Montjuïc
Sarrià
Pedralbes
Sant Gervasi-Bonanova
La Dreta de l'Eixample
Sant Andreu
La Maternitat i Sant RamonEl Bon Pastor
Sant Gervasi-Galvany
El Poblenou
Les Corts
La Nova Esquerra de l'Eixample
La Barceloneta
Vila de Gràcia
Diagonal Mar i el Front Marítim
El Guinardó
La Marina de PortSant Pere, Santa Caterina i la Ribera
Vallcarca i els Penitents
L'Antiga Esquerra de l'Eixample
La Verneda i la Pau
Provençals del Poblenou
Sants
El Parc i la Llacuna del PoblenouEl Raval
La Sagrada Família
El Carmel
El Besòs i el Maresme
La Vila Olímpica del Poblenou
La Sagrera
El Fort Pienc
La Trinitat Vella
Porta
El Putget i Farró
Sant Antoni
El Gòtic
El Poble Sec
Les Tres Torres
La Vall d'Hebron
Sant Martí de Provençals
La Marina del Prat Vermell
Camp de l'Arpa del Clot
Les Roquetes
El Clot
La Salut
El Camp d'en Grassot i Gràcia
La Font d'en Fargues
La Prosperitat
La Bordeta
Vilapicina i la Torre Llobeta
El Baix Guinardó
La Trinitat Nova
La Guineueta
Turó de la Peira
Navas
Hostafrancs
Sants-Badal
El Congrès i els Indians
El Coll
Can Baró
La Teixonera
La Font de la Guatlla
Canyelles
El Verdum
Baró de Viver
La ClotaCan Peguera
263
393
22
380
218
262
390
286
190
382
258267
268
266
335
191
376 375
269
271
189
265
261
209
270
84
310
195314
354
188313
355
312
326
327329
330
305
307
311
257
256
260
328
353
309
308
291
193
199
204
306
293
302
332
334337
336
294
299338
331
325
303
333
196
202
300288
295
192
290
298
200
296285
367
297
259
282
304
283
194
301
289
292
230 357
102
122
227
28
277
356228 276
203
106
20
284
108
229206
21
201
214
207
278226
318
197
212
208
213
366107
222
164
231
319
280
281
215
324323
223
221
322
216219
217
320
321
279205
198
224
225
101
29121
120
26
1837019
253
123
254
360
255
15
25
23
273274
359
243251
250 252
272
316
249
391
363
36960
275
362
105
66
61
287
64 6562
30
63
371
368
364
24
341
343
264
340
342
344
27
315
242
247246
248
241
240239
244
130
238
128103
177
104
339
129127
347348
349
351
346
352
179
184
180 181
185
183
234
236
18296
186
345
374
210
67
237
94
95
93
97
386
98
81
82
100
99
373
88
233
384
92
68
72
85
350
86
22074
112
111
91
113
87
7377
76
385
235
75 365
83
109
50
232
9089
110
378
55 37952
3635
53358
56
51
317
57
114
54187
34148
389392
388
70
131
71 58
387
59
381
134
135
141
147
133140
139
138132
157
137
170
11749
151
172
155
158
160
166 178168
176
167
156
146
150
136
144 145
161
159
171
163
162
175
174173
165
16912
42
143
154153152
44
142211
17372
16
48
46
119
32
124
149
45
118
47
11
1166913
43
12541
6
8710
91411537
3331
40
12638
39
377
5
2
34
80
79
78
1
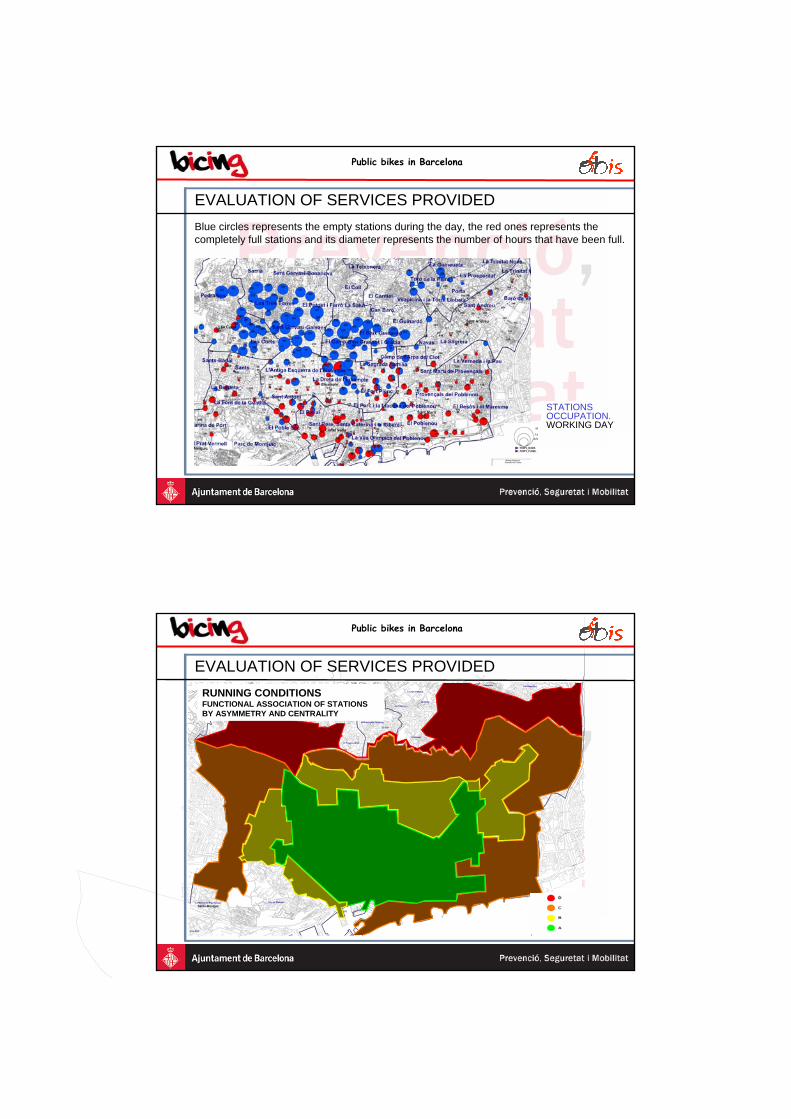
Bicing DiagnosiNiv ell de Serv ei
D C B A
RUNNING CONDITIONS FUNCTIONAL ASSOCIATION OF STATIONS BY ASYMMETRY AND CENTRALITY
EVALUATION OF SERVICES PROVIDED

Public bikes in Barcelona
Investment and recovery costs
The estimated global inversion global for Bicing services is 15,9 million euro, emphasizing the stations cost that represents almost the 70% and, in the distance, the bicycles cost (17%).
SERVICE COST
INVESTMENTS DISTRIBUTION
17%
69%
5%5% Bicycles
Stations
Control and management
Information
Maintenance and repair
Bicycles movement
Administration and structure
Public bikes in Barcelona
Running costsPersonnel costBicing service staff are about 230 people, 50% of them are assigned to bicycles movement.
The estimated personnel cost is about 5 million euro.
Estimated global service costs: 10,2 million €/year
Service costs
BICING SERVICE PERSONNEL
16%
26%
50%
STRUCTURE
ADMINISTRATION
CONTROL IAND MANAGEMENT
INFORMATION TO THE CUSTOMER
MAINTENANCE AND REPAIR
BICYCLES MOVEMENT
SERVICE COST

Public bikes in Barcelona
Media Impact
March 2008 November 2008 February 2009
Public bikes in Barcelona
Reflections. Social Impact.
• Number of visits done to the service web page is: 3.056.444
• The number of customers is 187.375 more than 15% of Barcelona population (excluding old people and adolescents)
• 59 % of users older than 30 years old new customer profile
• Large presence in the media
• Bicing customer idea of being member of a “club”
• Recognitions:
• BMW Award• “Medio Ambiente Generalitat” Award

Public bikes in Barcelona
Reflections. Impacts over mobility.
• Metropolitan Bicing demand other municipalities show their will of take part in the success
• Private bicycle growth great boost to the bicycle as an urban transport mode
• Gain of “Last mille” bus users• Pedestrians–cyclists tensions:
• Circulation Orderly “Bicycle Orderly”
“Ride a bicycle along the city is possible”
Necessity of exclusive space for bicycles
Public bikes in Barcelona
Thanks for your attention

Public bikes in Barcelona
Reflections about the implementation and management of the Barcelona Bicycle Public Service
Public bikes in Barcelona
Cost coverage
Service collection coverage, with the actual price system, will be around 33% of running expenses and joint recoveries (44% of expenses exclusively).
Users income:Users contribution as an income concept will be around 4,5 million euro. On 2008, 90% of them corresponds to annual subscriptions, and will be between 6,5 and 7,8 million on year 2009 depending on the customers number evolution, in accordance with new fares approved for this period.
ESTIMATED INCOME COVERAGE
45%
58%64%
77%
33%43% 48%
57%
0%
10%
20%
30%
40%
50%
60%
70%
80%
90%
2008
€
About expenses
About expenses + recoveries
Fares 2009 without
subscribers growth
Fares 2009 and
moderate subscribers
growth
Fares 2009 and high
subscribers growth
SERVICE COST

Public bikes in Barcelona
Availability of execute displacements on slope
A quarter of users assert that they always make Bicing trips on slope. 40% of users are not used to make slope routes.
Font: Estudi d'hàbits dels usuaris del Bicing. 2008
AVAILABILITY OF EXECUTE DISPLACEMENTS ON SLOPE
26%
26%
19%
29%
29%
32%
27%
31%
30%
36%
33%
35%
29%
32%
32%
38%
39%
35%
33%
31%
35%
11%
6%
7%
8%
7%
3%
4%
0% 10% 20% 30% 40% 50% 60% 70% 80% 90% 100%
Zona Port
Ciutat Vella
Eixample
Les Corts
Gràcia
Sant Andreu
TOTAL
% usersAlways Many times Some times Never
EVALUATION OF SERVICES PROVIDED
Public bikes in Barcelona
Studies execution:
• Studies abut mobility: • Demand analysis:
• Origin/destiny matrix• Self control by neighbourhood and zones• Schedule distribution• Stations imbalance
• Supply analysis:• Territorial coverage• Agility of the system
• Search of alternatives for demand management, and improve/adapt the supply
• Studies about operative optimization: • Analysis: problems detection• System resizing
• Stations, slots, bicycles, redistribution systems, etc.
IMPROVEMENT MEASURES

Public bikes in Barcelona
Improvement proposal:
Most saturated and/or unbalanced zones boost:
•Short term measures• Suggest to Clear Channel a replacement route reorganization by zones, to give an
homogeneous service to unattended zones with minimum costs • Densification of clusters at zones where the storage capacity is insufficient,
extending the current stations when is possible, or opening new stations near to the existing ones
• At new programmed stations (Sants),preferably stations with 60 slots (2x30)
• Long term measures
• Periodic revision of the clusters zoning, the stock planning, and the van assignment, as the demand increase
• Use of a station stock control tool, for visits reassignment
CL027 PLAÇA CATALUNYA
CL029 BARCELONETA
CL030 HOSPITAL DEL MAR
CL032 VILA OLÍMPICA
CL034 UPF
IMPROVEMENT MEASURES
Public bikes in Barcelona
Improvement proposal:
• Solve of redistribution problems:• Access problems to some stations• Action protocol
• Security improvement• Minimize the traffic affectation
• Revision of the service levels requirements (contract conditions).
• Improve on demand management:• Incentive for customers Auto-balance of the system
IMPROVEMENT MEASURES

Public bikes in Barcelona
28 km of new cycle lanes
More bicycle parking places (from 14,000
to 25,000)
More 30 Zones(car-bicycle co-existence)
Improved safety for existing cycle lanes
Barcelona: GLOBAL BICYCLE PROMOTION