Public Awareness Campaign on Climate Change and Energy ...
54
Public Awareness Campaign on Climate Change and Energy Efficiency Baseline and Follow-Up Surveys Office of Climate Change and Energy Efficiency Government of Newfoundland and Labrador March 2015
Transcript of Public Awareness Campaign on Climate Change and Energy ...

Public Awareness Campaign on Climate Change and Energy Efficiency
Baseline and Follow-Up Surveys
Office of Climate Change and Energy Efficiency Government of Newfoundland and Labrador
March 2015
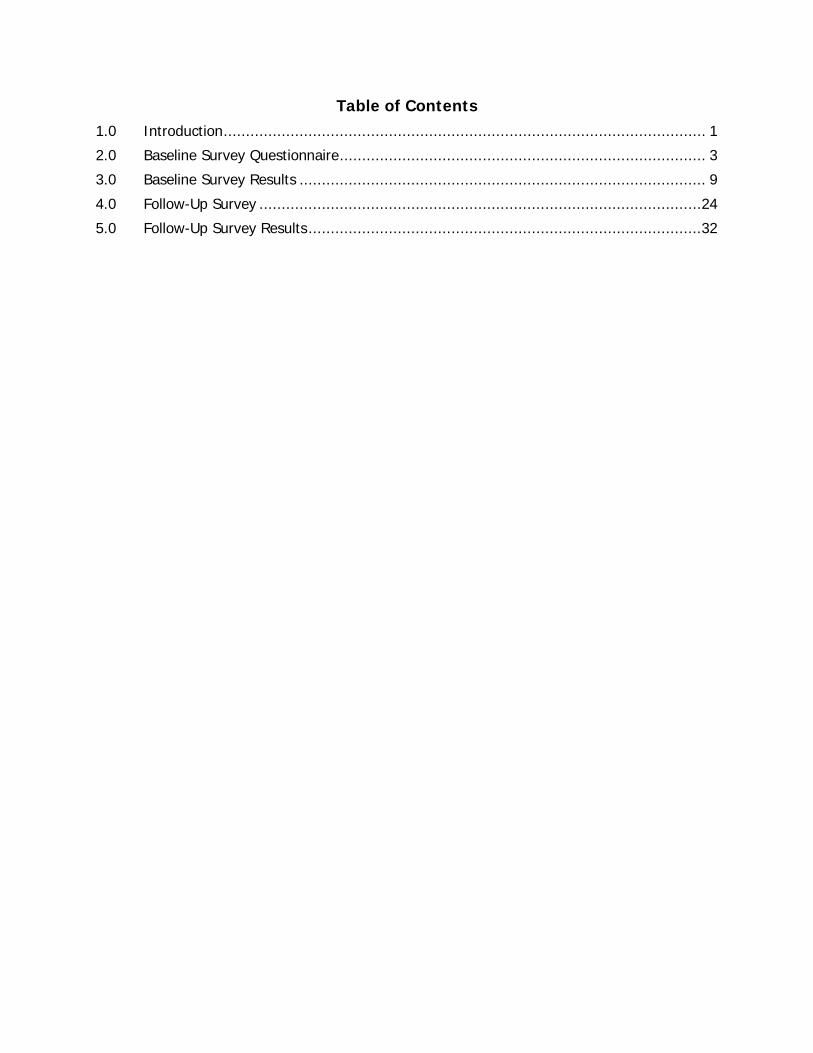
Table of Contents 1.0 Introduction ............................................................................................................ 1
2.0 Baseline Survey Questionnaire .................................................................................. 3
3.0 Baseline Survey Results ........................................................................................... 9
4.0 Follow-Up Survey ...................................................................................................24
5.0 Follow-Up Survey Results ........................................................................................32

Public Awareness Campaign on Climate Change and Energy Efficiency Baseline and Follow-Up Surveys 1
1.0 Introduction In September 2012, the Turn Back the Tide public awareness campaign was launched by the Office of Climate Change and Energy Efficiency (CCEE) fulfilling a commitment in the 2011 climate change and energy efficiency action plans. Its objective is to help Newfoundlanders and Labradorians better understand climate change and energy efficiency and how individuals can help tackle climate change. In advance of the campaign, a baseline survey was developed to measure residents’ awareness and behaviours related to climate change and energy efficiency. Its intention was to provide a baseline to measure change in awareness and behaviour resulting from the campaign. The survey was developed by CCEE. MQO Research was hired in March 2012 to administer it via telephone to 800 Newfoundland and Labrador residents (802 actual respondents). The Turn Back the Tide campaign funding ended in March 2014. At this point a follow-up survey was conducted to measure any change in awareness or behaviour. The survey was developed by CCEE. It was administered by the Newfoundland and Labrador Statistics Agency, Department of Finance, Government of Newfoundland and Labrador to 800 Newfoundland and Labrador residents (933 actual respondents).
Overview of Baseline and Follow-Up Surveys Baseline Survey Follow-Up Survey Data collection period March 17/12 – March 25/12 March 14/14 – April 25/14 Strata Region and age and gender within Region
Respondents St. John’s CMA 400 488 Outside St. John’s CMA 402 445 Total 802 933
Margin of error at 95% confidence ± 3.5% ± 3.2% Both surveys gathered information on three topic areas: knowledge of climate change and its impacts, actions and behaviours of individuals, and knowledge of provincial government programs and initiatives. The follow-up survey included an additional section gathering information specific to the Turn Back the Tide public awareness campaign. Key findings of the surveys include: Knowledge of Climate Change • In both surveys, almost all respondents believed that climate change was happening, most
(roughly two-thirds) associated it with rising temperatures and almost all were aware that human activity is causing climate change.
• There was an increase between the baseline and follow-up surveys in how informed respondents felt they were about the potential impacts of climate change on them as an individual (21 to 25 per cent of respondents felt very informed).
• In both surveys, about one-half of respondents felt the issue of climate change to be very relevant to Newfoundland and Labrador.
Individuals’ Behaviours and Actions • In both surveys, the everyday activities most participated in to help reduce impact on
climate change were recycling, using energy efficient lighting and insulating attics.

Public Awareness Campaign on Climate Change and Energy Efficiency Baseline and Follow-Up Surveys 2
• When comparing the baseline to the follow-up survey results, increases are seen in the use of ENERGY STAR appliances and fuel-efficient transportation.
• When asked, one-half of respondents in the follow-up survey reported a barrier preventing them from taking steps to improve their energy efficiency. Of these respondents, the most common barriers identified were related to financial constraints (e.g. more income, less cost, etc.).
• Most respondents to both surveys (86 per cent) felt that their everyday actions were having only little to moderate impact on climate change.
Provincial Government Programs and Initiatives • There was limited knowledge of provincial government work to reduce climate change or
increase energy efficiency. In both surveys, about two-thirds of respondents were not aware of any provincial government departments or agencies that were working toward reducing climate change or increasing energy efficiency.
• There was increased awareness of provincial government programs or services targeted toward climate change or energy efficiency (27 to 35 per cent).
Turn Back the Tide (follow-up survey only) • Almost one-half of respondents were aware of the Turn Back the Tide campaign. Of those
that were aware, over 80 per cent became familiar through television. • Few respondents (4 per cent) had visited the campaign website. • About one-half of respondents indicated that they changed behaviours as a result of
information obtained on climate change and energy efficiency. • Of respondents that were familiar with the campaign television advertisements, online
advertiesements or website, 17 per cent directly related their behavioural change to the Turn Back the Tide campaign.

Public Awareness Campaign on Climate Change and Energy Efficiency Baseline and Follow-Up Surveys 3
2.0 Baseline Survey Questionnaire FINAL - Public Awareness Campaign Survey Questions Introduction Hello, my name is ______ and I am calling from MQO Research, a Newfoundland-based research company and we are calling today/tonight to conduct a survey on issues in this province. Depending on your responses the survey will take about 8-10 minutes to complete. Please be assured that your responses will be kept confidential. If Necessary: Your answers will be kept confidential as required by the Access to Information and Protection of Privacy Act. Would you be willing to participate in this survey?
Yes Continue to Q1 Yes but not right now ask for a time to call back No Stop (Thank you for your time)
Section 1: Gauging Public Awareness and Understanding
1. Are you familiar with the term “climate change”? 1. Yes 2. No Read definition of climate change and skip to Q3 98. Don’t know/Unsure Read definition of climate change and skip to Q3
Definition of climate change: Climate change refers to changes in the environment around the world due to rises in global temperatures as a result of increased greenhouse gas emissions (e.g. carbon dioxide released from burning fuel to run our vehicles).
2. When you think of climate change what comes to mind?
(do not read list - prompt for multiple responses - check all that apply) 1. Natural disasters (e.g. storms, floods, etc.) 2. Recycling 3. Composting 4. Greenhouse effect/Greenhouse gases 5. Global warming/Temperature rising 6. Polar ice melt/Ice burgs 7. Wildlife/endangered species 8. Energy efficiency – appliances 9. Energy efficiency – light bulbs 10. Energy efficiency – insulation 11. Transportation - Hybrid or fuel efficient vehicles 12. Alternate transportation – public transportation, walking, cycling 13. Clean energy (e.g. Muskrat Falls, wind and solar energy) 14. Media events (e.g. World Environment Day) 15. Environmental activist (e.g. David Suzuki) 96 Nothing in particular comes to mind 97 Haven’t really thought about it
Other (please specify):______________________ 98. Don’t know
Public Awareness Campaign on Climate Change and Energy Efficiency Baseline and Follow-Up Surveys 4
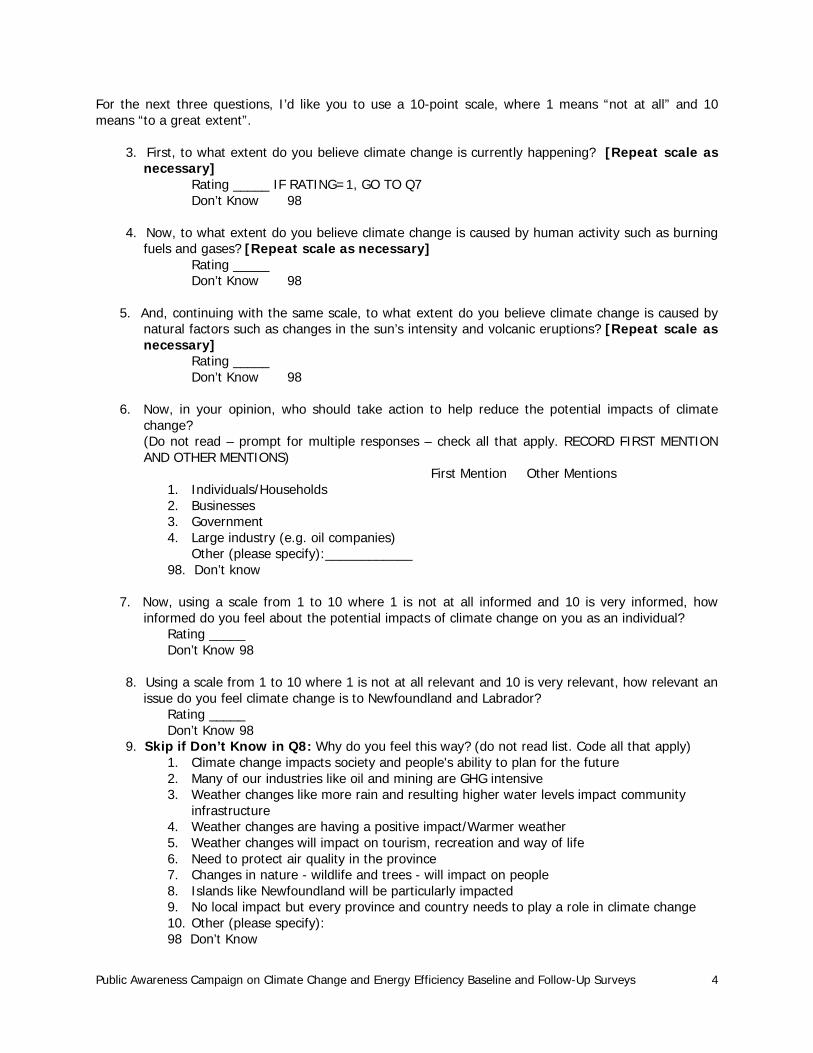
For the next three questions, I’d like you to use a 10-point scale, where 1 means “not at all” and 10 means “to a great extent”.
3. First, to what extent do you believe climate change is currently happening? [Repeat scale as necessary]
Rating _____ IF RATING=1, GO TO Q7 Don’t Know 98
4. Now, to what extent do you believe climate change is caused by human activity such as burning
fuels and gases? [Repeat scale as necessary] Rating _____ Don’t Know 98
5. And, continuing with the same scale, to what extent do you believe climate change is caused by
natural factors such as changes in the sun’s intensity and volcanic eruptions? [Repeat scale as necessary]
Rating _____ Don’t Know 98
6. Now, in your opinion, who should take action to help reduce the potential impacts of climate
change? (Do not read – prompt for multiple responses – check all that apply. RECORD FIRST MENTION AND OTHER MENTIONS) First Mention Other Mentions
1. Individuals/Households 2. Businesses 3. Government 4. Large industry (e.g. oil companies)
Other (please specify):____________ 98. Don’t know
7. Now, using a scale from 1 to 10 where 1 is not at all informed and 10 is very informed, how
informed do you feel about the potential impacts of climate change on you as an individual? Rating _____ Don’t Know 98
8. Using a scale from 1 to 10 where 1 is not at all relevant and 10 is very relevant, how relevant an
issue do you feel climate change is to Newfoundland and Labrador? Rating _____ Don’t Know 98
9. Skip if Don’t Know in Q8: Why do you feel this way? (do not read list. Code all that apply) 1. Climate change impacts society and people's ability to plan for the future 2. Many of our industries like oil and mining are GHG intensive 3. Weather changes like more rain and resulting higher water levels impact community
infrastructure 4. Weather changes are having a positive impact/Warmer weather 5. Weather changes will impact on tourism, recreation and way of life 6. Need to protect air quality in the province 7. Changes in nature - wildlife and trees - will impact on people 8. Islands like Newfoundland will be particularly impacted 9. No local impact but every province and country needs to play a role in climate change 10. Other (please specify): 98 Don’t Know

Public Awareness Campaign on Climate Change and Energy Efficiency Baseline and Follow-Up Surveys 5
Taking action 10. What impact do you feel your everyday actions are having on climate change? Would you say
your actions are having……(read list) 1. No impact 2. A little impact 3. A moderate impact 4. A strong impact 8. Don’t know (Vol)
11. Please list all the things you do in your everyday life to help reduce your impact on climate
change? (do not read - prompt for multiple responses – check all that apply) 1. Recycling 2. Composting 3. Energy efficient lighting 4. Programmable thermostats 5. Energy star appliances 6. Energy star windows 7. Insulated basement 8. Insulated attic 9. Alternative transportation - Carpooling 10. Alternative transportation - Public transportation/Bus 11. Alternative transportation - Walking 12. Alternative transportation - Bicycling 13. Fuel efficient transportation (i.e. hybrid vehicle or fuel efficient vehicles)
Other (please specify):________________________ 97. I don’t do anything to help reduce my impact 98. Don’t know
12. Do you recycle? (do not ask if listed in Q11)
1. Yes 2. No 8. Don’t know
13. Do you compost? (do not ask if listed in Q11)
1. Yes 2. No 8. Don’t know
14. Do you drive a fuel efficient vehicle? Fuel efficient vehicles would include all hybrid vehicles as
well as smaller vehicles similar to a Ford Focus, Chevrolet Aveo, Honda Civic or Nissan Sentra that generally have 4 cylinder engines. (do not ask if listed in Q11)
1. Yes 2. No 3. Do not own a vehicle 8. Don’t know
15. Do you use alternative transportation such as: (do not ask for each, if listed in Q11)
1. Carpooling 2. Public transportation/Bus 3. Walking 4. Bicycling 8. Don’t know (Vol)
Public Awareness Campaign on Climate Change and Energy Efficiency Baseline and Follow-Up Surveys 6
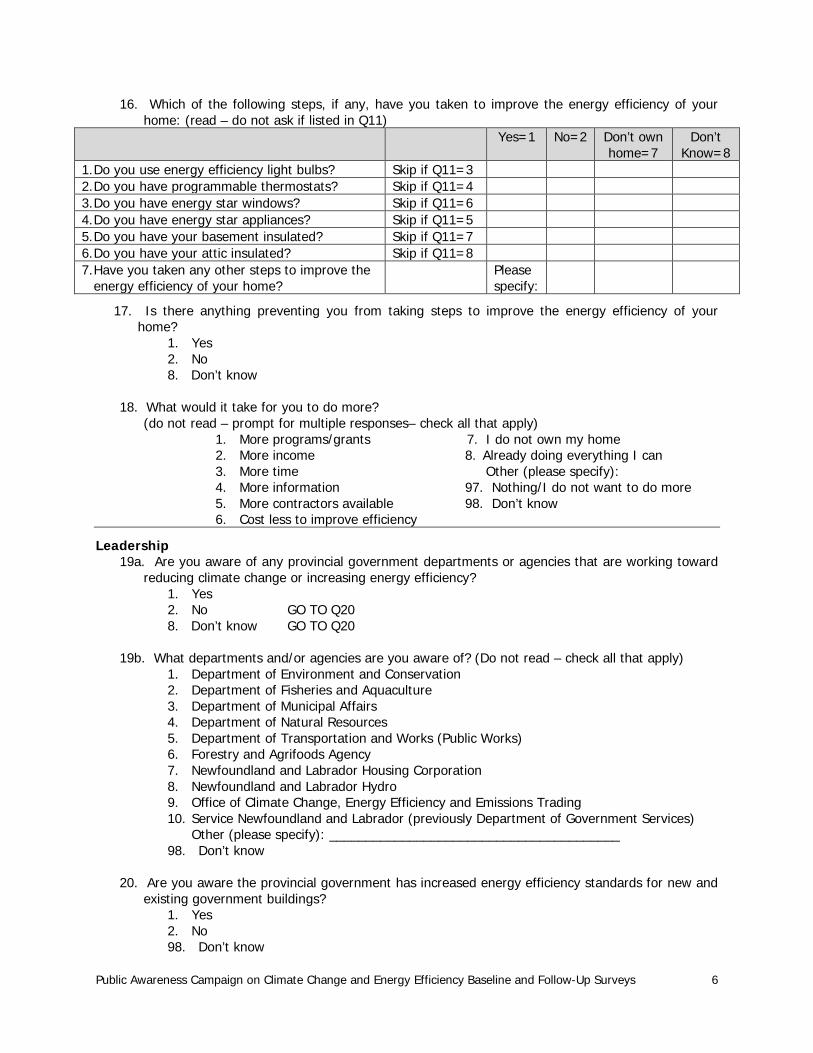
16. Which of the following steps, if any, have you taken to improve the energy efficiency of your home: (read – do not ask if listed in Q11)
Yes=1 No=2 Don’t own home=7
Don’t Know=8
1. Do you use energy efficiency light bulbs? Skip if Q11=3 2. Do you have programmable thermostats? Skip if Q11=4 3. Do you have energy star windows? Skip if Q11=6 4. Do you have energy star appliances? Skip if Q11=5 5. Do you have your basement insulated? Skip if Q11=7 6. Do you have your attic insulated? Skip if Q11=8 7. Have you taken any other steps to improve the
energy efficiency of your home? Please
specify:
17. Is there anything preventing you from taking steps to improve the energy efficiency of your home?
1. Yes 2. No 8. Don’t know
18. What would it take for you to do more?
(do not read – prompt for multiple responses– check all that apply) 1. More programs/grants 2. More income 3. More time 4. More information 5. More contractors available 6. Cost less to improve efficiency
7. I do not own my home 8. Already doing everything I can Other (please specify): 97. Nothing/I do not want to do more 98. Don’t know
Leadership 19a. Are you aware of any provincial government departments or agencies that are working toward
reducing climate change or increasing energy efficiency? 1. Yes 2. No GO TO Q20 8. Don’t know GO TO Q20
19b. What departments and/or agencies are you aware of? (Do not read – check all that apply)
1. Department of Environment and Conservation 2. Department of Fisheries and Aquaculture 3. Department of Municipal Affairs 4. Department of Natural Resources 5. Department of Transportation and Works (Public Works) 6. Forestry and Agrifoods Agency 7. Newfoundland and Labrador Housing Corporation 8. Newfoundland and Labrador Hydro 9. Office of Climate Change, Energy Efficiency and Emissions Trading 10. Service Newfoundland and Labrador (previously Department of Government Services)
Other (please specify): ________________________________________ 98. Don’t know
20. Are you aware the provincial government has increased energy efficiency standards for new and
existing government buildings? 1. Yes 2. No 98. Don’t know

Public Awareness Campaign on Climate Change and Energy Efficiency Baseline and Follow-Up Surveys 7
21. Are you aware the provincial government is purchasing hybrid vehicles? 1. Yes 2. No 98. Don’t know
Other programs
22. Are you aware of any provincial government programs or services targeted toward climate change or energy efficiency?
1. Yes- Get to half 2. Yes - Take Charge 3. Yes - energy efficiency home retrofit grant programs
(e.g. EnerGuide – Natural Resources, REEP for Low Income – Newfoundland and Labrador Housing Corporation)
4. Yes – Other (please specify):_____________________ 5. No 8. Don’t know
23. Are you aware of the Get to half campaign by MMSB which aims to reduce the amount of waste
produced at home, schools and work? (do not ask if mentioned in Q22 – go to Q24) 1. Yes 2. No GO TO Q25 8. Don’t know GO TO Q 25
24. Are you aware of the Take Charge program by Newfoundland and Labrador Hydro and
Newfoundland Power which provides information and funding towards making energy efficient improvements in your home or business? (do not ask if mentioned in Q22 – go to Q25)
1. Yes 2. No 98. Don’t know
25. Where would you send someone for information on climate change or energy efficiency?
(Do not read – prompt for multiple responses – check all that apply) 1. Government website 2. Internet website (non-government) 3. Government department 4. School/teacher 5. Friend 6. Utilities (e.g. Newfoundland Power)
Other (please specify):_________ 98. Don’t know
26. Now, in your opinion, who should take action to help reduce the potential impacts of climate
change? (Do not read – prompt for multiple responses – check all that apply. RECORD FIRST MENTION AND OTHER MENTIONS)
First Mention Other Mentions 1. Individuals/Households 2. Businesses 3. Government 4. Large industry (e.g. oil companies) Other (please specify):____________ 98. Don’t know

Public Awareness Campaign on Climate Change and Energy Efficiency Baseline and Follow-Up Surveys 8
Demographics Finally, I would like to ask you some questions about you and your household. All this information will only be used to help us analyse the results and will be kept in the strictest confidence.
27. Please indicate your gender. (Do not ask if known) 1. Female 2. Male
28. Would you mind telling me into which of the following categories your age falls?
1. 18 to 24 2. 25 to 34 3. 35 to 44 4. 45 to 54
5. 55 to 64 6. 65 or older 99 Refused
29. What is the highest level of schooling you have completed? (Do not read–accept one response only) 1. Less than high school 2. High school diploma 3. Some university/college/trade school 4. College/trade school diploma/certificate 5. Undergraduate degree
6. Graduate degree Other (please specify):__________ 98. Don’t know 99. Refused
30. What is your current marital status? (Do not read – accept one response only)
1. Single (never married) 2. Married 3. Separated 4. Divorced
5. Common law 6. Widowed 98. Don’t know 99. Refused
31. Do you have children under the age of 18 currently living at home?
1. Yes 2. No 9. Refused
32. Do you own your own home? 1. Yes 2. No 9. Refused
33. Is your total household income before taxes more or less than $60,000? 1. More Go to Q35 2. Less 9. Refused
34. Is it more or less than $30,000?
1. More Go to END 2. Less Go to END 9. Refused Go to END
35. Is it more or less than $90,000?
1. More 2. Less 9. Refused
This is the end of the survey. Thank you for your participation.

Public Awareness Campaign on Climate Change and Energy Efficiency Baseline and Follow-Up Surveys 9
3.0 Baseline Survey Results
Q1: Are you familiar with the term 'climate change'?
Total Region
St. John’s CMA Other NL Total Unweighted (N) 802 400 402 Yes 96% 97% 95% No 4% 3% 5%
Q2: When you think of climate change what comes to mind? SUBSET: Those who said 'Yes' to Q1.
Total Region
St. John’s CMA Other NL Total Unweighted (N) 772 389 383 Natural disasters (e.g. storms, floods, etc.) 11% 11% 11% Recycling 0% 0% 1% Composting 0% 0% 0% Greenhouse effect/Greenhouse gases 10% 12% 8% Global warming/Temperature rising 67% 70% 65% Polar ice melt/Icebergs 18% 21% 16% Wildlife/endangered species 3% 5% 3% Transportation - Hybrid or fuel efficient vehicles 0% 0% 0% Alternate transportation-public transportation,
walking, cycling 0% 0% 0%
Clean energy (e.g. Muskrat Falls, wind and solar energy) 0% 0% 0%
Environmental activist (e.g. David Suzuki) 0% 0% 0% Nothing in particular comes to mind 1% 0% 2% Haven't really thought about it 0% 0% 0% Weather patterns/seasons changing, climate,
currents 24% 23% 25%
Ozone issues 4% 5% 4% Pollution/Acid rain 5% 4% 5% Water levels rising/tides changing 2% 4% 2% Damage to fishery/agriculture issues 1% 1% 1% Environmental issues/changes 3% 4% 2% Not happening/natural phenomenon 2% 2% 3% Uncertain future 2% 2% 2% Government policy 1% 1% 0% Big industry 1% 1% 2% Miscellaneous mention 1% 1% 1% Other (Please Specify) 0% 0% 0% Don't know (VOL) 2% 1% 2%
Public Awareness Campaign on Climate Change and Energy Efficiency Baseline and Follow-Up Surveys 10
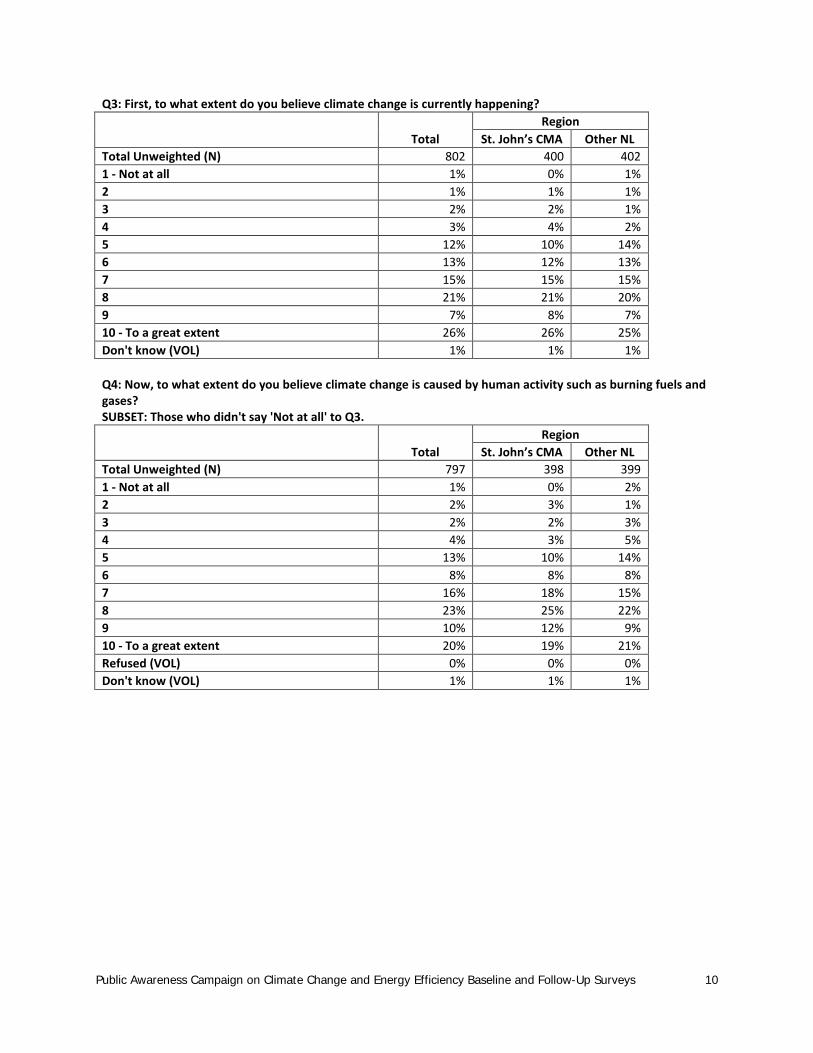
Q3: First, to what extent do you believe climate change is currently happening?
Total Region
St. John’s CMA Other NL Total Unweighted (N) 802 400 402 1 - Not at all 1% 0% 1% 2 1% 1% 1% 3 2% 2% 1% 4 3% 4% 2% 5 12% 10% 14% 6 13% 12% 13% 7 15% 15% 15% 8 21% 21% 20% 9 7% 8% 7% 10 - To a great extent 26% 26% 25% Don't know (VOL) 1% 1% 1%
Q4: Now, to what extent do you believe climate change is caused by human activity such as burning fuels and gases? SUBSET: Those who didn't say 'Not at all' to Q3.
Total Region
St. John’s CMA Other NL Total Unweighted (N) 797 398 399 1 - Not at all 1% 0% 2% 2 2% 3% 1% 3 2% 2% 3% 4 4% 3% 5% 5 13% 10% 14% 6 8% 8% 8% 7 16% 18% 15% 8 23% 25% 22% 9 10% 12% 9% 10 - To a great extent 20% 19% 21% Refused (VOL) 0% 0% 0% Don't know (VOL) 1% 1% 1%

Public Awareness Campaign on Climate Change and Energy Efficiency Baseline and Follow-Up Surveys 11
Q5: To what extent do you believe climate change is caused by natural factors such as changes in the sun's intensity and volcanic eruptions? SUBSET: Those who didn't say 'Not at all' to Q3.
Total Region
St. John’s CMA Other NL Total Unweighted (N) 797 398 399 1 - Not at all 4% 5% 4% 2 8% 10% 7% 3 10% 11% 9% 4 10% 12% 9% 5 22% 20% 23% 6 13% 12% 13% 7 13% 13% 13% 8 10% 10% 10% 9 3% 2% 3% 10 - To a great extent 5% 4% 5% Refused (VOL) 0% 0% 0% Don't know (VOL) 2% 1% 3%
Q6A: In your opinion, who should take action to help reduce the potential impacts of climate change? SUBSET: Those who didn't say 'Not at all' to Q3. -First mention-
Total Region
St. John’s CMA Other NL Total Unweighted (N) 797 398 399 Individuals/Households 34% 29% 37% Businesses 1% 1% 1% Government 39% 44% 37% Large industry (e.g. oil companies) 4% 4% 4% Everyone 14% 16% 13% No one 2% 2% 2% Scientists 0% 0% 0% NGO's 0% 0% 0% Refused (VOL) 0% 0% 0% Don't know (VOL) 5% 3% 6%

Public Awareness Campaign on Climate Change and Energy Efficiency Baseline and Follow-Up Surveys 12
Q6B: In your opinion, who should take action to help reduce the potential impacts of climate change? SUBSET: Those who didn't say 'Not at all' to Q3. -Other mentions-
Total Region
St. John’s CMA Other NL Total Unweighted (N) 761 387 374 Individuals/Households 30% 33% 28% Businesses 6% 8% 4% Government 33% 33% 34% Large industry (e.g. oil companies) 16% 19% 14% Everyone 5% 7% 4% No one 0% 0% 0% Scientists 3% 2% 3% NGO's 2% 2% 2% No other mentions (VOL) 23% 21% 24% Don't know (VOL) 1% 0% 2%
Q6: In your opinion, who should take action to help reduce the potential impacts of climate change? SUBSET: Those who didn't say 'Not at all' to Q3.-All mentions-
Total Region
St. John’s CMA Other NL Total Unweighted (N) 797 398 399 Individuals/Households 62% 61% 63% Businesses 6% 9% 5% Government 71% 76% 68% Large industry (e.g. oil companies) 19% 22% 17% Everyone 19% 23% 17% No one 2% 2% 2% Scientists 3% 2% 3% NGO's 2% 2% 2% Refused (VOL) 0% 0% 0% Don't know (VOL) 5% 3% 6%
Q7: How informed do you feel about the potential impacts of climate change on you as an individual?
Total Region
St. John’s CMA Other NL Total Unweighted (N) 802 400 402 1 - Not at all informed 3% 2% 4% 2 3% 2% 3% 3 8% 7% 8% 4 11% 12% 11% 5 22% 19% 23% 6 14% 17% 13% 7 17% 19% 16% 8 14% 15% 14% 9 3% 3% 3% 10 - Very informed 4% 4% 3% Don't know (VOL) 0% 0% 1%

Public Awareness Campaign on Climate Change and Energy Efficiency Baseline and Follow-Up Surveys 13
Q8: How relevant an issue do you feel climate change is to Newfoundland and Labrador?
Total Region
St. John’s CMA Other NL Total Unweighted (N) 802 400 402 1 - Not at all relevant 1% 1% 1% 2 1% 2% 1% 3 3% 4% 3% 4 4% 5% 3% 5 10% 9% 11% 6 12% 13% 11% 7 18% 19% 17% 8 22% 23% 22% 9 8% 6% 9% 10 - Very relevant 19% 18% 20% Don't know (VOL) 1% 0% 2%
Q9: Why do you feel this way? SUBSET: Those who gave a rating to Q8.
Total Region
St. John’s CMA Other NL Total Unweighted (N) 794 399 395 Climate change impacts society and people's ability
to plan for the future 8% 9% 7%
Many of our industries like oil and mining are GHG intensive 5% 7% 4%
Weather changes like more rain and resulting higher water levels impact community infrastructure 26% 25% 27%
Weather changes are having a positive impact/Warmer weather 8% 7% 9%
Weather changes will impact on tourism, recreation and way of life 8% 8% 8%
Need to protect air quality in the province 1% 2% 1% Changes in nature - wildlife and trees - will impact
on people 15% 12% 16%
Islands like Newfoundland will be particularly impacted 7% 7% 7%
No local impact but every province and country needs to play a role in climate change 14% 16% 12%
No/ limited impact locally 8% 11% 6% CC not an issue/other issues more relevant /cyclic 3% 4% 3% Lack of heavy industry/clean energy means we will
be impacted less 3% 4% 3%
Not enough information to comment 2% 3% 1% More education needed 1% 1% 1% Need more programs like recycling 1% 1% 1% Other 3% 2% 3% Refused (VOL) 0% 0% 0% Don't know (VOL) 9% 5% 11%

Public Awareness Campaign on Climate Change and Energy Efficiency Baseline and Follow-Up Surveys 14
Q10: What impact do you feel your everyday actions are having on climate change? Would you say your actions are having…
Total Region
St. John’s CMA Other NL Total Unweighted (N) 802 400 402 No impact 9% 8% 9% A little impact 47% 45% 48% A moderate impact 39% 41% 38% A strong impact 5% 6% 4% Refused (VOL) 0% 0% 0% Don't know (VOL) 1% 1% 1%
Q11: Please list all the things you do in your everyday life to help reduce your impact on climate change?
Total Region
St. John’s CMA Other NL Total Unweighted (N) 802 400 402 Recycling 58% 64% 54% Composting 11% 9% 12% Energy efficient lighting 4% 7% 3% Programmable thermostats 2% 2% 2% Energy star appliances 2% 3% 1% Energy star windows 1% 1% 1% Insulated basement 2% 3% 1% Insulated attic 2% 3% 2% Alternative transportation - Carpooling 9% 8% 10% Alternative transportation - Public transportation/Bus 2% 4% 1% Alternative transportation - Walking 16% 13% 18% Alternative transportation - Bicycling 2% 4% 2% Fuel efficient transportation (i.e. hybrid vehicle or fuel efficient
vehicles Fuel efficient vehicles would include all hybrid vehicles as well as smaller vehicles similar to a Ford Focus, Chevrolet Aveo, Honda Civic or Nissan Sentra that generally have 4 cylinder engines).
8% 11% 7%
Change driving habits 21% 27% 17% Change energy habits (Turn off lights, turn down thermostat) 23% 25% 21% Decrease use of chemicals 6% 5% 6% Don't drive 1% 1% 1% Conserve water 6% 8% 5% Reduce 8% 10% 6% Reuse 5% 3% 5% Organic/Locavore/produce my own 3% 3% 3% Wood heating 3% 1% 4% Quit/Don't smoke 1% 1% 1% Don't burn wood/paper etc 3% 2% 4% Stop littering 3% 3% 3% Political action/teach/green products 4% 3% 4% I don't do anything to help reduce my impact 10% 8% 12% Refused (VOL) 0% 0% 0% Don't know (VOL) 9% 6% 10%

Public Awareness Campaign on Climate Change and Energy Efficiency Baseline and Follow-Up Surveys 15
Q12: Do you recycle? SUBSET: Those who didn't say 'Recycling' to Q11.
Total Region
St. John’s CMA Other NL Total Unweighted (N) 335 145 190 Yes 90% 90% 89% No 10% 10% 11%
Q13: Do you compost? SUBSET: Those who didn't say 'Composting' to Q11.
Total Region
St. John’s CMA Other NL Total Unweighted (N) 715 363 352 Yes 30% 26% 32% No 70% 74% 68%
Q14: Do you drive a fuel efficient vehicle? SUBSET: Those who didn't say 'Fuel efficient transportation' to Q11.
Total Region
St. John’s CMA Other NL Total Unweighted (N) 730 354 376 Yes 50% 49% 51% No 46% 49% 45% Refused (VOL) 0% 0% 0% Don't know (VOL) 3% 2% 4%
Q15A: Do you use alternative transportation such as Carpooling? SUBSET: Those who didn't say 'Carpooling' to Q11.
Total Region
St. John’s CMA Other NL Total Unweighted (N) 742 374 368 Yes 28% 25% 30% No 71% 74% 68% Don't use alternative transportation (VOL) 0% 0% 0% Refused (VOL) 1% 0% 1%
Q15B: Do you use alternative transportation such as Walking? SUBSET: Those who didn't say 'Walking' to Q11.
Total Region
St. John’s CMA Other NL Total Unweighted (N) 674 347 327 Yes 57% 56% 58% No 42% 43% 42% Refused (VOL) 0% 0% 0%

Public Awareness Campaign on Climate Change and Energy Efficiency Baseline and Follow-Up Surveys 16
Q15C: Do you use alternative transportation such as Public transportation/Bus? SUBSET: Those who didn't say 'Public transportation/Bus' to Q11.
Total Region
St. John’s CMA Other NL Total Unweighted (N) 787 387 400 Yes 11% 16% 9% No 86% 82% 88% Don't use alternative transportation (VOL) 0% 0% 0% Refused (VOL) 2% 1% 2% Don't know (VOL) 0% 0% 0%
Q15D: Do you use alternative transportation such as Bicycling? SUBSET: Those who didn't say 'Bicycling' to Q11.
Total Region
St. John’s CMA Other NL Total Unweighted (N) 781 386 395 Yes 22% 18% 24% No 77% 80% 75% Don't use alternative transportation (VOL) 2% 2% 2% Refused (VOL) 0% 0% 0%

Public Awareness Campaign on Climate Change and Energy Efficiency Baseline and Follow-Up Surveys 17
Q16: Which of the following steps, if any, have you taken to improve the energy efficiency of your home:? SUBSET: Not asked if listed in Q11.
Total Region
St. John’s CMA Other NL Total Unweighted (N) 763 374 389
Do you use energy efficiency light bulbs?
Yes 91% 89% 93% No 8% 10% 7% Refused (VOL) 0% 0% 0% Don't know (VOL) 1% 1% 1%
Total Unweighted (N) 788 391 397
Do you have programmable thermostats? Yes 42% 46% 40% No 57% 53% 59% Don't know (VOL) 1% 1% 1%
Total Unweighted (N) 794 396 398
Do you have energy star windows? Yes 59% 56% 60% No 27% 27% 27% Don't know (VOL) 14% 17% 13%
Total Unweighted (N) 783 387 396
Do you have energy star appliances?
Yes 69% 71% 69% No 23% 21% 23% Refused (VOL) 0% 0% 0% Don't know (VOL) 8% 8% 8%
Total Unweighted (N) 785 388 397
Do you have your basement insulated?
Yes 76% 79% 75% No 16% 14% 17% Refused (VOL) 2% 2% 2% Don't know (VOL) 6% 5% 6%
Total Unweighted (N) 784 389 395
Do you have your attic insulated?
Yes 86% 82% 89% No 7% 8% 6% Refused (VOL) 1% 2% 0% Don't know (VOL) 6% 8% 5%
Public Awareness Campaign on Climate Change and Energy Efficiency Baseline and Follow-Up Surveys 18
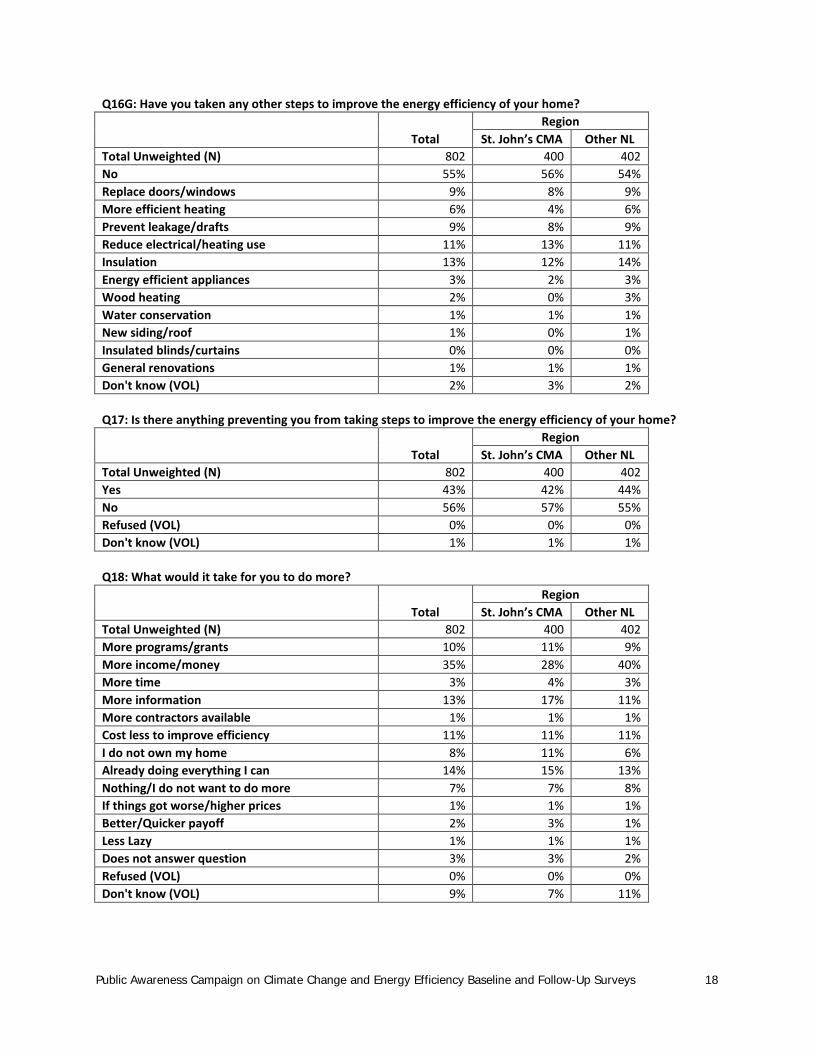
Q16G: Have you taken any other steps to improve the energy efficiency of your home?
Total Region
St. John’s CMA Other NL Total Unweighted (N) 802 400 402 No 55% 56% 54% Replace doors/windows 9% 8% 9% More efficient heating 6% 4% 6% Prevent leakage/drafts 9% 8% 9% Reduce electrical/heating use 11% 13% 11% Insulation 13% 12% 14% Energy efficient appliances 3% 2% 3% Wood heating 2% 0% 3% Water conservation 1% 1% 1% New siding/roof 1% 0% 1% Insulated blinds/curtains 0% 0% 0% General renovations 1% 1% 1% Don't know (VOL) 2% 3% 2%
Q17: Is there anything preventing you from taking steps to improve the energy efficiency of your home?
Total Region
St. John’s CMA Other NL Total Unweighted (N) 802 400 402 Yes 43% 42% 44% No 56% 57% 55% Refused (VOL) 0% 0% 0% Don't know (VOL) 1% 1% 1%
Q18: What would it take for you to do more?
Total Region
St. John’s CMA Other NL Total Unweighted (N) 802 400 402 More programs/grants 10% 11% 9% More income/money 35% 28% 40% More time 3% 4% 3% More information 13% 17% 11% More contractors available 1% 1% 1% Cost less to improve efficiency 11% 11% 11% I do not own my home 8% 11% 6% Already doing everything I can 14% 15% 13% Nothing/I do not want to do more 7% 7% 8% If things got worse/higher prices 1% 1% 1% Better/Quicker payoff 2% 3% 1% Less Lazy 1% 1% 1% Does not answer question 3% 3% 2% Refused (VOL) 0% 0% 0% Don't know (VOL) 9% 7% 11%

Public Awareness Campaign on Climate Change and Energy Efficiency Baseline and Follow-Up Surveys 19
Q19a: Are you aware of any provincial government departments or agencies that are working toward reducing climate change or increasing energy efficiency?
Total Region
St. John’s CMA Other NL Total Unweighted (N) 802 400 402 Yes 31% 35% 29% No 67% 63% 69% Don't know (VOL) 2% 2% 2%
Q19B: What departments and/or agencies are you aware of? SUBSET: Those who said 'Yes' to Q19A.
Total Region
St. John’s CMA Other NL Total Unweighted (N) 259 141 118 Department of Environment and Conservation 12% 21% 7% Department of Fisheries and Aquaculture 1% 2% 1% Department of Natural Resources 8% 12% 5% Department of Transportation and Works
(Public Works) 1% 3% 0%
Forestry and Agrifoods Agency 0% 1% 0% Newfoundland and Labrador Housing
Corporation 7% 5% 9%
Newfoundland and Labrador Hydro 17% 16% 19% Office of Climate Change, Energy Efficiency and
Emissions Trading 1% 3% 0%
Service Newfoundland and Labrador (previously Department of Government Services) 1% 2% 0%
Newfoundland Power 17% 8% 23% MMSB/Green depot 5% 6% 4% Utilities - general 3% 4% 3% Rebates/Grants? 8% 8% 7% Municipal government - general 2% 2% 1% Provincial government - general 2% 2% 2% Federal government - general 3% 3% 3% Government - general 2% 1% 3% NGO's 2% 2% 1% Don't know (VOL) 26% 28% 25%
Q20: Are you aware the provincial government has increased energy efficiency standards for new and existing government buildings?
Total Region
St. John’s CMA Other NL Total Unweighted (N) 802 400 402 Yes 27% 25% 28% No 70% 73% 69% Don't know (VOL) 3% 2% 3%

Public Awareness Campaign on Climate Change and Energy Efficiency Baseline and Follow-Up Surveys 20
Q21: Are you aware the provincial government is purchasing hybrid vehicles?
Total Region
St. John’s CMA Other NL Total Unweighted (N) 802 400 402 Yes 23% 23% 23% No 76% 75% 76% Don't know (VOL) 2% 2% 1%
Q22 Are you aware of any provincial government programs or services targeted toward climate change or energy efficiency?
Total Region
St. John’s CMA Other NL Total Unweighted (N) 802 400 402 Yes- Get to half 1% 1% 1% Yes - Take Charge 2% 2% 2% Yes - energy efficiency home retrofit grant
programs (e.g. EnerGuide - Natural Resources, REEP for Low Income - Newfoundland and Labrador Housing Corporation)
9% 9% 8%
No 79% 75% 80% Recycling 2% 2% 2% Muskrat Falls 2% 2% 1% Yes- Don't know name 3% 4% 3% Yes - rebate/grant programs (general) 1% 2% 0% Don't know (VOL) 4% 4% 4%
Q23: Are you aware of the Get to half campaign by MMSB which aims to reduce the amount of waste produced at home, schools and wok? SUBSET: Those who didn't mention it in Q22.
Total Region
St. John’s CMA Other NL Total Unweighted (N) 795 397 398 Yes 61% 73% 55% No 38% 27% 45% Don't know (VOL) 0% 0% 1%
Q24: Are you aware of the Take Charge program by Newfoundland and Labrador Hydro and Newfoundland Power? SUBSET: Those who didn't mention it in Q22.
Total Region
St. John’s CMA Other NL Total Unweighted (N) 787 390 397 Yes 70% 75% 66% No 29% 24% 31% Don't know (VOL) 2% 0% 2%

Public Awareness Campaign on Climate Change and Energy Efficiency Baseline and Follow-Up Surveys 21
Q25: Where would you send someone for information on climate change or energy efficiency?
Total Region
St. John’s CMA Other NL Total Unweighted (N) 802 400 402 Government website 15% 17% 15% Internet website (non-government) 47% 50% 45% Government department 22% 24% 21% School/teacher 1% 2% 1% Friend 1% 0% 1% Utilities (e.g. Newfoundland Power) 13% 14% 12% MMSB 2% 3% 1% Library 1% 2% 1% Media 1% 1% 1% Government member 0% 0% 0% Phonebook 1% 1% 1% NGO's 1% 1% 1% Business 1% 1% 0% Municipal Government 1% 1% 1% Nalcor 0% 0% 0% Foreign government 0% 0% 0% Refused (VOL) 0% 0% 1% Don't know (VOL) 20% 15% 23%
Q26: Now, in your opinion, who should take action to help reduce the potential impacts of climate change? -First mention-
Total Region
St. John’s CMA Other NL Total Unweighted (N) 802 400 402 Individuals/Households 38% 35% 40% Businesses 1% 2% 0% Government 40% 41% 39% Large industry (e.g. oil companies) 2% 2% 2% Everyone 14% 16% 13% No one 1% 1% 1% Scientists 0% 1% 0% Refused (VOL) 0% 0% 0% Don't know (VOL) 3% 2% 3%

Public Awareness Campaign on Climate Change and Energy Efficiency Baseline and Follow-Up Surveys 22
Q26: Now, in your opinion, who should take action to help reduce the potential impacts of climate change? -Other mentions- SUBSET: Those who didn't say 'Dont' know' to Q29 (first mention).
Total Region
St. John’s CMA Other NL Total Unweighted (N) 781 392 389 Individuals/Households 26% 28% 24% Businesses 8% 11% 7% Government 37% 36% 38% Large industry (e.g. oil companies) 13% 18% 10% Everyone 3% 3% 2% Scientists 0% 0% 0% No other mentions (VOL) 28% 26% 30% NGO's 2% 1% 2% Schools/Education 1% 2% 1% Other 0% 0% 0% Don't know (VOL) 1% 1% 1%
Q27: Please indicate your gender?
Total Region
St. John’s CMA Other NL Total Unweighted (N) 802 400 402 Male 46% 47% 45% Female 54% 53% 55%
Q28: Would you mind telling me into which of the following categories your age falls?
Total Region
St. John’s CMA Other NL Total Unweighted (N) 802 400 402 18 to 24 6% 8% 5% 25 to 34 19% 23% 17% 35 to 44 19% 20% 19% 45 to 54 21% 20% 22% 55 to 64 17% 15% 18% 65 or older 17% 14% 19%
Q29: What is the highest level of schooling you have completed?
Total Region
St. John’s CMA Other NL Total Unweighted (N) 802 400 402 Less than high school 11% 5% 14% High school diploma 19% 12% 22% Some university/college/trade school 11% 15% 8% College/trade school diploma/certificate 34% 29% 37% Undergraduate degree 16% 21% 13% Graduate degree 9% 17% 5% Refused (VOL) 1% 1% 1%

Public Awareness Campaign on Climate Change and Energy Efficiency Baseline and Follow-Up Surveys 23
Q30: What is your current marital status?
Total Region
St. John’s CMA Other NL Total Unweighted (N) 802 400 402 Single (never married) 20% 24% 18% Married 60% 60% 60% Separated 2% 1% 2% Divorced 5% 5% 4% Common law 8% 6% 9% Widowed 5% 3% 6% Refused (VOL) 1% 2% 1%
Q31: Do you have children under the age of 18 currently living at home?
Total Region
St. John’s CMA Other NL Total Unweighted (N) 802 400 402 Yes 35% 40% 32% No 65% 60% 67% Refused (VOL) 0% 1% 0%
Q32: Do you own your own home?
Total Region
St. John’s CMA Other NL Total Unweighted (N) 802 400 402 Yes 79% 75% 82% No 20% 24% 18% Refused (VOL) 0% 1% 0%
Q33-35 Income
Total Region
St. John’s CMA Other NL Total Unweighted (N) 802 400 402 less than $30K 16% 10% 20% $30K-$59K 26% 18% 30% $60K-$89K 20% 20% 20% $90K or more 28% 41% 20% Unknown 10% 11% 10%

Public Awareness Campaign on Climate Change and Energy Efficiency Baseline and Follow-Up Surveys 24
4.0 Follow-Up Survey
CONFIDENTIAL WHEN COMPLETED Collected under the Authority of the
Statistics Agency Act, RSNL1990, c.S-24
Newfoundland and Labrador Statistics Agency
www.stats.gov.nl.ca OFFICE OF CLIMATE CHANGE AND ENERGY EFFICIENCY
PUBLIC AWARENESS CAMPAIGN SURVEY 2014 PURPOSE
The Office of Climate Change and Energy Efficiency (CCEE), in partnership with the Newfoundland and Labrador Statistics Agency (NLSA), is conducting a survey to gauge public awareness and understanding of climate change and energy efficiency. The survey will help determine what actions, if any, residents of the province are taking in relation to this topic. The information collected will be used to raise public awareness around the issue and encourage public participation in related government initiatives and programs.
CONFIDENTIALITY
Although participation is voluntary, your co-operation is important to ensure that the information collected is as accurate and as comprehensive as possible. The survey will only take 10-15 minutes to complete, and your answers will be treated in strict confidence, used for statistical purposes and published in aggregate form only as required by the Statistics Agency Act. Would you like to participate? (Interviewer, if yes, continue. If no, thank respondent and end survey.)
If you have any questions concerning privacy or confidentiality, you can contact the Newfoundland and Labrador Statistics Agency at 729-1604 in the greater St. John’s area or call toll-free at 1-888-461-5244. Questions related to the survey’s purpose and/or its content should be directed to Patricia King ([email protected], 729-1485) at the Office of Climate Change and Energy Efficiency.
SECTION A – GAUGING PUBLIC AWARENESS AND UNDERSTANDING
AR1. In this first section, we will look at your awareness and understanding of climate change.
A1. Are you familiar with the term “climate change”?
1○ Yes 2○ No Read definition of climate change and go to A3 8○ Don’t know Read definition of climate change and go to A3 9○ Prefer not to say Read definition of climate change and go to A3
AR2. Climate change refers to changes in the environment around the world due to rises in global temperatures as a result of increased greenhouse gas emissions (for example, carbon dioxide released from burning fuel to run our vehicles).
Public Awareness Campaign on Climate Change and Energy Efficiency Baseline and Follow-Up Surveys 25
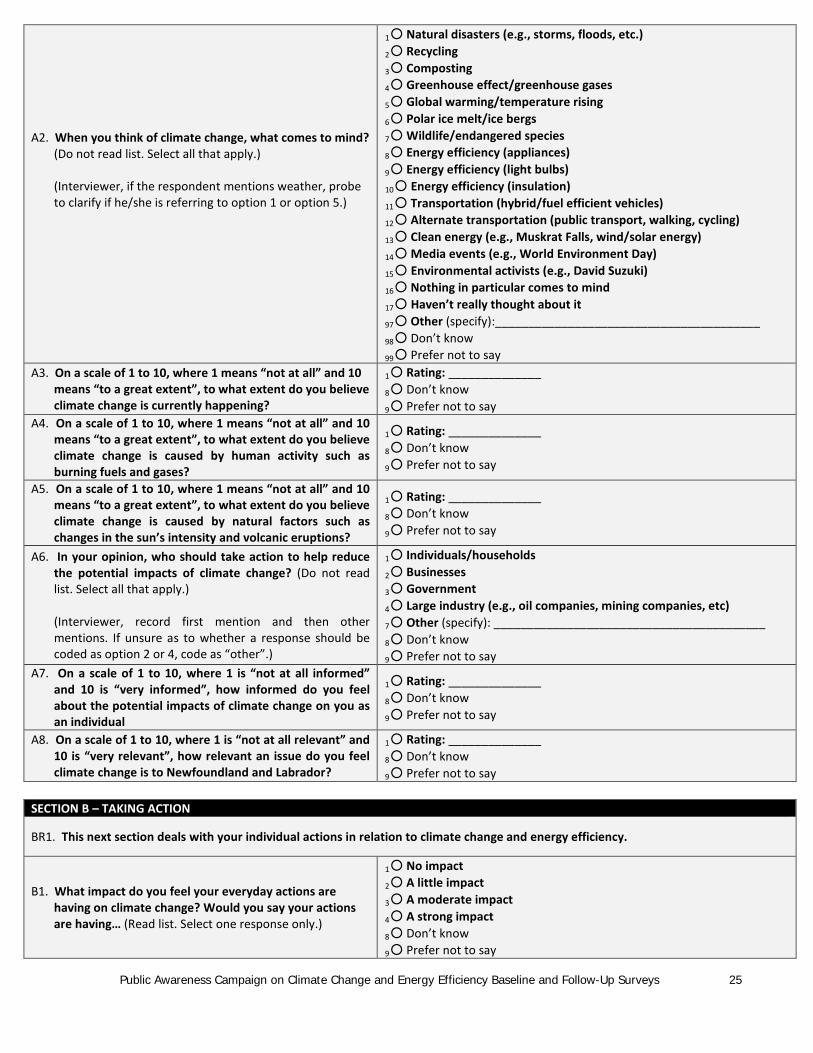
A2. When you think of climate change, what comes to mind? (Do not read list. Select all that apply.)
(Interviewer, if the respondent mentions weather, probe to clarify if he/she is referring to option 1 or option 5.)
1○ Natural disasters (e.g., storms, floods, etc.) 2○ Recycling 3○ Composting 4○ Greenhouse effect/greenhouse gases 5○ Global warming/temperature rising 6○ Polar ice melt/ice bergs 7○ Wildlife/endangered species 8○ Energy efficiency (appliances) 9○ Energy efficiency (light bulbs) 10○ Energy efficiency (insulation) 11○ Transportation (hybrid/fuel efficient vehicles) 12○ Alternate transportation (public transport, walking, cycling) 13○ Clean energy (e.g., Muskrat Falls, wind/solar energy) 14○ Media events (e.g., World Environment Day) 15○ Environmental activists (e.g., David Suzuki) 16○ Nothing in particular comes to mind 17○ Haven’t really thought about it 97○ Other (specify):________________________________________ 98○ Don’t know 99○ Prefer not to say
A3. On a scale of 1 to 10, where 1 means “not at all” and 10 means “to a great extent”, to what extent do you believe climate change is currently happening?
1○ Rating: ______________ 8○ Don’t know 9○ Prefer not to say
A4. On a scale of 1 to 10, where 1 means “not at all” and 10 means “to a great extent”, to what extent do you believe climate change is caused by human activity such as burning fuels and gases?
1○ Rating: ______________ 8○ Don’t know 9○ Prefer not to say
A5. On a scale of 1 to 10, where 1 means “not at all” and 10 means “to a great extent”, to what extent do you believe climate change is caused by natural factors such as changes in the sun’s intensity and volcanic eruptions?
1○ Rating: ______________ 8○ Don’t know 9○ Prefer not to say
A6. In your opinion, who should take action to help reduce the potential impacts of climate change? (Do not read list. Select all that apply.)
(Interviewer, record first mention and then other mentions. If unsure as to whether a response should be coded as option 2 or 4, code as “other”.)
1○ Individuals/households 2○ Businesses 3○ Government 4○ Large industry (e.g., oil companies, mining companies, etc) 7○ Other (specify): _________________________________________ 8○ Don’t know 9○ Prefer not to say
A7. On a scale of 1 to 10, where 1 is “not at all informed” and 10 is “very informed”, how informed do you feel about the potential impacts of climate change on you as an individual
1○ Rating: ______________ 8○ Don’t know 9○ Prefer not to say
A8. On a scale of 1 to 10, where 1 is “not at all relevant” and 10 is “very relevant”, how relevant an issue do you feel climate change is to Newfoundland and Labrador?
1○ Rating: ______________ 8○ Don’t know 9○ Prefer not to say
SECTION B – TAKING ACTION
BR1. This next section deals with your individual actions in relation to climate change and energy efficiency.
B1. What impact do you feel your everyday actions are having on climate change? Would you say your actions are having… (Read list. Select one response only.)
1○ No impact 2○ A little impact 3○ A moderate impact 4○ A strong impact 8○ Don’t know 9○ Prefer not to say

Public Awareness Campaign on Climate Change and Energy Efficiency Baseline and Follow-Up Surveys 26
B2. Please list all the things you do in your everyday life to
help reduce your impact on climate change. (Do not read list. Select all that apply.) 13○ Fuel efficient transportation would include all
hybrid vehicles as well as smaller vehicles similar to a Ford Focus, Chevrolet Aveo, Honda Civic or Nissan Sentra that generally have 4 cylinder engines.
1○ Recycling 2○ Composting 3○ Energy efficient lighting 4○ Programmable thermostats 5○ Energy star appliances 6○ Energy star windows 7○ Insulated basement 8○ Insulated attic 9○ Alternative transportation (carpooling) 10○ Alternative transportation (public transportation/bus) 11○ Alternative transportation (walking) 12○ Alternative transportation (bicycling) 13○ Fuel efficient transportation (i.e., hybrid or fuel efficient vehicle) 97○ Other (specify): ________________________________________ 14○ I don’t do anything to help reduce my impact 98○ Don’t know 99○ Prefer not to say
B3. Do you recycle? (Do not ask if B2=1)
1○ Yes 2○ No 8○ Don’t know 9○ Prefer not to say
B4. Do you compost? (Do not ask if B2=2)
1○ Yes 2○ No 8○ Don’t know 9○ Prefer not to say
B5. Do you drive a fuel efficient vehicle? (Do not ask if B2=13) Fuel efficient vehicles would include all hybrid vehicles as well as smaller vehicles similar to a Ford Focus, Chevrolet Aveo, Honda Civic or Nissan Sentra that generally have 4 cylinder engines.
1○ Yes 2○ No 3○ Do not own a vehicle 8○ Don’t know 9○ Prefer not to say
B6. Which of the following steps, if any, have you taken to improve the energy efficiency of your home?
B6A. Do you use energy efficient light bulbs? (Do not ask if B2=3)
1○ Yes 2○ No 8○ Don’t know 9○ Prefer not to say
B6B. Do you have programmable thermostats? (Do not ask if B2=4)
1○ Yes 2○ No 8○ Don’t know 9○ Prefer not to say
B6C. Do you have energy star appliances? (Do not ask if B2=5)
1○ Yes 2○ No 8○ Don’t know 9○ Prefer not to say
B6D. Do you have energy star windows? (Do not ask if B2=6)
1○ Yes 2○ No 8○ Don’t know 9○ Prefer not to say
CONTINUE TO B2

Public Awareness Campaign on Climate Change and Energy Efficiency Baseline and Follow-Up Surveys 27
B6E. Do you have your basement insulated? (Do not ask if B2=7)
1○ Yes 2○ No 3○ Do not have a basement
8○ Don’t know 9○ Prefer not to say
B6F. Do you have your attic insulated? (Do not ask if B2=8)
1○ Yes 2○ No 3○ Do not have an attic
8○ Don’t know 9○ Prefer not to say
B6G. Have you taken any other steps to improve the energy efficiency of your home?
1○ Yes (specify): _________________________________________ 2○ No 8○ Don’t know 9○ Prefer not to say
B7. Is there anything preventing you from taking steps to improve the energy efficiency of your home?
1○ Yes 2○ No 8○ Don’t know 9○ Prefer not to say
B8. What would it take for you to do more to improve the energy efficiency of your home? (Do not read list. Select all that apply.) (Interviewer, if the respondent says “more money”, probe to determine if he/she is referring to grants from outside sources – option 1, or an increase in personal income – option 2.)
1○ More programs/grants 2○ More income 3○ More time 4○ More information 5○ More contractors available 6○ If the cost to improve efficiency was less 7○ I do not own my home 8○ Already doing everything I can 97○ Other (specify): _______________________________________ 9○ Nothing/I do not want to do more 98○ Don’t know 99○ Prefer not to say
SECTION C – KNOWLEDGE OF CLIMATE CHANGE AND ENERGY EFFICIENCY RELATED PROGRAMS AND SERVICES CR1. Next we will examine your level of awareness with information sources as well as with government programs and services
related to climate change and energy efficiency.
C1. If you were to receive information on climate change and energy efficiency, which of the following sources would you trust the most? (Read list. Select one response only.)
1○ Community groups 2○ Private companies 3○ Municipal government 4○ Provincial government 5○ Federal government
7○ Other (specify): ________________ 6○ Wouldn’t trust any sources Go to C3
8○ Don’t know Go to C3 9○ Prefer not to say Go to C3
C2. What other sources would you trust? (Read list excluding first choice above. Select all that apply.)
1○ Community groups 2○ Private companies 3○ Municipal government 4○ Provincial government 5○ Federal government 7○ Other (specify): _______________________________________ 6○ No others 8○ Don’t know 9○ Prefer not to say
C3. Are you aware of any provincial government departments or agencies that are working toward reducing climate change or increasing energy efficiency?
1○ Yes 2○ No Go to C5 8○ Don’t know Go to C5 9○ Prefer not to say Go to C5

Public Awareness Campaign on Climate Change and Energy Efficiency Baseline and Follow-Up Surveys 28
C4. What provincial government departments and/or agencies are you aware of? (Do not read list. Select all that apply.)
1○ Department of Environment and Conservation 2○ Department of Fisheries and Aquaculture 3○ Department of Municipal Affairs 4○ Department of Natural Resources 5○ Department of Transportation and Works (Public Works) 6○ Forestry and Agrifoods Agency 7○ Newfoundland and Labrador Housing Corporation 8○ Newfoundland and Labrador Hydro 9○ Office of Climate Change, Energy Efficiency and Emissions Trading 10○ Service Newfoundland and Labrador (previously Department of Government Services)
11○ Newfoundland Power 97○ Other (specify): _______________________________________ 98○ Don’t know 99○ Prefer not to say
C5. Are you aware of any provincial government programs, services or initiatives targeted towards climate change or energy efficiency?
1○ Yes 2○ No Go to C7 8○ Don’t know Go to C7 9○ Prefer not to say Go to C7
C6. What provincial government programs, services or initiatives are you aware of? (Do not read list. Select all that apply.)
1○ Turn Back the Tide 2○ Get to Half 3○ Take Charge 4○ Muskrat Falls 5○ Hybrid Vehicles 6○ Energy efficient standards for government buildings 7○ Energy efficient home retrofit grant programs
(e.g., EnerGuide – Natural Resources, REEP for Low Income – Newfoundland and Labrador Housing)
97○ Other (specify): _______________________________________ 98○ Don’t know 99○ Prefer not to say
C7. Are you aware the provincial government has increased energy efficiency standards for new and existing government buildings? (Do not ask if C6=6.)
1○ Yes 2○ No 8○ Don’t know 9○ Prefer not to say
C8. Are you aware the provincial government is purchasing hybrid vehicles? (Do not ask if C6=5.)
1○ Yes 2○ No 8○ Don’t know 9○ Prefer not to say
C9. Are you aware of the Get to half campaign by the MMSB which aims to reduce the amount of waste produced at homes, school and work? (Do not ask if C6=2.)
1○ Yes 2○ No 8○ Don’t know 9○ Prefer not to say
C10. Are you aware of the Take Charge program by Newfoundland and Labrador Hydro and Newfoundland Power which provides information and funding towards making energy efficient improvements in your home or business? (Do not ask if C6=3.)
1○ Yes 2○ No 8○ Don’t know 9○ Prefer not to say

Public Awareness Campaign on Climate Change and Energy Efficiency Baseline and Follow-Up Surveys 29
SECTION D – PUBLIC AWARENESS WITH TURN BACK THE TIDE CAMPAIGN MATERIALS
DR1. The next series of questions focus on the provincial government’s Turn Back the Tide campaign. D1. Are you aware of the Turn Back the Tide campaign by
the provincial government which provides information to raise awareness on climate change and energy efficiency?
1○ Yes 2○ No Go to D3 8○ Don’t know Go to D3 9○ Prefer not to say Go to D3
D2. Through which types of media did you become familiar with the Turn Back the Tide campaign? (Do not read list. Select all that apply.)
1○ Television 2○ Posters 3○ Brochures 4○ Online ads/commercials 5○ Turn Back the Tide website 6○ Newspapers 7○ St. John’s Ice Caps promotions 8○ Turn Back the Tide Facebook page 97○ Other (specify): _______________________________________ 98○ Don’t know 99○ Prefer not to say
D3. Do you recall seeing the Turn Back the Tide advertisements on TV or online? (Do not ask if D2 = 1 OR 4.) (Interviewer, if respondent is unsure, prompt with “these are the black and white advertisements with people talking about climate change and energy efficiency.”)
1○ Yes 2○ No Go to D5 8○ Don’t know Go to D5 9○ Prefer not to say Go to D5
D4. What can you recall about the TV or online advertisements? (Do not read list. Select all that apply.)
1○ Slogan – Turn Back the Tide 2○ “I can make a difference” 3○ Water images (i.e., images of the ocean) 4○ Flooding 5○ Storm images 6○ Local actors 7○ Local images (e.g., people walking in downtown St. John’s) 8○ Individual actions – tips on how to reduce energy/waste 9○ Muskrat Falls 10○ Government leading the public 97○ Other (specify): _______________________________________ 11○ Nothing 98○ Don’t know 99○ Prefer not to say
D5. Have you visited the website TurnBacktheTide.ca? (Do not ask if D2 = 5.)
1○ Yes 2○ No If D2 = 1 or 4 OR D3 = 1, go to D7.
Else go to D9B 8○ Don’t know If D2 = 1 or 4 OR D3 = 1, go to D7.
Else go to D9B 9○ Prefer not to say If D2 = 1 or 4 OR D3 = 1, go to D7.
Else go to D9B
D6. What can you recall about the Turn Back the Tide website? (Do not read list. Select all that apply.)
1○ Slogan – Turn Back the Tide 2○ Visual appeal (colourful, local
images, etc.) 3○ Carbon calculator 4○ Interactive house 5○ What’s new page/articles 6○ Good information (general) 7○ Information for homeowners 8○ Information for businesses
9○ Information for your community
10○ Information on transportation 11○ Information on government
action 12○ Contests 97○ Other (specify): ____________ 13○ Nothing 98○ Don’t know 99○ Prefer not to say

Public Awareness Campaign on Climate Change and Energy Efficiency Baseline and Follow-Up Surveys 30
D7. (Only ask if D2 = 1, 4 OR 5 or D3 OR D5= 1)
Thinking of these different elements in the TV ads, online ads and website, have you changed your behavior as a result of information you have obtained from the Turn Back the Tide campaign?
1○ Yes 2○ No Go to D9A 8○ Don’t know Go to D9A 9○ Prefer not to say Go to D9A
D8. Which behaviours have you changed? (Do not read list. Select all that apply.) 13○ Fuel efficient transportation would include all
hybrid vehicles as well as smaller vehicles similar to a Ford Focus, Chevrolet Aveo, Honda Civic or Nissan Sentra that generally have 4 cylinder engines.
1○ Recycling 2○ Composting 3○ Energy efficient lighting 4○ Programmable thermostats 5○ Energy star appliances 6○ Energy star windows 7○ Insulated basement 8○ Insulated attic 9○ Alternative transportation (carpooling) 10○ Alternative transportation (public transportation/bus) 11○ Alternative transportation (walking) 12○ Alternative transportation (bicycling) 13○ Fuel efficient transportation (i.e., hybrid or fuel efficient vehicle) 97○ Other (specify): __________________________________________ 98○ Don’t know 99○ Prefer not to say
D9A. If D1, D3 OR D5 = 1 ask : Have you changed your behavior as a result of other information you have obtained on climate change and energy efficiency besides the Turn Back the Tide Campaign?
D9B. If D1, D3 AND D5 is NOT 1 ask : Have you changed your behavior as a result of information you have obtained on climate change and energy efficiency?
1○ Yes 2○ No Go to Section E 8○ Don’t know Go to Section E 9○ Prefer not to say Go to Section E
D10. Which behaviours have you changed? (Do not read list. Select all that apply.)
13○ Fuel efficient transportation would include all
hybrid vehicles as well as smaller vehicles similar to a Ford Focus, Chevrolet Aveo, Honda Civic or Nissan Sentra that generally have 4 cylinder engines.
1○ Recycling 2○ Composting 3○ Energy efficient lighting 4○ Programmable thermostats 5○ Energy star appliances 6○ Energy star windows 7○ Insulated basement 8○ Insulated attic 9○ Alternative transportation (carpooling) 10○ Alternative transportation (public transportation/bus) 11○ Alternative transportation (walking) 12○ Alternative transportation (bicycling) 13○ Fuel efficient transportation (i.e., hybrid or fuel efficient vehicle) 97○ Other (specify): __________________________________________ 98○ Don’t know 99○ Prefer not to say
SECTION E – DEMOGRAPHICS ER1. The final few questions are for research and statistical purposes only. Please be assured that all responses will be kept strictly
confidential.
E1. Please indicate your gender. 1○ Female 2○ Male 3○ Other
8○ Don’t know 9○ Prefer not to say
Public Awareness Campaign on Climate Change and Energy Efficiency Baseline and Follow-Up Surveys 31
E2. Which of the following categories best describes your age? (Read list. Select one response only.)
1○ 18 to 24 2○ 25 to 34 3○ 35 to 44 4○ 45 to 54
5○ 55 to 64 6○ 65 or older 8○ Don’t know 9○ Prefer not to say
E3. What is the highest level of education you have completed? (Do not read list. Select one response only.)
1○ Less than high school diploma 2○ High school diploma/High school equivalency (ABE/GED) 3○ Some university/college/trade school 4○ College/trade school diploma/certificate 5○ Undergraduate/bachelors degree (BA, BSc, BEng, etc.) 6○ Graduate/masters degree (MA, MSc, MEng, etc.) 7○ Other (specify): __________________________________________ 8○ Don’t know 9○ Prefer not to say
E4. What is your current marital status? (Do not read list. Select one response only.)
1○ Single (never married) 2○ Married 3○ Separated 4○ Divorced
5○ Common law 6○ Widowed 8○ Don’t know 9○ Prefer not to say
E5. Do you have children under the age of 18 currently living at home?
1○ Yes 2○ No 8○ Don’t know 9○ Prefer not to say
E6. Do you own your own home?
1○ Yes 2○ No 8○ Don’t know 9○ Prefer not to say
E7. Which of the following best describes your total household income before taxes and deductions in 2013? (Read list. Select one response only.) Total household income is the sum of the incomes of all permanent members of your household in 2013.
1○ Less than $30,000 2○ $30,000 to less than $60,000 3○ $60,000 to less than $90,000 4○ $90,000 or more 8○ Don’t know 9○ Prefer not to say
SECTION F – RESPONDENT FEEDBACK F1. Please provide any comments you may have related to
this survey or its content.
________________________________________________________
Thank you for your participation.
Please remember that all responses are kept strictly confidential
Newfoundland and Labrador Statistics Agency Office of Climate Change and Energy Efficiency www.stats.gov.nl.ca www.exec.gov.nl.ca/exec/cceeet/

Public Awareness Campaign on Climate Change and Energy Efficiency Baseline and Follow-Up Surveys 32
5.0 Follow-Up Survey Results
SECTION A – GAUGING PUBLIC AWARENESS AND UNDERSTANDING
A1. Are you familiar with the term 'climate change'?
St. John's CMA
Outside St. John's CMA Total
Count % Count % Count % Yes 464 95.1% 389 87.4% 853 91.4% No - Read definition of climate change 23 4.7% 52 11.7% 75 8.0% Don't know - Read definition of climate change ∙∙∙ ∙∙∙ ∙∙∙ ∙∙∙ 5 .5% Total 488 100.0% 445 100.0% 933 100.0%
A2. When you think of climate change, what comes to mind? SELECT ALL THAT APPLY
St. John's CMA
Outside St. John's CMA Total
N % N % N % Natural disasters (e.g., storms, floods, etc.) 119 25.6% 121 31.1% 240 28.1% Recycling ∙∙∙ ∙∙∙ ∙∙∙ ∙∙∙ ∙∙∙ ∙∙∙ Greenhouse effect/greenhouse gases 66 14.2% 37 9.5% 103 12.1% Global warming/temperature rising 277 59.7% 248 63.8% 525 61.5% Polar ice melt/ice bergs 82 17.7% 64 16.5% 146 17.1% Wildlife/endangered species 6 1.3% 7 1.8% 13 1.5% Energy efficiency (appliances) ∙∙∙ ∙∙∙ ∙∙∙ ∙∙∙ ∙∙∙ ∙∙∙ Energy efficiency (light bulbs) ∙∙∙ ∙∙∙ ∙∙∙ ∙∙∙ ∙∙∙ ∙∙∙ Energy efficiency (insulation) ∙∙∙ ∙∙∙ ∙∙∙ ∙∙∙ 5 .6% Transportation (hybrid/fuel efficient vehicles) ∙∙∙ ∙∙∙ ∙∙∙ ∙∙∙ ∙∙∙ ∙∙∙ Alternate transportation (public transport, walking, cycling)
∙∙∙ ∙∙∙ ∙∙∙ ∙∙∙ ∙∙∙ ∙∙∙
Clean energy (e.g., Muskrat Falls, wind/solar energy)
∙∙∙ ∙∙∙ ∙∙∙ ∙∙∙ 5 .6%
Media events (e.g., World Environment Day) 5 1.1% ∙∙∙ ∙∙∙ 5 .6% Environmental activists (e.g., David Suzuki) ∙∙∙ ∙∙∙ ∙∙∙ ∙∙∙ ∙∙∙ ∙∙∙ Nothing in particular comes to mind 7 1.5% 11 2.8% 18 2.1% Other (specify): 155 33.4% 100 25.7% 255 29.9% Don’t know 6 1.3% 6 1.5% 12 1.4% Totals may exceed 100% due to multiple responses. Final Results Compiled by the NLSA on 5/1/2014 [SUBSET: Respondents that are familiar with the term 'climate change'.]

Public Awareness Campaign on Climate Change and Energy Efficiency Baseline and Follow-Up Surveys 33
A2. (Other) When you think of climate change, what comes to mind? SELECT ALL THAT APPLY
St. John's CMA
Outside St. John's CMA Total
N % N % N % Changing weather patterns (weather atypical of season, changes in season length, increased snow/rain/winds, etc.)
97 62.6% 72 72.0% 169 66.3%
Depletion of the ozone layer 11 7.1% 5 5.0% 16 6.3% Pollution (air, water, land) 16 10.3% 6 6.0% 22 8.6% Rising ocean temperatures ∙∙∙ ∙∙∙ ∙∙∙ ∙∙∙ 5 2.0% Rising sea levels ∙∙∙ ∙∙∙ ∙∙∙ ∙∙∙ ∙∙∙ ∙∙∙ Economic costs (higher heat bills, higher costs for goods and services, etc.)
∙∙∙ ∙∙∙ ∙∙∙ ∙∙∙ 7 2.7%
Energy use/need for energy conservation ∙∙∙ ∙∙∙ ∙∙∙ ∙∙∙ 10 3.9% Climate change is a cyclical, natural phenomenon (not cause by human action)
∙∙∙ ∙∙∙ ∙∙∙ ∙∙∙ 11 4.3%
Other 22 14.2% 10 10.0% 32 12.5% Totals may exceed 100% due to multiple responses. Final Results Compiled by the NLSA on 5/1/2014
A3. On a scale of 1 to 10, where 1 means 'not at all' and 10 means 'to a great extent', to what extent do you believe climate change is currently happening?
St. John's CMA
Outside St. John's CMA Total
Count % Count % Count % 1 ∙∙∙ ∙∙∙ ∙∙∙ ∙∙∙ 14 1.5% 2 ∙∙∙ ∙∙∙ ∙∙∙ ∙∙∙ 5 .5% 3 6 1.2% 10 2.2% 16 1.7% 4 14 2.9% 19 4.3% 33 3.5% 5 69 14.1% 74 16.6% 143 15.3% 6 47 9.6% 55 12.4% 102 10.9% 7 73 15.0% 62 13.9% 135 14.5% 8 95 19.5% 86 19.3% 181 19.4% 9 40 8.2% 18 4.0% 58 6.2% 10 133 27.3% 96 21.6% 229 24.5% Don't know 6 1.2% 10 2.2% 16 1.7% Prefer not to say ∙∙∙ ∙∙∙ ∙∙∙ ∙∙∙ ∙∙∙ ∙∙∙ Total 488 100.0% 445 100.0% 933 100.0%

Public Awareness Campaign on Climate Change and Energy Efficiency Baseline and Follow-Up Surveys 34
A4. On a scale of 1 to 10, where 1 means 'not at all' and 10 means 'to a great extent', to what extent do you believe climate change is caused by human activity such as burning fuels and gases?
St. John's CMA
Outside St. John's CMA Total
Count % Count % Count % 1 7 1.4% 12 2.7% 19 2.0% 2 ∙∙∙ ∙∙∙ ∙∙∙ ∙∙∙ 12 1.3% 3 8 1.6% 11 2.5% 19 2.0% 4 9 1.8% 16 3.6% 25 2.7% 5 47 9.6% 56 12.6% 103 11.0% 6 35 7.2% 37 8.3% 72 7.7% 7 77 15.8% 61 13.7% 138 14.8% 8 117 24.0% 96 21.6% 213 22.8% 9 63 12.9% 38 8.5% 101 10.8% 10 114 23.4% 108 24.3% 222 23.8% Don't know ∙∙∙ ∙∙∙ ∙∙∙ ∙∙∙ 9 1.0% Total 488 100.0% 445 100.0% 933 100.0%
A5. On a scale of 1 to 10, where 1 means 'not at all' and 10 means 'to a great extent', to what extent do you believe climate change is caused by natural factors such as changes in the sun's intensity and volcanic eruptions?
St. John's CMA
Outside St. John's CMA Total
Count % Count % Count % 1 30 6.1% 19 4.3% 49 5.3% 2 48 9.8% 35 7.9% 83 8.9% 3 62 12.7% 39 8.8% 101 10.8% 4 56 11.5% 50 11.2% 106 11.4% 5 102 20.9% 102 22.9% 204 21.9% 6 51 10.5% 54 12.1% 105 11.3% 7 57 11.7% 46 10.3% 103 11.0% 8 37 7.6% 44 9.9% 81 8.7% 9 12 2.5% 15 3.4% 27 2.9% 10 19 3.9% 22 4.9% 41 4.4% Don't know 14 2.9% 19 4.3% 33 3.5% Total 488 100.0% 445 100.0% 933 100.0%
A6. In your opinion, who should take action to help reduce the potential impacts of climate change? SELECT ALL THAT APPLY
St. John's CMA
Outside St. John's CMA Total
N % N % N % Individuals/households 317 65.0% 255 57.3% 572 61.3% Businesses 61 12.5% 43 9.7% 104 11.1% Government 259 53.1% 235 52.8% 494 52.9% Large industry (e.g., oil companies, mining companies, etc)
96 19.7% 73 16.4% 169 18.1%
Other (specify): 70 14.3% 57 12.8% 127 13.6% Don’t know 13 2.7% 35 7.9% 48 5.1% Prefer not to say ∙∙∙ ∙∙∙ ∙∙∙ ∙∙∙ ∙∙∙ ∙∙∙ Totals may exceed 100% due to multiple responses. Final Results Compiled by the NLSA on 5/1/2014

Public Awareness Campaign on Climate Change and Energy Efficiency Baseline and Follow-Up Surveys 35
A6. (Other) In your opinion, who should take action to help reduce the potential impacts of climate change? SELECT ALL THAT APPLY
St. John's CMA
Outside St. John's CMA Total
Count % Count % Count % Everyone/All of us 49 70.0% 40 70.2% 89 70.1% Scientists/scientific community ∙∙∙ ∙∙∙ ∙∙∙ ∙∙∙ 7 5.5% Environmental groups ∙∙∙ ∙∙∙ ∙∙∙ ∙∙∙ ∙∙∙ ∙∙∙ Educators ∙∙∙ ∙∙∙ ∙∙∙ ∙∙∙ ∙∙∙ ∙∙∙ Doesn't think anyone can help reduce impacts 7 10.0% 5 8.8% 12 9.4% Other ∙∙∙ ∙∙∙ ∙∙∙ ∙∙∙ 11 8.7% Total 70 100.0% 57 100.0% 127 100.0%
A7. On a scale of 1 to 10, where 1 is 'not at all informed' and 10 is 'very informed', how informed do you feel about the potential impacts of climate change on you as an individual?
St. John's CMA
Outside St. John's CMA Total
Count % Count % Count % 1 11 2.3% 17 3.8% 28 3.0% 2 22 4.5% 13 2.9% 35 3.8% 3 29 5.9% 34 7.6% 63 6.8% 4 41 8.4% 30 6.7% 71 7.6% 5 112 23.0% 104 23.4% 216 23.2% 6 74 15.2% 54 12.1% 128 13.7% 7 83 17.0% 64 14.4% 147 15.8% 8 69 14.1% 64 14.4% 133 14.3% 9 16 3.3% 14 3.1% 30 3.2% 10 27 5.5% 39 8.8% 66 7.1% Don't know ∙∙∙ ∙∙∙ 12 2.7% 16 1.7% Total 488 100.0% 445 100.0% 933 100.0%
A8. On a scale of 1 to 10, where 1 is 'not at all relevant' and 10 is 'very relevant', how relevant an issue do you feel
climate change is to Newfoundland and Labrador?
St. John's CMA
Outside St. John's CMA Total
Count % Count % Count % 1 ∙∙∙ ∙∙∙ ∙∙∙ ∙∙∙ 10 1.1% 2 9 1.8% 5 1.1% 14 1.5% 3 14 2.9% 8 1.8% 22 2.4% 4 13 2.7% 13 2.9% 26 2.8% 5 54 11.1% 48 10.8% 102 10.9% 6 61 12.5% 50 11.2% 111 11.9% 7 97 19.9% 66 14.8% 163 17.5% 8 101 20.7% 104 23.4% 205 22.0% 9 33 6.8% 34 7.6% 67 7.2% 10 101 20.7% 102 22.9% 203 21.8% Don't know ∙∙∙ ∙∙∙ ∙∙∙ ∙∙∙ 10 1.1% Total 488 100.0% 445 100.0% 933 100.0%

Public Awareness Campaign on Climate Change and Energy Efficiency Baseline and Follow-Up Surveys 36
SECTION B – TAKING ACTION
B1. What impact do you feel your everyday actions are having on climate change? Would you say your actions are having . . . SELECT ONE RESPONSE ONLY
St. John's CMA
Outside St. John's CMA Total
Count % Count % Count % No impact 26 5.3% 34 7.6% 60 6.4% A little impact 227 46.5% 209 47.0% 436 46.7% A moderate impact 202 41.4% 162 36.4% 364 39.0% A strong impact 32 6.6% 35 7.9% 67 7.2% Don’t know ∙∙∙ ∙∙∙ ∙∙∙ ∙∙∙ ∙∙∙ ∙∙∙ Prefer not to say ∙∙∙ ∙∙∙ ∙∙∙ ∙∙∙ ∙∙∙ ∙∙∙ Total 488 100.0% 445 100.0% 933 100.0%
B2. Please list all the things you do in your everyday life to help reduce your impact on climate change. SELECT ALL THAT APPLY
St. John's CMA
Outside St. John's CMA Total
N % N % N % Recycling 271 55.5% 190 42.7% 461 49.4% Composting 36 7.4% 30 6.7% 66 7.1% Energy efficient lighting 41 8.4% 39 8.8% 80 8.6% Programmable thermostats 32 6.6% 12 2.7% 44 4.7% Energy star appliances 29 5.9% 19 4.3% 48 5.1% Energy star windows 35 7.2% 19 4.3% 54 5.8% Insulated basement 22 4.5% 19 4.3% 41 4.4% Insulated attic 23 4.7% 22 4.9% 45 4.8% Alternative transportation (carpooling) 41 8.4% 30 6.7% 71 7.6% Alternative transportation (public transportation/bus)
28 5.7% 13 2.9% 41 4.4%
Alternative transportation (walking) 72 14.8% 65 14.6% 137 14.7% Alternative transportation (bicycling) 8 1.6% 6 1.3% 14 1.5% Fuel efficient transportation (i.e., hybrid or fuel efficient vehicle)
47 9.6% 38 8.5% 85 9.1%
Other (specify): 293 60.0% 217 48.8% 510 54.7% I don’t do anything to help reduce my impact 27 5.5% 48 10.8% 75 8.0% Don’t know 23 4.7% 31 7.0% 54 5.8% Prefer not to say ∙∙∙ ∙∙∙ ∙∙∙ ∙∙∙ ∙∙∙ ∙∙∙ Totals may exceed 100% due to multiple responses. Final Results Compiled by the NLSA on 5/1/2014

Public Awareness Campaign on Climate Change and Energy Efficiency Baseline and Follow-Up Surveys 37
B2. (Other) Please list all the things you do in your everyday life to help reduce your impact on climate change. SELECT ALL THAT APPLY
St. John's CMA
Outside St. John's CMA Total
N % N % N % Take measures to conserve energy (reduce lighting/thermostats/appliance use, etc.)
195 66.6% 116 53.5% 311 61.0%
Take measures to conserve water 33 11.3% 22 10.1% 55 10.8% Drive less/refrain from letting vehicle idle 85 29.0% 76 35.0% 161 31.6% Take measures to reduce trash/ensure proper disposal of waste
37 12.6% 25 11.5% 62 12.2%
Take measures to improve energy efficiency of dwelling (solar panels, extra insulation, new doors, etc.)
31 10.6% 15 6.9% 46 9.0%
Use local/organic/environmentally friendly products/refrain from using products with harsh chemicals
18 6.1% 10 4.6% 28 5.5%
Grow own vegetables/plant trees or shrubs to help reduce atmospheric carbon dioxide levels
13 4.4% 6 2.8% 19 3.7%
Use a specific home heating source (note opinions differed on whether electricity, oil or wood has the least impact)
15 5.1% 32 14.7% 47 9.2%
Other 10 3.4% 8 3.7% 18 3.5% Totals may exceed 100% due to multiple responses. Final Results Compiled by the NLSA on 5/1/2014
B3. Do you recycle?
St. John's CMA
Outside St. John's CMA Total
Count % Count % Count % Yes 201 92.6% 223 87.5% 424 89.8% No 16 7.4% 32 12.5% 48 10.2% Total 217 100.0% 255 100.0% 472 100.0% [SUBSET: Respondents that indicated they DID NOT recycle in question B2.]
B4. Do you compost?
St. John's CMA
Outside St. John's CMA Total
Count % Count % Count % Yes 95 21.0% 100 24.1% 195 22.5% No 357 79.0% 314 75.7% 671 77.4% Don't know ∙∙∙ ∙∙∙ ∙∙∙ ∙∙∙ ∙∙∙ ∙∙∙ Total 452 100.0% 415 100.0% 867 100.0% [SUBSET: Respondents that indicated they DID NOT compost in question B2.]

Public Awareness Campaign on Climate Change and Energy Efficiency Baseline and Follow-Up Surveys 38
B5. Do you drive a fuel efficient vehicle?
St. John's CMA
Outside St. John's CMA Total
Count % Count % Count % Yes 244 55.3% 215 52.8% 459 54.1% No 149 33.8% 147 36.1% 296 34.9% Do not own a vehicle 39 8.8% 34 8.4% 73 8.6% Don’t know 9 2.0% 11 2.7% 20 2.4% Total 441 100.0% 407 100.0% 848 100.0% [SUBSET: Respondents that indicated they DID NOT use fuel efficient transportation in question B2.]
B6a. Do you use energy efficient light bulbs?
St. John's CMA
Outside St. John's CMA Total
Count % Count % Count % Yes 400 89.5% 352 86.7% 752 88.2% No 45 10.1% 53 13.1% 98 11.5% Don't know ∙∙∙ ∙∙∙ ∙∙∙ ∙∙∙ ∙∙∙ ∙∙∙ Total 447 100.0% 406 100.0% 853 100.0% [SUBSET: Respondents that indicated they DID NOT use energy efficient lighting in question B2.]
B6b. Do you have programmable thermostats?
St. John's CMA
Outside St. John's CMA Total
Count % Count % Count % Yes 182 39.9% 145 33.5% 327 36.8% No 271 59.4% 288 66.5% 559 62.9% Don’t know ∙∙∙ ∙∙∙ ∙∙∙ ∙∙∙ ∙∙∙ ∙∙∙ Total 456 100.0% 433 100.0% 889 100.0% [SUBSET: Respondents that indicated they DID NOT use programmable thermostats in question B2.]
B6c. Do you have energy star appliances?
St. John's CMA
Outside St. John's CMA Total
Count % Count % Count % Yes 340 74.1% 307 72.1% 647 73.1% No 93 20.3% 85 20.0% 178 20.1% Don't know 26 5.7% 34 8.0% 60 6.8% Total 459 100.0% 426 100.0% 885 100.0% [SUBSET: Respondents that indicated they DID NOT have energy star appliances in question B2.]
B6d. Do you have energy star windows?
St. John's CMA
Outside St. John's CMA Total
Count % Count % Count % Yes 228 50.3% 210 49.3% 438 49.8% No 135 29.8% 133 31.2% 268 30.5% Don't know 90 19.9% 83 19.5% 173 19.7% Total 453 100.0% 426 100.0% 879 100.0% [SUBSET: Respondents that indicated they DID NOT have energy star windows in question B2.]

Public Awareness Campaign on Climate Change and Energy Efficiency Baseline and Follow-Up Surveys 39
B6e. Do you have your basement insulated?
St. John's CMA
Outside St. John's CMA Total
Count % Count % Count % Yes 379 81.3% 302 70.9% 681 76.3% No 36 7.7% 53 12.4% 89 10.0% I do not have a basement in my home 40 8.6% 50 11.7% 90 10.1% Don't know 11 2.4% 20 4.7% 31 3.5% Prefer not to say ∙∙∙ ∙∙∙ ∙∙∙ ∙∙∙ ∙∙∙ ∙∙∙ Total 466 100.0% 426 100.0% 892 100.0% [SUBSET: Respondents that indicated they DID NOT have an insulated basement in question B2.]
B6f. Do you have your attic insulated?
St. John's CMA
Outside St. John's CMA Total
Count % Count % Count % Yes 371 79.8% 361 85.3% 732 82.4% No 10 2.2% 21 5.0% 31 3.5% I do not have an attic in my home 49 10.5% 18 4.3% 67 7.5% Don't know 35 7.5% 23 5.4% 58 6.5% Total 465 100.0% 423 100.0% 888 100.0% [SUBSET: Respondents that indicated they DID NOT have an insulated attic in question B2.]
B6g. Have you taken any other steps to improve the energy efficiency of your home?
St. John's CMA
Outside St. John's CMA Total
Count % Count % Count % Yes (specify): 201 41.2% 196 44.0% 397 42.6% No 278 57.0% 240 53.9% 518 55.5% Don't know 9 1.8% 9 2.0% 18 1.9% Total 488 100.0% 445 100.0% 933 100.0%
B6g. (Other) Have you taken any other steps to improve the energy efficiency of your home?
St. John's CMA
Outside St. John's CMA Total
N % N % N % Steps to better insulate the home/reduce drafts (extra insulation, new doors/windows, weather stripping, etc.)
132 65.7% 127 64.8% 259 65.2%
Steps to conserve energy (reduce lighting/thermostats, new/energy efficient appliances, etc.)
59 29.4% 56 28.6% 115 29.0%
Use a specific home heating source (opinions differed on whether electricity, oil or wood was more energy efficient)
21 10.4% 29 14.8% 50 12.6%
Steps to conserve water (low-flow shower heads, low-flow toilets, doing laundry less frequently, etc.)
8 4.0% 6 3.1% 14 3.5%
Other 5 2.5% 5 2.6% 10 2.5% Totals may exceed 100% due to multiple responses. Final Results Compiled by the NLSA on 5/1/2014
Public Awareness Campaign on Climate Change and Energy Efficiency Baseline and Follow-Up Surveys 40
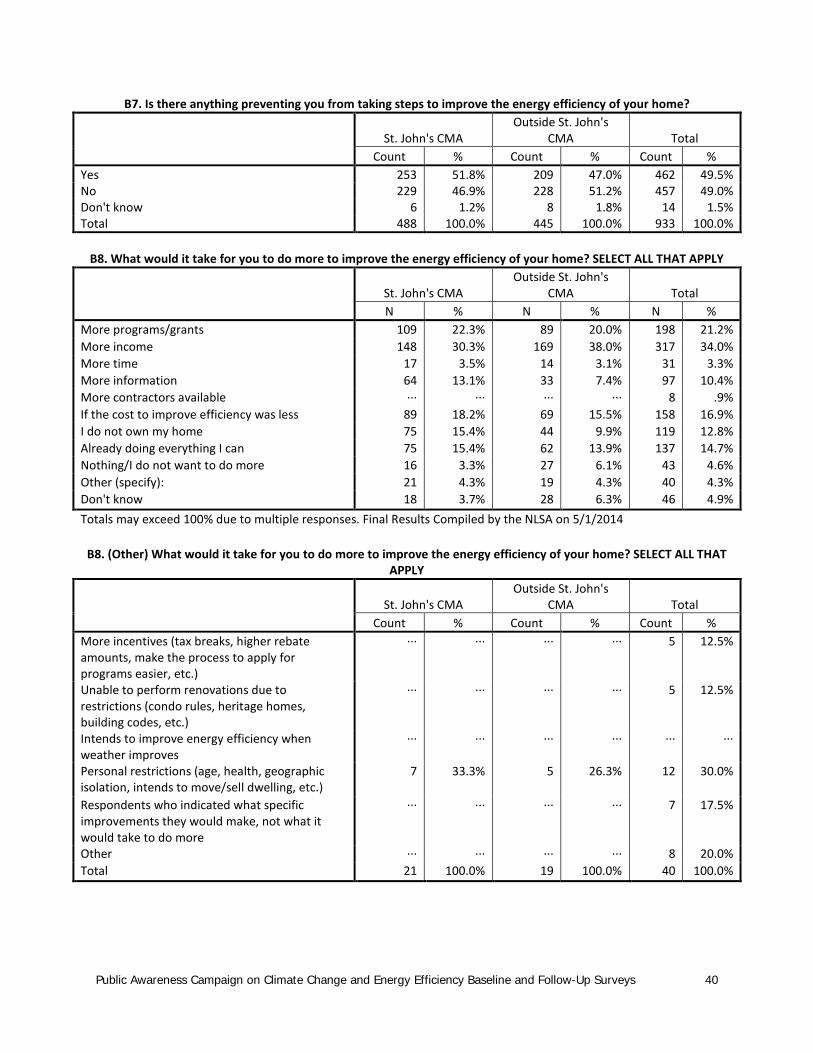
B7. Is there anything preventing you from taking steps to improve the energy efficiency of your home?
St. John's CMA
Outside St. John's CMA Total
Count % Count % Count % Yes 253 51.8% 209 47.0% 462 49.5% No 229 46.9% 228 51.2% 457 49.0% Don't know 6 1.2% 8 1.8% 14 1.5% Total 488 100.0% 445 100.0% 933 100.0%
B8. What would it take for you to do more to improve the energy efficiency of your home? SELECT ALL THAT APPLY
St. John's CMA
Outside St. John's CMA Total
N % N % N % More programs/grants 109 22.3% 89 20.0% 198 21.2% More income 148 30.3% 169 38.0% 317 34.0% More time 17 3.5% 14 3.1% 31 3.3% More information 64 13.1% 33 7.4% 97 10.4% More contractors available ∙∙∙ ∙∙∙ ∙∙∙ ∙∙∙ 8 .9% If the cost to improve efficiency was less 89 18.2% 69 15.5% 158 16.9% I do not own my home 75 15.4% 44 9.9% 119 12.8% Already doing everything I can 75 15.4% 62 13.9% 137 14.7% Nothing/I do not want to do more 16 3.3% 27 6.1% 43 4.6% Other (specify): 21 4.3% 19 4.3% 40 4.3% Don't know 18 3.7% 28 6.3% 46 4.9% Totals may exceed 100% due to multiple responses. Final Results Compiled by the NLSA on 5/1/2014
B8. (Other) What would it take for you to do more to improve the energy efficiency of your home? SELECT ALL THAT APPLY
St. John's CMA
Outside St. John's CMA Total
Count % Count % Count % More incentives (tax breaks, higher rebate amounts, make the process to apply for programs easier, etc.)
∙∙∙ ∙∙∙ ∙∙∙ ∙∙∙ 5 12.5%
Unable to perform renovations due to restrictions (condo rules, heritage homes, building codes, etc.)
∙∙∙ ∙∙∙ ∙∙∙ ∙∙∙ 5 12.5%
Intends to improve energy efficiency when weather improves
∙∙∙ ∙∙∙ ∙∙∙ ∙∙∙ ∙∙∙ ∙∙∙
Personal restrictions (age, health, geographic isolation, intends to move/sell dwelling, etc.)
7 33.3% 5 26.3% 12 30.0%
Respondents who indicated what specific improvements they would make, not what it would take to do more
∙∙∙ ∙∙∙ ∙∙∙ ∙∙∙ 7 17.5%
Other ∙∙∙ ∙∙∙ ∙∙∙ ∙∙∙ 8 20.0% Total 21 100.0% 19 100.0% 40 100.0%

Public Awareness Campaign on Climate Change and Energy Efficiency Baseline and Follow-Up Surveys 41
SECTION C – KNOWLEDGE OF CLIMATE CHANGE AND ENERGY EFFICIENCY RELATED PROGRAMS AND SERVICES
C1. If you were to receive information on climate change and energy efficiency, which of the following sources would you trust the most? SELECT ONE RESPONSE ONLY
St. John's CMA
Outside St. John's CMA Total
Count % Count % Count % Community groups 93 19.1% 91 20.4% 184 19.7% Private companies 30 6.1% 28 6.3% 58 6.2% Municipal government 39 8.0% 25 5.6% 64 6.9% Provincial government 152 31.1% 140 31.5% 292 31.3% Federal government 112 23.0% 100 22.5% 212 22.7% Would not trust any sources 18 3.7% 18 4.0% 36 3.9% Other (specify): 21 4.3% 10 2.2% 31 3.3% Don't know 23 4.7% 32 7.2% 55 5.9% Prefer not to say ∙∙∙ ∙∙∙ ∙∙∙ ∙∙∙ ∙∙∙ ∙∙∙ Total 488 100.0% 445 100.0% 933 100.0%
C1. (Other) If you were to receive information on climate change and energy efficiency, which of the following sources would you trust the most? SELECT ONE RESPONSE ONLY
St. John's CMA
Outside St. John's CMA Total
Count % Count % Count % Scientific community ∙∙∙ ∙∙∙ ∙∙∙ ∙∙∙ 12 38.7% Personal research conducted themselves ∙∙∙ ∙∙∙ ∙∙∙ ∙∙∙ 7 22.6% Other 7 33.3% 5 50.0% 12 38.7% Total 21 100.0% 10 100.0% 31 100.0%
C2. What other sources would you trust? SELECT ALL THAT APPLY
St. John's CMA
Outside St. John's CMA Total
N % N % N % Community groups 167 37.4% 126 32.0% 293 34.8% Private companies 101 22.6% 62 15.7% 163 19.4% Municipal government 201 45.0% 151 38.3% 352 41.9% Provincial government 162 36.2% 130 33.0% 292 34.7% Federal government 158 35.3% 119 30.2% 277 32.9% No others 33 7.4% 39 9.9% 72 8.6% Other (specify): 33 7.4% 22 5.6% 55 6.5% Don’t know 5 1.1% 15 3.8% 20 2.4% Prefer not to say ∙∙∙ ∙∙∙ ∙∙∙ ∙∙∙ ∙∙∙ ∙∙∙ Totals may exceed 100% due to multiple responses. Final Results Compiled by the NLSA on 5/1/2014 [SUBSET: Respondents that indicated a source they would trust MOST in question C1.]

Public Awareness Campaign on Climate Change and Energy Efficiency Baseline and Follow-Up Surveys 42
C2. (Other) What other sources would you trust? SELECT ALL THAT APPLY
St. John's CMA
Outside St. John's CMA Total
Count % Count % Count % Scientific community (incl. NASA and universities)
13 39.4% 9 40.9% 22 40.0%
Personal research conducted themselves ∙∙∙ ∙∙∙ ∙∙∙ ∙∙∙ ∙∙∙ ∙∙∙ News media (tv, radio, etc.) ∙∙∙ ∙∙∙ ∙∙∙ ∙∙∙ 7 12.7% Environmental groups (Greenpeace, World Wildlife Fund, etc.)
∙∙∙ ∙∙∙ ∙∙∙ ∙∙∙ ∙∙∙ ∙∙∙
Internet/social media ∙∙∙ ∙∙∙ ∙∙∙ ∙∙∙ 6 10.9% Specific individuals (friends, family, building contractors, etc.)
∙∙∙ ∙∙∙ ∙∙∙ ∙∙∙ 10 18.2%
Other ∙∙∙ ∙∙∙ ∙∙∙ ∙∙∙ ∙∙∙ ∙∙∙ Total 33 100.0% 22 100.0% 55 100.0%
C3. Are you aware of any provincial government departments or agencies that are working toward reducing climate change or increasing energy efficiency?
St. John's CMA
Outside St. John's CMA Total
Count % Count % Count % Yes 148 30.3% 124 27.9% 272 29.2% No 324 66.4% 306 68.8% 630 67.5% Don't know 16 3.3% 15 3.4% 31 3.3% Total 488 100.0% 445 100.0% 933 100.0%
C4. What provincial government departments and/or agencies are you aware of? SELECT ALL THAT APPLY
St. John's CMA
Outside St. John's CMA Total
N % N % N % Department of Environment and Conservation 35 23.6% 27 21.8% 62 22.8% Department of Fisheries and Aquaculture ∙∙∙ ∙∙∙ ∙∙∙ ∙∙∙ 5 1.8% Department of Municipal Affairs ∙∙∙ ∙∙∙ ∙∙∙ ∙∙∙ 9 3.3% Department of Natural Resources ∙∙∙ ∙∙∙ ∙∙∙ ∙∙∙ 26 9.6% Department of Transportation and Works (Public Works)
∙∙∙ ∙∙∙ ∙∙∙ ∙∙∙ 9 3.3%
Forestry and Agrifoods Agency ∙∙∙ ∙∙∙ ∙∙∙ ∙∙∙ ∙∙∙ ∙∙∙ Newfoundland and Labrador Housing Corporation
∙∙∙ ∙∙∙ ∙∙∙ ∙∙∙ 12 4.4%
Newfoundland and Labrador Hydro 23 15.5% 20 16.1% 43 15.8% Office of Climate Change, Energy Efficiency and Emissions Trading
∙∙∙ ∙∙∙ ∙∙∙ ∙∙∙ 17 6.3%
Service Newfoundland and Labrador (previously Department of Government Services)
∙∙∙ ∙∙∙ ∙∙∙ ∙∙∙ 5 1.8%
Newfoundland Power 36 24.3% 27 21.8% 63 23.2% Other (specify): 20 13.5% 21 16.9% 41 15.1% Don’t know 30 20.3% 33 26.6% 63 23.2% Prefer not to say ∙∙∙ ∙∙∙ ∙∙∙ ∙∙∙ ∙∙∙ ∙∙∙ Totals may exceed 100% due to multiple responses. Final Results Compiled by the NLSA on 5/1/2014 [SUBSET: Respondents aware of any provincial government departments or agencies in question C3.]

Public Awareness Campaign on Climate Change and Energy Efficiency Baseline and Follow-Up Surveys 43
C4. (Other) What provincial government departments and/or agencies are you aware of?
St. John's CMA
Outside St. John's CMA Total
Count % Count % Count % MMSB 9 45.0% 8 38.1% 17 41.5% Nalcor ∙∙∙ ∙∙∙ ∙∙∙ ∙∙∙ 8 19.5% Other ∙∙∙ ∙∙∙ ∙∙∙ ∙∙∙ 16 39.0% Total 20 100.0% 21 100.0% 41 100.0%
C5. Are you aware of any provincial government programs, services or initiatives targeted towards climate change or energy efficiency?
St. John's CMA
Outside St. John's CMA Total
Count % Count % Count % Yes 197 40.4% 128 28.8% 325 34.8% No 287 58.8% 309 69.4% 596 63.9% Don't know ∙∙∙ ∙∙∙ 8 1.8% 12 1.3% Total 488 100.0% 445 100.0% 933 100.0%
C6. What provincial government programs, services or initiatives are you aware of? SELECT ALL THAT APPLY
St. John's CMA
Outside St. John's CMA Total
N % N % N % Turn Back the Tide 9 4.6% 5 3.9% 14 4.3% Get to Half 12 6.1% 5 3.9% 17 5.2% Take Charge 55 27.9% 28 21.9% 83 25.5% Muskrat Falls ∙∙∙ ∙∙∙ ∙∙∙ ∙∙∙ 9 2.8% Hybrid Vehicles ∙∙∙ ∙∙∙ ∙∙∙ ∙∙∙ 2 .6% Energy efficient standards for government buildings
∙∙∙ ∙∙∙ ∙∙∙ ∙∙∙ 6 1.8%
Energy efficient home retrofit grant programs (e.g., EnerGuide - Natural Resources, REEP for Low Income - Newfoundland and Labrador Housing)
66 33.5% 56 43.8% 122 37.5%
Other (specify): 35 17.8% 24 18.8% 59 18.2% Don't know 43 21.8% 25 19.5% 68 20.9% Total 197 100.0% 128 100.0% 325 100.0% Totals may exceed 100% due to multiple responses. Final Results Compiled by the NLSA on 5/1/2014 [SUBSET: Respondents aware of any provincial government programs, services or initiatives in question C5.]
C6. (Other) What provincial government programs, services or initiatives are you aware of? SELECT ALL THAT APPLY
St. John's CMA
Outside St. John's CMA Total
Count % Count % Count % MMSB recycling programs (incl. vehicle tires and electronic waste - no further specification)
∙∙∙ ∙∙∙ ∙∙∙ ∙∙∙ 10 16.9%
Other ∙∙∙ ∙∙∙ ∙∙∙ ∙∙∙ 49 83.1% Total 35 100.0% 24 100.0% 59 100.0%

Public Awareness Campaign on Climate Change and Energy Efficiency Baseline and Follow-Up Surveys 44
C7. Are you aware the provincial government has increased energy efficiency standards for new and existing government buildings?
St. John's CMA
Outside St. John's CMA Total
Count % Count % Count % Yes 175 36.2% 154 34.7% 329 35.5% No 298 61.7% 284 64.0% 582 62.8% Don't know 10 2.1% 6 1.4% 16 1.7% Total 483 100.0% 444 100.0% 927 100.0% [SUBSET: Respondents that indicated they ARE NOT aware of energy efficient standards for government buildings in question C6.]
C8. Are you aware the provincial government is purchasing hybrid vehicles?
St. John's CMA
Outside St. John's CMA Total
Count % Count % Count % Yes 87 17.8% 89 20.1% 176 18.9% No 396 81.1% 349 78.8% 745 80.0% Don't know 5 1.0% 5 1.1% 10 1.1% Total 488 100.0% 443 100.0% 931 100.0% [SUBSET: Respondents that indicated they ARE NOT aware of government purchasing hybrid vehicles in question C6.]
C9. Are you aware of the Get to half campaign by the MMSB which aims to reduce the amount of waste produced at homes, school and work?
St. John's CMA
Outside St. John's CMA Total
Count % Count % Count % Yes 275 57.8% 238 54.1% 513 56.0% No 196 41.2% 202 45.9% 398 43.4% Don't know 5 1.1% ∙∙∙ ∙∙∙ 5 .5% Total 476 100.0% 440 100.0% 916 100.0% [SUBSET: Respondents that indicated they ARE NOT aware of the Get to Half campaign in question C6.]
C10. Are you aware of the Take Charge program by Newfoundland and Labrador Hydro and Newfoundland Power which provides information and funding towards making energy efficient improvements in your home or business?
St. John's CMA
Outside St. John's CMA Total
Count % Count % Count % Yes 342 79.0% 294 70.5% 636 74.8% No 87 20.1% 121 29.0% 208 24.5% Don't know ∙∙∙ ∙∙∙ ∙∙∙ ∙∙∙ 6 .7% Total 433 100.0% 417 100.0% 850 100.0% [SUBSET: Respondents that indicated they ARE NOT aware of the Take Charge program in question C6.]

Public Awareness Campaign on Climate Change and Energy Efficiency Baseline and Follow-Up Surveys 45
SECTION D – PUBLIC AWARENESS WITH TURN BACK THE TIDE CAMPAIGN MATERIALS
D1. Are you aware of the Turn Back the Tide campaign by the provincial government which provides information to raise awareness on climate change and energy efficiency?
St. John's CMA
Outside St. John's CMA Total
Count % Count % Count % Yes 243 49.8% 194 43.6% 437 46.8% No 237 48.6% 245 55.1% 482 51.7% Don't know 8 1.6% 6 1.3% 14 1.5% Total 488 100.0% 445 100.0% 933 100.0%
D2. Through which types of media did you become familiar with the Turn Back the Tide campaign? SELECT ALL THAT APPLY
St. John's CMA
Outside St. John's CMA Total
N % N % N % Television 196 80.7% 160 82.5% 356 81.5% Posters ∙∙∙ ∙∙∙ ∙∙∙ ∙∙∙ 12 2.7% Brochures ∙∙∙ ∙∙∙ ∙∙∙ ∙∙∙ 17 3.9% Online ads/commercials 33 13.6% 33 17.0% 66 15.1% Turn Back the Tide website ∙∙∙ ∙∙∙ ∙∙∙ ∙∙∙ 8 1.8% Newspapers 21 8.6% 12 6.2% 33 7.6% St. John’s Ice Caps promotions ∙∙∙ ∙∙∙ ∙∙∙ ∙∙∙ ∙∙∙ ∙∙∙ Turn Back the Tide Facebook page ∙∙∙ ∙∙∙ ∙∙∙ ∙∙∙ 5 1.1% Other (specify): 49 20.2% 24 12.4% 73 16.7% Don’t know 7 2.9% 10 5.2% 17 3.9% Totals may exceed 100% due to multiple responses. Final Results Compiled by the NLSA on 5/1/2014 [SUBSET: Respondents that are aware of the Turn Back the Tide campaign in question D1.]
D2. (Other) Through which types of media did you become familiar with the Turn Back the Tide campaign? SELECT ALL THAT APPLY
St. John's CMA
Outside St. John's CMA Total
Count % Count % Count % Radio 40 81.6% 17 70.8% 57 78.1% Other 9 18.4% 7 29.2% 16 21.9% Total 49 100.0% 24 100.0% 73 100.0%
D3. Do you recall seeing the Turn Back the Tide advertisements on TV or online?
St. John's CMA
Outside St. John's CMA Total
Count % Count % Count % Yes 69 24.6% 93 33.6% 162 29.1% No 200 71.4% 179 64.6% 379 68.0% Don't know 11 3.9% 5 1.8% 16 2.9% Total 280 100.0% 277 100.0% 557 100.0%
[SUBSET: Respondents that 1) are not aware of the Turn Back the Tide campaign in question D1, and 2) those that did not mention Television or Online ads/commercials in question D2.]

Public Awareness Campaign on Climate Change and Energy Efficiency Baseline and Follow-Up Surveys 46
D4. What can you recall about the TV or online advertisements? SELECT ALL THAT APPLY
St. John's CMA
Outside St. John's CMA Total
N % N % N % Slogan - Turn Back the Tide 115 41.5% 76 29.1% 191 35.5% "I can make a difference" 15 5.4% 14 5.4% 29 5.4% Water images (i.e., images of the ocean) 17 6.1% 5 1.9% 22 4.1% Flooding ∙∙∙ ∙∙∙ ∙∙∙ ∙∙∙ 11 2.0% Storm images ∙∙∙ ∙∙∙ ∙∙∙ ∙∙∙ 11 2.0% Local actors 20 7.2% 12 4.6% 32 5.9% Local images (e.g., people walking in downtown St. John’s)
13 4.7% 12 4.6% 25 4.6%
Individual actions - tips on how to reduce energy/waste
38 13.7% 31 11.9% 69 12.8%
Muskrat Falls ∙∙∙ ∙∙∙ ∙∙∙ ∙∙∙ 6 1.1% Government leading the public ∙∙∙ ∙∙∙ ∙∙∙ ∙∙∙ ∙∙∙ ∙∙∙ Nothing 58 20.9% 80 30.7% 138 25.7% Other (specify): 25 9.0% 22 8.4% 47 8.7% Don’t know 19 6.9% 40 15.3% 59 11.0% Prefer not to say ∙∙∙ ∙∙∙ ∙∙∙ ∙∙∙ ∙∙∙ ∙∙∙ Totals may exceed 100% due to multiple responses. Final Results Compiled by the NLSA on 5/1/2014 [SUBSET: Respondents that 1) mentioned Television or Online ads/commercials in question D2 , and 2) recalled seeing the Turn Back the Tide advertisements on TV or online in question D3.]
D4. (Other) What can you recall about the TV or online advertisements? SELECT ALL THAT APPLY
St. John's CMA
Outside St. John's CMA Total
Count % Count % Count % The individuals in the advertisements (talking about climate change and its effects)
10 40.0% 11 50.0% 21 44.7%
Visual aspects of the advertisements (statue of John Cabot, clothes blowing in the wind, black and white images, etc.)
∙∙∙ ∙∙∙ ∙∙∙ ∙∙∙ 6 12.8%
Informative aspects of the advertisements (plastic bottle use, rebate info, global issue, happening now, etc.)
∙∙∙ ∙∙∙ ∙∙∙ ∙∙∙ 9 19.1%
MMSB/reduce, reuse, recycle slogan ∙∙∙ ∙∙∙ ∙∙∙ ∙∙∙ ∙∙∙ ∙∙∙ Website (TurnBackTheTide.ca) ∙∙∙ ∙∙∙ ∙∙∙ ∙∙∙ ∙∙∙ ∙∙∙ Other ∙∙∙ ∙∙∙ ∙∙∙ ∙∙∙ ∙∙∙ ∙∙∙ Total 25 100.0% 22 100.0% 47 100.0%
D5. Have you visited the website TurnBacktheTide.ca?
St. John's CMA
Outside St. John's CMA Total
Count % Count % Count % Yes 18 3.7% 8 1.8% 26 2.8% No 463 95.7% 433 98.2% 896 96.9% Don't know ∙∙∙ ∙∙∙ ∙∙∙ ∙∙∙ ∙∙∙ ∙∙∙ Total 484 100.0% 441 100.0% 925 100.0% [SUBSET: Respondents that DID NOT mention the Turn Back the Tide website in question D2.]

Public Awareness Campaign on Climate Change and Energy Efficiency Baseline and Follow-Up Surveys 47
D6. What can you recall about the Turn Back the Tide website? SELECT ALL THAT APPLY
St. John's CMA
Outside St. John's CMA Total
N % N % N % Slogan - Turn Back the Tide ∙∙∙ ∙∙∙ ∙∙∙ ∙∙∙ 5 14.7% Visual appeal (colourful, local images, etc.) ∙∙∙ ∙∙∙ ∙∙∙ ∙∙∙ ∙∙∙ ∙∙∙ Interactive house ∙∙∙ ∙∙∙ ∙∙∙ ∙∙∙ ∙∙∙ ∙∙∙ Good information (general) ∙∙∙ ∙∙∙ ∙∙∙ ∙∙∙ 8 23.5% Information for homeowners ∙∙∙ ∙∙∙ ∙∙∙ ∙∙∙ ∙∙∙ ∙∙∙ Information for businesses ∙∙∙ ∙∙∙ ∙∙∙ ∙∙∙ ∙∙∙ ∙∙∙ Information for your community ∙∙∙ ∙∙∙ ∙∙∙ ∙∙∙ ∙∙∙ ∙∙∙ Information on government action ∙∙∙ ∙∙∙ ∙∙∙ ∙∙∙ ∙∙∙ ∙∙∙ Nothing ∙∙∙ ∙∙∙ ∙∙∙ ∙∙∙ 11 32.4% Other (specify): ∙∙∙ ∙∙∙ ∙∙∙ ∙∙∙ 5 14.7% Don’t know ∙∙∙ ∙∙∙ ∙∙∙ ∙∙∙ ∙∙∙ ∙∙∙ Total 22 100.0% 12 100.0% 34 100.0% Totals may exceed 100% due to multiple responses. Final Results Compiled by the NLSA on 5/1/2014 [SUBSET: Respondents that 1) mentioned the Turn Back the Tide website in question D2, or 2) indicated they have visited the website in question D5.]
D7. Thinking of these different elements in the TV ads, online ads and website, have you changed your behavior as a result of information you have obtained from the Turn Back the Tide campaign?
St. John's CMA
Outside St. John's CMA Total
Count % Count % Count % Yes 46 16.4% 44 16.9% 90 16.6% No 231 82.5% 208 79.7% 439 81.1% Don't know ∙∙∙ ∙∙∙ 9 3.4% 12 2.2% Total 280 100.0% 261 100.0% 541 100.0% [SUBSET: Respondents that 1) mentioned Television, Online or the Turn Back the Tide website in question D2, or 2) recalled seeing the advertisements on TV or online in question D3, or 3) indicated they have visited the website in question D5.]

Public Awareness Campaign on Climate Change and Energy Efficiency Baseline and Follow-Up Surveys 48
D8. Which behaviours have you changed? SELECT ALL THAT APPLY
St. John's CMA
Outside St. John's CMA Total
N % N % N % Recycling 21 45.7% 28 63.6% 49 54.4% Composting ∙∙∙ ∙∙∙ ∙∙∙ ∙∙∙ 10 11.1% Energy efficient lighting 5 10.9% 6 13.6% 11 12.2% Programmable thermostats ∙∙∙ ∙∙∙ ∙∙∙ ∙∙∙ 5 5.6% Energy star appliances ∙∙∙ ∙∙∙ ∙∙∙ ∙∙∙ 7 7.8% Energy star windows ∙∙∙ ∙∙∙ ∙∙∙ ∙∙∙ ∙∙∙ ∙∙∙ Insulated basement ∙∙∙ ∙∙∙ ∙∙∙ ∙∙∙ ∙∙∙ ∙∙∙ Insulated attic ∙∙∙ ∙∙∙ ∙∙∙ ∙∙∙ ∙∙∙ ∙∙∙ Alternative transportation (carpooling) ∙∙∙ ∙∙∙ ∙∙∙ ∙∙∙ 5 5.6% Alternative transportation (public transportation/bus)
∙∙∙ ∙∙∙ ∙∙∙ ∙∙∙ ∙∙∙ ∙∙∙
Alternative transportation (walking) ∙∙∙ ∙∙∙ ∙∙∙ ∙∙∙ 6 6.7% Fuel efficient transportation (i.e., hybrid or fuel efficien
∙∙∙ ∙∙∙ ∙∙∙ ∙∙∙ ∙∙∙ ∙∙∙
Other (specify): 20 43.5% 19 43.2% 39 43.3% Don’t know ∙∙∙ ∙∙∙ ∙∙∙ ∙∙∙ 6 6.7% Totals may exceed 100% due to multiple responses. Final Results Compiled by the NLSA on 5/1/2014 [SUBSET: Respondents that indicated they HAVE changed their behavior in question D7.]
D8. (Other) Which behaviours have you changed? SELECT ALL THAT APPLY
St. John's CMA
Outside St. John's CMA Total
N % N % N % Take measures to conserve energy (reduce lighting/thermostats/appliance use, etc.)
16 80.0% 11 57.9% 27 69.2%
Take measures to conserve water ∙∙∙ ∙∙∙ ∙∙∙ ∙∙∙ 7 17.9% Drive less/refrain from letting vehicle idle ∙∙∙ ∙∙∙ ∙∙∙ ∙∙∙ 5 12.8% Take measures to reduce trash/ensure proper disposal of waste
∙∙∙ ∙∙∙ ∙∙∙ ∙∙∙ 9 23.1%
Take measures to improve energy efficiency of dwelling (solar panels, extra insulation, new doors, etc.)
∙∙∙ ∙∙∙ ∙∙∙ ∙∙∙ ∙∙∙ ∙∙∙
Use local/organic/environmentally friendly products/refrain from using products with harsh chemicals
∙∙∙ ∙∙∙ ∙∙∙ ∙∙∙ ∙∙∙ ∙∙∙
Grow own vegetables/plant trees or shrubs to help reduce atmospheric carbon dioxide levels
∙∙∙ ∙∙∙ ∙∙∙ ∙∙∙ ∙∙∙ ∙∙∙
Other ∙∙∙ ∙∙∙ ∙∙∙ ∙∙∙ ∙∙∙ ∙∙∙ Totals may exceed 100% due to multiple responses. Final Results Compiled by the NLSA on 5/1/2014

Public Awareness Campaign on Climate Change and Energy Efficiency Baseline and Follow-Up Surveys 49
D9a. Have you changed your behavior as a result of other information you have obtained on climate change and energy efficiency besides the Turn Back the Tide Campaign?
St. John's CMA
Outside St. John's CMA Total
Count % Count % Count % Yes 169 56.3% 116 42.8% 285 49.9% No 125 41.7% 149 55.0% 274 48.0% Don't know 6 2.0% 6 2.2% 12 2.1% Total 300 100.0% 271 100.0% 571 100.0% [SUBSET: Respondents that are aware of the Turn Back the Tide campaign, or have seen TV or Online advertisements or the website related to the campaign. (i.e. D1 = Yes or D2 = Yes or D5 = Yes)]
D9b. Have you changed your behavior as a result of information you have obtained on climate change and energy efficiency?
St. John's CMA
Outside St. John's CMA Total
Count % Count % Count % Yes 113 60.1% 84 48.3% 197 54.4% No 71 37.8% 86 49.4% 157 43.4% Don't know ∙∙∙ ∙∙∙ ∙∙∙ ∙∙∙ 7 1.9% Prefer not to say ∙∙∙ ∙∙∙ ∙∙∙ ∙∙∙ ∙∙∙ ∙∙∙ Total 188 100.0% 174 100.0% 362 100.0% [SUBSET: Respondents that are NOT aware of the Turn Back the Tide campaign.]
D10. Which behaviours have you changed? SELECT ALL THAT APPLY
St. John's CMA
Outside St. John's CMA Total
N % N % N % Recycling 164 58.2% 93 46.5% 257 53.3% Composting 35 12.4% 28 14.0% 63 13.1% Energy efficient lighting 58 20.6% 52 26.0% 110 22.8% Programmable thermostats 23 8.2% 14 7.0% 37 7.7% Energy star appliances 29 10.3% 28 14.0% 57 11.8% Energy star windows 31 11.0% 22 11.0% 53 11.0% Insulated basement 24 8.5% 20 10.0% 44 9.1% Insulated attic 22 7.8% 23 11.5% 45 9.3% Alternative transportation (carpooling) 12 4.3% 10 5.0% 22 4.6% Alternative transportation (public transportation/bus)
∙∙∙ ∙∙∙ ∙∙∙ ∙∙∙ 14 2.9%
Alternative transportation (walking) 20 7.1% 18 9.0% 38 7.9% Alternative transportation (bicycling) ∙∙∙ ∙∙∙ ∙∙∙ ∙∙∙ 9 1.9% Fuel efficient transportation (i.e., hybrid or fuel efficient vehicle)
30 10.6% 21 10.5% 51 10.6%
Other (specify): 153 54.3% 112 56.0% 265 55.0% Don't know ∙∙∙ ∙∙∙ ∙∙∙ ∙∙∙ 10 2.1% Prefer not to say ∙∙∙ ∙∙∙ ∙∙∙ ∙∙∙ ∙∙∙ ∙∙∙ Totals may exceed 100% due to multiple responses. Final Results Compiled by the NLSA on 5/1/2014 [SUBSET: Respondents that indicated they have changed their behavior in question D9a or D9b.]

Public Awareness Campaign on Climate Change and Energy Efficiency Baseline and Follow-Up Surveys 50
D9a. (Other) Which behaviours have you changed as a result of other information you have obtained on climate change and energy efficiency besides the Turn Back the Tide Campaign?
St. John's CMA
Outside St. John's CMA Total
Count % Count % Count % Take measures to conserve energy (reduce lighting/thermostats/appliance use, etc.)
54 59.3% 34 56.7% 88 58.3%
Take measures to conserve water 8 8.8% 6 10.0% 14 9.3% Drive less/refrain from letting vehicle idle 10 11.0% 9 15.0% 19 12.6% Take measures to reduce trash/ensure proper disposal of waste
12 13.2% 10 16.7% 22 14.6%
Take measures to improve energy efficiency of dwelling (solar panels, extra insulation, new doors, etc.)
9 9.9% 6 10.0% 15 9.9%
Use local/organic/environmentally friendly products/refrain from using products with harsh chemicals
∙∙∙ ∙∙∙ ∙∙∙ ∙∙∙ 9 6.0%
Grow own vegetables/plant trees or shrubs to help reduce atmospheric carbon dioxide levels
∙∙∙ ∙∙∙ ∙∙∙ ∙∙∙ ∙∙∙ ∙∙∙
Use a specific home heating source (note opinions differed on whether electricity, oil or wood has the least impact)
∙∙∙ ∙∙∙ ∙∙∙ ∙∙∙ ∙∙∙ ∙∙∙
Other 10 11.0% 8 13.3% 18 11.9% Totals may exceed 100% due to multiple responses. Final Results Compiled by the NLSA on 5/1/2014
D9b. (Other) Which behaviours have you changed as a result of information you have obtained on climate change and energy efficiency?
St. John's CMA
Outside St. John's CMA Total
Count % Count % Count % Take measures to conserve energy (reduce lighting/thermostats/appliance use, etc.)
34 54.8% 25 48.1% 59 51.8%
Take measures to conserve water ∙∙∙ ∙∙∙ ∙∙∙ ∙∙∙ 6 5.3% Drive less/refrain from letting vehicle idle 11 17.7% 8 15.4% 19 16.7% Take measures to reduce trash/ensure proper disposal of waste
8 12.9% 5 9.6% 13 11.4%
Take measures to improve energy efficiency of dwelling (solar panels, extra insulation, new doors, etc.)
9 14.5% 9 17.3% 18 15.8%
Use local/organic/environmentally friendly products/refrain from using products with harsh chemicals
∙∙∙ ∙∙∙ ∙∙∙ ∙∙∙ ∙∙∙ ∙∙∙
Grow own vegetables/plant trees or shrubs to help reduce atmospheric carbon dioxide levels
∙∙∙ ∙∙∙ ∙∙∙ ∙∙∙ ∙∙∙ ∙∙∙
Use a specific home heating source (note opinions differed on whether electricity, oil or wood has the least impact)
∙∙∙ ∙∙∙ ∙∙∙ ∙∙∙ 9 7.9%
Other ∙∙∙ ∙∙∙ ∙∙∙ ∙∙∙ 12 10.5% Totals may exceed 100% due to multiple responses. Final Results Compiled by the NLSA on 5/1/2014

Public Awareness Campaign on Climate Change and Energy Efficiency Baseline and Follow-Up Surveys 51
SECTION E – DEMOGRAPHICS
E1. Please indicate your gender.
St. John's CMA
Outside St. John's CMA Total
Count % Count % Count % Female 240 49.2% 236 53.0% 476 51.0% Male 248 50.8% 209 47.0% 457 49.0% Total 488 100.0% 445 100.0% 933 100.0%
E2. Which of the following categories best describes your age? SELECT ONE RESPONSE ONLY
St. John's CMA
Outside St. John's CMA Total
Count % Count % Count % 18 to 24 17 3.5% 13 2.9% 30 3.2% 25 to 34 91 18.6% 43 9.7% 134 14.4% 35 to 44 111 22.7% 61 13.7% 172 18.4% 45 to 54 101 20.7% 102 22.9% 203 21.8% 55 to 64 89 18.2% 95 21.3% 184 19.7% 65 or older 77 15.8% 131 29.4% 208 22.3% Prefer not to say ∙∙∙ ∙∙∙ ∙∙∙ ∙∙∙ ∙∙∙ ∙∙∙ Total 488 100.0% 445 100.0% 933 100.0%
E3. What is the highest level of education you have completed? SELECT ONE RESPONSE ONLY
St. John's CMA
Outside St. John's CMA Total
Count % Count % Count % Less than high school diploma 32 6.6% 100 22.5% 132 14.1% High school diploma 84 17.2% 122 27.4% 206 22.1% Some university/college/trade school 46 9.4% 29 6.5% 75 8.0% College/trade school diploma/certificate 157 32.2% 120 27.0% 277 29.7% Undergraduate/bachelors degree (BA, BSc, BEng, etc.)
105 21.5% 51 11.5% 156 16.7%
Graduate/masters degree (MA, MSc, MEng, etc.) 60 12.3% 17 3.8% 77 8.3% Other (specify): ∙∙∙ ∙∙∙ ∙∙∙ ∙∙∙ 9 1.0% Prefer not to say ∙∙∙ ∙∙∙ ∙∙∙ ∙∙∙ ∙∙∙ ∙∙∙ Total 488 100.0% 445 100.0% 933 100.0%
E4. What is your current marital status? SELECT ONE RESPONSE ONLY
St. John's CMA
Outside St. John's CMA Total
Count % Count % Count % Single (never married) 106 21.7% 58 13.0% 164 17.6% Married 264 54.1% 275 61.8% 539 57.8% Separated 13 2.7% 8 1.8% 21 2.3% Divorced 39 8.0% 30 6.7% 69 7.4% Common law 41 8.4% 35 7.9% 76 8.1% Widowed 23 4.7% 38 8.5% 61 6.5% Prefer not to say ∙∙∙ ∙∙∙ ∙∙∙ ∙∙∙ ∙∙∙ ∙∙∙ Total 488 100.0% 445 100.0% 933 100.0%
E5. Do you have children under the age of 18 currently living at home? St. John's CMA Outside St. John's Total

Public Awareness Campaign on Climate Change and Energy Efficiency Baseline and Follow-Up Surveys 52
CMA Count % Count % Count %
Yes 186 38.1% 114 25.6% 300 32.2% No 302 61.9% 331 74.4% 633 67.8% Total 488 100.0% 445 100.0% 933 100.0%
E6. Do you own your own home?
St. John's CMA
Outside St. John's CMA Total
Count % Count % Count % Yes 377 77.3% 374 84.0% 751 80.5% No 111 22.7% 71 16.0% 182 19.5% Total 488 100.0% 445 100.0% 933 100.0%
E7. Which of the following best describes your total household income before taxes and deductions in 2013? SELECT ONE RESPONSE ONLY
St. John's CMA
Outside St. John's CMA Total
Count % Count % Count % Less than $30,000 64 13.1% 130 29.2% 194 20.8% $30,000 to less than $60,000 116 23.8% 123 27.6% 239 25.6% $60,000 to less than $90,000 90 18.4% 71 16.0% 161 17.3% $90,000 or more 182 37.3% 88 19.8% 270 28.9% Don’t know 7 1.4% 11 2.5% 18 1.9% Prefer not to say 29 5.9% 22 4.9% 51 5.5% Total 488 100.0% 445 100.0% 933 100.0%
∙∙∙ Suppressed due to confidentiality or data quality (Count < 5)