
Public Attitudes to Trade Tracker Wave three
38
Public Attitudes to Trade Tracker Wave three Technical Report Prepared by: BMG Research September 2021
Transcript of Public Attitudes to Trade Tracker Wave three

Public Attitudes to Trade Tracker Wave three
Technical Report Prepared by: BMG Research
September 2021

2
Contents
1 Methodology note 3
1.1 Aims 3
1.2 Methodology 3
1.3 Research phasing 5
1.4 Sampling 5
1.5 Quotas 8
1.6 Questionnaire design 9
1.7 Cognitive interviewing 9
1.8 Questionnaire scripting, testing and review 10
1.9 Data collection 10
1.10 Weighting 12
1.11 Date and rate of response 14
1.12 Data processing 16
1.13 Final achieved sample composition 17
1.14 Recommended note on impact of mode changes 17
2 Survey structure 19
Introduction. 19
Section 1. Background 20
Section 2. Awareness, Engagement and Knowledge 22
Section 3. Understanding perceptions and effect on self and society 23
Section 4: CPTPP and priority countries 26
Section 5: Voter behaviour 33
Section 6: Demographics 33

3
1 Methodology note 1.1 Aims The Department for International Trade (DIT) 2021 to 2022 Outcome Delivery Plan sets out an ambitious set of trade and investment objectives for the year ahead focused on achieving four priority outcomes:
1. secure world-class free trade agreements and reduce market access barriers, ensuring that consumers and businesses can benefit from both.
2. deliver economic growth to all the nations and regions of the UK through attracting and retaining inward investment.
3. support UK business to take full advantage of trade opportunities, including those arising from delivering FTAs, facilitating UK exports.
4. champion the rules-based international trading system and operate the UK’s new trading system, including protecting UK businesses from unfair trade practices.
DIT over the last few years has set out to deliver an ambitious free trade agreement programme that benefits businesses and consumers in every part of the UK.
DIT views the UK public as an important group of stakeholders. The Public Attitudes to Trade Tracker (PATT) has been designed to help ensure that the public’s views are considered during the policy making process and to inform future communications.
In September 2018 DIT commissioned a nationally representative survey of the UK public to examine public attitudes towards trade, to understand the public’s priorities as they relate to trade policy, and to track how these may change over time.
Two waves of fieldwork have been completed to date. The first baseline wave concluded in January 2019 and the second in August 2019, and final reports have been published by DIT.
This report outlines the methodology and approach for wave three of the research1. Fieldwork for this wave was carried out between June and August 2020.
1.2 Methodology Readers should treat comparisons at wave three with data from waves one and two with additional caution. Caution should always be exercised when tracking survey data, but extra caution should be taken in this instance due to the mode changes that were introduced in Wave three.
Waves one and two of the PATT combined push-to-web invites with a face-to-face administered Computer-Assisted Self-Interviewing (CASI) approach. Each element comprised roughly 50% of the achieved sample. Due to the Covid-19 outbreak, the face-to-face fieldwork element for Wave three was unable to go ahead as originally planned.
1 The technical reports for Waves 1 and 2 of the research are available here: https://www.gov.uk/government/publications/public-attitudes-to-trade-tracker-wave-1 https://www.gov.uk/government/publications/public-attitudes-to-trade-tracker-patt-wave-2
4
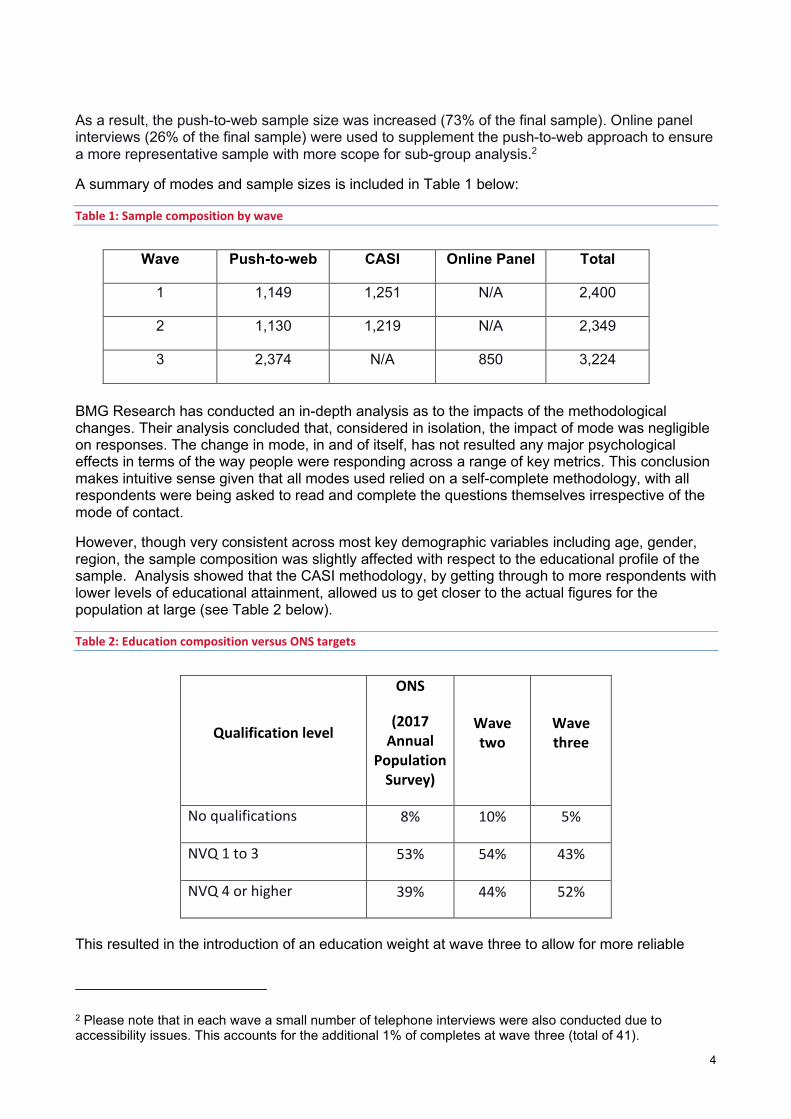
As a result, the push-to-web sample size was increased (73% of the final sample). Online panel interviews (26% of the final sample) were used to supplement the push-to-web approach to ensure a more representative sample with more scope for sub-group analysis.2
A summary of modes and sample sizes is included in Table 1 below:
Table 1: Sample composition by wave
Wave Push-to-web CASI Online Panel Total
1 1,149 1,251 N/A 2,400
2 1,130 1,219 N/A 2,349
3 2,374 N/A 850 3,224
BMG Research has conducted an in-depth analysis as to the impacts of the methodological changes. Their analysis concluded that, considered in isolation, the impact of mode was negligible on responses. The change in mode, in and of itself, has not resulted any major psychological effects in terms of the way people were responding across a range of key metrics. This conclusion makes intuitive sense given that all modes used relied on a self-complete methodology, with all respondents were being asked to read and complete the questions themselves irrespective of the mode of contact.
However, though very consistent across most key demographic variables including age, gender, region, the sample composition was slightly affected with respect to the educational profile of the sample. Analysis showed that the CASI methodology, by getting through to more respondents with lower levels of educational attainment, allowed us to get closer to the actual figures for the population at large (see Table 2 below).
Table 2: Education composition versus ONS targets
Qualification level
ONS
(2017 Annual
Population Survey)
Wave two
Wave three
No qualifications 8% 10% 5%
NVQ 1 to 3 53% 54% 43%
NVQ 4 or higher 39% 44% 52%
This resulted in the introduction of an education weight at wave three to allow for more reliable
2 Please note that in each wave a small number of telephone interviews were also conducted due to accessibility issues. This accounts for the additional 1% of completes at wave three (total of 41).

5
comparisons across waves.3 It is worth noting that this new weight did not drastically change the final reported figures. Rather the effect was more marginal, ranging between 1% and 3% points, and tending to slightly reduce levels support, interest and positivity around free trade and free trade agreements. It is also worth noting that most of the differences were accounted for by a small rise in the proportions saying don’t know or neither, rather than necessarily an increase at the opposite end of the scale.
Given these changes to methodology, whilst BMG has concluded that tracking against waves one and two can still be done credibly, small shifts - even if statistically significant - should be treated with additional caution and without strong emphasis.
1.3 Research phasing The research was administered by BMG Research. Timings of wave three of the research were as follows:
• cognitive interviews: 20 February to 28 February 2020
• main stage fieldwork push-to-web: 15 June 2020 to 23 August 2020
• main stage fieldwork online panel: 29 July 2020 to 14 August 2020
1.4 Sampling The PATT sample frame is designed to be representative of private households in the United Kingdom.
The survey sample was drawn via two different approaches to cater for the mixture of methodologies.
1.4.1 Push-to-web sample frame The push-to-web sample was selected via a stratified random probability design proportional to the UK population (with sample boosts in Northern Ireland, Scotland, and Wales). With the exception of the increased number of sampled addresses, this approach is consistent with the approach employed in waves one and two.
The Great Britain sample frame was drawn from the Royal Mail’s small users Postcode Address File (PAF). The small users PAF is limited to addresses which receive, on average, fewer than 50 items of post per day and which are not flagged with Royal Mail’s “organisation code”. An updated version of this list is obtained twice a year.
By using only the small-user delivery points, most large institutions and businesses are excluded from the sample. Small-user delivery points which are flagged as small business addresses are also excluded. However, some small businesses and other ineligible addresses remain on the sampling frame and if these were selected, the letters were returned to BMG as undelivered and recorded as ineligible.
The sampling frame employed for addresses in Northern Ireland is the Pointer address database. Pointer is the most comprehensive and authoritative address database in Northern Ireland, with approximately 650,000 address records available for selection. This list of domestic properties is
3 Results from waves one and two were not retrospectively adjusted.
6
maintained by Land and Property Services (LPS), with input from Local Councils, Royal Mail and Ordnance Survey of Northern Ireland (OSNI).
A systematic random sample of addresses was selected for Northern Ireland from the Pointer address database. Addresses are sorted by district council and ward, so the sample is effectively stratified geographically.
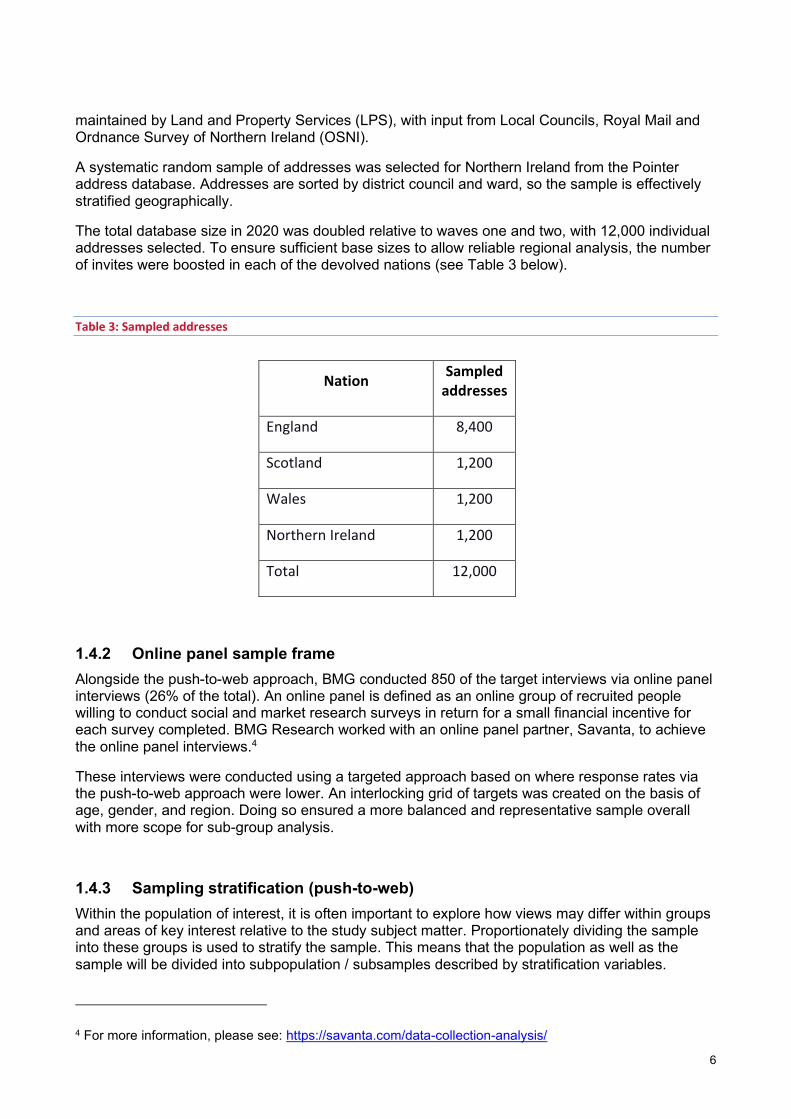
The total database size in 2020 was doubled relative to waves one and two, with 12,000 individual addresses selected. To ensure sufficient base sizes to allow reliable regional analysis, the number of invites were boosted in each of the devolved nations (see Table 3 below).
Table 3: Sampled addresses
Nation Sampled
addresses
England 8,400
Scotland 1,200
Wales 1,200
Northern Ireland 1,200
Total 12,000
1.4.2 Online panel sample frame Alongside the push-to-web approach, BMG conducted 850 of the target interviews via online panel interviews (26% of the total). An online panel is defined as an online group of recruited people willing to conduct social and market research surveys in return for a small financial incentive for each survey completed. BMG Research worked with an online panel partner, Savanta, to achieve the online panel interviews.4
These interviews were conducted using a targeted approach based on where response rates via the push-to-web approach were lower. An interlocking grid of targets was created on the basis of age, gender, and region. Doing so ensured a more balanced and representative sample overall with more scope for sub-group analysis.
1.4.3 Sampling stratification (push-to-web) Within the population of interest, it is often important to explore how views may differ within groups and areas of key interest relative to the study subject matter. Proportionately dividing the sample into these groups is used to stratify the sample. This means that the population as well as the sample will be divided into subpopulation / subsamples described by stratification variables.
4 For more information, please see: https://savanta.com/data-collection-analysis/

7
A 240-cell sample stratification matrix was devised for the PATT study, with the targets within each cell informed by the 2019 ONS mid-year population estimates5. This was entirely consistent with the selection process utilised in waves one and two.
Using pre-set targets within each sample stratification cell for ‘initial sample drawn’, the sample was drawn on a '1 in n' basis. These cells are listed below in Table 4.
Table 4: Variables used in sample stratification
Variables used in the sample stratification Region
English region / devolved nation East Midlands
East of England
London
North East
North West
South East
South West
West Midlands
Yorkshire and The Humber
Scotland
Northern Ireland
Wales
Urban / Rural (multiplied by 2 classifications)
Urban
Rural
Indices of Multiple Deprivation (IMD; 10 deciles)
1-10 (deciles)
1.4.4 Quota sampling and probability sampling The aim of probability sampling is to generalise, or make inferences, about the whole population sampled from, and to be able to quantify the precision of this inference. The statistical theory which
5 Details of ONS 2019 Mid-year estimates can be found here https://www.ons.gov.uk/peoplepopulationandcommunity/populationandmigration/populationestimates/datasets/analysisofpopulationestimatestool

8
underpins this only applies if the sample is unbiased – that is, there is no systematic difference from the ‘true’ population – and each respondent in the population has a known non-zero probability of selection.
The PATT survey uses a mix of both probability and quota sampling. The push-to-web component relies on stratified random probability approach, and whilst overall targets are used to compare the achieved results to identify the extent to which non-response bias is affecting the sample, no formal quotas are set. Meanwhile, the online panel component relies on quota sampling, with age, gender and region quota targets created based on where higher levels of non-response are identified from the push to web-component.
Readers should note that there are a number of issues with using formal statistical significance tests on quota sample data, for example bias and lack of known sampling probability. Strictly speaking, confidence intervals cannot be applied to quota samples because they do not use equal or known probabilities of selection. However, it is common practice to derive them. This can give some indication of the relative levels of variation to help users of the data understand that the percentages provided are statistics, not absolute numbers.
1.5 Quotas When utilising a split sample of push-to-web and online panel interviews, a number of controls need to be put in place to guarantee a balanced final sample. This is most related to the response rates and timeliness of response from push-to-web sample.
Regional quotas were defined as set out in Table 5. Additional boosts within devolved nations were established to allow for representative bases within each country for robust analysis which brought the final target sample size up to 3,200.
Table 5: Country targets
Devolved Nation Natural Fallout
from 2,850 Sample
Boost Total Margin of Error (MoE) (95%)6
England Approximately 2,400 0 2,400 2.00
Scotland Approximately 225 75 300 5.67
Wales Approximately 140 135 275 5.91
Northern Ireland Approximately 85 140 225 6.53 Total 2,850 350 3,200 1.73
Regional quotas were established, which interlocked between age and gender. These were based on ONS 2019 mid-year population estimates. The exact targets are outlined below in Table 4.
Based on the rate of initial push-to-web completes received and the frequencies of geographic and demographic categories that responded, proportional quotas were then modelled for the online panel sample. This meant that residents could be targeted by the required geographies and demographics.
6 The margin of sampling error describes how close we can reasonably expect a survey result to fall relative to the true population value.
9
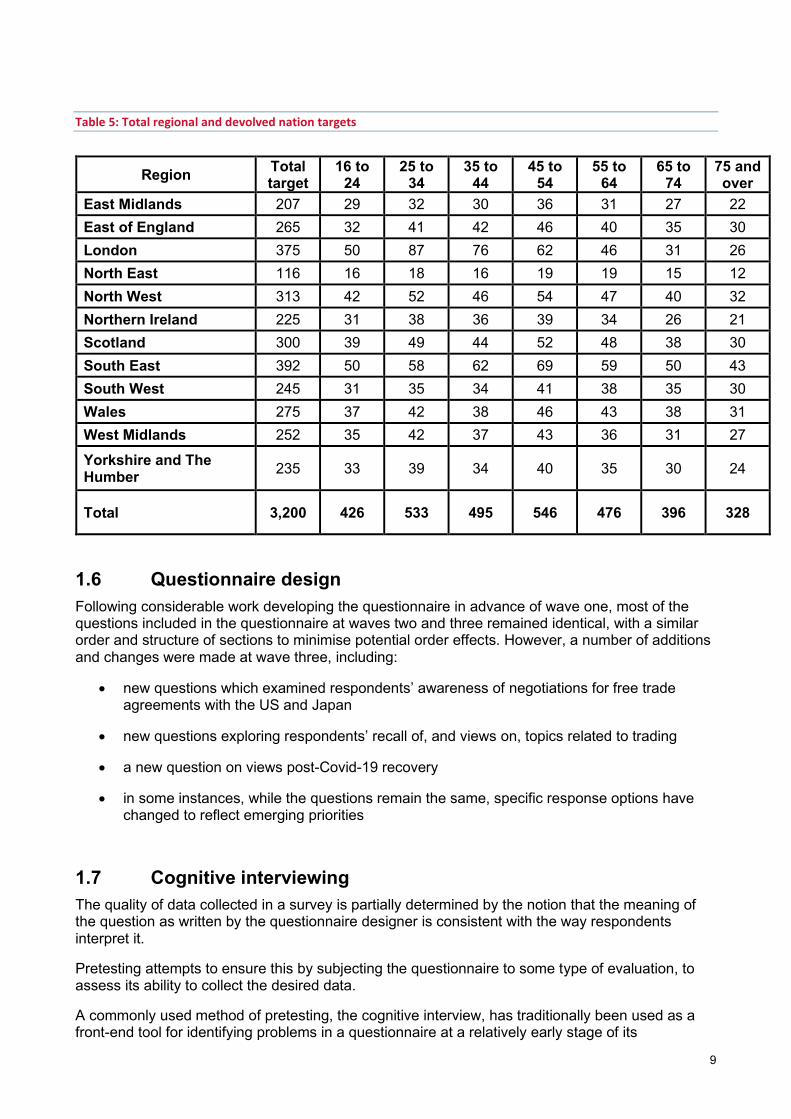
Table 5: Total regional and devolved nation targets
Region Total target
16 to 24
25 to 34
35 to 44
45 to 54
55 to 64
65 to 74
75 and over
East Midlands 207 29 32 30 36 31 27 22 East of England 265 32 41 42 46 40 35 30 London 375 50 87 76 62 46 31 26 North East 116 16 18 16 19 19 15 12 North West 313 42 52 46 54 47 40 32 Northern Ireland 225 31 38 36 39 34 26 21 Scotland 300 39 49 44 52 48 38 30 South East 392 50 58 62 69 59 50 43 South West 245 31 35 34 41 38 35 30 Wales 275 37 42 38 46 43 38 31 West Midlands 252 35 42 37 43 36 31 27
Yorkshire and The Humber 235 33 39 34 40 35 30 24
Total 3,200 426 533 495 546 476 396 328
1.6 Questionnaire design Following considerable work developing the questionnaire in advance of wave one, most of the questions included in the questionnaire at waves two and three remained identical, with a similar order and structure of sections to minimise potential order effects. However, a number of additions and changes were made at wave three, including:
• new questions which examined respondents’ awareness of negotiations for free trade agreements with the US and Japan
• new questions exploring respondents’ recall of, and views on, topics related to trading
• a new question on views post-Covid-19 recovery
• in some instances, while the questions remain the same, specific response options have changed to reflect emerging priorities
1.7 Cognitive interviewing The quality of data collected in a survey is partially determined by the notion that the meaning of the question as written by the questionnaire designer is consistent with the way respondents interpret it.
Pretesting attempts to ensure this by subjecting the questionnaire to some type of evaluation, to assess its ability to collect the desired data.
A commonly used method of pretesting, the cognitive interview, has traditionally been used as a front-end tool for identifying problems in a questionnaire at a relatively early stage of its

10
development. Currently, cognitive interviewing7 is the most widely used pretesting tool, in which respondents are asked to report directly on the internal cognitive processes employed to answer survey questions. Interviewers often probe the meaning of specific terms or the intent of specific questions throughout the interview. Generally, only a very small number of purposively chosen respondents are interviewed and the results are not generalisable to a larger population.
For wave three, a total of 21 questions were tested in 10 verbal cognitive interviews. Given that extensive testing had been conducted at wave one, the questions tested focussed on potential new additions and amended questions.
Interviews were conducted either face-to-face or via telephone between 20 February and 28 February 2020. Cognitive interview participants completed the interviews via telephone and were emailed a copy of the questionnaire prior to the interview. Participants completing the interview face-to-face were asked to complete the cognitive interview using paper versions of the cognitive specific survey.
Interviews were conducted with a broad demographic and regional mix of participants.
Interviews followed a verbal probe approach using a semi-concurrent probing technique. Participants were asked to complete the survey in sections. Following each section, participants were asked about their experiences when answering each of the questions in the previous section. Many probes were tailored to be question specific, but typical probes included:
• how did you find answering this question?
• can you tell me in your own words what the question was asking?
• how easy or difficult did you find this question to answer?
• what did [insert question or response term] mean to you?
The changes recommended were mostly nuances to question wording to enable greater audience comprehension, alongside minor routing edits.
1.8 Questionnaire scripting, testing and review The final scripted questionnaire was signed-off and the survey was launched with the initial letter being sent to sampled households.
Based on the survey completes from the initial push-to-web invite, interim top-line results were extracted and reviewed to ‘sense-check’ the data, the number of valid responses, and variance in response distribution ahead of agreement on the study being fully launched.
1.9 Data collection Push-to-web All 12,000 sampled households were sent an initial invitation and reminder letters were sent to those who had not yet completed the survey. The letters contained information about the purpose
7 Examining the complex psychological processes involved in answering different types of survey questions https://www.researchgate.net/publication/261815491_The_Psychology_of_Survey_Response_by_Roger_Tourangeau_Lance_J_Rips_Kenneth_Rasinski

11
of the survey, instructions on what to do including login details, and contact details for the BMG Research support line should they have difficulties taking part. This included a freephone number, email address and Frequently Asked Questions (FAQs) on the BMG website.
Table 6. Invitations and reminders
Letter sent Number of letters sent
Number of completed surveys
Response rate of letters sent
Initial invitation 12,000 959 7.9%
1st reminder 11,099 873 7.9%
2nd reminder 9,936 542 5.5%
Out of the 12,000 letter invitations posted, 2,374 responded via push to web, which gave a response rate of 20%. In our experience, this response rate is in line with or even slightly higher than similar surveys with full governmental branding.
To ensure sufficient bases for all devolved nations, the main sample was boosted in each of the devolved nations. Completes in each region, including comparative figures for waves one and two, are outlined in Table 6 and Figure 1.
Table 6: Total unweighted and weighted completes
Region Wave 1:
Unweighted Counts
Wave 2: Unweighted
Counts
Wave 3: Unweighted
Counts
Wave 1: Weighted Counts
Wave 2: Weighted Counts
Wave 3: Weighted Counts
England 1,819 1,747 2,410 2,017 1,973 2,708
Scotland 202 202 302 202 198 272
Wales 213 203 282 115 113 155
Northern Ireland 166 197 230 66 65 89
Total 2,400 2,349 3,224 2,400 2,349 3,224

12
Figure 1: Geographic distribution of Public Attitudes Tracker sample (unweighted)
Unweighted base: All respondents (3,224)
1.10 Weighting Weights are applied to survey data to ensure that they match the profile of the population of interest (in this case national representativeness of the UK public).
1.10.1 Weighting schema Results were merged and calibration weighting applied to the profile of UK adults.
Weighting targets were defined by:
• 2019 ONS Mid-year population estimates: proportional by Age, Gender and Region8
• Indices of Multiple Deprivation (IMD)9
• statistics from the Electoral Commission on EU Referendum Vote10
• education level (an addition for this wave, see discussion on page 4 above), with targets taken from the 2017 Annual Population Survey11
8 Details of ONS 2019 Mid-year population estimates can be found here: https://www.ons.gov.uk/peoplepopulationandcommunity/populationandmigration/populationestimates 9 Details of Indices of Multiple Deprivation (IMD) statistics can be found here: https://www.gov.uk/government/statistics/english-indices-of-deprivation-2015 10 Details of The Electoral Commission EU Referendum results can be found here: https://www.electoralcommission.org.uk/who-we-are-and-what-we-do/elections-and-referendums/past-elections-and-referendums/eu-referendum/results-and-turnout-eu-referendum 11 Details of the Annual Population survey can be found here: Annual population survey (APS) QMI - Office for National Statistics
3%
7%
7%
7%
8%
9%
9%
9%
9%
9%
9%
13%
North EastEast MidlandsWest Midlands
Northern IrelandYorkshire and The Humber
WalesSouth West
East of EnglandLondon
North WestScotland
South East

13
Table 7, below, outlines the effective sample sizes post weighting across each region12:
Table 7: Country effective sample sizes
Region Unweighted sample size Effective sample size Effective Proportion
England 2,410 2,190 91% Scotland 302 256 85% Wales 282 242 86% Northern Ireland 230 177 77% Total 3,224 2,396 74%
Tables 8, 9 and 10, below, outline the weighted composition of the final sample by age, gender, region, and EU Referendum Vote.
Table 8: Country population weight
Age England Scotland Wales Northern Ireland
Male 16 to 24 13.55% 13.53% 14.07% 14.57% 25 to 34 16.64% 16.17% 14.72% 16.81% 35 to 44 15.53% 14.82% 13.51% 16.26% 45 to 54 17.24% 17.80% 17.00% 17.73% 55 to 64 13.89% 15.42% 14.96% 14.25% 65 to 74 12.28% 14.21% 17.09% 14.52% 75 and over 9.59% 7.20% 7.74% 5.68%
Total Male - 100% 100% 100% 100% Female 16 to 24 13.09% 12.92% 13.26% 13.76%
25 to 34 16.48% 15.78% 14.50% 16.54% 35 to 44 15.60% 14.56% 13.78% 16.25% 45 to 54 17.19% 17.69% 17.00% 17.59% 55 to 64 14.02% 15.25% 15.16% 14.17% 65 to 74 12.29% 12.50% 13.87% 11.40% 75 and over 11.33% 11.30% 12.43% 10.29% Total Female - 100% 100% 100% 100%
12 Please note that the overall effective sample size is reduced by the oversampling in each devolved nation. This was an intentional component of the research design.

14
Table 9: Region proportional population weight
Region Weight East 9%
East Midlands 7%
London 13%
North East 4%
North West 11%
Northern Ireland 3%
Scotland 8%
South East 14%
South West 9%
Wales 5%
West Midlands 9%
Yorkshire and The Humber 8%
Total 100%
Table 10: EU Referendum voting behaviour weight
Table 11: Education weight
1.11 Date and rate of response As illustrated below in Figure 2, spikes in numbers of completes can be attributed to the sending of initial invitation letters and subsequent rounds of reminder letters, each instigating a near-instant response. Compared to waves one and two, the responses following the invitation letter and reminder letters were more staggered, with two peaks for each letter sent. This is likely the result of the impact of Covid-19 on the postal service in the UK, resulting in households receiving letters over a slightly longer period.
EU Referendum Vote Weight Leave 37.44%
Remain 34.71%
Did not vote 27.85%
Total 100%
Education level Weight No qualifications 8% NVQ1 to 3 53% NVQ4 or higher 39%
Total 100%

15
Reminder 1 Reminder 2
Figure 2: Number of Push-to-web completions
0
50
100
150
200
250
15-Jun 22-Jun 29-Jun 06-Jul 13-Jul 20-Jul 27-Jul 03-Aug 10-Aug 17-Aug
Rate of push-to-web completes

16
Fieldwork for the online panel component was conducted to coincide with push-to-web households receiving the final reminder (third mailing). This allowed for targeting based on where groups were underrepresented in the push-to-web sample at the time. A small initial pilot of the online panel approach was conducted from 31 July to 3 August to ensure there were no errors in the script and data was being collected as intended. Fieldwork for the online panel approach then launched in full on 5 August 2020. Figure 3 shows panel completions occurring over this time period.
Figure 3: Number of Panel CAWI completions by date
1.12 Data processing With the exception of the coding of responses to open-ended questions, no data entry phase was required for this survey. The programmed script ensured that all question routing was performed automatically, and no post-editing of the data was required in the way that might be necessary for surveys administered using a ‘Pencil and Paper’ method.
Responses from fully open-ended questions were collated and code frames created to reflect all key themes in the responses. Responses from questions with an ‘other – specify’ option were analysed and, if appropriate, back-coded into one of the pre-coded categories. If the response could not be assigned to an existing code but gained a sufficient number of mentions, a new code was created which all relevant responses were assigned to. Coding was carried out by a specialist team. All coders who worked on the study were briefed on the subject matter of the study and a written set of instructions was made available to ensure accuracy. Code frames were created by the coding team in the first instance and approved by the research team.
0
20
40
60
80
100
120
140
160
180
200
15-Jun 22-Jun 29-Jun 06-Jul 13-Jul 20-Jul 27-Jul 03-Aug 10-Aug 17-Aug
Rate of panel completions

17
1.13 Final achieved sample composition
Region Target 16 to 24
25 to 34
35 to 44
45 to 54
55 to 64
65 to 74
75 and over
East Midlands 212 27 28 38 36 28 33 21 East of England 297 33 46 41 46 55 43 30 London 298 36 65 65 61 28 20 21 North East 108 11 17 18 19 17 16 9 North West 299 36 50 43 50 39 49 27 Northern Ireland 230 16 31 43 42 48 35 14 Scotland 302 32 53 42 49 62 41 20 South East 433 42 35 57 68 81 86 54 South West 283 25 37 38 39 59 41 41 Wales 302 32 53 42 49 62 41 20 West Midlands 229 30 39 37 36 31 31 23 Yorkshire and The Humber 251 29 40 35 42 49 32 20
Total 3,224 345 482 494 532 548 482 303
1.14 Recommended note on impact of mode changes 1.14.1 Long version Readers should treat comparisons at wave three with data from waves one and two with additional caution. Caution should always be exercised when tracking survey data, but extra caution should be taken in this instance due to the mode changes that were introduced in Wave three. Waves one and two of the PATT combined push-to-web invites with a face-to-face administered CASI approach. Each element comprised roughly 50% of the achieved sample. Due to the Covid-19 outbreak, the face-to-face fieldwork element for Wave three was unable to go ahead as originally planned. As a result, the push-to-web sample size was increased (73% of the final sample). Online panel interviews (26% of the final sample) were used to supplement the push-to-web approach to ensure a more representative sample with more scope for sub-group analysis.13 BMG Research has conducted an in-depth analysis as to the impacts of the change. Their analysis concluded that, considered in isolation, the impact of mode was negligible on responses. However, though very consistent across most key demographic variables, the sample composition was slightly affected with respect to the educational profile of the sample. This resulted in the introduction of an education weight at wave three to allow for more reliable comparisons across waves. Accordingly, whilst BMG has concluded that tracking against waves one and two can still be done so credibly, small shifts - even if statistically significant - should be treated with additional caution and without strong emphasis. 1.14.2 Shortened version Due to changes in our survey modes used as a result of the Covid-19 pandemic, readers should treat comparisons at wave three with data from waves one and two with additional caution. Whilst BMG has concluded that tracking against Waves one and two can still be done so credibly, small
13 Please note that in each wave a small number of telephone interviews were also conducted due to accessibility issues. This accounts for the additional 1% of completes at wave three.

18
shifts - even if statistically significant - should be treated with additional caution and without strong emphasis.

19
2 Survey structure Introduction. Thank you for agreeing to take part in this survey for the Department for International Trade (DIT). We would like to ask you a few questions to understand your thoughts about how the UK trades with countries around the world following the Covid-19 outbreak. The survey takes on average 15 minutes to complete. All responses are treated confidentially, and all results will be anonymised. BMG Research are company partners of the Market Research Society (MRS) and abide by their rules. If you would like to check that BMG is a genuine market research agency you can do so by visiting the MRS website: www.mrs.org.uk/company_partner/company_partner_members. Details about what we will do with the information collected can be found in our privacy notice here: www.bmgresearch.co.uk/privacy -------------------------------------------------------------------------------------------------------------------------------------- Under General Data Protection Regulation (GDPR), we need your permission to use the survey results on certain topics. By clicking the next button, you agree to participate in the survey and for BMG to process all information collected. Click here to begin the survey ARROW/ CHECK BOX

20
Section 1. Background Firstly, a few quick questions about you…
Ask all S1. What is your gender? [Single Response]
Male 1 Female 2 Other 3 Prefer not to say 4
Ask all S2. Which of the following age brackets do you fit into? [Single Response]
15 or below Screenout 16-17 1 18-24 2 25-34 3 35-44 4 45-54 5 55-64 6 65-74 7 75+ 8 PNTS 9
ASK ALL, SINGLE RESPONSE
Region. Where do you live?

21
East Midlands 1
East of England 2
London 3
North East England 4
North West England 5
South East England 6
South West England 7
West Midlands 8
Yorkshire and the Humber 9
Northern Ireland 10
Scotland 11
Wales 12
Other Screenout
ASK ALL, SINGLE RESPONSE
ProvidePostcode. This survey requires respondents to give their full postcode. Are you happy to provide this?
This information will only be used for statistical purposes to analyse the results by specific areas, such as Local Authority, Constituency and Government areas. Asking for your postcode saves you time and helps us to report more accurate information. All answers will be treated entirely anonymously and postcode information will not be used for any other purpose.
Yes 1
No 2
SCREENOUT IF ProvidePostcode =2
ASK ALL, OPEN RESPONSE
Postcode. Could you please provide your full UK postcode? Please ensure to include a space where applicable, e.g. AB1 2CD

22
________________________
Section 2. Awareness, Engagement and Knowledge [Section GRIDs IK1 and IK2 to have randomised order]
Ask all IK1. How interested would you say are in … [Single Response – rotate options and flip scale scales consistent for each participant] Very
interested Fairly interested
Not very interested
Not at all interested
how the UK trades with countries outside the European Union
how the UK trades with countries in the European Union
UK foreign affairs
the UK economy
the UK’s approach to environmental issues
Ask all IK2. How knowledgeable would you say you currently are about… [Single Response – rotate options and flip scale scales consistent for each participant] Very
knowledgeable Fairly knowledgeable
Not very knowledgeable
Not at all knowledgeable
how the UK trades with countries outside the European Union
how the UK trades with countries in the European Union
UK foreign affairs
the UK economy
the UK’s approach to environmental issues
Ask all
23
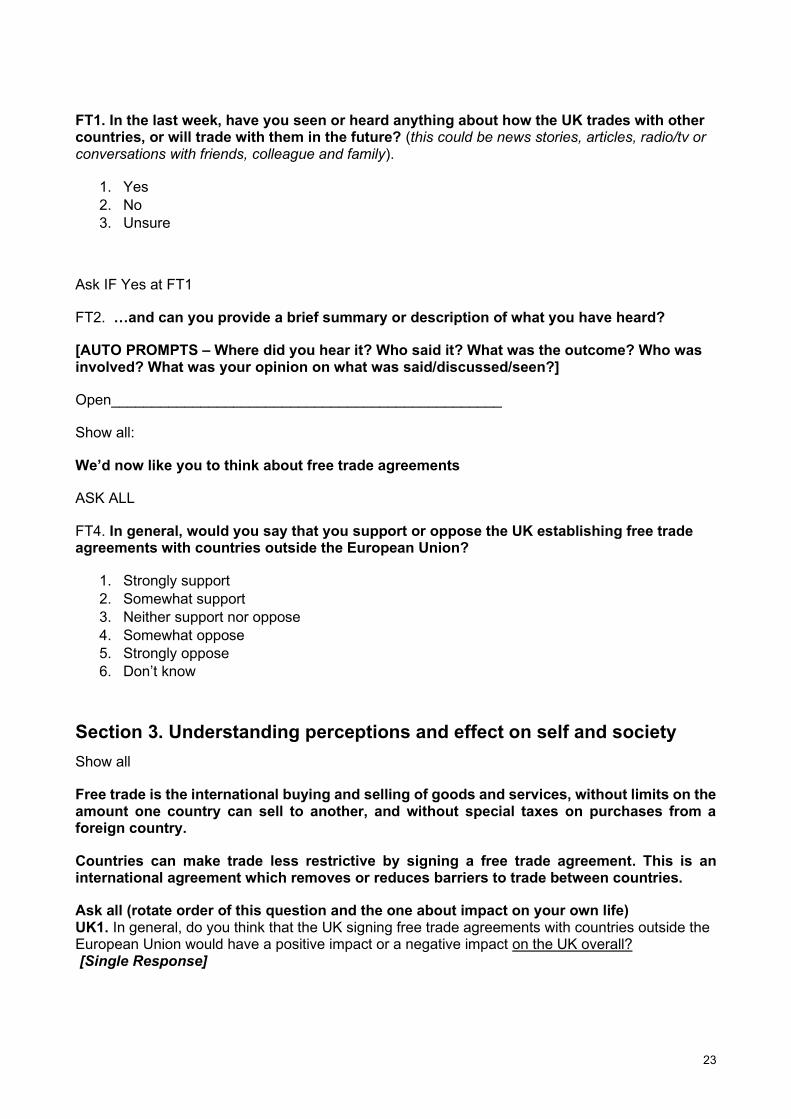
FT1. In the last week, have you seen or heard anything about how the UK trades with other countries, or will trade with them in the future? (this could be news stories, articles, radio/tv or conversations with friends, colleague and family).
1. Yes 2. No 3. Unsure
Ask IF Yes at FT1
FT2. …and can you provide a brief summary or description of what you have heard?
[AUTO PROMPTS – Where did you hear it? Who said it? What was the outcome? Who was involved? What was your opinion on what was said/discussed/seen?]
Open________________________________________________
Show all:
We’d now like you to think about free trade agreements
ASK ALL
FT4. In general, would you say that you support or oppose the UK establishing free trade agreements with countries outside the European Union?
1. Strongly support 2. Somewhat support 3. Neither support nor oppose 4. Somewhat oppose 5. Strongly oppose 6. Don’t know
Section 3. Understanding perceptions and effect on self and society Show all
Free trade is the international buying and selling of goods and services, without limits on the amount one country can sell to another, and without special taxes on purchases from a foreign country.
Countries can make trade less restrictive by signing a free trade agreement. This is an international agreement which removes or reduces barriers to trade between countries.
Ask all (rotate order of this question and the one about impact on your own life) UK1. In general, do you think that the UK signing free trade agreements with countries outside the European Union would have a positive impact or a negative impact on the UK overall? [Single Response]

24
Very positive impact 1 Fairly positive impact 2 No impact 3 Fairly negative impact 4 Very negative impact 5 Don’t know 6
ASK IF 1-5 UK1. UK1a. You stated that the UK signing free trade agreements with countries outside the European Union would have a [pipe in previous response from UK1] on the UK. What makes you say this? [AUTO PROMPTS - Why is that? Can you expand a little further?] Open ________________________________________________
Ask all UK2. In general, do you think that the UK signing free trade agreements with countries outside the European Union would have a positive impact or a negative impact on you and your daily life? [Single Response]
Very positive impact 1 Fairly positive impact 2 No impact 3 Fairly negative impact 4 Very negative impact 5 Don’t know 6
Ask all ASK IF 1-5 UK2. UK2a. You stated that the UK signing free trade agreements with countries outside the European Union would have a [pipe in previous response from UK2] on you and your daily life. What makes you say this? [AUTO PROMPTS - Why is that? Can you expand a little further?] Open ________________________________________________
UK3-UK6 SCALES FLIPPED IN CONJUNCTION WITH ONE ANOTHER Ask all UK3. Now thinking about both the UK as a whole and then just your local area, do you think that increased free trade would result in more jobs being created overall, or fewer jobs being created overall? [Single Response]
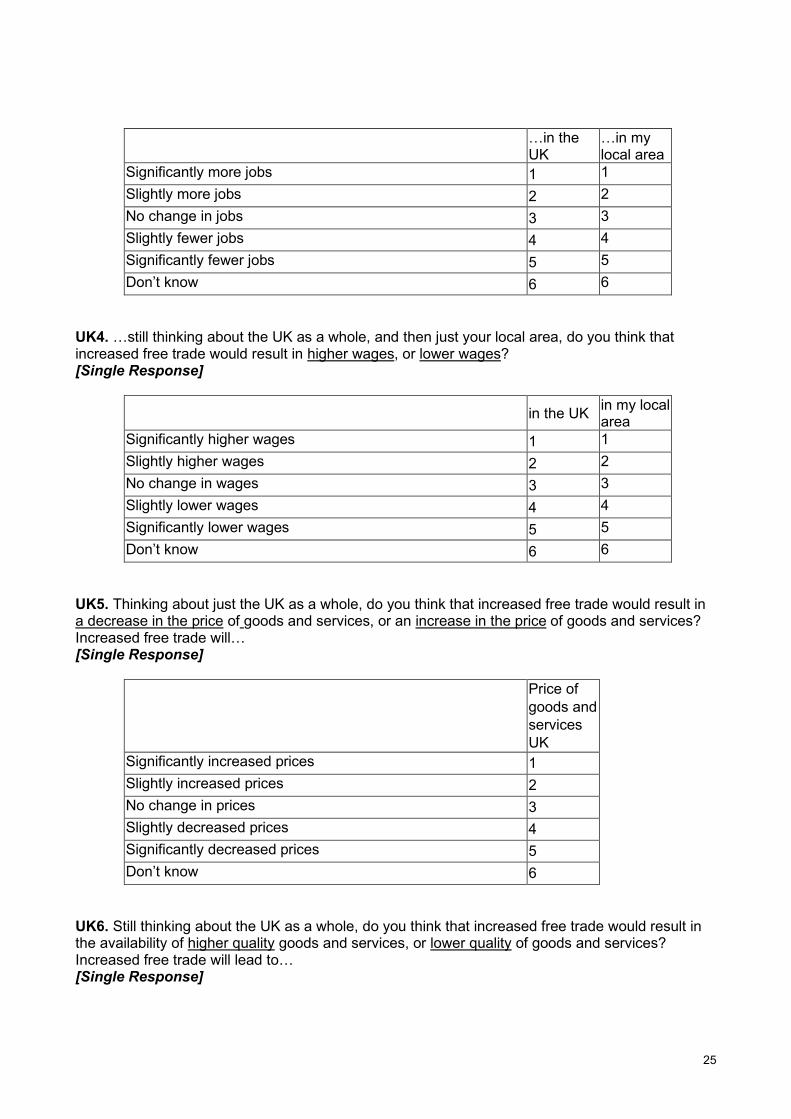
25
…in the
UK …in my local area
Significantly more jobs 1 1 Slightly more jobs 2 2 No change in jobs 3 3 Slightly fewer jobs 4 4 Significantly fewer jobs 5 5 Don’t know 6 6
UK4. …still thinking about the UK as a whole, and then just your local area, do you think that increased free trade would result in higher wages, or lower wages? [Single Response]
in the UK in my local area
Significantly higher wages 1 1 Slightly higher wages 2 2 No change in wages 3 3 Slightly lower wages 4 4 Significantly lower wages 5 5 Don’t know 6 6
UK5. Thinking about just the UK as a whole, do you think that increased free trade would result in a decrease in the price of goods and services, or an increase in the price of goods and services? Increased free trade will… [Single Response]
Price of goods and services UK
Significantly increased prices 1 Slightly increased prices 2 No change in prices 3 Slightly decreased prices 4 Significantly decreased prices 5 Don’t know 6
UK6. Still thinking about the UK as a whole, do you think that increased free trade would result in the availability of higher quality goods and services, or lower quality of goods and services? Increased free trade will lead to… [Single Response]

26
Quality of goods in the UK
Significantly higher quality 1 Slightly higher quality 2 No change in quality 3 Slightly lower quality 4 Significantly lower quality 5 Don’t know 6
CG.
Which of the following best describes your view of the quality of consumer goods from the following countries?
Please tick one option per row
Very poor quality
Poor quality
Neither poor nor good
Good quality
Very good quality
Don’t know
USA
China
Australia
New Zealand
India
Japan
INV: Businesses often invest in other countries. To what extent do you support or oppose foreign businesses investing in the UK?
1. Strongly support 2. Somewhat support 3. Neither support nor oppose 4. Somewhat oppose 5. Strongly oppose 6. Don’t know
Section 4: CPTPP and priority countries Ask all CPTPP. How aware are you of the Comprehensive and Progressive Agreement for Trans-Pacific Partnership (CPTPP) formerly known as Trans-Pacific Partnership (TPP)?

27
[Single Response– reverse scale order for ½ of the sample]
I know a great deal about the CPTPP or the TPP 1 I know a fair amount about the CPTPP or the TPP 2 I know a little about the CPTPP or the TPP 3 Have heard of the name, but know nothing about the CPTPP or the TPP 4
Never heard of the CPTPP or the TPP 5
Show only if answered code 1 -3.
The Comprehensive and Progressive Agreement for Trans-Pacific Partnership (CPTPP) is a Free Trade Agreement between 11 countries in the Asia-Pacific region. These are; Australia, Brunei, Canada, Chile, Japan, Malaysia, Mexico, New Zealand, Peru, Singapore and Vietnam. The agreement came into force in December 2018.
Ask only if answered code 1 -3 at question CPTTP CPTPPA. To what extent would you support or oppose the UK joining the CPTPP? [Single Response – alternate scale order for ½ of the sample]
Strongly support 1 Somewhat support 2 Neither support nor oppose 3 Somewhat oppose 4 Strongly oppose 5 Don’t know 6
Ask all TP2. To what extent would you support or oppose the UK establishing a free trade agreement with each of the following countries? [Single Response per row] Strongly
support Somewhat
support Neither
support nor oppose
Somewhat oppose
Strongly oppose
Don’t know
United States of America Australia New Zealand China India Japan
(show both TP2c and TP2d on the same page)
Split sample for these questions and for appeal question (TP2e). Ask about 2 countries.
TP2c. Please select up to three considerations you think the UK government should be giving the highest priority to when negotiating free trade agreements with the following countries?
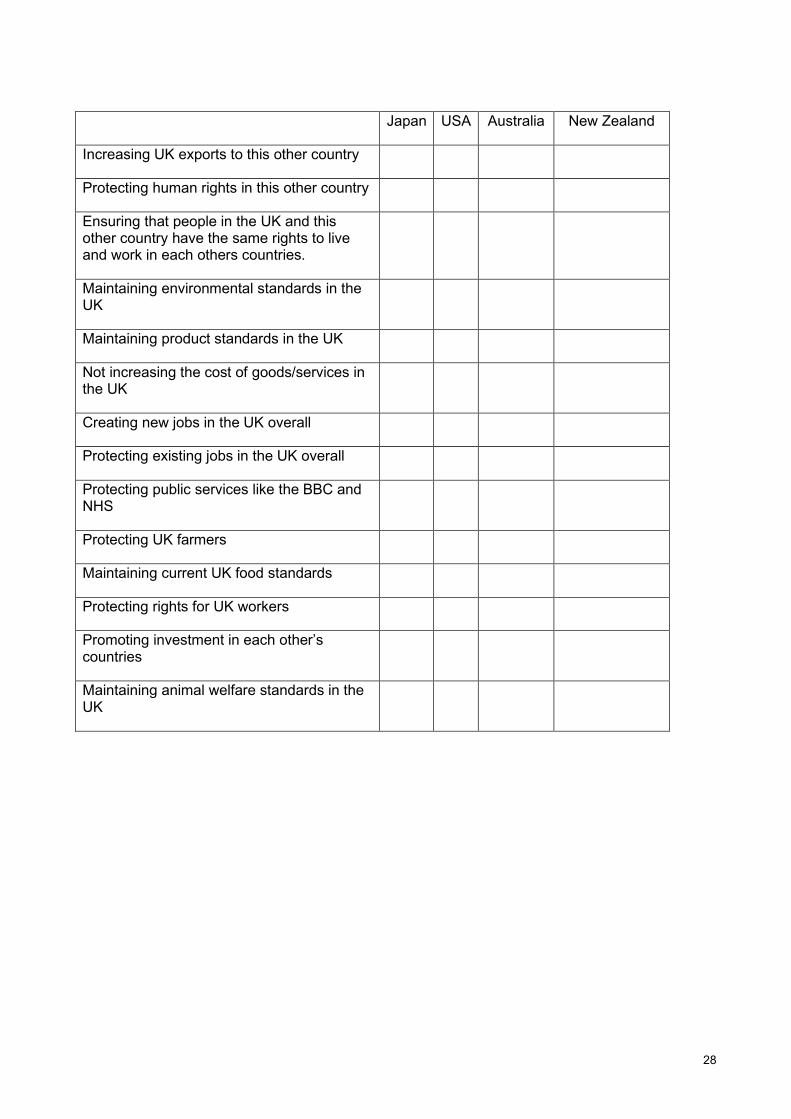
28
Japan USA Australia New Zealand
Increasing UK exports to this other country
Protecting human rights in this other country
Ensuring that people in the UK and this other country have the same rights to live and work in each others countries.
Maintaining environmental standards in the UK
Maintaining product standards in the UK
Not increasing the cost of goods/services in the UK
Creating new jobs in the UK overall
Protecting existing jobs in the UK overall
Protecting public services like the BBC and NHS
Protecting UK farmers
Maintaining current UK food standards
Protecting rights for UK workers
Promoting investment in each other’s countries
Maintaining animal welfare standards in the UK

29
TP2d. Please select up to three considerations you think the UK government should be giving the least priority to when negotiating free trade agreements with the following countries?
Japan USA Australia New Zealand
Increasing UK exports to this other country
Protecting human rights in this other country
Ensuring that people in the UK and this other country have the same rights to live and work in each others countries.
Maintaining environmental standards in the UK
Maintaining product standards in the UK
Not increasing the cost of goods/services in the UK
Creating new jobs in the UK overall
Protecting existing jobs in the UK overall
Protecting public services like the BBC and NHS
Protecting UK farmers
Maintaining current UK food standards
Protecting rights for UK workers
Promoting investment in each other’s countries
Maintaining animal welfare standards in the UK
TP2e. Which of these considerations make the following countries an appealing trading partner to you? Please select up to three.

30
Split sample as above
New Zealand
USA Australia Japan
Lower prices of products coming from this country
Have strong workers’ rights, such as health and safety rules, family benefits and sick pay
Country specialises in goods and services the UK doesn’t produce
Country produces high quality consumer goods
Environmentally considerate
High standards of animal welfare
Politically similar to the UK
Culturally similar to the UK
Respect human rights
Respects international trade law
Similar food standards to the UK
Have a strong economy
Have a stable government
Something else
None of the above
FTA published priorities and Covid-19 questions
ROTATE UP and JP sections
Ask all
UP1: On 2nd March 2020, the government published the UK’s negotiation objectives for a trade agreement with the United States of America.

31
Prior to today, were you aware of these negotiation priorities for a free trade agreement with the US?
1. Yes 2. No 3. Don’t Know
If ‘yes’ at UP1 Ask all - UP2: What topics, if any, do you remember hearing about this? (randomise list, multiple choice except for codes 7 to 10 )
1. The NHS 2. Food safety 3. Animal welfare 4. The impact on different regions of the UK, such as Scotland, the North East, or the
Midlands 5. The impact on different types of businesses, such as those who manufacture ceramics or
cars, or who provide professional services – such as lawyers - or financial services. 6. The impact on our economy or Gross Domestic Product (GDP) 7. I remember hearing about the negotiation objectives but not any specific topics 8. Something else 9. Nothing 10. Don’t know
JP1 On 13th May 2020, the government published the UK’s negotiation objectives for a trade agreement with Japan.
Prior to today, were you aware of these negotiation priorities for a free trade agreement with Japan?
1. Yes 2. No 3. Don’t Know
If ‘yes’ at JP1 JP2: What topics, if any, do you remember hearing about this? (randomise list, multiple choice except for codes 7 to 10 )
1. The NHS 2. Technology and maximising opportunities for digital trade 3. The impact on different regions of the UK, such as Scotland, the North East, or the
Midlands 4. The impact on different types of businesses, such as those who manufacture cars, or who
provide professional services – such as lawyers - or financial services. 5. The impact on our economy or Gross Domestic Product (GDP) 6. I remember hearing about the negotiation objectives but not any specific topics 7. Something else 8. Nothing 9. Don’t know

32
Ask all CV1: Which of the following topics do you recall having seen or heard about in the last 3 months?
Please select all the topics that you have heard about in the last three months.
1. The government response to the novel coronavirus, also known as Covid-19 2. The government beginning trade negotiations with the USA 3. The 75th anniversary of VE day 4. The governments publication of the UK-Japan negotiating priorities 5. The announcement of the UK’s new tariff regime 6. The government beginning trade negotiations with the EU 7. None of the above
Ask all CV2: Here are some pairs of statements. Please indicate where your own view lies on a 10-point scale where 0 means complete agreement with the statement on the left, 10 means complete agreement with the statement on the right, and 5 means you don’t agree with either of the statements or that your views are mixed or balanced on the issue in question. [Randomise]
[0=10 scale for each item below. Top item at 0 and bottom item at 10 with don’t now]
CV2_1
It’s best to protect our own domestic industries by applying higher taxes to imports
vs
Tax free trade between different countries is the most effective way to encourage our businesses and economy to grow
CV2_2
We should prevent essential goods manufactured in the UK from being exported, allowing us to assist our own nation best
vs
We should prioritise protecting the worldwide supply of essential goods, allowing food and medicines to cross borders without restrictions.
CV2_3
For our economic recovery following covid-19 the UK should embrace international trade, ensuring a free flow of imports and exports of goods and services
vs For our economic recovery following covid-19 the UK should become self-sufficient and less reliant on imports from other countries
Ask all

33
ECON Once lockdown restrictions are lifted, do you think the UK economy will be slow or quick to recover from the effects of Covid-19?
1. Very quick to recover (i.e. by the end of 2020)
2. Fairly quick to recover (i.e. within 1 to 2 years)
3. Fairly slow to recover (i.e. within 2 to 5 years)
4. Very slow to recover (i.e. within 5 to 10 years or longer)
5. Don’t know
Section 5: Voter behaviour Ask all EU1. Around 28% of people who could have voted did not vote in the UK’s EU Referendum held on 23rd June 2016. Many said that this was because they were sick, too busy or simply weren’t interested in politics. Did you vote at the EU Referendum? [Single Response]
I did not vote at the EU Referendum 1 I voted at the EU Referendum 2 I cannot remember 3
Ask if voted at the EU Referendum at EU1 EU2 …and how did you vote at the EU Referendum? [Single Response]
I voted to leave the European Union 1 I voted to remain in the European Union 2 I cannot remember 3 Prefer not to say 4
Section 6: Demographics

34
Ask all D1. Which of the following categories would best describe your ethnicity? [Single Response]
White British/English/Welsh/Scottish/Northern Irish 1 Irish 2 Gypsy, Traveller or Irish Traveller 3 Any other White background 4 Mixed/ Multiple ethnic groups White and Black Caribbean 5 White and Black African 6 White and Asian 7 Any other Mixed/ Multiple ethnic background 8 Asian or Asian British Indian 9 Pakistani 10 Bangladeshi 11 Chinese 12 Any other Asian background 13 Black or Black British African 14 Caribbean 15 Any other Black/ African/ Caribbean background 16
Other ethnic group Arab 17 Other 18 Don’t know 98 Prefer not to say 99

35
ASK ALL D2. What is your highest level of your educational qualification received? [Single Response – expand codes, 3-7 to show the individual levels]
PhD/Doctor 1 Masters 2 Bachelors Degree or equivalent (Such as a NVQ level 5)
3
Higher education (Such as a HND or a NVQ level 4)
4
A level or equivalent (Such as Scottish Highers or NVQ level 3)
5
GCSE and below (Such as O level or an RSA Diploma)
6
Other qualifications (Such as NVQ level 1)
7
No qualifications 8 Prefer not to say 9

36
ASK ALL D3. Which of the following options best describes your occupation?
If you are retired and have an occupational pension, or if you are not in employment and have been out of work for less than 6 months, please answer for your most recent occupation. [Single Response]
Semi or unskilled manual work (e.g. Manual workers, all apprentices to be skilled trades, caretaker, Park keeper, non-HGV driver, shop assistant) 1
Skilled manual worker (e.g. Skilled Bricklayer, Carpenter, Plumber, Painter, Bus/ Ambulance Driver, HGV driver, AA patrolman, pub/bar worker, etc.)
2
Supervisory or clerical/ junior managerial/ professional/administrative (e.g. Office worker, Student Doctor, Foreman with 25+ employees, salesperson, etc.)
3
Intermediate managerial/ professional/ administrative (e.g. Newly qualified (under 3 years) doctor, Solicitor, Board director small organisation, middle manager in large organisation, principle officer in civil service/local government)
4
Higher managerial/ professional/ administrative (e.g. Established doctor, Solicitor, Board Director in a large organisation (200+ employees, top level civil servant/public service employee)
5
Full time Student 7
Casual worker – not in permanent employment 8
Housewife/ Homemaker 9
Retired and living on state pension (i.e. no private or work-related pension scheme) 10
Unemployed or not working due to long-term sickness 11
Full-time carer of another household member 12
Other 95

37
ASK ALL D6. Which of the following bands, best represents your annual household income, before deductions for income tax, National Insurance etc? [Single Response]
Less than £10,000 1
£10,000 - £19,999 2
£20,000 - £29,999 3
£30,000 - £39,999 4
£40,000 - £49,999 5
£50,000 - £59,999 6
£60,000 - £69,999 7
£70,000 - £79,999 8
£80,000 - £89,999 9
£90,000 – £99,999 10
More than £100,000 11
Prefer not to say 98

38
The UK’s Department for International Trade (DIT) has overall responsibility for promoting UK trade across the world and attracting foreign investment to our economy. We are a specialised government body with responsibility for negotiating trade policy, supporting businesses, as well as delivering an outward-looking trade diplomacy strategy.
Legal disclaimer Whereas every effort has been to ensure that the information in this document is accurate the Department for International Trade does not accept liability for any errors, omissions or misleading statements, and no warranty is given, or responsibility accepted as to the standing of any individual firm, company or other organisation mentioned.
Copyright
© Crown Copyright 2021
This publication is licensed under the terms of the Open Government. License v3.0 except where otherwise stated. To view this license, visit http://nationalarchives.gov.uk/doc/open-government-licence/version/3/
Where we have identified any third-party copyright information you will need to obtain permission from the copyright holders concerned.
Any enquiries regarding this publication should be sent to us at