
Public and stakeholder - Energy Pathwaysenergy-pathways.org/pdf/R4_public_and_stakeholder...PUBLIC...
90
PUBLIC AND STAKEHOLDER ATTITUDES Public and stakeholder attitudes towards energy, environment and CCS With respect to anthropogenic emissions of CO 2 there are different technological options for reducing these emissions. Widespread introduction of these measures requires research and development to improve performance, reliability and efficiency. Nevertheless, no matter how promising an option is from a technological and economic perspective, it has to be socially accepted by the public if implementation is to be successful. This report gives results from two different studies of public and stakeholder attitudes. The first study investigates public attitudes towards energy policy and global warming, including technical options for mitigating emissions of anthropogenic greenhouse gases. The study is based on surveys which poll the general public and is unique in that it compares four regions: the UK, USA, Japan and Sweden. The second study examines attitudes towards Carbon Capture and Storage (CCS) among stakeholders active within the fields of energy and environment (public authorities, companies etc.). This report is a result from the project Pathways to Sustainable European Energy Systems – a five year project within The AGS Energy Pathways Flagship Program. The project has the overall aim to evaluate and propose robust pathways towards a sustainable energy system with respect to environmental, technical, economic and social issues. Here the focus is on the stationary energy system (power and heat) in the European setting. The AGS is a collaboration of four universities that brings together world-class ex- pertise from the member institutions to develop research and education in collaboration with government and industry on the challenges of sustainable development. THE AGS PATHWAY REPORTS 2007:E2 Public and stakeholder attitudes towards energy, environment and CCS PATHWAYS TO SUSTAINABLE EUROPEAN ENERGY SYSTEMS
Transcript of Public and stakeholder - Energy Pathwaysenergy-pathways.org/pdf/R4_public_and_stakeholder...PUBLIC...

PU
BL
IC A
ND
STA
KE
HO
LD
ER
ATTITUD
ES
Public and stakeholder attitudes towards energy,
environment and CCSWith respect to anthropogenic emissions of CO
2 there are different
technological options for reducing these emissions. Widespread introduction of these measures requires research and development to improve performance, reliability and efficiency. Nevertheless, no matter how promising an option is from a technological and economic perspective, it has to be socially accepted by the public if implementation is to be successful. This report gives results from two different studies of public and stakeholder attitudes.
The first study investigates public attitudes towards energy policy and global warming, including technical options for mitigating emissions of anthropogenic greenhouse gases. The study is based on surveys which poll the general public and is unique in that it compares four regions: the UK, USA, Japan and Sweden.
The second study examines attitudes towards Carbon Capture and Storage (CCS) among stakeholders active within the fields of energy and environment (public authorities, companies etc.).
This report is a result from the project Pathways to Sustainable European Energy Systems – a five year project within The AGS Energy Pathways Flagship Program.
The project has the overall aim to evaluate and propose robust pathways towards a sustainable energy system with respect to environmental, technical, economic and social issues. Here the focus is on the stationary energy system (power and heat) in the European setting.
The AGS is a collaboration of four universities that brings together world-class ex-pertise from the member institutions to develop research and education in collaboration with government and industry on the challenges of sustainable development.
THE
AG
S PATH
WAY R
EP
OR
TS 2007:E
2
Public and stakeholder attitudes towards energy,
environment and CCS
PATHWAYS TO SUSTAINABLE EUROPEAN ENERGY SYSTEMS

FOUR UNIVERSITIES
The Alliance for Global Sustainability is an international part-
nership of four leading science and technology universities:
CHALMERS Chalmers University of Technology, was founded
in 1829 following a donation, and became an independent
foundation in 1994.Around 13,100 people work and study at
the university. Chalmers offers Ph.D and Licentiate course pro-
grammes as well as MScEng, MArch, BScEng, BSc and nautical
programmes.
Contact: Alexandra Priatna
Phone: +46 31 772 4959 Fax: +46 31 772 4958
E-mail: [email protected]
ETH Swiss Federal Institute of Technology Zurich, is a science
and technology university founded in 1855. Here 18,000 people
from Switzerland and abroad are currently studying, working or
conducting research at one of the university’s 15 departments.
Contact: Peter Edwards
Phone: +41 44 632 4330 Fax: +41 44 632 1215
E-mail: [email protected]
MIT Massachusetts Institute of Technology, a coeducational,
privately endowed research university, is dedicated to advanc-
ing knowledge and educating students in science, technology,
and other areas of scholarship. Founded in 1861, the institute
today has more than 900 faculty and 10,000 undergraduate
and graduate students in five Schools with thirty-three degree-
granting departments, programs, and divisions.
Contact: Karen Gibson
Phone: +1 617 258 6368 Fax: +1 617 258 6590
E-mail: [email protected]
UT The Univeristy of Tokyo, established in 1877, is the oldest
university in Japan. With its 10 faculties, 15 graduate schools,
and 11 research institutes (including a Research Center for
Advanced Science and Technology), UT is a world-renowned,
research oriented university.
Contact: Yuko Shimazaki
Phone: +81 3 5841 7937 Fax: +81 3 5841 2303
E-mail: [email protected]

Public and stakeholder attitudes towards energy,
environment and CCS
AGS Pathways report 2007:E2
P A T H W A Y S T O S U S T A I N A B L E E U R O P E A N E N E R G Y S Y S T E M S
A G S , T H E A L L I A N C E F O R G L O B A L S U S T A I N A B I L I T Y
Göteborg 2007

C o p y r i g h t 2 0 0 7
P r i n t e d b y P R - O f f s e t , M ö l n d a l
I S B N 9 7 8 - 9 1 - 6 3 3 - 0 1 1 1 - 7
This report can be ordered from:
AGS Office at Chalmers
GMV, Chalmers
SE - 412 96 Göteborg

Table of content
General background 1
Introduction 1
Study 1 - A survey of public attitudes towards
energy and environment 3
Study 2 - A survey of Swedish stakeholders
attitudes towards energy and environment 12
Study 1 17
Method 19
Results 25
Study 2 51
Method 53
Results 60
References 78


Summary and conclusions
1
General summary
Increased global warming due to increased atmospheric concentration of Green House Gases (GHG) is considered a serious threat to mankind. Over the two past centuries there has been a strong increase in anthropogenic emissions of GHGs from burning fossil fuels, especially with respect to carbon dioxide (CO2), the most important GHG since it is emitted in the largest quantities. The atmospheric concentration of CO2 has increased from a pre-industrial level of 280 ppm to more than 370 ppm (IPCC, 2001).
As a first step to reduce emissions and stabilize the atmospheric content of GHGs the Kyoto pro-tocol was signed in 1997 and entered into force on February 16, 2005. The protocol is based on legally binding emissions targets for industriali-zed countries (so called Annex I countries). Thus, GHG reduction targets are prescribed for 38 deve-loped countries and for the European Community, and it is stated that these countries together must reach a 5 % reduction in annual GHG emissions on average during the first commitment period from 2008 to 2012 compared to the base year 1990. All the large industrialized countries except the USA and Australia have signed the protocol. The reduction goals differ between countries. Sweden, as part of the European Union, is actu-ally allowed to increase its emissions by 4 %. However, the Swedish Parliament has set a natio-nal goal of instead reducing the emissions by 4 %.
With respect to anthropogenic emissions of CO2 there are different technological options for redu-
cing these emissions, such as implementing energy conservation measures, increasing energy effi-ciency, increasing use of renewable fuels and to change modes of transportation (public instead of individual transportation). Widespread introduction of these measures requires research and deve-lopment to improve performance, reliability and efficiency. Nevertheless, no matter how promising an option is from a technological and economic perspective, it has to be socially accepted by the public if implementation is to be successful. Thus, it is necessary to investigate not only technical and economic barriers which must be overcome for successful implementation, but also social and political barriers.
This report concerns the latter type of barriers illustrating results from two different studies.
Study 1 - Public attitudesThe first study investigates public attitudes towards energy policy and global warming, inclu-ding technical options for mitigating emissions of anthropogenic greenhouse gases. The study is based on surveys which poll the general public and is unique in that it compares four regions the UK, USA, Japan and Sweden.
Study 2 - Stakeholder attitudes The second study examines attitudes towards Carbon Capture and Storage (CCS) among sta-keholders active within the fields of energy and environment (public authorities, companies etc.). CCS is a rather new technology for mitigating
Introduction

Summary and conclusions
2
emissions of anthropogenic greenhouse gases. The survey helps to evaluate the attitudes of both the public and stakeholders in order to see what role, if any, CCS might play in a more sustainable energy system. The study is based on questionnai-res which poll stakeholders in the Nordic countries (predominantly in Sweden and to a smaller extent in Denmark, Norway and Finland).
An AGS co-operationBoth studies are based on a co-operative effort within the Alliance for Global Sustainability (AGS) (see page 83). Chalmers University of Technology (Sweden), MIT (USA), the University of Cambridge (UK), and the University of Tokyo (Japan), have performed corresponding surveys in different regions.
More informationFor more information please contact:Prof. Filip Johnsson, dept. of Energy and Environment, ChalmersSE-412 96 Göteborg, Sweden. Phone: +46 31 772 1000. E-mail: [email protected]. David M. Reiner, Judge Business School, University of Cambridge.E-mail: [email protected]
Summary and conclusions
3
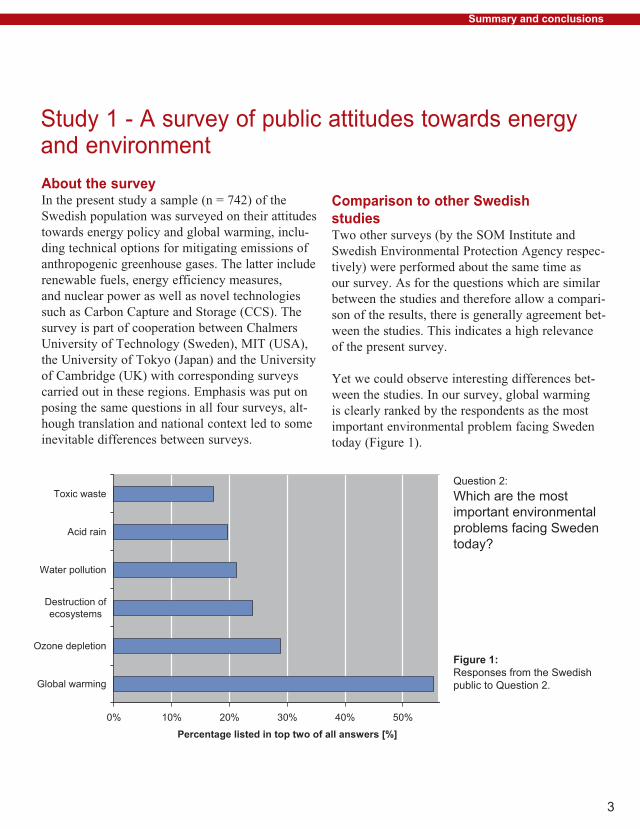
About the surveyIn the present study a sample (n = 742) of the Swedish population was surveyed on their attitudes towards energy policy and global warming, inclu-ding technical options for mitigating emissions of anthropogenic greenhouse gases. The latter include renewable fuels, energy efficiency measures, and nuclear power as well as novel technologies such as Carbon Capture and Storage (CCS). The survey is part of cooperation between Chalmers University of Technology (Sweden), MIT (USA), the University of Tokyo (Japan) and the University of Cambridge (UK) with corresponding surveys carried out in these regions. Emphasis was put on posing the same questions in all four surveys, alt-hough translation and national context led to some inevitable differences between surveys.
Comparison to other Swedish studiesTwo other surveys (by the SOM Institute and Swedish Environmental Protection Agency respec-tively) were performed about the same time as our survey. As for the questions which are similar between the studies and therefore allow a compari-son of the results, there is generally agreement bet-ween the studies. This indicates a high relevance of the present survey.
Yet we could observe interesting differences bet-ween the studies. In our survey, global warming is clearly ranked by the respondents as the most important environmental problem facing Sweden today (Figure 1).
Study 1 - A survey of public attitudes towards energy and environment
Question 2:
Which are the most important environmental problems facing Sweden today?
Figure 1: Responses from the Swedish public to Question 2.

Summary and conclusions
�
In the SOM study, the results of a similar question instead indicated that respondents believed ozone depletion to be the largest threat to the environ-ment. Global warming was ranked as the number two threat. Besides the somewhat different design of the questions, one possible explanation for the discrepancy could be that our survey focuses on energy and climate issues, which indirectly may have affected the respondents’ opinion on the importance of global warming. In the SOM study, the questions concerning environment and energy only accounted for a rather small part of the sur-vey. Furthermore, the relatively low response rate (49 %) in our study may yield some bias. Persons who consider global warming as an important environmental problem might be represented to a larger extent than what is the case for the whole population.
The importance of the environment and global warmingIn comparison to other problems facing society, environmental issues have a fairly strong position among the Swedish public (Table 1). Health care and unemployment are on top of the list, while problems concerning the environment are ranked fifth out of 20 alternatives in our survey. The responses are similar to the results of a comparable question in the SOM study. The SOM study has included the question with the list of problems facing society since 1987.
Although the Swedish audience does not rank environmental problems as high as at the end of the 1980s, our survey shows that they are ranked higher than in the US and UK.
Table 1: Responses from the Swedish public to Question 1: What are the three most important issues facing Sweden today?
SWEDEN US UK
Health care 57% 35% 26%
Unemployment 44% 30% 5%
Education 41% 19% 17%
Crime 28% 14% 31%
Environment 24% 9% 13%
Economy of the state 21% 35% 10%
Income inequity 14% 4% 5%
Welfare 14% 3% 6%
Aging population 11% 5% 15%
Taxes 8% 11% 13%
SWEDEN US UK
Drugs 7% 12% 16%
Budget deficit 5% 15% 1%
Racism 4% 4% 4%
Poverty 4% 8% 7%
Foreign policy 2% 14% 10%
Inflation 2% 3% 2%
Terrorism 2% 42% 39%
AIDS 1% 4% 1%
Stock market 1% 2% 0%

Summary and conclusions
5
In both the US and UK, terrorism is ranked high (in first and second place respectively), which is a large difference compared to the Swedish survey, where it is ranked in 17th place. This difference is probably due to the design of the question, since the respondents were asked about issues facing their country. The USA and UK are allies in the ‘war on terrorism’, which has put terrorism high on the national agenda. The surveys were sent out after the US had been hit by terrorists in 2001, but prior to the suicide bombers strike on London on July 7, 2005. Sweden, on the other side, is not a member of the alliance in the ‘war on terrorism’, and has not been struck by any major terrorist attacks. But terrorism in general does worry the Swedes. When the SOM study asked the respon-
dents what makes them worried about the future (a more general question, not linked to Sweden), ter-rorism was ranked as the top priority.
As discussed above, it is not clear whether global warming can be considered the most important environmental problem for the Swedish public. Our survey indicates this, but the SOM study points to ozone depletion being regarded as more important. In either case, we can conclude that global warming is considered one of the most important problems. In the UK, global warming is considered the most important environmental problem. In the US, the public considers water pollution to be the top priority. Global warming is ranked as the number six priority.

Summary and conclusions
6
Question 7:
There is a growing con-cern about increasing levels of carbon dioxide in the atmosphere. How do you think the following contricute to these levels?
Figure 2:Responses from the Swedish public to Question 7.
Understanding and addressing global warmingLooking at the results from the Swedish survey, we can see that the Swedish public generally understands that automobiles, factories and coal burning plants increase the atmospheric levels of CO2 (Figure 2).
There is also a basic understanding about trees reducing the CO2 levels. Almost one fifth of the respondents believe that nuclear power lead to increased CO2 levels. The results are confirmed by the Swedish EPA study, which included a com-parable question. In comparison to the surveys in the US, UK and Japan, the degree of understan-ding global warming is about the same in all four countries.
Summary and conclusions
7
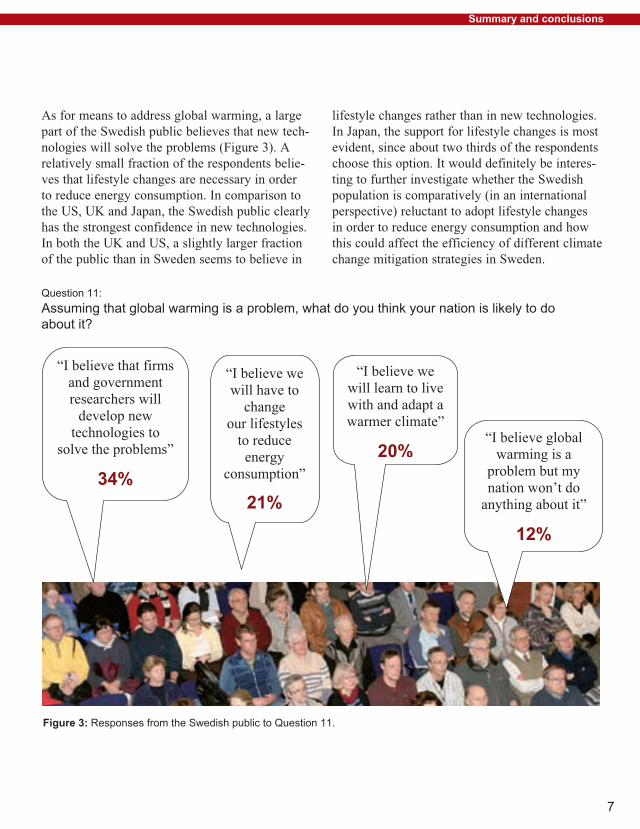
Figure 3: Responses from the Swedish public to Question 11.
Question 11:
Assuming that global warming is a problem, what do you think your nation is likely to do about it?
As for means to address global warming, a large part of the Swedish public believes that new tech-nologies will solve the problems (Figure 3). A relatively small fraction of the respondents belie-ves that lifestyle changes are necessary in order to reduce energy consumption. In comparison to the US, UK and Japan, the Swedish public clearly has the strongest confidence in new technologies. In both the UK and US, a slightly larger fraction of the public than in Sweden seems to believe in
lifestyle changes rather than in new technologies. In Japan, the support for lifestyle changes is most evident, since about two thirds of the respondents choose this option. It would definitely be interes-ting to further investigate whether the Swedish population is comparatively (in an international perspective) reluctant to adopt lifestyle changes in order to reduce energy consumption and how this could affect the efficiency of different climate change mitigation strategies in Sweden.

Summary and conclusions
8
Figure 4: Responses from the Swedish public to Question 13.
Wind CCS
Question 13:
The following technologies have been proposed to address global warming. If you were responsible for designing a plan to address global warming, which of the following technologies would you use?
Technology choices for addressing global warmingIn its choice of technologies to reduce global warming, the Swedish public shows a strong preference for using energy efficient cars, wind energy, energy efficient appliances and solar energy (Figure 4). Similar results can be observed for the US, UK and Japan, which shows that these technologies are generally well appreciated. These technologies have appeared in Swedish media for the last two to three decades and, consequently,
the public is rather well informed on these. The situation for Carbon Capture and Storage (CCS) is rather different. The technology is fairly new and unproven, and only a small fraction of the public in all four countries had heard about the techno-logy during the year previous to receiving the questionnaire. This lack of knowledge about the technology may explain why (in all four studies) the largest share of the public is not sure whether to use the technology and the rest are roughly divi-ded between using it and not using it.

Summary and conclusions
9
Figure 5: Comparison of responses to Question 1� for the surveys in Sweden, USA and UK.
Question 1�:
How can we best address the issue of global warming? (With information about future generation potentials and production costs?
With background information on electricity pro-duction costs and the CO2 emissions from dif-ferent technology options, the respondents were asked to choose their option to address global warming related to electricity production (Figure 5). Even with this information, Swedish respon-dents do not recognize CCS as an important option, since less than 1 % choose this option. The Swedish respondents prefer to expand renewables, to invest in R&D or to expand nuclear power. In total, 87 % of the respondents choose one of these three options. In the UK and US, however, a significant fraction of the public (10 and 16 % respectively) chooses CCS. The apparent diffe-rence compared to the Swedish survey might be
understood from higher fossil fuel dependence in the US and UK compared to Sweden. Due to high energy and carbon dioxide taxes and high availa-bility of other fuels in Sweden (nuclear and hydro power and biomass), there has been little use of fossil fuels (except natural gas) for large-scale electricity generation. In the US and UK, however, fossil fuels still account for the largest part of the electricity generation.
To sum up, we can conclude that CCS is an unk-nown technology for the large majority of the public, but that the public seems to take a rather neutral position towards CCS. Information about electricity generation costs favoured the public’s position on CCS in the US and UK.

Summary and conclusions
10
Figure 6:Responses from the Swedish public to Question 9.
Question 9:
If it solved global warming, would you be will-ling to pay [value] more per month on your electricity bill?
Willingness to pay to solve global warmingMore than 40 % of the Swedish respondents are not willing to pay anything extra to solve global warming (Figure 6). This relatively large fraction might be understood from results in the SOM study (Holmberg and Weibull, 2005). In the study, the respondents were asked about how eco-nomically dependent their households were on the electricity price. 58 % responded that they were highly or fairly dependent on the electricity price. It is reasonable to assume that the willingness to pay extra for electricity is low among this group. In another question in the SOM study, respon-dents had to give their opinion on the electricity price in Sweden. 86 % considered it to be very high or fairly high (Hedberg and Holmberg 2005). Furthermore, during the last five years, the largest electricity companies have made large profits, which have received a lot of media attention. It is thus possible that people in general are unwilling to pay more for the electricity, since they already believe that the electricity price is high conside-ring the large profits of the electricity companies. It may very well be that a large fraction of the people thinks that it is the electricity companies who should pay to solve global warming since they are part of the problem (causing the emis-sions) and that they could afford to solve this in view of their large revenues. Therefore it could be the case that the willingness to pay to solve global warming would have increased if the question had been designed without linking it to the electricity price. In comparison to the surveys in the UK, US and Japan, the public in Sweden shows clearly the largest reluctance to pay additional amounts to solve global warming.
To sum up, the results of this survey indicate that the Swedes are highly aware of environmental issues and global warming in particular. They also rank environment before economy on a general level. In spite of this, when it comes to climate change mitigation measures affecting their per-sonal situation, they are, in comparison to the public in the UK, US and Japan, less interested in changing their lifestyle in order to reduce energy consumption and more reluctant to pay additional amounts on their electricity bill to solve global warming. Further research is necessary to confirm these observations and to explore the implications for climate change mitigation in Sweden.

Summary and conclusions
11
The relevance of the study seems high. This is because a comparison of a number of questions of this study with similar questions in two other public surveys, performed in Sweden during the same year, in general shows only minor differences.
In comparison to other problems facing society, environmental issues have a fairly strong position among the Swedish people. The importance of environmental problems is clearly higher than in the US and UK.
Global warming is considered one of the most important problems by the Swedish as well as by the UK people. In the US, however, the public considers water pollution to be the most important problem.
The surveys in all four countries show that the public generally understands that automo-biles, factories and coal burning plants increase the atmospheric levels of CO2. There is also a basic understanding about trees reducing the CO2 levels. In all four countries, there is a significant share of the public (20-30 %) who believes nuclear power plants increasethe atmospheric levels of CO2.
With respect to means for addressing global warming, a large fraction of the Swedish public believes that new technologies would solve the problems. A relatively small fraction of the respondents believes that lifestyle changes are necessary in to reduce energy consumption. In comparison to the US, UK and Japan, the Swedish people clearly have the strongest con-fidence in new technologies.
In all four surveys, the people show a strong preference for using energy efficient cars, wind energy, energy efficient appliances and solar energy to address global warming. Carbon Capture and Storage (CCS) is largely unknown by the public. In all surveys, the majority is not sure whether to use the technology and the rest are roughly divided between using it and not using it.
When providing background information on electricity production costs and the CO2 emis-sions from different technology options, the Swedish people did not recognize CCS as an important option. In the UK and US, however, significant fractions of the people (10 and 16 % respectively) choose CCS with this informa-tion.
In comparison to the surveys in the UK, US and Japan, people in Sweden show the largest reluctance to pay additional amounts to solve global warming. However, the design of the question where this was addressed (expressed as an additional amount on the monthly elec-tricity bill) may have influenced the responses, since more than 80 % of the Swedish public considers the electricity price to be very high or fairly high.
Main findings

Summary and conclusions
12
Study 2 - A survey of Swedish stakeholder attitudes towards Carbon Capture Storage (CCS)
The number and type of respondentsThe number of respondents (38) to this questionn-aire is comparatively small. The results on the stakeholders’ views and opinions would therefore most likely be different if a larger amount of sta-keholders would receive the questionnaire or if the share of Swedish respondents (27 out of 38) would be reduced and the number of respondents from Norway, Finland and Denmark would be increased. In Norway, for example, CCS has played a much larger role in the climate change debate than in Sweden. Of course, also the selection and distribu-tion of stakeholder organizations (energy companies, energy associations, industrial companies with large CO2 emissions and industrial associations and public authorities and ministries) influence the final results. Given these circumstances, we believe the results should be interpreted with care and not as being representative for all stakeholders. However, we do believe the results give interesting insights on how the issues of climate change and CCS are handled and viewed in these particular types of stakeholder organizations.
About the survey The survey consisted of a written questionnaire with 31 questions, which was sent to individuals working at stakeholder organizations, which could be organi-zed into four main groups:
1 Energy companies (active on a regional, national or international level)
2 Energy associations
3 Industrial companies with large CO2 emissions and industrial associations
� Public authorities and ministries
The person receiving the questionnaire was asked to answer it on an individual basis, i.e. based on her/his personal opinion and personal knowledge. Consequently, the responses do not necessarily represent the official opinion of each stakeholder organization. 38 out of 48 persons receiving the questionnaire responded, yielding a response rate of 79 %. The questions were organized in the following sections:
General Background on Climate Change
General Questions regarding Carbon Capture and Storage (CCS)
Future of Carbon Capture and Storage (CCS)
Public Attitudes towards CCS
The Stakeholders Organizations’ Approach to CCS

Summary and conclusions
13
Knowledge and opinions about climate changeFrom the results, it is apparent that the respondents have knowledge and clear opi-nions about climate change. These stakehol-ders in general consider climate change to be more serious than other problems facing society (such as starvation, poverty, crime etc.; see Figure 7). They also demonstrate that climate change has a high priority within the stakeholder organizations’ overall portfolio of environmental concerns. Furthermore, a majority of these stakeholder organizations has a clear position on climate change, which in most cases is publicly available. The respondents seem to believe that national and international regulation related to cli-mate change will lead to moderate reductions of GHG emissions over the next 20 years. Regarding how much of a burden climate change policies would impose on business over the next decade, these stakeholders are roughly split between ‘moderate’ and ‘heavy’.
…but CCS is known to a lesser extentSome stakeholders pointed out that their knowledge about CCS was limited. Therefore they sometimes found it hard to respond. One example was in the question where new types of CCS (ocean storage) were introduced to them. Although they picked an alternative to a question, they claimed that more knowledge about CCS could actually mean that they would change their response. They apprecia-ted the questionnaire in the respect that it pro-vided them with new information about CCS.
Looking at the responses of the questionnaire, we can observe a rather large uncertainty about how increased adoption of CCS will affect the penetration of other low-carbon energy sources, and the environmental risks associated with CCS. For example, concer-ning the risk for water contamination due to CCS, out of 38 respondents one person did not answer, three are unsure and seven belie-
Qustion 1:
How serious do you consider the threat of climate change to be relative to other pro-blems facing society (such as starvation, poverty, crime etc)?
Figure 7:Responses to Question 1.

Summary and conclusions
1�
ve they have insufficient information to respond to the question.
The results of the questionnaire also shed some light on the reasons behind this rather poor know-ledge of CCS. So far CCS has played (according to these stakeholders) a small role in the cli-mate change debate in all countries but Norway. Additionally, only a few of these organizations have a clear position on CCS, implying weak gui-dance for the employees responding to this ques-tionnaire. The respondents are, however, rather optimistic about the chances that new information or events might change their organizations’ current lack of position toward CCS (Figure 8).
The future for CCSThe stakeholders are quite positive about the opportunities for CCS to be established as a low-carbon energy source in the future. Many believe that within 20 years or less, it will be possible to receive credits for CCS in national accounting sys-tems and/or emissions trading systems. Almost all
of them (36 out of 38 responses) find it likely that a large-scale entry of CCS will occur within 20 years or less (Figure 9). In relation to other low-carbon energy sources (such as fuel cells and solar energy), the large-scale entry of CCS will occur earlier according to the respondents. In order for this to happen, these stakeholders clearly advocate geological storage (offshore or onshore), since they rate the social acceptability to be much higher for this form of storage than for ocean storage. This is also the form of the CCS that they consider to be the most desirable or the least undesirable.
As regards concerns that would discourage wide-scale penetration of CCS, the stakeholders put for-ward its acceptability to NGOs, the opportunities to find suitable storage sites, and the economic viability (the cost per ton CO2 abated). Of much less importance seem to be concerns over effects on other mitigation technologies (e.g. renewables), the equity or fairness in siting, or the acceptability to the business community.
Question 28:
Do you think there is any new informa-tion or event that might change your organization’s current attitude towards CCS?
Figure 8:Responses to Question 28.

Summary and conclusions
15
Question 15:
When do you think that large-scale entry of the following technologies in the electric power sector is likely?
Figure 9:Responses to Question 15.
Views on public attitudes toward CCSAlmost half of the stakeholders (18 out of 38) believe the public is largely ignorant about CCS. This opinion is a bit more common among Swedish respondents, where 16 out of 27 respon-dents consider the public to be largely ignorant. This result is line with observations made in study 1. In study 1, only 15 % responded that they had heard or read about CCS during the past year. Furthermore, although 58 % of the respondents correctly marked that CCS can reduce global war-ming, over 30 % incorrectly believed that CCS can reduce acid rain, ozone depletion, smog and water pollution.
Looking at the results from both studies, another interesting observation can be made. Although the Swedish stakeholders in this study have more
information and knowledge about climate change and options to reduce CO2 emissions than the Swedish public in general, both groups seem to prefer bioenergy/biomass, solar energy, wind energy and nuclear power to fossil-fired plants with CCS.
Looking at the responses from all stakeholders, they find that more information and public con-sultations are likely to help ease potential public concerns over CCS. It is possible that this also includes getting acceptability to NGOs (which was shown to be important for enabling wide-scale penetration of CCS), since they can play an important role in providing the public with infor-mation and arguments for or against a specific technology.

Study 1
16

Study 1
17
Study 1

Study 1
18
Study 1
19
Study 1. A survey of public attitudes towards energy and environment
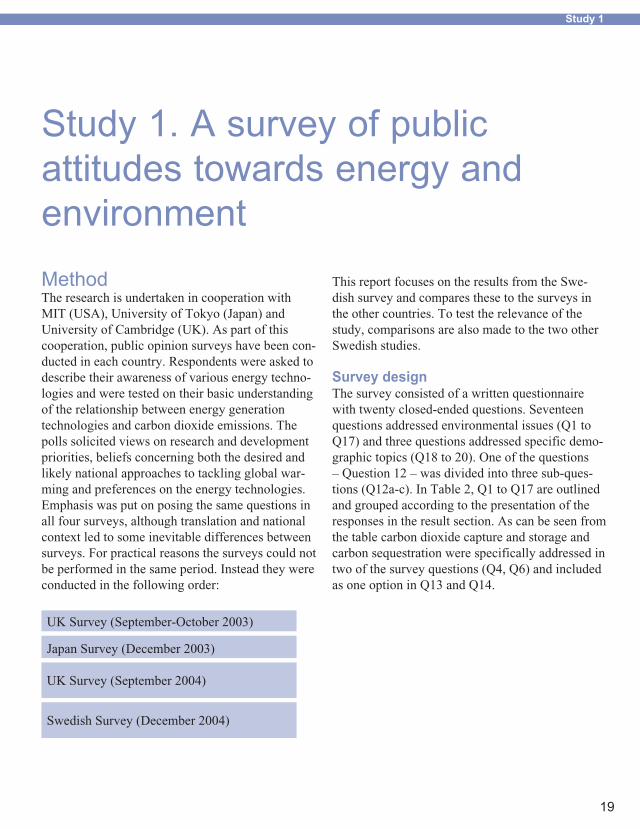
MethodThe research is undertaken in cooperation with MIT (USA), University of Tokyo (Japan) and University of Cambridge (UK). As part of this cooperation, public opinion surveys have been con-ducted in each country. Respondents were asked to describe their awareness of various energy techno-logies and were tested on their basic understanding of the relationship between energy generation technologies and carbon dioxide emissions. The polls solicited views on research and development priorities, beliefs concerning both the desired and likely national approaches to tackling global war-ming and preferences on the energy technologies. Emphasis was put on posing the same questions in all four surveys, although translation and national context led to some inevitable differences between surveys. For practical reasons the surveys could not be performed in the same period. Instead they were conducted in the following order:
UK Survey (September-October 2003)
Japan Survey (December 2003)
UK Survey (September 2004)
Swedish Survey (December 2004)
This report focuses on the results from the Swe-dish survey and compares these to the surveys in the other countries. To test the relevance of the study, comparisons are also made to the two other Swedish studies.
Survey designThe survey consisted of a written questionnaire with twenty closed-ended questions. Seventeen questions addressed environmental issues (Q1 to Q17) and three questions addressed specific demo-graphic topics (Q18 to 20). One of the questions – Question 12 – was divided into three sub-ques-tions (Q12a-c). In Table 2, Q1 to Q17 are outlined and grouped according to the presentation of the responses in the result section. As can be seen from the table carbon dioxide capture and storage and carbon sequestration were specifically addressed in two of the survey questions (Q4, Q6) and included as one option in Q13 and Q14.

Study 1
20
Table 2: The survey questions grouped into understanding, attitudes and willingness to pay
RESULT SECTION QUESTIONS IN THE SURVEY
PUBLIC UNDERSTANDING Q7. There is a growing concern about increasing levels of car-bon dioxide in the atmosphere. How do you think the following contribute to these levels? Automobiles, Factories, Oceans ...
Q4. Have you heard of or read about any of the following in the past year (2004)? More efficient cars, Nuclear energy, Wind energy, Carbon Capture and Storage (CCS) …
Q6. Please select if “carbon sequestration” or “carbon capture and storage” can reduce each of the following environmental concerns. Acid rain, Ozone depletion, Toxic waste…
PUBLIC ATTITUDES Q1. What are the three most important issues facing Sweden today? Health care, Unemployment, Education, Crime ...
Q2. Which are the two most important environmental problems facing Sweden today? Global warming, Ozone depletion, Destruction of ecosystems
Q3. Many environmental issues involve difficult trade-offs with the economy. Which of the following statements best describes your view? The highest priority should be given to protecting the environment, even if it hurts the economy, Both the envi-ronment and the economy are important, but the environment should come first…
Q5. If the Swedish National Energy Administration has 100 Million SEK to spend, which do you think should be the two top priorities? Energy conservation, More efficient cars and trucks, Nuclear power…
Q10. From what you know about global warming, which of the following statements comes closest to your opinion? Global warming has been established as a serious problem and imme-diate action is necessary, There is enough evidence that global warming is taking place and some action should be taken…
Q11. Assuming that global warming is a problem, what do you think Sweden is likely to do about it? I believe that firms and government researchers will develop new technologies to solve the problems, I believe we will have to change our lifestyles to reduce energy consumption…

Study 1
21
Table 2: The survey questions grouped into understanding, attitudes and willingness to pay
RESULT SECTION QUESTIONS IN THE SURVEY
Q12a. What is the appropriate level for controlling greenhouse gas emissions? National level, European level, International level…
Q12b. What do you think of the Swedish emission target to reduce emissions by 4% by 2012? Desireable and reasonable, Desirable but impractical ...
Q12c. The US government says that it won’t join the Kyoto Protocol (an international treaty to limit emissions of greenhou-se gases) because it would hurt the US economy and is based on uncertain science. Do you think the US position is right or wrong? Right, Wrong, No opinion
Q13. The following technologies have been proposed to address global warming.If you were responsible for designing a plan to address global warming, which of the following technologies would you use? Solar energy, Energy efficient appliances, Carbon Capture and Storage (CCS)…
Q14. How can we best address the issue of global warming? (With information about future generation potentials and pro-duction costs) Expand renewables, Expand nuclear power, Reduce electricity consumption, even if it means lower economic growth, Continue using fossil fuels but with CCS …
Q15. Do you believe that we have responsibility to look out for the interests of future generations, even if it means making our-selves worse off? Yes, No, No opinion
Q16. Do you think we (the Government) should increase foreign aid, let it stay the same, decrease it or remove it entirely? Increase, Stay the same, Decrease…
WILLINGNESS TO PAY TO SOLVE GLOBAL WARMING
Q17. How do you heat your home? Electricity, District heating, Biomass (Wood)…
Q8. How much is your monthly electricity bill? Less than 75 SEK (~$11), 75-150 SEK (~$11-21)…
Q9. If it solved global warming, would you be willing to pay [value] more per month on your electricity bill? Nothing extra, 35 SEK (~$5), 70 SEK (~$10)…

Study 1
22
The questionnaire was distributed in December 2004 by Statistics Sweden (SCB), a central govern-ment authority for official governmental statistics and other statistics. A sample (n=1500 persons) of the national population aged 18 to 65 years received a printed version of the questionnaire by mail. In total, 742 responded to the questionnaire yielding a response rate of 49 % which was consi-dered to be statistically representative for the group studied, although this response rate was somewhat lower than a typical response rate of surveys on less technical subjects. Thus, the reason for the lower response rate is assumed to be that the ques-tionnaire was considered a bit more complicated to fill out than the typical questionnaire used by SCB. The results of the questionnaire are listed in a report written by SCB (Kurt, 2005).
In general, the Swedish survey had the same or similar questions as the survey in the US and UK. The seventeen questions addressing environmental issues were mainly the same between the surveys. When they differed, it was due to national condi-tions affecting the possible answers for the respon-dents. For example, in Question 17, the respon-dents were asked about how they heat their homes. In the Swedish study, district heating was included as an alternative, since district heating plays an important role in the Swedish heating market. In the US and UK studies, district heating was not included as it only accounts for a small share of the heating market.
The Swedish survey, as well as the US and UK survey, differed in several respects from the Ja-
panese survey. The Japanese survey consisted of four parts. In the second part, nine of the questions were designed in the same or in a similar way as in the other three surveys. Due to a problem in the distribution step of the Swedish survey, however, it was not possible to compare the results with one of the nine questions in the Japanese survey. Hence, when comparisons are made below, Japanese results are included in eight questions.
Table 3 summarizes other characteristics of each survey such as way of distribution, sample number and response rate. In both the Swedish and Japa-nese surveys, the questionnaires were distributed in printed versions, while Internet polling was used in the US and UK surveys. In all surveys but the Japanese, the respondents represented a sample of the national population. In the Japanese survey, respondents were selected in the cities of Tokyo and Sapporo only. The sample size was the largest in the UK survey and the smallest in the Swedish survey. However, in relation to the total number of inhabitants in each country/region, the sample size was the largest in the Swedish survey. The US and Japanese surveys showed the highest response rates (70 and 64 %, respectively). The relatively low response rate in the Swedish survey (49 %) meant a bias in share of female respondents. 44 % of the respondents were female, while the corresponding figure for the national population aged 18-65 years was 49 % (Statistics Sweden, 2005). The other three surveys had an almost 50/50 split between female and male respondents. The average/median age of the respondents was fairly similar in all four studies.

Study 1
23
Table 3: Comparison between the Swedish, US, UK and Japanese surveys
COUNTRY METHOD OF DISTRIBUTION SampleResponse
rate
Female/male share of respon-dents (%)
Average age of respon-
dents
Sweden
Printed version of the questionnaire was sent to a sample of the national popula-tion aged 18-65 years
1 500(total
population~ 9 Million)
7�2 (�9%) ��/56 �3
US
Internet polling distributed by Knowledge Networks, a consumer information com-pany. Knowledge Networks has recruited an online research panel designed to be representative of the entire US popu-lation. A random sample was drawn of panel members aged 18 years or older (Curry 200�).
1 710(total
population~ 290 Million)
1 205(70 %)
52/�8 �62
UK
Internet polling distributed by YouGov, an online polling company. YouGov maintains a panel of �6,000 electors in the United Kingdom, recruited via non-political websites through invitations and pop-up advertisements. Results are weighted based on demographic informa-tion provided by the panelists to YouGov (Curry et al. 2005).
2 6�0(total
population~ 60 Million)
1 056(�0 %)
52/�8 �0-�93
Japan
A multi-stage stratified sampling method from theBasic Resident Register was used to choose people aged 20 or older in the cities Tokyo and Sapporo. Surveyors visi-ted people and asked them to participate in the survey. If they agreed, surveyors left a printed questionnaire (Itaoka et al 200�).
1 57�(total
population in Tokyo and Sapporo
~ 10 Million)
1006(6� %)
51/�9�7
2) median value3) YouGov provided categorical variables for age (Curry et al 2005)

Study 1
2�
Other Swedish studiesAs mentioned above, the results of the Swedish sur-vey are compared with results from two other Swe-dish studies which contain some questions similar to those in the Swedish survey. They were also perfor-med around the same time as the Swedish survey.
These studies are also of special interest since they have been carried out on a regular basis over several years and, thus, they allow an estimate of how the public can be expected to change opinions over time. The two studies are:
1) The SOM study: SOM stands for Society, Opinion, and Media. The SOM study has been performed annually since 1986. The purpose of the study is to map the Swedish public’s habits and attitudes concerning society, politics and media. We have chosen to focus mainly on the latest published results of the questionnaire, which was distribu-ted to a sample of the Swedish population aged 15 to 85 years in mid-September 2004. Two partly different versions of the questionnaire were used, and each type of questionnaire was sent to 3,000 persons. Both types of questionn-aires included around 100 questions, with one of them including a section with 12 questions on the topic of environment and energy. Of these 12 questions, we found four questions to be rele-vant to compare with our results. The response rate for the SOM questionnaire as a whole was 59 %. The gender distribution of the respon-dents was the same as for the nation as a whole in the age group 15-85 years (50 % female, 50 % male respondents). More detailed information about the SOM study is given by Holmberg and Weibull (2005).
2) The Swedish EPA study: Since 2002, the Swedish Environmental Protec-tion Agency has commissioned an annual study of the Swedish public’s attitude and knowledge about climate change. The studies have been performed through telephone interviews with a sample of the population aged between 16 and 75 years. During 2002-2004, the interviews were carried out in October-November and 2,000 persons were interviewed. In 2005, the interviews were carried out in August-Septem-ber and 1,000 persons were interviewed. In all studies, the average age of the respondents has been around 45 years. In relation to our study, we found one question to be particularly rele-vant. More detailed information about the study is provided by Söderström and Ottander (2005).

Study 1
25
ResultsThis chapter presents the survey results divided according to the grouping of the questions given in Table 2, i.e.:
Public Understanding
Public Attitudes
Willingness to Pay to Solve Global Warming
Thus, the chapter has the same basic structure as in the US study (Chapter 4 in Curry 2004). The reason for this is to facilitate further comparisons for the readers. For each question, we first present the results from the Swedish survey. This is fol-lowed by a comparison with the surveys in USA, UK and Japan. When possible, associations are also made with the two above mentioned SOM and EPA studies.
Public understandingAs seen from Table 2 the survey incorporated one question on carbon dioxide sources and sinks (Q7) and two questions on recognition and understan-ding of CCS (Q4 and Q6).
Understanding of global warmingIn Question 7, respondents were asked if speci-fic technologies or systems increased, decreased or had no impact on the atmospheric levels of CO2 (cf. Q7 in Table 2). Respondents could also answer that they were not sure. The results for the Swedish public are summarized in Figure 10 from which it can be seen that Swedish people generally understand that automobiles, factories and coal burning plants increase the atmospheric levels of CO2. There is also a basic understanding about trees reducing the CO2 levels. Almost 17 % of the respondents believe that nuclear power leads to increased CO2 levels.

Study 1
26
For some of the categories in Figure 10, we can make a comparison to the Swedish EPA-study (Söderström and Ottander, 2005), where the re-spondents were asked about how different sectors of society contribute to increasing global warming. In 2004, 91 % believed that automobiles contri-bute to a high degree or to a certain degree. 15 % believed that the nuclear power industry contribu-tes to a high degree to increase global warming, while 22 % believed this industry contributes to a certain degree. As regards farming, 14 % of the respondents believed farming contributes to a high degree while 44 % believed it contributes to a certain degree. The results in Figure 10 are in line with these results, especially concerning automobi-les, but also with respect to the significant fraction
who believes nuclear power increases CO2 in the atmosphere.
Figure 11 compares the answers from the Swedish public about nuclear power leading to increased at-mospheric CO2 levels with corresponding answers from the other surveys. There is some significant difference in that the share of ‘Not sure’ responses is clearly smaller in the Swedish survey compared to the surveys of the other regions. This might show that the public to a larger extent has taken a position on nuclear power due to the long lasting national debate on the use of nuclear power in Sweden, with the result that the public is more in-formed about this technology. This debate has been going on (with varying intensity) since the 1970s.

Study 1
27
Question 7:
Responses regarding nuclear power
Figure 11: Comparisons of responses to Question 7 in the surveys in Sweden, US, UK and Japan .
Question 7:
There is a growing concern about increasing levels of carbon dioxide in the atmosphere. How do you think the fol-lowing contribute to these levels?
Figure 10: Responses from the Swedish public to Question 7

Study 1
28
Question �:
Have you heard of or read about any of the following in the past year (200�)?
Figure 12: Respon-ses from the Swedish public to Question �
Public understanding of CCSQuestion 4 inquired whether the public had heard of or read about CO2 reduction technologies in general. More than one option could be marked and the results are summarized in Figure 12. As can be seen from the figure, a majority of the re-spondents have heard or read about more efficient cars, nuclear energy, wind energy, solar energy and more efficient appliances. More than half of the respondents are informed about biomass/bio-energy. About 15 % have heard or read about carbon capture and storage (CCS). Less than 10 % have heard or read about carbon sequestration. The low number for CCS is expected since it is a new technology.
In Figure 13, we have compared the results con-cerning carbon sequestration, carbon capture and storage, and biomass/bioenergy with the surveys in the US, UK and Japan. A difference is that a relatively large share of the Swedish public has
heard of or read about biomass/bioenergy, especi-ally compared to the US and UK. The difference could be due to the comparatively large use of biomass/bioenergy in Sweden. On the topic of carbon capture and storage, the Swedish values are not as high in Japan, but higher than in the US and UK. For carbon sequestration, the values are especially high in Japan.
In Question 6, the respondents were specifically asked about carbon capture and storage (CCS) and how it affects different environmental pro-blems. As can be seen in Figure 14, the respon-dents could choose to answer that CCS increases or decreases the environmental problem, that it does not affect the environmental problem, or that they were not sure.
Around 58 % of the respondents correctly marked that CCS can reduce global warming. Yet over 30 % of the respondents incorrectly believe that

Study 1
29
Question �:
Have you heard of or read about any of the following in the past year (200�)?
Figure 13: Comparisons of responses to Question � in the surveys in Sweden, US, UK and Japan.
CCS can reduce acid rain, ozone depletion, smog and water pollution. The results indicate that the Swedish public has a poor understanding of the purpose of using CCS.
Comparing the Swedish survey in Figure 15 with the other three surveys reveals that the understanding of
CCS and global warming seems to be clearly higher in Japan and clearly lower in the US. A larger share of the respondents in the US and UK are not sure whether CCS can reduce global warming when eva-luated with those in Sweden and Japan.

Study 1
30
Question 6:
Please select if “carbon se-questration” or “carbon capture and storage” can reduce each of the following environ-mental concerns
Figure 14: Responses to Question 6.
Question 6:
Please select if “car-bon sequestration” or “carbon capture and storage” can reduce each of the follo-wing environmental concerns. Respon-ses regarding global warming
Figure 15: Responses to Question 6.

Study 1
31
Public attitudesThe survey included 11 questions on public at-titudes toward general environmental and societal problems (Q1-Q3, Q5), global warming (Q10-12), climate change-mitigation technologies (Q13-14) and future generations and foreign support (Q15-16).
Attitudes toward environment in relation to other socio-economic issuesIn Question 1, the respondents were asked to rank the three most important issues facing Sweden to-day (cf. Q1 in Table 2). In total, there were 20 av-ailable issues to choose from, as can be noted from Figure 16. Health care rank as the top priority, followed by unemployment. Problems concerning the environment, as a general group, ranks fifth on the list (denoted ‘Environment’ in Figure 16). It is worth noting that women rank ‘Environment’ fourth on the list, while men rank it in sixth place. The same observation could be made for respon-dents supporting the governmental (‘left’) parties versus respondents supporting the opposition of ‘right’ parties, i.e. ‘lefts’ rank environment higher than ‘rights’ (in fourth and seventh place respecti-vely).
The Swedish SOM study (Holmberg and Weibull, 2005) included a question similar to Question 1 where respondents were asked to mark the most important problem(s) in the Swedish society of today. Respondents could mark maximum three out of seventeen alternatives, which for the most part were practically the same or similar as in our study. In the study for the year 2004, which is the most recent SOM study available in literature, health care was ranked as the top priority, followed by employment rate. As in our survey, the deno-
mination ‘Environment’ referred to environmental problems in general. In the SOM study ‘Environ-ment’ ranked tenth on the list, meaning a lower relative priority compared to our survey where it ranks fifth on the list. It is, however, possible that the stronger focus on energy and climate issues in our survey compared to the SOM study may have influenced the respondents to consider ‘Environ-ment’ as relatively more important.
From the SOM study we can also observe the public’s responses over time to the question have been included since 1987. During 1987-1990, ‘En-vironment’ was ranked as the top priority. During the first half of the 1990s, however, ‘Environment’ gradually was considered less important in relation to other problems in society. Since 1998, ‘Environ-ment’ has never been ranked higher than seventh in the SOM study. As seen from Figure 17, environment has higher support as an important issue in Sweden than in the US and UK (this question was not included in the survey for Japan). In the US and UK, ‘Envi-ronment’ ranks as thirteen and eight respectively. In both US (first place with 42 %) and UK (second place with 39 %), terrorism ranks high, which is a large difference compared to the Swedish survey (eighteenth place with 2 %).
The SOM study had two questions where the issue of terrorism was included. The first one has already been mentioned above as similar to Question 1 in our survey. Also in the SOM study, terrorism was ranked low. Only 3 % of the respondents mentio-ned terrorism, defence or security as an important problem (Holmberg and Weibull, 2005). Accor-ding to Holmberg and Weibull (2005) the reason

Study 1
32
for the low value in the SOM study could be that the question asked about problems facing Sweden. In the second question in the SOM study where ter-rorism was included, respondents were asked what makes them worried about the future. This was a
more general question, which was not linked to Sweden. Responses showed that terrorism then was ranked as the top priority.
Question 1:
What are the three most important is-sues facing Sweden today?
Figure 16: Responses from the Swedish public to Question 1.
Question 1:
What are the three most important is-sues facing Sweden today?
Figure 17: Comparison of responses to Question 1 in the surveys in Swe-den, US and, UK. The survey in Japan did not include this question.

Study 1
33
In Question 2, the respondents were asked to choo-se the two most important environmental problems facing Sweden (cf. Q2 in Table 2). As shown in Figure 18, people could choose from 11 different environmental problems. Global warming ranks as the top priority, followed by ozone depletion and destruction of ecosystems.
The SOM study included a similar question where the respondents were asked to give their opinion on eight different threats to the environment. For each threat, the respondents had to mark one out of ten alternatives, ranging from 1 (‘very little threat’) to 10 (‘very large threat’). For each threat, an average value was then calculated. The 2004 results sho-
wed the largest average value for ozone depletion (8.4), followed by global warming (8.2). In the previous years, since global warming was included in the SOM study (2002 and 2003), ozone deple-tion had also slightly higher average values than global warming. Comparing these results to Figure 18, it seems a bit surprising that the respondents in our survey clearly rank global warming before ozone depletion. According to the UK survey global warming is also a top priority as can be seen in Figure 19. In the USA, however, the public considers water pollu-tion to be the top priority. Global warming ranks as number six priority.
Question 2:
Which are the two most important environmental problems facing Sweden today?
Figure 18: Responses from the Swedish public to Question 2.

Study 1
3�

Study 1
35
In Question 3, people could choose between four statements about the priority between saving the environment and protecting the economy. As can be seen in Figure 20, respondents could also answer that they were unsure. Around 68 % consi-der the environment to be the first priority, while only 24 % rank the economy as more important or slightly more important. Among men and respon-dents supporting the opposition (‘right wing’ at
present), a relatively large share holds the economy to be the first priority (30 and 35 % respectively).
As in Sweden, more than half of the people asked in the US and UK consider the environment to be the first priority (cf. Figure 20). However, there is larger support for protecting the economy, especi-ally in the US.
Figure 19: Comparisons of responses to Question 2 in the surveys in Sweden, US and, UK. The survey in Japan did not include this question.
Question 2:
Which are the two most important environmental problems facing Sweden today?

Study 1
36
In Question 5, the respondents were asked to give their opinion on what the Swedish National Energy Administration should do if it had an extra 100 Million SEK to spend. They could choose two out of 13 options as seen in Figure 21. New energy sources are considered the top priority, followed by energy conservation, more efficient cars and nuclear power. Nuclear power is chosen to a com-paratively larger extent by men and respondents supporting the (‘right wing’) opposition (25 % and 33 % respectively). Ways to remove carbon from atmosphere are ranked as the sixth priority. It is possible, however, that the wording of the alterna-tives may have influenced the results. For example,
if the term ‘Technologies to reduce global war-ming’, which directly addresses global warming, had been used instead of the more indirect term ‘Ways to remove carbon from the atmosphere’, this alternative might have been ranked higher.
Respondents in the US and UK also regard new en-ergy sources as the top priority in Figure 22. Ways to remove carbon from the atmosphere are con-sidered of less priority compared to the Swedish survey. As in the case of Question 1, the terrorism related option has a much higher priority in the US and UK than in Sweden.
Question 3:
Many environme-ntal issues involve difficult trade-offs with the economy. Which of the fol-lowing statements best describes your view?
Figure 20: Compa-risons of responses to Question 3 in the surveys in Sweden, US and UK. The survey in Japan did not include this question. NB! The US study did not include the option ‘Unsure’.

Study 1
37
Question 5:
If the Swedish National Energy Administration has 100 Million SEK to spend, which do you think should be the two top priori-ties?
Figure 21: Responses from the Swedish public to Question 5.
Question 5:
If the Swedish National Energy Administration has 100 Million SEK to spend, which do you think should be the two top priorities?
Figure 22: Compa-risons of responses to Question 5 in the surveys in Sweden, US and, UK. The survey in Japan did not include this question.

Study 1
38
Question 10:
From what you know about global war-ming, which of the following statements comes closest to your opinion?
Figure 23: Comparisons of responses to Question 10 in the surveys in Sweden, US, UK, and Japan.
10) Question 6 (in part 2) in the Japanese study
Public attitudes toward global warmingIn the survey, three questions addressed the public’s general opinion about global warming, the effect of global warming on our lifestyles, and the current governmental policy on controlling green-house gas emissions (cf. Table 2). The last question was divided into three sub-questions with respect to the public’s opinion on the appropriate level for controlling greenhouse gas emissions (Q12a), on the Swedish national goal of reducing greenhouse gas emissions by 4 % by 2012 compared to the 1990 level (Q12b) and on the US government posi-tion not to sign the Kyoto protocol (Q12c).
In Question 10, the respondents had to choose between four statements concerning to what extent global warming exists and whether actions are required. They could answer that they had no opinion as can be noted in Figure 23. More than 80 % of the respondents in Sweden believe that global warming is taking place and that immediate action
or some action should be taken. Only 2 % of the re-spondents as a whole choose the alternative ‘Con-cern about global warming is unwarranted’. No female respondents and no respondents supporting the governmental parties choose this alternative.The support for action against global warming is also strong in the studies in UK and Japan (see Figure 23). In the US survey, the support is lower. A comparatively large fraction of the respondents in the US study has no opinion.
In Question 11, the respondents had to choose between five statements on how global warming would change our way of living. The respondents could answer that they had no opinion, as shown in Figure 24. About one third of the respondents believe that industry and government researchers will develop new technologies to solve the pro-blems associated with global warming. Men and supporters of the opposition believe this to a larger extent (37 and 38 % respectively) than women and

Study 1
39
supporters of the present government. Around 20 % believe that we have to change our lifestyles in order to reduce energy consumption. Supporters of the governmental parties especially have this opinion (27 %). Only 2 % of the respondents do not consider global warming to be a problem.
Comparing these results to the answers to Question 2 (cf. Figure 18), the share of respondents conside-ring global warming to be one of the two most im-portant problems facing Sweden corresponds well to the total share of respondents choosing the two strongest measures to reduce global warming (de-velop new technologies and change our lifestyles) in Figure 24. However, this observation should be interpreted with care, since we are only comparing the total responses, i.e. we have not examined how each individual responded to Questions 2 and 11. A further examination of this would be necessary to support the observation.
Comparing the four regional surveys (cf. Figure 24), it is interesting to note that it is only in Japan that the public strongly believes that we have to change our lifestyles in order to reduce energy consumption. Another interesting difference is that a relatively large share of the public in the US and UK believes that global warming is a problem but that their nation will not do anything about it.
Question 12 asked the respondents about the policy on the subject of regulating greenhouse gas emissions. The question was divided into three sub-questions with respect to the public’s opinion on the appropriate level for controlling greenhouse gas emissions (Q12a), the Swedish national goal of reducing greenhouse gas emissions by 4 % by 2012 compared to the 1990 level (Q12b) and the US government position not to sign the Kyoto protocol (Q12c). In Question 12a, for which the results are given in Figure 25, the respondents could choose either national, European, or international level or
Question 11:
Assuming that global warming is a problem, what do you think your nation is likely to do about it?
Figure 24: Comparisons of responses to Question 11 in the surveys in Sweden, US, UK, and Japan. NB! The US survey did not include the option ‘No opi-nion’. The Japanese survey did not include the option ’I believe we will do nothing since global warming is not a problem’.

Study 1
�0
stating that they had no opinion. A large majority (71 %) believes international is the appropriate level.
In Figure 25, we have also included the results in the UK survey. This question was not included in the surveys in the USA and Japan. In the UK there is a slight majority for the international level. Almost one quarter of the respondents do not have an opinion.
In Question 12b, the respondents were asked to give their opinion on the Swedish national goal of reducing greenhouse gas emissions by 4 % by 2012 compared to the 1990 level. The respondents could choose between four statements, one being ‘no opi-nion’ as can be noted from Figure 26. Almost 50 % believe the goal was desirable and reasonable. Women and respondents supporting the govern-mental parties believe the goal to be desirable and reasonable to a larger extent (52 % and 55 % respectively) than men and respondents supporting the opposition (46 % for each category). In total, around 88 % believe the goal was desirable.
In Figure 27, we present the answers to Question 12b for the Swedish survey and the UK survey (this question was not included in the surveys for the US and Japan). A comparison between the surveys is hard to make, since the UK survey related to the national goal of reducing greenhouse gas emissions by 60 % by 2050. Both the goal and the time perspective were thus very different from the Swedish survey. Nevertheless, it is interesting to note that also in the UK survey, a large share (around 83 %) of the public believes that the goal is desirable.
In Question 12c, the respondents had to give their opinion about the US government not signing the Kyoto protocol. The respondents could choose between answering that the US position was right or wrong and that they had no opinion as seen in Figure 28. A large majority of the Swedish population (around 79 %) believe the US position is wrong.
This question was also included in the US study, but obviously with the difference that it concerned
Question 12a:
What is the appropri-ate level for control-ling greenhouse gas emissions?
Figure 25: Comparison of responses to Question 12a for the surveys in Sweden and UK.

Study 1
�1
the respondents’ own country. The results show that only 30 % of the US respondents believe that the US position is wrong. To what extent this large difference compared to the Swedish survey can be explained by general contrasts in national support from the way the question was asked or from cont-rasts in public attitudes on global warming is not
known, although the large difference indicates that it should be a combination of both kinds of cont-rasts (i.e. not solely to the contrasts in the national perspective on the question). Furthermore, half of the respondents in the US survey have no opinion as to whether the US position is right or wrong, wheras only 17% of the Swedes take this position.
Question 12b:
What do you think of the Swedish emis-sion target to reduce emissions by � % by 2012?
Figure 27: Results in Question 12b for the sur-veys in Sweden and UK. NB! The national goal for the UK is a reduction by 60 % by 2050.
Question 12b:
What do you think of the Swedish emis-sion target to reduce emissions by � % by 2012?
Figure 26: Responses from the Swedish public to Question 12b.

Study 1
�2
Question 12c:
The US government says that it won’t join the Kyoto Protocol (an international treaty to limit emis-sions of greenhouse gases) because it would hurt the US economy and is based on uncertain science.Do you think the US position is right or wrong?
Figure 28: Comparison of responses to Question 12c for the surveys in Sweden and the US.
Public attitudes toward climate change-mitigation technologiesThere were two questions on the public’s preferen-ce for different climate change-mitigation options. The questions addressed both climate change-miti-gation in general and options related to electricity production.
In Question 13, the respondents had to give their opinion on whether to use or not to use different measures for reducing global warming (cf. Table 2). The respondents could choose between defini-tely use, probably use, not sure, probably not use and definitely not use, as can be observed from Figure 29. In the figure, we can note that there is a strong preference for using energy efficient cars, wind energy, energy efficient appliances and solar energy. Almost half of the public is not sure whether to use CCS. The other half is roughly divided between using it and not using it. There are only small differences between men and women
and between supporters of the governmental parties and the opposition, respectively.
The SOM study has a question similar to Question 13. Respondents were given a list of ‘energy sour-ces’, which consisted of a combination of techno-logies and fuels for heat and electricity production (hydropower, wind energy, nuclear energy, solar energy, bioenergy/biomass, natural gas, coal and oil). Respondents were then asked to what extent they think each of these ‘energy sources’ should be used over the coming 5-10 years. For each ‘energy source’, respondents could answer that we should make more effort, the same effort as today, less effort than today, or no effort - i.e. that we should abandon using the ‘energy source’. The same strong preference for wind energy and solar energy as in our survey could be observed. 73 % believed we should put more effort into using wind energy, while 79 % believed we should put more effort into using solar energy. The support for bioenergy/bio-

Study 1
�3
mass was lower 45 % believed we should put more effort into using it. One reason for this might be that there already is a large-scale use of bioenergy/biomass in Sweden. Only 14 % believed we should put more effort into using nuclear energy.
The lower support for nuclear energy compared to wind energy and solar energy is also shown in our survey. 25 % of the respondents would definitely use nuclear energy to address global warming while 51 % and 65 % of the respondents would definitely use wind energy and solar energy respec-tively (see Figure 29). Comparing our survey and the SOM study thus reveals stronger preference in the SOM study for using wind energy or solar energy over nuclear energy. One reason for this might be that our survey focuses on the interaction between using the ‘energy source’ and its effect on global warming only. It might be the case that the respondents in the SOM-study to a larger extent have considered other aspects of nuclear energy,
such as nuclear waste disposal problems and pro-blems with radioactivity due to plant breakdowns.
Comparing the results from the four countries, both similarities and differences can be observed. In all four countries, around 70-90 % of the public would definitely or probably use energy efficient cars, wind energy, energy efficient appliances or solar energy to address global warming. The support for iron fertilization of the oceans is generally weak, only 15-25 % would definitely or probably use this method. Carbon sequestration is clearly a more popular option in Japan than in Sweden (90 % and 56 % respectively would definitely or probably use this method) with the US and UK in between. As can be seen in Figure 30, the Swedish survey results for CCS are similar to results from the surveys in the US, UK and Japan. The largest share of the public in each country is not sure whether to use the technology. The rest are roughly divided between using it and not using it.

Study 1
��
Question 13:
The following tech-nologies have been proposed to address global warming. If you were respon-sible for designing a plan to address glo-bal warming, which of the following technologies would you use?
Figure 30: Comparisons of responses to Question 13 in the surveys in Swe-den, US, UK, and Japan.
Question 13:
The following technolo-gies have been propo-sed to address global warming. If you were responsible for desig-ning a plan to address global warming, which of the following techno-logies would you use?
Figure 29: Responses from the Swedish public to Ques-tion 13.

Study 1
�5
In Question 14, the respondents were given a number of options and were asked to select their best option to address global warming related to electricity production. The respondents also recei-ved rough estimates of the electricity production costs and the CO2 emissions from each technology option, including a short note on their future gene-ration potential. This was compared to the current electricity production cost.
In Figure 31, we can observe that the Swedish respondents prefer to expand renewables, to invest in R&D or to expand nuclear power. In total, 87% of the respondents choose one of these three options. There are significant differences between men and women as well as between supporters of the governmental parties and the opposition. Men and supporters of the opposition prefer to a larger extent to expand nuclear power (28 % and 40 % respectively compared to 19 % and 16 % for fema-les and governmental supporters), while women
and supporters of the governmental parties favour expanding renewables (40 % for both groups).
We can also note that there is weak support for continuing to use fossil fuels with CCS. But, as indicated above (cf. Question 4), the Swedish pu-blic is to a large extent unaware of this technology. Furthermore, Question 4 indicates that the public in the UK and the US are even more unaware of CCS than the Swedish public. Yet the Swedish support for CCS is significantly lower than in the US and UK surveys, which are also included in Figure 31. The answers to Question 4 and 14 might thus re-veal a generally more positive attitude towards coal and other fossil fuels among the public in the UK and the US than among the Swedish public. This might be explained by the fact that in the UK and US coal and other fossil fuels currently contribute a much larger share of the heat and power production than in Sweden.
Question 1�:
How can we best add-ress the issue of global warming?
Figure 31: Comparison of responses to Question 1� for the surveys in Sweden, USA and UK. This question was included in the Japanese sur-vey, but without giving the re-spondents information about future generation potentials and production costs. The-refore, we have not included the Japanese results. NB! In the US survey, the option ‘No opinion’ was not included.

Study 1
�6
Public attitudes toward future genera-tions and foreign supportThe respondents were asked to give their opinion on to what extent we should take responsibility about future generations and support to developing countries.
In Question 15, the respondents had to consider whether we have a responsibility to look out for the interests of future generations, even if it means making ourselves worse off. Respondents could answer yes, no, or no opinion as can be observed from Figure 32. There is very strong support for the responsibility to look out for future generations in the Swedish survey as well as in the US and UK surveys.
In Question 16, the respondents had to select one option on the topic of the future development of foreign aid. They could choose between increasing
it, letting it stay the same, decreasing it, removing it entirely, and not to give an opinion. The results are given in Figure 33. A majority (52 %) of the Swedish respondents believes we should increase the foreign aid whereas around 12 % have the opinion that Sweden should reduce the foreign aid. This result is in line with the results of a similar question in the SOM study, where respondents were asked if they considered reducing foreign aid to be a good or bad proposal (Holmberg and Wei-bull 2005b). Around 47 % answered that reducing foreign aid was a very bad or fairly bad proposal (thus indicating a positive attitude towards foreign aid) while 22 % considered this to be a very good or fairly good proposal. In the SOM study, this share peaked in 1996 and 1997 (38 %). From 2001 and onwards, it has been stable at around 22 %.
There is a significant difference between the Swe-dish results and the results of the US and UK sur-
Question 15 :
Do you believe that we have a respon-sibility to look out for the interests of future generations, even if it means making ourselves worse off?
Figure 32: Comparison of responses to Question 15 for the surveys in Swe-den, USA and UK. This question was not included in the Japanese survey NB! In the US survey, the option ‘No opinion’ was not included.
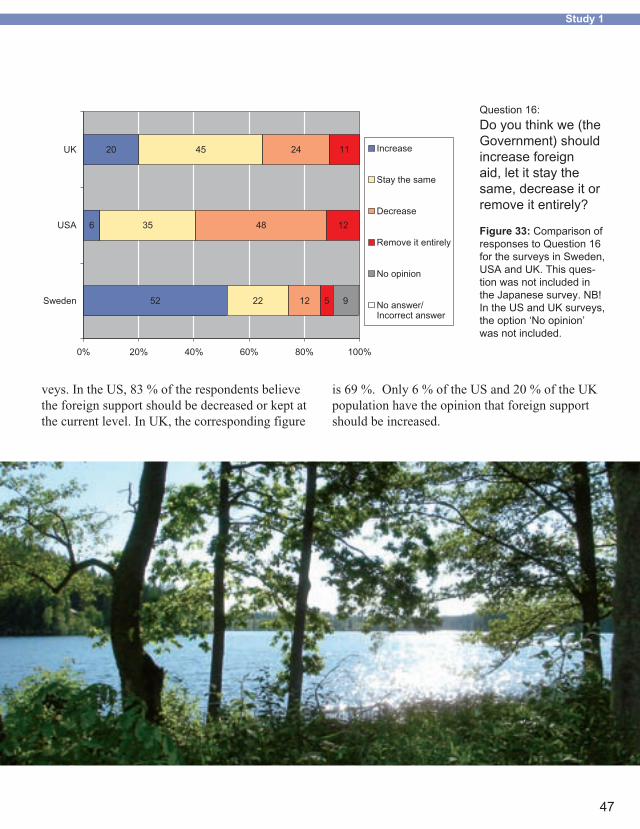
Study 1
�7
Question 16:
Do you think we (the Government) should increase foreign aid, let it stay the same, decrease it or remove it entirely?
Figure 33: Comparison of responses to Question 16 for the surveys in Sweden, USA and UK. This ques-tion was not included in the Japanese survey. NB! In the US and UK surveys, the option ‘No opinion’ was not included.
veys. In the US, 83 % of the respondents believe the foreign support should be decreased or kept at the current level. In UK, the corresponding figure
is 69 %. Only 6 % of the US and 20 % of the UK population have the opinion that foreign support should be increased.

Study 1
�8
Willingness to pay to solve global warmingThis section comprises three survey questions. The first two offer an orientation on how the respon-dents heat their homes and how much they pay monthly for electricity (Q17 and Q8 respectively). Thus, these questions provide a background to bet-ter understanding of results from the third question (Q9), where respondents are asked about how much more they are willing to pay monthly for electricity if it solves global warming.
In Question 17, respondents could choose between seven options for how their home was heated, including a ‘not sure’ alternative. They were asked to mark only one alternative. Nevertheless, many multiple answers were received and it was decided to allow for this as the frequency was high. This explains why the sum of the bars in Figure 34 adds up to over 100 %. Looking at the result, we can ob-serve that electricity, district heating and biomass
are the most common heating systems among the population.
In Figure 35, we have compared the results of Question 17 between the surveys for Sweden, US and UK. In order to make this comparison, we had to re-calculate the Swedish results, since the sum of all answers in Figure 35 added up to over 100 % (as explained above), which was not the case in the US and UK studies. We assumed the same propor-tional distribution as in Figure 35, but we reduced each share to make the sum 100 %. The share of electricity is the highest in Sweden, although the difference compared to the US is small. However, one should bear in mind that electricity is also consumed in the heat pumps. Heat pumps were not an available option in the US and UK surveys. Assuming that respondents using heat pumps in the US and UK marked the option ‘Other’, it is clear that heat pumps are used to a larger extent among the Swedish respondents (which also agrees with
Question 17:
How do you heat your home?
Figure 34: Responses from the Swedish public to Question 17.

Study 1
�9
Question 17:
How do you heat your home?
Figure 35: Compari-son of responses to Question 17 for the surveys in Sweden, USA and UK. This question was not included in the Japanese survey. NB! In the Swedish survey, ‘No Heating’ was not included. In the US and UK surveys, ‘District heating’ and Heat pump’ were not included.
available knowledge, e.g. from national statis-tics). The Swedish results of Question 17 agree fairly well with national statistics on heating systems (STEM 2005). As expected, in the US and UK, instead, natural gas is the heating source with the largest share among the respondents. In all, it seems that most people are aware of how their homes are heated.
In Question 8, the respondents were asked about their monthly electricity bill. Respondents could choose between 8 different levels. They could answer that they did not know (or that the cost for electricity is included in the rent) (cf. Figure 36). In Sweden, 49 % of the respondents pay SEK 500 (approx $70) or more per month.
With respect to comparing Question 8 between the different regions, there is a difference in cost intervals in the surveys. This is partly due to the exchange rate used when converting from Swedish, British and Japanese currency into dol-lars. The different cost intervals make it difficult to compare the results. Compared to the other countries, however, the monthly electricity costs seem to be lower in the UK (e.g. only 28 % of the respondents pay $73 or more per month). In comparison to the US and Sweden this seems reasonable considering the lower share of electri-city used for home heating in the UK as shown in Figure 35.

Study 1
50
Question 8:
How much is your monthly electricity bill?
Figure 3.27: Responses from the Swedish public to Question 8.
In Question 9, the respondents had to consider how much additional money they would be willing to pay on their monthly electricity bill in order to solve global warming. They could choose between six options and marking that they were unsure; cf. Figure 37. Almost 43 % of the Swedish respon-dents are not willing to pay anything extra to solve global warming, while 42 % are willing to pay $5 or more per month. Men and supporters of the op-
position are relatively more reluctant to pay extra to solve global warming (50 % and 48 %, respecti-vely, are not willing to pay anything extra).
As for Question 9 a comparison between regions is not straightforward due to the difference in intervals. Nevertheless, it can be concluded that the Swedes are most reluctant to pay extra on their electricity bill to solve global warming.
Question 9:
If it solved global warming, would you be willing to pay [value] more per month on your elec-tricity bill?
Figure 37: Responses from the Swedish public to Question 9.

Study 2
51
Study 2

Study 2
52

Study 2
53
Study 2. A survey of Swedish stake-holder attitudes towards Carbon Capture and Storage (CCS)
MethodThe survey consisted of a written questionnaire with 31 questions. The questions were organized in different sections as is shown in Table 4 (Questions 29-31 addressed specific demographic topics and are not included in the table). Some of the ques-tions were divided into sub-questions (e.g. Ques-tions 19a and 19b). For all questions but one, the respondents could make a choice between several
available alternative answers. The exemption to this – Question 28b – was an open-ended question where respondents were asked to state information or events that might change their organization’s current attitude towards CCS. For some of the questions, respondents could add their own alter-natives to complement the options available (e.g. Question 21).

Study 2
5�
Table 4: The survey questions grouped into climate change and different aspects of CCS
SECTION IN THE SURVEY QUESTIONS IN THE SURVEY
GENERAL BACKGROUND ON CLIMATE CHANGE
Q1. How serious do you consider the threat of climate change to be relative to other problems facing society (such as starvation, poverty, crime etc)? Much more serious than other problems, More serious than other problems, Similar to other problems..
Q2. What impact do you think national and international regula-tion related to climate change will have on emissions of carbon dioxide and other greenhouse gases over the next 20 years? Regulation will lead to very large reductions in emissions, Regulation will lead to large reductions, Regulation will lead to moderate reductions…
Q3. How much of a burden do you expect climate change poli-cies to impose on businesses over the next decade? Very heavy burden, Heavy burden, Moderate burden…
Q4. If emissions are reduced, which do you think will be the major driver in reducing emissions – advances in technology or changing individual behavior? Definitely technology, Primarily technology, Combination/both will be major drivers…
Q5. How difficult do you think it will be to significantly reduce global CO2 emissions over the coming century using ALL current best available and appropriate approaches you consider (including conservation, efficiency, wide-scale deployment of renewables, fuel switching to less carbon-intensive fuels, and / or increased use of nuclear power)? Very difficult, Difficult, Moderate…
Q6. How do you consider climate change to fit within your organization’s overall portfolio of environmental concerns? Top priority, High priority, One of many priorities…
Q7. Does your organization currently have a clear position on climate change (e.g., in the political debate over regulating emissions or in your organization’s Environmental Management System)? Yes, clearly formulated and publicly available, Yes, clearly formulated but not publicly available, Yes, but under review…

Study 2
55
Table 4: The survey questions grouped into climate change and different aspects of CCS
SECTION IN THE SURVEY QUESTIONS IN THE SURVEY
GENERAL QUESTIONS REGAR-DING CARBON CAPTURE AND STORAGE (CCS)
Q8. What term do you think is most appropriate for describing the technology for reducing CO2 emissions into the atmosphere by capturing CO2 from flue gas and injecting into the ocean or a geological reservoir? Carbon sequestration, Carbon / Carbon dioxide capture and sequestration, Carbon / Carbon dioxide capture and storage...
Q9a. Are you familiar with the concept of Enhanced Oil Recove-ry (EOR)? Yes =>Go to Question 9b, No =>Go to Question 10a
Q9b. If yes, how does this affect your opinion on CCS? Kno-wing of EOR gives a more favorable impression of CCS, EOR does not affect view of CCS, Knowing of EOR gives a more negative view of CCS
Q10a. Are you familiar with ongoing projects that inject carbon dioxide into reservoirs (e.g., Sleipner project in the North Sea, In Salah project in Algeria)? Yes =>Go to Question 10b, No =>Go to Question 11a..
Q10b. If yes, how does this affect your opinion on CCS? Kno-wing of these projects gives a more favorable impression of CCS, These projects do not affect view of CCS, Knowing of these projects gives a more negative view of CCS
Q11a. Do you think that large-scale adoption of CCS will increase the cost of electricity generated from fossil fuels? Yes, I think it will increase the cost significantly, Yes, I think it will increase the cost a little, No, Unsure
Q11b. Which of the following options gives the best description of the relationship between increased adoption of CCS and the penetration of other low-carbon alternative sources of energy such as renewables or nuclear? Increased adoption of CCS will encourage renewables / nuclear energy, Introduction of CCS will not influence the role of renewables / nuclear energy…

Study 2
Table 4: The survey questions grouped into climate change and different aspects of CCS
SECTION IN THE SURVEY QUESTIONS IN THE SURVEY
FUTURE OF CARBON CAPTURE AND STORAGE (CCS)
Q12. Which of the following statements coincides best with your view of the relationship between development of CCS and regulation of carbon dioxide and other greenhouse gases? Advan-ces in CCS will lead to more stringent regulation of greenhouse gases, More stringent regulation will lead to advances in CCS, Advances in CCS will weaken efforts to introduce more stringent regulation of greenhouse gases…
Q13a. How would you characterize the role that CCS plays in the current national climate change debate in your country? Very Large, Large, Moderate…
Q13b. Do you believe that the role of CCS is increasing or de-creasing in the national climate change debate in your country? Increasing substantially, Increasing slightly, Staying the same…
Q14. When do you think that it will be possible to receive credits for CCS in national accounting systems and/or emissions trading systems? During the first commitment period of the Kyoto Proto-col (2008-2012), In the second commitment period (2013-2016), Sometime between 12 and 20 years from now…
Q15. When do you think that large-scale entry of the following technologies (CCS, Solar energy, Fuel cells, Hydrogen power, Nuclear fusion, Tidal power) in the electric power sector is likely? Within the next 10 years, In 20 years, In 50 years, Never
Q16. How would you rate the social acceptability of different forms of CCS? Highly Unacceptable, Probably Unacceptable, Possibly Acceptable…
Q17. Which form of CCS do you consider to be most desirable or the least undesirable? Onshore geological storage, Offshore geological storage, Geological storage in general (I do not pre-fer any particular type of geological storage)…
56

Study 2
57
Table 4: The survey questions grouped into climate change and different aspects of CCS
SECTION IN THE SURVEY QUESTIONS IN THE SURVEY
FUTURE OF CARBON CAPTURE AND STORAGE (CCS) (CONT.)
Q18. Thinking of the form of CCS you chose in Q17, how would you compare the following electric power sector technologies (Natural gas turbines (without CCS), Conventional coal power (without CCS), Hydropower, Wind turbines, Nuclear power, Biomass/Bioenergy, Solar power, Nuclear fusion) to fossil-fired plants with carbon capture and storage for generating about the same amount of electricity? Much more preferable than CCS, More preferable than CCS, Similar to CCS…
Q19a. Still thinking of the form of CCS you chose in Q17, how serious do you consider the following risks (Water contamina-tion, Land/soil degradation, Ecosystem impacts, Human health impacts, Sudden large scale release, Other, namely) to be for CCS? Very High Risk, High Risk, Medium Risk…
Q19b. Which do you believe to be the major sources of risk for CCS? Accidents in transport and handling, Injection at storage sites, Leakage from reservoirs…
Q20. Thinking again of the form of CCS you chose in Q 17, which of the following would you consider to be the most sig-nificant concerns that would discourage wide-scale penetration of CCS? Acceptability to the wider public, Acceptability to local publics, Acceptability to NGOs (Non Governmental Organiza-tions)…
PUBLIC ATTITUDES TOWARDS CCS
Q21. Which of the following would you consider to be the most compelling persuasive reasons why if you would support wide-scale penetration of CCS in the future? Acceptability to NGOs, Acceptability to the business community, Continued generation from fossil fuel…
Q22. What would you think is the current attitude among the public toward CCS? Very positive, Moderately positive, Ambiva-lent…

Study 2
58
Table 4: The survey questions grouped into climate change and different aspects of CCS
SECTION IN THE SURVEY QUESTIONS IN THE SURVEY
Q23. When would you expect that the public would begin to un-derstand the issues associated with CCS? Next few years, Next few decades, Only if CCS becomes controversial in the public arena…
Q24. Would you expect that CCS would be more of a national policy question or more of a local siting question? Primarily national, Mostly national, Mix/Both…
Q25. To what extent do you believe that more information and public consultations would help ease potential public concerns over CCS? Public consultations and more information are likely to be very helpful, Public consultations and more infor-mation are likely to be helpful, Public consultations and more information may or may not be helpful…
THE STAKEHOLDERS ORGANIZATION’S APPROACH TO CCS
Q26a. Does your organization currently have a clear position on CCS? Yes, it is positive toward CCS, Yes, it is neutral toward CCS, Yes, it is negative toward CCS…
Q26b. Which of the following do you consider to be the major reason(s) for your organization’s position on CCS? Cost-effecti-veness of CCS as a climate change mitigation measure, Costli-ness of CCS as a climate change mitigation measure, Business opportunity…
Q27. How do you assess current attitudes toward CCS among colleagues within your organization? Very positive, Moderately positive, Ambivalent…
Q28a. Do you think there is any new information or event that might change your organization’s current attitude towards CCS? Very unlikely, Unlikely, Ambivalent…
Q28b. If so, what sort of information or event might change those attitudes?

Study 2
59
The questionnaire was distributed by Profu i Göteborg AB, an independent research and consul-tant company. The survey was sent to individuals working at stakeholder organizations, which could be assigned into four main groups:
Energy companies (active on a regional, national or international level)
Energy associations
Industrial companies with large CO2 emissions and industrial associations
Public authorities and ministries
The person receiving the questionnaire was asked to answer it on an individual basis, i.e. based on her/his personal opinion and personal knowledge. Consequently, the responses do not necessarily represent the official opinion of each stakeholder organization. 38 out of 48 persons receiving the questionnaire responded, yielding a response rate of 79 %. As can be noted, the sample size is small (especially considering that stakeholders in four countries are included) and it is thus not possible to scale up the results to be representative for a whole population (e.g. the population of ‘Energy compa-nies’). The results are generally presented by the number of all respondents choosing each possible answer to each question. When possible, this is complemented with qualitative observations regar-
ding differences between individuals working at each of the four types of stakeholder organizations.
The questionnaire was distributed in three rounds. In the first round (end of November 2005), it was sent to persons working at energy companies, energy associations, industrial associations, and public authorities and ministries in Sweden only. 15 out of 18 individuals responded. The second round, which targeted the same type of respondents but in Denmark, Norway and Finland, was distributed in mid-December 2005. 11 out of 15 individuals responded. Finally, the third round targeted persons working at industrial companies in Sweden with large CO2 emissions. It was distributed in March 2006, with 12 out 15 individuals filling out the questionnaire. This setup of the survey meant that a much larger part of the responses came from Swe-dish stakeholders (27 responses) than from stake-holders in Denmark, Norway and Finland (5, 3 and 3 responses respectively). During April-May 2006, a short follow-up was performed (four by telephone and one by e-mail) with stakeholders, to discuss matters arising out of the questionnaire and to allow them to elaborate on their answers. In a few cases, these respondents then changed their answers to certain questions. The results in Chapter 3 are pre-sented after including these changes. Furthermore, we have included comments and insights gained from the discussion with the stakeholders in the follow-ups.
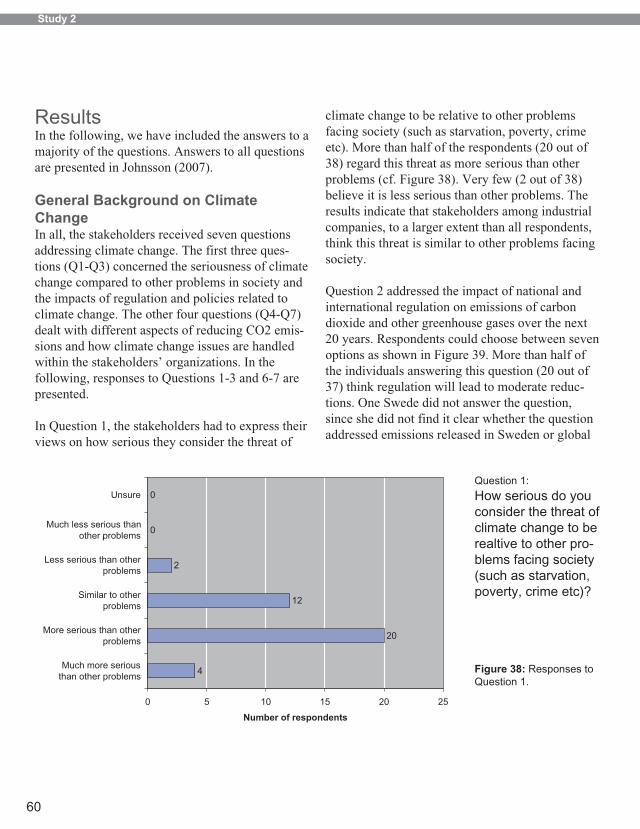
Study 2
60
ResultsIn the following, we have included the answers to a majority of the questions. Answers to all questions are presented in Johnsson (2007).
General Background on Climate ChangeIn all, the stakeholders received seven questions addressing climate change. The first three ques-tions (Q1-Q3) concerned the seriousness of climate change compared to other problems in society and the impacts of regulation and policies related to climate change. The other four questions (Q4-Q7) dealt with different aspects of reducing CO2 emis-sions and how climate change issues are handled within the stakeholders’ organizations. In the following, responses to Questions 1-3 and 6-7 are presented.
In Question 1, the stakeholders had to express their views on how serious they consider the threat of
climate change to be relative to other problems facing society (such as starvation, poverty, crime etc). More than half of the respondents (20 out of 38) regard this threat as more serious than other problems (cf. Figure 38). Very few (2 out of 38) believe it is less serious than other problems. The results indicate that stakeholders among industrial companies, to a larger extent than all respondents, think this threat is similar to other problems facing society.
Question 2 addressed the impact of national and international regulation on emissions of carbon dioxide and other greenhouse gases over the next 20 years. Respondents could choose between seven options as shown in Figure 39. More than half of the individuals answering this question (20 out of 37) think regulation will lead to moderate reduc-tions. One Swede did not answer the question, since she did not find it clear whether the question addressed emissions released in Sweden or global
Question 1:
How serious do you consider the threat of climate change to be realtive to other pro-blems facing society (such as starvation, poverty, crime etc)?
Figure 38: Responses to Question 1.

Study 2
61
Question 3:
How much of a bur-den do you expect climate change policies to impose on businesses over the next decade?
Figure 40: Responses to Question 3.
emissions. In the follow-up, she stated that her answer would be small-moderate reductions on a global level, and large reductions on a national level.
Question 3 directed the stakeholders’ attention towards the possible burdens that climate change policies can impose on businesses over the next decade. Out of the six possible alternatives (cf. Figure 40), most respondents choose ‘moderate’ or
Question 2:
What impact do you think national and international regula-tion related to climate change will have on emissions of carbon dioxide and other greenhouse gases over the next 20 years? Figure 39: Responses to Question 2.

Study 2
62
‘heavy’ burden (16 responses each). As might have been expected, stakeholders within industrial com-panies and industrial associations, choose ‘heavy’ or ‘very heavy’ burden (8 and 2 respectively, out of 14) to a higher degree than all respondents. Only one person, working at a Swedish public authority, chooses ‘very light burden’. In the follow-up, he said he based his answer on his experiences and observa-tions that industrial companies by default take a very negative attitude towards programmes and incentives for increased energy efficiency and reduced GHG emissions. He had seen numerous examples where businesses initially believed nothing could be im-proved at a reasonable cost at their plant. After some simplified analyses by external consultants, however, they realized that large potentials for improved effi-ciency/reduced emissions could be achieved in a cost efficient way and changed their mind.
Question 6 addressed how much of a priority climate change was within the stakeholder organizations’
overall portfolio of environmental concerns. 27 out of 38 respondents have the opinion that climate chan-ge is of high priority or the top priority (cf. Figure 41). Only one person believes it is of low priority. From the answers, we can note that stakeholders from energy companies and energy associations to a higher degree than stakeholders from industrial companies view climate change as a high or a top priority.
In Question 7, respondents were requested to state whether their organization has a clear position on climate change. Four persons did not answer. Among the people that gave their opinion, more than half (21 out of 34) claim their organizations have clearly formulated and publicly available positions. One of the three persons answering ‘Yes, but under review’, who works at a Norwegian energy association, explained in the follow-up (performed roughly six months after he received the questionnaire) that this position was still under review.
Question 6:
How do you consider climate change to fit within your organization’s overall portfolio of envi-ronmental concerns?
Figure 41: Responses to Question 6.

Study 2
63
Question 7:
Does your organiza-tion currently have a clear position on climate change (e.g. in the policital de-bate over regulating emissions or in your organization’s Envi-ronmental Manage-ment System)?
Figure 42: Responses to Question 7.
General questions regarding Carbon Capture and Storage (CCS)In this section, respondents had to answer four questions (Q8-Q11). Three of them (Q9-Q11) were further divided into sub-questions. The questions addressed the appropriate term for capturing CO2 from flue gas and injecting into the ocean or a geo-logical reservoir, the knowledge of Enhanced Oil
Recovery (EOR) and ongoing projects that inject carbon dioxide into reservoirs, and how increased adoption of CCS could influence the costs of electricity generated from fossil fuels as well as the penetration of other low-carbon alternative sources of energy such as renewables or nuclear. In the fol-lowing, responses to Questions 11 are presented.
Question 11a:
Do you think that large-scale adoption of CCS will increase the cost of electricity generated from fossil fuels?
Figure 43: Responses to Question 11a.

Study 2
6�
Question 11a directed the stakeholders’ attention to the possible influence by a large-scale adoption of CCS on the costs for electricity generation from fossil fuels. The stakeholders were requested to select one out of four alternatives (cf. Figure 43). One person, however, selected two alternatives, which resulted in 39 responses. As we can see from Figure 43, the stakeholders were mainly divided between a little and a significant increase of the costs (18 responses each). In the follow-up, one person who stated ‘little’ increase explained that he had received some brief information about possible efficiency improvements in coal condensing power plants and energy losses when using CCS. Compa-red to his knowledge about the efficiency of typical coal condensing power plants of today, he believed possible efficiency improvements and energy los-ses due to CCS would more or less level out, thus implying a little impact on the generation costs. Another stakeholder in the follow-up, who stated ‘significant’ increase, believed the costs for CCS would be high in comparison to today’s generation costs. He did not mention anything about possible efficiency improvements at fossil-fuelled power plants.
In Question 11b, respondents were asked about their opinion on how increased adoption of CCS would affect the penetration of other low-carbon alternative sources of energy such as renewables or nuclear energy. Only one alternative each was to be chosen for renewables and nuclear energy, but some respondents chose two answers while other skipped the question. The net result was thereby 39 and 37 responses for how CCS would affect renewables and nuclear energy respectively. We can note in Figure 44 that the responses are fairly equally distributed among the four options. In comparison, there seems to a bit higher confidence in increased adoption of CCS encouraging renewa-bles than nuclear energy. Looking at the individual answers, it is interesting to note the many different combinations on how renewables and nuclear energy would be influenced respectively. In the follow-up, we asked four of the stakeholders the reasons behind their choices, which are presented in Table 5.
Question 11b:
Which of the following options gives the best description of the relationship between increased adoption of CCS and the penetration of other low-carbon alternative sources of energy such as renewables or nuclear?
Figure 44: Responses to Question 11b.

Study 2
65
Table 5: Follow-up with four respondents concerning their answers to Question 11b
STAKEHOLDER
INCREASED ADOPTION OF CCS WILL ...
REASONS BEHIND THESE CHOICES
1
- discourage renewables
- discourage nuclear energy
Through CCS the large global coal reserves can be utilized. Electricity production from coal will then also in the future be a large-scale, competitive alter-native. This will lead to increased competition among the alternatives offering CO2-free electricity produc-tion. Consequently, the electricity price will be lower than it would be in a future without CCS, which will lead to fewer incentives for development of other CO2-free electricity production such as renewables or nuclear energy.
2
- encourage renewables
- discourage nuclear energy
Increased adoption of CCS, a large-scale technology, will mean a higher electricity price. Because renewa-bles often are used in small-scale technologies, they will benefit from the higher electricity price without competing directly with CCS. Nuclear energy, on the other hand, is a large-scale technology and will compete directly with fossil fuelled power plants with CCS. An obvious disadvan-tage of nuclear energy is the high capital cost when investing in nuclear energy compared to fossil fuelled power plants with CCS.
3
- encourage renewables
- not influence the role of nuclear energy
For renewables, practically the same reasoning as stakeholder 2.Regarding nuclear energy, political decisions are much more important than the electricity price. Accordingly, introduction of CCS leading to higher electricity prices will have a minor effect on nuclear energy in comparison to the treatment of nuclear energy on the political agenda
4
- encourage renewables
- encourage nuclear energy
Increased adoption of CCS will mean a higher elec-tricity price. Thereby the incentives for development of other CO2-free technologies (such as renewables and nuclear energy) will increase.

Study 2
66
Future of Carbon Capture and Storage (CCS)This section in the questionnaire incorporated the largest number of questions. In total, the respondents were requested to answer ten ques-tions (Q12-Q21), two of which were divided into sub-questions (Q13 and Q19). The first four questions (Q12-Q15) concerned the future role of CCS within the climate change context, including a comparison regarding when it is likely that CCS and other low-carbon energy technologies will enter on a large scale in the electric power sector. In the next four questions (Q16-Q19), respon-dents were asked to rate the social acceptability of different forms of CCS and the form of CCS they preferred. This also included how they would compare fossil-fired plants with carbon capture and storage to other electricity production alternatives and what risks they felt were associated with CCS. In the last two questions (Q20-Q21), respondents had to state concerns that would discourage wide-
scale penetration of CCS and reasons why if they would support such penetration in the future. In the following, responses to Questions 13a, and 14-20 are presented.
In Question 13a, respondents were requested to characterize the role that CCS plays in the current national climate change debate in their countries. For an evident majority (28 out of 38), the role of CCS is either small or very small (see Figure 45). Notably, all respondents answering ‘large’ or ‘very large’ are Norwegian. One of these persons stated in the follow-up that since roughly a decade ago, CCS has been part of ongoing discussion in Nor-way regarding expanded power capacity through investments in natural gas condensing plants. CCS has already taken a place at some old Norwegian oil fields, and there seem to be many opportunities to expand this business. According to the respon-dent, the ambition of the Norwegian Government is to establish the new power plants with CCS.
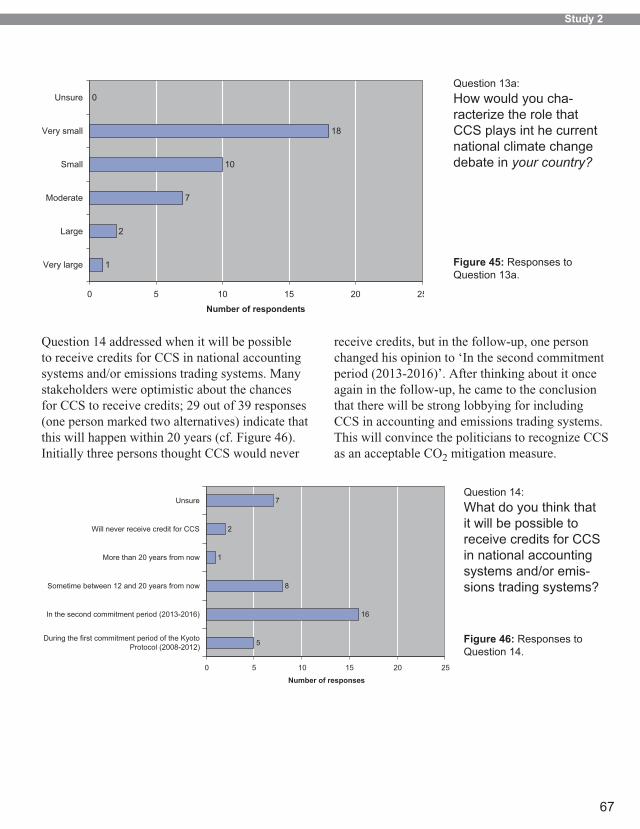
Study 2
67
Question 14 addressed when it will be possible to receive credits for CCS in national accounting systems and/or emissions trading systems. Many stakeholders were optimistic about the chances for CCS to receive credits; 29 out of 39 responses (one person marked two alternatives) indicate that this will happen within 20 years (cf. Figure 46). Initially three persons thought CCS would never
receive credits, but in the follow-up, one person changed his opinion to ‘In the second commitment period (2013-2016)’. After thinking about it once again in the follow-up, he came to the conclusion that there will be strong lobbying for including CCS in accounting and emissions trading systems. This will convince the politicians to recognize CCS as an acceptable CO2 mitigation measure.
Question 13a:
How would you cha-racterize the role that CCS plays int he current national climate change debate in your country?
Figure 45: Responses to Question 13a.
Question 1�:
What do you think that it will be possible to receive credits for CCS in national accounting systems and/or emis-sions trading systems?
Figure 46: Responses to Question 1�.
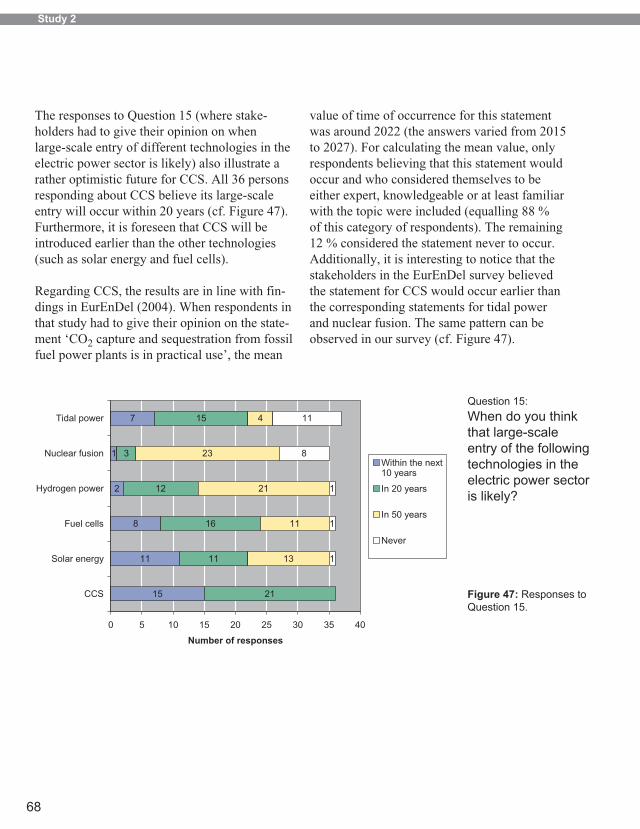
Study 2
68
The responses to Question 15 (where stake-holders had to give their opinion on when large-scale entry of different technologies in the electric power sector is likely) also illustrate a rather optimistic future for CCS. All 36 persons responding about CCS believe its large-scale entry will occur within 20 years (cf. Figure 47). Furthermore, it is foreseen that CCS will be introduced earlier than the other technologies (such as solar energy and fuel cells).
Regarding CCS, the results are in line with fin-dings in EurEnDel (2004). When respondents in that study had to give their opinion on the state-ment ‘CO2 capture and sequestration from fossil fuel power plants is in practical use’, the mean
value of time of occurrence for this statement was around 2022 (the answers varied from 2015 to 2027). For calculating the mean value, only respondents believing that this statement would occur and who considered themselves to be either expert, knowledgeable or at least familiar with the topic were included (equalling 88 % of this category of respondents). The remaining 12 % considered the statement never to occur. Additionally, it is interesting to notice that the stakeholders in the EurEnDel survey believed the statement for CCS would occur earlier than the corresponding statements for tidal power and nuclear fusion. The same pattern can be observed in our survey (cf. Figure 47).
Question 15:
When do you think that large-scale entry of the following technologies in the electric power sector is likely?
Figure 47: Responses to Question 15.

Study 2
69
In Question 16, the stakeholders were asked to rate the social acceptability of different forms of CCS. As can be seen in Figure 48, the respondents be-lieve the social acceptability to be high for geologi-cal storage, onshore or offshore, compared to other forms of CCS (22 and 30 persons respectively find these forms of CCS to be probably or highly acceptable). For the two types of ocean storage, the opposite is true; a majority (26 persons for each type) finds these forms of CCS to be probably or highly unacceptable.
One person, who finds lake-type ocean storage to be probably acceptable, acknowledged in the follow-up that he did not know much about this technology. Nevertheless, he thought the techno-logy could be attractive to the public if it could be shown that it worked properly and in a safe way. An advantage for this type of CCS, he thought, could be that it would be performed far away from other human activities, thus minimizing the risk of the NIMBY phenomenon occurring at the CO2 storage.
Question 16:
How would you rate the social acceptabi-lity of different forms of CCS?
Figure 48: Responses to Question 16. *Storage of CO2 in the ocean by dispersion of CO2 to minimize degree of impact, ** Storage in the ocean as liquid CO2 to isolate CO2 and minimize spatial extent of impact.

Study 2
70
The preference for geological storage can also be noted in the responses to Question 17, where the stakeholders had to state which form of CCS they
find to be most desirable or the least undesirable. 29 out of 38 respondents choose an alternative that includes geological storage only (cf. Figure 49).
Question 17:
Which forms of CCS do you consi-der to be the most desirable or the least undesireable?
Figure 49: Responses to Question 17.
In Question 18, the respondents were asked to compare a number of electric power sector tech-nologies to fossil-fired plants equipped with CCS. From their answers (see Figure 50) it is clear that they find solar power, biomass/bioenergy, wind turbines and hydropower more or much more preferable than fossil-fired plants with CCS. It is also evident that they consider conventional coal power and natural gas turbines without CCS to be less or much less preferable than fossil-fired plants with CCS.
From the follow-up we could make some interes-ting observations on the arguments and reasoning behind the stakeholders’ answers. One respondent, who stated that natural gas turbines without CCS are much more preferable than fossil-fired plants
with CCS, argued that natural gas turbines without CCS can be utilized in small-scale applications with high overall efficiency, e.g. combined heat and power production. This increases security of supply and reduces the possible negative effects of centralized power plant breakdowns. Another stakeholder, whose opinion was that hydropower is similar to CCS, remarked that his opinion is based on the premise that CCS is working to 100 %, mea-ning that there are no leaks of CO2 at all. If there would be any leaks, he would change his answer to hydropower as much more preferable than fossil-fired plants with CCS. A third stakeholder, who stated that nuclear power is much less preferable than fossil-fired plants with CCS and who works at a ministry, explained that this was not her personal view but the political view. She did not consider

Study 2
71
Figure 50: Responses to Question 18.
her personal opinion to be of relevance for this question.
Parts of Question 18 can be compared to results from EurEnDel (2004), where the respondents for 19 technology statements were asked to give an assessment of the impact it would have if the sta-tement came true. Included in this assessment was the impact on wealth creation, environment, quality of life and security of supply. An index calculation was then performed to add together the impacts on
these four areas. The index ranged from -50 for an adverse impact up to 100 for a highly beneficial impact (i.e. the higher the index, the more bene-ficial the impact). The statements ‘Photovoltaic cells contribute with >5% of European electricity generation [Today it is 0.15%]’ and ‘Biomass for central heating and district heating systems is wi-dely used ’ received a much higher total index than the statement ‘CO2 capture and sequestration from fossil fuel power plants is in practical use’ , which indicates that the respondents found solar power
Question 18: Thinking of the form of CCS you chose in Q17, how would you compare the following electric power sector technologies to fossil-fired plants with carbon capture and storage for generating about the same amount of electricity?

Study 2
72
Question 19a:
Still thinking of the form of CCS you chose in Question17, how serious do you consider the follo-wing risks to be for CCS?
Figure 51: Responses to Question 19a.
and biomass/bioenergy to be much more preferable than fossil-fired plants with CCS. As stated above, this can also be observed in our study.
Thinking of the form of CCS they chose in Ques-tion 17, the respondents were asked in Question 19a to mark how serious they consider a number of risks to be for CCS. For many of the possible environmental impacts (see Figure 51), a clear majority of the stakeholders believe the risks as-sociated with CCS are fairly limited, varying from ‘negligible’ to ‘medium’. The largest concern is with sudden large scale releases where 15 out of 37 respondents find the risk to be ‘medium’ or ‘high’.
Depending on the environmental impact, between three and seven persons could not rate the risk because they believed they did not have enough information to make such an evaluation.
In Question 19b, the respondents had to state the major sources of risk for CCS. They could mark several of the available alternatives, which yielded a total of 61 responses from 38 stakeholders. The major sources of risk are according to the stakehol-ders ‘Leakage from reservoirs’ (17 responses) and ‘Seismic activity’ (16 responses) (see also Figure 52).

Study 2
73
Question 19b:
Which do you believe to be the major sour-ces of risks for CCS?
Figure 52: Responses to Question 19b. NB! Several alternatives could be marked by each respon-dent.
The stakeholders were requested in Question 20 to mark the alternatives they consider to be the most significant concerns that would discourage wide-scale penetration of CCS. They could also add their own alternatives. Since several options could be chosen, the total number of responses was 175 (from 38 stakeholders). From Figures 53 and 54, we can observe that the largest obstacles for wide-scale penetration of CCS, according to the stake-
holders, would be ‘Acceptability to NGOs (Non Governmental Organizations)’, ‘Finding suitable storage sites’, and ‘Economic viability (cost per ton of carbon dioxide abated)’ with 25, 23 and 21 responses respectively. Two persons added other concerns, which were ‘International legislation for storage will be delayed’ and ‘Establishing neces-sary infrastructure’.

Study 2
7�
Figure 53: The eight most chosen responses to Question 20. NB! Several alternatives could be marked by each respon-dent.
Figure 54: Responses to Question 20, excluding the ones in Figure 53.
Question 20:
Thinking again of the form of CCS you chose in Question 17, which of the following would you consider to be the most significant concerns that would discourage wide-scale penetration of CCS?
Question 20:
Thinking again of the form of CCS you chose in Question 17, which of the following would you consider to be the most significant concerns that would discourage wide-scale penetration of CCS?

Study 2
75
Public Attitudes towards CCSThe stakeholders received four questions on public attitudes and knowledge about CCS (Q22-Q25). These concerned
- the public’s current attitude, - when the public would begin to understand issues associated with CCS, - whether CCS would be more of a national policy issue or more of a local siting issue, - and whether more information and public consultations would help ease potential public concerns over CCS.
In the following, responses to Questions 22 and 25 are presented.
In Question 22, respondents had to give their opinion on what they think is the current attitude
among the public toward CCS. Almost half of the stakeholders (18 out of 38) believe that the public is largely ignorant (see Figure 55). The other stake-holders are roughly split between thinking that the public is ambivalent and thinking it is moderately positive towards CCS (10 and 7 responses respec-tively). One person believes the public is very positive towards CCS. He explained in the fol-low-up that his answer was based on the national situation in Norway. As shown in conjunction with Question 13a, CCS is playing an important role in the current climate change debate in Norway. Consequently, he claimed, the public has received a lot of information regarding CCS through e.g. the government, media and environmental NGOs. His impression is that these groups generally have had a neutral to positive attitude towards CCS, which has influenced the public to have a positive attitude towards CCS.
Question 22:
What would you think is the current attitude among the public toward CCS?
Figure 55: Responses to Question 22

Study 2
76
When asked in Question 25 whether more informa-tion and public consultations would help ease po-tential public concerns over CCS, the respondents
generally agree to this. 28 out of 38 respondents believe these measures are likely to be helpful or very helpful (cf. Figure 56).
Question 25:
To what extent do you believe that more information and public consultations would help ease potential public concerns over CCS?
Figure 56: Response to Question 25
The Stakeholders Organizations’ Approach to CCSThree questions (Q26-Q28) addressed various as-pects of this issue, whereof two were divided into sub-questions (Q26 and Q28). Respondents were asked about their organizations’ current position on CCS, the reasons behind this position and if there would be information or events that could change it. Additionally, they were asked to assess the present attitudes toward CCS among their col-leagues. In the following, responses to Questions 26a and 28a are presented.
In Question 26a, respondents were asked if their organization currently has a clear position on CCS. As can be noted in Figure 57, a majority (21 responses out of 38) does not have a clear posi-
tion. Furthermore, it is interesting to notice that none of the organizations included seem to have a negative position towards CCS. In the follow-up, two stakeholders changed their view from ‘Yes, it is positive toward CCS’ to ‘No’. One of them did this because he had initially answered the question only thinking about the group he worked within, and not the whole company. The second person changed her answer because during the six months between receiving the questionnaire and participating in the follow-up, she believed the official position had changed from ‘watchfully positive’ to no position at all. The main reason for this change was the increased focus in Sweden to reduce fossil fuel use through the work of the ‘Commission against oil dependency’.
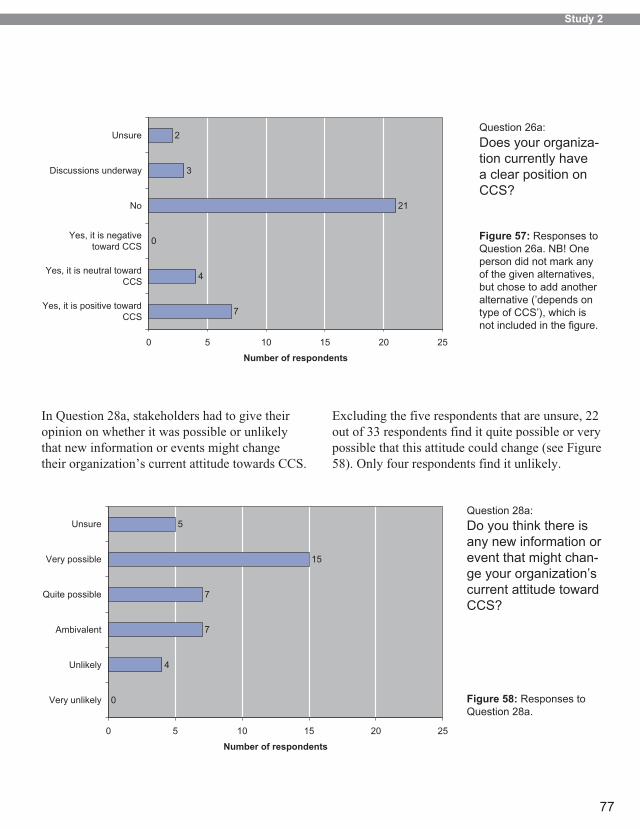
Study 2
77
Question 26a:
Does your organiza-tion currently have a clear position on CCS?
Figure 57: Responses to Question 26a. NB! One person did not mark any of the given alternatives, but chose to add another alternative (’depends on type of CCS’), which is not included in the figure.
Question 28a:
Do you think there is any new information or event that might chan-ge your organization’s current attitude toward CCS?
Figure 58: Responses to Question 28a.
In Question 28a, stakeholders had to give their opinion on whether it was possible or unlikely that new information or events might change their organization’s current attitude towards CCS.
Excluding the five respondents that are unsure, 22 out of 33 respondents find it quite possible or very possible that this attitude could change (see Figure 58). Only four respondents find it unlikely.

References
78
ReferencesStudy 1
Bisconti, A. (2000) Environmental concerns and changing attitudes, Progress in Nuclear Energy 37, pp. 1-4
Bisconti, A. (2005) Record High 70 Percent Favor Nuclear Energy; Public Supports Planning for More Plants, Perspective on Public Opinion, report prepared for the Nuclear Energy Institute
Curry, T.-E. (2004) Public Awareness of Car-bon Capture and Storage: A Survey of Attitudes toward Climate Change Mitigation, Master The-sis, Massachusetts Institute of Technology, USA
Curry, T.E., Reiner, D.M., de Figueiredo, M.A., Herzog, H.J. (2005) A Survey of Public Attitudes towards Energy & Environment in Great Bri-tain, Publication No. LFEE 2005-001 WP MIT Laboratory for Energy and the Environment, Cambridge, MA.
Friedmann, J. (2003). Teapot Dome Field Experi-ment. Presented at MIT CarbonSequestration Forum IV: Scenarios for Carbon Sequestration, Cambridge, MA.
Hedberg, P. and Holmberg, S. (2005) Åsikter om energi och kärnkraft, ForskningsprojektetENERGIOPINIONEN I SVERIGE, preliminär rapport, februari 2005
Heinrich, J. J., H. J. Herzog and D. M. Reiner (2004). Environmental Assessment ofGeologic Storage of CO2. Massachusetts Institute of Technology, Laboratory for Energyand the Environment. MIT LFEE 2003-002. http://sequestration.mit.edu/pdf/lfee_2003-002_rp.pdf
Holmberg, S., and Weibull, L. (eds.) (2005) Lyckan kommer, lyckan går, SOM rapport 36, SOM-Institutet, Göteborg
Holmberg, S., and Weibull, L. (eds.) (2005b) Swedish Trends, 1986-2004, SOM-Institutet, Göteborg
Huijts, N. (2003) Public perception of carbon dioxide storage. The role of trust and affectin attitude formation, Master Thesis, Department of Technology Management, Eindhoven Univer-sity of Technology
IPCC (2001). Summary for Policymakers. Third Assessment Report, Climate Change2001: The Scientific Basis. Cambridge, UK, Cambridge University Press: 1-18.http://www.ipcc.ch/pub/spm22-01.pdf.
Itaoka, K., Saito, M., and Akai, M. (2004) Public Acceptance of CO2 Capture and Storage Tech-nology: A Survey of Public Opinion to Explore Influential Factors, In E.S. Rubin, D.W. Keith and C.F. Gilboy, eds., Proceedings of 7th Interna-tional Conference on Greenhouse Gas Control Technologies. Volume 1: Peer-Reviewed Papers and Plenary Presentations, IEA Greenhouse Gas Programme, Cheltenham, UK
Kurt, E. (2005) Rapport från undersökning “Tyck till om energi- och klimatfrågor!” – Prioriteringar för Sverige, Statistics Sweden, June, 2005
Mansouri, I., Newborough, M., and Probert, D. (1996) Energy Consumption in UK Households: Impact of Domestic Electrical Appliances, App-lied Energy 54 (3), pp. 211-285

References
79
Plotnikoff, R.C., Wright, M-F., and Karunamuni, N. (2004) Knowledge, attitudes and behaviours related to climate change in Alberta, Canada: implications for public health policy and practice, International Journal of Environmental Health Research 14 (3), pp. 223-229
Reiner, D.M., Curry, T.E., de Figueiredo, M.A., Herzog, H.J., Ansolabehere, S.D., Itaoka, K., Johnsson, F. and Odenberger, M. (2006) “Ameri-can exceptionalism? Similarities and differences in national attitudes towards energy policy and global warming.” Environmental Science and Technology (Washington), 40(7): 2093-2098
Shackley, S., McLachlan, C., and Gough, C. (2004) The Public Perceptions of Carbon Capture and Storage, Tyndall Centre for Climate Change Research, Tyndall Centre Working Paper No. 44
Statistics Sweden, Swedish population by age and sex on Dec. 31, 2004, http://www.scb.se/templates/tableOrChart____78316.asp, downloaded 2006-01-04
STEM (Swedish Energy Agency) (2005) Energilä-get 2005, report ET 2005:23, Eskilstuna, Sweden
Söderström, M., and Ottander, P. (2005) Allmän-hetens kunskaper och attityder till växthuseffekten. Uppföljning av Klimatkampanjen, report for the Swedish Environmental Protection Agency, http://www.naturvardsverket.se/dokument/klimat/pdf/rapport_2005.pdf, downloaded 2005-12-22
Viklund, M. (2004) Energy policy options—from the perspective of public attitudesand risk perceptions, Energy Policy 32, pp. 1159-1171
Wikipedia (2006) War on Terrorism, http://en.wikipedia.org/wiki/War_on_Terrorism, 2006-06-26
Study 2EurEnDel (European Energy Delphi) (2004) Tech-nology and Social Visions for Europe’s Energy Future - a Europe-wide Delphi Study, Final report, http://www.izt.de/eurendel/survey_results/index.html
Johnsson, F., (2007) A survey of public attitudes towards energy and environment in Sweden, report to be published during 2007. Department of Energy and Environment, Chalmers University of Techno-logy, Göteborg.


Pathways to sustainable European energy systemsThe European pathways project is a five year project with the overall aim to evaluate and propose robust pat-hways towards a sustainable energy system with respect to environmental, technical, economic and social issues. The focus is on the stationary energy system (power and heat) in the European setting. Evaluations will be based on a detailed description of the present energy system and follow how this can be developed into the future under a range of environmental, economic and infrastructure constraints. The proposed project is a response to the need for a large and long-term research project on European energy pathways, which can produce independent results to support decision makers in industry and in govern-mental organizations. Stakeholders for this project are: the European utility industry and other energy related industries, the European Commission, EU-Member State governments and their energy related boards and oil and gas companies. The overall question to be answered by the project is:
How can pathways to a sustainable energy system be characterized and visualized and what are the consequen-ces of these pathways with respect to the characteristics of the energy system as such (types of technologies, technical and economic barriers) and for society in general (security of supply, competitiveness and required policies)?
This question is addressed on three levels; by means of energy systems analysis (technology assessment and technical-economic analysis), a multi-disciplinary analysis and an extended multi-disciplinary policy analysis. From a dialogue with stakeholders, the above question has been divided into sub-questions such as:
• What is the critical timing for decisions to ensure that a pathway to a sustainable energy system can be followed?
• What are ”key” technologies and systems for the identified ”pathways” - including identification of uncertainties and risks for technology lock-in effects?
• What requirements and consequences are imposed on the energy system in case of a high penetration of renewables?
• What are the consequences of a strong increase in the use of natural gas?
• What if efforts to develop CO2 capture and storage fail?
• Where should the biomass be used – in the transport-ation sector or in the stationary energy system?
• Are the deregulated energy markets suitable to facilitate a development towards a sustainable energy system?
• Will energy efficiency be achieved through free market forces or regulatory action?
• What are the requirements of financing the energy infrastructure for the different pathways identified?
In order to address the sub-questions in an efficient and focussed way the project is structured into 10 work packages addressing topics such as description of the energy infrastructure, energy systems modelling, tech-nology assessment of best available and future technologies and international fuel markets. In planning of the project significant efforts have been put into ensuring that the project should not only be strong in research but also in management, communication and fundraising.
The global dimension will be ensured through integration with the other three regional AGS pathway projects in the Americas, East Asia, and India and Africa.
More information at Pathways website:
www.energypathways.se


83
The Alliance for Global Sustainability The Alliance for Global Sustainability (AGS) brings together four of the world’s leading technical universi-ties – the Massachusetts Institute of Technology, The University of Tokyo, Chalmers University of Technology and the Swiss Federal Institute of Technology – to conduct research in collaboration with government and industry on some of society´s greatest challenges.
The AGS represent a new synthesis of multidisciplinary and multi-geographical research that draws on the diverse
and complementary skills of the AGS partners. In addi-tion to academic collaborations each of the universities has extensive experience in working with stakeholders, particularly a growing number of visionary leaders from industry who recognise their fundamental role in achieving sustainable development.
More information at AGS website:
globalsustainability.org
Photo: Måns Ahnlund


