
PUBLIC ADVOCATES OFFICE CALIFORNIA PUBLIC UTILITIES …
90
Docket Exhibit Number Commissioner ALJ Witness : : : : : A.19-08-013 PAO-05P ______ Shiroma Wildgrube/Seybert Roberts PUBLIC ADVOCATES OFFICE CALIFORNIA PUBLIC UTILITIES COMMISSION Report on the Results of Operations for Southern California Edison Company General Rate Case Test Year 2021 Transmission & Distribution Capital Expenditures Part 3 PUBLIC VERSION San Francisco, California April 10, 2020
Transcript of PUBLIC ADVOCATES OFFICE CALIFORNIA PUBLIC UTILITIES …

Docket Exhibit Number Commissioner ALJ Witness
: : : : :
A.19-08-013 PAO-05P ______ Shiroma Wildgrube/Seybert Roberts
PUBLIC ADVOCATES OFFICE CALIFORNIA PUBLIC UTILITIES COMMISSION
Report on the Results of Operations for
Southern California Edison Company General Rate Case
Test Year 2021
Transmission & Distribution Capital Expenditures Part 3
PUBLIC VERSION
San Francisco, California
April 10, 2020

TABLE OF CONTENTS
I. INTRODUCTION ............................................................................................... 1
II. SUMMARY OF RECOMMENDATIONS .......................................................... 2
III. GENERAL DISCUSSION ................................................................................... 4
A. Background ....................................................................................................... 4
1. Glossary ................................................................................................... 4
2. Capital Expenditures versus Capital Additions ....................................... 4
3. Capital Expenditures for 2022 and 2023.................................................. 4
4. Use of 2019 Recorded Expenditures ........................................................ 4
5. Use of Direct Nominal Dollars ................................................................ 5
6. CPUC Jurisdictional Versus Total Expenditures ..................................... 5
7. Distribution Resources Plan (DRP) Proceeding ...................................... 5
B. Discovery and Workpapers Supporting This Testimony ................................. 7
C. Overarching Issues ........................................................................................... 7
1. SCE Does Not Adequately Describe How Existing and Customer Owned Technologies (ECTs) Can Aid with DER Integration ................................................................................................ 7
2. SCE’s Request Presumes the Outcome of Active CPUC Proceedings .............................................................................................. 8
3. SCE Should Be Held Accountable for Cost Escalation Between Rate Cases When There Is No Showing of Increased Scope or Functionality ............................................................................. 9
4. SCE Should Provide Requested Information on GMS Functionality .......................................................................................... 10
D. Public Advocates Office Overarching Conclusions ....................................... 10
1. Review of Public Advocates Office TY 2018 Recommendations .................................................................................. 10
2. The Commission Should Order SCE to Accelerate the Deployment of a DER Management System (DERMS) to Control and Monitor DERs .................................................................... 11
IV. DISCUSSION / ANALYSIS OF GRID MODERNIZATION ........................... 12
A. Background on Grid Modernization ............................................................... 13
1. PG&E’s TY 2020 GRC Was the First GRC to Incorporate DRP Grid Modernization Requirements ................................................ 13

2. SCE’s TY 2018 GRC Grid Modernization Request .............................. 13
B. General Critiques of SCE’s Grid Modernization Request .............................. 15
1. SCE’s GMP Prioritizes High-Cost IOU Solutions Without Adequate Consideration of ECTs .......................................................... 15
2. SCE’s Systemwide Grid Modernization Investments Do Not Appear to Reduce the Need for Circuit Specific Upgrades ................... 16
3. Sectionalization per SCE’s GMP May Decrease DER Hosting Capacity and Increase DER-Driven Grid Needs.................................... 17
C. Grid Management System (GMS) .................................................................. 17
1. SCE’s GMS Has Evolved into a Collection of Software Tools ............. 18
2. SCE’s Request for an 84% Increase for GMS Is Not Sufficiently Supported or Justified ........................................................ 20
3. The Increase in SCE’s Forecast GMS Deployment Cost is Not Due to An Increase in GMS Functionality ............................................ 28
4. SCE’s Current GMS Proposal Will Delay Monitoring and Control of DERs with Smart Inverters ................................................... 28
5. Public Advocates Office Recommendations for GMS .......................... 30
D. Engineering & Planning Software Tools ........................................................ 31
1. SCE’s E&P Software Tools Forecast is Nearly Three Times Higher Than Its TY 2018 Request ......................................................... 33
2. Recommendations .................................................................................. 34
3. Grid Connectivity Model (GCM) .......................................................... 35
4. Grid Analytics Application (GAA) ........................................................ 36
5. Grid Interconnection Processing Tool (GIPT) ....................................... 38
6. Distribution Resources Plan External Portal (DRPEP) ......................... 40
7. Long-Term Planning Tool and System Modeling (LTPT-SMT) ...................................................................................................... 42
V. DISCUSSION / ANALYSIS OF LOAD GROWTH .......................................... 44
A. Background on Load Growth Projects and Programs .................................... 46
1. Distribution and Subtransmission Planning Process and DRP .............. 46
2. SCE’s Test Year 2018 GRC Load Growth Request .............................. 48
B. DER-Driven Load Growth Programs ............................................................. 49
1. Summary of SCE’s Request ................................................................... 49
2. DER-Driven Projects are New and SCE Forecasts Significant Annual Program Costs ........................................................................... 50

3. SCE Provided Insufficient Information to Determine the Reasonableness of SCE’s Request ......................................................... 51
4. SCE’s DER-Driven Programs Presumes the Outcome on an Active Commission Proceeding ............................................................. 52
5. SCE Does Not Acknowledge or Properly Account for Significant Uncertainties in its Forecast ................................................ 54
6. SCE Errs by Assuming that DER Integration Issues Must be Mitigated by Traditional Grid Upgrades ................................................ 59
7. The Use of Memorandum Accounts Has Been Authorized in the DRP Proceeding ............................................................................... 60
8. Program Specific Cost Estimate Issues .................................................. 61
9. Recommendations .................................................................................. 65
VI. WITNESS QUALIFICATIONS ........................................................................ 67
APPENDIX A - GLOSSARY ........................................................................................... 68
APPENDIX B – EXISTING AND CUSTOMER TECHNOLOGIES (ECTS) ............................ 70
A. Public Advocates Office Comparison of DER-Integration Technologies ................................................................................................... 71
B. Description and Status of ECTs, and Their Role in DER Integration ............ 73
C. ECTs are Economically Efficient ................................................................... 79
D. Perspectives on Potential DER Integration Challenges .................................. 80
APPENDIX C – THE IMPACT OF SECTIONALIZATION ON HOSTING CAPACITY .............. 84
1
TRANSMISSION & DISTRIBUTION 1 CAPITAL EXPENDITURES PART 3 2
I. INTRODUCTION 3
This exhibit presents the analyses and recommendations of the Public Advocates 4 Office (Cal Advocates) regarding Southern California Edison Company’s (SCE) forecasts of 5 certain Transmission and Distribution (T&D) capital expenditures for 2019, 2020 and Test 6 Year (TY) 2021. 7
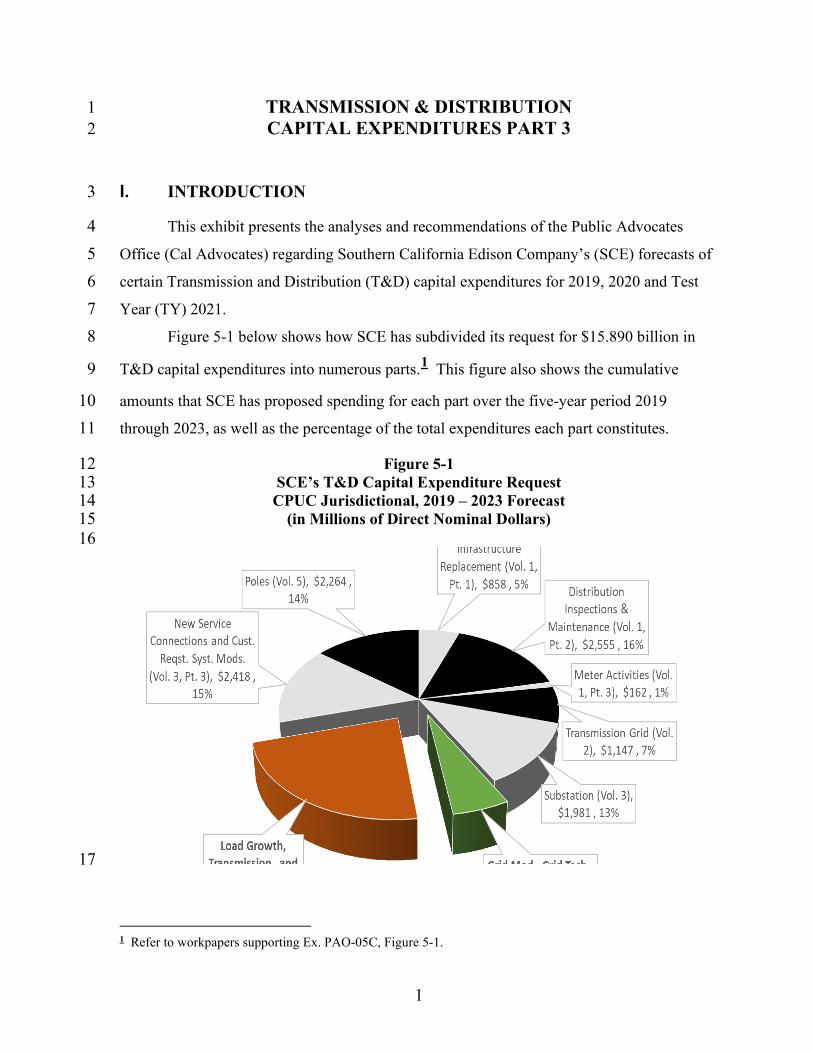
Figure 5-1 below shows how SCE has subdivided its request for $15.890 billion in 8
T&D capital expenditures into numerous parts.1 This figure also shows the cumulative 9
amounts that SCE has proposed spending for each part over the five-year period 2019 10 through 2023, as well as the percentage of the total expenditures each part constitutes. 11
Figure 5-1 12 SCE’s T&D Capital Expenditure Request 13 CPUC Jurisdictional, 2019 – 2023 Forecast 14
(in Millions of Direct Nominal Dollars) 15 16
17
1 Refer to workpapers supporting Ex. PAO-05C, Figure 5-1.

2
This exhibit examines SCE’s Exhibit SCE-2, Vol. 4, Parts 1 and 2, colored green and 1 orange respectively in the pie chart above, for which SCE has proposed expending $4.506 2
billion over the five-year period.2 This testimony responds to these two volumes together 3
since they include the bulk of new or expanded programs to accommodate, or enable benefits 4 from increasing levels of Distributed Energy Resources (DER), including energy efficiency, 5 demand response, electric vehicles, energy storage and renewable energy generators as 6 defined in Public Utilities Code section 769. SCE’s proposals regarding its T&D capital 7 expenditures associated with other areas are addressed in Exhibits PAO-03 and PAO-04, and 8 T&D expenses associated with other areas are addressed in Exhibits PAO-06 and PAO-07. 9
This testimony provides discussion, analysis, and recommendations for only a subset 10 of Grid Modernization and Load Growth programs and projects. For topics discussed in Ex. 11 SCE-2, Vol. 4, Parts 1 and 2 but not discussed herein, it is most accurate to state that the 12 Public Advocates Office does not oppose SCE’s request, and it is incorrect to state that the 13 Public Advocates Office supports SCE’s request. These topics include SCE’s discussion and 14 forecast for Grid Technology, Energy Storage, Transmission Projects, and Engineering 15 (expenses only). 16
II. SUMMARY OF RECOMMENDATIONS 17
The following summarizes the Public Advocates Office’s recommendations: 18
• The Public Advocates Office recommendation for Grid Management System 19 (GMS), Ex. SCE-2, Vol. 4, Part. 1, is $106.244 million for 2019-2021, compared 20 to SCE’s $116.399 million request. 21
• The Public Advocates Office recommends that SCE revise its GMS deployment 22 schedule to accelerate the control and monitoring of DERs with smart inverters. 23
• The Public Advocates Office recommendation for Engineering and Planning 24 (E&P) Software Tools, Ex. SCE-2, Vol. 4, Part. 1, is $1.634 million for 2019-25 2021, compared to SCE’s $88.710 million request. 26
• The Public Advocates Office recommends that the Commission order that the 27 funding adopted in this GRC for GMS and E&P Tools constitute full funding to 28
2 Refer to Public Advocates Office Workpapers for Ex. PAO-05C, Figure 5-1.

3
deploy these software tools, and that the only future costs that will be authorized 1 will be based on “refresh” costs.3 2
• The Public Advocates Office recommends memorandum account treatment for all 3 DER-driven Grid Reinforcement programs in Ex. SCE-2, Vol. 4, Part 2. This 4 results in a forecast of $0.0 for 2019-2021 now, compared to SCE’s $43.035 5 million request, but provides the potential for cost recovery in future rate cases. 6
• The Public Advocates Office recommends that SCE clarify the date by which 7 SCE will be able to monitor and control DERs, assuming it is directed to do so by 8 the Commission. 9
• SCE should provide requested information that defines the functionality of GMS 10 and E&P Software Tools. 11
Table 5-1 compares the Public Advocates Office’s recommendations and SCE’s 12 2019-2021 forecasts of T&D capital expenditures for the programs reviewed herein. 13
Table 5-1 14 T&D Capital Expenditures for 2019-2021 15
CPUC Jurisdictional, 2019-2021 16 (In Millions of Nominal Dollars) 17
Description Public Advocates Office Recommended
SCE Proposed4
2019 2020 2021 2019 2020 2021 Grid Management System (GMS)
$33.064 $35.724 $37.456 $33.064 $35.724 $47.611
Engineering and Planning (E&P) Software Tools
$1.634 $0.0 $0.0 $36.352 $25.145 $27.213
DER-driven Grid Reinforcement
$0.0 $0.0 $0.0 $0.0 $0.512 $42.523
18
3 Refer to Section IV.C.2. 4 Ex. SCE-2, Vol. 4, Part 1, p. 31, Table II-8 and p. 79, Figure II-21. Also, Ex. SCE-2, Vol. 4, Part 2, p. 26, Table II-2.

4
III. GENERAL DISCUSSION 1
A. Background 2
1. Glossary 3 Appendix A to this testimony includes a glossary to define acronyms used in this 4
testimony. 5
2. Capital Expenditures versus Capital Additions 6 This exhibit only discusses capital expenditures and does not specifically address 7
SCE’s capital additions. The distinction between the two is important. Capital expenditures, 8 as the term implies, reflect the capital dollars that SCE spends in a given year. No 9 consideration is given as to whether or not those expenditures result in projects that are 10 actually completed (and considered to be “used and useful”) during the year. In contrast, 11 capital additions reflect the dollar amount of projects that are completed during a given year, 12 regardless of when the expenditures actually took place. SCE has elected to present its 13 testimony and workpapers using the “expenditure” format. SCE’s Results of Operations 14 (RO) computer model takes these expenditures and converts them to capital additions using 15 project completion dates that are loaded into the model. To be consistent, the Public 16 Advocates Office has also presented its discussions and recommendations using capital 17 expenditures. 18
3. Capital Expenditures for 2022 and 2023 19 SCE’s testimony and workpapers include requests for 2022 and 2023. Capital 20
expenditures that occur after the 2021 Test Year are not discussed in this exhibit. The Public 21 Advocates Office’s post-test year ratemaking proposals for 2022 and 2023 are set forth in 22 Exhibit PAO-17. 23
4. Use of 2019 Recorded Expenditures 24 The Public Advocates Office obtains additional years of recorded plant data 25
whenever possible. In this GRC, the Public Advocates Office obtained recorded 26 expenditures for 2019 on March 13, 2020. The recommendations within this testimony were 27 developed prior to obtaining 2019 recorded data, and reflect SCE’s 2019 forecast 28 expenditures. 29

5
5. Use of Direct Nominal Dollars 1 In its exhibits and workpapers, SCE has presented its capital expenditures in direct 2
nominal dollars. “Direct” dollars refers to the fact that SCE’s capital expenditure estimates 3 do not include various loadings, such as the capitalized portions of Pensions and Benefits, 4 Payroll Taxes, Injuries and Damages, Administrative and General Expenses, etc. These 5 various loadings are estimated separately and are allocated to the various capital projects by 6
the RO computer model.5 “Nominal” dollars refers to the fact that SCE’s forecasts are 7
presented with estimates keyed to the year in which they occurred. For example, a 2020 8 capital expenditure will use 2020 dollars for its forecast, rather than presenting the estimate 9 in constant dollars from a prior year. Because the exhibits, workpapers, and the RO 10 computer model are all set up to use direct nominal dollars, the Public Advocates Office is 11 presenting its analyses and estimates in the same manner. 12
6. CPUC Jurisdictional Versus Total Expenditures 13 Many of the capital projects included in Ex. SCE-02, Vol. 4, Part 2 are, in part or in 14
whole, allocated to the Federal Energy Regulatory Commission (FERC) jurisdiction. Where 15 a requested program includes both FERC and CPUC jurisdiction requests, for example for 16
the Grid Reliability Program,6 SCE provides expenditure summaries for both the total 17
request and the CPUC jurisdictional request. SCE does not seek approval for FERC-related 18 investments in this proceeding. The projects and programs reviewed in this testimony do not 19 include FERC-jurisdictional expenditures, and for these projects and programs total 20 expenditures are equal to CPUC-jurisdictional expenditures. 21
7. Distribution Resources Plan (DRP) Proceeding 22 The topics covered in this testimony all relate to investments needed to maintain a 23
safe and reliable electric distribution system. Public Utilities Code section 353.5 requires 24 each electric utility “as a part of its distribution planning process, to consider specified 25 nonutility owned distributed energy resources as an alternative to investments in its 26 distribution system to ensure reliable electric services at the lowest possible costs.” Public 27
5 SCE response to Public Advocates Office data request PubAdv-SCE-113-TCR, Q.18c. 6 Ex. SCE-2, Vol. 4, Part 2, p. 97.

6
Utilities Code section 769 required each utility to file a “distribution resources plan” by July 1 1, 2015 regarding the integration of cost-effective distributed energy resources (DER),7 and 2 required the Commission to review those applications. The Commission established a 3 rulemaking in 2014, the Distribution Resources Plan (DRP) proceeding,8 and stated that the 4 “goal of these [distribution resource] plans is to begin the process of moving the Investor-5 Owned Utilities (IOUs) towards a more full integration of DERs into their distribution 6 system planning, operations and investment.”9 For more than five years the Commission and 7 parties including SCE and the Public Advocates Office have worked to establish the contents 8 of the DRPs, review these plans, and developed processes and tools to help integrate DERs 9 into the distribution planning process, including in GRCs. 10
The current proceeding is the first GRC filing from SCE to be subject to the 11 following key decisions adopted by the Commission in the DRP proceeding: 12
• Decision (D.) 17-09-026 – Adopted requirements for deployment of an 13 Integration Capacity Analysis (ICA), which provides public information 14 regarding the ability of distribution circuits to absorb DER without upgrades, 15
• D.18-02-004 – Adopted requirements for forecasting DER and load growth 16 and requirements for a Distribution Investment Deferral Framework (DIDF) 17 to allow qualified DER projects to defer a traditional “wired” grid upgrade, 18
• D.18-03-23 – Adopted a definition of Grid Modernization and required a Grid 19 Modernization Plan (GMP) to be included with each GRC. 20
While many of the major objectives of the DRP proceeding have been achieved, a 21 revised scoping memo issued in January of 2020 included a long list of issues or refinements 22
that remain to be implemented.10 23
7 Public Utilities Code section 769(a) states “for purposes of this section, “distributed resources” means distributed renewable generation resources, energy efficiency, energy storage, electric vehicles, and demand response technologies.” 8 Order Instituting Rulemaking (R.)14-08-013 issued August 20, 2014. 9 R.14-08-013, p. 4. 10 Joint Second Amended Scoping Memo and Ruling of Assigned Commissioner and Administrative Law Judge issued January 9, 2020 in R.14-08-013, pp. 4-6.

7
SCE’s includes the requisite GMP and refers to the above and other DRP 1 requirements throughout its testimony. Similarly, the Public Advocates Office refers to DRP 2 requirements where applicable in this testimony. 3
B. Discovery and Workpapers Supporting This Testimony 4 All reference materials cited in this testimony are included in the supporting 5
workpapers to PAO-05, including: 6
• Data request responses and cited attachments, 7
• Spreadsheets supporting tables and figures or other calculations, 8
• Presentations from meetings and workshops, 9
• Excerpts or full versions of reports, articles, or other publications, 10
• Excerpts from GRC and other testimony not available via the Commission 11 website, and 12
• Data requests issued, but with SCE responses pending. 13 These workpapers will be compiled after testimony is served, so citations herein do 14
not refer to specific volumes or pages of these workpapers. Please refer to the workpaper 15 Table of Contents to find specific references cited. 16
Excel versions of spreadsheets included in the workpapers will be provided to SCE, 17 other parties, the Administrative Law Judges, and the Commission if requested. 18
C. Overarching Issues 19
1. SCE Does Not Adequately Describe How Existing and 20 Customer Owned Technologies (ECTs) Can Aid with 21 DER Integration 22
The Commission’s Grid Modernization Decision stated “we agree that the IOUs 23 should identify how DERs and smart inverters can meet some of these [DER] integration 24
challenges as part of their Grid Modernization Plans.”11 SCE’s GMP includes a section 25
titled the “Role of Existing and Customer Technologies in Achieving Objectives,” which 26
provides a limited discussion of a subset of applicable technologies.12 Appendix B to this 27
11 D.18-03-023, p. 13. 12 Ex. SCE-2, Vol. 4, Part 1, p. A-21 to A-22. Smart meter systems such as this are also referred to as AMI
(continued on next page)

8
testimony provides the deployment status and an objective description of existing and 1 customer technologies (ECTs) that provide monitoring and/or control of DERs and customer 2 loads. Appendix B also discusses the ability of these tools to help integrate DERs compared 3 to the solutions proposed by SCE. This issue is raised as an overarching issue because it 4 impacts SCE’s requests as discussed in Sections IV.B.1 and V.B.6 below, and because it 5 triggers a new recommendation as discussed in Section III.D. below: the Commission should 6 order SCE to accelerate the deployment of a DER Management System (DERMS) to control 7 and monitor DERs. 8
2. SCE’s Request Presumes the Outcome of Active CPUC 9 Proceedings 10
In its TY 2018 GRC, SCE requested $1.875 billion through 2020 for a new Grid 11 Modernization program at the same time that the Commission and parties were debating how 12
to achieve the objectives of AB 327 and the DRP OIR.13 As discussed in Section III.A.7. 13
above, three key DRP decisions have been issued since the TY 2018 GRC which have 14 addressed many of the issues discussed in SCE’s GMP. Two issues remain to be resolved 15 which impact this GRC. First, D.17-09-026 authorized ICA deployment for one of three use 16 cases discussed by a Commission working group. However, SCE uses an analysis nearly 17 identical to ICA for a second use case (the planning use case) that has not been developed or 18 adopted by the Commission. SCE’s use of ICA is discussed in detail in Section V.B.4 below. 19
Second, SCE proposed a group of programs to perform grid upgrades to prepare for 20
forecast DER deployment.14 This program presumes that ratepayers will pay all upgrade 21
costs and DER developers will pay none. This is contrary to the Wholesale Distribution 22
systems because they encompass not only a communicating service meter, but also a wireless communication system within customer premises (the Home Area Network or HAN), a wireless communication system to connect the meters with the utility (the “backhaul”), and various data processing, storage, and presentment systems at the utility to allow the customer’s energy usage data to be used for billing, remote disconnection of delinquent customers and online presentment to customers. 13 SCE TY 2018 GRC, A.16-09-001, Ex. SCE-2, Vol. 10, SCE Testimony on T&D, Volume 10 – Grid Modernization dated September 1, 2016, “Grid Modernization Capital Expenditures 2016-2020 Forecast” figure provided before the table of contents. 14 Refer to Section V.B. below. These programs are referred to as “DER Hosting Capacity Reinforcement“ programs in SCE’s GMP, and “DER-driven…” programs in its Load Growth testimony, See Ex. SCE-2, Vol. 4, Part 2.

9
Access Tariff (WDAT) and Rule 21 interconnection process which establishes that larger 1
projects that trigger an upgrade must pay for the upgrade.15 Rule 21 is currently being 2
revised in proceeding R.17-07-017 and the scope includes “cost allocation for grid 3
upgrades.” 16 Generators under the Net Energy Metering (NEM) program were exempt from 4
paying interconnection fees until the Commission reevaluated NEM, determined “NEM 5 successor tariff customers should pay for them,” and instituted a “modest one-time additional 6
fee.”17 NEM was scheduled to be reviewed by 2019,18 but that review has yet to begin. 7
Determination of cost causation and cost responsibility are fundamental functions of 8 the Commission, and SCE is attempting to initiate DER-driven Reinforcement programs 9
prior to scoped Commission action in the DRP, Rule 21 and NEM proceedings. 19 10
3. SCE Should Be Held Accountable for Cost Escalation 11 Between Rate Cases When There Is No Showing of 12 Increased Scope or Functionality 13
Sections IV.C. and IV.D below discuss how SCE’s cost estimates for Grid 14 Modernization software systems and tools have increased significantly compared to its TY 15 2018 requests. SCE has provided no evidence that these forecast cost increases were in 16 response to a change in scope for these programs that results in increased functionality. 17 Instead, SCE is requesting that ratepayers pay significantly more for the same software SCE 18 requested in the last rate case. This is not reasonable. If SCE is unable to accurately forecast 19 project costs and/or unable to control implementation costs, SCE shareholders should pay for 20 these program management inadequacies. 21
15 See SCE Rule 21, sheet 45, Section E-4, effective September 1, 2016. Note that Individual customers also generally pay most of the cost for grid upgrades they cause per CPUC Rule 15 and 16, including line extensions to new housing developments, and residential or commercial service upgrades. Rule 15 provides allowances for residential ($3,402) and non-residential customers (per a formula included in the rule). 16 Order Instituting Rulemaking to Consider Streamlining Interconnection of Distributed Energy Resources and Improvements to Rule 21 (R.) 17-07-007 issued July 21, 2017, p. 2. 17 D.16-01-004, p. 85. The exact fee was set by each IOU in a subsequent advice letter per Ordering Paragraph 2 (D.16-01-004, p. 119). This decision allowed Single-Family Affordable Solar Housing (SASH) to remain exempt (p. 87), and required systems larger than 1 MW to “pay all interconnection costs under Rule 21” (D.16-01-004, p. 95). 18 D.16-01-044, p. 122, Ordering Paragraph 12. 19 D.15-01-001. For example, see pages 2 and 28.

10
4. SCE Should Provide Requested Information on GMS 1 Functionality 2
The Public Advocates Office requested SCE documents that describe the 3 functionality of SCE’s GMS per Sections IV.C. and IV.D. below. SCE responded that the 4 documents were highly sensitive and that “SCE is amenable to reviewing the requested 5
documents with Public Advocates Office in an in-person reading room session.”20 To the 6
extent that SCE claims the requested documents are confidential, SCE should provide them 7 pursuant to the requirements of D.16-08-024 and D.17-09-023, which govern the submission 8 of confidential documents to the Commission. One reason these documents were requested 9 was to provide a record of the scope of work and functionality associated with SCE’s GMS 10 request. Without these details, the Public Advocates Office is concerned that SCE’s TY 11 2024 GRC could ask for additional funding to deploy the same functionality it promised as 12 part of the current request. 13
D. Public Advocates Office Overarching Conclusions 14
1. Review of Public Advocates Office TY 2018 15 Recommendations 16
In SCE’s TY 2018 GRC, the Public Advocates Office’s testimony provided an 17 extensive review of SCE’s then new Grid Modernization request, and provided four 18
overarching recommendations:21 19
1. SCE’s comprehensive Grid Modernization request should be denied, but 20 existing programs and circuit specific DER-related upgrades should be 21 allowed if properly justified, 22 23
2. The CPUC should address cost attribution to DER and treatment of 24 customer/developer contributions in Track 3 of the DRP proceeding, 25 26
3. SCE should be required to perform an analysis of AMI (Advanced Metering 27 Infrastructure) capabilities to support Grid Modernization, 28 29
4. A Memorandum Account subject to reasonableness review should be used for 30 any Grid Modernization programs approved within the current GRC period. 31
20 SCE response to Public Advocates Office data request PubAdv-SCE-113-TCR, Q.4 and Q.5. 21 SCE TY 2018 GRC, A.16-09-001, Ex. ORA-9A, ORA Amended Testimony of Transmission and Distribution Capital Expenditures, Part 2 of 4, dated July 2017, pp. 56-61.

11
The Public Advocates Office’s testimony in the current case takes a different 1 approach that focuses on individual program requests, and only one new overarching 2 recommendation is provided in Section III.D.2 below. However, a brief review of the prior 3 recommendations is provided here. 4
First, cost attribution and treatment of customer/developer contributions is still an 5 open issue, as discussed in Section III.C.2. above. The same is true for the use of existing 6 equipment such as AMI, per Section III.C.1. above. Therefore, recommendations two and 7 three above are still relevant. 8
Second, the recommendation to deny SCE’s Grid Modernization Request was 9 addressed in D.19-05-020, which provided disposition of individual Grid Modernization 10
programs.22 In addition, a central point of the Public Advocates Office’s support for denial 11
was based on the fact that SCE’s request presumed the outcome of many issues in the DRP 12
proceeding that have now been addressed, as discussed in Section III.A.6. above.23 The only 13
element of this recommendation revisited in this testimony, “circuit specific DER-related 14 upgrades,” is addressed in Section V.B.9. below. 15
Finally, the recommendation to use a memorandum account for all of SCE’s Grid 16 Modernization request was not explicitly addressed in the disposition of the TY 2018 GRC in 17 D.19-05-020. While this recommendation is not repeated in the current case, a memorandum 18 account is recommended for one group of programs, as discussed in Section V.B.9. below. 19
2. The Commission Should Order SCE to Accelerate the 20 Deployment of a DER Management System (DERMS) 21 to Control and Monitor DERs 22
The DER Management System (DERMS) is the component of SCE’s proposed Grid 23
Management System (GMS) that will control and monitor DERs with “Smart Inverters.”24 24
While most of the requisite “Phase 3 smart inverters” are scheduled to begin deployment in 25 2020, SCE’s current GMS deployment plan puts DERMS deployment no earlier than 2022, 26
22 D.19-05-020 in A.16-09-001. Some programs were denied, some were approved per SCE’s request, and others were approved, but with a funding level less than SCE’s request. 23 Per Section III.C.2., some issues remain in the scope of the active DRP proceeding. 24 As discussed in Section IV.C. below and Appendix B.

12
and potentially not until beyond SCE’s current planning horizon.25 As discussed in 1
Appendix B to this testimony, the value of smart inverters is limited without a DERMS to 2 allow grid operators to monitor and control them. The Public Advocates Office therefore 3 recommends that DERMS deployment should be accelerated to minimize the time between 4 initial deployment of smart inverters that can be controlled and monitored, and deployment 5 of the DER Management System (DERMS) required to control and monitor them. 6
IV. DISCUSSION / ANALYSIS OF GRID MODERNIZATION 7
Appendix A of Ex. SCE-2, Vol. 4, Part 1 provides SCE’s Grid Modernization Plan 8 (GMP), as required by the Commission per D.18-03-023. Table 11 in the GMP summarizes 9 SCE’s forecasts for Grid Modernization for 2019-2028, which total $1.961 billion to $3.039 10
billion.26 11
The Public Advocates Office provides recommendations on three components of 12
SCE’s GMP which total $644 million to $818 million for 2019-2028:27 13
• Grid Management System (GMS), 14
• Engineering and Planning (E&P) Software tools, 15
• DER Hosting Capacity Reinforcement. 16 GMS and E&P Tools are discussed in this section, and DER Hosting Capacity 17
Reinforcement is discussed in Section V below. As noted in Section I of this testimony, a 18 lack of testimony on any component of SCE’s request should not be construed as support for 19 SCE’s proposal or request. 20
25 See Section IV.C.4. Refer to Appendix B for a summary of smart inverter functions, and status of deployment. 26 Refer to workpapers supporting Ex. PAO-05C, Grid Modernization Costs. Ex. SCE-2, Vol. 4, Part 1, p. A-32 provides forecast Grid Modernization costs for 2019-2028, including high and low range estimates for 2024-2028. 27 Refer to workpapers supporting Ex. PAO-05C, Grid Modernization Costs.

13
A. Background on Grid Modernization 1
1. PG&E’s TY 2020 GRC Was the First GRC to 2 Incorporate DRP Grid Modernization Requirements 3
Pacific Gas and Electric Company’s (PG&E’s) TY 2020 GRC, A.18-12-009, was the 4 first GRC to include a Grid Modernization Plan (GMP) consistent with D.18-03-023. 5 Multiple parties including the Public Advocates Office, The Utility Reform Network 6 (TURN) and SEIA/VoteSolar provided testimony regarding PG&E’s GMP, and additional 7 evidence regarding PG&E’s GMP and associated requests were added to the record through 8 hearings. A joint settlement agreement that included PG&E, the Public Advocates Office, 9 TURN, and other parties was submitted to the Commission prior to briefing, and disposition 10
of that case awaits issuance of a proposed decision.28 PG&E’s Grid Modernization request 11
is referenced in Section IV.C.2 below. 12
2. SCE’s TY 2018 GRC Grid Modernization Request 13 SCE’s TY 2018 GRC application, A.16-09-001, was the first GRC application to 14
include a substantial request for capital investments justified in large part due to the impacts 15 of DERs. SCE’s testimony in that case included a separate volume dedicated to “Grid 16 Modernization” that helped inform the Commission’s requirements for a GMP in D.18-03-17
023.29 18
SCE initially requested $1.875 billion in capital expenditures for Grid Modernization 19
for 2016-2020.30 This request included all the components included in SCE’s current 20
request, which Public Advocates Office summarizes as follows:31 21
28 Joint Motion of the Public Advocates Office, the Utility Reform Network, Small Business Utility Advocates, Center for Accessible Technology, the National Diversity Coalition, Coalition of California Utility Employees, The office of the Safety Advocate, and Pacific Gas and Electric Company for Approval of Settlement Agreement, dated December 20, 2019, filed January 14, 2020 in A.18-12-009. 29 SCE TY 2018 GRC, A.16-09-001, Ex. SCE-2, Vol. 10, SCE Testimony on T&D, Volume 10 – Grid Modernization dated September 1, 2016. 30 SCE TY 2018 GRC, A.16-09-001, Ex. SCE-2, Vol. 10, SCE Testimony on T&D, Volume 10 – Grid Modernization dated September 1, 2016, “Grid Modernization Capital Expenditures 2016-2020 Forecast” figure provided before the table of contents. 31 SCE TY 2018 GRC, A.16-09-001, Ex. SCE-2, Vol. 10, SCE Testimony on T&D, Volume 10 – Grid Modernization dated September 1, 2016, pp. 12-13. Figure I-1 on page 12 of this exhibit illustrates how these
(continued on next page)

14
• Distribution Automation – equipment added to monitor and reconfigure 1 distribution circuits, 2 3
• Substation Automation - equipment added to monitor and control substation 4 equipment such as transformers and circuit breakers, 5 6
• Communications – new equipment to expand communications between 7 distribution circuits, substations, and control centers, 8 9
• Grid Management System (GMS) – software system that processes 10 information from the equipment listed above, and helps grid operators control 11 automated equipment in substations and on distribution circuits, and 12 13
• Engineering and Planning (E&P) Tools – five software tools to help 14 integrate DERs into SCE’s distribution planning and operations. 15
16 In rebuttal testimony, SCE reduced its request by approximately $300 million based 17
on removal of its Subtransmission Relay Upgrade request and reductions in Distribution 18
Automation.32 In addition, SCE rebuttal re-focused its Grid Modernization justification on 19
the reliability benefits of its proposal.33 20
Intervenors provided extensive testimony criticizing SCE’s Grid Modernization 21 request, due in part to the magnitude of the request and its potential impact on the integration 22 of DERs. As with the description of SCE’s request above, the following excerpts from 23 intervenor testimony are greatly simplified summaries, and readers should refer to the cited 24 materials for a full understanding of intervenor concerns, arguments, and recommendations: 25
• The Public Advocates Office – “SCE’s request for Grid Modernization 26 investments is premature, and ORA’s testimony details eight reasons why 27 SCE’s Grid Modernization proposal should not be adopted now.”34 28 29
components are related. 32 SCE TY 2018 GRC, A.16-09-001, Ex. SCE-2, Vol. 18, SCE Rebuttal Testimony on T&D– Grid Modernization, dated June 16, 2017, pp. 6-7. 33 SCE TY 2018 GRC, A.16-09-001, Ex. SCE-2, Vol. 18, SCE Rebuttal Testimony on T&D– Grid Modernization, dated June 16, 2017, p. 1. 34 Opening Brief of the Office of Ratepayers Advocates in A.16-09-001 dated September 8, 2017, p. 80. The full brief on this topic, provided on pages 80-106, recommended no funding for new Grid Modernization programs; continue funding certain historical programs; and funding of circuit specific Distributed Energy Resource-related upgrades if they are properly justified. Seven reasons were provided to support these recommendations.

15
• SEIA/VoteSolar – “SCE has not demonstrated that the benefits of the 1 program exceed its costs. Therefore, SCE's request for $1.7 billion to fund 2 it[s] Grid Modernization proposal must be denied.”35 3
4 • TURN – “TURN’s total 2018 forecast for grid modernization investments is 5
$116.474 million. This amount would provide grid flexibility needs for the 6 distribution operator and would achieve 55% of SCE’s reliability benefits, at 7 about 25% of the cost.”36 8
9 SCE’s TY 2018 Grid Modernization requests were resolved through D.19-05-020. 10
Details regarding the full or partial funding for the specific Grid Modernization components 11 are discussed in Sections IV.C., IV.D., and V.B. below. 12
B. General Critiques of SCE’s Grid Modernization Request 13
1. SCE’s GMP Prioritizes High-Cost IOU Solutions 14 Without Adequate Consideration of ECTs 15
Section III.C.1. raised this as an overarching issue, and Appendix B describes how 16 ECTs (Existing and Customer Technologies) can play an integrating DERs into SCE’s 17 distribution grid. This section details how SCE failed to meet the Commission requirement 18
to consider ECTs with its GMP.37 19
SCE’s GMP states that “SCE recognizes the importance of leveraging existing utility 20 and 3rd party infrastructure to achieve its Grid Modernization objectives when it is possible 21
and reasonable.”38 However, the subordinate role these technologies play within SCE’s 22
35 Opening Brief of the Solar Energy Industries Association and Vote Solar in A.16-09-001 dated September 8, 2017, p. 14. The full brief on this topic, provided on pages 13-27. Pages 6-13 of the SEIA/VoteSolar brief compiled its critique of how SCE accounted for solar photovoltaic (PV) systems in its System Planning capital requests. 36 Opening Brief of The Utility Reform Network in A.16-09-001 dated September 8, 2017, p. 51. TURN’s $116.474 million forecast is compared to SCE’s 2018 forecast of $440.664 million on page 52. Pages 46-109 of TURN’s brief compiled its analysis of SCE’s request and its recommendations for each Grid Modernization component except for SCE’s request for planning tools, which TURN supported. 37 D.18-03-023, pp. 12-13. These pages of the decision discuss a critique by SEIA and VoteSolar regarding the list of potential integration challenges which stated “many of these challenges will be resolved in part by smart inverters, DERs such as energy storage, and by mitigations identified during the interconnection process." The Commission responded with the following: “We agree that the IOUs should identify how DERs and smart inverters can meet some of these integration challenges as part of their Grid Modernization Plan.” 38 Ex. SCE-2, Vol. 4, Part 1, p. A-21, emphasis added.

16
GMP is demonstrated by the length of the discussion: approximately one page.39 ECTs are 1
not referenced in GMP tables regarding DER-related technology evaluations, foundational 2 technologies, Grid Modernization capabilities, Grid Modernization technology profiles, 3 alternatives to SCE investment, cost reasonableness determination, and DER integration 4
challenges and mitigations.40 Omission of ECTs from the final table listed is particularly 5
troubling because Commission Resolution E-4982 expressly includes smart inverters and 6
energy storage as technologies that can mitigate potential DER integration challenges.41 7
The Public Advocates Office does not claim that the use of ECTs to measure and 8 control customer load and DERs provides the same benefits as SCE’s GMP, but as described 9 in detail in Appendix B, they can be used to help mitigate DER integration issues. 10 Considering the low cost to ratepayers of these alternatives, they should have served as the 11 baseline against which SCE’s GMP was compared. 12
2. SCE’s Systemwide Grid Modernization Investments Do 13 Not Appear to Reduce the Need for Circuit Specific 14 Upgrades 15
SCE’s GMP describes two types of upgrades: systemwide and location specific 16
upgrades.42 Location specific upgrades include substation and feeder automation programs, 17
which add monitoring and switching capabilities, and DER Hosting Capacity Reinforcement 18 programs, which upgrade or add equipment in the power flow path, including conductors, 19
voltage regulators, circuit breakers, entire feeders, and substation transformer banks. 43 20
Section V.B. below discusses the latter, which are referred to in SCE’s Load Growth 21
39 Ex. SCE-2, Vol. 4, Part 1, pp. A-21 to A-22. Outside of this short discussion, AMI is referenced on page A-19 one as a source of data to one of SCE’s requested Grid Analytics Application. Smart Inverters are referenced on page A-16, but in a footnote that relates to autonomous DERs without smart inverters. 40 Ex. SCE-2, Vol. 4, Part 1, Appendix A, tables 4, 5, 7, 12, 14, 15, and 18. 41 Resolution E-4982, final three pages of the resolution labeled pages 1-3. Footnote 30 on page 1 states “Smart inverters represent a new remedy for managing the voltage concerns at the source of the issues. Smart inverter functionalities, such as the Volt/VAR and fixed power factor functions of the Smart Inverter Working Group’s Phase 1 Recommendations, continue to evolve and may become a preferred method for voltage management over traditional approaches in the near future.” 42 Ex. SCE-2, Vol. 4, Part 1, pp. A-48 to A-52. 43 Ex. SCE-2, Vol. 4, Part 1, pp. A-48 to A-52.

17
testimony as DER-driven programs. Based on the Public Advocates Office reading of SCE 1 testimony and workpapers, it does not appear that SCE’s proposed Grid Modernization 2 upgrades intended to provide monitoring and control of SCE assets are factored into the 3 forecast of its DER-driven programs. Thus, these investments do not appear to reduce the 4 need for DER Hosting Capacity Reinforcement programs. If this is correct, it is a 5 shortcoming of SCE’s GMP compared to the use of ECTs which can increase hosting 6 capacity at a lower cost, as discussed in Appendix B. 7
3. Sectionalization per SCE’s GMP May Decrease DER 8 Hosting Capacity and Increase DER-Driven Grid Needs 9
The distribution automation component of SCE’s GMP adds Supervisory Control and 10 Data Acquisition (SCADA) enabled switches to distribution circuits to “sectionalize” the 11
circuit and allow restoration to some customers on the circuit during an outage.44 SCE’s 12
GMP describes multiple benefits of distribution automation which are neither challenged nor 13 supported by the Public Advocates Office. However, it appears that the addition of these 14 SCADA switches reduces the hosting capacity for DERs using both ICA and SCE’s “DER-15 driven Reinforcement Study,” as discussed in detail in Appendix C to this testimony. The 16 Public Advocates Office recommends that SCE address this issue in rebuttal testimony, and 17 clarify if this is an adverse impact of sectionalization, an unforeseen limitation of ICA/ 18 SCE’s DER-driven Reinforcement Study, or both. 19
C. Grid Management System (GMS) 20 SCE describes GMS as “an advanced software platform that will […] enable SCE 21
system operators, operations engineers and other users to receive and analyze real-time 22
information on customer energy usage, system power flows, system outages.”45 SCE also 23
states that “GMS will also provide interfaces required for grid operators in centralized 24 control centers to monitor and control “grid devices” such as remote operated switches and 25
44 In the TY 2018 SCE, SCE requested adding three mid-circuit switches per circuit. Its current request includes one. See Ex. SCE-2, Vol. 4, Part 1, pp. 104-105. 45 Ex. SCE-2, Vol. 4, Part 1, p. 75.

18
DERs.”46 SCE requested funding for GMS for the first time in its TY 2018 GRC, and its 1
request for $134.5 million was approved by the Commission.47 2
Table 5-2 below compares SCE’s GMS request with the Public Advocates Office’s 3 recommendation for 2019-2021: 4
Table 5-2 5 Capital Expenditures for 2019-2021 6 Grid Management System (GMS) 7 (In Thousands of Nominal Dollars) 8
Description Public Advocates Office Recommended
SCE Proposed48
2019 2020 2021 2019 2020 2021 GMS $33,064 $35,724 $37,456 $33,064 $35,724 $47,611
9 Table 5-2 shows a recommended $10.2 million reduction for 2021, but this is just a 10
portion of the Public Advocates Office recommendation to limit ratepayer funding of GMS 11 deployment to the $134.5 million previously authorized. The Public Advocates Office’s full 12 recommendation for GMS is provided in Section IV.B.5. below based on the following 13 discussion points. 14
1. SCE’s GMS Has Evolved into a Collection of Software 15 Tools 16
SCE’s TY 2018 request described GMS as a single software tool and discussed how 17 the alternative of deploying “existing disparate stand-alone products … would essentially 18 create the Grid Management System at a cost that would exceed that of the GMS we intend 19
to develop.”49 This is different than SCE’s current GMS request which describes GMS as 20
“an advanced software platform” as previously mentioned. Some components of GMS are 21 discussed in SCE’s testimony including ADMS (Advanced Distribution Management 22
46 Ex. SCE-2, Vol. 4, Part 1, p. 75. 47 D.19-05-020 specifically authorized $39.456 million for 2018 and did not address SCE’s request for other years. SCE’s response to Public Advocates Office data request PubAdv-SCE-113-TCR, Q.16 indicated that SCE errata in the TY 2018 GRC revised the total GMS request to $134.5 million. 48 Ex. SCE-2, Vol. 4, Part 1, p. 79, Figure II-21. 49 SCE TY 2018 GRC, A.16-09-001, Ex. SCE-2, Vol. 10, pp. 109-110.

19
System), DERMS (DER Management System), and SCADA and Figure 5-2 shows how they 1
are related:50 2
Figure 5-2 3 GMS System Architecture 4
5
6 The Public Advocates Office requested SCE and SCE vendor documents describing 7
GMS requirements, components, and capabilities, but they were not provided.51 SCE’s 8
responses to discovery did provide an estimate of the cost for each GMS component and an 9 EPIC Report purported to provide “information and results from our Operational Service Bus 10 [OBS] proof of concept” which appears to be a central element of GMS based on Figure 5-2 11
50 SCE’s response to data request PubAdv-SCE-113-TCR, Q.6. 51 SCE’s response to data request PubAdv-SCE-113-TCR, Q.4 and Q.5, received March 10, 2020. Both responses stated: “SCE is amenable to reviewing the requested documents with Public Advocates Office in an in-person reading room session,” but this is not an appropriate substitute for providing documents to the Public Advocates Office, and is impracticable, if not impossible, due to current restrictions on in-person meetings. Refer to Section III.C.4.

20
above.52 SCE does not mention the evolution of GMS from a single software tool into a 1
platform of multiple tools as a driver of its current forecast.53 2
2. SCE’s Request for an 84% Increase for GMS Is Not 3 Sufficiently Supported or Justified 4
SCE’s Current Forecast for Full GMS Deployment is $247.1 Million 5 SCE testimony provides a “revised GMS capital expenditure forecast of $191.9 6
million,”54 but this value only accounts for SCE’s annual capital expenditure forecasts for 7
2019 through 2023.55 It also excludes O&M costs.56 Two estimates of the total cost for 8
GMS deployment, per SCE, are available. First, SCE’s testimony shows that SCE has 9 already recorded $28.9 million through 2018 for GMS, and has estimated costs for 2024-10
2028 of between $54.0 million and $81.0 million.57 This results is a 2016-2028 cost 11
between $274.8 million and $301.8 million. In this estimate, little is known about the 2024-12
2028 costs except that it is “a rough estimate.”58 The other estimate of GMS total costs is 13
provided by SCE’s Benefit to Cost (BCA) analysis for GMS provided in response to 14 discovery, which shows 2019-2028 capital expenditures of $268.1 million. 59 When recorded 15 costs are added, this yields $297.0 million in capital expenditures for 2016-2028, which 16 agrees with the range above. The BCA provides the following important information 17 additional to that provided in testimony: 18
52 SCE’s response to data request PubAdv-SCE-113-TCR, Q.3 and Q.10. 53 Ex. SCE-2, Vol. 4, Part 1, p. 80. 54 Ex. SCE-2, Vol. 4, Part 1, p. 85. 55 Ex. SCE-2, Vol. 4, Part 1, Figure II-21, p. 79. 56 See SCE’s response to data request PubAdv-SCE-113-TCR, Q.18. 57 See Ex. SCE-2, Vol. 4, Part 1: recorded costs from Figure II-21, p. 79, and 2024-2028 forecast costs from Table 11, p. A-32. 58 SCE’s response to data request PubAdv-SCE-113-TCR, Q.17 states that “the GMP forecast for GMS in 2024-2028 is outside of the 2021 GRC scope and are considered to be a rough estimate.” 59 Attachment to SCE’s response to data request PubAdv-SCE-113-TCR, Q.31.

21
• There are no capital expenditures forecast for 2025 and 2026, indicating that 1 GMS deployment costs end in 2024,60 2
• SCE’s current estimate for full GMS deployment capital costs is $247.1 3 million,61 4
• SCE anticipates that a “refresh” of GMS will be required every seven years 5 for 20% of the “initial capital costs,” plus overheads and a 20% contingency.62 6 This equates to $49.9 million in 2027. 7
SCE’s GMS Deployment Forecast has Increased 84% 8 SCE’s TY 2018 GRC testimony and workpapers forecast GMS capital expenditures 9
of $134.5 million.63 A BCA for the TY 2018 GRC was provided in response to discovery 10
from TURN, which revealed the following:64 11
• There are no capital expenditures forecast for 2021-2024, indicating that GMS 12 deployment costs were expected to end in 2020,65 13
• SCE’s estimate for full GMS deployment capital costs was $134.8 million,66 14
60 Attachment to SCE’s response to data request PubAdv-SCE-113-TCR, Q.31, Tab “GMS Costs,” cells J6-K6. 61 $218.2 million from the BCA for 2019-2024 (Tab “GMS Costs,” cells D6-I6) plus $28.9 for recorded costs through 2018. 62 Calculations in the Excel version of the BCA show that 2019-2024 capital costs are used as the “initial capital costs.” There is a lack of clarity regarding how SCE applies contingency in its cost estimate. It is clear from the Excel version of the BCA that a 20% contingency adder is applied to the refresh costs. However, while the BCA “Key Assumptions” tab shows a GMS contingency rate of 20%, SCE’s response to data request PubAdv-SCE-113-TCR, Q.23 indicated that contingency was not applied to the current forecast. The BCA shows static values for 2019-2024, which does not illuminate whether contingency was added or not. Contingency is also discussed relative to SCE’s TY 2018 GRC forecast later in this section. 63 SCE’s original testimony provided a forecast of $135.1 million (A.16-09-001, Ex. SCE-2, Vol. 10, p.99, Figure III-34.) SCE’s original workpapers provided two cost estimates, one that supported the $135.1 million value, and another that showed a total value of $123.2 million (A.16-09-001, Workpapers, Ex. SCE-2, Vol. 10, pp. 188-192.) In response to data request PubAdv-SCE-113-TCR, Q.16 in the current GRC, SCE showed that a final forecast was $134.5 million, and provided TY 2018 GRC errata workpapers supporting this value as an attachment. 64 SCE TY 2018 GRC, A.16-09-001, attachment to SCE response to TURN-SCE-026, Q.55. 65 SCE TY 2018 GRC, A.16-09-001, attachment to SCE response to TURN-SCE-026, Q.55, Tab “6a. GMS Costs,” cells G6-J6. 66 SCE TY 2018 GRC, A.16-09-001, attachment to SCE response to TURN-SCE-026, Q.55, Tab “6a. GMS Costs,” cells C6-F6. As discussed in footnote 63, SCE’s estimate for GMS changed during the TY 2018 GRC, which might account for the small difference between the $134.5 million and $134.8 million values.

22
• SCE anticipated that a “refresh” of GMS would be required every seven years 1 for 20% of the “initial capital costs,” plus overheads and a 20% contingency.67 2 This equated to $30.4 million in 2025. 3
Information provided in the BCAs for both the TY 2018 GRC and current case shown 4 that SCE’s forecast for the full cost of GMS deployment has increased by $112.6 million, or 5
84%.68 6
SCE’s Current Cost Estimate Cannot Justify an 84% Increase 7 In response to discovery, SCE confirmed that the forecast cost for GMS has 8
increased, but could not quantify the increase.69 SCE workpapers provided a cost estimate 9
to support its current GMS forecast using the same six line template used for many of its 10
other Grid Modernization requests.70 This cost estimate is very simplistic compared to the 11
22 line cost estimate provided to support SCE’s TY 2018 GMS request.71 The Public 12
Advocates Office issued a data request asking if this was “the most detailed cost estimate 13 SCE currently has for GMS,” and in response SCE referred to the confidential attachment to 14
another data request.72 This cost estimate contained more information than SCE’s 15
workpaper, but suffered from the following limitations: 16
67 Calculations in the Excel version of the BCA show that 2016-2020 capital costs were used as the “initial capital costs.” 68 $247.1 million less $134.5 million is $112.6 million. 69 SCE’s response to data request PubAdv-SCE-113-TCR, Q.19a. 70 SCE Workpapers, Ex. SCE-2, Vol. 4, Part 1, Chapter II, Book A, p. 168. Other GM workpapers for E&P Software Tools and Communications requests with similar format are provided at pages, 124, 128, 134, 136, 140, 144, 148, 152, 156, and 160. Workpapers supporting Ex. PAO-05C, Table 5-3, below, discuss the cost estimate for the SMT tool which included a seventh line for “other.” 71 SCE TY 2018 GRC, A.16-09-001, Ex. SCE-2, Vol. 10, SCE Workpapers supporting T&D– Grid Modernization, dated September 1, 2016, p. 190. 72 SCE response to data request PubAdv-SCE-113-TCR, Q.20a, which refers to the attachment to SCE’s response to data request PubAdv-SCE-113-TCR, Q.3. The attachment is an Excel spreadsheet titled “CONFIDENTIAL GMS Functions_Cost Breakdown_Q3_Q21_Q22_03092020.”

23
• It provided no additional support for one of the six line items in SCE’s cost 1 estimate, “Supporting Costs,” which account for $39.1 million or 18% of 2
SCE’s 2016-2023 cost forecast of $220.8 million,73 3
• SCE provided purported total vendor costs, which account for $97.0 million 4 or 44% of SCE’s 2016-2023 cost forecast of $220.8 million, but SCE would 5
not provide supporting evidence to the Public Advocates Office,74 and 6
• It did not include 2024 expenditures, which included $26.2 million in capital 7
expenditures for the final year of GMS deployment.75 8
SCE failed to provide adequate support for its significant 84% increase in either its 9 application or in response to direct requests for this information from the Public Advocates 10 Office. 11
GMS Contingency Costs Should be Clarified 12 SCE’s TY 2018 GRC GMS forecast included a 25% contingency adder for all initial 13
deployment costs and an additional 20% adder for recurring “refresh” costs.76 SCE’s current 14
GMS forecast does not mention contingency and in response to discovery stated “SCE did 15 not include a contingency adder in SCE’s 2021 GRC GMS capital expenditure forecast for 16
the 2019-2023 period.”77 This statement appears to be consistent with SCE’s other 17
73 Supporting Costs are public, from SCE Workpapers, Ex. SCE-2, Vol. 4, Part 1, Chapter II, Book A, p. 168. The confidential attachment to SCE’s response to data request PubAdv-SCE-113-TCR, Q.3, does not provide support for these costs. (The attachment is an Excel spreadsheet titled “CONFIDENTIAL GMS Functions_Cost Breakdown_Q3_Q21_Q22_03092020.”) 74 Costs for Vendor Contracts-fixed price and Software License are public, from SCE Workpapers, Ex. SCE-2, Vol. 4, Part 1, Chapter II, Book A, p. 168. In data request PubAdv-SCE-113-TCR, Q.21c, the Public Advocates Office asked: “For any GMS component whose cost is forecast based on competitive market pricing, provide evidence that the specific forecast cost is consistent with the vendor data provided in the competitive solicitation process.” (Emphasis added.) SCE responded: “The details of those costs are a direct extract from the final cost proposals…,” but provided no evidence to support this assertion. 75 The $26.2 million amount is public; see attachment to SCE’s response to data request PubAdv-SCE-113-TCR, Q.31, Tab “GMS Costs,” cell I11. 76 SCE TY 2018 GRC, A.16-09-001, Ex. SCE-2, Vol. 10, SCE Workpapers supporting T&D– Grid Modernization, dated September 1, 2016, p. 190 shows a 25% contingency. SCE TY 2018 GRC, A.16-09-001, attachment to SCE response to TURN-SCE-026, Q.55, Tab “Key Assumptions,” cell B41 shows a 20% contingency which is applied to recurring costs. 77 SCE response to Public Advocates Office data request PubAdv-SCE-113-TCR, Q.23, emphasis added.

24
responses to discovery, but to be clear, SCE continues to apply a 20% contingency adder for 1
recurring costs starting in 2027.78 The Public Advocates Office is concerned that SCE has 2
moved contingency from being included as an explicit adder in the TY 2018 GRC to being 3 embedded in other elements of SCE’s current forecast, possibly for example within the 4 “Supporting Costs” for which SCE has provided no support. This concern is based on the 5 fact that even the most detailed level of cost estimate, AACE Class 1, includes uncertainty 6
ranging from -10% to +15%, 79 and on other significant uncertainties unique to SCE’s GMS 7
proposal discussed below. 8 End-to-End Testing 9 End-to-end testing for a measurement and control system involves inserting a known 10
physical or electrical stimulus at one end, and verifying that the correct response is observed 11 at the other end. For GMS and its associated communication networks and automated field 12 devices, one end is the field device and the other is the GMS display screen and database in 13
the distribution operation center.80 SCE’s narrative description of GMS “Supporting Costs” 14
indicates that end-to-end testing costs are included, but these testing costs are not 15
quantified.81 SCE also states that “the need for a more comprehensive approach to …system 16
testing” was a component of its current GMS forecast.82 17
In its recent TY 2020 GRC, PG&E’s cost estimate for its equivalent of GMS included 18
an explicit description and cost estimate for “point-to-point” testing.83 The Public 19
78 Attachment to SCE’s response to Public Advocates Office data request PubAdv-SCE-113-TCR, Q.3, tab “Key Assumptions,” cell B17. 79 AACE International Recommended Practice No. 18R-97, Cost Estimate Classification System as Applied in Engineering, Procurement, and Construction for the Process Industries, p. 2. 80 To test a GMS measurement, a signal such as a known current is applied to a field device such as a SCADA enabled switch and the current is verified on the GMS display. For a GMS control, a signal such as “open” or “close” is initiated in the GMS system, and the correct response (“open” or “close”) is observed at the field device. 81 SCE Workpapers, Ex. SCE-2, Vol. 4, Part 1, Chapter II, Book A, p. 168. 82 Ex. SCE-2, Vol. 4, Part 1, p. 80. 83 PG&E TY 2020 GRC, A.18-12-009, Ex. PG&E-4, Electric Distribution Workpapers Supporting Chapters 11-19, dated December 13, 2018, pp. WP 19-13, WP 19-14, and WP 19-18. PG&E requested an ADMS, which is one component of SCE’s GMS.

25
Advocates Office’s testimony, discovery, and cross examination of PG&E’s witness 1 explored PG&E’s definition of “point-to-point” testing relative to “end-to-end” testing, the 2 specific scope of testing work included in PG&E’s forecast, and the specifics of PG&E’s cost 3
estimate.84 This issue was not briefed or reviewed by the Commission since this issue was 4
resolved through settlement, but the testimony, workpapers, and hearing transcripts attest to 5 the following: 6
• Point-to-point testing was the single most expensive cost component (40%) of 7 PG&E’s ADMS request,85 8 9
• Field based point-to-point testing, which is comparable to end-to-end testing, 10 was the most expensive form of point-to-point testing proposed by PG&E,86 11
12 • The cost to test a new ADMS/SCADA system will vary widely depending on 13
the test method, number of points tested, size and expertise of the test team, 14 and other factors.87 15
16 These findings from PG&E’s ADMS request should be considered in the evaluation 17
of SCE’s GMS request. SCE’s testimony and workpapers provided no information about its 18 GMS testing plan, and in response to discovery indicated that its “End-to-End Testing plan 19 for GMS (Phase 1) is in the process of being developed and the plan is scheduled to be 20
84 PG&E TY 2020 GRC, A.18-12-009, Ex CalAdvocates-08, Testimony on Electric Distribution Capital Expenditures, Part 1 of 2, June 28, 2019, pp. 44-48; PG&E responses to data requests PubAdv_093, Q. 1, 3, 8, 9, 10, 11, 16, 20; PG&E responses to data requests PubAdv_225, Q. 1 and Q. 3; Reporter’s Transcript (RT) for October 2, 2019, pp. 1716-1735. 85 PG&E TY 2020 GRC, A.18-12-009, Ex CalAdvocates-08, Testimony on Electric Distribution Capital Expenditures, Part 1 of 2, June 28, 2019, p. 39. For 2020, $12.934/$32.487 is 39.8%. 86 PG&E TY 2020 GRC, A.18-12-009, Ex. PG&E-8, Rebuttal Testimony on Electric Distribution, Chapter 1 though Chapter 19, Volume 1 of 2, dated September 4, 2019, pp. 19-40 to 19-41 and 19-46 to 19-47. This testimony does not explicitly provide costs, but the discussion in whole shows that PG&E’s testing costs had already been reduced by assuming that 85-90% of SCADA point would be tested using “back-office point-to-point testing methods. 87 PG&E TY 2020 GRC, A.18-12-009, Ex. PG&E-4, Electric Distribution Workpapers Supporting Chapters 11-19, dated December 13, 2018, p. WP 19-14, Table 19-14 shows the details of how PG&E estimated the cost of point-to-point testing. PG&E TY 2020 GRC, A.18-12-009, Ex CalAdvocates-08, Testimony on Electric Distribution Capital Expenditures, Part 1 of 2, June 28, 2019, pp. 44-48 discusses the impacts of individual components on the final cost estimate.

26
completed in Q3 2020.”88 This statement is problematic for two reasons. First, it indicates 1
that SCE’s current GMS forecast was prepared without a Testing Plan, and therefore its 2 forecast includes uncertainty regarding the scope and cost of testing. Second, because this 3 statement refers only to GMS Phase 1, it can be inferred that this testing plan will not include 4
testing of DERs and microgrids that will be controlled and monitored through DERMS. 89 5
Since GMS is being designed to interface with both SCE and third-party owned assets, a 6 complete Test Plan must include both types of DER. 7
Both of these issues point to the probability that SCE’s current GMS forecast either 8 has embedded contingencies to account for uncertain testing costs, or that SCE’s GMS 9 forecast has omitted critical costs. Even if these costs will be incurred outside of the current 10 GRC time period, this section of Public Advocates Office analysis is evaluating the increase 11 in total GMS deployment costs, so this omission is relevant. 12
SCE’s GMS Forecast Appears to Include a Limited DERMS 13 The common template SCE used for GMS and E&P tools was used to create Table 5-14
3 below, which shows SCE’s forecasts for Grid Modernization software:90 15
16
88 SCE response to data request PubAdv-SCE-113-TCR, Q.14. 89 Refer to Section IV.C.4. below regarding SCE’s phased approach to GMS deployment. 90 Refer to workpapers supporting Ex. PAO-05C, Table 5-3. SCE’s cost estimate for SMT included $762 thousand for “other,” which has been added to “Supporting Costs” for SMT in the table above. Note that the public version of this table as shown is provided in the public version of the Ex. PAO-05C workpapers, and a version including confidential data for ADMS and DERMS is provided in the confidential version of these workpapers.

27
Table 5-3 1 Total Capital Expenditures Through 2023 2 For Grid Modernization Software Tools 3
(In Millions of Nominal Dollars) 4
5 This table shows that vendor fixed price contracts and software licenses combined 6
constitute more than half of the forecast cost for each software system except GMS, and 7
range from $8.6 million for DRPEP to $97 million for GMS.91 8
In a response to discovery, SCE broke out the cost of individual GMS components 9
such as ADMS, ADMS Enhancements, and DERMS in its 2016-2023 forecast.92 For 10
ADMS, SCE’s confidential data shows vendor fixed price contracts and software licenses 11 totaled $xxxxxxxxxxxx, indicating that the vendor costs for ADMS are the most expensive 12
for Grid Modernization software by a significant margin. 93 The comparable vendor costs 13
for DERMS are $xxxxxx xxxxxxxx xxx xxxxxxx xxxxxxxxxxx xxxxxxx xxxxxxx xxxxxx 14 xxxxx xxxx. The relatively small forecast for DERMS vendor costs compared to ADMS and 15 E&P tools leads the Public Advocates Office to question whether SCE’s current GMS cost 16 estimate will provide for full deployment of a means of controlling and monitoring DERs. 17 This is discussed in more detail in the Section IV.C.4. below. 18
91 One potential reason that this general finding does not hold for GMS is that GMS is the only tool to require extensive end-to-end testing. 92 Redacted attachment to SCE’s supplemental response to data request PubAdv-SCE-113-TCR, Q.3, “GMS Functions_Cost Breakdown_Question 3-21-22 Redacted.” 93 Attachment to SCE’s response to data request PubAdv-SCE-113-TCR, Q.3, “CONFIDENTIAL GMS Functions_Cost Breakdown_Q3_Q21_Q22_03092020.” SCE asserts confidentiality over this attachment. ADMS costs include both ADMS and ADMS Enhancements which relate to DERs.
Cost Type LTPT SMT DRPEP GIPT GCM GAA GMSSCE Labor 0.538$ 0.922$ 0.935$ 1.325$ 2.400$ 2.296$ 14.710$
Vendor Contract - Effort Driven 0.175$ 0.557$ 0.176$ 1.505$ -$ -$ 26.701$
Vendor Contract - Fixed Price 17.745$ 17.436$ 8.546$ 18.141$ 34.315$ 30.918$ 78.950$
Software License 0.500$ 1.379$ 0.053$ 0.300$ -$ 0.558$ 18.054$
Hardware and Data Center (App, 0.890$ 0.616$ -$ 0.153$ 0.150$ 2.571$ 43.321$
Supporting Costs* 10.225$ 5.179$ 4.811$ 7.835$ 8.789$ 10.143$ 39.059$
Total Capital 30.073$ 26.088$ 14.521$ 29.260$ 45.654$ 46.486$ 220.797$
Check 30.073$ 26.088$ 14.521$ 29.260$ 45.654$ 46.486$ 220.797$
Vendor Fixed Price and Licence 18.25$ 18.81$ 8.60$ 18.44$ 34.32$ 31.48$ 97.00$ % of Total Capital 61% 72% 59% 63% 75% 68% 44%

28
3. The Increase in SCE’s Forecast GMS Deployment Cost 1 is Not Due to An Increase in GMS Functionality 2
One possible justification for the 84% increase in SCE’s forecast GMS capital 3 expenditures would be that SCE has changed the requirements, and that GMS will have more 4 functionality compared to the TY 2018 GRC request. Based on the Public Advocates 5 Office’s comparison of the Grid Modernization volumes in each case, and the sections on 6 GMS in particular, this did not appear to be the case. SCE’s response to discovery asking 7 “please describe any new functionality included in SCE’s current GMS proposal compared to 8 its TY 2018 forecast” appears to confirm that there is no significant increase in GMS 9
functionality in the current case relative to the TY 2018 GRC.94 The discussion of DERMS 10
vendor costs in the previous section suggests that current GMS functionality may have 11 decreased. 12
4. SCE’s Current GMS Proposal Will Delay Monitoring 13 and Control of DERs with Smart Inverters 14
The role of ECTs, existing and customer technologies, as a tool for DER integration 15 is discussed in Appendix B. This section discusses how SCE’s GMS deployment plan will 16
delay the realization of benefits provided by DERMS control and monitoring of DERs.95 17
While SCE’s testimony states that GMS will include DERMS, the testimony is 18 ambiguous regarding the timing of DERMS deployment and the degree to which these 19
deployment costs are included in the current GRC.96 Also, as discussed in Section IV.C.2. 20
above, the Public Advocates Office is concerned that SCE’s current GMS cost does not 21
94 SCE’s response to data request PubAdv-SCE-113-TCR, Q.19. Part “c” of SCE’s response stated “from a business capabilities point of view, the functionality for GMS that is described in the 2021 GRC is in alignment with that presented in the 2018 GRC. Any areas of differences are limited to the technical scope for how the GMS solution will be implemented.” The meaning of this response is not entirely clear, but since no new functionality was provided in SCE’s response it is reasonable to infer that none is planned. Also see SCE’s response to data request PubAdv-SCE-113-TCR, Q.1. 95 While many ECTs can provide grid benefits without a DERMS, DERMS enables key benefits from some ECTs such as Smart Inverters. Refer to Appendix B. 96 Ex. SCE-02, Vol. 4, Part 1, p. 75. However, page A-5 of the same exhibit does not refer to DERMS in the three phase GMS roadmap. SCE also states on page 80 of the same exhibit that “the [GMS] program also developed and implemented interim control algorithms and DER constraint management functionality for use until the DERMS is deployed.”

29
include all DERMS capital costs required for deployment and use. SCE’s responses to 1 discovery clarified the following regarding DERMS functionality and deployment: 2
• Phase 3 of GMS includes both Base and Advanced DERMS deployment,97 3
• DERMS, rather than ADMS, provides for interaction with DERs and 4
microgrids,98 5
• SCE’s current plan will deploy Base DERMS by March 2024, but Advanced 6
DERMS functionality is not currently scheduled,99 7
• SCE projects that the ability to monitor Smart Inverters per Phase 3 Function 8
1 requirements will be operational “by 2022,”100 9
• SCE projects that the ability to control Smart Inverters per Phase 3 Functions 10
2 through 8 requirements will be operational “by 2022,”101 11
• SCE states that “SCE’s grid modernization communication systems provide 12 for the ability to monitor and control all types of DERs regardless of 13 ownership,” but the timing of this ability was neither requested or 14
provided.102 15
97 SCE’s response to data request PubAdv-SCE-113-TCR, Q.11. The fact the DERMS is being deployed rather than just planned is based on page 47 of SCE’s June 10, 2019 Grid Modernization Plan Presentation, which states “Deploy based on the delivery roadmap below” (emphasis added), followed by a diagram showing both ADMS and DERMS. 98 SCE’s response to data request PubAdv-SCE-113-TCR, Q.12. The table provided shows the ability to manage microgrids as part of Base DERMS, and interaction with DERs as part of both Base and Advanced DERMS. 99 SCE’s response to data request PubAdv-SCE-113-TCR, Q.7. 100 SCE’s response to data request PubAdv-SCE-113-TCR, Q.26. This response does not discuss whether a communication network such as NetComm or FAN will be in place by 2022. 101 SCE’s response to data request PubAdv-SCE-113-TCR, Q.27. This response refers to SCE’s response to PubAdv-SCE-113-TCR-Q.26. 102 SCE’s response to data request PubAdv-SCE-113-TCR, Q.28. SCE’s response to data request PubAdv-SCE-113-TCR, Q.29 states that “SCE has designed the new grid modernization communication systems to accommodate an initial level of 250,000 (two hundred fifty thousand) DERs with the ability to scale beyond that level as needed,” which the Public Advocates Office interprets as meaning the current capital requests will allow communication with 250,000 DERs, but additional investment will be required for additional DERs.

30
SCE’s discovery responses provide conflicting information on the critical question of 1 when SCE will be able monitor and control DER’s via IEEE 2030.5 requirements. Per the 2 fourth and fifth bullets above, SCE clearly states this ability is expected by 2022. However, 3 per bullets one through three, full DERMS deployment will not be completed as part of the 4 three GMS phases currently planned and included in SCE’s cost estimate through 2024. The 5 timing of this capability must, at a minimum, be clarified in the current GRC so that the 6 Commission can evaluate the scope of GMS functionality included in the current request. 7 This clarification should include which DERMS costs are included in the current 2021-2023 8 request, which are included in the GMS cost estimate through 2024, and whether there are 9 DERMS or any other infrastructure costs beyond 2024 that are required to enable SCE grid 10 operators to monitor and control DERs via IEEE 2030.5. 11
5. Public Advocates Office Recommendations for GMS 12 In the TY 2018 GRC, the Commission authorized in full SCE’s forecast of $134.5 13
million for full GMS deployment including a 25% contingency. In the current proceeding, 14 SCE’s testimony does not mention the dramatic $112.6 million or 84% increase in its current 15 GMS forecast. As discussed above, the Public Advocates Office concludes that: 16
• This increase is not adequately supported or justified, 17
• It might not include all required testing and DERMS costs, and 18
• Despite the increase, the critical capability of controlling and monitoring 19 DERs via DERMS may be delayed or only partially included. 20
The Public Advocates Office is concerned that even this significant cost increase will 21 not capture the total cost of GMS deployment, and that SCE’s TY 2024 GRC will request 22 significantly more than the $26.2 million currently estimated by SCE for 2024, the final year 23 of GMS deployment. Alternatively, SCE could attempt to scale back GMS functionality and 24 benefits from DERMS deployment. 25
Given these facts, the Public Advocates Office envisions two potential outcomes. 26 First, the Commission could find that it has already considered and resolved this request, and 27 support ratepayer funding of GMS that does not exceed SCE’s TY 2018 GRC request of 28 $134.5 million and hold SCE accountable for providing all functionality described in its 29 testimony. The Public Advocates Office supports this outcome. The other alternative is to 30 treat SCE’s GMS request as a new request given the increased forecast and the fact that GMS 31

31
is now a “platform” of software rather than one integrated software tool. If this alternative is 1 pursued, the Public Advocates Office recommends that the first steps should be to ensure that 2 smart inverter functionality, DER telemetry, and smart meter voltage measurement 3 capabilities are fully leveraged in the current GRC period. Any re-evaluation of SCE’s GMS 4 request should consider the evaluation of ECTs provided in Appendix B. 5
Regardless of the level of funding approved by the Commission for GMS, SCE 6 should be ordered to provide confidential documents that define the functionality of GMS, 7 and clarify how the ability to control and monitor DERs will be realized and implemented 8 once the Commission requires it. 9
D. Engineering & Planning Software Tools 10 SCE requests funding for five Engineering and Planning (E&P) software tools to 11
support its Grid Modernization Plan, specifically to “support SCE in calculating the amount 12 of DERs that the distribution system can host without triggering distribution infrastructure 13
upgrades, and in forecasting SCE’s short-term and long-term grid needs:”103 14
• Grid Interconnection Processing Tool (GIPT), 15
• Grid Analytics Application (GAA), 16
• Grid Connectivity Model (GCM), 17
• Distribution Resources Plan External Portal (DRPEP), and 18
• System Modeling Tool (SMT) and the Long-Term Planning Tool (LTPT). 19 SCE’s presentation on Grid Modernization from June 2019 provides a detailed 20
diagram showing how these tools are related.104 21
Each of these tools was initially requested in SCE’s TY 2018 GRC, although SCE 22
provided separate requests for SMT and LTPT in the original request.105 GIPT, GAA, 23
GCM, and LTPT were requested as part of SCE’s Capitalized Software testimony,106 and 24
103 SCE TY 2021 GRC Testimony, Ex. SCE-2, Vol. 4, Part 1, p. 28. 104 “Southern California Edison’s Grid Modernization Plan,” June 10, 2019 presentation, p. 31. 105 SCE TY 2021 GRC Testimony, Ex. SCE-2, Vol. 4, Part 1, p. 28. 106 SCE TY 2018 GRC, A.16-09-001, Ex. SCE-4, Vol. 2, SCE Testimony on Capitalized Software dated September 1, 2016., Ex. SCE-4, Vol. 2, pp. 144-166.

32
the Commission authorized recorded 2016 expenditures and 50% of SCE’s forecast for 2017 1
and 2018, less SCE’s forecast contingency.107 SMT and DRPEP were requested within 2
SCE’s Grid Modernization testimony,108 and the Commission authorized SCE’s request in 3
full for 2017 and 2018.109 4
Table 5-4 below shows that the Public Advocates Office supports continued funding 5 for each of these E&P Software Tools, but at reduced levels compared to SCE’s current 6 request. 7
Table 5-4 8 Capital Expenditures for 2019-2021 9
E&P Software Tools 10 (In Thousands of Nominal Dollars) 11
Description Public Advocates Office Recommended
SCE Proposed110
2019 2020 2021 2019 2020 2021 GIPT $354 $0 $0 $11,489 $5,424 $6,124 GAA $0 $0 $0 $6,599 $5,684 $5,827 GCM $0 $0 $0 $8,417 $6,631 $8,174 DRPEP $1,289 $0 $0 $2,057 $1,315 $1,438 SMT-LTPT $0 $0 $0 $7,790 $6,091 $5,650
Total $1,634 $0 $0 $36,352 $25,145 $27,213 12 As discussed in the following sections for each individual E&P Software Tool, the 13 Public Advocates Office forecast is derived from a combination of SCE’s TY 2018 GRC 14 request and previous Commission Authorization levels. 15
107 D.19-05-020, pp. 114-115. Pages 149-152 of the decision explains why requested contingencies were disallowed by the Commission, and page B4 of the decision shows this adjustment for the four E&P tools discussed here. 108 SCE TY 2018 GRC, A.16-09-001, Ex. SCE-2, Vol. 10, SCE Testimony on T&D, Volume 10 – Grid Modernization dated September 1, 2016, pp. 85-97. 109 D.19-05-020, pp. 156-157. 110 SCE Workpapers, Ex. SCE-2, Vol. 4, Part 1, Chapter II, Book A, pp. 122, 126, 130, 132, 138, 142.

33
1. SCE’s E&P Software Tools Forecast is Nearly Three 1 Times Higher Than Its TY 2018 Request 2
Table 5-5 below compares SCE’s current request with its TY 2018 GRC request, the 3 recorded expenditures through 2018, and the approximate funding level approved by the 4 Commission: 5
Table 5-5 6 E&P Software Tools 7
Comparison Between TY 2018 and TY2021 GRCs 8 9
10 This table shows that the nearly $143 million increase in SCE’s forecast is significant 11
in both percentage and absolute terms. In addition, while SCE’s TY 2018 forecast appeared 12 to include all forecast deployment costs within the GRC period for five of the six tools, SCE 13 now forecasts additional capital expenditures through 2028 for all tools, and possibly 14
beyond.111 15
SCE claims the increase is due to its decision to “acquire products from multiple 16
vendors and to manage a substantial integration effort, which resulted in higher costs.”112 17
SCE provides no evidence in its workpapers to support this assertion.113 More importantly, 18
111 SCE’s TY 2018 forecast for GCM, GIPT, DRPEP, SMT, and LTPT indicated a forecast of zero in 2020 or before, which the Public Advocates Office reasonably interprets as zero funding required beyond 2020. See SCE TY 2018 GRC, A.16-09-001, Ex. SCE-4, Vol. 2, SCE Testimony on Capitalized Software dated September 1, 2016., Ex. SCE-4, Vol. 2, pp. 144-166. Also, SCE TY 2018 GRC, A.16-09-001, Ex. SCE-2, Vol. 10, SCE Testimony on T&D, Volume 10 – Grid Modernization dated September 1, 2016, pp. 86 and 93. For the current request, SCE shows forecast expenditures in 2024-2028 in SCE TY 2021 GRC Testimony, Ex. SCE-2, Vol. 4, Part 1, p. A-32, Table 11. 112 SCE TY 2021 GRC Testimony, Ex. SCE-2, Vol. 4, Part 1, p. 32. 113 SCE TY 2021 GRC Workpapers, Ex. SCE-2, Vol. 4, Part 1, Chapter II, Book A, pp. 121-144. Workpapers
(continued on next page)
E&P Software Tool
SCE TY 2018
Forecast
Program Completed
per 2018 Forecast?
D.19-05-020 Authorized, approximate
SCE TY 2021
Forecast
Program Completed
per 2021 Forecast?
Recorded Expenditures through 2018
Increase: TY 2020 / TY 2018
Increase: TY 2020 /
AuthorizedGCM $14,940 Yes $6,985 $48,654 No $11,396 3.3 7.0 GAA $17,590 No $10,535 $56,986 No $17,812 3.2 5.4 GIPT $13,680 Yes $6,577 $35,260 No $6,223 2.6 5.4 DRPEP $5,809 Yes $5,809 $17,021 No $4,520 2.9 2.9 LTPT-SMT $28,222 Yes $20,779 $65,161 No $31,810 2.3 3.1
Total $80,241 $50,685 $223,081 $71,760 2.8 4.4

34
SCE’s assertion implies that the increased forecast is based on a changed situation, i.e., that 1 in TY 2018 they assumed that E&P Software Tools could be procured as an integrated 2 package, but now tools must be purchased separately and then integrated at an additional 3 cost. This is not correct. In the TY 2018 GRC, each tool was described separately with no 4 discussion of the forecasts being dependent on procuring all tools from one vendor. This is a 5 direct contrast to SCE’s TY 2018 GMS request, which clearly emphasized the need for an 6
integrated collection of tools to replace DMS and OMS.114 In addition, two of the tools 7
were requested in the Grid Modernization volume and two were requested in the Capitalized 8 Software testimony, as noted above. 9
2. Recommendations 10 Table 5-5 above shows that SCE has recorded $71.760 million through 2018 on E&P 11
software tools, which is 89% of its TY 2018 request, and 42% higher than the level 12 authorized by the Commission. For this reason, the Public Advocates Office generally 13 recommends that SCE shareholders, rather than ratepayers, fund any remaining work 14 required to provide the functionality SCE described in its TY 2018 GRC. Exceptions are 15 noted in the following discussion of each tool. In addition, the Commission should consider 16 an upward adjustment from the levels authorized in D.19-05-020 if SCE can provide 17 evidence that a) additional functionality is required per Commission direction since the TY 18 2018 GRC; and b) SCE can accurately forecast the incremental cost of this added 19 functionality. Even if SCE is able to meet these constraints, any additional ratepayer funding 20 should account for the fact that SCE has already exceeded its authorized funding by over $21 21
million and has expended additional funding in 2019.115 22
are provided for each E&P tool, but not an overarching workpaper for the purported new scope of integrating the tools. 114 SCE TY 2018 GRC, A.16-09-001, Ex. SCE-2, Vol. 10, SCE Testimony on T&D, Volume 10 – Grid Modernization dated September 1, 2016, pp. 109-110. 115 Attachment to SCE’s response to Public Advocates Office data request PubAdv-SCE-056-TXB, Q.2, supplemental. SCE recorded $36.998 million for E&P Tools, compared to its forecast of $36.352 million.

35
3. Grid Connectivity Model (GCM) 1
The GCM “is a software model of SCE’s entire electrical grid.”116 SCE’s recorded 2
and forecast costs for GCM for 2015-2023 are provided for six standardized cost types in its 3
workpapers.117 Figure 5-3 below compares SCE’s current request for GCM with its TY 4
2018 GRC request and the approximate funding level approved by the Commission:118 5
Figure 5-3 6 Capital Expenditures for GCM 7
8
9 10
Figure 5-3 reveals the following: 11
• SCE’s TY 2018 forecast shows expenditures dropping to zero in 2020, which 12
indicates that total GCM deployment cost was forecast to be $14.940 million.119 13
116 Ex. SCE-2, Vol. 4, Part 1, p. 39. 117 SCE Workpapers, Ex. SCE-2, Vol. 4, Part 1, Chapter II, Book A, p. 124. 118 Refer to workpapers supporting Ex. PAO-05C, Figure 5-3. Commission approved funding is approximate since the decision did not address the years 2019 and beyond. For these attrition years, the Commission’s approved methodology for 2018 was applied. 119 $14.940 million is the sum of the values shown in Figure 5-3 for the SCE TY 2018 forecast.

36
• The Commission authorized approximately $6.985 million for GCM, which is 1
approximately 50% of SCE’s request.120 2
• SCE’s TY 2021 forecast shows recorded and forecast expenditures totaling 3 approximately $48.654 million, which includes forecast expenditures beyond 4
2023.121 5
SCE’s testimony offers no explanation for why its current forecast for GCM is at least 6 three times its TY 2018 request, and nearly seven times the funding authorized by the 7
Commission.122 In addition, SCE states that it has “successfully implemented the initial 8
release of GCM, which directly supported SCE’s ability to perform the ICA.”123 SCE has 9
already recorded $11.396 million for GCM through 2018, which significantly exceeds the 10 total project funding of approximately $6.985 million authorized by the Commission in the 11
TY 2018 case.124 The Public Advocates Office therefore recommends that no additional 12
ratepayer funding be authorized for GCM. 13 Note that SCE has a separate request for a “Transformer Connectivity Model” in its 14
capitalized software testimony.125 15
4. Grid Analytics Application (GAA) 16 The GAA is a software tool that “provides SCE engineers, system planners, and 17
system operators with improved analytical, visualization, and decision-support capabilities 18
required to plan and operate a modern grid.”126 SCE’s recorded and forecast costs for GAA 19
120 $6.985 million is the sum of the values shown in Figure 5-3 for D.19-05-020. Refer to workpapers supporting Ex. PAO-05C, Figure 5-3 for the exact calculation of all values in this figure. 121 $48.654 million is the sum of the 2015-2018 recorded; 2019-2023 forecast; and the “2024+ values shown in Figure 5-3 for SCE TY 2021. Refer to workpapers supporting Ex. PAO-05C, Figure 5-3 for the exact calculation of all values in this figure. 122 The basis for SCE’s GCM request is provided in Ex. SCE-2, Vol. 4, Part 1, p. 43. 123 Ex. SCE-2, Vol. 4, Part 1, p. 41. 124 $11.396 million is the sum of the values shown in Figure 5-3 for SCE TY 2021 Recorded. 125 Ex. SCE-6, Vol 1, Part 2, p. 134. 126 Ex. SCE-2, Vol. 4, Part 1, p. 44.

37
for 2015-2023 are provided for six standardized cost types in its workpapers.127 Figure 5-4 1
below compares SCE’s current request for GAA with its TY 2018 GRC request and the 2
approximate funding level approved by the Commission:128 3
Figure 5-4 4 Capital Expenditures for GAA 5
6 7
8 Figure 5-4 reveals the following: 9
• SCE’s TY 2018 forecast shows expenditures dropping to nearly zero in 2018-2020, 10 which indicates that the total GAA deployment cost was forecast to be slightly more 11
than $17.590 million.129 12
127 SCE Workpapers, Ex. SCE-2, Vol. 4, Part 1, Chapter II, Book A, p. 128. 128 Refer to workpapers supporting Ex. PAO-05C, Figure 5-4. Commission approved funding is approximate since the decision did not address the years 2019 and beyond. For these attrition years, the Commission’s approved methodology for 2018 was applied. 129 $17.590 million is the sum of the values shown in Figure 5-3 for the SCE TY 2018 forecast.

38
• The Commission authorized approximately $10.535 million for GAA, which is more 1
than 50% of SCE’s request.130 2
• SCE’s TY 2021 forecast shows recorded and forecast expenditures totaling 3 approximately $56.986 million, which includes forecast expenditures beyond 4
2023.131 5
SCE’s testimony offers no explanation for why its current forecast for GAA is 6 approximately three times its TY 2018 request, and over five times the funding authorized by 7
the Commission.132 In addition, SCE states that “in 2018, the initial release of GAA 8
successfully implemented the annual, hour-based profile processing platform necessary for 9
long-term forecasting in LTPT.”133 SCE has already recorded $17.812 million for GAA 10
through 2018, which exceeds both the total project funding of approximately $10.535 million 11
authorized by the Commission in the TY 2018 case and SCE’s $17.590 million forecast.134 12
The Public Advocates Office therefore recommends that no additional ratepayer funding be 13 authorized for GAA. 14
5. Grid Interconnection Processing Tool (GIPT) 15 “The GIPT is a business process management tool that will allow customers and SCE 16
to more quickly and efficiently connect electrical generation and load to the grid.”135 SCE’s 17
recorded and forecast costs for GIPT for 2015-2023 are provided for six standardized cost 18
130 $10.535 million is the sum of the values shown in Figure 5-3 for D.19-05-020. Refer to workpapers supporting Ex. PAO-05C, Figure 5-4 for the exact calculation of all values in this figure. 131 $56.986 million is the sum of the 2015-2018 recorded; 2019-2023 forecast; and the “2024+ values shown in Figure 5-3 for SCE TY 2021. Refer to workpapers supporting Ex. PAO-05C, Figure 5-4 for the exact calculation of all values in this figure. 132 The basis for SCE’s GAA request is provided in Ex. SCE-2, Vol. 4, Part 1, pp. 46-47. Refer to Table 5-5 above for comparative costs. 133 Ex. SCE-2, Vol. 4, Part 1, p. 45. Other functionality of the GAA implemented in 2018 are described in the same page. 134 Refer to workpapers supporting Ex. PAO-05C, Figure 5-4. 135 Ex. SCE-2, Vol. 4, Part 1, p. 44.

39
types in its workpapers.136 Figure 5-5 below compares SCE’s current request for GIPT with 1
its TY 2018 GRC request and the approximate funding level approved by the 2
Commission:137 3
Figure 5-5 4 Capital Expenditures for GIPT 5
6 Figure 5-5 reveals the following: 7
• SCE’s TY 2018 forecast shows expenditures dropping to zero in 2019-2020, which 8
indicates that the total GIPT deployment cost was forecast to be $13.680 million.138 9
• The Commission authorized $6.577 million for GIPT, which is less than 50% of 10
SCE’s request.139 11
136 SCE Workpapers, Ex. SCE-2, Vol. 4, Part 1, Chapter II, Book A, p. 140. 137 Refer to workpapers supporting Ex. PAO-05C, Figure 5-5. Commission approved funding is approximate since the decision did not address the years 2019 and beyond. For these attrition years, the Commission’s approved methodology for 2018 was applied. 138 $13.680 million is the sum of the values shown in Figure 5-5 for the SCE TY 2018 forecast. 139 $6.577 million is the sum of the values shown in Figure 5-5 for D.19-05-020. Refer to workpapers supporting Ex. PAO-05C, Figure 5-5 for the exact calculation of all values in this figure.

40
• SCE’s TY 2021 forecast shows recorded and forecast expenditures totaling 1 approximately $35.260 million, which includes forecast expenditures beyond 2
2023.140 3
• SCE’s forecast for $5.0 to $7.0 million in 2024-2028 appears to be inconsistent with 4
SCE’s forecast of zero for 2022 and 2023.141 5
SCE’s testimony states that “the project scope is unchanged” and unlike some of the 6 other E&P tools, however SCE states that it has not yet completed initial implementation of 7
GIPT.142 SCE also acknowledges that its current forecast for GIPT is “higher than the 2018 8
GRC request,” but fails to mention that its current request is more than 2.5 times its TY 2018 9
request, and over five times the funding authorized by the Commission.143 Finally, SCE 10
describes the cause of the increase as “The COTS [commercial off-the-shelf] product SCE 11 had initially considered was insufficient for addressing the GIPT business requirements,” but 12 this does not justify the magnitude of the increase in SCE’s current GIPT request. SCE has 13 already recorded $6.223 million for GIPT through 2018, which is $0.354 million lower than 14
the $6.577 million authorized by the Commission in the TY 2018.144 The Public Advocates 15
Office therefore recommends that $0.354 million of additional funding be authorized for 16 GIPT in 2019 to provide funding per D.19-05-020, but no additional ratepayer funding for 17 2020 and 2021. 18
6. Distribution Resources Plan External Portal (DRPEP) 19 DRPEP is an interactive website that provides public access to data on SCE’s 20
distribution system and its distribution planning process, consistent with DRP proceeding 21
140 $35.260 million is the sum of the 2015-2018 recorded; 2019-2023 forecast; and the “2024+ values shown in Figure 5-5 for SCE TY 2021. Refer to workpapers supporting Ex. PAO-05C, Figure 5-5 for the exact calculation of all values in this figure. 141 The zero forecasts for 2022 and 2023 imply that GIPT is completed and operational in 2021, and that deployment is complete. 142 Ex. SCE-2, Vol. 4, Part 1, p. 52. 143 The basis for SCE’s GIPT request is provided in Ex. SCE-2, Vol. 4, Part 1, p. 46. 144 Refer to workpapers supporting Ex. PAO-05C, Figure 5-5

41
requirements.145 SCE’s recorded and forecast costs for DRPEP for 2015-2023 are provided 1
for six standardized cost types in its workpapers.146 Figure 5-6 below compares SCE’s 2
current request for DRPEP with its TY 2018 GRC request and the approximate funding level 3
approved by the Commission:147 4
Figure 5-6 5 Capital Expenditures for DRPEP 6
7 Figure 5-6 reveals the following: 8
• SCE’s TY 2018 forecast shows expenditures dropping to zero in 2019-2020, which 9
indicates that the total DRPEP deployment cost was forecast to be $5.809 million.148 10
145 Ex. SCE-2, Vol. 4, Part 1, p. 55. Refer to Section III.A.7. regarding DRP requirements. 146 SCE Workpapers, Ex. SCE-2, Vol. 4, Part 1, Chapter II, Book A, p. 144. 147 Refer to workpapers supporting Ex. PAO-05C, Figure 5-6. Commission approved funding is approximate since the decision did not address the years 2019 and beyond. For these attrition years, the Commission’s approved methodology for 2018 was applied. 148 $5.809 million is the sum of the values shown in Figure 5-6 for the SCE TY 2018 forecast.

42
• The Commission authorized $5.809 million, or 100% of SCE’s TY2018 DRPEP 1
request.149 2
• SCE’s TY 2021 forecast shows recorded and forecast expenditures totaling 3 approximately $17.021 million, which includes forecast expenditures beyond 4
2023.150 5
SCE describes that it has implemented foundational DRPEP capabilities including the 6 publication of ICA and LNBA data, and GNA and DDOR reports, and that the current 7 request is to automate the “15/15 Rule” and accommodate potential new DRP 8
requirements.151 SCE does not compare its current DRPEP request to its amounts requested 9
and authorized in TY 2018, which is nearly three times greater than both, but does state that 10
its forecast is based on costs incurred to date.152 SCE has already recorded $4.520 million 11
for DRPEP through 2018, which is $1.289 million lower than the $5.809 million authorized 12 by the Commission in the TY 2018, and the DRPEP currently supports all DRP 13
requirements.153 The Public Advocates Office therefore recommends that $1.289 million of 14
additional funding be authorized for DRPEP in 2019 to provide funding per D.19-05-020, but 15 no additional ratepayer funding for 2020 and 2021. 16
7. Long-Term Planning Tool and System Modeling 17 (LTPT-SMT) 18
Per SCE, the LTPT-SMT software tool provides forecasting, power system analysis 19 and work management capabilities that are central to the overall management of the 20
distribution grid and DERs.154 SCE’s recorded and forecast costs for 2015-2023 are 21
149 $5.809 million is the sum of the values shown in Figure 5-6 for D.19-05-020. Refer to workpapers supporting Ex. PAO-05C, Figure 5-6 for the exact calculation of all values in this figure. 150 $17.021 million is the sum of the 2015-2018 recorded; 2019-2023 forecast; and the “2024+ values shown in Figure 5-3 for SCE TY 2021. Refer to workpapers supporting Ex. PAO-05C, Figure 5-6 for the exact calculation of all values in this figure. 151 Ex. SCE-2, Vol. 4, Part 1, p. 55. 152 Ex. SCE-2, Vol. 4, Part 1, p. 57. 153 Refer to workpapers supporting Ex. PAO-05C, Figure 5-6.
Ex. SCE-2, Vol. 4, Part 1, pp. 31 and 47. SMT and LTPT were requested separately in TY 2018 as previously discussed.

43
provided separately for LTPT and SMT for six standardized cost types in its workpapers.155 1
Figure 5-7 below compares SCE’s current request for LTPT-SMT with its TY 2018 GRC 2
request and the approximate funding level approved by the Commission:156 3
Figure 5-7 4 Capital Expenditures for LTPT-SMT 5
6 Figure 5-7 reveals the following: 7
• SCE’s TY 2018 forecast shows expenditures dropping to zero in 2020, which 8 indicates that the total LTPT-SMT deployment cost was forecast to be $28.222 9
million.157 10
• The Commission authorized $20.779 million, or 78% of SCE’s TY2018 LTPT-SMT 11
request.158 12
155 SCE Workpapers, Ex. SCE-2, Vol. 4, Part 1, Chapter II, Book A, pp. 134 and 136. 156 Refer to workpapers supporting Ex. PAO-05C, Figure 5-7. Commission approved funding is approximate since the decision did not address the years 2019 and beyond. For these attrition years, the Commission’s approved methodology for 2018 was applied. 157 $28.222 million is the sum of the values shown in Figure 5-7 for the SCE TY 2018 forecast. 158 $20.779 million is the sum of the values shown in Figure 5-7 for D.19-05-020. Refer to workpapers supporting Ex. PAO-05C, Figure 5-7 for the exact calculation of all values in this figure.

44
• SCE’s TY 2021 forecast shows recorded and forecast expenditures totaling 1 approximately $65.161 million, which includes forecast expenditures beyond 2
2023.159 3
SCE acknowledges that its current LTPT-SMT is “higher relative to the 2018 GRC 4
forecast” and attributes this to integration complexity that was previously unknown.160 This 5
claim was debunked in Section IV.D.1. above, and regardless, it is insufficient to justify a 6 new forecast which is more than 2.3 times greater SCE’s TY 2018 forecast, and more than 7
three times the funding authorized by the Commission.161 SCE has already recorded 8
$31.810 million for LTPT-SMT through 2018, which is more than 1.5 times the $20.779 9
million authorized by the Commission in the TY 2018.162 The Public Advocates Office 10
therefore recommends that no additional ratepayer funding be authorized for LTPT-SMT. 11
V. DISCUSSION / ANALYSIS OF LOAD GROWTH 12
Section II of Ex. SCE-2, Vol. 4, Part 2 includes provides SCE’s Load Growth 13 Business Plan Element which “covers work needed to support customer load and Distributed 14
Energy Resource (DER) growth throughout SCE’s electrical Grid.” 163 This work is driven 15
by forecasts of grid deficiencies due to increasing load from new customers, increased load 16 from existing customers, and DER growth. SCE’s Load Growth request encompasses 15 17
programs which are discussed by SCE in five groups:164 18
• Distribution Substation Plan, 19
159 $65.161 million is the sum of the 2015-2018 recorded; 2019-2023 forecast; and the “2024+ values shown in Figure 5-3 for SCE TY 2021. Refer to workpapers supporting Ex. PAO-05C, Figure 5-7 for the exact calculation of all values in this figure 160 Ex. SCE-2, Vol. 4, Part 1, p. 50. 161 Refer to workpapers supporting Ex. PAO-05C, Figure 5-7. 162 $31.810 million is the sum of the values shown in Figure 5-7 for SCE TY 2021 Recorded. 163 Ex. SCE-2, Vol. 4, Part 2, p. 4. Note that SCE’s requests for work for its transmission grid is included in Section III of the same exhibit, 164 Ex. SCE-2, Vol. 4, Part 2, p. 26, Table II-1 shows the five groups. The 15 programs, plus two transmission programs, are listed in SCE Workpapers, Ex. SCE-2, Vol. 4, Part 2, Chapter II, Book A, pp. 2-3.

45
• DER-Driven Grid Reinforcement, 1
• Transmission Substation Plan, 2
• System Improvement Programs, and 3
• Land Rights Management. 4 DER-Driven Grid Reinforcement programs are a component of SCE’s Grid 5
Modernization plan,165 and are the focus of this section of Public Advocates Office 6
testimony. Table 5-6 below compares SCE proposals for the five programs reviewed by the 7 Public Advocates Office: 8
Table 5-6 9 DER-driven Load Growth Capital Expenditures for 2019-2021 10
(In Millions of Nominal Dollars) 11
Description Public Advocates Office Recommended
SCE Proposed166
2019 2020 2021 2019 2020 2021 DER-Driven 4 kV Cutovers
$0.0 $0.0 $0.0 $0.0 $0.0 $9.058
DER-Driven Circuit Breaker Upgrades
$0.0 $0.0 $0.0 $0.0 $0.455 $1.608
DER-Driven Distribution Circuit Upgrades
$0.0 $0.0 $0.0 $0.0 $0.0 $13.876
DER-Driven Substation Transformer Upgrades
$0.0 $0.0 $0.0 $0.0 $0.057 $0.843
New DER-Driven DSP Circuits
$0.0 $0.0 $0.0 $0.0 $0.0 $17.137
Total $0.0 $0.0 $0.0 $0.0 $0.512 $42.523 12 As noted in Section I of this testimony, an absence of specific testimony on any 13
component of SCE’s request should not be construed as Public Advocates Office support for 14 that component of SCE’s request. The Public Advocates Office recommends memorandum 15 account treatment for all DER-driven Load Growth programs, which results in zero ratepayer 16
165 See Ex. SCE-2, Vol. 4, Part 1, pp. A-32, A-47, and A-51 to A-52. The GMP uses the term “DER Hosting Capacity Reinforcement” for these DER-driven programs. 166 SCE Workpapers, Ex. SCE-2, Vol. 4, Part 2, Chapter II, Book A, pp. 2-3.

46
funding during the current GRC period, but does provide the potential for cost recovery at a 1 later time. 2
A. Background on Load Growth Projects and Programs 3
1. Distribution and Subtransmission Planning Process and 4 DRP 5
Planning Processes 6 SCE’s Load Growth requests are an outcome of SCE’s transmission, subtransmission, 7
and distribution planning processes.167 With regard to the programs reviewed in this 8
testimony, SCE’s testimony and workpapers include descriptions of the following 9
components of its Distribution and Subtransmission Planning Processes:168 10
• Engineering and Planning (E&P) software tools,169 11
• DER-driven Reinforcement Study,170 12
• Determination of “Grid Needs,”171 13
• Identification of projects for DER driven distribution needs,172 14
• Identification of projects that can be eliminated or deferred through DER 15
projects.173 16
167 Ex. SCE-2, Vol. 4, Part 2, p. 4. SCE’s grid is unique in California based on its use of a subtransmission system. Refer to pages 64 and 94 of Ex. SCE-2, Vol. 4, Part 2. 168 This testimony does not review SCE’s subtransmission requests, or distribution requests driven by SCE’s “Peak Load Analysis.” Refer Ex. SCE-2, Vol. 4, Part 2, pp. 12-13 for SCE’s description of Peak Load analysis compared to the High DER Output Analysis. 169 Ex. SCE-2, Vol. 4, Part 1, pp. 28-58. 170 SCE Workpapers, Ex. SCE-2, Vol. 4, Part 2, Chapter II, Book A, pp. 14-29. This reference is to a workpaper titled “High Distributed Energy Resources Planning Assumptions,” but the term “DER-driven Grid Reinforcement Study” is used within that workpaper. The Public Advocates Office uses the latter term in this testimony because it more accurately describes a distinct analysis process, not just different assumptions. This is supported by SCE’s response to Public Advocates Office data request PubAdv-SCE-130, Q. 1. Note that “high” in the workpaper title does not indicate that a “high” DER scenario was used. See SCE’s response to Public Advocates Office data request PubAdv-SCE-139, Q.4. 171 Ex. SCE-2, Vol. 4, Part 2, pp. 13-14. 172 Ex. SCE-2, Vol. 4, Part 2, p. 19. 173 Ex. SCE-2, Vol. 4, Part 2, p. 24.

47
These processes are discussed in more detail in Section V.B. below. 1 Distributed Resource Plan Requirements 2 As noted in Section IV.A.1. above, this GRC is the first to be subjected to 3
requirements developed in the DRP proceeding, and SCE discusses many of these 4
requirements and how SCE has complied with them.174 However, SCE’s discussion is 5
insufficient is some areas, as listed below with references to the section which discusses the 6 shortcomings in detail: 7
• Impact of Grid Modernization requests on Load Growth programs, 8
• Adjustments to load and DER forecasts, 9 First, SCE’s Distribution and Subtransmission Planning Process is currently evolving 10
in response to the DRP requirements and SCE’s grid modernization request for GMS and 11
E&P tools discussion in Section IV above.175 This is best illustrated by Figure 5-8 below, 12
which compare SCE “current” and “future” planning processes:176 13
Figure 5-8 14 SCE Proposed Changes Regarding Software Tools 15
Used for Distribution Planning 16 17
18
174 Ex. SCE-2, Vol. 4, Part 2, pp. 5, 7, 10, 14, 24, 25. 175 SCE’s GMS includes a DERMS, which can allow grid operators to control DERs with smart inverters. This is discussed in Section III.C.1. above, and in Section V.B.6. below regarding the impact on load growth programs. 176 Ex. SCE-2, Vol. 4, Part 1, p. 31, Figure II-8.

48
SCE’s testimony is unclear as to the timing of this transition as it related to the 1
current GRC, but key details were revealed through discovery and a meeting with SCE.177 2
In addition, SCE’s phased implementation plan for GMS/DERMS, discussed in Section 3 IV.C. above, will impact when SCE will have the ability to monitor and control DERs with 4 smart inverters. The implications of this regarding mitigation of forecast DER-driven grid 5 needs are discussed in Section V.B. 6
Second, D.18-02-004 established that GRC requests must be consistent with a 7
utilities’ GNA report and DDOR, and any exceptions must be described.178 This was also 8
clarified and illustrated in the decision: “We direct the IOUs to implement DER growth 9 scenarios and the ICA for purposes of the existing distribution planning and new DRP 10
processes as described above and visualized in Figure 2 below.”179 SCE responses to 11
discovery confirmed that its GRC request is built on, and fully consistent with its 2019 GNA 12
report and DDOR.180 However, SCE added an unauthorized analysis process to its forecast, 13
and failed to adjust its forecast based on significant developments since the statewide 2017 14 IEPR forecast developed, both of which are discussed in Section V.B.5. 15
2. SCE’s Test Year 2018 GRC Load Growth Request 16 SCE’s TY 2018 testimony was organized differently than the current case, with Load 17
Growth programs within a volume entitled “System Planning.”181 The primary difference 18
between these two SCE requests, relative to the topics addressed in this testimony, is that 19 DER-driven requests were included within existing programs. This is discussed in detail in 20 Section V.B. below. D.19-05-020 discussed intervenor opposition to SCE’s TY 2018 GRC 21 requests for System Planning programs but adopted SCE’s forecasts for all programs that 22
177 Public version of SCE’s presentation from March 23, 2020 meeting with the Public Advocates Office, pp. 12-15. Also, SCE’s response to Public Advocates Office data request PubAdv-SCE-128-TCR, Q.1, 2, and 3. 178 D.18-02-004, p. 84, Ordering Paragraph 2.h. The decision discussed that the scope of “DER growth scenarios” work should be expanded to include “load forecasting as it relates to distribution planning.” See D.18-02-004, pp. 17-18. 179 D.18-02-004, p. 31. Figure 2 is provided on Page 32 of the decision. Refer to Section V.B.5. below regarding use of the ICA. 180 SCE response to data request PubAdv-SCE-139-TCR, Q.1, 2, and 3. 181 SCE TY 2018 GRC Testimony, A.16-09-001, Ex. SCE-2, Vol. 3.

49
included DER-driven upgrades, or programs such as 4 kV cutover that were justified in part 1
based on DER concerns.182 2
B. DER-Driven Load Growth Programs 3
SCE requests funding for five programs to mitigate DER-driven grid needs.183 4
While these programs are new in terms of having new and unique WBS numbers, in the TY 5
2018 GRC they were generally embedded within traditional programs. 184 6
The Public Advocates Office recommends memorandum account treatment for each 7 of these programs, and as a result Table 5-6 above shows that none of these programs should 8 receive ratepayer funding during the current GRC. Support for this recommendation is 9 provided in the following sections which are organized broadly in the following order: 10
• Objective program summary information, 11
• Public Advocates Office arguments for use of a memorandum account, 12
• Discussion of each of the five programs, and 13
• Recommendations 14
1. Summary of SCE’s Request 15 Descriptions of each of the five DER-driven programs are provided in SCE’s 16
testimony.185 SCE states that its DER-driven program forecasts are based on its “DER-17
driven Reinforcement Study.”186 This methodology and its limitations are discussed in 18
182 D.19-05-020, pp. 45-63. 183 Ex. SCE-2, Vol. 4, Part 2, p. 52. 184 SCE response to Public Advocates Office data request PubAdv-SCE-138-TCR, Q.1 to Q.6. The DER-Driven Substation Transformer Upgrades Program, discussed in Section V.B.8., does not appear to have been included withing SCE’s TY 2018 GRC. The other four programs were described as follows: SCE TY 2018 GRC Testimony, A.16-09-001, Ex. SCE-2, Vol. 3. This includes Distribution Circuits Upgrades per page 62; New Distribution Circuits per page 65; 4 kV programs per page 84; and circuit breakers within the Substation Equipment Replacement Program per page 108. 185 Ex. SCE-2, Vol. 4, Part 2, pp. 52-63. 186 Ex. SCE-2, Vol. 4, Part 2, p. 19, which refers to pp. 12-13 .

50
Section V.B.5. below. SCE uses a forecast-units times forecast-unit-cost methodology for 1
each of the five programs.187 2
2. DER-Driven Projects are New and SCE Forecasts 3 Significant Annual Program Costs 4
5
Figure 5-9 below shows SCE’s request for DER-driven load growth programs:188 6
Figure 5-9 7 DER-Driven Load Growth Capital Expenditures for 2014-2023 8
(In Thousands of Nominal Dollars) 9
10 Figure 6 from SCE’s GMP supplements these values with 2024-2028 forecasts of 11
approximately $59 million per year.189 Despite inconsistencies compared to the GMP table 12
that shows all Grid Modernization forecasts,190 the figures show that SCE forecasts DER-13
187 SCE Workpapers, Ex. SCE-2, Vol. 4, Part 2, Chapter II, Book B, pp. 1-26. 188 SCE Workpapers, Ex. SCE-2, Vol. 4, Part 2, Chapter II, Book A, pp. 2-3. 189 Ex. SCE-2, Vol. 4, Part 1, p. A-52. 190 Ex. SCE-2, Vol. 4, Part 1, p. A-32, Table 11. This table shows a 2023 value of $14.231 million compared to $27.676 million in the workpapers. The table also shows 2024-2028 forecast ranging from $160 million to $295 million, but only the high range is shown in the Figure 6.
51
driven expenditures jump from near zero in 2020 to $42 million in 2021; decline and 1 fluctuate in 2022 and 2023, and then stabilize at nearly $60 million a year for the remainder 2 of the forecast. 3
SCE has recorded no expenditures for DER-driven programs as of April 2, 2020.191 4
3. SCE Provided Insufficient Information to Determine 5 the Reasonableness of SCE’s Request 6
SCE’s testimony provides narrative descriptions of each DER-driven program and the 7
methodology used to forecast the need for these programs.192 SCE’s workpapers for each 8
program include one page with overall program information, including 2019-2023 annual 9
forecast values, and a description of its methodology.193 However, neither the testimony nor 10
the workpapers provide quantitative support for the specific request in dollars per year per 11 program. As mentioned above, SCE uses a “forecast-units times forecast-unit-cost” 12 methodology for each program, but fails to provide the following information: 13
• No reports or analysis supporting the purported need in terms of units,194 14
• No annual units data, 15
• No unit cost information, and 16
• No tabulations or other calculations to support annual requests. 17 Broadly, these limitations fall into two categories: justification of need for specific 18
mitigation projects and justification for the requested funding. The former is discussed in 19 detail in Sections V.B.5. and Section V.B.6. below. Regarding the justification for the 20 requested annual funding per program, SCE provided more detailed program cost estimates 21 in response to discovery which asked “please provide all data, analysis and electronic 22
191 SCE response to Public Advocates Office data request PubAdv-SCE-138-TCR, Q.5 to Q.6. 192 Ex. SCE-2, Vol. 4, Part 2, pp. 52-63. 193 SCE Workpapers, Ex. SCE-2, Vol. 4, Part 2, Chapter II, Book B, pp. 1-26 provide information on each program. SCE Workpapers, Ex. SCE-2, Vol. 4, Part 2, Chapter II, Book A, pp. 14-29, provides SCE’s methodology, as is discussed in detail in Section V.B.5 below. 194 SCE’s describes its High DER Analysis methodology in its workpapers, but this is a narrative description of methodology and assumptions, not documentation of the analysis and results. SCE refers to GNA reports as support and while the GNA Report provides a table of results, derivation of those results cannot be performed using the data provided. See SCE responses to Public Advocates Office data requests PubAdv-SCE-121, Q.1b and PubAdv-SCE-126, Q.1.

52
spreadsheets with formulas and links intact supporting SCE’s forecast.”195 These cost 1
estimates are discussed in detail in Section V.B.8. below, but the following shortcomings 2 were common to all five cost estimates: 3
• Limited active formulae to show the calculations performed, 4
• No support for unit numbers per year, and 5
• Limited support for the unit cost values. 6 The burden of proof belongs on SCE. SCE not only failed to support its DER-driven 7
forecasts in its application materials, it also failed to do so in response to a clear and concise 8 discovery request. 9
4. SCE’s DER-Driven Programs Presumes the Outcome 10 on an Active Commission Proceeding 11
SCE’s forecast for DER-driven programs is driven by its “DER-driven Grid 12
Reinforcement Study.”196 This study uses the same software as SCE’s current ICA 13
implementation, and nearly the same four criteria to determine if DERs are causing violations 14
of SCE’s operating standards.197 The primary difference between the DER-driven 15
Reinforcement Study and SCE’s current ICA implementation is that the former includes 16 forecasts of DER and load growth while the later applies to the current grid configuration 17
with existing loads and DER.198 18
Development of the ICA tool statewide included consideration of at least two use 19
cases: interconnection and planning.199 The primary difference between the planning use 20
195 Attachment to SCE’s response to data request SEIA-VoteSolar-SCE-001, Q.41 to Q.45. 196 Ex. SCE-2, Vol. 4, Part 2, pp. 12-13. SCE Workpapers, Ex. SCE-2, Vol. 4, Part 2, Chapter II, Book A, pp. 14-29. 197 CYME was used for both, per the public version of SCE’s presentation from March 23, 2020 meeting with the Public Advocates Office, p. 54, and D.17-09-026, p. 33. Criteria for the DER-driven Grid Reinforcement Study are provided in SCE Workpapers, Ex. SCE-2, Vol. 4, Part 2, Chapter II, Book A, pp. 25-29. The same criteria for ICA are provided in D.17-09-026, p.59, Ordering Paragraph 5. Note that the ICA Safety Criteria is operational flexibility, as listed on the same page. See SCE’s response to data request PubAdv-SCE-139-TCR, Q.10 and Q.13. 198 There may be other differences, but this is primary conceptual difference. See SCE’s response to data request PubAdv-SCE-TCR-139, Q.10. 199 Decision D.17-09-026, p. 58, Ordering Paragraph 4.

53
case and the interconnection use case is that the former includes forecasts of DER and load 1 growth while the later applies to the current grid configuration with existing loads and 2
DER.200 Therefore, SCE’s DER-driven Reinforcement Study is conceptually an 3
implementation of the ICA for planning use case. 4 The Commission adopted requirements for the ICA for the interconnection use case 5
and required implementation for this use case by December 28, 2018.201 SCE has complied 6
with these requirements and currently has an accurate ICA that is updated monthly for 7
locations where ICA results have changed.202 In contrast, requirements for the ICA 8
planning use case have not been adopted by the Commission, in part because “the Joint IOUs 9 highlighted that regardless of the ICA methodology, the results [for the planning use case] 10 would have some significant level of uncertainty since they are based on forecasts of circuit 11
level DER and load growth.”203 The most recent scoping ruling identified that use cases 12
other than the interconnection use case, per the DFWG final report, “remain in scope.”204 13
Therefore, SCE’s use of its DER-driven Reinforcement Study in the current GRC incorrectly 14 presumes the outcome of an open Commission proceeding. 15
200 There are other differences, but this is primary conceptual difference. 201 Ordering paragraphs 5 and 6 of D.17-09-026 required implementation nine months after the decision was adopted. This data was delayed pending Commission disposition of IOU confidentiality issues. ALJ Ruling dated December 17, 2018, p. 15, provided the revised online data of December 28, 2018. 202 SCE response to Public Advocates Office data request PubAdv-SCE-128-TCR, Q.6 and Q.7. 203 “California Distribution Resources Plan (R. 14-08-013) Integration Capacity Analysis Working Group Final ICA WG Long Term Refinements Report” filed March 12, 2018, in R.14-08-013, p. 18, Section 4.1.4. 204 Joint Second Amended Scoping Memo and Ruling of Assigned Commissioner and Administrative Law Judge issued January 9, 2020 in R.14-08-013, p. 4. This scoping memo refers to the policy use case and not the planning use case. The Administrative Law Judge’s Ruling Requesting Comments on Refinements to the Integration Capacity Analysis filed July 3, 2019 in R.14-08-013 stated the following at page 4: “While the planning use case was adopted in D.17-09-026, the Commission should consider whether the necessity of the use case justifies the effort and complexity of its implementation, and whether they are needed for DER integration, before further consideration of methodological issues for planning or policy use cases.” Slide 6 of the ICA workshop held September 9, 2019, included in workpapers supporting this testimony, clarified “the Policy and Planning use case will be considered in future long-term refinements in the DRP Proceeding.”

54
5. SCE Does Not Acknowledge or Properly Account for 1 Significant Uncertainties in its Forecast 2
SCE justifies its DER-driven programs based on the forecast adverse impacts of load 3 and DER growth that SCE’s estimates to a very fine level of spatial resolution: to the 4
individual service transformers on distribution feeders. 205 The available evidence indicates 5
that except for issues with large wholesale generators, the purported DER-driven grid issues 6
do not currently exist, but are anticipated on a “forward-looking” basis.206 SCE does not 7
discuss the level of uncertainly embedded in its forward-looking methodology. This section 8 discusses these uncertainties, and why they help justify the Public Advocates Office’s 9 recommendation to use a memorandum account for these programs. 10
Summary of SCE’s DER-driven Grid Reinforcement Study 11 As previously mentioned, SCE’s DER-driven program forecast is based on its DER-12
driven Grid Reinforcement Study. This study begins with disaggregated load and DER 13 forecasts for each of its feeders, which were derived from the IEPR forecast consistent with 14
the requirements of D.18-02-003 and subsequent rulings in the DRP proceeding.207 SCE 15
then further uses an unapproved process to disaggregate the circuit level forecasts to 16 individual service transformers that convert higher primary voltage to the lower secondary 17
voltages used by a small number of customers. 208 Power flow and protection studies are 18
then run for specific hours of each forecast year to determine if any of the following criteria 19
have been violated:209 20
205 See SCE Workpapers, Ex. SCE-2, Vol. 4, Part 2, Chapter II, Book A, p. 22-25. Note that the bottom figure on page 24 of this workpaper provides an example with close to 300 service transformers on a feeder. Also, SCE’s response to Public Advocates Office data request PubAdv-SCE-130-TCR, Q.7, states that “in the first years of both forecasts, we are able to use actual known growth and generation projects to appropriately disaggregate the load.” This response does not specify which years this statement applies to, which is important since the IEPR forecast cited is the 2017 IEPR, as discussed later in this section. 206 SCE response to Public Advocates Office data request PubAdv-SCE-130-TCR, Q.8. It is important to differentiate impacts and mitigations from megawatt scale wholesale PV generators from those of other types and scales of DERs, as is discussed in Appendix B 207 SCE response to data request PubAdv-SCE-139-TCR, Q.2. 208 Refer to Section V.B.5. 209 SCE Workpapers, Ex. SCE-2, Vol. 4, Part 2, Chapter II, Book A, pp. 25-29. Also, see SCE’s response to data request PubAdv-SCE-139-TCR, Q.12.

55
• Voltage, 1
• Thermal/Capacity, 2
• Protection, and 3
• Operational Flexibility. 4 If SCE’s requirements for any criteria are violated, specific types of mitigation 5
projects are proposed.210 The Public Advocates Office is critical of the use of this 6
methodology, and our concerns fall into two categories: 1) concerns about the applicability 7 of the 2017 IEPR forecast and disaggregation to SCE feeders, and 2) specific concerns 8 regarding the DER-driven Grid Reinforcement Study. 9
Uncertainties in the Commission Approved Forecasting Process 10 SCE states that the initial steps of the DER-driven Reinforcement Study, deriving 11
circuit level forecasts from the 2017 IEPR report, were performed consistent with 12
Commission requirements from the DRP proceeding. 211 The Public Advocates Office does 13
not challenge that SCE complied with Commission requirements, or that the 2017 IEPR 14
provides the correct starting point for SCE’s TY 2021 GRC distribution planning. 212 15
However, a Distribution Forecasting Working Group (DFWG) was established in the DRP 16 proceeding to evaluate methods to disaggregate the IEPR forecast, and included evaluation of 17
uncertainty in the scope of work.213 The DFWG Final Report provided an extensive 18
discussion of uncertainly stemming from each step of the forecasting process, culminating in 19
the Table 5-10:214 20
210 These mitigations are described within SCE’s workpapers as discussed for each DER-driven program in Section V.B.8. Below. 211 SCE response to Public Advocates Office data request PubAdv-SCE-139-TCR, Q.2. 212 D.18-02-004 established that “the most recent IEPR system-level forecast is the most appropriate source for DER growth scenarios.” See page 18. Page 9 of SCE’s 2019 Grid Needs Assessment Report, Amended version dated August 23, 2019 indicates that the “2017 IEPR Forecast” was used, and refers to the following: “California Energy Commission, “SCE TAC Peak and Energy Forecasts: CED 2017, Mid Baseline‐Mid AAEE/AAPV.” 213 D.18-02-003, p. 82, Ordering Paragraph 1.c. Also see Joint Ruling of the Commissioner and Administrative Law Judge Establishing Parameters and Schedule for the Distribution Forecasting Working Group, filed March 29, 2018 in R.14-08-013, pp. 3 and 6. 214 July 2, 2018 filing by SCE in R.14-08-013 provided the DFWG Final Report dated June 28, 2018 as
(continued on next page)

56
Table 5-10 1 Distribution Forecasting Working Group Uncertainty Summary 2
3
4 5
This table shows the level of uncertainty and associated risk is high for PV, which is 6
by far the largest type of DER considered in SCE’s DER-driven Reinforcement Study.215 7
The DFWG consensus findings concluded that “IOUs [should ] consider the uncertainty 8 qualifications and use them as an input to help prioritize their analysis and modeling 9
efforts.”216 10
Beyond the inherent uncertainties and risks involved in the Commission approved 11 forecasting process, there have been significant developments since the 2017 IEPR was 12 generated and that should be considered. Most recently, the Coronavirus pandemic began 13 causing massive societal and economic disruptions in March 2020 as a result of efforts to 14
Attachment A. See Figure 8, page 24. Refer to the DFWG Final Report for definitions of each line item, and the Glossary in Appendix A for definitions of the DERs in each column. 215 SCE Workpapers, Ex. SCE-2, Vol. 4, Part 2, Chapter II, Book A, p. 17. Also, SCE notes that “confidence level decreases as the forecast moves further into the future.” SCE Workpapers, Ex. SCE-2, Vol. 4, Part 2, Chapter II, Book B, p. 5. 216 July 2, 2018 filing by SCE in R.14-08-013 provided the DFWG Final Report dated June 28, 2018 as Attachment A. See page 35.
PV EV AAEE ES LMDR
IEPR High High High High Medium
Method Medium Medium Medium High Medium
Shapes/Profile Low Med to High Medium High Low
Charge Location
Not Applicable
Medium Not Applicable
Not Applicable
Not Applicable
Lumpy (NT)* Low Medium Medium Low Low
Lumpy (LT)** High Medium Medium High Medium
Impact Large Medium Large Small Small
Risk High Medium High Low Low* NT = Near-Term** LT + Long -Term

57
contain this disease.217 These disruptions are clearly not modeled in the 2017 IEPR forecast. 1
The intensity and duration of the resulting recession, and its impacts on electric load and 2 DER growth and adoption patterns are currently in flux, but experts have described the 3
negative impacts on the Solar and Energy Storage industries.218 4
Other significant developments since the 2017 IEPR forecast was created and SCE 5 performed its DER-driven Reinforcement Study include: 6
• The 2018 and 2019 wildfires and associated Public Safety Power Shutoff 7 (PSPS) events initiated a trend of increased deployment of energy storage 8
systems.219 9
• The Commission initiated the Microgrid OIR. 220 10
Energy storage systems, whether in stand-alone applications or as part of a microgrid, 11 provide a valuable tool to help moderate any adverse impacts of intermittent distributed 12 generators. Microgrids add a different mix of DERs at a given location on a feeder compared 13 to non-microgrid DER deployment, and provide the ability to isolate both DERs and 14 customer load from the feeder. Customer response to PSPS events and the impetus to 15 commercialize and deploy microgrids through R.19-09-009 are both new developments and 16 are not incorporated into 2017 IEPR DER forecasts currently being used. 17
217 Refer to the workpapers supporting Ex. PAO-05C for the following. The Governor of the State of California, Gavin Newsom, declared a state of emergency on March 4, 2020, and ordered a statewide “shelter in place” order on March 19, 2020, per Executive Order N-33-20. Also Los Angeles Times article “Coronavirus recession now expected to be deeper and longer,” dated April 1, 2020. 218 Refer to the workpapers supporting Ex. PAO-05C for the following. “Coronavirus creating solar industry 'crisis': U.S. trade group,” Reuters, March 16, 2020. “Energy storage growth derailed by coronavirus: Wood Mackenzie,” Power Technology, April 3, 2020 219 Refer to the workpapers supporting Ex. PAO-05C for the following. “Power shutoffs cause a battery boom in California,” PV Magazine, October 31, 2029. Also see D.20-01-021, p.2, “This decision prioritizes allocation of 2020 to 2024 [Self Generation Incentive Program (SGIP)] collections in accordance with Assembly Bill 1144 (Friedman, 2019) and to benefit customers impacted by Public Safety Power Shutoff (PSPS) events or located in areas of extreme or elevated wildfire risk.” 85% of the SGIP funding is allocated to energy storage technologies. 220 Order Instituting Rulemaking Regarding Microgrids Pursuant To Senate Bill 1339 (R).19-09-009 OIR dated September 19, 2019. This proceeding was initiated per state statue to “facilitate the commercialization of microgrids for distribution customers” while “avoiding shifting costs between ratepayers,” p. 2. While the scope of this proceeding has a long-term focus, Track 1 aims to improve grid resiliency in advance of the 2020 fire season. See Assigned Commissioner’s Scoping Memo and Ruling for Track 1, issued December 20, 2019 in R.19-09-009, p. 3.
58
Each of these three developments can significantly alter the rate of growth of each 1 type of DER, the mix of DER installed, and the spatial deployment pattern compared to 2 historical distributions. Taken together, they indicate significant new uncertainties in the 3 forecast deployment of DERs, including the possibility of a significant reduction of PV-only 4 installations, and an increase in energy storage installations. 5
While SCE is required to use the 2017 IEPR forecast as the starting point for the 6
DPP, it also has the flexibility to propose and justify adjustments.221 SCE has exercised this 7
flexibility by including “incremental load growth” in its DPP, but has not made adjustments 8
to account for these new DER-related developments.222 9
SCE’s DER-driven Reinforcement Study Adds Uncertainty 10 SCE’s DER-driven Reinforcement Study adds a second disaggregation step (from 11
feeder head to service transformers) on top of the Commission approved disaggregation 12
(from system to feeder). 223 As discussed in Section III.C.2. and V.B.4. above, this process 13
is similar to the ICA planning use case. A DRP ICA working group, separate from the 14 DFWG working group, reported that “the Joint IOUs highlighted that regardless of the ICA 15 methodology, the results [for the planning use case] would have some significant level of 16
uncertainty since they are based on forecasts of circuit level DER and load growth.”224 17
SCE’s DER-driven Reinforcement Study adds another layer of uncertainly by adding a 18
second disaggregation step to the Commission approved forecasting process.225 19
20
221 D.18-02-004, pp. 19-20. 222 Ex. SCE-2, Vol. 4, Part 2, pp. 10-11. 223 “California Distribution Resources Plan (R. 14-08-013) Integration Capacity Analysis Working Group Final ICA WG Long Term Refinements Report” filed March 12, 2018, in R.14-08-013, p. 18, Section 4.1.4. 224 SCE’s DER-driven Reinforcement Study workpaper generally refers to “DER” regarding the methodology, but details are only provided for PV. See SCE Workpapers, Ex. SCE-2, Vol. 4, Part 2, Chapter II, Book A, p. 14-29. Note that the bottom figure on page 24 of this workpaper provides an example with close to 300 service transformers on a feeder. 225 The DFWG discussed DER dispersion along a circuit as an informational topic and concluded “At this point in time, no attempt is made to specifically locate forecasted DER along a circuit.” July 2, 2018 filing by SCE in R.14-08-013 provided the DFWG Final Report dated June 28, 2018 as Attachment A, see pp. 33-34.

59
SCE Does Not Account for the Impact of ICA on the Location of DERs 1 SCE’s DER-driven Reinforcement Study methodology uses historical data on DER 2
size and data on the existing amount of DER on each service transformer to allocate forecast 3
DER growth along the feeder.226 This methodology fails to account for the role that ICA 4
can and should play in driving DER to locations that do not require grid upgrades.227 ICA in 5
this context refers to the ICA interconnection maps and data which SCE deployed at the end 6 of 2018, rather than the ICA for planning use case discussed in the prior paragraph. While 7 there is current no regulatory mandate or tariff to drive DER into areas identified by ICA as 8 having high hosting capacity, developers of larger DERs use ICA maps and now to locate 9
projects.228 In addition, the Commission is actively working to integrate ICA results into the 10
Rule 21 interconnection process.229 ICA was created in response to the Commission’s 11
desire to increase the cost effectiveness of DERs by avoiding the types of projects SCE seeks 12 to implement through its DER-driven programs, and its use should be reflected in SCE’s 13 request for DER-driven grid upgrades. 14
6. SCE Errs by Assuming that DER Integration Issues 15 Must be Mitigated by Traditional Grid Upgrades 16
Independent of the above issues regarding SCE’s ability to predict where and when 17 DER deployment will result in violations SCE’s grid operation standards, SCE’s cost 18 estimates are based on deployment of specific SCE owned equipment as mitigation. For 19 example, SCE proposes to install voltage regulators when its analysis indicates that a voltage 20
violation will occur.230 SCE’s analysis fails to account for how DERs can provide solutions 21
226 SCE Workpapers, Ex. SCE-2, Vol. 4, Part 2, Chapter II, Book A, p. 23-24. 227 D.18-03-023, pp. 17 and 20. 228 Refer to workpapers supporting Ex. PAO-05C, Letters from CESA and CALSSA Regarding DER Developer Use of ICA. 229 The Scoping Memo of Assigned Commissioner and Administrative Law Judge in R.17-07-007 filed October 2, 2017 incorporated ICA into Working Group 2, and posed four key questions on pages 3-4. The Final Report for this working group filed by the joint utilities on October 31, 2018 in R.17-07-017, includes proposals regarding ICA in response to issues 8, 9, and 10. Commission disposition of this report in pending. 230 SCE Workpapers, Ex. SCE-2, Vol. 4, Part 2, Chapter II, Book B, p. 4. All SCE proposed upgrades are discussed in SCE workpapers and in Section V.B.8. below.

60
to grid needs. As an initial example, Section V.B.5. above noted that adverse DER impacts 1 to date were due to wholesale DER, and that this DER was curtailed as a result. While 2 extensive curtailment of DER output is counter to state climate change policy and DER 3 provider business models, strategic curtailment for short periods could be preferable to the 4 alternative of higher interconnection costs. Appendix B discusses how ECTs, existing and 5 customer technologies, can and should be considered to avoid and/or mitigate DER 6 integration issues. This concept is particularly important relative to DER-driven Hosting 7 Capacity Reinforcement projects: once smart inverters are required as a condition of 8 interconnection, they will be deployed at each new DER project location and can provide 9 site-specific benefits. 10
7. The Use of Memorandum Accounts Has Been 11 Authorized in the DRP Proceeding 12
The CPUC has authorized the use of two memorandum accounts in the DRP 13 proceeding. First, the Commission authorized a “memorandum account to track the 14 incremental costs of implementing the Integration Capacity Analysis and Locational Net 15
Benefit Analysis to the specifications ordered herein.”231 Second, the Commission 16
authorized “a memorandum account to track the incremental costs of implementing the 17
GNA, DDOR, and Data Access Portal to the specifications described in this decision.”232 18
SCE’s relevant testimony on electric distribution do not refer to these accounts.233 19
SCE’s Results of Operation testimony includes discussion of a long list of balancing and 20
memorandum accounts also does not refer to these two memorandum accounts.234 SCE 21
does however request a new “DRP Write Off Costs memorandum Account (DRPWOCMA) 22
231 D.17-09-026, p. 64, Ordering Paragraph 19. This account “will be subject to a reasonableness review” per page 56 of the decision. 232 D.18-02-004, p. 85, Ordering Paragraph 2.n. This order further states “the IOUs shall create a sub-account within the memorandum account established in D.17-09-026 to track the incremental costs of ICA and LNBA implementation for this purpose. 233 Ex. SCE-2, Vol. 4, Part 1 and Part 2. 234 Ex. SCE-7, Vol. 1, Section V.B. SCE’s testimony at pages 37-39 refers to a related “Distribution Deferral Balancing Account also referenced in D.18-02-003, pp. 88-89, Ordering Paragraphs 2.aa., 2. bb., and 2.ee.

61
effective January 1, 2021” for “tracking of the contingency related costs for pre-construction 1
activities” related to the DIDF.235 2
8. Program Specific Cost Estimate Issues 3 DER-Driven Circuit Upgrades Program 4 SCE’s workpapers provide a narrative discussion of how its forecast for this program 5
is based on analysis SCE purports to justify “a total 27 voltage regulators, 12.5 miles of 6
conductor/cable upgrades, and 27 RARs to help mitigate the violations.”236 All the 7
workpaper shortcomings described in Section V.B.3. above are applicable to this program. 8 In addition, SCE’s workpapers state “however, simulation results for 2022 – 2023 are used to 9 inform the general level of funding that will be required ….,” but does not explain how this 10
step was performed.237 11
The more detailed support for this program provided by SCE in response to discovery 12
had the following issues:238 13
• The number of voltage regulators is shown to be 60 rather than 27 per the 14
workpapers,239 15
• No information is provided to allow the unit costs for conductors and cables to be 16 vetted, other than that data from 2016-2018 was used, 17
• No information is provided to allow the unit costs for voltage regulators or RARs to 18 be vetted, other than project numbers, and 19
• SCE provides no support for how the workpaper statement cited above regarding how 20 the 2022-2023 forecast was implemented. 21
235 Ex. SCE-7, Vol. 1, p. 51. 236 SCE Workpapers, Ex. SCE-2, Vol. 4, Part 2, Chapter II, Book B, p. 4. “RAR” is a Remote Automatic Recloser. The role of a RAR is explained in SCE Workpapers, Ex. SCE-2, Vol. 4, Part 2, Chapter II, Book A, p. 27. 237 SCE Workpapers, Ex. SCE-2, Vol. 4, Part 2, Chapter II, Book B, p. 5. 238 Attachment to SCE’s response to data request SEIA-Vote Solar-SCE-001, Q.41. 239 Attachment to SCE’s response to data request SEIA-Vote Solar-SCE-001, Q.41, cell H26.

62
These issues prevented the Public Advocates Office from evaluating the 1 reasonableness of SCE’s forecast for this program barring significant additional discovery. 2 In addition, the discrepancy in the number of forecast units of voltage regulators noted in the 3
first bullet above doubles the largest component of SCE’s forecast.240 Also, SCE shifts all 4
of its 2019-2021 forecast into 2021, which inflates the 2021 test year forecast. SCE does not 5 justify this shift or the resulting increase in TY 2012 except that it results from “shifts in 6
overall priorities…”241 SCE’s workpapers explain that it is more certain of its forecast of 7
DER-driven grid needs for 2019-2021 than those for 2023-2024, yet SCE proposes to delay 8 upgrades until 2021. This suggests that either SCE believes that these needs will not 9 materialize in 2019 or 2020, or that the impacts on safety, reliability, and voltage 10 requirements are minimal. 11
DER-Driven New Circuits Program 12 SCE’s workpapers provide a narrative discussion of how its forecast for this program 13
is based on building 10 new circuits based on two criteria:242 14
• “A circuit exceeds its PLL [planned loading limit] due to reverse power flow 15 on the circuit,” or 16
• More than 16 MW of DER on “an individual circuit at the substation.” 17 All the workpaper shortcomings described in Section V.B.3. above are applicable to 18
this program. The more detailed support for this program provided by SCE in response to 19 discovery shows that the forecast is based on a fixed cost of $3.5 million per circuit and a 20
variable cost for associated work within the substation,243 but the following issues were 21
found: 22
240 The total voltage regulator forecast based on 60 units is $11.994 million, which is 68% of the total program forecast of $17.567 million. 241 SCE’s response to data request SEIA-Vote Solar-SCE-001, Q.41. Also see cell E7 of tab “DER-driven Distribution Circuits Upgrade” in the attachment to this data request. 242 SCE Workpapers, Ex. SCE-2, Vol. 4, Part 2, Chapter II, Book B, p. 14. 243 Attachment to SCE’s response to data request SEIA-Vote Solar-SCE-001, Q. 41. SCE workpapers note that the unit cost for a new circuit is the same as for the “New DSP Circuits” program but does not mention the cost for substation work.
63
• No information is provided to allow the unit costs for new circuits to be vetted,244 1
• No information is provided to allow the unit costs for substation work to be vetted, or 2 how they are applied. 3 These issues prevented the Public Advocates Office from evaluating the 4
reasonableness of SCE’s forecast for this program barring significant additional discovery. 5 As with the Circuit Upgrades forecast, SCE shifts all of its 2019-2021 forecast into 2021, 6 which leads to the same problems and concerns. 7
DER-Driven 4 kV Cutovers Program 8 SCE’s workpapers provide a narrative discussion of how its forecast for this program 9
proposes to “cutover” four 4 kV circuits to higher voltages “where the voltage and/or thermal 10 issues [on the 4 kV circuit] were of such a large magnitude that a higher voltage circuit is 11
required to adopt the new DERs.”245 All the workpaper shortcomings described in Section 12
V.B.3. above are applicable to this program. SCE workpapers explain that the unit cost for a 13 circuit cutover is the product of the number of transformers on the circuit to be cutover and a 14
unit cost per transformer.246 The more detailed support for this program provided by SCE in 15
response to discovery gives the unit cost per transformer to be $56,398,247 but the following 16
issues were found: 17
• No information is provided to allow the units per year to be vetted, circuits or 18 transformers, 19
• No information is provided to allow the unit costs for new circuits to be vetted.248 20
244 No information to support the $3.477 million unit cost is provided in the Attachment to SCE’s response to data request SEIA-Vote Solar-SCE-001, Q.41. SCE workpapers for the “New DSP Circuits” program, cited as the source for this unit cost data, do not include this unit cost. See SCE Workpapers, Ex. SCE-2, Vol. 4, Part 2, Chapter II, Book A, pp. 14-15. 245 SCE Workpapers, Ex. SCE-2, Vol. 4, Part 2, Chapter II, Book B, p. 10. Refer to Ex. SCE-2, Vol. 4, Part 2, pp. 49-50 for a description of the cutover process from 4 kV to 12 kV or higher. 246 SCE Workpapers, Ex. SCE-2, Vol. 4, Part 2, Chapter II, Book B, pp. 10-11. 247 Attachment to SCE’s response to data request SEIA-Vote Solar-SCE-001, Q.41. 248 Attachment to SCE’s response to data request SEIA-Vote Solar-SCE-001, Q.41 shows that the $56,398 unit cost per transformer is derived from cost and unit data for “4 kV-IR” projects for 2014-2018. No evidence has been provided to show that the scope of work in these projects is comparable to the scope of work is the subject program.

64
Independent of the evidentiary concerns expressed for other DER-driven programs, 1 the Public Advocates Office questions the fundamental justification for this program, which 2 presumes that SCE can accurately predict DER levels accurately enough to target specific 4 3 kV circuits to be cutover in specific years. If these projects are truly needed, SCE should 4 either a) show that the forecast thermal or voltage violations due to DER cannot be mitigated 5 for less cost as part of the DER-driven Circuit Upgrade Program, or b) prioritize these 6 circuits as part of the regular 4 kV cutover program. 7
DER-Driven Circuit Breaker Upgrades Program 8 SCE’s workpapers describes how its forecast for this program is based on replacing 9
41 substation circuit breakers due to an increase in “short circuit amps.”249 All the 10
workpaper shortcomings described in Section V.B.3. above are applicable to this program. 11 SCE’s workpapers explain that this forecast is based on a basic forecast units times forecast 12
unit cost for a circuit breaker.250 The more detailed support for this program provided by 13
SCE in response to discovery gives the unit cost per 12 kV circuit breaker to be $154,241,251 14
but the following issues were found: 15
• No information is provided to allow the units per year to be vetted,252 16
• No information is provided to allow the unit costs to be vetted, and 17
• SCE provided no information to support the spreading of costs across two years. 18 These issues prevented the Public Advocates Office from evaluating the 19
reasonableness of SCE’s forecast for this program barring significant additional discovery. 20 DER-Driven Substation Transformer Upgrades Program 21 SCE’s workpapers provide a narrative discussion of how its forecast for this program 22
is based on analysis SCE purports to justify that it must “increase the substation bank 23 capacity” at one substation due to “reverse power flow from the aggregate DER on the 24
249 SCE Workpapers, Ex. SCE-2, Vol. 4, Part 2, Chapter II, Book B, p. 19. 250 SCE Workpapers, Ex. SCE-2, Vol. 4, Part 2, Chapter II, Book B, p. 19. 251 Attachment to SCE’s response to data request SEIA-Vote Solar-SCE-001, Q.41. One of the 41 circuit breakers was a 16 kV unit with a unit cost of $140,135. The attachment also shows how the forecast cost is spread over two years, with approximately 2/3 of the costs in Year 2. 252 The 41 breakers to be replaced are only defined by the voltage and a purported year of needed replacement.

65
circuit.”253 All the workpaper shortcomings described in Section V.B.3. above are 1
applicable to this program. The more detailed support for this program provided by SCE in 2 response to discovery clarifies that this project will install a new transformer at a unit cost of 3
$1.818 million,254 but the following issues were found: 4
• The name and location of the proposed project is not given, nor was it provided in 5 SCE testimony or workpapers, 6
• No information is provided to allow the unit cost to be vetted, beyond the project 7 numbers for projects deemed by SCE to be comparable, and 8
• SCE provided no support for the spreading of costs across three years, 9 These issues prevented the Public Advocates Office from evaluating the 10
reasonableness of SCE’s forecast for this program barring significant additional discovery. 11
9. Recommendations 12 SCE’s request for DER-driven programs represents one of SCE’s responses to state 13
mandates to increase DER penetration within the distribution grid. This request differs from 14 other Grid Modernization requests because they are for location specific work rather than 15 system wide upgrades. As previously noted in Section III.D.1., the Public Advocates Office 16 testimony recommended that circuit-specific DER-related upgrades should be allow if 17 properly justify. SCE’s current DER-driven upgrades do no justify immediate cost recovery 18 because the methodology SCE used to justify these programs: 19
• Presumes the outcome of an active CPUC proceeding, 20
• Is subject to significant uncertainty, 21
• Does not account for the role of ICA in directing DERs to grid locations that 22 do not require upgrades, and 23
• Does not account for the positive impacts of DER. 24 In addition, beyond the question of whether these programs are needed, SCE has not 25
demonstrated that its cost estimates are reasonable. This is after SCE’s response to a clear 26
253 SCE Workpapers, Ex. SCE-2, Vol. 4, Part 2, Chapter II, Book B, p. 26. Neither the workpapers nor SCE’s testimony describe the scope of the project. 254 Attachment to SCE’s response to data request SEIA-Vote Solar-SCE-001, Q.41. The attachments shows the cost of the transformer to be spread over three years with 3%, 43%, and 54% for years 1 to 3 respectively.

66
discovery question seeking support for its cost estimates. Finally, SCE has shifted forecast 1 costs from 2019 and 2020 to 2021 due to resource constraints, without explaining how these 2 constraints will be resolved by 2021. 3
The net result is considerable uncertainty surrounding these programs including 4 whether DER-driven grid violations will materialize as forecast; whether the proposed 5 mitigations are the optimum solutions, and whether SCE will have the resources to 6 implement the proposed mitigations. Given this uncertainty, the Public Advocates Office 7 recommends that DER-driven programs be subjected to memorandum account treatment. 8 Section V.B.7. above describes memorandum accounts previously authorize for DER related 9 expenditures and a new account proposed by SCE. The Public Advocates Office has no 10 preference regarding if one of these is used or an alternative new account, but recommends 11 that 1) expenditures for DER-driven upgrades be tracked separately for, 2) subsequent 12 reasonableness review. 13
A memorandum account rather than a balancing account is recommended in part 14 because it is likely that SCE will expend much less than forecast for these programs. In 15
addition, SCE forecasts significant ongoing capital expenditures for these programs.255 The 16
use of a memorandum account provides for a reasonableness review that can help evaluate 17 the effectiveness of work that has been performed, and inform improvements to programs 18 requested in the next GRC. Such a review is consistent with Commission requirements in 19 DRP to “evaluate the effectiveness of past forecasts and calibrate their circuit-level DER 20
forecasts based on actual data.”256 21
22
255 Ex. SCE-2, Vol. 4, Part 1, p. A-52. 256 D.18-02-003, p. 82, Ordering Paragraph 1.e.

67
VI. WITNESS QUALIFICATIONS 1
My name is Thomas Roberts. My business address is 505 Van Ness Avenue, San 2 Francisco, California. I am employed by the California Public Utilities Commission as a 3 Senior Utilities Engineer in the Public Advocates Office Energy Infrastructure Branch. I 4 received a Bachelor of Science Degree in Mechanical Engineering from the California 5 Polytechnic University in 1988, and a Masters of Business Administration from the Peter F. 6 Drucker Center at the Claremont Graduate School in 1994. I am currently registered in 7 California as a Professional Mechanical Engineer. 8
Since joining the Commission in 2006, I have worked on a wide variety of 9 proceedings, including advanced metering infrastructure (AMI), energy efficiency (EE), and 10 avoided costs. I have served the Public Advocates Office as project coordinator for AMI 11 programs, and for distributed generation programs including the California Solar Initiative 12 (CSI) and the Self-Generator Incentive Program (SGIP). I have prepared and defended 13 testimony in PG&E’s TY 2017 and TY 2020 GRCs, SCE’s 2018 GRC, and Sempra’s 2019 14 GRC on electric distribution capital expenditures. I am currently a member of the Public 15 Advocates Office’s Distribution Resources Plan (DRP) team and contribute to Public 16 Advocates Office filings in a multitude of demand-side resource and planning proceedings. 17 Between 2011 and 2015, I focused on natural gas issues including being a witness in the 18 2012 Pipeline Safety Enhancement Plan (PSEP) applications of PG&E and of Southern 19 California Gas Company and San Diego Gas & Electric Company, in the Orders to Show 20 Cause related to PG&E’s Line 147 in 2013, in PG&E’s PSEP Update application in 2014, 21 and in PG&E’s 2015 Gas Transmission and Storage (GT&S) proceeding. 22
Prior to joining the Commission, I held various professional positions including 23 Senior Test Engineer/Scientist, Facility Manager, and Program Manager at Boeing Space 24 Systems, and as an applications engineer for a mechanical instrumentation manufacturer. 25
This completes my prepared testimony. 26

68
Appendix A - Glossary 1 AAEE - Additional Achievable Energy Efficiency 2 AC – Alternating Current 3 ADMS - Advanced Distribution Management System 4 AMI - Advanced Metering Infrastructure 5 CALSSA - California Solar and Storage Association 6 CESA - California Energy Storage Alliance 7 CPUC – California Public Utilities Commission 8 DC – Direct Current 9 DER - Distributed Energy Resource 10 DERMS - DER Management System 11 DFWG – Distribution Forecasting Working Group 12 DIDF - Distribution Investment Deferral Framework 13 DOE - Department of Energy 14 DPP - Distribution Planning Process 15 DRP - Distribution Resource Plan 16 DRPEP - DRP External Portal 17 E&P – Engineering and Planning 18 ECT - Existing and Customer Technologies 19 EE - Energy Efficiency 20 EPIC - Electric Program Investment Charge 21 ES - Energy Storage 22 FAN - Field Area Network 23 GAA - Grid Analytics Application 24 GCM - Grid Connectivity Model 25 GIPT - Grid Interconnection Processing Tool 26 GMP - Grid Modernization Plan 27 GMS - Grid Management System 28 GRC – General Rate Case 29 HAN - Home Area Network 30 ICA - Integration Capacity Analysis 31

69
IEEE – Institute of Electrical and Electronics Engineers 1 IOU - Investor Owned Utility 2 LDMR - Load Modifying Demand Response 3 LTPT - Long Term Planning Tool 4 ORA - Office of Ratepayer Advocates 5 NEM – Net Energy Metering 6 PG&E - Pacific Gas and Electric Company 7 PIN - Project Identification Number 8 PSPS - Public Safety Power Shutoff 9 PV - Photovoltaic 10 SCADA - Supervisory Control and Data Acquisition 11 SCE - Southern California Edison Company 12 SEIA - Solar Electric Industries Association 13 SIWG – Smart Inverter Working Group 14 SMT - System Modeling Tool 15 TURN - The Utility Reform Network 16 WAN - Wide Area Network 17 WDAT – Wholesale Distribution Access Tariff 18

70
Appendix B – Existing and Customer Technologies (ECTs) 1 SCE’s GMP describes potential DER integration challenges and how its proposed 2
new investments in SCE-owned assets can mitigate these challenges.257 However, there are 3
other tools to help 1) avoid adverse grid impacts from DERs; 2) verify that 4 estimated/forecasted adverse grid impacts are actually occurring, or will occur imminently; 5 and 3) mitigate actual impacts. These tools include existing SCE assets, existing third-party 6 assets, and new and existing customer owned assets. These assets, aka equipment or 7 technologies, are collectively referred to by SCE as Existing and Customer Technologies 8
(ECTs.)258 SCE testimony states “as shown in the table, certain integration challenges may 9
more easily be resolved through direct utility control of the customer resources.” 259 10
Examples of ECT use include: 11
• Autonomous Phase 1 smart inverter functions can help mitigate voltage issues 12 without DERMS, 13
• The AMI meters’ remote disconnect feature can be used to island single 14 customer microgrids, and 15
• Energy storage facilities can be used to shift PV output away from periods of 16 minimum load. 17
This appendix discusses how ECTs can help integrate DERs at a lower cost than 18 SCE’s GMP. First, Table 5-7 shows how SCE’s GMP and ECTs can address specific DER 19 integration challenges. Second, a discussion is provided for each ECT: description of the 20 technology, current status, discussion of how the technology relates to the DER challenges in 21 Table 5-7. Third, perspectives on some potential DER integration challenges are provided, 22 and finally the costs of ECTs are discussed. 23
One aspect of ECTs that is not discussed in this appendix are the potential benefits of 24 ECTs and DERs more broadly. Readers should review the statue that led to the DRP 25
257 Integration of DERs is only one objective of SCE’s GMP. See Ex. SCE-2, Vol. 4, Part 1, pp. A-41 to A-42, Table 15. 258 Ex. SCE-2, Vol. 4, Part 1, p. A-21. 259 Ex. SCE-2, Vol. 4, Part 1, p. A-17. However, as discussed in Section V.B.1 of this testimony, none of the tables in SCE’s GMP shows how ECTs can be used to manage grid integration challenges

71
proceeding, Public Utilities Code Section 769, the DRP OIR, and the Commission’s 2017 1 DER Action Plan to understand the potential DER benefits that the Legislature and 2
Commission sought to realize through the DRP proceeding.260 3
A. Public Advocates Office Comparison of DER-Integration 4 Technologies 5
Table 5-7 below compares SCE’s GMP request and ECTs to the 11 potential DER-6
Integration Challenges adopted by the Commission:261 7
260 See AB 327 (Perea, 2013), and https://www.cpuc.ca.gov/General.aspx?id=6442458159, Updated DER Action Plan dated May 3, 2017. 261 The Commission’s Grid Modernization decision included a list of ten potential system/integration challenges that could possibly by driven by high penetrations of DERs. See D.18-03-023, Appendix C, pp. 7-11. The list of potential system/integration challenges was expanded to 11 by Resolution E-4982, which is included in the workpapers supporting this testimony since it includes detailed descriptions of each challenge.

72
1
Tabl
e 5-
7Pu
blic
Adv
ocat
es O
ffice
Com
paris
on o
f DER
-Inte
grat
ion
Tech
nolo
gies
AB
CD
EF
GH
JI
KPo
tent
ial
Syst
em/I
nteg
ratio
n Ch
alle
nge
SCE
Grid
M
oder
izat
ion(1
)
SCE
DER
Rein
frcm
nt(2
)
ECTs
per E
-498
2(3)
AMI
Phas
e 1
Smar
t In
vert
erRu
le 2
1 Te
lem
etry
Phas
e 3
Smar
t In
vert
er w
ith
DERM
S
Util
ity
Cont
rolla
ble
Mic
rogr
ids W
ith
DERM
S
Ener
gy
Stor
age(4
)O
ther
ECT
s
Volta
ge F
luct
uatio
nX
SI, E
SX
XX
XX
X?
Stea
dy-S
tate
Vol
tage
Vi
olat
ions
XX
SI, E
SX
XX
XX
X?
Mas
ked
Load
XSI
, mor
e gr
anul
ar
DER
data
XX
XX
?
Ther
mal
XX
ESX
XX
?
Prot
ectio
nX
XN
one
?X
?
Ope
ratio
nal L
imits
XSI
XX
XX
X?
Faul
t Loc
atio
n an
d Se
rvic
e Re
stor
atio
nX
Non
eX
XX
?
Ener
gy M
arke
t Sec
urity
XN
one
XX
X?
Cybe
rsec
urity
XN
one
XX
X?
DER
Aggr
egat
ion
Impa
cts
on th
e Bu
lk G
ridX
SIX
XX
XX
X?
DER
Who
lesa
le M
arke
t Pa
rtic
ipat
ion
XN
one
XX
X?
(1) P
er E
x. S
CE-2
, Vol
. 4, P
art 1
, p. A
- Tab
le 8
: GM
S, E
&P,
SA,
DA, C
oms,
cybe
r.(2
) Per
Per
Ex.
SCE
-2, V
ol. 4
, Par
t 1, p
. A-2
1, T
able
8: D
ER-d
riven
pro
gram
s, re
lays
.(3
) SI =
smar
t inv
erte
r; ES
= e
nerg
y st
orag
e(4
) Ener
gy st
orag
e ca
pabi
litie
s, in
depe
nden
t fro
m sm
art i
nver
ter c
apab
ilitie
s.

73
Columns B and C in Table 5-7 provided data from SCE’s GMP.262 Column D is 1
taken from Commission Resolution E-4982, which approved the list of DER-integration 2
challenges, and technologies that could address those challenges.263 The remaining columns 3
provide the Public Advocates Office’s understanding of how ECTs can meet each integration 4 challenge based on its participation in the DRP and Rule 21 proceedings. 5
B. Description and Status of ECTs, and Their Role in DER Integration 6 This section describes the following ECTs: 7
• Advanced Metering Infrastructure (AMI), 8
• DER telemetry per Rule 21 requirements, 9
• Phase 1 Smart Inverters, 10
• Existing third-party communication networks, 11
• Phase 3 Smart Inverters, 12
• Customer energy storage, 13
• Customer microgrids, and 14
• Other ECTs. 15 For each ECT, the deployment status is provided, as well as a summary of how the 16
ECT can help address DER-integration challenges. 17 AMI 18 In D.08-09-039, the CPUC authorized SCE to spend $1.63 billion to deploy its 19
proposed “SmartConnect” smart meter system, which is also referred to as SCE’s AMI 20
system.264 AMI is fully deployed and operational, but SCE has requested funding to 21
maintain and upgrade the system. In the current GRC, SCE requests funding to upgrade the 22 “Network (Metering) Management System (NMS)” used to support communications with 23 smart meters to 4G technology, but this request does not include replacement of the cell 24
relays that transmit data from the AMI mesh network to SCE’s back office.265 SCE’s TY 25
262 Ex. SCE-2, Vol. 4, Part 1, p. A-21, Table 8. 263 See Resolution E-4982, final table in the attachments. 264 D.08-09-039, p. 2. 265 Ex. SCE-6, Vol. 1, Part 2, pp. 126-129.
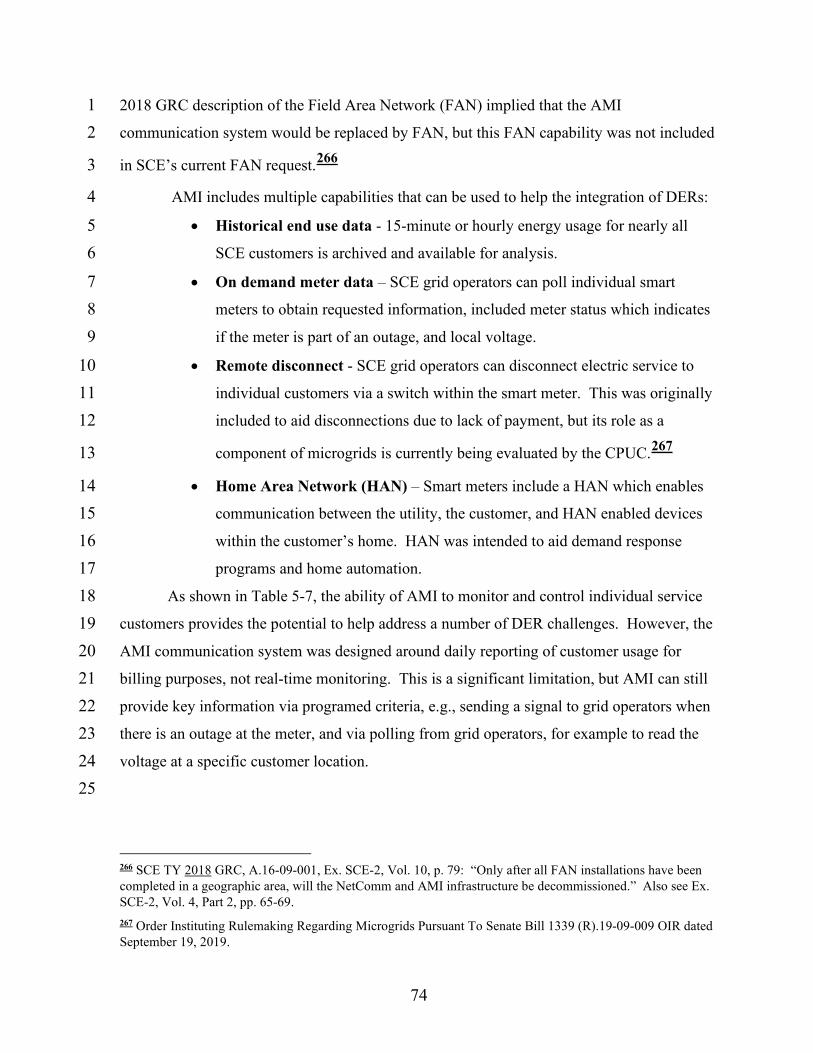
74
2018 GRC description of the Field Area Network (FAN) implied that the AMI 1 communication system would be replaced by FAN, but this FAN capability was not included 2
in SCE’s current FAN request.266 3
AMI includes multiple capabilities that can be used to help the integration of DERs: 4
• Historical end use data - 15-minute or hourly energy usage for nearly all 5 SCE customers is archived and available for analysis. 6
• On demand meter data – SCE grid operators can poll individual smart 7 meters to obtain requested information, included meter status which indicates 8 if the meter is part of an outage, and local voltage. 9
• Remote disconnect - SCE grid operators can disconnect electric service to 10 individual customers via a switch within the smart meter. This was originally 11 included to aid disconnections due to lack of payment, but its role as a 12
component of microgrids is currently being evaluated by the CPUC.267 13
• Home Area Network (HAN) – Smart meters include a HAN which enables 14 communication between the utility, the customer, and HAN enabled devices 15 within the customer’s home. HAN was intended to aid demand response 16 programs and home automation. 17
As shown in Table 5-7, the ability of AMI to monitor and control individual service 18 customers provides the potential to help address a number of DER challenges. However, the 19 AMI communication system was designed around daily reporting of customer usage for 20 billing purposes, not real-time monitoring. This is a significant limitation, but AMI can still 21 provide key information via programed criteria, e.g., sending a signal to grid operators when 22 there is an outage at the meter, and via polling from grid operators, for example to read the 23 voltage at a specific customer location. 24 25
266 SCE TY 2018 GRC, A.16-09-001, Ex. SCE-2, Vol. 10, p. 79: “Only after all FAN installations have been completed in a geographic area, will the NetComm and AMI infrastructure be decommissioned.” Also see Ex. SCE-2, Vol. 4, Part 2, pp. 65-69. 267 Order Instituting Rulemaking Regarding Microgrids Pursuant To Senate Bill 1339 (R).19-09-009 OIR dated September 19, 2019.

75
Phase 1 Smart Inverters 1 In California, about 90% of local (small scale) renewable generation is connected to 2
the distribution grid through inverters,268 as are all battery energy storage devices. All 3 inverters convert DC electricity to AC, or vice versa, and some help optimize power 4 production from solar panels or control battery charging, but “smart inverters” add features 5 that help minimize any adverse grid impacts from DERs. In D.14-12-035, the Commission 6 summarized smart inverter capabilities and adopted seven specific features recommended by 7 the smart inverter working group (SIWG).269 In adopting the first phase of mandatory smart 8 inverter standards the Commission stated: 9
The voltage on a distribution line is now controlled by shunt capacitors, voltage 10 regulators on the line, and a voltage regulator in the distribution transformer at the 11 substation controlled by a line drop compensation algorithm. The smart inverter 12 has the potential to substitute for all of these measures with greater accuracy 13 and at lower cost.270 14 15 Inverter-based DERs interconnected since September 8, 2017 have included all seven 16
Phase 1 functions.271 Phase 1 smart inverter features adopted in D.14-12-035 are 17
autonomous features. For example dynamic Volt/Var operation automatically adjusts the 18 inverter’s ability to absorb reactive power in response to changes in voltage at the inverter, 19 independent of steps SCE takes to optimize voltages on the circuit. A key attribute of smart 20 inverters is that they are deployed with DERs such that the timing and location of their 21 deployment is synchronized with the DERs that could adversely impact the grid. 22
SCE’s response to discovery states that its DER-Driven Reinforcement Study 23 accounts for the use of the “VOLT/VAR Reactive Power Priority function,” but that “some 24 distribution circuits are projected to experience high voltages beyond what can be mitigated 25
by the VOLT/VAR function.”272 26
27
268 D.14-12-035, pp. 2-3. 269 D.14-12-035, pp. 3-4. 270 D.14-12-035, p. 14, emphasis added. 271 SCE Rule 21 dated March 4, 2020, sheet 137, Section H.3.d, emphasis added. 272 SCE response to Public Advocates Office data request PubAdv-SCE-130-TCR, Q.10.

76
Rule 21 Telemetry 1 Independent of the interconnection requirements for smart inverters, generators as 2
small as 250 kW may be required to install telemetering equipment.273 The Rule 21 3
Working Group discussed revisions to telemetry requirements in 2017 and 2018 and D.19-4 03-013 adopted the working group’s proposals. In response to this decision, SCE issued 5 Advice Letter 4044-E with its proposed revised telemetry requirements on July 26, 2019. 6 The advice letter was protested, so disposition of the advice letter and implementation of 7 revised telemetry requirements are pending a Commission resolution. 8
As shown in Table 5-7, Rule 21 telemetry allows SCE to monitor the status and 9 output of large DERs that can have the biggest impact on the distribution grid. Rule 21 10 telemetry does not appear to allow control of the connected DERs. However, SCE indicated 11 that it has curtailed wholesale generator output to mitigate reliability issues SCE is already 12
experiencing on its distribution system, which implies a control system for these DERs.274 13
Third-Party DER Monitoring and Communication Systems 14 Existing DERs often include monitoring systems to allow installers, leasing 15
companies, inverter manufacturers, and DER owners to remotely view the status and output 16 of the DERs. In some situations these systems provide information only, but in the case of 17 leased DERs, these monitoring systems are used to determine payments between the lessor 18 and the lessee. Communications between the DER and the parties monitoring the DER 19 typically uses the same third party (e.g., ATT, Verizon, etc.) communications infrastructure 20 used to support the internet and cable TV. 21
Third-party monitoring and communication systems are not included in Table 5-7 22 because they cannot directly assist with DER-integration. These systems can however 23 provide communication channels between ECTs, for example Phase 3 smart inverters, and 24 DER aggregators and utility operators. 25 26
273 SCE Rule 21 dated March 4, 2020, sheet 164, Section J.5. Telemetering is defined on sheet 23 of SCE’s Rule 21 as “the electrical or electronic transmittal of Metering data on a real-time basis to Distribution Provider.” In addition to being deployed at the discretion of SCE, Rule 21 does not specify the parameters to be monitored, the frequency of data polling, or the required latency of responses. 274 SCE response to Public Advocates Office data request Pubadv-SCE-130-TCR, Q.8.

77
Phase 3 Smart Inverters 1 In Resolution E-4898 the Commission in added a second set of eight smart inverter 2
functions into Rule 21, referred to as Phase 3 functions.275 These functions are more 3
powerful than Phase 1 functions because they control more aspects of DER output and 4 because they can be adjusted and triggered by SCE grid operators. However, none of the 5 Phase 3 functions can be utilized without 1) a communication path; and 2) rules defining 6 when and how they are activated. 7
Two Phase 3 functions have been required for DERs interconnected after February 8
22, 2019:276 9
• Function 5 – Frequency Watt Mode, 10
• Function 6 – Volt Watt Mode. 11 Four additional functions are currently scheduled to be required for DERs 12
interconnecting as of June 22, 2020:277 13
• Function 1 – Monitor Key Data, 14
• Function 2 – DER Disconnect and Reconnect, 15
• Function 3 – Limit Maximum Active Power Mode, and 16
• Function 8 – Scheduling Power Values and Models. 17 The same deadline applies to implementation of the IEEE 2030.5 standard that 18
defines the default protocol to be used to communicate between grid operators and DERs 19
with Phase 3 smart inverters.278 20
275 Resolution E-4898, pp. 3-4. All eight Phase three functions are described here. 276 SCE Rule 21 dated March 4, 2020, sheets 150-151. 277 Per Resolution E-5000, p. 44, Orders 10 and 11, these functions were to be mandatory for interconnections after January 22, 2020. This deadline was first extended to March 22, 2020 based on a request from the California Solar and Storage Association. An additional extension was requested by inverter manufacturers on March 19, 2020 based on complications due to the COVID-19 pandemic, which resulted in the current deadline of June 22, 2020. Refer to letter from CPUC Executive Director dated March 19, 2020, included in workpapers supporting Ex. PAO-05C. Phase 3 Function 4 and 7 are not defined in a national standard such as IEEE 1547-2018, and require additional standards development before they will be scheduled to be required for interconnection. 278 Refer to Resolution E-5000, p. 44, Order 10, and letter from CPUC Executive Director dated March 19, 2020.

78
As shown in Table 5-7, Resolution E-4982 demonstrated that smart inverters could be 1 used to address five of the eleven Potential System/Integration Challenges. However, a 2 review of the definitions of the Phase 3 functions currently scheduled to be required in 2020 3 shows that these control and monitoring functions can also help at least five of the remaining 4
challenges.279 For example, the ability to disconnect the inverter using Function 2 or limit 5
active power using Function 3 can be used to reduce generation output and alleviate thermal 6 issues. In addition, the ability of monitor data at the DER via Function 1 can provide 7 situational awareness regarding outages and actual DER output. Finally, the ability to 8 schedule inverter output via Function 8 could be used to support future participation in 9 wholesale markets. 10
SCE’s response to discovery states that these Phase 3 functions were not used in its 11 DER-Driven Reinforcement Study because “there is no CPUC requirement at this time to 12 activate this capability thus it is not clear when and how this function would be available to 13
support DER operational functions.”280 This response exposes a “chicken versus egg” 14
conundrum: which should come first, deployment of DERMS and other infrastructure 15 required for SCE to control Phase 3 functions, or development of rules and/or tariffs based on 16 the use of Phase 3 functionality. The Public Advocates Office recommends that both should 17 be developed in parallel. 18
Customer Owned Microgrids 19 As discussed in Section V.B.5. of this testimony, the Commission is currently 20
engaged in a proceeding that seeks to commercialize microgrids, R.19-09-009. It is 21 reasonable to assume that most of the resulting microgrids will be interconnected after Phase 22 3 smart inverter functions become mandatory, except Functions 4 and 7. Therefore, the 23 DERs within a microgrid will be able to provide the grid benefits described above. In 24 addition, utility controlled microgrids as a whole provide an additional tool to help mitigate 25 grid DER impacts: all DERs and loads within the grid can disconnected from the grid and 26 operated in islanded mode. This allows operators to isolate problems associated with DERs 27
279 The Public Advocates Office has not found evidence of how the subject smart inverter functions can address protection issues, such as the reduction of reach issue described in SCE’s DER-driven Reinforcement Study. 280 SCE response to Public Advocates Office data request PubAdv-SCE-130-TCR, Q.11.

79
within the microgrid, and also to help regulate voltages and adjust power flows for the 1 balance of the feeder by removing the net-load of the islanded microgrid. 2
Customer Owned Storage 3 As discussed in Section V.B.5. of this testimony, the PSPS events of 2019 have 4
accelerated deployment of customer owned energy storage systems. Table 5-7 shows that 5 Resolution E-4982 identified three DER integration challenges that could be mitigated by 6 energy storage. The Public Advocates Office has not investigated whether storage can 7 mitigate any of the remaining challenges, but it is reasonable to assume that if the storage 8 device is coupled to the grid using a smart inverter, additional benefits should be realized. 9
Other ECTs 10 Transportation and building decarbonization initiatives could provide a fleet of new 11
tools to help integrate DERs, particular the variable loads from PV generators.281 IEEE 12
2030.5 supports a wide range of devices including programmable communicating 13 thermostats, water heaters, lighting, pool pumps, and electric vehicle chargers. SCE has two 14
active EPIC III projects investigating how electric vehicles can be integrated into the grid.282 15
A 2019 U.S. Department of Energy (DOE) paper describes the grid services that grid-16
interactive efficient buildings can potentially provide.283 These technologies are unlikely to 17
have grid impacts in the current GRC period, but may within the 10-year planning horizon of 18 the GMP. 19
C. ECTs are Economically Efficient 20 SCE’s GMP states that “SCE can leverage existing AMI, 3rd party communications 21
networks, and smart inverters to improve the economic efficiency of the modernized 22
electric grid.”284 The economic efficiency in this statement stems from the fact that the cost 23
of ECTs are primarily sunk costs as with AMI, or costs borne by DER developers and 24
281 See R.18-12-006 electric vehicles and R.19-01-011 regarding building decarbonization. 282 Ex. SCE-2, Vol. 4, Part 1, p. A-13, Table 4, Project IDs GT-18-0015 and GT-18-0016. 283Grid-Interactive Efficient Buildings: Overview, DOE, p. 18, Table II-3. Refer to workpapers supporting Ex. PAO-05C. 284 Ex. SCE-2, Vol. 4, Part 1, p. A-21, emphasis added.

80
owners with smart inverters, Rule 21 telemetry, and DERs such as energy storage and 1
electric vehicles.285 Leveraging existing equipment is the most efficient alternative because 2
no new rate increases are incurred, to the benefit of both ratepayer and DER providers. 3 Upgrades funded by DER developers and owners are also economically efficient because 4 these parties have a financial incentive to minimize interconnection costs. For example, since 5 DER providers must generally pay for grid upgrades deemed necessary by SCE, they have an 6 incentive to use the ICA maps to size and locate their project where excess capacity exists. 7 As noted in Section III.C.2. of this testimony, determination of cost causation and 8 responsibility are ongoing issues before the Commission. 9
One additional factor supports the economic efficiency of smart inverters: their 10 deployment is fully synchronized with DER deployment. For example, the Phase 1 ride-11 through and Volt/VAR functions have been deployed with newly interconnected DERs since 12 September 8, 2017 and operate autonomously now to help mitigate adverse voltage and bulk-13
grid impacts.286 In addition, once Phase 3 smart inverter functions 1, 2, 3, and 8 are required 14
for all new DER interconnections, SCE will have the capability to monitor and control these 15 DERs. As discussed throughout this testimony, this capability can only be realized once 16 SCE has deployed a DERMS and established communication channels between distribution 17 system operators and DERs. 18
D. Perspectives on Potential DER Integration Challenges 19 SCE’s GMP discusses DER integration challenges from the perspective of an IOU 20
which has a financial motivation to invest in new capital projects, and an operational 21 motivation to maximize visibility and control of its distribution system while minimizing the 22 scope and duration of customer outages. This is a valid perspective that the Commission 23 must consider. However, the Commission must also consider the perspectives of ratepayer 24 advocates, who seek to meet state policy goals at the minimum cost, and the perspectives of 25 DER developers, who seek equitable sharing of interconnection costs and fair compensation 26
285 Other non-sunk costs include some required SCE infrastructure, primarily DERMS, and any regulatory mechanisms including tariffs and market development that result, either planned or inadvertently, in ratepayer subsidies that exceed the actual value provided by DERs. 286 SCE Workpapers, Ex. SCE-2, Vol. 4, Part 2, Chapter II, Book A, pp. 25-26. Also, E-4982, page 2 of final table regarding DER integration issue number 10, DER Aggregation Impacts on the Bulk Grid.

81
for any grid service they provide. The following are the Public Advocates Office 1 perspectives on seven DER integration issues referenced in SCE’s GMP, as described in 2
Resolution E-4982.287 3
DER Aggregation Impacts on the Bulk Grid 4 DERs interconnected to the distribution grid can impact the bulk grid if their 5
aggregated impact, net of load, results in voltage, frequency, or thermal violations on the 6 high-voltage side of substation transformer banks. These impacts are mitigated, in part, by 7 addressing DER related issues at the feeder level. For example, if ECTs and SCE equipment 8 are used to avoid reverse power flow through the circuit breaker for each feeder in a 9 substation, there should be no adverse impacts on the high voltage side of the substation or 10 the bulk grid. In addition, the definition of bulk grid impacts in E-4982 refers to the situation 11 where “a large installed base of DER which trips off-line due to aggressive protection 12 settings” and notes that this “will be fixed in the future with smart inverters.” Phase 1 smart 13 inverter voltage and frequency ride-through functions provide this functionality. Table 5-7 14 shows that every ECT can help mitigate this potential integration challenge if they are used 15 to mitigate feeder level challenges. 16
Protection 17 SCE’s DER-Driven Reinforcement Study includes two protection criteria: reduction 18
of reach and fault current contribution.288 While the Public Advocates Office understands 19
that DERs can contribute fault current that can impact the operation of protection devices 20 such as circuit breakers, it must be noted that the fault contribution from inverter-based 21
DERs in approximately five-times lower than synchronous generators with inertia.289 This 22
must be considered in the protection studies, particularly for circuits where smaller (3-10 kV) 23 DERs dominate, for example on residential feeders. 24
287 Resolution E-4982, final three pages of the resolution labeled pages 1-3. 288 SCE Workpapers, Ex. SCE-2, Vol. 4, Part 2, Chapter II, Book A, pp. 26-27. Also see SCE’s response to Public Advocates Office data request PubAdv-SCE-130-TCR, Q.19. 289 For example, refer to the following presentation included in the workpapers supporting Ex. PAO-05C: “Fault Current Contribution from DG,” dated May 25, 2016. As shown of slide 2, synchronous generator short circuit current contribution is approximately six times the generator rating, while slide 9 indicates that this current is usually between 100% and 120% of the rated power of an inverter.

82
Operational Limitations 1 The description of this issue in E-4982 includes a long list of diverse issues. The 2
Public Advocates Office’s primary concern relates to operational flexibility, as discussed in 3 Appendix C of this testimony. Other listed issues are addressed below in the discussion of 4 voltage and thermal issues. 5
Thermal 6 DER-driven thermal issues primarily occur when the generation from DERs on a 7
given segment of the distribution grid first matches all load on that section, and then exceed 8 the load to such a degree that the net current exceeds equipment planned loading limits. This 9 takes a lot of DER generation concurrent with low customer loads. This situation is unlikely 10
to be driven by NEM customers, who are required to size DER systems to the onsite load.290 11
State mandates to electrify the transportation and building sectors should result in significant 12 increases in the load on specific distribution assets such as feeder segments. This increase in 13 circuit loading could reduce or eliminate the number of hours in which DER output exceeds 14 load and planned loading limits. Even if this load growth lags DER growth, it should be 15 considered in the near-term deployment of SCE’s proposed Grid Modernization assets, 16 particularly long lived equipment such as a new feeder. 17
Voltage Fluctuations 18 E-4982 illustrates this challenge based on the variable output of a solar PV system as 19
clouds pass over the PV modules.291 In this application, energy storage systems can use a 20
portion of their overall capacity to mitigate this issue, while using the balance for other use 21 cases. In addition, E-4982 states “smart inverter functionalities, such as the Volt/VAR and 22 fixed power factor functions of the Smart Inverter Working Group’s Phase 1 23 Recommendations, continue to evolve and may become a preferred method for voltage 24
management over traditional approaches in the near future.” 292 25
26
290 Public Utilities Code Section 2827(a)(4). 291 Resolution E-4982, p. 43 (marked as page 1). 292 Resolution E-4982, p. 43 (marked as page 1), footnote 30.

83
Masked Load 1 Masked load is an issue that primarily impacts reconfiguration of the distribution grid 2
following an outage, and it presumes that when service is restored, load will come online 3
before DER generation.293 SCE’s proposed solution to this potential issue is to populate its 4
distribution grid with sensors, or other devices that include sensors, to provide the real-time 5 electrical status at those measurement points. This an expensive solution that is tied to SCE’s 6 distribution automation plan. Other alternatives are possible. These alternatives are based on 7 providing grid operators with accurate and immediate static data regarding DER location, 8 type, and capacity; monitoring DERs using ECTs; and control of loads via AMI remote 9 disconnect capability as well as control of DERs via Phase 3 smart inverter capabilities. 10 These alternatives may require some elements of SCE’s GMP, such as DERMS and E&P 11 tools, without expenditures for other elements, such as distribution automation equipment. 12
Cybersecurity 13 Cybersecurity concerns should be discussed separately for utility assets and DERs 14
based on the scope of outcomes in the event that a cybersecurity breach occurs. A 15 cyberattack of SCE’s distribution SCADA system could impact substation equipment 16 settings and SCADA enabled devices on feeders, and the ability to monitor distribution grid 17 and large DER operating status via current Rule 21 telemetry. The impacts of a single 18 nefarious command could impact large groups of customers on a targeted feeder circuit 19 breaker, for example. 20
An attack on the systems used to monitor and control DERs with smart inverters has a 21 smaller impact for two reasons. First, the scope of impact from a nefarious command to a 22 single device is limited by the size of the DER and the smart inverter functions that can be 23 accessed. For example, an illicit command to disconnect a 10 kW rooftop PV system will 24 have the same impact as a solar eclipse: a small temporary increase in net load on the service 25 transformer and feeder. Second, an elicit command to a DER aggregator could have a larger 26 impact, if for example, all smart inverters installed and monitored by one company were 27
293 Inverters generally take time to run internal tests following an outage, and during this time there is no power output. It’s possible that this issue could be resolved in the future if the inverter and smart meter at the same facility could be coordinated via HAN. For example, smart meters at facilities with DERs could be remotely programmed to disconnect during an outage, and to reconnect only after the inverter tests were completed. In this way, the facility would only connect back to the grid once the DER was generating.

84
targeted. However, given that the DER industries are competitive, it is unlikely that all 1
DERs on a given circuit will be controlled by the same DER aggregator.294 Therefore, the 2
impact of such an attack would be spread over a wide geographic area such that the impacts 3 on a single substation or feeder would be minimized. As a result, the cybersecurity of a 4 DERMS/smart inverter system is less critical due to the scale of impacts from a cyberattack. 5
It must be noted that cybersecurity is a fundamental component of the IEEE 2030.5 6 communication protocol adopted by the Commission for use with DERs, including a cipher 7 suite which provides 128-bit security on par with that used by the financial services 8
sector.295 9
Appendix C – The Impact of Sectionalization on Hosting Capacity 10 The distribution automation component of SCE’s GMP adds SCADA enabled 11
switches to distribution circuits to “sectionalize” the circuit and allow restoration of some 12
customers on the circuit during an outage.296 SCE’s GMP describes multiple benefits of 13
distribution automation which are neither challenged nor supported by the Public Advocates 14 Office. As stated in Section IV.B.3., it appears that the addition of these SCADA switches 15 reduces the hosting capacity for DERs using both ICA and SCE’s DER-driven 16 Reinforcement Study, as discussed below. 17
SCE’s ICA, discussed in Section III.C.2. above, provides public maps and 18 downloadable data that allows “determining the maximum amount of DERs that can be 19
connected without adversely impacting SCE’s distribution system.”297 This DER “hosting 20
capacity” data is provided in two flavors: “Opflex” and “Non-Opflex.”298 ICA Operational 21
294 Refer to workpapers supporting Ex. PAO-05C: “Tesla stays on top of the California solar market,” dated June 6, 2018. The article shows that Tesla had 15.6% of the California Solar market in 2017, and that that share dropped by 50% since 2016. SCE interconnection data could be used to determine the share of installations from any DER aggregator on a given circuit. 295 Refer to workpapers supporting Ex. PAO-05C: Handout from University of California San Diego course on DER communications. 296 In the TY 2018 GRC, SCE requested adding three mid-circuit switches per circuit. Its current request includes one. See Ex. SCE-2, Vol. 4, Part 1, pp. 104-105. 297 SCE ICA handbook, https://ltmdrpep.sce.com/drpep/downloads/ICAUserGuide.pdf, p. 2. 298 There are actually five flavors of hosting capacity in SCE’s ICA: Uniform Generation and PV Solar, each
(continued on next page)

85
Flexibility is defined as “the amount of generation that can be installed without causing 1 reverse power flow at SCADA devices at the time the integration capacity analysis was 2
performed.”299 SCADA devices include the types of switches SCE proposes to add to 3
circuits through its distribution automation program.300 Given that reverse power flow 4
through any SCADA device depends on the level of DER output relative to load, there will 5 be situations were reverse flow occurs for segments near the end of a feeder, but not at the 6
feeder head in the substation.301 The addition of a new switch, for example at the midpoint 7
of a feeder, adds a new SCADA device to be evaluated for reverse power flow through ICA. 8 If the analysis at the new device indicates reverse power flow, the reported hosting capacity 9 will be reduced. This is reflected in SCE’s ICA data which shows lower Opflex values than 10
Non-Opflex values for nearly all circuit segments and load/generation profiles evaluated.302 11
Since SCE proposes distribution automation as mitigation for adverse impacts from high 12 levels of DER, it is not clear whether this calculated hosting capacity reduction is an 13 unforeseen flaw in the Commission approved ICA methodology, or a negative repercussion 14 of SCE’s GMP. 15
Section V.B.5. of this testimony discusses how SCE’s DER-driven Reinforcement 16 Study is used to justify SCE’s DER-driven load growth programs, and Section V.B.4. 17 describes how this methodology is similar to ICA. SCE’s DER-driven Reinforcement Study 18 includes an operational flexibility criteria to determine if upgrades are required due to DERs 19
both with and without Opflex and Uniform Load. SCE ICA handbook, https://ltmdrpep.sce.com/drpep/downloads/ICAUserGuide.pdf, p. 6. 299 SCE ICA handbook, https://ltmdrpep.sce.com/drpep/downloads/ICAUserGuide.pdf, p.16. 300 Ex. SCE-2, Vol. 4, Part 1, pp. 87 and 89, footnote 146. 301 This would occur if the load available to absorb the DER output is low at the feeder end, but increases moving back towards the feeder head such that load exceeds DER output for some portion of the feeder nearer to the substation. 302 This finding is based on the Public Advocates Office’s ad hoc review of SCE’s online ICA data, which has found no situations where Non-Opflex ICA values are higher than Opflex values. Given that Opflex adds an additional constraint to other ICA evaluation criteria, it is expected that Opflex values should equal Non-Opflex values in the limiting case and never exceed them.

86
on a specific circuit,303 and SCE’s DER-driven New Circuits program proposes to build ten 1
new distribution circuits in the current GRC period based on this purported operational 2
flexibility need.304 It appears based on the descriptions provided by SCE that the 3
operational flexibility criteria in the DER-driven Reinforcement Study are based on the 4 amount of DER on the entire feeder, not just a feeder segment, and the addition of additional 5 SCADA switches on the feeder does not impact the analysis. SCE should confirm this in 6 rebuttal. 7
The above discussion addresses a potential negative outcome of increased 8 sectionalizing of distribution circuits with respect to DERs. However, SCE’s testimony also 9 discusses the benefits of the additional monitoring point provided at each new SCADA 10 switch, and ultimately SCE’s justification for both its distribution automation and GMS 11
requests is based on claims that reliability benefits greatly exceed the upgrade costs.305 The 12
Public Advocates Office is not claiming that sectionalization in general, and SCE’s 13 distribution automation plan specifically, provides no benefits or benefits that are lower than 14 the cost of equipment required. However, the addition of additional SCADA switches 15 appears to reduce hosting capacity as reported in ICA data, and to indicate the need for 16 additional DER-driven new circuit projects that would not otherwise be required. Unless 17 SCE is able to demonstrate that this finding is incorrect, these negative impacts should be 18 considered in the evaluation of SCE’s distribution automation plans, its DER-driven project 19 requests, the use of ICA with Opflex in Rule 21, and in future revisions to ICA. 20
303 See SCE Workpapers, Ex. SCE-2, Vol. 4, Part 2, Chapter II, Book A, pp. 28-29. Also, SCE response to Public Advocates Office data request PubAdv-SCE-128-TCR, Q.1. 304 See Section V.B.8. of this testimony. 305 The claimed benefits of increased situational awareness provided by additional SCADA monitoring points is referenced throughout Ex. SCE-2, Vol. 4, Part 1, including the GMP in Appendix A. SCE’s claims regarding GMS and distribution automation benefit to costs are provided at pages 75 and 87 respectively. The Public Advocates Office has not reviewed these claims.


