Public 1 Ontario Transmission System Presentation to F&ASC April 16, 2003.
43
Public 1 Ontario Transmission System Presentation to F&ASC April 16, 2003
-
Upload
kelley-skinner -
Category
Documents
-
view
215 -
download
1
Transcript of Public 1 Ontario Transmission System Presentation to F&ASC April 16, 2003.

Public 1
Ontario Transmission System
Presentation to F&ASC
April 16, 2003

Public 2
Ontario Transmission System- Highlights
• Nine major internal interfaces
• Ten transmission zones
• Eight interconnection points with Manitoba, Minnesota, Quebec, Michigan & New York
• Generally, several transmission networks at 500 kV, 230 kV and 115 kV voltage levels

Public 3
Map of Ontario
ONTARIOMAJOR 500kV & 230kVLINE ROUTES & STATIONS
QUEBEC
Hamilton
MILTONSEAFORTHDETWEILER
MIDDLEPORT
RICHVIEW
CLAIREVILLE
HANOVER
ORANGEVILLE
Lake Simcoe
Barrie
Toronto
160km
LakeSuperior
Moose RiverJames Bay
WAWA
To The WEST ZONE (See box)
Sault Ste. Marie
MISSISSAGI
ALGOMA
HANMER
SMITH FALLS
MERIVALEST LAWRENCE
HINCHINBROOKE
CATARAQUI
HAWTHORNE
ST ISIDORE
Lake Timiskaming
MARTINDALE
SudburyNorth Bay
DOBBIN
WIDDIFIELD
BUCHANAN
London
SCOTT
SarniaLONGWOOD
CHATHAM
LAUZON
Windsor
CANADA
UNITED STATES
Lake Erie
Niagara Falls
Kitchener
Lake Huron
Georgian Bay PARRY SOUNDMUSKOKA
MINDEN
TO QUEBEC
Ottawa
Ottawa River
Kingston
BELLEVILLE
Peterborough
Lake Ontario
CANADA
UNITED STATES
LEASIDE
BEACH
Abitibi River
PINARD
Mattagami River
KAPUSKASING
ANSONVILLE
KIDD CREEKMETSITE
Timmins PORCUPINE
DYMOND
MINNESOTA
Red Lake
Lake St. Joseph Albany River
Trout Lake
KENORA
DRYDEN
Lac Seul
Sioux Lookout
Lake ofthe Woods
LakeNipigon
MACKENZIE
UNITED STATES
MARATHON
Manitouwadge
Geralston
Rainy RiverFORTFRANCES
WAWA
LakeSuperior
CANADA
LONGUEUIL
Lake Nipissing
LENNOX (F)
OWEN SOUND
LAKEHEAD
BROCKVILLE
TRAFALGAR
BURLINGTON
ESSA
CHERRYWOOD
THUNDER BAY
MICHIGAN
NEW YORK
Public 4
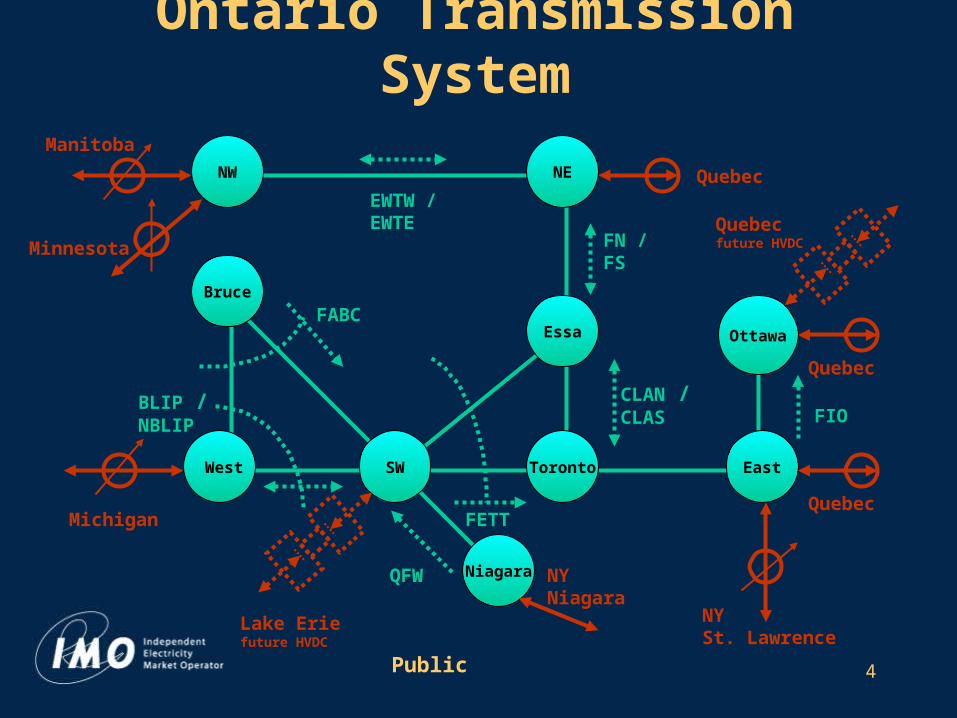
NW NE
Essa
TorontoSW East
Niagara
West
Bruce
NY Niagara
Michigan
NY St. Lawrence
Quebec
Quebec
Quebecfuture HVDC
FABC
EWTW /EWTE
CLAN /CLAS
FN /FS
BLIP /NBLIP
FETT
QFW
Minnesota
Manitoba
Ontario Transmission System
Ottawa
Quebec
FIO
Lake Eriefuture HVDC

Public 5
Definition of Interface/Interconnection
• Interface and Interconnection definitions are formed by grouping one or more circuits (lines) for the purpose of measuring their combined flow at specific points and enforcing a power flow limit in MW.

Public 6
Major Interfaces• East-West (EW) - EW Transfer East(EWTE) & EW
Transfer West (EWTW)
• Flow North (FN)/Flow South (FS)
• Claireville North (CLAN)/Claireville South (CLAS)
• Flow Away from Bruce Complex (FABC)
• Buchanan Longwood Input (BLIP)/Negative BLIP (NBLIP)
• Queenston Flow West (QFW)
• Flow East Towards Toronto (FETT)
• Transfer East from Cherrywood (TEC)
• Flow Into Ottawa (FIO)

Public 7
Interface Limit Characteristics
• ‘Base’ limit
• All transmission facilities are in-service
• Directional
• Certain outages result in a penalty in MW
• Respect thermal limitations
• Preserve system and/or plant stability and maintain acceptable post-contingency voltage
• Some limits simple constants; others more complex

Public 8
Interface Base Limits
Interface Operating Security Limits (MW) BLIP 3,500 NBLIP 1,500 QFW 1,750 Summer, 1,950 Winter FABC 4,050-4,450 with four Bruce B units in-service*
4,440-4,950 with five Bruce units in-service* 4,500-5,300 with six 500 kV Bruce units in-service*
FETT 5,700** CLAN 2,000 CLAS 1,000 FIO 1,900 FN 1,900 FS 1,400 EWTE 325 EWTW 350
Summer Limits apply from May 1 to October 31. Winter Limits apply from November 1 to April 30.
(*) Limit varies to according BLIP/NBLIP flow. Published limit range based on the most restrictive contigency.
(**) If the summer Ontario demand exceeds 21,400 MW the limit is penalized by (OD-21400)/3 MW

Public 9
EWTE/EWTW Interface
• Boundary between the NW and NE zones
• Power flows related to power flows with Manitoba & Minnesota
• EWTE limit - 325 MW - preserve system stability
• EWTW limit - 350 MW - preserve system stability & maintain acceptable pre-contingency voltages
• Power flows from NW to NE

Public 10
FN/FS Interface
• Boundary between the NE and Essa zones
• FN limit - 1,900 MW - maintain acceptable post-contingency voltages
• FS limit - 1,400 MW - preserve plant stability

Public 11
CLAN/CLAS Interface
• Boundary between the Essa and Toronto zones
• CLAN limit - 2,000 MW
• CLAS limit - 1,000 MW
• Limits define boundary conditions for other system limits

Public 12
FABC Interface
• Boundary between the Bruce zone and the West and Southwest zones
• Flows are out
• FABC limit - 4,050-4,450 MW 4 units; 4,440-4,950 MW 5 units; 4,500-5,300 MW 6 units
• Preserve system and/or plant stability & maintain acceptable post-contingency voltages
• Limit improvement with generation rejection

Public 13
BLIP/NBLIP Interface
• Boundary between the West zone and the Bruce and Southwest zones
• BLIP limit - 3,500 MW - preserve system and/or plant stability & maintain acceptable pre-contingency and post-contingency voltages
• NBLIP limit - 1,500 MW - maintain acceptable post-contingency voltages
• NBLIP limit dependent on Bruce, Lambton & Nanticoke and reactor switching availability

Public 14
QFW Interface
• Boundary between the Niagara and SW zones
• QFW limit - 1,750 MW Summer; 1,950 MW Winter - respect thermal limitations
• Real-time, limit determined by ambient weather conditions
• No limit for flows opposite to QFW direction
Public 15
FETT Interface
• Boundary between the SW zone and the Essa and Toronto zones
• FETT Limit - 5,700 MW - preserve system and/or plant stability & maintain acceptable voltages
• Limit dependent on Nanticoke, Lakeview, Darlington, Pickering & Lennox plus FS flow
• Summer limit dependent on Ontario Demand
• No limit for flows opposite to FETT direction

Public 16
TEC Interface
• Boundary between the Toronto and East zones
• No pre-defined limit

Public 17
FIO Interface
• Boundary between the East and Ottawa transmission zones
• FIO Limit - 1,900 MW - maintain acceptable post-contingency voltages
• Real-time limit improvement with load rejection
• No limit for flows opposite to FIO direction
• Quebec High Voltage Direct Current (HVDC) interconnection project - limit increase to 3,000 MW

Public 18
NW NE
Essa
TorontoSW East
Niagara
West
Bruce
NY Niagara
Michigan
NY St. Lawrence
Quebec
Quebec
Quebecfuture HVDC
3120 MW
240 MW
650 MW
615 MW
215 MW
2925 MW
1010 MW
Minnesota
Manitoba
Snapshot Flows Jan. 23, 2003 @ approx. 18:00 hrs
Ottawa
Quebec
1470 MW
Lake Eriefuture HVDC
325 MW

Public 19
NW NE
Essa
TorontoSW East
Niagara
West
Bruce
NY Niagara
Michigan
NY St. Lawrence
Quebec
Quebec
Quebecfuture HVDC
3115 MW
50 MW
1910 MW
935 MW
255 MW
3165 MW
315 MW
Minnesota
Manitoba
Snapshot Flows Jan. 23, 2003 @ approx. 3:30 hrs
Ottawa
Quebec
1245 MW
Lake Eriefuture HVDC
1775 MW

Public 20
NW NE
Essa
TorontoSW East
Niagara
West
Bruce
NY Niagara
Michigan
NY St. Lawrence
Quebec
Quebec
Quebecfuture HVDC
FABC
EWTW /EWTE
CLAN /CLAS
FN /FS
BLIP /NBLIP
FETT
QFW
Minnesota
Manitoba
Ontario Transmission System
Ottawa
Quebec
FIO
Lake Eriefuture HVDC

Public 21
Interconnections
• Ontario-Manitoba - Ontario-Manitoba Transfer East (OMTE) & Ontario-Manitoba Transfer West (OMTW)
• Ontario-Minnesota - Minnesota Power Flow North (MPFN) & Minnesota Power Flow South (MPFS)
• Ontario-Michigan

Public 22
Interconnections(Continued)
• Ontario-New York Niagara & Ontario-New York St Lawrence
• Ontario-Quebec North & Ontario-Quebec South
• Quebec & Lake Erie HVDCs (future installations)
• Most of Ontario’s non-radial interconnections are under phase angle regulator (PAR) control, except for New York Niagara and part of Michigan (today)

Public 23
Interconnection Limit Characteristics
• ‘Base’ limit
• All transmission facilities are in-service
• Directional
• Certain outages result in a penalty in MW
• Manitoba & Minnesota - PAR deadband margins recognized in limits
• Quebec - summer and winter limits

Public 24
Interconnection Limit Characteristics (Continued)
• Michigan & New York - range of summer and winter flow limits
• Respect thermal and/or stability limitations
• Real-time, thermal limitations determined by ambient weather conditions
• Ontario coincident import/export capability - many factors

Public 25
Interconnection Base Limits
InterconnectionLimit - Flows Out of Ontario
MWLimit - Flows Into Ontario
MW
Manitoba 275 324
Minnesota(3) 140 90
New York St. Lawrence 400 400
Quebec North – Summer* 95(5) 65
Quebec South (East and Ottawa) - Summer* 740 1,385
New York Niagara (60 Hz and 25 Hz) – Summer*(1) 700-1,800 1,000-1,300
Michigan – Summer*(2,3) 1,700-2,100 700-1,700
Quebec North – Winter* 110(4) 84
Quebec South (East and Ottawa) - Winter* 760 1,385
New York Niagara (60 Hz and 25 Hz) – Winter*(1) 1,000-2,000 1,200-1,500
Michigan – Winter*(2,3) 1,800-2,200 1,200-1,700

Public 26
Ontario-Manitoba & Ontario-Minnesota
Interconnections
• PAR controlled
• Imports & exports constrained by stability and thermal limitations
• OMTW limit - 275 MW; OMTE limit - 275 MW; SK1 115kV limit - 49MW
• MPFN limit - 90 MW; MPFS limit - 140 MW

Public 27
Ontario-Quebec North Interconnection
• Radial connection
• Imports & exports are constrained thermal limitations
• Summer limits - imports 65 MW; exports 95 MW
• Winter limits - imports 84 MW; exports 110 MW
Public 28
Ontario-Quebec South Interconnection
• Radial connection
• Imports are constrained by stability limitations and available Quebec generation
• Exports are constrained by stability and thermal limitations
• Summer limits - imports 1,385 MW; exports 740 MW
• Winter limits - imports 1,385 MW; exports 760 MW

Public 29
Ontario-New YorkSt. Lawrence Interconnection
• PAR controlled
• Imports & exports are constrained by thermal limitations
• Limit - imports 400 MW; exports 400 MW
Public 30
Ontario-New York Niagara Interconnection
• Free flowing
• Imports & exports are comprised of scheduled flows plus unscheduled parallel path flows
• A range of flow limits for different weather and generation dispatch conditions
• Lower flow limit - unfavourable operating conditions; constrained by thermal limitations

Public 31
Ontario-New York Niagara Interconnection (Continued)
• Higher flow limit - favourable operating conditions; constrained by thermal limitations
• Generally, import capability never fully utilized
• Summer limits - imports 1,000-1,300 MW; exports 700-1,800 MW
• Winter limits - imports 1,200-1,500 MW; exports 1,000-2,000 MW

Public 32
Ontario-Michigan Interconnection
• Partial PAR control & free flowing (today)
• Imports & exports are comprised of scheduled flows plus unscheduled parallel path flows
• Full PAR control (Summer 2003)
• Imports & exports are expected to more closely match scheduled flows
• Partial vs. full PAR control does not materially change the flow limits

Public 33
Ontario-Michigan Interconnection(Continued)
• A range of flow limits for different operating conditions
• Exports - lower flow limit - no generation rejection is armed at Lambton
• Imports - higher flow limit - low generation levels at Lambton and TransAlta - Sarnia
• Summer limits - imports 700-1,700 MW; exports 1,700-2,100 MW
• Winter limits - imports 1,200-1,700 MW; exports 1,800-2,200 MW
Public 34
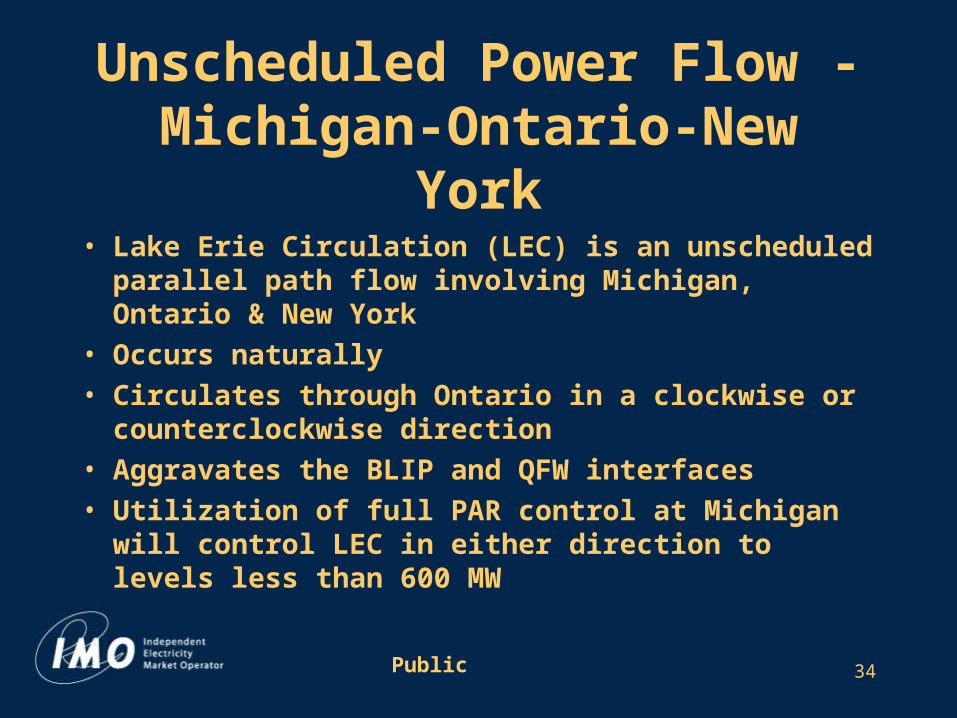
Unscheduled Power Flow - Michigan-Ontario-New York
• Lake Erie Circulation (LEC) is an unscheduled parallel path flow involving Michigan, Ontario & New York
• Occurs naturally
• Circulates through Ontario in a clockwise or counterclockwise direction
• Aggravates the BLIP and QFW interfaces
• Utilization of full PAR control at Michigan will control LEC in either direction to levels less than 600 MW

Public 35
Scheduled Power Flow - Michigan-Ontario-New York
• With partial PAR control at Michigan (MI), scheduled power flows across the MI and New York (NY) Niagara interconnections depend on system conditions
• When full PAR at MI is utilized, scheduled power flows with MI are more likely to be regulated across the MI interconnection
• This will alleviate unscheduled flows on the NY Niagara interconnection and in turn, allow scheduled flows with New York to be maintained

Public 36
NY - MichiganScheduled import example with partial
PAR control
Beck Generation = 1800Niagara load = 800QFW pre-load = 1000 QFW limit = 1750permissible inflow on NY interface = 750
Michigan Import Limit = 1700Michigan Import Schedule = 1700Michigan flow into Ontario = 1190+129 = 1319Michigan contribution on NY = 510
NY max additional import flow = 750 - 510 = 240NY max schedule = 240 / 0.65 = 369NY contribution on Michigan = 129 NY flow = 750
Import from NY & Michigan = 1700 + 369 = 2069
Michigan flow = 0.7 Michigan schedule + 0.35 NY schedule
NY flow = 0.3 Michigan schedule + 0.65 NY schedule

Public 37
Ontario Coincident Import/Export Capability
• With partial PAR control at MI, the coincident import/export capability is unlikely to equal the arithmetic sum of the individual flow limits
• When full PAR control is utilized, the coincident import/export capability could equal the arithmetic sum of the individual flow limits
Public 38
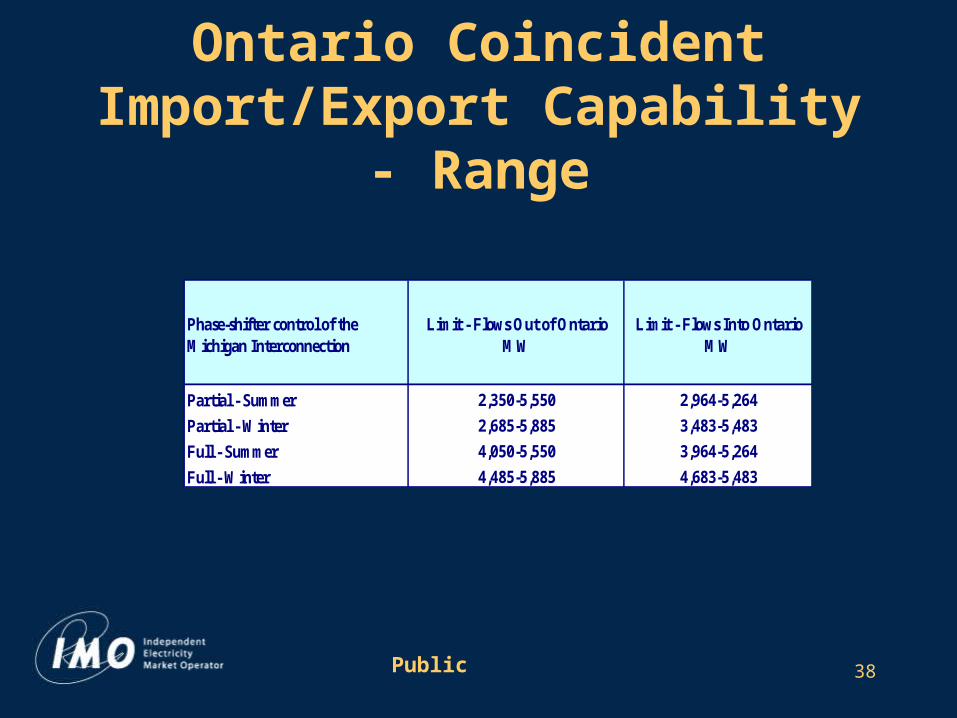
Ontario Coincident Import/Export Capability - Range
Phase-shifter control of the Michigan Interconnection
Limit - Flows Out of Ontario MW
Limit - Flows Into Ontario MW
Partial - Summer 2,350-5,550 2,964-5,264
Partial - Winter 2,685-5,885 3,483-5,483
Full - Summer 4,050-5,550 3,964-5,264
Full - Winter 4,485-5,885 4,683-5,483

Public 39
2,964 MW=324(MB)+90(MN)+400(NY St. Lawrence) +65(QC North)+1,385(QC South)+700(min. MI only)
3,964 MW=324+90+400+65+1,385+700(min. MI) +1,000 (min. NY Niagara)
5,264 MW=324+90+400+65+1,385+1,700(max. MI) +1,300 (max. NY Niagara)
Ontario Coincident Import/Export Capability - Example
Phase-shifter control of the Michigan Interconnection
Limit - Flows Into Ontario MW
Partial - Summer 2,964-5,264Full - Summer 3,964-5,264

Public 40
Ontario Coincident Import Capability
• Higher value in ranges achieved with low generation dispatch levels
• Generation levels rarely, if ever, materialize
• Expected Ontario coincident import capability is approximately 4,000 MW

Public 41
IMO Reports on Transmission Capacity
• Interface and interconnections limitations are identified in the IMO Security Status Report (SSR), Security and Adequacy Assessment Report (SAA) and 18-Month Outlook
• Different time periods covered
• Limitations identified as a penalty in MW
• Penalty is applied against the ‘base’ limit

Public 42
Example - SSR Report for April 11, 2003
Transmission InterfacesSystem Advisory/Summary Hourly Details H1-12 Hourly Details H13-24 Transmission Interfaces SAA
Notes
Internal Transmission Interface Limitations
FacilityPenaltyApplied
Date/TimeIssued
StartDate/Time
EndDate/Time
Comments
Positive BLIP -Positive BuchananLongwood Input
5002003/04/0815:08
2003/04/0617:00
2003/04/1211:00
C21J O/S
Negative BLIP -Negative BuchananLongwood Input
5002003/04/0815:08
2003/04/0617:00
2003/04/1211:00
C21J O/S
TEM - Transfer Eastof Mackenzie
752003/04/0114:42
2003/04/0707:00
2003/04/1106:00
K6F + X27A O/S
EWTE - East-WestTransfer East
502003/04/0114:42
2003/04/0707:00
2003/04/1106:00
K6F+X27A O/S
FETT - Flow East ToToronto
1502003/04/0414:51
2003/04/1013:00
2003/04/1105:00
Claireville T13 O/S
FETT - Flow East ToToronto
3502003/04/0116:13
2003/04/1105:00
2003/04/1118:00
Claireville T13 + C12R +Richview Terminal O/S
FETT Base limit=5,700MW; Limit=5,700-150-350=5,200MW
Public 43
End
![Bass Drums [Kompatibilitätsmodus] · Ascent Series – Bass Drums ASC 11 1814 BD WM ASC 11 2018 BD NM ASC 11 2218 BD NM (Black Chrome) ASC 11 2220 BD NM ASC 11 2418 BD NM 145 948](https://static.fdocuments.us/doc/165x107/6100da0fcb5bbe465e663480/bass-drums-kompatibilittsmodus-ascent-series-a-bass-drums-asc-11-1814-bd-wm.jpg)