
PTW and e-mobility€¦ · ADEME ICE in PTW Energyefficiency Exhaustemissions Dynamics ... 125...
14
PTW and e-mobility Environnemental impacts – PTW assets Environnemental impacts – PTW assets Nantes – FIM Europe – 2018 june 29th Bertrand-Olivier DUCREUX
Transcript of PTW and e-mobility€¦ · ADEME ICE in PTW Energyefficiency Exhaustemissions Dynamics ... 125...

PTW and e-mobility
Environnemental impacts – PTW assetsEnvironnemental impacts – PTW assets
Nantes – FIM Europe – 2018 june 29thBertrand-Olivier DUCREUX
Summary
ADEME
ICE in PTWEnergy efficiency
Exhaust emissions
Dynamics
Electric powertrains
2FIM Europe, Nantes 2018, june 29thwww.ademe.fr
Electric powertrainsStudying cars (life cycle analysis)
e-mobility
e-PTW assets

ADEME
No regulatory role (unlike US EPA for example)
French Agency for Environment & Energy management
3FIM Europe, Nantes 2018, june 29thwww.ademe.fr
No regulatory role (unlike US EPA for example)
A vocation for technical expertise (advisory)
Working on PTW environmental impacts since 2000

PTW : energy efficiency / fuel consumption
Compared to cars in daily urban use
8,0
10,0
12,0
14,0
4FIM Europe, Nantes 2018, june 29thwww.ademe.fr
Some high performance bikes have the same fuel consumption than small cars…
Sources : ADEME 2009 http://www.ademe.fr/sites/default/files/assets/documents/62817_two_wheelers.pdf
0,0
2,0
4,0
6,0
8,0
125 medium sizeengine
>950 cm3 diesel car urban car V6 sedan
l / 1
00 k
m

PTW : energy efficiency / fuel consumption
The result of 2 main factors
10,0%
15,0%
Estimation of powertrain energetic efficiency on "r eal-use" cycles
60
70
80
90
100
Real-use / mechanical energy at the wheel
on the studied path (Wh/km)
5FIM Europe, Nantes 2018, june 29thwww.ademe.fr
… but high performance ICE leads to low efficiency in daily usePTW are much smaller and lighter than cars…
Sources : ADEME 2009 http://www.ademe.fr/sites/default/files/assets/documents/62817_two_wheelers.pdf
0,0%
5,0%
spor
t/GT
>= 9
50
spor
t/GT
>= 9
50
spor
t/GT
>= 9
50
scoo
ter 1
25
road
ster
600
road
ster
600
spor
t/GT
>= 9
50
scoo
ter 4
00
seda
n 6c
yl a
uto
scoo
ter 1
25
scoo
ter 4
00
road
ster
600
scoo
ter 2
50
scoo
ter 1
25
scoo
ter 1
25
urba
n ga
solin
e
mot
orbi
ke 1
25
urba
n di
esel
Euro 2 Euro 3 Euro 3 Euro 2 Euro 3 Euro 2 Euro 3 Euro 3 Eur o 4 Euro 3 Euro 2 Euro 3 Euro 3 Euro 3 Euro 3 Euro 4 Euro 3 Euro 4
inj inj inj carbu inj inj inj inj inj inj inj inj inj inj inj inj c arbu inj
78 kW 78 kW 78 kW 8 kW 72 kW 72 kW 74 kW 29 kW 155 kW 11 kW 2 5 kW 53 kW 16 kW 12 kW 10 kW 55 kW 8 kW 66 kW
270 kg 270 kg 270 kg 190 kg 270 kg 270 kg 320 kg 310 kg 170 0kg
240 kg 270 kg 270 kg 230 kg 190 kg 240 kg 1130kg
190 kg 1250kg
0
10
20
30
40
50
60
125 midsize > 950 small car gasoline small car diesel big car V6

ICE PTW : exhaust emissions
The smaller the worst ?
Total mass of pollutants left in the atmosphere alo ng the "Linas-Musée d'Orsay" route
50
60
70
80
90
100
gram
s of
gas
eous
pol
luta
nts
Suburbs City Parking
387g
+38
/ -
32
195g
+57
/ -
60
current Euro threshold equivalence
6FIM Europe, Nantes 2018, june 29thwww.ademe.fr
Real use exhaust emissions : Euro3 PTW compared to Euro4 carsSource : ADEME 2009
2S 50cc scooter : higher PM (unregulated) than diesel w/o DPF
higher NOx than E5 or E6 diesel
Source : ADEME/CORTEA 2014 – IFSTTAR « EMI 2-4 : small L vehicles emissions »
0
10
20
30
40
50
mot
orbi
ke 1
25
scoo
ter
125
scoo
ter
>12
5
road
ster
600
spor
t/GT
>=9
50
urba
n ga
solin
e
seda
n ga
solin
e
urba
n di
esel
w/o
DP
F
mot
orbi
ke 1
25
scoo
ter
125
scoo
ter
>12
5
road
ster
600
spor
t/GT
>=9
50
urba
n ga
solin
e
seda
n ga
solin
e
urba
n di
esel
w/o
DP
F
mot
orbi
ke 1
25
scoo
ter
125
scoo
ter
>12
5
road
ster
600
spor
t/GT
>=9
50
urba
n ga
solin
e
seda
n ga
solin
e
urba
n di
esel
w/o
DP
F
CO HC NOx
gram
s of
gas
eous
pol
luta
nts
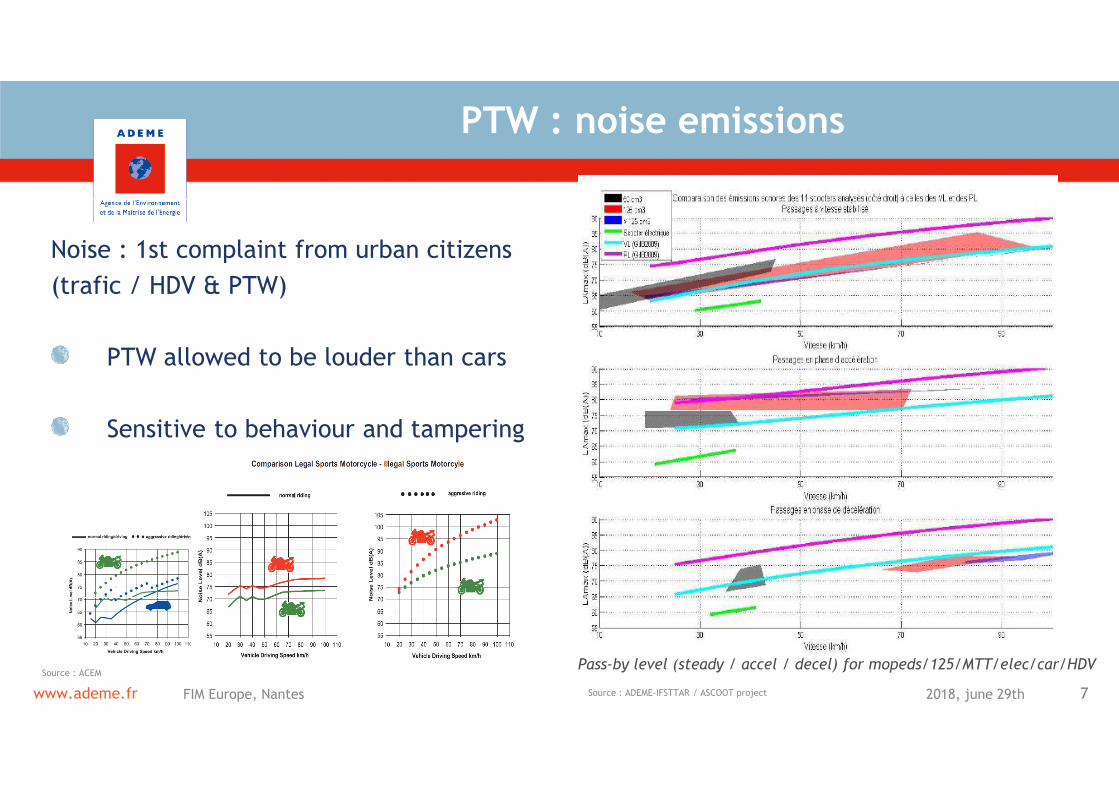
Noise : 1st complaint from urban citizens
(trafic / HDV & PTW)
PTW allowed to be louder than cars
PTW : noise emissions
7FIM Europe, Nantes 2018, june 29thwww.ademe.fr
Sensitive to behaviour and tampering
« passing by » noise level
Source : ADEME-IFSTTAR / ASCOOT project
Pass-by level (steady / accel / decel) for mopeds/125/MTT/elec/car/HDVSource : ACEM

ICE PTW : performance (max power / accel)
Accélération départ arrêté 2RM > 50 cm3 (1998-2010)
30
35
40
45400m DA1000m DA
MTL 125cm3~ 106 HP
Twingo60 hp
Cooper S175 hp
911385 hp
Gallardo530 hp
F 599670 hp
BugattiVeyron
8FIM Europe, Nantes 2018, june 29thwww.ademe.frSource : ADEME database / 2RM 1998-2010
0
5
10
15
20
25
0 50 100 150 200 250 300 350 400 450 500
Puissance massique (kW / tonne) conducteur inclus
chro
no (
s)
'
Power to weight ratio (kW/t) including driver

Total BEV energy close to diesel car (WtW)
• Despite higher powertrain efficiency
E-mobility
Detailed Life Cycle Analysis (for cars) : Energy
300000
350000
400000
450000
Tota
l p
rim
ary
en
erg
y c
on
sum
pti
on
Fuel production
Electricity production
9FIM Europe, Nantes 2018, june 29thwww.ademe.fr
Mainly due to :
• Low electricity production efficiency
• High share from battery manufacturing
Overall energy efficiency is not an asset…
But reduces dependence on oil
Total primary energy consumption for ICE vs electric cars
Source : ADEME 2016 « the potential of electric vehicles »
0
50000
100000
150000
200000
250000
Electric
Passenger Car
Diesel
Passanger Car
Gasoline
Passenger Car
Tota
l p
rim
ary
en
erg
y c
on
sum
pti
on
[MJ]
Vehicle assembly
Manufacture of battery
Manufacture of
components

Impact on air quality >> 0
• No NOx
• No VOC
• No PM from combustion
E-mobility
Detailed Life Cycle Analysis : environment
8
10
12
Ph
oto
che
mic
al o
zon
e c
rea
tio
n p
ote
nti
al
Vehicle use
Fuel production
Electricity production
10FIM Europe, Nantes 2018, june 29thwww.ademe.fr
• No PM from combustion
But
• Acidification potential
• Aquatic eutrophication potential
are
• Higher than ICE for manufacturing
• Comparable over the full lifecyclePhotochemical ozone creation potential for ICE vs electric cars
Source : ADEME 2016 « the potential of electric vehicles »
0
2
4
6
Electric
Passenger Car
Diesel Passanger
Car
Gasoline
Passenger Car
Ph
oto
che
mic
al o
zon
e c
rea
tio
n p
ote
nti
al
[kg
C2H
4-e
q]
Electricity production
Vehicle assembly
Manufacture of battery
Manufacture of
components
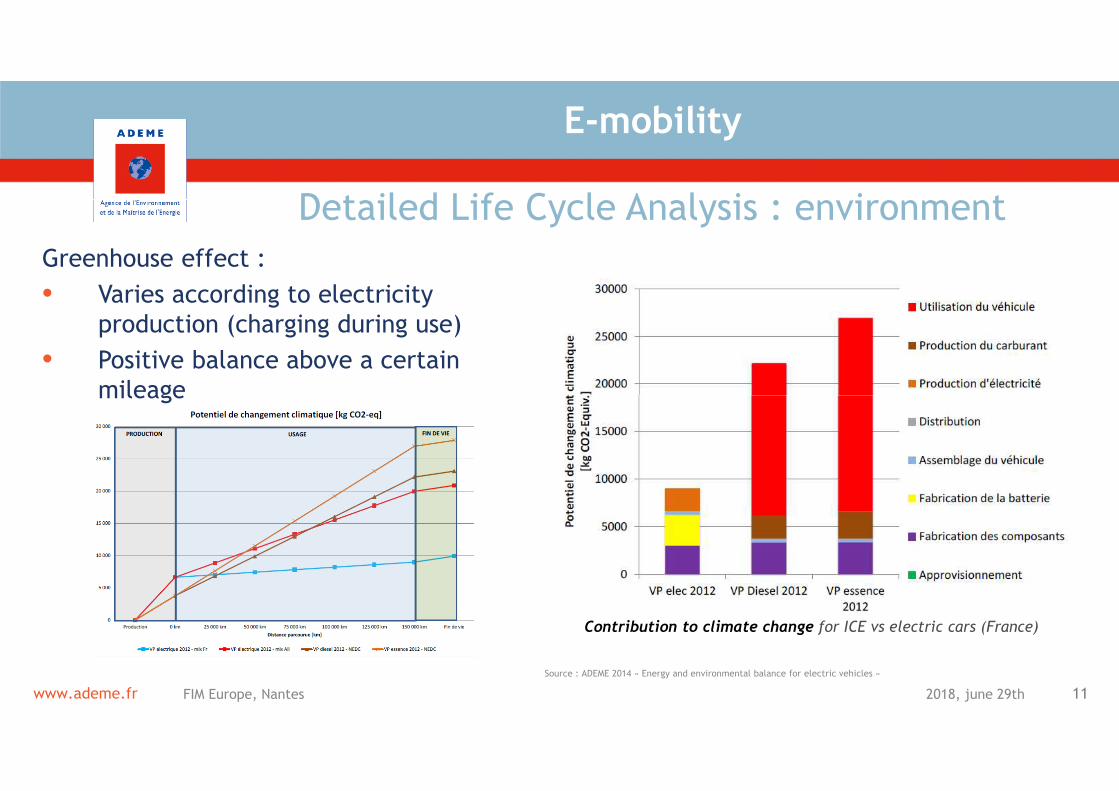
Greenhouse effect :
• Varies according to electricity
production (charging during use)
• Positive balance above a certain
mileage
E-mobility
Detailed Life Cycle Analysis : environment
11FIM Europe, Nantes 2018, june 29thwww.ademe.fr
mileage
Contribution to climate change for ICE vs electric cars (France)
Source : ADEME 2014 « Energy and environmental balance for electric vehicles »
• Most environmental impacts during manufacturing process (battery…)
• No local emissions, mid-term positive balance for climate change
The electric vehicle should be used
E-mobility
ADEME’s opinion
12FIM Europe, Nantes 2018, june 29thwww.ademe.fr
The electric vehicle should be used• In replacement of ICE vehicles (reduce local environmental impacts vs thermal engines)
• In situation where mileage is growing fast (compensate for manufacturing impacts, benefits
from lower economical use cost)
• With a battery capacity at the right size for the adressed mission profile
Electric vehicles fit in well in new « mobility services approach » (sharing)

Environmental impacts of ICE PTW much higher than ICE carsElectric powertrain advantages even more valuable (low noise, no local emissions)
Noise decorrelated from performance levelReduces user willingness for tampering (noise vs security may require communication…)
Smaller requirements for battery sizing vs cars (lighter and smaller vehicle,
e-PTW
Assets
13FIM Europe, Nantes 2018, june 29thwww.ademe.fr
Smaller requirements for battery sizing vs cars (lighter and smaller vehicle,
lower ICE autonomy in the market)Reduces the relative share of battery considering energy impacts, and economical cost
Performance w/o high consumption at low powerLower energy penalty in-use for high performance PTW
Higher transient performance than ICE (continuous rated power /max power)New dynamics on the market (ex : Zero or C-evo : MTL 11 kW with MTT acceleration)