PTPRT/D MUTATION OR PROMOTER METHYLATION: IMPLICATIONS...
97
PTPRT/D MUTATION OR PROMOTER METHYLATION: IMPLICATIONS FOR STAT3 INHIBITION by Noah David Peyser Bachelor of Science, Rensselaer Polytechnic Institute, 2011 Submitted to the Graduate Faculty of The University of Pittsburgh School of Medicine in partial fulfillment of the requirements for the degree of Doctor of Philosophy University of Pittsburgh 2015
Transcript of PTPRT/D MUTATION OR PROMOTER METHYLATION: IMPLICATIONS...

i
PTPRT/D MUTATION OR PROMOTER METHYLATION: IMPLICATIONS FOR STAT3 INHIBITION
by
Noah David Peyser
Bachelor of Science, Rensselaer Polytechnic Institute, 2011
Submitted to the Graduate Faculty of
The University of Pittsburgh School of Medicine in partial fulfillment
of the requirements for the degree of
Doctor of Philosophy
University of Pittsburgh
2015

ii
UNIVERSITY OF PITTSBURGH
SCHOOL OF MEDICINE
This dissertation was presented
by
Noah D. Peyser
It was defended on
June 5, 2015
and approved by
Daniel E. Johnson, PhD, Department of Medicine
Thomas E. Smithgall, PhD, Department of Microbiology & Molecular Genetics
Alexander Sorkin, PhD, Department of Cell Biology
Steffi Oesterreich, PhD, Department of Pharmacology & Chemical Biology
Dissertation Advisor: Jennifer R. Grandis, MD, Department of Otolaryngology

iii
Copyright © by Noah D. Peyser
2015

iv
Head and neck squamous cell carcinoma (HNSCC) is a morbid and frequently fatal malignancy
arising from the squamous epithelium of the upper aerodigestive tract. Survival rates have
remained low and stagnant in recent decades even as our understanding of this disease has led to
new treatment approaches, most notably the approval in 2006 of cetuximab, a monoclonal
antibody targeting the epidermal growth factor receptor. The paucity of broadly effective
targeted therapies for HNSCC patients illustrates the need for new targets for pharmacologic
inhibition and biomarkers for predicting exquisite response to such agents. STAT3 is a potent
oncogene that is hyperactivated by constitutive tyrosine phosphorylation in nearly all HNSCCs,
where STAT3 represents a rational target for inhibition. As it is increasingly clear that most
targeted therapies are unlikely to be broadly effective in unselected groups of patients, we have
sought to identify genetic/epigenetic alterations of phosphatases that normally downregulate
STAT3 in order to assess the potential utility of these alterations as predictive biomarkers for
STAT3-targeted therapeutics. Our findings reveal that somatic mutation or promoter
hypermethylation of PTPRT or PTPRD leads to loss of function of these phosphatases in
HNSCC, concomitant with increased activation of STAT3 in preclinical models and tumor
specimens. Importantly, these events are also associated with increased sensitivity to inhibitors
of the STAT3 pathway in preclinical models. Together, these studies indicate that genetic or
epigenetic alterations leading to loss of function of phosphatases that target STAT3 may
PTPRT/D MUTATION OR PROMOTER METHYLATION: IMPLICATIONS FOR STAT3 INHIBITION
Noah D. Peyser, PhD
University of Pittsburgh, 2015

v
ultimately serve as biomarkers for the selection of patients who will be most likely to respond to
STAT3 inhibitors that are currently in preclinical and clinical development.

vi
TABLE OF CONTENTS
PREFACE .................................................................................................................................. XII
1.0 INTRODUCTION ........................................................................................................ 1
1.1 POTENTIAL FOR TARGETING STAT3 IN HUMAN MALIGNANCY .... 1
1.1.1 Introduction to STATs .................................................................................... 1
1.1.2 Physiological Roles of STAT3 ......................................................................... 3
1.1.3 Role of STAT3 in Cancer ................................................................................ 6
1.1.3.1 Genomic and Epigenomic Deregulation of STAT3 in Cancer .......... 6
1.1.3.2 STAT3 in Cell Growth and Proliferation ........................................... 9
1.1.3.3 STAT3 in Apoptosis and Cell Survival ............................................. 10
1.1.3.4 STAT3 in Migration and Invasion .................................................... 11
1.1.3.5 STAT3 in the Tumor Microenvironment ......................................... 13
1.1.4 Overview of the Current STAT3 Inhibitors in Clinical Development ..... 14
1.1.5 Critical Analysis of the Potential use of STAT3 Inhibitors in the
Management of Human Malignancy ........................................................................ 16
1.1.6 Conclusions..................................................................................................... 19
2.0 FREQUENT MUTATION OF RECEPTOR PROTEIN TYROSINE
PHOSPHATASES PROVIDES A MECHANISM FOR STAT3 HYPERACTIVATION IN
HEAD AND NECK CANCER ................................................................................................... 20

vii
2.1 INTRODUCTION ............................................................................................. 20
2.2 MATERIALS AND METHODS ...................................................................... 22
2.2.1 Data Download and Analysis ........................................................................ 22
2.2.2 Cell Culture .................................................................................................... 23
2.2.3 Plasmid Constructs and Site-Directed Mutagenesis ................................... 23
2.2.4 Transient Transfection .................................................................................. 24
2.2.5 Retroviral Infection of HNSCC Cells .......................................................... 25
2.2.6 Western Blotting ............................................................................................ 26
2.3 RESULTS ........................................................................................................... 27
2.3.1 PTPR Genes are Frequently Mutated Across Cancers and PTPRT is the
Most Commonly Mutated Family Member ............................................................. 27
2.3.2 PTPR Mutations are Associated with Increased pSTAT3 Expression in
HNSCC Tumors and Cell Lines................................................................................ 29
2.3.3 PTPRT/D Mutations Dysregulate pSTAT3 Expression and
Growth/Proliferation in HNSCC Cells..................................................................... 32
2.3.4 PTPRT/D Mutation is Associated with Enhanced Sensitivity to STAT3
Pathway Inhibition in HNSCC Cells ........................................................................ 37
2.4 DISCUSSION ..................................................................................................... 39
3.0 FREQUENT PROMOTER HYPERMETHYLATION OF PTPRT INCREASES
STAT3 ACTIVATION AND SENSITIVITY TO STAT3 INHIBITION IN HEAD AND
NECK CANCER ......................................................................................................................... 43
3.1 INTRODUCTION ............................................................................................. 43
3.2 MATERIALS AND METHODS ...................................................................... 45
viii
3.2.1 Genomic and Proteomic Data and Analysis ................................................ 45
3.2.2 Methylation-Specific Polymerase Chain Reaction (MSP) ......................... 45
3.2.3 Cell Culture .................................................................................................... 46
3.2.4 5-Azacytidine (5-aza) and shRNA Treatment ............................................. 47
3.2.5 Western Blotting ............................................................................................ 47
3.2.6 Drug Treatment ............................................................................................. 48
3.2.7 Animals ........................................................................................................... 48
3.3 RESULTS ........................................................................................................... 49
3.3.1 Frequent PTPRT Promoter Hypermethylation Leads to Decreased PTPRT
mRNA Expression ...................................................................................................... 49
3.3.2 The PTPRT Promoter is Frequently Hypermethylated Across Human
Cancers ........................................................................................................................ 53
3.3.3 PTPRT Expression is Inversely Associated With STAT3 Activation in
HNSCC ........................................................................................................................ 55
3.3.4 PTPRT Promoter Methylation is Reversible, Leading to PTPRT-Specific
pSTAT3 Downregulation .......................................................................................... 57
3.3.5 PTPRT Promoter Methylation is Associated with Increased Sensitivity to
STAT3 Inhibition in HNSCC Cells .......................................................................... 58
3.3.6 PTPRD Promoter Hypermethylation or Gene Copy Number Alterations
are not Significantly Associated with PTPRD Loss of Function ........................... 62
3.4 DISCUSSION ..................................................................................................... 64
4.0 DISCUSSION ............................................................................................................. 68
BIBLIOGRAPHY ....................................................................................................................... 71

ix
LIST OF TABLES
Table 1. STAT3 inhibitors currently in clinical development according to clinicaltrials.gov ..... 14

x
LIST OF FIGURES
Figure 1. Domain architecture of STATs ....................................................................................... 2
Figure 2. Whole-exome sequencing of human cancers demonstrates high rates of PTPR somatic
mutations ....................................................................................................................................... 28
Figure 3. PTPR mutation is associated with increased pSTAT3 expression in HNSCC tumors and
cell lines ........................................................................................................................................ 31
Figure 4. PTPRT wild-type, but not a catalytic domain mutant, leads to decreased pSTAT3
expression ..................................................................................................................................... 33
Figure 5. PTPRD wild-type, but not mutants, leads to decreased pSTAT3 expression ............... 34
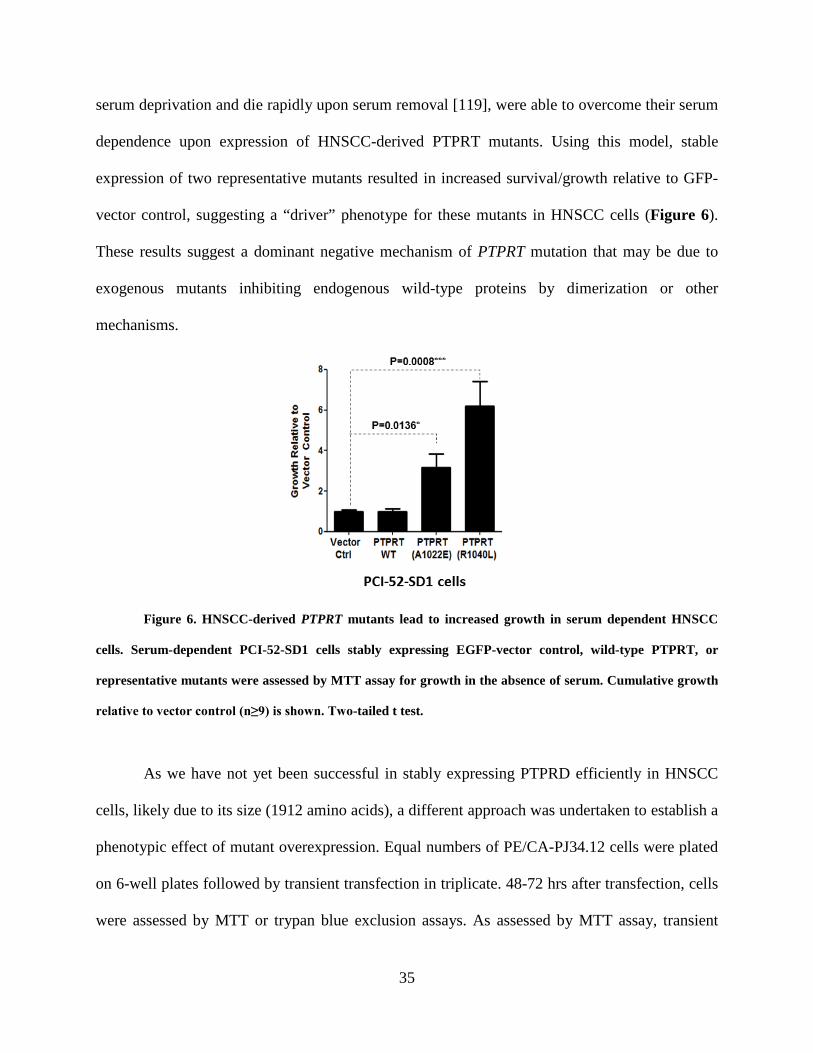
Figure 6. HNSCC-derived PTPRT mutants lead to increased growth in serum dependent HNSCC
cells ............................................................................................................................................... 35
Figure 7. HNSCC-derived PTPRD mutations lead to increased cell growth/proliferation in
HNSCC cells ................................................................................................................................. 36
Figure 8. PTPRT mutation is associated with increased sensitivity to the STAT3 pathway
inhibitor JSI-124 ........................................................................................................................... 38
Figure 9. HNSCC cells harboring an endogenous PTPRD mutation (PE/CA-PJ49) are more
sensitive to the STAT3 pathway inhibitor JSI-124 relative to representative PTPRD WT HNSCC
cells (PE/CA-PJ34.12) .................................................................................................................. 39

xi
Figure 10. Frequent PTPRT promoter hypermethylation is associated with downregulation of
PTPRT mRNA in HNSCC tumors ................................................................................................ 50
Figure 11. PTPRT copy number alterations are not significantly associated with altered mRNA
expression in HNSCC ................................................................................................................... 51
Figure 12. The PTPRT promoter is frequently methylated in an independent cohort of HNSCC
tumors ........................................................................................................................................... 52
Figure 13. The PTPRT promoter is frequently hypermethylated across cancer types in association
with downregulated PTPRT mRNA ............................................................................................. 54
Figure 14. PTPRT promoter methylation and mRNA expression are associated with pSTAT3
expression ..................................................................................................................................... 56
Figure 15. PTPRT promoter methylation is reduced by 5-azacytidine treatment, leading to
PTPRT-specific pSTAT3 downregulation in HNSCC cells ......................................................... 58
Figure 16. Increased PTPRT promoter methylation is associated with increased sensitivity to
STAT3 inhibition .......................................................................................................................... 60
Figure 17. Increased PTPRT promoter methylation is associated with increased sensitivity to the
JAK2 inhibitor LY2784544 .......................................................................................................... 61
Figure 18. HNSCC cells with high PTPRT promoter methylation are sensitive to STAT3
inhibition in vivo ........................................................................................................................... 62
Figure 19. The PTPRD promoter is not hypermethylated in HNSCC tumors compared with
adjacent normal mucosa ................................................................................................................ 63
Figure 20. PTPRD copy number alterations are frequent across cancers but are not associated
with PTPRD mRNA expression in HNSCC ................................................................................. 64

xii
PREFACE
List of Abbreviations:
5-aza 5-Azacytidine
AD Adenocarcinoma
ALK Anaplastic Lymphoma Kinase
AML Acute Myeloid Leukemia
ATCC American Type Culture Collection
bFGF Basic Fibroblast Growth Factor
BLCA Bladder Urothelial Carcinoma
BRCA Breast Invasive Carcinoma
CCLE Cancer Cell Line Encyclopedia
cdk Cyclin-Dependent Kinase
CESC Cervical Squamous Cell carcinoma and Endocervical Adenocarcinoma
COAD Colon Adenocarcinoma
CREB cAMP-response Element-binding Protein
CTD Carboxy-terminal Domain
DBD Deoxyribonucleic Acid Binding Domain
DMEM Dulbecco’s Modified Eagle’s Medium
DMSO Dimethyl Sulfoxide

xiii
DNA Deoxyribonucleic Acid
DNMT DNA Methyltransferase
ECM Extracellular Matrix
EGF Epidermal Growth Factor
EGFR Epidermal Growth Factor Receptor
EGFRvIII Epidermal Growth Factor Receptor Variant III
ESCA Esophageal Carcinoma
FBS Fetal Bovine Serum
FFPE Formalin-fixed, Paraffin-embedded
FGFR Fibroblast Growth Factor Receptor
FN3 Fibronectin Type III-like
GBM Glioblastoma Multiforme
GM-CSF Granulocyte-Macrophage Colony-Stimulating Factor
gp130 Glycoprotein 130
HBV Hepatitis B Virus
HER2 Human Epidermal Growth Factor Receptor 2
HNSCC Head and Neck Squamous Cell Carcinoma
IEC Intestinal Epithelial Cell
IFN Interferon
IgG Immunoglobulin G
IL-6 Interleukin-6
JAK Janus Kinase
K685 Lysine 685

xiv
KIRC Kidney Renal Cell Carcinoma
KIRP Kidney Renal Papillary Cell Carcinoma
LIHC Liver Hepatocellular Carcinoma
LUAD Lung Adenocarcinoma
LUSC Lung Squamous Cell Carcinoma
MMP Matrix Metalloproteinase
mRNA Messenger Ribonucleic Acid
MSP Methylation-specific Polymerase Chain Reaction
MTT 3-(4,5-dimethylthiazol-2-yl)-2,5-diphenyltetrazolium bromide
NF-κB Nuclear Factor Kappa-light-chain-enhancer of Activated B cells
NSCLC Non-small Cell Lung Cancer
OCT-1 Octamer Transcription Factor 1
PBS Phosphate-buffered Saline
PDB Protein Data Bank
PDGFR Platelet-derived Growth Factor Receptor
PDPN Podoplanin
PI3K Phophatidylinositol-4,5-bisphosphate 3-kinase
PIAS Protein Inhibitor of Activated STAT
PPID Protein-Protein Interaction Domain
pSTAT3 Phospho-Signal Transducer and Activator of Transcription (Tyrosine 705)
PTP Protein Tyrosine Phosphatase
PTPN Protein Tyrosine Phosphatase Non-Receptor-Type
PTPR Protein Tyrosine Phosphatase Receptor-Type

xv
PTPRT/D Protein Tyrosine Phosphatase Receptor-Types T and D
pY Phospho-tyrosine
RNA Ribonucleic Acid
RPPA Reverse-phase Protein Array
RTK Receptor Tyrosine Kinase
S727 Serine 727
SCC Squamous Cell Carcinoma
SH2 SRC-homology 2
shPTPRT shRNA Targeting PTPRT mRNA
shRNA Small Hairpin Ribonucleic Acid
shScr Sequence-scrambled shRNA Control
SOCS Suppressor of Cytokine Signaling
STAT Signal Transducer and Activator of Transcription
SUMO Small Ubiquitin-like Modifier
TCGA The Cancer Genome Atlas
TCPA The Cancer Proteome Atlas
TGF Transforming Growth Factor
TNF Tumor Necrosis Factor
VEGF Vascular Endothelial Growth Factor
WT Wild-type
WTX Wilms Tumor Gene on the X Chromosome Protein
Y705 Tyrosine 705

xvi
Portions of this dissertation were previously published in part or in whole as manuscripts I have
co-authored. They are reprinted here with permission.

1
1.0 INTRODUCTION
1.1 POTENTIAL FOR TARGETING STAT3 IN HUMAN MALIGNANCY
1.1.1 Introduction to STATs
The signal transducer and activator of transcription (STAT) family is group of ubiquitously
expressed proteins involved in a wide variety of cellular processes. Canonical STAT signaling
involves STAT monomers localized in the cytoplasm where they receive a wide variety of
specific upstream signals. Upon activation, STATs dimerize and translocate to the nucleus where
they activate transcription of specific target genes, ultimately leading to altered protein
expression and cellular phenotype. To date, seven STAT family members have been identified,
including STAT 1, 2, 3, 4, 5A, 5B, and 6, though multiple isoforms of each have also been
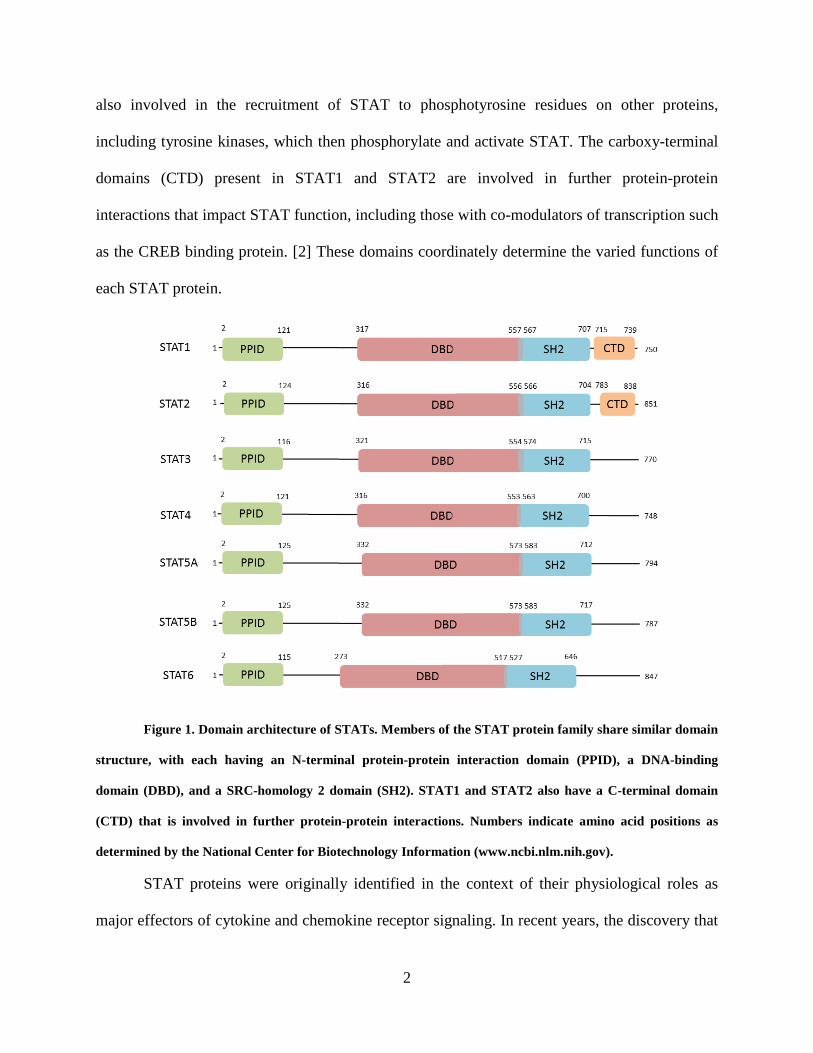
found. Each STAT protein includes several conserved domains that contribute to protein
function (Figure 1). The N-terminal protein-protein interaction domain (PPID) mediates
interaction between neighboring STAT proteins (or other co-regulatory proteins) and contributes
to cooperative binding of STAT dimers on DNA, leading to the formation of stabilized tetramers.
[1] This function, while non-essential for transcriptional activation, may contribute to enhanced
STAT3 signaling by prolonging DNA binding. The DNA-binding domain (DBD) is involved in
sequence-specific DNA binding, recruitment of co-activators, and the activation of transcription
of STAT3 target genes. The SRC-homology 2 (SH2) domain is the mediator of STAT
dimerization via reciprocal phosphotyrosine binding, a critical step for STAT activation. It is
2
also involved in the recruitment of STAT to phosphotyrosine residues on other proteins,
including tyrosine kinases, which then phosphorylate and activate STAT. The carboxy-terminal
domains (CTD) present in STAT1 and STAT2 are involved in further protein-protein
interactions that impact STAT function, including those with co-modulators of transcription such
as the CREB binding protein. [2] These domains coordinately determine the varied functions of
each STAT protein.
Figure 1. Domain architecture of STATs. Members of the STAT protein family share similar domain
structure, with each having an N-terminal protein-protein interaction domain (PPID), a DNA-binding
domain (DBD), and a SRC-homology 2 domain (SH2). STAT1 and STAT2 also have a C-terminal domain
(CTD) that is involved in further protein-protein interactions. Numbers indicate amino acid positions as
determined by the National Center for Biotechnology Information (www.ncbi.nlm.nih.gov).
STAT proteins were originally identified in the context of their physiological roles as
major effectors of cytokine and chemokine receptor signaling. In recent years, the discovery that

3
dysregulated STAT proteins are key modulators of human malignancy has driven research into
the functions of these proteins. It now appears that the contribution of STAT proteins to cancer,
especially overexpression and hyperactivation of STAT3, is crucial for the development and
progression of many cancers. As such, STAT3 is likely a promising target for the development
of inhibitors and is the focus of much ongoing research and drug development.
1.1.2 Physiological Roles of STAT3
Phosphorylation of STAT3 on tyrosine 705 (Y705) by various upstream kinases is critical for
STAT3 activation. [3] A large number of protein tyrosine kinases directly phosphorylate STAT3
on Y705, including cytokine and chemokine receptors and their co-activators. Well-studied
examples of such kinases include membrane integral receptor tyrosine kinases (RTKs) such as
the epidermal growth factor receptor (EGFR), fibroblast growth factor receptors (FGFRs), and
non-receptor tyrosine kinases that may or may not be associated with receptors such as Janus
kinase (JAK), SRC, and ABL. [3-6] Upon STAT3 activation, dimers directly bind DNA at
TT(N)4-6AA consensus sites and regulate transcription of specific target genes. [7] The binding
affinity of STAT3 for this region is determined by both the nucleotide sequence and cooperative
dimer-dimer interactions mediated by the amino-terminal PPID of STAT3. [7, 8] STAT3 activity
can be further modulated by phosphorylation of serine 727 (S727), though the context-specific
consequences of S727 phosphorylation remain incompletely understood. [9, 10] In addition,
STAT3 activity can be modified by reversible acetylation of lysine 685 (K685), an event that is
critical for the formation of stable STAT3 dimers and required for cytokine-induced STAT3-
mediated transcription. [11, 12]

4
Downregulation of STAT3 occurs by several mechanisms in normal biology. The
suppressor of cytokine signaling (SOCS) family of proteins, especially SOCS1 and SOCS3,
inhibit STAT3 in a cytokine-inducible manner by binding to and inhibiting upstream JAKs. [13,
14] Members of the protein inhibitor of activated STAT (PIAS) family, especially PIAS3, are
small ubiquitin-like modifier (SUMO)-E3 ligases that bind specifically to STAT3 and abrogate
its activity. [15] The SOCS and PIAS families together constitute major mechanisms by which
STAT3 activity is downregulated quickly following stimulation with specific cytokines under
normal conditions. Other proteins, including GRIM-19, can also abrogate STAT3 activity via
direct interactions. [16] Importantly, enzymatic removal of the phosphate group from Y705 of
STAT3 by protein tyrosine phosphatases (PTPs) can also occur. Like the upstream kinases, PTPs
that inactivate STAT3 can be membrane integral (PTPR family, including PTPRT and PTPRD)
or cytosolic (PTPN family, including PTPN2 and PTPN11). [17-20] Additionally, removal of the
acetyl group from K685 of STAT3 by deacetylases, including SirT1, can lead to STAT3
downmodulation. [21, 22] The intricacy and redundancy of the many mechanisms of STAT3
activation and deactivation illustrate the importance of maintaining tight control of the STAT3
pathway in normal biology.
Perhaps the field of normal biology in which STAT3 is most well-studied is that of
inflammation and the immune response. The actions of many cytokines and chemokines that led
to the discovery of the STAT family, especially IL-6 and interferon (IFN), are mediated
principally by STAT3 and are critical for proper immune function. STAT3 activation is triggered
in epithelial tissue and associated macrophages in response to IgG complex deposition or injury.
[23] In dendritic cells, the pro-inflammatory activity of IL-6 is mediated by transient activation
of STAT3 while the anti-inflammatory effects of IL-10 are due to more sustained STAT3

5
activation. [24] Interestingly, artificial early termination of IL-10 signaling leads to an IL-6-like
cellular response. [24] This rapid termination of IL-6 signaling appears to be mediated by
SOCS3, which is a STAT3 target gene upregulated by both IL-6 and IL-10 that can inhibit
signaling through the IL-6 receptor, but not the IL-10 receptor. [24] These findings suggest that
the divergent consequences of various signals upstream of STAT3 may in turn be determined by
the contribution of STAT3 inactivators that ultimately determine the duration of STAT3
signaling.
Increased STAT3 activity is also associated with wound healing. As many of the genes
involved in wound healing are also involved in oncogenesis, it is not surprising that STAT3
regulates many of the same genes in both of these processes. [25] After cutaneous wounding in
mice, IL-6 is upregulated in the epidermis primarily at the leading edge of the wound. [26]
Genetic knockout of Il-6 in mice leads to deficient cutaneous wound healing, with knockout
mice requiring up to three-fold longer to heal than wild-type mice. [26] Keratinocyte-specific
Stat3 knockout in mice leads to impaired skin remodeling that results from impaired epidermal
cell regeneration, confirming a central role for STAT3 in normal wound healing. [27] In the gut,
STAT3 activation in intestinal epithelial cells (IECs) regulates immune homeostasis. [28]
Colonic CD11c+ cells secrete IL-22 in response to Toll-like receptor activation, leading to
STAT3 activation in IECs and promoting wound healing, demonstrating that STAT3 is essential
for the wound healing process in a variety of tissues. [28]
STAT3 plays additional roles in several other normal cellular processes. For example,
STAT3 functions as the downstream effector of important hormones such as insulin and leptin in
both the brain and peripheral tissues, allowing for regulation of energy and metabolite
homeostasis. [29-32] STAT3 is also involved in autophagy, embryogenesis, proper thymic

6
function, mammary development, and other processes. [33-36] The importance of STAT3
activity in normal biology is demonstrated in part by the ubiquity of its tissue distribution.
STAT3 activation across these tissues is a transient event, and STAT3 is quickly downregulated.
When aberrations occur in the strict regulation of STAT3, malignancies can develop.
1.1.3 Role of STAT3 in Cancer
1.1.3.1 Genomic and Epigenomic Deregulation of STAT3 in Cancer The STAT3 protein is
overexpressed and/or hyperactivated in the majority of human cancers. [37] The prevalence of
STAT3 hyperactivation in cancer cannot be explained by mutational activation of STAT3 as
somatic mutation of the STAT3 gene in cancer is rare (1.1%; 64/5626 cancers analyzed to date by
whole exome sequencing by The Cancer Genome Atlas [TCGA]). [38] Instead, STAT3 is the
common effector of activating events affecting oncoproteins and deactivating events affecting
tumor suppressive proteins that ultimately lead to constitutive STAT3 activation. Dysregulation
of diverse pathways that converge on STAT3 allows the escape from strict regulation that
maintains transient STAT3 signaling in normal cell biology, leading to tumor-promoting cell
proliferation, survival, motility, invasion, and angiogenesis. In addition, activation of STAT3 is
associated with emergent resistance to targeted therapies and decreased patient survival. [39, 40]
Among the first observations that indicated the importance of STAT3 in cancer was the
phosphorylation of STAT3 by v-SRC, a known oncoprotein, and constitutive STAT3 tyrosine
phosphorylation and DNA-binding in several v-SRC-transformed cell lines. [41] Further study
revealed that STAT3 activation and specific gene regulation is required for SRC-mediated
transformation of NIH-3T3 cells, leading to the conclusion that activation of STAT3 signaling is
a critical component of malignant transformation. [42, 43] Additional studies generated similar

7
findings in diverse systems, providing a strong case for the central role of STAT3 in a wide array
of cancers. [39, 44-49] Years of continued research have convinced physicians and scientists of
the significance of STAT3 in cancer, and have elucidated many, though certainly not all, of the
mechanisms by which aberrant STAT3 signaling contributes to malignancy.
In addition to SRC, many kinases upstream of STAT3 activation are frequently altered in
cancer, leading to constitutive kinase and STAT3 signaling. In neuroblastoma, frequent point
mutation of the receptor tyrosine kinase ALK in the kinase domain (F1174L) leads to
constitutive activation of STAT3. [50] Forced expression of this mutant, but not wild-type ALK,
is sufficient to transform Ba/F3 cells, enables cytokine independent growth, and confers
sensitivity to the small molecule ALK inhibitor TAE684 in neuroblastoma cell line models. [50]
Further, in ALK-positive anaplastic large-cell lymphoma cells that overexpress of STAT3,
inhibition of ALK leads to downregulation of total and active STAT3. [51] Similar results have
been found for other kinase domain mutations, including the well-studied JAK2 mutation
V617F, which is primarily found in myeloproliferative disorders. [52, 53] Activation of JAK2
caused by this mutation leads to constitutive activation of STAT3 and is associated with reduced
survival in idiopathic myelofibrosis. [54, 55] Another mechanism of kinase-driven STAT3
activation in cancer is genomic amplification of kinase genes or RTK ligands with subsequent
protein overexpression, leading to enhanced activation of wild-type kinases. For example, gene
amplification of PDGFRA or EGFR in distinct subsets of glial tumors leads to enhanced
expression of the proteins encoded by these genes and activation of downstream signaling
events, including STAT3 phosphorylation. [56] Overexpression of RTK ligands, such as IL-6 or
TGF-α, can also lead to persistent STAT3 activation via autocrine signaling through their
receptors. [57, 58] Other genomic events and rearrangements can also lead to kinase and STAT3

8
activation, such as that observed for the EGFRvIII protein, a constitutively active EGFR variant
that is missing a large portion of the extracellular domain and exhibits impaired EGF binding.
EGFRvIII expression is sufficient to transform NR6 cells (murine fibroblasts) and is associated
with STAT3 activation and target gene expression. [59, 60]
Conversely, activation of STAT3 in human cancers can result from genomic or
epigenomic inactivation of proteins that normally downregulate STAT3 activity. In contrast to
the frequent activation of kinases by point mutation, deactivation of tumor suppressive proteins
by point mutation is relatively rare, though there are notable exceptions including deactivation of
TP53. Other examples include recently reported mutations in GRIM-19 that ablate its STAT3
inhibitory activity and promote tumor growth. [16] Many investigators have recently begun to
focus on epigenomic silencing of tumor suppressive proteins that normally downregulate
STAT3, especially by promoter hypermethylation. In lung cancer for example, SOCS3 is
frequently downregulated by promoter hypermethylation, and restoration of SOCS3 expression
in cells where it was previously silenced leads to downregulation of active STAT3, induction of
apoptosis, and suppression of cell growth. [61] As SOCS proteins have not been demonstrated to
inhibit kinases other than JAKs, inactivation of the SOCS family is unlikely to contribute
substantially to aberrant STAT3 signaling across cancer types. Indeed, SOCS1 is unable to
inhibit STAT3-mediated transformation of NIH-3T3 cells by v-SRC and does not reduce STAT3
target gene expression in this system. [62] Abnormal epigenomic alteration of other proteins that
normally cause direct inactivation of STAT3, especially protein tyrosine phosphatases, remains
incompletely understood and warrants further study. For instance, frequent methylation in the
promoter region of PTPN6 is strongly correlated with decreased PTPN6 mRNA expression and
increased pSTAT3 expression in immunodeficiency-related non-Hodgkin lymphoma (but not in

9
human immunodeficiency virus-related Burkitt lymphoma), demonstrating that epigenetic
silencing of a phosphatase targeting pSTAT3 can lead to STAT3 activation. [63] Additional
STAT3 suppressive proteins, including the glutathione S-transferase family member GSTP1,
which downmodulates EGF-mediated STAT3 signaling and expression of STAT3 target genes
via a direct interaction with STAT3, is promoter hypermethylated in HBV-associated
hepatocellular carcinoma and prostate cancer, and is subsequently downregulated. [64-66]
The diversity of genomic and epigenomic alterations in both activators and deactivators
of STAT3 signaling is in part responsible for the high degree of difficulty in developing
therapeutics that are applicable to a wide array of cancers and suggests that targeting STAT3
directly may prove more efficacious. The further understanding of the many mechanisms
contributing to aberrant STAT3 pathway activation may lead to the identification of biomarkers
that can be used to establish subsets of patients who will be most likely to respond to STAT3
inhibition.
1.1.3.2 STAT3 in Cell Growth and Proliferation STAT3 is a critical driver of dysregulated
cell growth in cancer, but not in normal cells. [67] Constitutive STAT3 signaling has been
implicated in aberrant cell growth and proliferation in many cancers, including head and neck
squamous cell carcinoma, colorectal carcinoma, melanoma, glioblastoma multiforme, multiple
myeloma, non-small cell lung cancer, and others. [58, 68-72] A critical mediator of cell growth
downstream of STAT3 is its target gene CCND1, encoding cyclin D1, which is upregulated
transcriptionally by active STAT3 and is required for STAT3-mediated transformation. [73]
Cyclin D1 in turn acts through cyclin-dependent kinase (cdk)-dependent and cdk-independent
mechanisms to allow passage through the G1 checkpoint of the cell cycle, ultimately leading to
continuous and unregulated cell growth and proliferation. [74] In addition, the STAT3 target

10
gene MYC, which itself encodes a transcription factor, also potently promotes cell growth and is
required for SRC-mediated cellular transformation via STAT3. [45]
Other target genes of STAT3 that contribute to cell growth and proliferation include
cytokines and growth factors that often act in an autocrine manner to further increase STAT3
signaling and/or other mitogenic pathways. It has recently been appreciated that non-traditional
gene products, including microRNA molecules that downregulate specific genes by binding to
specific mRNA transcripts, are also mediators of STAT3 mitogenic function. For example,
STAT3 is persistently active in Wilms tumor, a genetically heterogeneous childhood kidney
cancer, where it transcriptionally upregulates the microRNA miR-370, which in turn regulates
cell proliferation and tumorigenicity in mice. [75] Cells transfected with miR-370 exhibit
downregulation of the tumor suppressor WTX (Wilms tumor gene on the X chromosome
protein) via direct binding to the 3’-untranslated region of WTX mRNA, leading to its
degradation. [75] These cells also exhibit downregulation of the proteins p21Cip1 and p27Cip1
(which inhibit progress through the cell cycle) and upregulation of cyclin D1, illustrating
additional mechanisms downstream of STAT3 that contribute to its proliferative capacity. [75]
1.1.3.3 STAT3 in Apoptosis and Cell Survival Constitutive STAT3 activation leads to evasion
of apoptosis and a subsequent increase in cell survival. STAT3 transcriptionally regulates several
BCL-2 family members, including the anti-apoptotic proteins BCL-xL, BCL-2, and MCL-1. [76]
The BCL-2 family regulates apoptosis via homo/heterodimerization (the dynamics of which are
determined stoichiometrically) and translocation to the mitochondrial membrane, where they
ultimately regulate cytochrome c release and the initiation of apoptosis. STAT3-mediated
upregulation of BCL-xL, BCL-2, and MCL-1 contributes to apoptosis evasion in several cancers.
[76-78] STAT3-mediated BCL-2 expression in metastatic subclones of the parental cell line

11
MDA-MB435 (estrogen receptor-negative breast cancer) correlates with increased pSTAT3, but
not with other transcription factors that regulate BCL-2, and contributes to chemoresistance in
this cell line, suggesting that the anti-apoptotic effects of STAT3 contribute to treatment
resistance. [79] Furthermore, a small peptide, ST3-H2A2, which inhibits the function of the N-
terminal PPID of STAT3 induces the expression of multiple pro-apoptotic genes (and others) in
prostate cancer cells, suggesting that STAT3 inhibition may restore normal apoptosis. [80]
STAT3 target genes that are not themselves in the BCL-2 family can also contribute to
evasion of apoptosis. Octamer transcription factor-1 (Oct-1) has been reported to be a target gene
of STAT3 in esophageal squamous carcinoma cells (Eca-109), where STAT3 and OCT-1
coordinately regulate apoptosis. [39] In these cells, activation of STAT3 by IL-6 treatment
suppresses apoptosis as assessed by TUNEL staining, and knockdown of either STAT3 or Oct-1
by RNA interference enhances apoptosis. [39] Conversely, forced overexpression of OCT-1
(even in the presence of STAT3 knockdown) is sufficient to reduce apoptosis to similar levels as
IL-6 treatment, suggesting that STAT3-driven OCT-1 expression may be sufficient to reduce
apoptosis to minimal levels in these cells. [39] STAT3 and Oct-1 knockdown leads to increased
expression of pro-apoptotic BAX and BAD proteins, cytochrome c release from mitochondria,
subsequent cleavage of caspase-3 and -9, and decreased expression of anti-apoptotic BCL-2 and
BCL-xL proteins. [39] These findings provide a mechanism by which STAT3 hyperactivation
leads to positive feedback in the suppression of apoptosis in conjunction with its target gene Oct-
1.
1.1.3.4 STAT3 in Migration and Invasion Constitutively active STAT3 further contributes to
the cancer phenotype by promoting motility and invasion, including in human melanoma where
increased activation of STAT3 promotes metastasis to the brain. [81] The metastatic action of

12
STAT3 is in part mediated by matrix metalloproteinases (MMPs), a family of zinc-dependent
endopeptidases that are secreted into the extracellular matrix (ECM). There the MMPs degrade
ECM proteins, leading to facilitated cell migration, invasion through the basement membrane,
and ultimately the establishment of metastatic secondary tumors. The STAT3 target genes MMP-
2 and MMP-9 are upregulated in esophageal squamous carcinoma cells (Eca-109) that express
high pSTAT3, and STAT3 knockdown by RNA interference in these cells leads to
downregulation of MMP-2 and MMP-9, dysregulation of cell migration directionality, decreased
migration speed, and disorganization of F-actin formation, demonstrating a central role for
STAT3 in MMP-2/9-mediated cell motility. [39] In addition, activation of STAT3 is required for
maximal MMP-1 and MMP-10 induction in response to EGF in T24 bladder cancer cells, where
STAT3 is a critical mediator of malignant characteristics. [82]
Other mechanisms that contribute to STAT3-mediated cell migration have been
elucidated. For instance, EGFR activation via autocrine signaling in near-confluent, but not
sparse, squamous cell carcinoma cells leads to activation of STAT3 and subsequent
overexpression of the transmembrane glycoprotein podoplanin (PDPN). [83] This cell density-
regulated PDPN expression leads to increased cell migration and invasion, and these effects are
reversed by shRNA knockdown of PDPN. [83] Importantly, the observation of increased PDPN
extends to clinical samples, in which PDPN is overexpressed in basal cell layers at the invading
front of in situ SCC lesions, providing an additional clinically relevant mechanism by which
STAT3 contributes to motility and invasion. [83] Similarly, STAT3 is necessary for EGFR-
mediated migration and invasion in prostate carcinoma cells. [84] shRNA knockdown of STAT3
in Tu-2449 glioma cells additionally leads to decreased PDPN expression and microvilli

13
formation relative to vector infected cells. [85] Thus, inhibition of STAT3 may be an effective
strategy for preventing malignant transformation and metastasis in several human cancers.
1.1.3.5 STAT3 in the Tumor Microenvironment STAT3 is a critical regulator of the tumor
microenvironment. For example, STAT3 is the downstream effector of several cytokine
receptors that are involved in promoting angiogenesis, including those for vascular endothelial
growth factor (VEGF), basic fibroblast growth factor (bFGF), leptin, IL-6, and granulocyte-
macrophage colony-stimulating factor (GM-CSF). [86-89] In addition, STAT3 can promote
transcription of pro-angiogenic factors, including VEGF and IL-6, leading to paracrine and/or
autocrine feedback. [90-92] Cytokine excretion from tumor cells also act upon neighboring
endothelial cells to promote proliferation, migration, and microvascular tube formation, leading
to the development of mature blood vessels. The contribution of STAT3 activation to tumor
angiogenesis both in tumor cells and in endothelial cells suggests that inhibition of STAT3 may
be an efficient method for blocking angiogenesis and tumor progression.
STAT3 is also involved in inflammation-associated carcinogenesis, suppression of the
anti-tumor immune response, and maintenance of cancer stem cells. For example, NF-κB-
mediated expression of IL-6 and subsequent activation of STAT3 is required for survival and
evasion of apoptosis in intestinal epithelial cells during the development of colitis-associated
cancer, a serious complication of irritable bowel disease. [93, 94] Furthermore, STAT3 activity
is associated with reduced T cell infiltration in isogenic murine melanomas, suggesting a role for
STAT3 in suppressing anti-tumor immunity. [95] Inhibition of STAT3 in these tumor cells and
also in glioblastoma multiforme (GBM) cell models stimulates secretion of soluble factors,
including TNF-α and IFN-β, that ultimately lead to increased infiltration of lymphocytes, natural
killer cells, neutrophils, and macrophages, and also activate nitric oxide production from
14
macrophages in vivo and in vitro. [95, 96] In addition, genetic or pharmacologic inhibition of
STAT3 in GBM stem cells, even transiently, leads to a loss of multipotency and irreversible
growth arrest, suggesting that STAT3 is required for maintenance and proliferation of cancer
stem cells in this system. [97] Thus, several mechanisms exist by which STAT3 inhibition may
lead to tumor microenvironment disruption and subsequent regression.
1.1.4 Overview of the Current STAT3 Inhibitors in Clinical Development
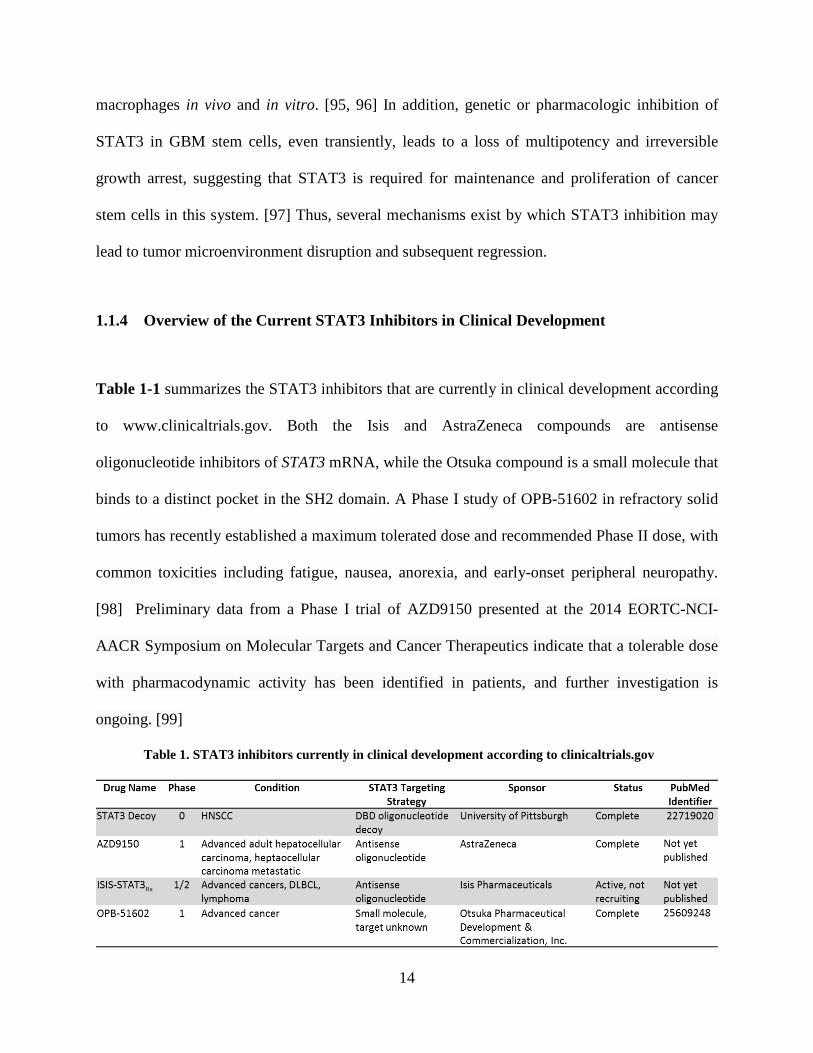
Table 1-1 summarizes the STAT3 inhibitors that are currently in clinical development according
to www.clinicaltrials.gov. Both the Isis and AstraZeneca compounds are antisense
oligonucleotide inhibitors of STAT3 mRNA, while the Otsuka compound is a small molecule that
binds to a distinct pocket in the SH2 domain. A Phase I study of OPB-51602 in refractory solid
tumors has recently established a maximum tolerated dose and recommended Phase II dose, with
common toxicities including fatigue, nausea, anorexia, and early-onset peripheral neuropathy.
[98] Preliminary data from a Phase I trial of AZD9150 presented at the 2014 EORTC-NCI-
AACR Symposium on Molecular Targets and Cancer Therapeutics indicate that a tolerable dose
with pharmacodynamic activity has been identified in patients, and further investigation is
ongoing. [99]
Table 1. STAT3 inhibitors currently in clinical development according to clinicaltrials.gov

15
For a full report of the completed STAT3 decoy Phase 0 trial and further development,
see [100]. The decoy, which was designed to bind to the STAT3 DBD and prevent STAT3
binding to STAT3 response elements in genomic DNA, consists of a 15-mer duplex
oligonucleotide with phosphorothioate caps at the 5’ and 3’ ends to enhance stability in vivo.
Intratumoral injection of this molecule immediately prior to surgical resection in HNSCC
patients led to decreased expression of STAT3 target genes relative to saline-injected tumors in a
Phase 0 trial, confirming the ability of the decoy to downregulate STAT3 signaling in human
tumors. Systemic administration of the decoy in a murine xenograft model failed to demonstrate
any effect on tumor growth or STAT3 signaling. One challenge presented by this approach was
the low stability of the decoy molecule in serum. To overcome this difficulty, modified decoys
were designed and tested. A circularized decoy consisting of the original decoy with two
hexaethylene glycol linkages demonstrated enhanced stability in serum, with detectable levels up
to 12 hours. Importantly, systemic administration of the cyclic decoy in murine xenograft models
by intravenous injection inhibited tumor growth and expression of STAT3 target genes,
demonstrating a successful strategy for inhibiting intratumoral STAT3 signaling via systemic,
rather than intratumoral, administration. The cyclic decoy has not yet been tested in humans, as
efforts are underway to further improve its preclinical pharmacodynamic and pharmacokinetic
parameters.
In addition to targeting STAT3 via its DNA-binding domain with an oligonucleotide
decoy, STAT3 may be targeted via its SH2 domain by small molecules, peptides, or
peptidomimetic compounds. [101-104] Such molecules are designed to disrupt STAT3
dimerization, thus preventing its translocation to the nucleus and transcription. Other inhibition
strategies include the introduction of antisense oligonucleotides (as in the case of the

16
Isis/AstraZeneca drug in clinical development) designed to cause degradation of STAT3 mRNA
or prevent its translation via complementary base paring, thereby reducing total STAT3 protein
levels. [105] Antisense strategies in particular will require exquisite tissue specificity, as they
may lead to reduced expression of STAT3 in normal tissues where its function is required.
Recent high throughput and in silico screens also have the potential to identify novel strategies
for targeting STAT3. [101, 106]
1.1.5 Critical Analysis of the Potential use of STAT3 Inhibitors in the Management of
Human Malignancy
In order for any protein to be the optimal target of inhibition for the treatment of cancer, it must
exhibit several characteristics. Inhibition of the target protein must lead to suprression of cell
growth/proliferation/survival, motility/invasion, and angiogenesis, and enhancement of the anti-
tumor immune response. The ideal target would also be applicable across a wide variety of
cancer types. The inhibition of STAT3 in preclinical models has demonstrated all of these
characteristics across a wide variety of cancers, most likely via reversal of the many mechanisms
discussed above, suggesting that STAT3 inhibitors may ultimately be of especially high impact
in treating human malignancy. Importantly, a Phase 0 trial has demonstrated that STAT3 can be
effectively targeted in human tumors, and further preclinical studies have suggested that
systemic delivery of STAT3 inhibitors is likely to be effective. [100] In addition, because
STAT3 signaling is transient in normal tissues and cells, the potential for adverse events
following systemic administration of a STAT3 inhibitor is minimal. Indeed, toxicology studies in
non-human primates demonstrate a lack of toxicity of a STAT3 decoy oligonucleotide. [107]
17
Many of the recently approved therapies for cancer target tyrosine kinases that are
upstream of STAT3 activation, among other pathways. It is thought that mutations in these
kinases would signify constitutive activation and serve as a biomarker for patients that will most
likely respond to these therapies. Unfortunately, there has been limited clinical success with
currently available inhibitors of these upstream kinases, though in some cases they do prove
extremely effective. Studies in preclinical models demonstrate that NSCLC cell lines with
mutations in select tyrosine kinases do not exhibit decreased STAT3 activation upon treatment
with the respective targeted small molecules erlotinib (EGFR), U0126 (MEK1/2), sunitinib
(PDGFRA), or crizotinib (MET), though other downstream effects of these inhibitors, including
downmodulation of PI3K signaling, does occur. [108] These findings support the notion that
directly targeting STAT3, rather than any large number of its upstream activators, may be more
efficacious in reversing the effects of constitutive STAT3 signaling.
Though some patients initially respond to targeted therapies, many develop
chemoresistance and secondary cancers that are associated with increased STAT3 signaling. For
example, hyperactivation of STAT3 is associated with resistance to EGFR-targeted therapies in
several cancers, including HNSCC, bladder cancer, and others. [40, 79] Biopsies of recurrent
HNSCC following treatment with cetuximab, an FDA-approved monoclonal antibody targeting
EGFR, exhibit elevated pSTAT3 relative to pre-treatment samples, suggesting that STAT3
inhibition may be effective at overcoming acquired resistance or as adjuvant therapy to prevent
recurrence. [40] Targeting STAT3 in bladder cancer cell lines that are resistant to cetuximab and
exhibit elevated levels of activated STAT3 relative to cetuximab-sensitive cell lines leads to
reduced cell viability and downregulation of STAT3 target genes. [40] Importantly, combination
of STAT3 inhibition with EGFR blockade significantly enhances antitumor effect in vivo relative
18
to EGFR blockade alone, suggesting that the efficacy of already existing (and approved) drugs
may be significantly increased by concomitant treatment with STAT3 inhibitors. [40] An
additional mechanism of acquired resistance to targeted therapy is the activation of IL-6
following treatment. For example, acquired resistance to trastuzumab (a monoclonal antibody
targeting the HER2/neu receptor) in HER2-positive breast cancer is associated with the
activation of an IL-6 inflammatory feedback loop in which downstream STAT3 signaling
contributes to cancer stem cell proliferation, providing additional rationale for co-targeting with
a STAT3 inhibitor. [109] Likewise, resistance to the tyrosine kinase inhibitor imatinib, which
targets the BCR-ABLBCR-ABL oncoprotein, in chronic myeloid leukemia cell models is also
associated with increased STAT3 activation and target gene expression. [110] Knockdown of
STAT3 by RNA interference in this context re-sensitizes the cells to imatinib-induced cell death,
suggesting that STAT3 inhibition may also be effective at overcoming targeted therapy
resistance in hematological malignancies. [110]
Certain challenges in the development of STAT3 inhibitors to date have been overcome.
Firstly, STAT3 and other transcription factors were widely regarded as undruggable mainly
because they are not exposed to the extracellular surface and do not have clear ligand-binding
domains that can be targeted for competitive inhibition. These perceived difficulties have proven
surmountable in the case of STAT3 in both preclinical and clinical models, with STAT3-
targeting agents effectively downmodulating the pathway and reversing its oncogenic effects. A
second obstacle in targeting STAT3 was its structural homology with STAT1, a family member
with tumor suppressive properties in many systems. This challenge has been overcome both with
oligonucleotide inhibitors (which exploit the exquisite specificity of the DNA-binding domain)
and with recent high-throughput in silico and in vitro screens of compound libraries to identify

19
candidates that specifically inhibit STAT3 and not STAT1. Both of these strategies may lead to
novel clinical therapeutics targeting STAT3 in the near future.
1.1.6 Conclusions
Recent advances in the understanding of STAT3 signaling and its role in cancer have led to the
establishment of STAT3 as a potential target for a wide variety of human malignancies. While
some clinical success has been found in the treatment of cancer with non-specific
chemotherapeutics and some targeted agents, there remains a large need for new classes of
inhibitors of novel targets that will be widely applicable, well-tolerated, and highly effective.
There is an additional need for the identification of predictive biomarkers of response to these
emerging agents. The sum of preclinical and clinical data to date supports a unique role for
STAT3 as one such target. Indeed, many therapeutic clinical successes thus far have been
associated with decreased STAT3 signaling, but because of the diversity of signaling
components upstream of STAT3, the high cost of developing inhibitors for each one, the
potential for emergent compensatory mechanisms, and the development of resistance to a given
therapy, a more effective strategy will likely be to directly target STAT3.

20
2.0 FREQUENT MUTATION OF RECEPTOR PROTEIN TYROSINE
PHOSPHATASES PROVIDES A MECHANISM FOR STAT3 HYPERACTIVATION IN
HEAD AND NECK CANCER
2.1 INTRODUCTION
Tyrosine phosphorylation regulates a multitude of cellular processes by coordinately activating
and inactivating signaling proteins. Aberrations of protein tyrosine phosphorylation and
signaling are a hallmark of oncogenic events found in most human cancers. The
phosphorylation/dephosphorylation of tyrosine residues on signaling proteins is directly
mediated by protein tyrosine kinases and phosphatases. Although many cellular factors are
known to dynamically control the activity of these enzymes, genetic alterations of kinases and
phosphatases in human cancers lead to perturbations in the levels of tyrosine phosphorylated
proteins, uncontrolled cell growth, and tumor formation. While activating mutations of tyrosine
kinases have been extensively studied [111, 112], cancer-associated mutations of tyrosine
phosphatases remain incompletely understood, partly due to the lack of comprehensive genomic
analysis of these large arrays of phosphatases, as well as their largely unknown and often
ambiguous actions in normal physiology and cancer biology.
Among the 107 known protein tyrosine phosphatases, the Receptor-like Protein Tyrosine
Phosphatases (PTPRs) represent the largest family of the human tyrosine phosphatome,

21
comprising 21 family members [113]. These PTPRs are believed to be crucial for the regulation
of inter- as well as intracellular signaling due to the cell surface localization of PTPRs. Selected
members of the PTPR family have been reported to function as tumor suppressors, where gene
mutation, deletion, or methylation may contribute to the cancer phenotype [113].
STAT3 is an oncogene and constitutive STAT3 activation is a hallmark of human
cancers. Activating STAT3 mutations are rare in all cancers studied to date, including HNSCC
[114]. While activating mutations of upstream receptor tyrosine kinases leading to increased
STAT3 phosphorylation characterize some malignancies (e.g. EGFR mutations in NSCLC
[115]), most cancers lack these alterations yet harbor elevated pSTAT3 levels. Importantly, it has
been reported that pSTAT3 serves as a substrate for wild-type PTPRT in colorectal cancer cells
(SW480 and HT29) and HEK293T cells [17]. pSTAT3 has additionally been reported to be a
substrate of PTPRD in glioblastoma models, suggesting that several PTPR family members may
exhibit tumor suppressive function by dephosphorylating STAT3 [20].
In the present study we hypothesized that mutation of PTPR family members, including
PTPRT and PTPRD, results in elevated expression levels of tyrosine phosphorylated STAT3 in
human HNSCC, and that these mutations may predict sensitivity to STAT3 pathway inhibitors in
preclinical and clinical development. PTPRT/D are two distinct genes that each code for distinct
phosphatases that directly target p-STAT3. Analysis of reverse phase protein array (RPPA) and
whole-exome sequencing data demonstrated significant association between PTPR mutation and
increased p-STAT3 expression levels in HNSCC. Studies in HNSCC models demonstrate that
PTPRT/D mutations induce pSTAT3 and HNSCC survival, consistent with a “driver” phenotype,
while computational modeling revealed functional implications of PTPR mutations on p-Tyr-
substrate interactions. Collectively, these studies establish first-time evidence of the de novo

22
signaling consequences of PTPR mutations on major oncogenic pathway that drives human
carcinogenesis. Analysis of whole-exome sequencing results of 374 primary (HNSCCs) revealed
that PTPR genes are mutated in nearly one-third (30.7%) of HNSCC tumors, compared to a
15.2% mutation rate in the PTPN family. This pattern is strikingly consistent across an additional
14 types of solid tumors, implicating a potentially important pathologic contribution of PTPR
mutations to human carcinogenesis. These cumulative findings suggest that genetic alterations of
selected PTPRs, including PTPRT/D, may induce STAT3 activation and serve as predictive
biomarkers for treatment with emerging STAT3 pathway inhibitors.
2.2 MATERIALS AND METHODS
2.2.1 Data Download and Analysis
Mutation, copy number alteration, and RNA-Seq data were aggregated from the cBio Portal and
published reports. [38, 116-118] DNA and protein sequences and domain annotations were
obtained from the National Center for Biotechnology Information
(http://www.ncbi.nlm.nih.gov). Reverse phase protein array data were obtained from The Cancer
Proteome Atlas (http://app1.bioinformatics.mdanderson.org/tcpa/_design/basic/index.html).
Statistical tests were performed using GraphPad Prism 5 (GraphPad, La Jolla, CA) or StatXact
(Cytel, Cambridge, MA) where noted.

23
2.2.2 Cell Culture
All HNSCC cell lines were genotypically verified by short tandem repeat DNA profiling.
Cal27 and FaDu cells were obtained from ATCC (Manassas, VA). PE/CA-PJ34.12 and PE/CA-
PJ49 cells were obtained from Sigma-Aldrich (St. Louis, MO). 686LN cells were obtained from
Georgia Chen at MD Anderson Cancer Center (Houston, TX). Cal33 cells were obtained from
Gerard Milano (Centre Antoine Lacassagne, Nice, France), and the PCI-52-SD1 cell line was
obtained by clonal selection of the parental PCI-52 cell line (University of Pittsburgh Cancer
Institute) by rounds of graded serum selection as described. [119] Cal27, Cal33, FaDu, and PCI-
52 cells were cultured in Dulbecco's modified Eagle's medium (DMEM) (Mediatech, Inc.,
Manassas, VA) supplemented with 10% fetal bovine serum (FBS) (Gemini Bio-Products, West
Sacramento, CA). 686LN cells were cultured in DMEM/F12 (Life Technologies, Grand Island,
NY) supplemented with 10% FBS. PE/CA-PJ34.12 and PE/CA-PJ49 were cultured in Iscove's
Modification of DMEM (Mediatech Inc., Manassas, VA) supplemented with 10% FBS and 2
mM L-glutamine (Life Technologies, Grand Island, NY). All cells were maintained in an
incubator at 37°C and 5% CO2.
2.2.3 Plasmid Constructs and Site-Directed Mutagenesis
pCl-Neo-PTPRT was obtained from Addgene (plasmid 16630, Cambridge, MA). pMXs-puro-
EGFP vector was obtained from Cell Biolabs (San Diego, CA). The PTPRT WT gene was
subcloned into the retroviral vector pMXs-puro, and the pMXs-puro-PTPRT WT was used as a
template for site-directed mutagenesis using the QuikChange site-directed mutagenesis kit
(Agilent Technologies, Santa Clara, CA) or Phusion site-directed mutagenesis kit (Thermo

24
Fisher Scientific, Waltham, MA) according to the manufacturer’s instructions. pcDNA3.1-
PTPRD and empty vector were obtained from Timothy Chan (MD Anderson Cancer Center,
Houston, TX) and used as a template for site-directed mutagenesis as above. E. coli clones were
grown on LB/agar plates containing the appropriate selection antibiotic. Three to five clones
were selected and grown in 5 mL of LB containing the appropriate antibiotic overnight, and
plasmid DNA was isolated using the QIAprep Spin Miniprep Kit according to the
manufacturer’s instructions (Qiagen, Hilden, Germany). Mutation sites were then verified by
Sanger sequencing. After identification of clones expressing the intended plasmids, 250 mL
cultures of the clones were established overnight prior to plasmid DNA isolation with the
Hurricane Maxi Prep Kit according to the manufacturer’s instructions (GerardBIOTECH,
Oxford, OH). Glyerol stocks of each culture were stored at -80°C for subsequent rounds of
plasmid amplification and isolation.
2.2.4 Transient Transfection
Cells were transfected using Lipofectamine 2000 (Life Technologies, Carlsbad, CA) or FuGENE
HD (Promega Corporation, Madison, WI) according to the manufacturer’s instructions. Cells
were plated at 250,000 cells per well in 6-well plates one day before transfection with 4 μg of
DNA diluted in 200 μL of Opti-MEM (Life Technologies, Carlsbad, CA) containing the
appropriate quantity oftransfection reagent. For Lipofectamine 2000 transfections, cells in
transfection medium were incubated at 37°C and 5% CO2 for 4 hrs before the medium was
replaced with complete growth medium containing 10% or 0% fetal bovine serum as
experimentally appropriate. For FuGENE HD transfections, the transfection mixture was added
25
directly to growth medium and left unchanged for the duration of the experiment. Cells were
then incubated as above for 48-72 hrs before analysis.
2.2.5 Retroviral Infection of HNSCC Cells
Retroviruses were generated using the Platinum Retrovirus Expression Systems (Cell Biolabs,
San Diego, CA) according to manufacturer’s instructions. Plat-A cells were transfected with 3 µg
of retroviral vector carrying the gene of interest (pMXs-puro-EGFP as control, pMXs-puro-
PTPRT WT, pMXs-puro-PTPRT mutants). Three days after transfection, fresh retroviruses (in
the supernatant of the Plat-A cells) were collected by centrifugation at 1,500 rpm for 5 mins at
4°C to pellet cell debris. Any cell debris left in the supernatant was removed by filtration through
a 0.45 µm syringe filter. Fresh retroviruses were immediately used for infection of HNSCC cells.
HNSCC cells were plated at ~20% confluency in a T75 flask one day before infection. Infection
of HNSCC cells was performed by adding 4.5 mL of fresh retrovirus to the culture flask
containing 7.5 mL of complete culture media. Then, 38 µL of polybrene (4 µg/µL stock solution,
Sigma-Aldrich, St. Louis, MO) was added to the cells with gentle mixing to improve infection
efficiency. Cells were then incubated at 37°C and 5% CO2 for an additional 48-72 hrs, after
which the infection medium was replaced with fresh complete medium. Infection efficiency was
estimated by visualization of GFP-expressing cells under a fluorescence microscope. Expression
of the gene of interest and alteration of the signaling pathway was assessed within 7-10 days of
infection by Western blot.

26
2.2.6 Western Blotting
Whole cell lysates were prepared in lysis buffer containing phosphatase and protease inhibitors
using cell scrapers and sonication followed by centrifugation to remove cell debris. Lysate
concentrations were determined with the Bio-Rad Protein Assay reagent (Bio-Rad Laboratories,
Inc., Hercules, CA). 40 μg of protein was mixed with the appropriate volume of 4X loading dye
containing β-mercaptoethanol and incubated in boiling water for 5 minutes. Samples were loaded
into 8-10% polyacrylamide gel containing sodium dodecyl sulfate and allowed to separate at
~125 V. Gels were blotted onto nitrocellulose membranes by semi-dry transfer at 21 V for 50
min. Blots were blocked in 5% milk for 1 hr at room temperature, then incubated with primary
antibody in 1% milk overnight at 4°C with agitation. The next day, primary antibody was rinsed
off, followed by incubation with horse radish peroxidase-conjugated secondary antibody in 5%
milk for 1 hr at room temperature. Blots were then imaged using Western Blotting Luminol
Reagent (Santa Cruz Biotechnology, Dallas, TX) and the ChemiDoc™ XRS+ System and Image
Lab™ software (Bio-Rad Laboratories, Inc., Hercules, CA). Primary antibodies for pSTAT3 and
STAT3 were purchased from Cell Signaling Technology, Inc. (Boston, MA; typical dilution
1:1000-1:3000). PTPRT antibody was produced by and obtained from Dr. Zhenghe Wang (Case
Western Reserve University, Cleveland, OH; typical dilution 1:500). β-tubulin primary antibody
was purchased from Abcam (Cambridge, MA; typical dilution 1:50,000). Secondary antibodies
were purchased from BioRad (Hercules, CA; typical dilution 1:1000-1:3000). All milk and
antibody solutions were made in tris-buffered saline containing Tween-20 at pH 7.6. Blots were
quantitated by densitometry using ImageJ software.
27
2.3 RESULTS
2.3.1 PTPR Genes are Frequently Mutated Across Cancers and PTPRT is the Most
Commonly Mutated Family Member
In order to understand the potential genetic contributions of the PTPR family to tyrosine
phosphorylation-mediated signaling and dysregulation in HNSCC, we comprehensively analyzed
PTPR family mutations in large cohorts of primary HNSCC tumors. Whole-exome sequencing
data of 374 primary HNSCCs were included. Strikingly, 30.7% (115/374) of HNSCC tumors
harbored non-synonymous somatic mutations of at least one PTPR family member, compared to
only 15.2% (57/374) of tumors with mutations of PTPN genes, which code for the cytoplasmic
PTPs that comprise the second major family of PTPs in the human genome (Figure 2A). Further,
7.8% (29/374) of HNSCC tumors contained multiple mutations of PTPR family members (from
2-6 PTPR mutations per tumor; Figure 2B), suggesting a potentially significant contribution of
PTPR family mutations in this context. Further investigation demonstrated that this high rate of
somatic mutation of the PTPR family (relative to the PTPN family) found in HNSCC is also
detected in all 14 types of human solid tumors analyzed (4039 total solid tumors sequenced by
TCGA at time of analysis), but not in a hematopoietic malignancy (6/196 AML cases; 3.1%)
(Figure 2C), suggesting that PTPR mutation may substantially contribute to many types of solid
tumors.
The availability of comprehensive whole-exome sequencing data (from TCGA) on all
PTPR genes allowed us to identify the most commonly mutated PTPR family members in all
sequenced human cancers, including HNSCC. Among the 374 sequenced HNSCC tumors,
PTPRT is the most frequently mutated PTPR (5.6% of cases; 22 mutations total, with one tumor

28
harboring 2 PTPRT mutations), followed by PTPRD, PTPRC, and PTPRM, each mutated in
3.7% of cases. Missense mutation sites in each of the corresponding proteins are depicted in
Figure 2D. Although PTPR mutation rates vary among different cancer types, cumulative results
reveal that PTPRT is the single most commonly mutated PTPR in human cancers (6.2%, 285
mutations in 4609 solid and hematopoietic cancers sequenced), with the highest mutation
frequency of PTPRT in cutaneous melanoma (a total of 99 mutations in 253 tumors sequenced;
39.1%).
Figure 2. Whole-exome sequencing of human cancers demonstrates high rates of PTPR somatic
mutations. A) Frequencies of PTPR and PTPN somatic mutations in 374 HNSCC tumors. B) A subset (29/374,
7.8%) of HNSCC tumors harbor mutations of multiple PTPR genes. C) The PTPR gene family is mutated at a

29
higher rate than the cytoplasmic PTP gene family across 15 cancers). Glioblastoma Multiforme (GBM);
Adenocarcinoma (AD); Squamous Cell Carcinoma (SCC), Acute Myeloid Leukemia (AML). D) Mutation and
domain-mapping of the 4 most frequently mutated PTPRs in HNSCC. Domains defined as in the Swiss-Prot
entries, Protein Knowledgebase, UniProtKB.
Cumulative mutation data for PTPRT in 16 types of sequenced tumors indicates that
37.9% (108/285) of PTPRT mutations are found in the catalytic phosphatase domain, while
33.0% (94/285) occur in the extracellular fibronectin type III-like (FN3) domain. In HNSCC,
45.5% (10/22) of PTPRT mutations are located in the catalytic domain, indicating the potential
pathologic relevance of these genetic alterations leading to loss of phosphatase activity or
substrate recognition.
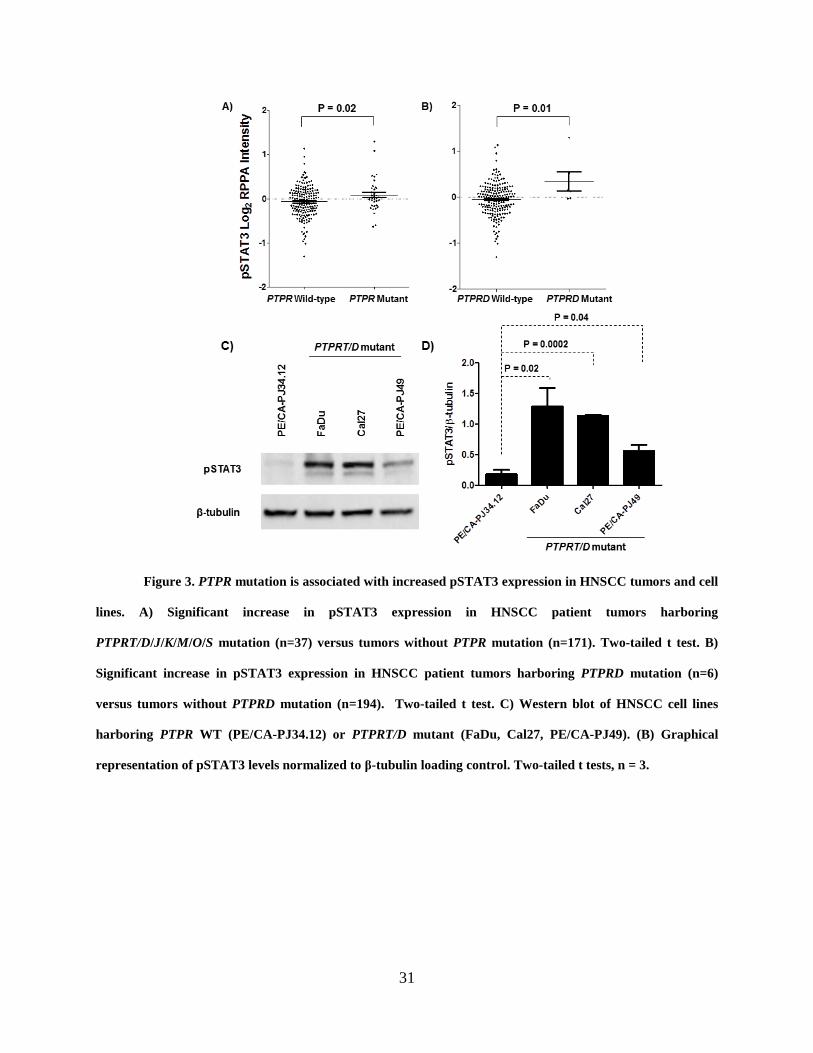
2.3.2 PTPR Mutations are Associated with Increased pSTAT3 Expression in HNSCC
Tumors and Cell Lines
Using whole-exome sequencing and RPPA data available from TCGA and The Cancer Proteome
Atlas (TCPA, a resource for accessing proteomic data from tumors previously analyzed by
TCGA), we sought to determine if mutation of PTPR family members with putative tumor
suppressive functions is associated with elevated pSTAT3 expression in HNSCC tumors. A
literature review identified 7 PTPR family members (types T, D, J, K, M, O, and S) that have
consistently been reported as tumor suppressors without also having been reported as oncogenic
in alternate systems. Examination of 212 primary HNSCC tumors showed that tumors harboring
mutations in PTPR tumor suppressor genes expressed significantly higher levels of pSTAT3
compared to tumors with wild-type PTPR family members (P = 0.02; Figure 3A). When each
family member is instead analyzed individually, only PTPRD mutation is significantly associated

30
with increased pSTAT3 in HNSCC tumors (P = 0.01; Figure 3B), suggesting that these
mutations may have a particularly profound signaling effect.
We next sought to determine if this trend held true in HNSCC cell lines that harbor
endogenous PTPRT/D mutations as determined by the Cancer Cell Line Encyclopedia (CCLE).
[120] We identified three HNSCC cell lines with such mutation: FaDu harboring PTPRT
p.E985K, Cal27 harboring PTPRD p.S387L, and PE/CA-PJ49 harboring PTPRD p.I1821V.
Western blot analysis revealed that these PTPRT/D mutant cell lines all express significantly
greater pSTAT3 than does a cell line with no PTPR gene family mutations (PE/CA-PJ34.12;
Figure 3C and 3D). These findings suggest that these cell lines may represent sufficient models
for further investigation of the contribution of PTPRT/D mutation to STAT3 signaling and
sensitivity to STAT3 inhibition.
31
Figure 3. PTPR mutation is associated with increased pSTAT3 expression in HNSCC tumors and cell
lines. A) Significant increase in pSTAT3 expression in HNSCC patient tumors harboring
PTPRT/D/J/K/M/O/S mutation (n=37) versus tumors without PTPR mutation (n=171). Two-tailed t test. B)
Significant increase in pSTAT3 expression in HNSCC patient tumors harboring PTPRD mutation (n=6)
versus tumors without PTPRD mutation (n=194). Two-tailed t test. C) Western blot of HNSCC cell lines
harboring PTPR WT (PE/CA-PJ34.12) or PTPRT/D mutant (FaDu, Cal27, PE/CA-PJ49). (B) Graphical
representation of pSTAT3 levels normalized to β-tubulin loading control. Two-tailed t tests, n = 3.

32
2.3.3 PTPRT/D Mutations Dysregulate pSTAT3 Expression and Growth/Proliferation in
HNSCC Cells
We next sought to directly test the effects of overexpression of wild-type (WT) PTPRT/D or
mutant constructs in HNSCC cells. First, PCI-52-SD1 cells (with unknown PTPR mutation
status) were stably infected with WT PTPRT and analyzed by Western blot (Figure 4A). A
significant downregulation of pSTAT3 was observed in PTPRT-infected cells indicating that
PTPRT is capable of regulating pSTAT3 activation in HNSCC cells. Conversely, transient
overexpression of an HNSCC-derived PTPRT mutant (A1041E, localized in the catalytic
domain) in Cal33 cells (with no PTPR family mutations) results in increased pSTAT3 expression
relative to WT-expressing cells, suggesting that this mutation results in loss of catalytic function
(Figure 4B). Interestingly, overexpression of another HNSCC-derived mutant (P497T, localized
in the extracellular domain) does not result in increased pSTAT3 expression relative to WT in
the same context. This may suggest that mutations located in the extracellular region of the
PTPRT may not manifest through altered catalytic activity, but rather through alternative
mechanisms such as altered cell-cell interaction, cell adhesion, motility and/or invasion.

33
Figure 4. PTPRT wild-type, but not a catalytic domain mutant, leads to decreased pSTAT3
expression. A) Stable expression of WT PTPRT reduced basal pSTAT3 expression in PCI-52-SD1 cells.
Graph showing cumulative results of from 5 independent experiments. Two-tailed t test. D) Cal33 cells were
transiently transfected with a representative catalytic domain mutation (A1022E) or FN3-domain mutation
(P497T).
Similar experiments were then performed to test if PTPRD and its HNSCC-derived
mutants are similarly able to regulate pSTAT3 expression. Upon transient overexpression of WT
PTPRD in Cal27 cells (with endogenous PTPRD mutation), a significant reduction in pSTAT3
expression is observed by Western blot (Figure 5A), indicating that PTPRD also has the ability
to regulate pSTAT3 in HNSCC cells. A similar reduction in pSTAT3 expression is also observed
after transient overexpression of WT PTPRD in PE/CA-PJ34.12 cells (with no PTPR family
mutations) (Figure 5B), demonstrating a consistent effect in an additional HNSCC cell line.
Transient overexpression of five representative HNSCC-derived PTPRD mutants in this cell line
conversely leads to no significant reduction in pSTAT3 expression relative to vector control,
with the exception of one mutant (L1147F). Interestingly, only one of these mutants (K1502M)
is located in the catalytic domain, suggesting that even those mutations that are located in the

34
extracellular region can affect the catalytic function of PTPRD. While these mutations likely
manifest through allosteric mechanisms, the current lack of a solved crystal structure of the
PTPRD extracellular domain precludes a more thorough mechanistic analysis.
Figure 5. PTPRD wild-type, but not mutants, leads to decreased pSTAT3 expression. (A)
Overexpression of WT PTPRD in a PTPRD-mutant cell line (Cal27) leads to decreased pSTAT3 expression.
Two-tailed t test. (B) PTPRD-wild-type HNSCC cells (PE/CA-PJ34.12) transiently overexpressing mutant
PTPRD exhibit increased pSTAT3 expression relative to wild-type-expressing cells. Two-tailed t test.
Having now established that PTPRT/D mutations lead to increased pSTAT3 activation in
HNSCC cells, we next tested whether this activity leads to phenotypic changes associated with
cancer progression. First, we tested whether PCI-52-SD1 cells, which are exquisitely sensitive to
35
serum deprivation and die rapidly upon serum removal [119], were able to overcome their serum
dependence upon expression of HNSCC-derived PTPRT mutants. Using this model, stable
expression of two representative mutants resulted in increased survival/growth relative to GFP-
vector control, suggesting a “driver” phenotype for these mutants in HNSCC cells (Figure 6).
These results suggest a dominant negative mechanism of PTPRT mutation that may be due to
exogenous mutants inhibiting endogenous wild-type proteins by dimerization or other
mechanisms.
Figure 6. HNSCC-derived PTPRT mutants lead to increased growth in serum dependent HNSCC
cells. Serum-dependent PCI-52-SD1 cells stably expressing EGFP-vector control, wild-type PTPRT, or
representative mutants were assessed by MTT assay for growth in the absence of serum. Cumulative growth
relative to vector control (n≥9) is shown. Two-tailed t test.
As we have not yet been successful in stably expressing PTPRD efficiently in HNSCC
cells, likely due to its size (1912 amino acids), a different approach was undertaken to establish a
phenotypic effect of mutant overexpression. Equal numbers of PE/CA-PJ34.12 cells were plated
on 6-well plates followed by transient transfection in triplicate. 48-72 hrs after transfection, cells
were assessed by MTT or trypan blue exclusion assays. As assessed by MTT assay, transient

36
overexpression of WT PTPRD leads to significantly decreased cell growth relative to vector
control (Figure 7A). For all PTPRD mutants tested, this growth suppression was not observed,
again suggesting these mutations are loss of function events. This result was confirmed with two
representative mutants by trypan blue exclusion assay (Figure 7B). These results are consistent
with the observed effects on pSTAT3 expression following transient overexpression (Figure
5B), with the exception of the L1147F mutation. While expression of this mutation leads to
decreased pSTAT3 expression, it does not also lead to decreased growth. This is likely an
example of a mutation that manifests through alternative mechanisms that are independent of
STAT3.
Figure 7. HNSCC-derived PTPRD mutations lead to increased cell growth/proliferation in HNSCC
cells. (A) Cell growth was assessed by MTT assay 48 hrs after transfection and normalized to vector-
transfected controls. One-way ANOVA P = 0.0007. Depicted P values represent the results of pairwise two-
tailed unpaired t tests. The experiment was performed three times with similar results. (B) Cell proliferation
was assessed by trypan blue exclusion assay 72 hrs after transfection. One-way ANOVA P < 0.0001. Depicted
P values represent the results of pairwise two-tailed unpaired t tests.

37
Together, these experiments demonstrate that PTPRT/D are capable of regulating STAT3
activity in a variety of HNSCC cell models and that most HNSCC-derived PTPRT/D mutations
are likely to be loss-of-catalytic function events. In addition to regulation of pSTAT3 expression,
these mutants are also capable of affecting cell growth/proliferation in HNSCC cell lines,
confirming an oncogenic role for mutant PTPRT/D.
2.3.4 PTPRT/D Mutation is Associated with Enhanced Sensitivity to STAT3 Pathway
Inhibition in HNSCC Cells
The proximal nature of PTPRT/D mutation to STAT3 hyperactivation led us to hypothesize that
these mutations may signify increased dependence upon STAT3 signaling for cell growth and
survival. We therefore sought to test if these mutations led to sensitivity to pharmacologic
STAT3 pathway inhibition. Treatment of PCI-52-SD1 cells stably expressing a catalytic domain
PTPRT mutant (R1059L) or EGFP control with JSI-124, a selective JAK/STAT3 inhibitor [121],
revealed that cells overexpressing mutant PTPRT are indeed more sensitive to STAT3 inhibition
than vector control cells as determined by MTT assay (Figure 8), suggesting that these
mutations may signify enhanced sensitivity to STAT3 pathway inhibition.

38
Figure 8. PTPRT mutation is associated with increased sensitivity to the STAT3 pathway inhibitor
JSI-124. PCI-52-SD1 cells stably expressing the indicated constructs were treated with JSI-124 followed by
MTT assay. Two-tailed t tests.
Our lack of success in stably expressing PTPRD efficiently in HNSCC cells again led us
to employ an alternate method for determining relative sensitivity to STAT3 inhibition in
PTPRD WT versus mutant cells. We identified one cell line that harbors an endogenous PTPRD
mutation (PE/CA-PJ49) and another with no PTPR family mutations (PE/CA-PJ34.12) according
to the CCLE. Treatment of these cell lines with JSI-124 reveals that cells harboring mutant
PTPRD are more sensitive than WT cells as assessed by MTT assay (Figure 9), suggesting that
PTPRD mutation may also signify enhanced sensitivity to STAT3 pathway inhibition.

39
Figure 9. HNSCC cells harboring an endogenous PTPRD mutation (PE/CA-PJ49) are more sensitive
to the STAT3 pathway inhibitor JSI-124 relative to representative PTPRD WT HNSCC cells (PE/CA-
PJ34.12). Cells were treated with increasing concentrations of JSI-124 for 24 hours followed by MTT assay.
The experiment was performed three times with consistent results.
Together, these findings indicate that PTPRT/D mutations may lead to increased
sensitivity to STAT3 inhibition in HNSCC. These mutations may therefore ultimately serve as
predictive biomarkers of exquisite response to emerging STAT3-targeted therapeutics in HNSCC
patients.
2.4 DISCUSSION
These cumulative results indicate that tumor-associated PTPRT/D mutations can alter STAT3
phosphorylation/activation in HNSCC, and likely across many tumor types. This suggests a
novel and common mechanism for dysregulated cell survival and growth involving PTPR
mutation and STAT3 hyperactivation. Therefore, tumors that harbor PTPR (especially
40
PTPRT/D) mutations may be most amenable to treatment with STAT3 pathway inhibitors that
are currently in preclinical and clinical development.
The frequency of PTPR mutations is unexpectedly high across all solid tumor types
analyzed to date. The disperse distribution and lack of hotspot mutations in putative tumor
suppressor PTPR genes suggests that these mutations likely represent loss-of-function events that
typically affect tumor suppressive proteins rather than gain-of-function in oncogenic proteins in
cancer. While this mutation pattern is consistent with that reported for select PTPRs in colorectal
cancers [122], this work represents the most comprehensive analysis of somatic mutations of the
PTPR family across all human cancers sequenced to date.
Constitutive STAT3 activation is frequently found in nearly all human cancers, and
expression levels of pSTAT3 are often associated with poor prognosis [123-125]. Many
mechanisms driving STAT3 activation in cancer have been elucidated, with much focus in recent
decades on mutational activation of kinases upstream of STAT3, including EGFR, BCR-ABL,
SRC-family kinases, and many others. Unfortunately, with a few notable exceptions, tyrosine
kinase inhibitors have met with several clinical challenges, including a lack of predictive
biomarkers for optimal selection of patients likely to benefit as well as the emergence of
resistance mechanisms.
Direct exome sequencing of thousands of patient tumors has not identified common or
consistent STAT3 mutational events in solid tumors, indicating that STAT3 mutation itself
cannot account for any large fraction of cancers with overactive STAT3 signaling, and
precluding the use of STAT3 mutation as a biomarker in large numbers of patients.
Furthermore, solid tumors, including HNSCC, exhibit a lack of activating mutations in kinases
upstream of STAT3 [114]. Thus, activating mutations of STAT3, or of direct upstream positive

41
regulators, are unlikely to be the key genetic factors driving STAT3 hyperactivation in human
cancers, including HNSCC.
Somatic alterations of negative regulators of STAT3 remain incompletely understood in
cancers, including HNSCC. As PTPRT/D have been reported to be direct negative regulators of
STAT3 [20, 126], we sought to determine the impact of PTPRT/D alterations on STAT3
signaling and sensitivity to STAT3 inhibition in HNSCC tumors and preclinical models. Here we
have investigated the hypothesis that PTPRT/D mutation leads to loss of function and subsequent
upregulation of pSTAT3 expression, concomitant with increased sensitivity to pharmacologic
STAT3 pathway inhibition.
Herein we first determined that tumor suppressor PTPR genes are associated with
increased STAT3 activation in primary HNSCC tumors. PTPRT/D mutations occur frequently in
HNSCC and across cancers, with PTPRT representing the single most frequently mutated
phosphatase in HNSCC and across all cancers. These mutations are dispersed throughout the
gene and protein, with no emergent hotspots, consistent with a pattern generally associated with
tumor suppressors rather than oncogenes and concurrent with our hypothesis.
Both PTPRT/D have previously been shown to directly dephosphorylate pSTAT3. We
have now demonstrated that WT PTPRT/D have the capacity to downregulate STAT3 signaling
and growth/survival in HNSCC cells, while most mutants do not, further supporting a loss of
function hypothesis. Interestingly, mutations occurring in both the extracellular and intracellular
regions of PTPRD appear to decrease phosphatase activity (likely through undetermined
allosteric mechanisms), while the one extracellular domain mutation of PTPRT that was tested
did not. This may suggest that extracellular mutations of PTPRD, but not PTPRT, manifest
through increased STAT3 activation, while only intracellular PTPRT mutations contribute in this

42
way. Instead, extracellular PTPRT mutations may manifest through STAT3-independent
mechanisms, which could include modulation of cell-cell interactions, motility, and invasion.
Because of the proximal and direct interaction between PTPRT/D mutation and pSTAT3
overexpression, we hypothesized that loss of function of these proteins by somatic mutation may
lead to increased sensitivity to STAT3 pathway inhibition. Here we have demonstrated that
PTPRT/D mutation is indeed associated with increased sensitivity to the JAK/STAT3 inhibitor
JSI-124 in HNSCC cells, indicating that these mutations may ultimately serve as predictive
biomarkers for STAT3-targeted therapeutics.
In conclusion, PTPR mutational events are relatively common in primary HNSCC, as
well as in many other solid tumors as revealed by large-scale whole-exome sequencing studies.
We have demonstrated that tumor-specific mutational events in the PTPRT/D genes can serve as
direct “drivers” for tumor growth by inducing hyperactivation of STAT3, a potent oncogenic
transcription factor and PTPRT/D substrate. STAT3 pathway inhibitors are under active
investigation in human cancers, and it is biologically plausible that select PTPRT/D mutations
may identify tumors that may be particularly responsive to treatment with STAT3 pathway
inhibitors.

43
3.0 FREQUENT PROMOTER HYPERMETHYLATION OF PTPRT INCREASES
STAT3 ACTIVATION AND SENSITIVITY TO STAT3 INHIBITION IN HEAD AND
NECK CANCER
3.1 INTRODUCTION
Head and neck squamous cell carcinoma (HNSCC) is an invasive malignancy with more than
45,000 expected diagnoses and more than 8,000 expected deaths in 2015 in the United States
alone. [127] Most cancers, including HNSCC, are characterized by constitutive activation of
signal transducer and activator of transcription 3 (STAT3) via phosphorylation of tyrosine 705
(Y705). STAT3 is a transcription factor and potent oncoprotein that activates or maintains many
cancer phenotypes including abnormal growth, proliferation, angiogenesis, and invasion as well
as evasion of apoptosis and the anti-tumor immune response. [128] While aberrant activation of
kinases upstream of STAT3 likely contributes to constitutive activation of STAT3 in cancer, the
role of loss-of-function of downstream regulators, especially protein tyrosine phosphatases
(PTPs), remains incompletely understood.
The PTP superfamily is a large group of enzymes that, in close coordination with tyrosine
kinases, tightly regulates diverse signaling pathways by catalyzing the removal of a phosphate
group from specific signaling proteins. The largest class of PTPs in the human genome is the
44
receptor-like PTP (PTPR) family, which contains 21 distinct members. PTPR family members
span the membrane once and contain one or two intracellular catalytic domains, as well as a
modular extracellular region that typically contains several protein-protein interaction domains.
A role for PTPRs in the context of cancer is increasingly apparent, with many members
implicated as oncogenes or tumor suppressor genes. [113] As described in Chapter 2, we recently
reported that members of the PTPR family are frequently somatically mutated across all solid
tumors analyzed, including HNSCC, with PTPR type T (PTPRT) representing the single most
commonly mutated PTP in HNSCC and across all cancers. [119] Importantly, pSTAT3 is a
validated direct substrate of PTPRT, and loss-of-function mutations of PTPRT lead to increased
pSTAT3 expression and enhanced HNSCC cell growth/survival. [17, 119] As these loss-of-
function PTPRT mutations are found in relatively few HNSCC tumors (5.6% of tumors
analyzed), we sought to determine if loss of PTPRT expression by aberrant promoter methylation
contributes to pSTAT3 overexpression and sensitivity to STAT3 inhibition in HNSCC.
Herein, we describe the high frequency of aberrant PTPRT promoter hypermethylation in
HNSCC and other cancers. We demonstrate that PTPRT promoter methylation is significantly
associated with downregulation of PTPRT expression, with an associated increase in expression
of the PTPRT substrate pSTAT3 in HNSCC. We show that this methylation is reversible, leading
to specific downregulation of pSTAT3 in HNSCC cells. Further, we demonstrate a correlation
between PTPRT promoter methylation and sensitivity to STAT3 inhibition in HNSCC cell lines,
suggesting that PTPRT methylation may serve as a predictive biomarker of responsiveness to
STAT3 inhibitors currently in clinical development.

45
3.2 MATERIALS AND METHODS
3.2.1 Genomic and Proteomic Data and Analysis
TCGA methylation and RNA-Seq data were obtained through R software via the CGDS-R
package or through the TCGA data matrix (https://tcga-
data.nci.nih.gov/tcga/dataAccessMatrix.htm). Reverse-phase protein array data were obtained
from The Cancer Proteome Atlas (TCPA;
http://app1.bioinformatics.mdanderson.org/tcpa/_design/basic/index.html). Statistical
calculations were performed using GraphPad Prism 5 software (GraphPad, La Jolla, CA) unless
otherwise noted.
3.2.2 Methylation-Specific Polymerase Chain Reaction (MSP)
Two-millimeter diameter cores were obtained from formalin-fixed, paraffin-embedded HNSCC
tumors under the auspices of a protocol approved by the Institutional Review Board of the
University of Pittsburgh. Tumor DNA was isolated with the QIAamp DNA FFPE Tissue Kit,
while the QIAamp DNA Mini Kit was used for isolation of DNA from cell lines, both according
to the manufacturer’s instructions (Qiagen, Hilden, Germany). DNA concentrations were
determined using a Beckman Coulter spectrophotometer (Pasadena, CA). Bisulfite conversion of
1 μg of DNA per sample was performed using the EpiTect® Bisulfite Kit according to the
manufacturer’s instructions (Qiagen, Hilden, Germany). 1 μL of bisultfite-converted DNA eluate
was used for MSP. MSP primers were designed using MethPrimer software [129] and purchased
from Sigma-Aldrich (St. Louis, MO). MSP was performed with the EpiTect® MSP Kit (Qiagen,

46
Hilden, Germany). After reaction completion, products were analyzed by gel electrophoresis on
a 2.5% agarose gel. Images were taken using the ChemiDoc™ XRS+ System and Image Lab™
software (Bio-Rad Laboratories, Inc., Hercules, CA). Densitometry was performed using ImageJ
and the fractional methylation (beta value) for a particular tumor or cell line was calculated as
(methylation signal) / (methylation signal + unmethylation signal).
3.2.3 Cell Culture
Cal27 and Detroit 562 cells were obtained from ATCC (Manassas, VA). 686LN cells were
obtained from Georgia Chen at MD Anderson Cancer Center (Houston, TX). BICR 18 and
PE/CA-PJ49 cells were obtained from Sigma-Aldrich (St. Louis, MO). UMSCC cell lines were
obtained from Thomas E. Cary at the University of Michigan (Ann Arbor, MI). HSC-2 cells
were obtained from Hideo Niwa at Nihon University (Tokyo, Japan). Cal27, Detroit 562, HSC-2,
UMSCC 47, and UMSCC 22A were maintained in DMEM (Corning, Corning, NY) containing
10% fetal bovine serum (FBS; Gemini Bio-Products, West Sacramento, CA). UMSCC 1 were
maintained in DMEM containing 10% FBS and 0.4 µg/mL hydrocortisone (Sigma-Aldrich, St.
Louis, MO). BICR 18 were maintained DMEM containing 10% FBS, 0.4 µg/mL hydrocortisone,
and 2 mM L-glutamine (Life Technologies, Carlsbad, CA). 686LN were maintained in
DMEM/F12 (Life Technologies, Carlsbad, CA) containing 10% FBS. PE/CA-PJ49 were
maintained in Iscove’s DMEM (Corning, Corning, NY) containing 10% FBS and 2 mM L-
glutamine. All cells were genotypically verified using the AmpFSTR Identifiler PCR
Amplification Kit according to the manufacturer’s instructions (Life Technologies, Carlsbad,
CA) and maintained at 37°C and 5% CO2.

47
3.2.4 5-Azacytidine (5-aza) and shRNA Treatment
Cal27 cells were plated at 250,000 cells per well on 6-well plates and incubated overnight.
Medium was then replaced with complete medium containing 1 μM 5-aza (or 50% acetic acid in
water as vehicle). 24 hours later, cells were transfected with 2 μg of shRNA targeted toward
PTPRT (shPTPRT) or non-targeted scrambled sequence (shScr) with 6 μL of FuGENE® HD
(Promega, Fitchburg, WI) in 200 μL of Opti-MEM® (Life Technologies, Carlsbad, CA) added
directly to medium containing 5-aza (or vehicle). Cells were incubated for an additional 24 hours
before DNA, RNA, and protein were harvested for analysis.
3.2.5 Western Blotting
Whole cell lysates were prepared in lysis buffer containing phosphatase and protease inhibitors
using cell scrapers and sonication followed by centrifugation to remove cell debris. Lysate
concentrations were determined with the Bio-Rad Protein Assay reagent (Bio-Rad Laboratories,
Inc., Hercules, CA). 40 μg of protein was mixed with the appropriate volume of 4X loading dye
containing β-mercaptoethanol and incubated in boiling water for 5 minutes. Samples were loaded
into 8-10% polyacrylamide gel containing sodium dodecyl sulfate and allowed to resolve at
~125 V. Gels were blotted onto nitrocellulose membranes by semi-dry transfer at 21 V for 50
min. Blots were blocked in 5% milk for 1 hr at room temperature, then incubated with primary
antibody in 1% milk overnight at 4°C with agitation. The next day, primary antibody was rinsed
off followed by incubation in secondary antibody conjugated to horseradish peroxidase in 5%
milk for 1 hr at room temperature. Blots were then imaged using Western Blotting Luminol
Reagent (Santa Cruz Biotechnology, Dallas, TX) and the ChemiDoc™ XRS+ System and Image

48
Lab™ software (Bio-Rad Laboratories, Inc., Hercules, CA). Primary antibodies for pSTAT3 and
STAT3 were purchased from Cell Signaling Technology, Inc. (Boston, MA; typical dilution
1:1000-1:3000). β-tubulin primary antibody was purchased from Abcam (Cambridge, MA;
typical dilution 1:50,000). Secondary antibodies were purchased from BioRad (Hercules, CA;
typical dilution 1:1000-1:3000). All milk and antibody solutions were made in Tris-buffered
saline containing Tween-20 at pH 7.6. Blots were quantitated by densitometry using ImageJ
software.
3.2.6 Drug Treatment
Cells were plated on 48-well plates at a density of 6800 cells per well and incubated overnight
before treatment with increasing concentrations of Stattic (Sigma-Aldrich, St. Louis, MO), JSI-
124 (Calbiochem, San Diego, CA), LY2784544 (Eli Lilly and Company, Indianpolis, IN), or
DMSO alone as vehicle control in triplicate in the appropriate complete medium (see 3.2.3 Cell
Culture). MTT assays were performed by adding 5 mg/mL MTT in PBS to aspirated wells after
72 hrs and incubating at 37°C for 10-30 minutes as appropriate for each cell line. MTT was then
aspirated and replaced with an equal volume of DMSO. 100 μL of DMSO was transferred from
each well to a 96-well plate for data collection. Data were fit to a sigmoidal curve and EC50
values were determined using GraphPad Prism 5 (GraphPad, La Jolla, CA).
3.2.7 Animals
Mice were used in accordance with a protocol approved by the Institutional Animal Care and
Use Committee at the University of Pittsburgh, and were housed in a facility certified by the
49
American Association for the Accreditation of Laboratory Animal Care. 5-6 week old female
Foxn1 nude mice were purchased from Harlan Laboratories (Indianapolis, IN). 16 mice were
inoculated with 3×10⁶ BICR 18 cells on the left flank, and 3×10⁶ UMSCC 1 cells on the right
flank. After 10 days of growth, UMSCC 1 cells had formed palpable tumors in 15/16 mice, while
BICR 18 had formed none. At this time, 8 mice were randomized to receive 50 mg/kg Stattic in
1% Tween-80 in PBS by oral gavage five times per week as previously reported in an ovarian
cancer model. [130] Seven mice received no treatment as control. Tumor sizes were blindly
measured by caliper in two dimensions and volumes calculated as: Vol = (large measurement) ×
(small measurement)2. Mice were sacrificed after measurements were taken on day 9 of
treatment.
3.3 RESULTS
3.3.1 Frequent PTPRT Promoter Hypermethylation Leads to Decreased PTPRT mRNA
Expression
To assess aberrant PTPRT promoter methylation in HNSCC, we analyzed TCGA data derived
from the Illumina HumanMethylation450 platform, a quantitative assay that assesses methylation
levels of more than 485,000 CG dinucleotides throughout the human genome. As promoter
methylation is associated with decreased gene expression, we first determined which CG
dinucleotide methylation event in the PTPRT promoter region was most negatively correlated
with PTPRT mRNA expression (Figure 10A), and considered that methylation of this site was
likely to most significantly contribute to reduced PTPRT expression. We then defined aberrant

50
hypermethylation as a fractional methylation level (beta value) at least three standard deviations
above the mean methylation level of the same genetic locus in organ-matched normal tissue as
determined by TCGA using the same assay. This analysis detected that 60.1% (256/426 tumors
analyzed) of HNSCC tumors were aberrantly hypermethylated (Figure 10B). By this stringent
measure, hypermethylated tumors exhibit significantly decreased PTPRT mRNA expression
levels as determined by RNA-Seq (Figure 10C), suggesting the validity of the above definition
and that PTPRT hypermethylation has the expected biologic effect. In contrast, copy number
alterations of the PTPRT gene are relatively infrequent and are not significantly associated with
altered PTPRT mRNA expression (Figure 11).
Figure 10. Frequent PTPRT promoter hypermethylation is associated with downregulation of PTPRT
mRNA in HNSCC tumors. A) Methylation at the CG dinucleotide denoted cg04541293 significantly
correlates with decreased PTPRT mRNA expression (n = 279, Pearson r = -0.2670, P < 0.0001, R2 = 0.07131,
95% confidence interval depicted). B) PTPRT promoter hypermethylation (defined as a methylation level

51
greater than three standard deviations above the mean methylation level of the same genetic locus in organ-
matched normal tissue samples) was assessed in 426 tumors from TCGA. C) PTPRT hypermethylation is
significantly associated with downregulation of PTPRT mRNA (two-tailed unpaired t test). Whiskers
represent minimal or maximal values. RNA-Seq Score in arbitrary units.
Figure 11. PTPRT copy number alterations are not significantly associated with altered mRNA
expression in HNSCC. A Jonckheere-Terpstra test was performed using StatXact software (Cytel,
Cambridge, MA). There are no cases of high-level amplification of PTPRT in the HNSCC tumors analyzed.
Whiskers represent minimal or maximal values.
As human papilloma virus (HPV) infection is an etiologic and prognostic factor in a
subset of HNSCC, we sought to determine if PTPRT promoter hypermethylation is associated
with HPV status and observed no significant association (P = 1.00, Fisher’s exact test; PTPRT
promoter hypermethylation in 21/36 [58.3%] HPV-positive tumors versus 145/243 [59.7%]
HPV-negative tumors), suggesting that HPV infection is not a driver of PTPRT promoter
methylation. [131]

52
In order to validate TCGA findings in an independent HNSCC human cohort, we
performed methylation-specific PCR (MSP) on 45 formalin-fixed, paraffin-embedded oral
squamous cell cancers with primers directed at the promoter region of PTPRT (representative
analysis in Figure 12A). We considered a tumor methylated when the methylation signal was
more than 50% of the total signal as determined by densitometry. Using this semi-quantitative
analysis, a similar high frequency of methylation was observed in this cohort (71.1%, 32/45
tumors analyzed; Figure 12B), further suggesting that PTPRT promoter methylation represents a
common mechanism of PTPRT downregulation in HNSCC.
Figure 12. The PTPRT promoter is frequently methylated in an independent cohort of HNSCC
tumors. A) Representative MSP analysis of the PTPRT promoter from four HNSCC tumors. M denotes
primers amplifying methylated sequences, and U denotes primers amplifying unmethylated sequences. B)
Summary of MSP analysis of 45 HNSCC tumors. A tumor is considered methylated when the methylation
level is >50% of the total signal.

53
3.3.2 The PTPRT Promoter is Frequently Hypermethylated Across Human Cancers
We next sought to determine if PTPRT promoter hypermethylation is a common feature across
cancer types. Further analysis of TCGA data reveals that the PTPRT promoter is frequently
hypermethylated across a broad array of cancer types when hypermethylation is defined as a
fractional methylation level (beta value) at least three standard deviations above the mean
methylation level of the same genetic locus in organ-matched normal tissue samples. The highest
incidence of PTPRT promoter hypermethylation occurs in colon adenocarcinoma (78.7%,
289/367 tumors analyzed), while HNSCC exhibits the second highest incidence (60.1%) among
the cancers for which sufficient data were available for this analysis (Figure 13A). Of the
cancers analyzed, four exhibit significant downregulation of PTPRT mRNA in hypermethylated
tumors (HNSCC, colon adenocarcinoma, lung adenocarcinoma, and breast invasive carcinoma; P
< 0.05), suggesting a functional role for aberrant PTPRT promoter methylation across several
cancer types (Figure 13B).

54
Figure 13. The PTPRT promoter is frequently hypermethylated across cancer types in association
with downregulated PTPRT mRNA. COAD, colon adenocarcinoma; HNSCC, head and neck squamous cell
carcinoma; LUAD, lung adenocarcinoma; BRCA, breast invasive carcinoma; CESC, cervical squamous cell
carcinoma and endocervical adenocarcinoma; BLCA, bladder urothelial carcinoma; LUSC, lung squamous
cell carcinoma; LIHC, liver hepatocellular carcinoma; ESCA, esophageal carcinoma; KIRC, kidney renal
clear cell carcinoma; KIRP, kidney renal papillary cell carcinoma. A) The PTPRT promoter is frequently
hypermethylated in several cancers. B) Table summarizing hypermethylation across cancers. Expression P
values represent the results of unpaired two-tailed t tests between hypermethylated and non-hypermethylated
tumors, with those in bold denoting significant (P < 0.05) downregulation of PTPRT mRNA expression in
hypermethylated tumors. Normal (n) and Tumor (n) denote the number of organ site-matched normal tissue
or number of tumor samples used in this analysis, respectively.

55
3.3.3 PTPRT Expression is Inversely Associated with STAT3 Activation in HNSCC
As PTPRT promoter methylation leads to downregulation of PTPRT expression, we next sought
to determine if PTPRT expression was inversely associated with pSTAT3 expression in HNSCC
tumors. Analysis of TCGA and TCPA HNSCC data indicates that PTPRT mRNA expression is
indeed inversely correlated with pSTAT3 expression in primary HNSCC tumors as determined
by RPPA (P < 0.008) (Figure 14A). Indeed, representative immunohistochemical staining of an
independent cohort of HNSCC tumors demonstrated that those with PTPRT promoter
methylation, as determined by MSP, express elevated levels of pSTAT3 relative to tumors
without PTPRT methylation (Figure 14B). Together, these findings suggest that PTPRT
promoter methylation may be a frequent mechanism that contributes to STAT3 activation in
HNSCC.

56
Figure 14. PTPRT promoter methylation and mRNA expression are associated with pSTAT3
expression. A) PTPRT mRNA expression is significantly correlated with pSTAT3 expression (n = 184,
Pearson r = -0.1958, P < 0.008, R2 = 0.03835, 95% confidence interval depicted). RNA-Seq Score in arbitrary
units. B) Representative immunohistochemical analysis of pSTAT3 expression in six HNSCC tumors with the
indicated PTPRT methylation status, performed as previously described. [119]

57
3.3.4 PTPRT Promoter Methylation is Reversible, Leading to PTPRT-Specific pSTAT3
Downregulation
To further investigate the mechanistic association between PTPRT promoter methylation and
pSTAT3 expression, we designed an experiment involving shRNA targeted toward PTPRT and
5-aza, a non-specific DNA methyltransferase (DNMT) inhibitor that leads to genome-wide
demethylation. We selected a HNSCC cell line (Cal27) that exhibits nearly complete methylation
of the PTPRT promoter as determined by MSP. As expected, treatment of these Cal27 cells with
5-aza led to an increase in the unmethylated signal as determined by MSP(Figure 15A). This
demethylation event was concurrent with restored expression of endogenous WT PTPRT as
determined by RT-PCR, which was sufficient to lead to downregulation of pSTAT3 expression
as determined by Western blot (Figures 15B and 15C). Transfection of Cal27 cells with shRNA
directed against PTPRT (shPTPRT) following 5-aza treatment also resulted in an increase in the
unmethylated signal as expected (Figure 15A), but the expression of PTPRT was significantly
downregulated relative to 5-aza treatment alone, indicating that while the PTPRT promoter was
demethylated by 5-aza, the shPTPRT treatment was sufficient to degrade the resulting PTPRT
mRNA. Further, pSTAT3 expression remained unaffected under 5-azza plus shPTPRT
conditions relative to 5-aza treatment alone (Figures 15B and 15C), suggesting that 5-aza-
mediated downregulation of pSTAT3 is dependent upon demethylation and re-expression of
PTPRT in these cells. These results provide mechanistic evidence that PTPRT promoter
methylation contributes directly and proximally to STAT3 activation in HNSCC by
downregulation of PTPRT expression.

58
Figure 15. PTPRT promoter methylation is reduced by 5-azacytidine treatment, leading to PTPRT-
specific pSTAT3 downregulation in HNSCC cells. A) MSP analysis of the PTPRT promoter in HNSCC cells
(Cal27) following treatment with 1 μM 5-azacytidine (or vehicle) and shRNA targeted toward PTPRT
(shPTPRT) or scrambled non-targeting shRNA (shScr). B) Western blot and RT-PCR analysis of Cal27 cells
treated as indicated. C) Graphical representation of pSTAT3/STAT3 expression analyzed by Western blot
following the indicated treatments (analyzed by unpaired two-tailed t tests, n = 3).
3.3.5 PTPRT Promoter Methylation is Associated with Increased Sensitivity to STAT3
Inhibition in HNSCC Cells
Due to the proximal nature of PTPRT promoter hypermethylation and pSTAT3 overexpression,
we hypothesized that such methylation may predict enahanced sensitivity to STAT3 pathway
inhibition. To evaluate whether PTPRT promoter methylation may serve as a predictive

59
biomarker for STAT3 targeted therapies, we first conducted MTT assays to determine EC50
values for selective STAT3 inhibitors in a panel of 8 HNSCC cell lines (Figures 16A and 16B)
that exhibit varying levels of PTPRT promoter methylation as determined by MSP (summarized
in Figures 16C and 16D). Figures 16E and 16F illustrate that PTPRT promoter methylation
and sensitivity to Stattic (a direct inhibitor of STAT3 dimerization and nuclear translocation by
binding to the SH2 domain) or JSI-124 (a JAK/STAT3 pathway inhibitor) are significantly
inversely correlated (P < 0.05), indicating that HNSCC cell lines with a high degree of PTPRT
promoter methylation are most sensitive to STAT3 inhibition. A similar trend was observed with
the JAK2 inhibitor LY2784544, though this observation was not statistically significant (Figure
17). Notably, we observe no direct correlation between PTPRT promoter methylation and
pSTAT3 expression in this cell line panel, suggesting that high pSTAT3 expression per se may
not be predictive of sensitivity to STAT3 inhibitors. Instead, PTPRT promoter methylation may
lead to some degree of addiction to STAT3 signaling in HNSCC cells, thus leading to STAT3
inhibitor sensitization. These findings indicate that HNSCC tumors with a high degree of PTPRT
promoter methylation may be most amenable to treatment with STAT3 inhibitors that are
currently in preclinical and clinical development.

60
Figure 16. Increased PTPRT promoter methylation is associated with increased sensitivity to STAT3
inhibition. A,B) Dose-response curves for 8 HNSCC cell lines treated with increasing concentrations of Stattic
or JSI-124. MTT assays were performed after 72 hours of treatment. C,D) Tables of EC50 values and
fractional methylation determined by MSP for the cell lines treated in A and B, sorted from least to most
sensitive. E,F) The PTPRT fractional methylation level of the cells treated in A and B correlates with
sensitivity to Stattic (n = 8, Pearson r = -0.7916, P < 0.05, R2 = 0.5178) and JSI-124 (n = 8, Pearson r = -0.8224,
P < 0.02, R2 = 0.6763).

61
Figure 17. Increased PTPRT promoter methylation is associated with increased sensitivity to the
JAK2 inhibitor LY2784544. A) Dose-response curves for 8 HNSCC cell lines treated with increasing
concentrations of LY2784544. MTT assays were performed after 72 hours of treatment. B) Table of EC50
values and fractional methylation determined by MSP for the cell lines treated in A, sorted from least to most
sensitive. C) Analysis of the correlation between PTPRT fractional methylation and sensitivity to LY2784544
reveals a trend toward higher sensitivity to LY2784544 in HNSCC cells with higher PTPRT methylation (n =
8, Pearson r = -0.4411, P < 0.3, R2 = 0.1946).
We next sought to determine whether PTPRT methylation may serve as a predictive
biomarker of sensitivity to STAT3 inhibition in a heterotopic tumorgraft model of HNSCC. We
inoculated 16 nude mice with 3×10⁶ BICR 18 cells (which exhibit total PTPRT unmethylation; β
= 0) in one flank, and 3×10⁶ UMSCC 1 cells (which exhibit near total PTPRT methylation; β =
0.899) in the other flank. After 10 days, the unmethylated cells had not formed any tumors, while
the methylated cells had formed palpable masses in 15/16 mice (mean volume = 100.3 mm3). As
BICR 18 cells are the only HNSCC cells identified to date with total (or indeed, >50%) PTPRT
unmethylation, we are therefore unable to determine the relative sensitivities of unmethylated
versus methylated HNSCC cells in vivo. Nevertheless, starting on day 10 post-inoculation, 8
mice were randomized to receive 50 mg/kg Stattic by oral gavage five times per week, while 7
mice received no treatment. Serial tumor measurements were performed three times per week by
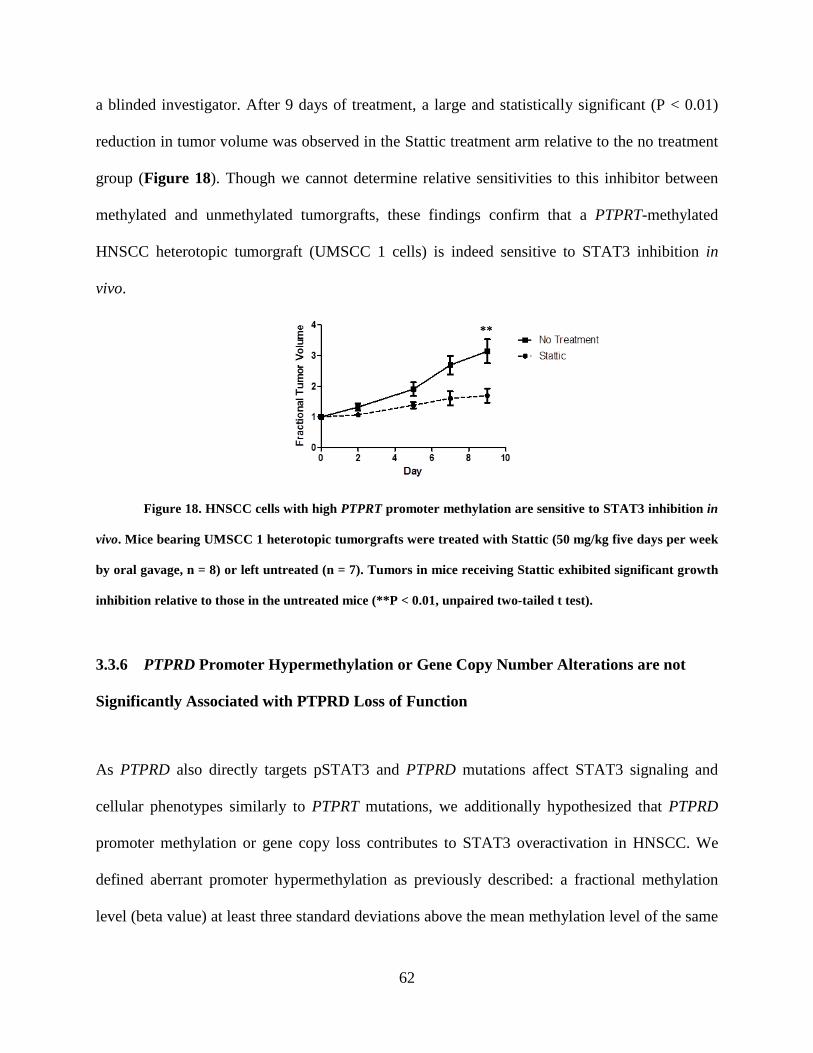
62
a blinded investigator. After 9 days of treatment, a large and statistically significant (P < 0.01)
reduction in tumor volume was observed in the Stattic treatment arm relative to the no treatment
group (Figure 18). Though we cannot determine relative sensitivities to this inhibitor between
methylated and unmethylated tumorgrafts, these findings confirm that a PTPRT-methylated
HNSCC heterotopic tumorgraft (UMSCC 1 cells) is indeed sensitive to STAT3 inhibition in
vivo.
Figure 18. HNSCC cells with high PTPRT promoter methylation are sensitive to STAT3 inhibition in
vivo. Mice bearing UMSCC 1 heterotopic tumorgrafts were treated with Stattic (50 mg/kg five days per week
by oral gavage, n = 8) or left untreated (n = 7). Tumors in mice receiving Stattic exhibited significant growth
inhibition relative to those in the untreated mice (**P < 0.01, unpaired two-tailed t test).
3.3.6 PTPRD Promoter Hypermethylation or Gene Copy Number Alterations are not
Significantly Associated with PTPRD Loss of Function
As PTPRD also directly targets pSTAT3 and PTPRD mutations affect STAT3 signaling and
cellular phenotypes similarly to PTPRT mutations, we additionally hypothesized that PTPRD
promoter methylation or gene copy loss contributes to STAT3 overactivation in HNSCC. We
defined aberrant promoter hypermethylation as previously described: a fractional methylation
level (beta value) at least three standard deviations above the mean methylation level of the same

63
genetic locus in organ-matched normal tissue as determined by TCGA using the same
methylation assay (Illumina HumanMethylation450). In contrast to frequent promoter
hypermethylation of PTPRT (Figure 10), no cases of aberrant PTPRD promoter
hypermethylation were observed in this cohort (0/426 tumors analyzed). This finding was
confirmed in an independent cohort by MSP, where both tumor and patient-matched adjacent
normal tissue exhibited PTPRD promoter methylation, suggesting that this methylation event
may represent a feature of normal oral epithelium (Figure 19).
Figure 19. The PTPRD promoter is not hypermethylated in HNSCC tumors compared with adjacent
normal mucosa. Five HNSCC tumors and matched normal mucosa from the same patients were collected and
analyzed by MSP. M denotes primers amplifying methylated sequences, while U denotes primers amplifying
unmethylated sequences.
Analysis of PTPRD copy number alterations as determined by TCGA across cancer types
revealed that copy number loss is more common than gain in HNSCC and in all cancers
analyzed, with the exception of colorectal and cervical cancers (Figure 20A). While this
suggests that PTPRD copy number loss may contribute to loss of PTPRD expression and
function, no significant association between PTPRD copy number alteration and mRNA was
observed in HNSCC, similarly to that observed for PTPRT (Figure 11). This finding suggests

64
that gene copy loss does not significantly contribute to loss of expression or function of PTPRD
in HNSCC (Figure 20B).
Figure 20. PTPRD copy number alterations are frequent across cancers but are not associated with
PTPRD mRNA expression in HNSCC. (A) Copy number alteration of PTPRD in human cancers as
determined by TCGA. (B) PTPRD copy number alterations do not correlate with altered PTPRD mRNA
expression in HNSCC. A Jonckheere-Terpstra test was performed using StatXact software (Cytel,
Cambridge, MA).
3.4 DISCUSSION
The survival rate for HNSCC patients has remained stagnant in recent decades despite advances
in the understanding of the biological underpinnings of this disease and improved therapeutic
strategies. In 2006, the Food and Drug Administration approved cetuximab, a monoclonal
antibody targeting the epidermal growth factor receptor (EGFR), for the treatment of HNSCC
65
patients. [132] Unfortunately, cetuximab has produced limited success in the clinic, at least in
part due to the lack of predictive biomarkers, including EGFR expression or copy number gain.
[133] There is therefore a need for the identification of both novel targets for pharmacologic
inhibition and biomarkers of sensitivity to those emerging therapeutics. STAT3 is a promising
target for pharmacologic inhibition, and STAT3 inhibitors are being developed and tested in
early phase clinical trials. [134] Additionally, we previously reported that STAT3 activation
contributes to cetuximab resistance in HNSCC preclinical models and tumors from patients
treated on cetuximab-containing protocols, indicating that direct inhibition of STAT3 may
overcome certain mechanisms of resistance to available targeted therapeutics. [40] It is
increasingly apparent that most molecular targeted agents will be most effective in subgroups of
patients identified by specific genomic, epigenomic, and/or proteomic characteristics, including
promoter methylation. The identification of biomarkers that identify those individuals most
likely to benefit from such agents would allow the design of more scientifically rational clinical
trials, and ultimately may provide broad clinical benefit to cancer patients.
Here we investigate the potential utility of PTPRT promoter methylation as a predictive
biomarker of response to STAT3 inhibition in HNSCC preclinical models. We report that the
PTPRT promoter is frequently hypermethylated in HNSCC (>60%) and several other cancer
types in association with decreased PTPRT mRNA expression. Interestingly, a high rate of
PTPRT promoter hypermethylation has previously been reported in other cancer types using
alternate methodologies independent of TCGA. Colorectal cancer has the highest incidence of
PTPRT promoter hypermethylation according to the present analysis (>78%), concordant with a
previously published analysis of sporadic colorectal cancer, where nearly all tumors analyzed

66
were methylated at the PTPRT promoter in contrast to no observed methylation in matched
normal tissues. [135] In addition, in hepatocellular carcinoma (a tumor type we were unable to
analyze here due to unavailability of normal tissue in TCGA data), the PTPRT methylation level
has been reported to progressively increase from adjacent tissue to tumor. [135, 136] Our present
findings indicate that PTPRT promoter methylation may represent a common event across many
cancer types, especially HNSCC, colorectal cancer, lung adenocarcinoma, and breast invasive
carcinoma. These results suggest that the development of a therapeutic strategy informed by
PTPRT promoter hypermethylation may be of wide clinical benefit.
To date, the functional signaling consequences downstream of PTPRT promoter
hypermethylation have not been described, and as such, no strategies to mitigate the effects of
this event have been proposed. Herein we demonstrate that the PTPRT promoter methylation is
associated with a decrease in PTPRT mRNA expression in HNSCC. This downregulation is in
turn associated with an increase in expression of the PTPRT substrate pSTAT3, indicating that
PTPRT promoter methylation likely contributes to overexpression of PTPRT substrates,
including pSTAT3. We further evaluated PTPRT promoter methylation in an independent cohort
of HNSCC and observed a similarly high frequency to that observed in data available from
TCGA, thus confirming the high incidence of this methylation event. We also demonstrate that
PTPRT methylation significantly contributes to pSTAT3 upregulation in HNSCC cells with
experiments that employ both 5-aza and shRNA to establish a direct mechanistic connection
between these events.
Together, these studies suggest that HNSCC cells and tumors that exhibit high levels of
PTPRT promoter methylation may be more dependent on STAT3 signaling for growth and

67
survival, thus offering the opportunity to exploit PTPRT methylation as a predictive biomarker of
sensitivity to STAT3 inhibition. Here we have established an association between PTPRT
promoter methylation and sensitivity to inhibitors of the STAT3 signaling pathway by
calculating significant correlations between PTPRT promoter methylation in HNSCC cell lines
as determined by MSP and EC50 values for the STAT3 inhibitor Stattic and STAT3 pathway
inhibitors JSI-123 and LY2784544. These studies therefore provide a rationale for designing
future clinical trials of STAT3-targeted therapeutics that select for patients with a high degree of
PTPRT promoter methylation. Screening for high PTPRT promoter methylation may ultimately
allow the identification of patients who are most likely to benefit from treatment with STAT3
targeting agents, leading to improved clinical outcomes.

68
4.0 DISCUSSION
Head and neck squamous cell carcinoma (HNSCC) is a frequently fatal malignancy that arises
from the squamous epithelium of the upper aerodigestive tract. Current treatment modalities for
this disease generally include surgery combined with some combination of chemotherapy,
radiation, and/or cetuximab, a monoclonal antibody targeting EGFR that was approved for use in
HNSCC by the FDA in 2006. These regimens are associated with significant co-morbidities,
including skin reactions, mucositis, and surgical complications leading to diminished quality of
life. [137-139] The major complication leading to low overall survival of HNSCC patients is
frequent recurrence or formation of second primary tumors. These secondary tumors are often
resistant to current therapies, and recurrent tumors in patients formerly treated on cetuximab-
containing protocols have been reported to exhibit increased pSTAT3 expression, suggesting that
STAT3 activation may represent an important and targetable mechanism of acquired cetuximab
resistance in HNSCC patients. [40]
STAT3 is an oncogenic transcription factor that is frequently hyperactivated by tyrosine
phosphorylation in primary and recurrent HNSCC. Aberrant constitutive STAT3 activation leads
to potent activation or maintenance of several cancer phenotypes, including growth, survival,
motility/invasion, angiogenesis, and evasion of apoptosis and the immune response. As such,
STAT3 is a rational drug target for which targeted inhibitors are currently in clinical
development. Importantly, biomarkers of response to such agents are currently lacking. It is

69
increasingly apparent that most targeted therapeutics will be most effective in tumors with
particular and defined biologic characteristics, such as somatic mutation or promoter methylation
of specific genes. The identification of such predictive biomarkers of exceptional response to
STAT3 inhibitors may therefore lead to the design of more rational clinical trials, ultimately
leading to improved patient outcomes in HNSCC.
While STAT3 is constitutively hyperactivated in most cancers, the mechanisms
underlying this phenomenon remain incompletely understood. Somatic mutation of STAT3 is
rare, occurring with a frequency that is dramatically insufficient to explain the high frequency of
observed STAT3 pathway overactivation. Instead, much effort has been expended to determine
the contribution of mutational activation of kinases upstream of STAT3, including growth factor
receptors such as EGFR and FGFR, as well as intracellular kinases such as SRC and JAK,
among many others. Recent whole-exome sequencing studies across multiple institutions have
now indicated that activating kinase mutations are rare in HNSCC, with the notable exception of
PIK3CA. [116-118] We therefore sought to test the hypothesis that loss of function of proteins
that normally inactivate STAT3, particularly phosphatases, will lead to STAT3 pathway
activation and ultimately to increased sensitivity to STAT3 inhibition.
The PTPR family is the largest subgroup of the human protein tyrosine phosphatome.
These enzymes, in close coordination with tyrosine kinases, regulate the phosphorylation status
of signaling proteins, including STAT3. In particular, PTPRT and PTPRD have been
demonstrated to directly target pSTAT3 in cell-free systems and several human cell types. [17,
20] Additionally, somatic mutation or promoter methylation of these genes has been reported in
several cancer types, including GBM, colorectal cancer, and hepatocellular carcinoma,
suggesting a contribution of loss of function of these proteins across cancer types. These prior

70
findings led us to further investigate the hypothesis that loss of function of PTPRT/D in
particular will lead to increased phosphorylation of their common substrate pSTAT3, and
ultimately lead to enhanced sensitivity to STAT3 inhibition.
The results presented herein support an important role for mutation or promoter
methylation of PTPRT/D in HNSCC. We have shown that loss of function of PTPRT or PTPRD
by somatic mutation or promoter hypermethylation occurs in ~10% or >60% of HNSCC tumors,
respectively. These events lead to upregulation of pSTAT3, concomitant with upregulated cancer
phenotypes such as growth, survival, proliferation, and escape from serum dependence.
Importantly, several preclinical models indicate that PTPRT/D mutation or promoter methylation
may predict enhanceed sensitivity to STAT3 pathway inhibitors. Further preclinical and clinical
studies to more firmly establish these events as predictive biomarkers, including in knockout
mouse models of oral carcinogenesis and a Phase 0 clinical trial expected to include 35 patients,
are already underway. These studies may then inform the design of future trials that will include
large numbers of patients selected for STAT3-targeted therapy based on the PTPRT/D status of
their tumors. Such work may ultimately allow for the identification of patients who will be most
likely to respond to STAT3 inhibitors, leading to improved patient outcomes in cancer.

71
BIBLIOGRAPHY
1. Vinkemeier, U., et al., DNA binding of in vitro activated Stat1 alpha, Stat1 beta and truncated Stat1: interaction between NH2-terminal domains stabilizes binding of two dimers to tandem DNA sites. The EMBO journal, 1996. 15(20): p. 5616-5626.
2. Wojciak, J., et al., Structural basis for recruitment of CBP/p300 coactivators by STAT1
and STAT2 transactivation domains. The EMBO journal, 2009. 28(7): p. 948-958. 3. Zhong, Z., Z. Wen, and J.E. Darnell, Jr., Stat3: a STAT family member activated by
tyrosine phosphorylation in response to epidermal growth factor and interleukin-6. Science, 1994. 264(5155): p. 95-8.
4. Akira, S., et al., Molecular cloning of APRF, a novel IFN-stimulated gene factor 3 p91-
related transcription factor involved in the gp130-mediated signaling pathway. Cell, 1994. 77(1): p. 63-71.
5. Hart, K., et al., Transformation and Stat activation by derivatives of FGFR1, FGFR3, and
FGFR4. Oncogene, 2000. 19(29): p. 3309-3320. 6. Cirri, P., et al., c-Src activates both STAT1 and STAT3 in PDGF-stimulated NIH3T3
cells. Biochemical and biophysical research communications, 1997. 239(2): p. 493-497. 7. Ehret, G., et al., DNA binding specificity of different STAT proteins. Comparison of in
vitro specificity with natural target sites. J Biol Chem, 2001. 276(9): p. 6675-6688. 8. Xu, X., Y. Sun, and T. Hoey, Cooperative DNA binding and sequence-selective
recognition conferred by the STAT amino-terminal domain. Science (New York, N.Y.), 1996. 273(5276): p. 794-797.
9. Rosa, M.A., et al., Studies of Jak/STAT3 expression and signalling in psoriasis identifies
STAT3-Ser727 phosphorylation as a modulator of transcriptional activity. Experimental Dermatology, 2013. 22.
10. Wakahara, R., et al., Phospho-Ser727 of STAT3 regulates STAT3 activity by enhancing
dephosphorylation of phospho-Tyr705 largely through TC45. Genes to cells : devoted to molecular & cellular mechanisms, 2012. 17(2): p. 132-145.
72
11. Wang, R., P. Cherukuri, and J. Luo, Activation of Stat3 sequence-specific DNA binding and transcription by p300/CREB-binding protein-mediated acetylation. J Biol Chem, 2005. 280(12): p. 11528-11534.
12. Yuan, Z.-L., et al., Stat3 dimerization regulated by reversible acetylation of a single
lysine residue. Science (New York, N.Y.), 2005. 307(5707): p. 269-273. 13. Sasaki, A., et al., Cytokine-inducible SH2 protein-3 (CIS3/SOCS3) inhibits Janus tyrosine
kinase by binding through the N-terminal kinase inhibitory region as well as SH2 domain. Genes to cells : devoted to molecular & cellular mechanisms, 1999. 4(6): p. 339-351.
14. Yasukawa, H., et al., The JAK-binding protein JAB inhibits Janus tyrosine kinase activity
through binding in the activation loop. The EMBO journal, 1999. 18(5): p. 1309-1320. 15. Chung, C., et al., Specific inhibition of Stat3 signal transduction by PIAS3. Science (New
York, N.Y.), 1997. 278(5344): p. 1803-1805. 16. Nallar, S., et al., Tumor-derived Mutations in the Gene Associated with Retinoid
Interferon-induced Mortality (GRIM-19) Disrupt Its Anti-signal Transducer and Activator of Transcription 3 (STAT3) Activity and Promote Oncogenesis. J Biol Chem, 2013. 288(11): p. 7930-7941.
17. Zhang, X., et al., Identification of STAT3 as a substrate of receptor protein tyrosine
phosphatase T. Proceedings of the National Academy of Sciences of the United States of America, 2007. 104(10): p. 4060-4064.
18. Yamamoto, T., et al., The nuclear isoform of protein-tyrosine phosphatase TC-PTP
regulates interleukin-6-mediated signaling pathway through STAT3 dephosphorylation. Biochemical and biophysical research communications, 2002. 297(4): p. 811-817.
19. Zhang, W., et al., Negative regulation of Stat3 by activating PTPN11 mutants contributes
to the pathogenesis of Noonan syndrome and juvenile myelomonocytic leukemia. J Biol Chem, 2009. 284(33): p. 22353-22363.
20. Veeriah, S., et al., The tyrosine phosphatase PTPRD is a tumor suppressor that is
frequently inactivated and mutated in glioblastoma and other human cancers. Proceedings of the National Academy of Sciences, 2009. 106(23): p. 9435-9440.
21. Nie, Y., et al., STAT3 inhibition of gluconeogenesis is downregulated by SirT1. Nature
cell biology, 2009. 11(4): p. 492-500. 22. Bernier, M., et al., Negative regulation of STAT3 protein-mediated cellular respiration by
SIRT1 protein. J Biol Chem, 2011. 286(22): p. 19270-19279.
73
23. Gao, H., et al., Stat3 activation in acute lung injury. Journal of immunology (Baltimore, Md. : 1950), 2004. 172(12): p. 7703-7712.
24. Braun, D., M. Fribourg, and S. Sealfon, Cytokine Response Is Determined by Duration of
Receptor and Signal Transducers and Activators of Transcription 3 (STAT3) Activation. J Biol Chem, 2013. 288(5): p. 2986-2993.
25. Dauer, D., et al., Stat3 regulates genes common to both wound healing and cancer.
Oncogene, 2005. 24(21): p. 3397-3408. 26. Gallucci, R., et al., Impaired cutaneous wound healing in interleukin-6-deficient and
immunosuppressed mice. FASEB journal : official publication of the Federation of American Societies for Experimental Biology, 2000. 14(15): p. 2525-2531.
27. Sano, S., et al., Keratinocyte-specific ablation of Stat3 exhibits impaired skin remodeling,
but does not affect skin morphogenesis. The EMBO journal, 1999. 18(17): p. 4657-4668. 28. Pickert, G., et al., STAT3 links IL-22 signaling in intestinal epithelial cells to mucosal
wound healing. The Journal of experimental medicine, 2009. 206(7): p. 1465-1472. 29. Coffer, P.J., et al., Insulin activates Stat3 independently of p21ras-ERK and PI-3K signal
transduction. Oncogene, 1997. 15(21): p. 2529. 30. Carvalheira, J., et al., Insulin modulates leptin-induced STAT3 activation in rat
hypothalamus. FEBS letters, 2001. 500(3): p. 119-124. 31. Inoue, H., et al., Role of hepatic STAT3 in brain-insulin action on hepatic glucose
production. Cell metabolism, 2006. 3(4): p. 267-275. 32. Zong, C., et al., Mechanism of STAT3 activation by insulin-like growth factor I receptor.
J Biol Chem, 2000. 275(20): p. 15099-15105. 33. Niso-Santano, M., et al., Direct interaction between STAT3 and EIF2AK2 controls fatty
acid-induced autophagy. Autophagy, 2012. 9(3). 34. Takeda, K., et al., Targeted disruption of the mouse Stat3 gene leads to early embryonic
lethality. Proceedings of the National Academy of Sciences of the United States of America, 1997. 94(8): p. 3801-3804.
35. Sano, S., et al., Stat3 in thymic epithelial cells is essential for postnatal maintenance of
thymic architecture and thymocyte survival. Immunity, 2001. 15(2): p. 261-273. 36. Chapman, R., et al., Suppression of epithelial apoptosis and delayed mammary gland
involution in mice with a conditional knockout of Stat3. Genes & development, 1999. 13(19): p. 2604-2616.

74
37. Yu, H. and R. Jove, The STATs of cancer--new molecular targets come of age. Nature reviews. Cancer, 2004. 4(2): p. 97-105.
38. Cerami, E., et al., The cBio cancer genomics portal: an open platform for exploring
multidimensional cancer genomics data. Cancer discovery, 2012. 2(5): p. 401-404. 39. Wang, Z., et al., STAT3 is involved in esophageal carcinogenesis through regulation of
Oct-1. Carcinogenesis, 2013. 34(3): p. 678-688. 40. Sen, M., et al., Targeting Stat3 abrogates EGFR inhibitor resistance in cancer. Clinical
cancer research : an official journal of the American Association for Cancer Research, 2012. 18(18): p. 4986-4996.
41. Yu, C.-L., et al., Enhanced DNA-binding activity of a Stat3-related protein in cells
transformed by the Src oncoprotein. Science, 1995. 269(5220): p. 81-83. 42. Bromberg, J., et al., Stat3 activation is required for cellular transformation by v-src.
Molecular and cellular biology, 1998. 18(5): p. 2553-2558. 43. Turkson, J., et al., Stat3 activation by Src induces specific gene regulation and is
required for cell transformation. Molecular and cellular biology, 1998. 18(5): p. 2545-2552.
44. Pedranzini, L., A. Leitch, and J. Bromberg, Stat3 is required for the development of skin
cancer. The Journal of clinical investigation, 2004. 114(5): p. 619-622. 45. Bowman, T., et al., Stat3-mediated Myc expression is required for Src transformation
and PDGF-induced mitogenesis. Proceedings of the National Academy of Sciences of the United States of America, 2001. 98(13): p. 7319-7324.
46. Yu, C.-Y., et al., STAT3 activation is required for interleukin-6 induced transformation in
tumor-promotion sensitive mouse skin epithelial cells. Oncogene, 2002. 21(25): p. 3949-3960.
47. Chiarle, R., et al., Stat3 is required for ALK-mediated lymphomagenesis and provides a
possible therapeutic target. Nature medicine, 2005. 11(6): p. 623-629. 48. Vultur, A., et al., Stat3 is required for full neoplastic transformation by the Simian Virus
40 large tumor antigen. Molecular biology of the cell, 2005. 16(8): p. 3832-3846. 49. Dasgupta, A., et al., Stat3 activation is required for the growth of U87 cell-derived
tumours in mice. European journal of cancer (Oxford, England : 1990), 2009. 45(4): p. 677-684.
50. George, R., et al., Activating mutations in ALK provide a therapeutic target in
neuroblastoma. Nature, 2008. 455(7215): p. 975-978.

75
51. Anand, M., R. Lai, and P. Gelebart, -catenin is constitutively active and increases STAT3
expression/activation in anaplastic lymphoma kinase-positive anaplastic large cell lymphoma. Haematologica, 2010. 96.
52. Jones, A., et al., Widespread occurrence of the JAK2 V617F mutation in chronic
myeloproliferative disorders. Blood, 2005. 106(6): p. 2162-2168. 53. Scott, L., et al., The V617F JAK2 mutation is uncommon in cancers and in myeloid
malignancies other than the classic myeloproliferative disorders. Blood, 2005. 106(8): p. 2920-2921.
54. Campbell, P., et al., V617F mutation in JAK2 is associated with poorer survival in
idiopathic myelofibrosis. Blood, 2006. 107(5): p. 2098-2100. 55. Oku, S., et al., JAK2 V617F uses distinct signalling pathways to induce cell proliferation
and neutrophil activation. British journal of haematology, 2010. 150(3): p. 334-344. 56. Fleming, T., et al., Amplification and/or overexpression of platelet-derived growth factor
receptors and epidermal growth factor receptor in human glial tumors. Cancer research, 1992. 52(16): p. 4550-4553.
57. Yeh, H.H., et al., Autocrine IL-6-induced Stat3 activation contributes to the pathogenesis
of lung adenocarcinoma and malignant pleural effusion. Oncogene, 2006. 25(31): p. 4300-4309.
58. Grandis, J., et al., Requirement of Stat3 but not Stat1 activation for epidermal growth
factor receptor- mediated cell growth In vitro. The Journal of clinical investigation, 1998. 102(7): p. 1385-1392.
59. Batra, S., et al., Epidermal growth factor ligand-independent, unregulated, cell-
transforming potential of a naturally occurring human mutant EGFRvIII gene. Cell growth & differentiation : the molecular biology journal of the American Association for Cancer Research, 1995. 6(10): p. 1251-1259.
60. Lo, H.-W., et al., Cyclooxygenase-2 is a novel transcriptional target of the nuclear
EGFR-STAT3 and EGFRvIII-STAT3 signaling axes. Molecular cancer research : MCR, 2010. 8(2): p. 232-245.
61. He, B., et al., SOCS-3 is frequently silenced by hypermethylation and suppresses cell
growth in human lung cancer. Proceedings of the National Academy of Sciences of the United States of America, 2003. 100(24): p. 14133-14138.
62. Iwamoto, T., et al., The JAK-inhibitor, JAB/SOCS-1 selectively inhibits cytokine-induced,
but not v-Src induced JAK-STAT activation. Oncogene, 2000. 19(41): p. 4795-4801.

76
63. Capello, D., et al., Alterations of negative regulators of cytokine signalling in immunodeficiency-related non-Hodgkin lymphoma. Hematological oncology, 2013. 31(1): p. 22-28.
64. Kou, X., et al., GSTP1 negatively regulates Stat3 activation in epidermal growth factor
signaling. Oncology letters, 2013. 5(3): p. 1053-1057. 65. Zhong, S., et al., Silencing of GSTP1 gene by CpG island DNA hypermethylation in HBV-
associated hepatocellular carcinomas. Clinical cancer research : an official journal of the American Association for Cancer Research, 2002. 8(4): p. 1087-1092.
66. Lin, X., et al., Reversal of GSTP1 CpG island hypermethylation and reactivation of pi-
class glutathione S-transferase (GSTP1) expression in human prostate cancer cells by treatment with procainamide. Cancer research, 2001. 61(24): p. 8611-8616.
67. Schlessinger, K. and D. Levy, Malignant transformation but not normal cell growth
depends on signal transducer and activator of transcription 3. Cancer research, 2005. 65(13): p. 5828-5834.
68. Corvinus, F., et al., Persistent STAT3 activation in colon cancer is associated with
enhanced cell proliferation and tumor growth. Neoplasia (New York, N.Y.), 2005. 7(6): p. 545-555.
69. Niu, G., et al., Roles of activated Src and Stat3 signaling in melanoma tumor cell growth.
Oncogene, 2002. 21(46): p. 7001-7010. 70. Rahaman, S., et al., Inhibition of constitutively active Stat3 suppresses proliferation and
induces apoptosis in glioblastoma multiforme cells. Oncogene, 2002. 21(55): p. 8404-8413.
71. Bhardwaj, A., et al., Resveratrol inhibits proliferation, induces apoptosis, and overcomes
chemoresistance through down-regulation of STAT3 and nuclear factor-kappaB-regulated antiapoptotic and cell survival gene products in human multiple myeloma cells. Blood, 2007. 109(6): p. 2293-2302.
72. Weerasinghe, P., et al., Inhibition of Stat3 activation and tumor growth suppression of
non-small cell lung cancer by G-quartet oligonucleotides. International journal of oncology, 2007. 31(1): p. 129-136.
73. Leslie, K., et al., Cyclin D1 is transcriptionally regulated by and required for
transformation by activated signal transducer and activator of transcription 3. Cancer research, 2006. 66(5): p. 2544-2552.
74. Ewen, M. and J. Lamb, The activities of cyclin D1 that drive tumorigenesis. Trends in
molecular medicine, 2004. 10(4): p. 158-162.

77
75. Cao, X., et al., Stat3 inhibits WTX expression through up-regulation of microRNA-370 in Wilms tumor. FEBS letters, 2013. 587(6): p. 639-644.
76. Zhuang, L., et al., Mcl-1, Bcl-XL and Stat3 expression are associated with progression of
melanoma whereas Bcl-2, AP-2 and MITF levels decrease during progression of melanoma. Modern pathology : an official journal of the United States and Canadian Academy of Pathology, Inc, 2007. 20(4): p. 416-426.
77. Catlett-Falcone, R., et al., Constitutive activation of Stat3 signaling confers resistance to
apoptosis in human U266 myeloma cells. Immunity, 1999. 10(1): p. 105-115. 78. Zushi, S., et al., STAT3 mediates the survival signal in oncogenic ras-transfected
intestinal epithelial cells. International journal of cancer. Journal international du cancer, 1998. 78(3): p. 326-330.
79. Real, P., et al., Resistance to chemotherapy via Stat3-dependent overexpression of Bcl-2
in metastatic breast cancer cells. Oncogene, 2002. 21(50): p. 7611-7618. 80. Timofeeva, O., et al., STAT3 suppresses transcription of proapoptotic genes in cancer
cells with the involvement of its N-terminal domain. Proceedings of the National Academy of Sciences of the United States of America, 2013.
81. Xie, T.-x., et al., Activation of stat3 in human melanoma promotes brain metastasis.
Cancer research, 2006. 66(6): p. 3188-3196. 82. Itoh, M., et al., Requirement of STAT3 activation for maximal collagenase-1 (MMP-1)
induction by epidermal growth factor and malignant characteristics in T24 bladder cancer cells. Oncogene, 2006. 25(8): p. 1195-1204.
83. Fujii, M., et al., Intercellular contact augments epidermal growth factor receptor (EGFR)
and signal transducer and activator of transcription 3 (STAT3)-activation which increases podoplanin-expression in order to promote squamous cell carcinoma motility. Cellular signalling, 2013. 25(4): p. 760-765.
84. Zhou, W., J. Grandis, and A. Wells, STAT3 is required but not sufficient for EGF
receptor-mediated migration and invasion of human prostate carcinoma cell lines. British journal of cancer, 2006. 95(2): p. 164-171.
85. Priester, M., et al., STAT3 silencing inhibits glioma single cell infiltration and tumor
growth. Neuro-oncology, 2013. 86. Cascio, S., et al., Expression of angiogenic regulators, VEGF and leptin, is regulated by
the EGF/PI3K/STAT3 pathway in colorectal cancer cells. Journal of cellular physiology, 2009. 221(1): p. 189-194.

78
87. Wei, L.-H., et al., Interleukin-6 promotes cervical tumor growth by VEGF-dependent angiogenesis via a STAT3 pathway. Oncogene, 2003. 22(10): p. 1517-1527.
88. Valdembri, D., et al., In vivo activation of JAK2/STAT-3 pathway during angiogenesis
induced by GM-CSF. FASEB journal : official publication of the Federation of American Societies for Experimental Biology, 2002. 16(2): p. 225-227.
89. Zhao, M., et al., JAK2/STAT3 signaling pathway activation mediates tumor angiogenesis
by upregulation of VEGF and bFGF in non-small-cell lung cancer. Lung cancer (Amsterdam, Netherlands), 2011. 73(3): p. 366-374.
90. Sriuranpong, V., et al., Epidermal growth factor receptor-independent constitutive
activation of STAT3 in head and neck squamous cell carcinoma is mediated by the autocrine/paracrine stimulation of the interleukin 6/gp130 cytokine system. Cancer research, 2003. 63(11): p. 2948-2956.
91. Niu, G., et al., Constitutive Stat3 activity up-regulates VEGF expression and tumor
angiogenesis. Oncogene, 2002. 21(13): p. 2000-2008. 92. Masuda, M., et al., Signal transducers and activators of transcription 3 up-regulates
vascular endothelial growth factor production and tumor angiogenesis in head and neck squamous cell carcinoma. Oral oncology, 2007. 43(8): p. 785-790.
93. Grivennikov, S., et al., IL-6 and Stat3 are required for survival of intestinal epithelial
cells and development of colitis-associated cancer. Cancer cell, 2009. 15(2): p. 103-113. 94. Liang, J., et al., Sphingosine-1-phosphate links persistent STAT3 activation, chronic
intestinal inflammation, and development of colitis-associated cancer. Cancer cell, 2013. 23(1): p. 107-120.
95. Burdelya, L., et al., Stat3 activity in melanoma cells affects migration of immune effector
cells and nitric oxide-mediated antitumor effects. Journal of immunology (Baltimore, Md. : 1950), 2005. 174(7): p. 3925-3931.
96. See, A., et al., The role of STAT3 activation in modulating the immune microenvironment
of GBM. Journal of neuro-oncology, 2012. 110(3): p. 359-368. 97. Sherry, M., et al., STAT3 is required for proliferation and maintenance of multipotency in
glioblastoma stem cells. Stem cells (Dayton, Ohio), 2009. 27(10): p. 2383-2392. 98. Wong, A., et al., Phase I and biomarker study of OPB-51602, a novel signal transducer
and activator of transcription (STAT) 3 inhibitor, in patients with refractory solid malignancies. Annals of Oncology, 2015: p. mdv026.
99. Kang, Y., et al., 217 Results of a phase I, open-label, multicentre study to assess the
safety, tolerability, pharmacokinetics and preliminary anti-tumour activity of AZD9150

79
in patients with advanced/metastatic hepatocellular carcinoma. European Journal of Cancer, 2014. 50: p. 73-74.
100. Sen, M., et al., First-in-human trial of a STAT3 decoy oligonucleotide in head and neck
tumors: implications for cancer therapy. Cancer discovery, 2012. 2(8): p. 694-705. 101. Schust, J., et al., Stattic: a small-molecule inhibitor of STAT3 activation and
dimerization. Chemistry & biology, 2006. 13(11): p. 1235-1242. 102. Ren, Z., et al., Identification of a high-affinity phosphopeptide inhibitor of Stat3.
Bioorganic & medicinal chemistry letters, 2003. 13(4): p. 633-636. 103. Zhang, X., et al., A novel small-molecule disrupts Stat3 SH2 domain-phosphotyrosine
interactions and Stat3-dependent tumor processes. Biochemical pharmacology, 2010. 79(10): p. 1398-1409.
104. Gomez, C., et al., Design, synthesis, and evaluation of peptidomimetics containing
Freidinger lactams as STAT3 inhibitors. Bioorganic & medicinal chemistry letters, 2009. 19(6): p. 1733-1736.
105. Epling-Burnette, P., et al., Inhibition of STAT3 signaling leads to apoptosis of leukemic
large granular lymphocytes and decreased Mcl-1 expression. The Journal of clinical investigation, 2001. 107(3): p. 351-362.
106. Song, H., et al., A low-molecular-weight compound discovered through virtual database
screening inhibits Stat3 function in breast cancer cells. Proceedings of the National Academy of Sciences of the United States of America, 2005. 102(13): p. 4700-4705.
107. Sen, M., et al., Lack of toxicity of a STAT3 decoy oligonucleotide. Cancer chemotherapy
and pharmacology, 2009. 63(6): p. 983-995. 108. Looyenga, B., et al., STAT3 is activated by JAK2 independent of key oncogenic driver
mutations in non-small cell lung carcinoma. PloS one, 2012. 7(2). 109. Korkaya, H., et al., Activation of an IL6 inflammatory loop mediates trastuzumab
resistance in HER2+ breast cancer by expanding the cancer stem cell population. Molecular cell, 2012. 47(4): p. 570-584.
110. Bewry, N., et al., Stat3 contributes to resistance toward BCR-ABL inhibitors in a bone
marrow microenvironment model of drug resistance. Molecular cancer therapeutics, 2008. 7(10): p. 3169-3175.
111. Groesser, L., et al., Postzygotic HRAS and KRAS mutations cause nevus sebaceous and
Schimmelpenning syndrome. Nat Genet, 2012. 44(7): p. 783-7.

80
112. Paez, J.G., et al., EGFR mutations in lung cancer: correlation with clinical response to gefitinib therapy. Science, 2004. 304(5676): p. 1497-500.
113. Julien, S., et al., Inside the human cancer tyrosine phosphatome. Nature reviews. Cancer,
2011. 11(1): p. 35-49. 114. Lui, V.W., et al., Frequent Mutation of the PI3K Pathway in Head and Neck Cancer
Defines Predictive Biomarkers. Cancer Discov, 2013. 3(7): p. 761-9. 115. Gao, S.P., et al., Mutations in the EGFR kinase domain mediate STAT3 activation via IL-
6 production in human lung adenocarcinomas. J Clin Invest, 2007. 117(12): p. 3846-56. 116. Stransky, N., et al., The mutational landscape of head and neck squamous cell
carcinoma. Science, 2011. 333(6046): p. 1157-1160. 117. Network, C.G.A., Comprehensive genomic characterization of head and neck squamous
cell carcinomas. Nature, 2015. 517(7536): p. 576-582. 118. Agrawal, N., et al., Exome sequencing of head and neck squamous cell carcinoma reveals
inactivating mutations in NOTCH1. Science, 2011. 333(6046): p. 1154-1157. 119. Lui, V.W.Y., et al., Frequent mutation of receptor protein tyrosine phosphatases
provides a mechanism for STAT3 hyperactivation in head and neck cancer. Proceedings of the National Academy of Sciences, 2014. 111(3): p. 1114-1119.
120. Barretina, J., et al., The Cancer Cell Line Encyclopedia enables predictive modelling of
anticancer drug sensitivity. Nature, 2012. 483(7391): p. 603-607. 121. Blaskovich, M.A., et al., Discovery of JSI-124 (cucurbitacin I), a selective Janus
kinase/signal transducer and activator of transcription 3 signaling pathway inhibitor with potent antitumor activity against human and murine cancer cells in mice. Cancer research, 2003. 63(6): p. 1270-1279.
122. Wang, Z., et al., Mutational analysis of the tyrosine phosphatome in colorectal cancers.
Science, 2004. 304(5674): p. 1164-6. 123. Chen, Y., et al., STAT3, a Poor Survival Predicator, Is Associated with Lymph Node
Metastasis from Breast Cancer. J Breast Cancer, 2013. 16(1): p. 40-9. 124. Macha, M.A., et al., Prognostic significance of nuclear pSTAT3 in oral cancer. Head
Neck, 2011. 33(4): p. 482-9. 125. Kusaba, T., et al., Activation of STAT3 is a marker of poor prognosis in human colorectal
cancer. Oncol Rep, 2006. 15(6): p. 1445-51.

81
126. Zhang, X., et al., Identification of STAT3 as a substrate of receptor protein tyrosine phosphatase T. Proc Natl Acad Sci U S A, 2007. 104(10): p. 4060-4.
127. Siegel, R.L., K.D. Miller, and A. Jemal, Cancer statistics, 2015. CA: a cancer journal for
clinicians, 2015. 65(1): p. 5-29. 128. Mali, S.B., Review of STAT3 (Signal Transducers and Activators of Transcription) in
head and neck cancer. Oral oncology, 2015. 129. Li, L.-C. and R. Dahiya, MethPrimer: designing primers for methylation PCRs.
Bioinformatics (Oxford, England), 2002. 18(11): p. 1427-1431. 130. Ji, T., et al., Abrogation of constitutive Stat3 activity circumvents cisplatin resistant
ovarian cancer. Cancer letters, 2013. 341(2): p. 231-239. 131. Benson, E., et al., The clinical impact of HPV tumor status upon head and neck squamous
cell carcinomas. Oral oncology, 2014. 50(6): p. 565-574. 132. Leemans, C.R., B.J. Braakhuis, and R.H. Brakenhoff, The molecular biology of head and
neck cancer. Nature Reviews Cancer, 2011. 11(1): p. 9-22. 133. Licitra, L., et al., Evaluation of EGFR gene copy number as a predictive biomarker for
the efficacy of cetuximab in combination with chemotherapy in the first-line treatment of recurrent and/or metastatic squamous cell carcinoma of the head and neck: EXTREME study. Annals of oncology : official journal of the European Society for Medical Oncology / ESMO, 2011. 22(5): p. 1078-1087.
134. Peyser, N.D. and J.R. Grandis, Critical analysis of the potential for targeting STAT3 in
human malignancy. OncoTargets and therapy, 2013. 6: p. 999. 135. Laczmanska, I., et al., Protein tyrosine phosphatase receptor-like genes are frequently
hypermethylated in sporadic colorectal cancer. Journal of human genetics, 2013. 58(1): p. 11-15.
136. Gao, W., et al., Variable DNA methylation patterns associated with progression of
disease in hepatocellular carcinomas. Carcinogenesis, 2008. 29(10): p. 1901-1910. 137. Giro, C., et al., High rate of severe radiation dermatitis during radiation therapy with
concurrent cetuximab in head and neck cancer: results of a survey in EORTC institutes. Radiotherapy and Oncology, 2009. 90(2): p. 166-171.
138. Pryor, D.I., et al., Enhanced toxicity with concurrent cetuximab and radiotherapy in head
and neck cancer. Radiotherapy and Oncology, 2009. 90(2): p. 172-176. 139. So, W., et al., Quality-of-life among head and neck cancer survivors at one year after
treatment–A systematic review. European journal of cancer, 2012. 48(15): p. 2391-2408.