Ptolemy’s Geographia in digits - e-Perimetron · Ptolemy’s Geographia in digits Keywords:...
18
e-Perimetron, Vol. 3, No. 1, 2008 [22-39] www.e-perimetron.org | ISSN 1790-3769 [22] Evangelos Livieratos 1 , Angeliki Tsorlini 2 , Chryssoula Boutoura 3 , Manolis Manoledakis 4 Ptolemy’s Geographia in digits Keywords: Ptolemy’s Geographia; Ptolemy’s coordinates; Ptolemy maps; History of maps; map comparison; cartometry; optimal fitting. Summary Claudius Ptolemy, in his Geographia, gives a list of geographic coordinates of spherical longitude and latitude of almost ten thousand point locations on the earth surface, as they were known at his times. The list is organized in Tabulae which cor- respond to specific regions of the three known continents at that time, Africa, Asia and Europe. Research on Ptolemy’s Geographia has started at the University of Thessaloniki, Greece, in the eighties, focused mainly, but not exclusively, on data re- lated to territories which are now under the sovereignty of the modern Greek state. This research is concentrated on the study and analysis of Toponymy, in one hand, but more specifically, on the intrinsic geometric structure given in Geographia, pa- rameterized by the arrays of spherical geographic coordinates of longitude and lati- tude assigned to points on the earth surface apparently known at Ptolemy’s times. The research concerns: a) the geometric properties related to the complete sets of co- ordinates of point locations (towns and points on natural features, as rivers, mountain crests, promontories etc.) which are identified, or not, today, and b) the use of only the identified location of points in order to approximate non-identified locations (in Ptolemy’s sense) on modern geographic layouts, assisted by relevant archaeological analyses and evidences. The “Thessaloniki Project” on Ptolemy’s Geographia is highly supported by the application of a manifold of geodetic methodologies and techniques, which are coupled with modern digital tools allowing powerful and prompt computational interactivity and visualization of the results in graphic envi- ronment, important factors in the analytical processing. The research is also sup- ported and enhanced by the extensive comparative use of old maps created on the basis of Ptolemy’s Geographia, a process which permits the pure cartographic exten- sion and enrichment of the project offering in addition insights from the relevant study of Geographia-born maps. Introduction Geographia is the fundamental Greek work of the Roman era, written by Claudius Ptolemy which described for the first time, textually and numerically, the geography of the known World in the 2 nd c. A.D. In this work Ptolemy gives the know-how on map construction and also a list of geographic coordinates of spherical longitude and latitude of almost ten thousand point locations, on the earth surface, known at his times. In this paper, which is based on the research carried out the last years by members of the Cartography Group at the Faculty of Surveying Engineering, University of Thessaloniki, 1 Professor of geodesy and cartography, Aristotle University of Thessaloniki, Greece [[email protected] ] 2 Surveying engineer, MSc in cartography and geography, Doctoral candidate, Aristotle University of Thessaloniki, Greece [[email protected] ] 3 Professor of cartography, Aristotle University of Thessaloniki, Greece [[email protected] ] 4 PhD in Archaeology, Aristotle University of Thessaloniki; Visiting lecturer of archaeology, Democri- tus University of Thrace, Greece [[email protected] ]
Transcript of Ptolemy’s Geographia in digits - e-Perimetron · Ptolemy’s Geographia in digits Keywords:...

e-Perimetron, Vol. 3, No. 1, 2008 [22-39] www.e-perimetron.org | ISSN 1790-3769
[22]
Evangelos Livieratos1, Angeliki Tsorlini
2, Chryssoula Boutoura
3, Manolis Manoledakis
4
Ptolemy’s Geographia in digits
Keywords: Ptolemy’s Geographia; Ptolemy’s coordinates; Ptolemy maps; History of maps;
map comparison; cartometry; optimal fitting.
Summary
Claudius Ptolemy, in his Geographia, gives a list of geographic coordinates of
spherical longitude and latitude of almost ten thousand point locations on the earth
surface, as they were known at his times. The list is organized in Tabulae which cor-
respond to specific regions of the three known continents at that time, Africa, Asia
and Europe. Research on Ptolemy’s Geographia has started at the University of
Thessaloniki, Greece, in the eighties, focused mainly, but not exclusively, on data re-
lated to territories which are now under the sovereignty of the modern Greek state.
This research is concentrated on the study and analysis of Toponymy, in one hand,
but more specifically, on the intrinsic geometric structure given in Geographia, pa-
rameterized by the arrays of spherical geographic coordinates of longitude and lati-
tude assigned to points on the earth surface apparently known at Ptolemy’s times.
The research concerns: a) the geometric properties related to the complete sets of co-
ordinates of point locations (towns and points on natural features, as rivers, mountain
crests, promontories etc.) which are identified, or not, today, and b) the use of only
the identified location of points in order to approximate non-identified locations (in
Ptolemy’s sense) on modern geographic layouts, assisted by relevant archaeological
analyses and evidences. The “Thessaloniki Project” on Ptolemy’s Geographia is
highly supported by the application of a manifold of geodetic methodologies and
techniques, which are coupled with modern digital tools allowing powerful and
prompt computational interactivity and visualization of the results in graphic envi-
ronment, important factors in the analytical processing. The research is also sup-
ported and enhanced by the extensive comparative use of old maps created on the
basis of Ptolemy’s Geographia, a process which permits the pure cartographic exten-
sion and enrichment of the project offering in addition insights from the relevant
study of Geographia-born maps.
Introduction
Geographia is the fundamental Greek work of the Roman era, written by Claudius
Ptolemy which described for the first time, textually and numerically, the geography of
the known World in the 2nd c. A.D. In this work Ptolemy gives the know-how on map
construction and also a list of geographic coordinates of spherical longitude and latitude
of almost ten thousand point locations, on the earth surface, known at his times.
In this paper, which is based on the research carried out the last years by members of the
Cartography Group at the Faculty of Surveying Engineering, University of Thessaloniki,
1 Professor of geodesy and cartography, Aristotle University of Thessaloniki, Greece [[email protected]] 2 Surveying engineer, MSc in cartography and geography, Doctoral candidate, Aristotle University of
Thessaloniki, Greece [[email protected]] 3 Professor of cartography, Aristotle University of Thessaloniki, Greece [[email protected]] 4 PhD in Archaeology, Aristotle University of Thessaloniki; Visiting lecturer of archaeology, Democri-
tus University of Thrace, Greece [[email protected]]
e-Perimetron, Vol. 3, No. 1, 2008 [22-39] www.e-perimetron.org | ISSN 1790-3769
[23]
the interest is focused on Ptolemy’s coordinates given in Geographia for the area corre-
sponding today to the territory of modern Greece. This area is listed mainly in Book III,
Chapters XI to XV concerning Europe and Book V and Chapter II concerning Asia. The
Tabulae referred to these chapters are Tabula IX and X of Europe and Tabula I of Asia,
with the largest part of modern Greece depicted in Tabula X (Fig.1). In the areas of inter-
est it is also included Cyprus, which is numerically described in Book V, Chapter XIII
and is depicted in Tabula IV.
The World of Ptolemy is classified in Regions, since each Chapter is referred to one of
them, giving by this way the concept of Atlas as it is understood today. The number of
toponyms depicted on the Tabulae of Europe is high, compared to the other Regions of
Asia and Africa. As it is also obvious from Fig. 1 the smaller the Tabula is the more im-
portant and detailed the region appears in Ptolemy’s Geographia.
Figure 1. The ‘Tabulae’ in Ptolemy’s Geographia.
As it is known, the importance of Ptolemy’s Geographia had “declined” for almost 10
centuries coming back in 13th c. thanks to Byzantine scholars in Constantinople influenc-
ing profoundly the revival of world’s geography and cartography in the Renaissance. This
work is referenced mainly for the historic, artistic and editorial value of its editions and
for the maps included but it is still almost unknown, with many questions left open, about
the numerical part of its content.
The positioning in Geographia
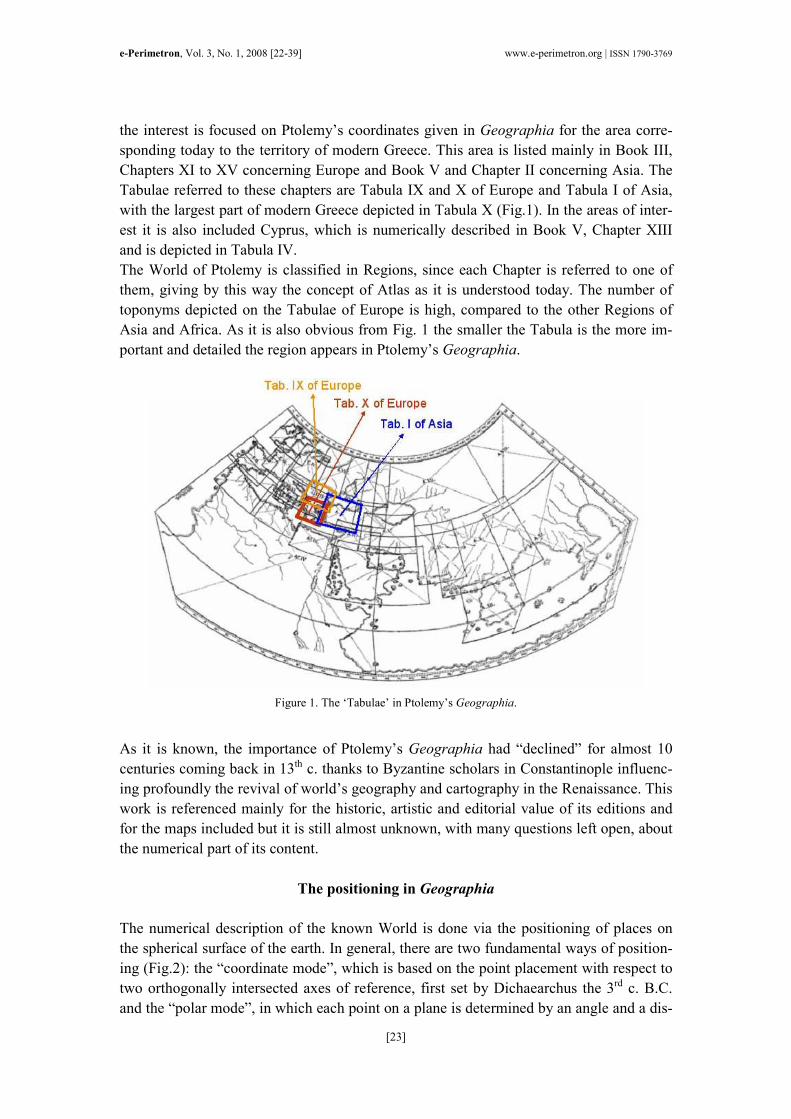
The numerical description of the known World is done via the positioning of places on
the spherical surface of the earth. In general, there are two fundamental ways of position-
ing (Fig.2): the “coordinate mode”, which is based on the point placement with respect to
two orthogonally intersected axes of reference, first set by Dichaearchus the 3rd c. B.C.
and the “polar mode”, in which each point on a plane is determined by an angle and a dis-
e-Perimetron, Vol. 3, No. 1, 2008 [22-39] www.e-perimetron.org | ISSN 1790-3769
[24]
tance from an origin. This second method recalls Aristotle’s formulation of the “direc-
tions of the wind” (3rd c. B.C.) which offers the method the angular component and the
seaman’s skill in determining distances in sea.
(a) (b)
Figure 2. Two ways of positioning: (a) the polar mode based on Aristotle’s “directions of the wind” and seamen’s
skill for estimation of distances and (b) the coordinate mode based on Dichaearchus
Ptolemy, in his Geographia, uses the Hypparchus “model”, for the “coordinate mode”
point positioning on the surface of the sphere by using a pair of numbers, the geographi-
cal coordinates, which derive from the intersection of two orthogonal lines on the Earth-
sphere, the parallels and the meridians. Each point is defined with two pure dimensionless
numbers, lambda (λ) for the longitude of the point and phi (φ), for the latitude.
In this book, there are about ten thousand point positions on the globe, in pairs of geo-
graphic coordinates as they were known in Ptolemy’s days, which referred to geographic
sites (i.e. towns, mountain picks, river mouths, promontories and other), identified or not
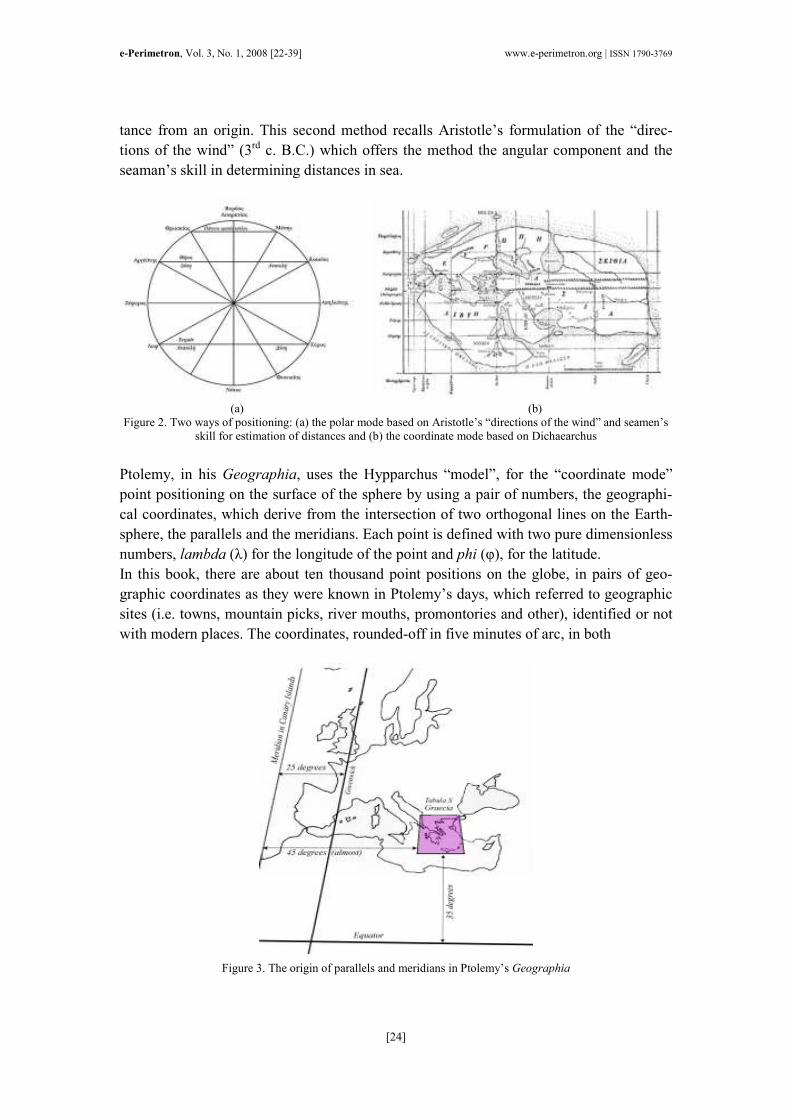
with modern places. The coordinates, rounded-off in five minutes of arc, in both
Figure 3. The origin of parallels and meridians in Ptolemy’s Geographia

e-Perimetron, Vol. 3, No. 1, 2008 [22-39] www.e-perimetron.org | ISSN 1790-3769
[25]
orthogonal primer directions (parallels and meridians), are grouped according to the con-
tinental and regional classification followed by Ptolemy in his Geographia, following the
known Ptolemaic reference system of parallels and meridians, the origin of which is re-
spectively close to actual Equator and close to the Canary Islands almost 25 degrees west
of the today’s origin at Greenwich (Fig.3).
Ptolemy Geographia and the Thessaloniki Project
Research on Ptolemy’s Geographia has started at the University of Thessaloniki, Greece,
in the early Eighties, focused mainly, but not exclusively, on data related to territories
which are now under the sovereignty of modern Greek state. This research is concentrated
on the study and analysis of toponymy, in one hand, but more specifically on the intrinsic
geometric structure given in Geographia, parameterized by the arrays of spherical geo-
graphic coordinates of longitude and latitude assigned to points on the earth surface ap-
parently known in the times of Ptolemy.
The editions currently used1, are the following:
1. Vatopedion Codex (13th -14th century),
2. Marciana Codex (15th century),
3. Codex Urbinas Lat.277, Biblioteca Apostolica Vaticana, 1472-1473 (Institut
Cartogràfic de Catalunya, Barcelona),
4. Donnus Nicolaus Germanus mid-15th century manuscript of Ptolemy’s Geogra-
phia as given in Codex Ebnerianus (Stevenson 1991: 92),
5. B.Pirckeymer’s edition, Lyon, 1535
6. G.Ruschelli’s edition, Venice 1574
7. G. Mercator’s Greek - Latin edition, Amsterdam 1605
8. two 19th century editions by Nobbe (Leipzig 1843 printed edition, 1966),
9. Müller’s edition (Paris 1883),
10. Ptolemaios, Handbuch der Geographie by A.Stueckelberger and G.Grasshoff,
Basel 2006
In this phase of the Project the areas of interest are the regions of Thrace, Macedonia,
Epirus, Achaia, Crete and Asia Minor. In these regions, almost 800 pairs of coordinates
are listed, 600 of them referred to the actual territory of Greece. An important part of our
research is also referred to Cyprus and to the Mediterranean coastline.
Processing the Ptolemy’s coordinates
According to the followed procedure in the Project, the coordinates for each place are first
stored digitally in a database according to the currently available editions of Ptolemy’s
Geographia. If necessary, the coordinates are transcribed from Byzantine Greek writing
and before introducing into the database, they are visually checked on screen. The all
around check for discrepancies in the point placement, especially the gross errors or mis-
prints, are then detected and evaluated. The coordinate database for all Geographia ver-
1 The project is open for more editions.

e-Perimetron, Vol. 3, No. 1, 2008 [22-39] www.e-perimetron.org | ISSN 1790-3769
[26]
sions in use is then ready for analytical tests. A sample of this catalogue is depicted in
Fig.4.
After the proper coordinate auto- and cross-checking (an example shown in Fig.5) and the
correction from gross errors, they are projected onto a map with a relevant graticule of
parallels and meridians, plotted in the same projection, using e.g the elementary geo-
graphic projection (y = Rφ, x = Rλ), assuming a unit radius reference sphere (R = 1) for
the earth’s model. By this way, a map is constructed for each Geographia version plotted
from the coordinates and depicting the toponyms of the regions (Fig.6).
Figure 4. Database of λ,φ input from various Geographia editions.
Figure 5. Coordinate differences (%) between Germanus and the other Geographia editions.
e-Perimetron, Vol. 3, No. 1, 2008 [22-39] www.e-perimetron.org | ISSN 1790-3769
[27]
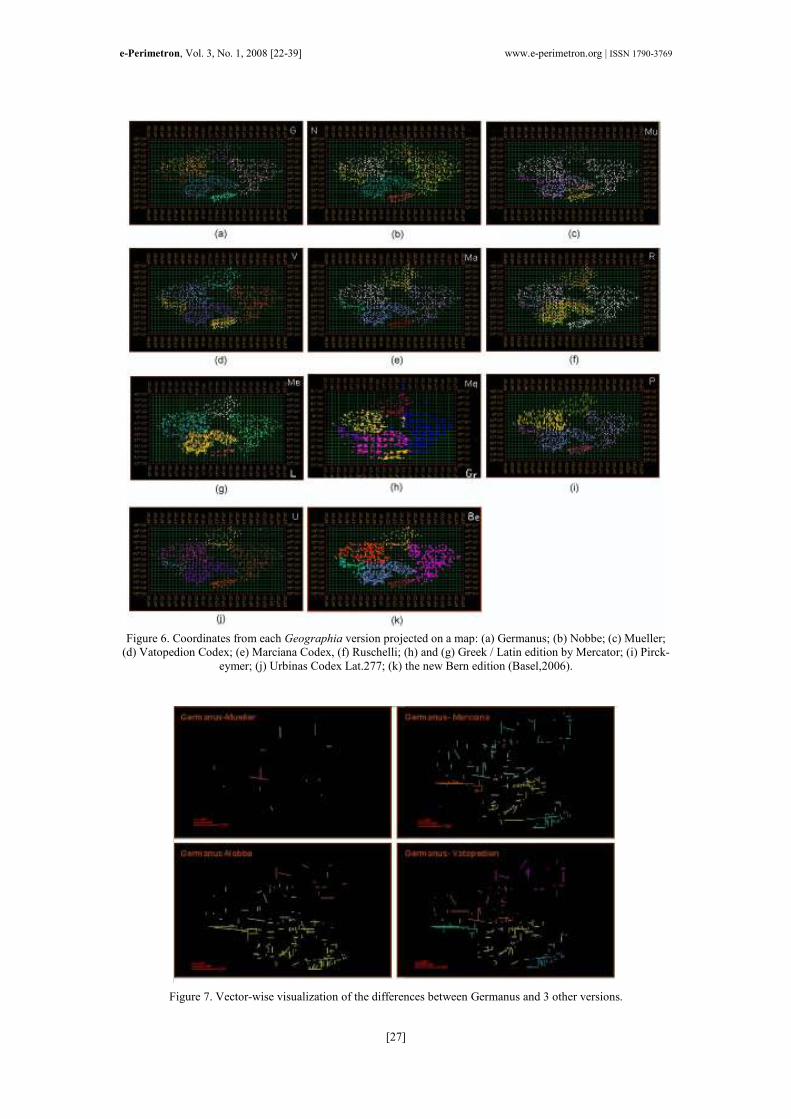
Figure 6. Coordinates from each Geographia version projected on a map: (a) Germanus; (b) Nobbe; (c) Mueller;
(d) Vatopedion Codex; (e) Marciana Codex, (f) Ruschelli; (h) and (g) Greek / Latin edition by Mercator; (i) Pirck-
eymer; (j) Urbinas Codex Lat.277; (k) the new Bern edition (Basel,2006).
Figure 7. Vector-wise visualization of the differences between Germanus and 3 other versions.

e-Perimetron, Vol. 3, No. 1, 2008 [22-39] www.e-perimetron.org | ISSN 1790-3769
[28]
The point positioning visualized on screen makes easier the auto- and cross- checking
of the coordinates, the detection of the differences, the gross errors, the double values
and other displacements they may occur, as it is shown in Fig.7.
Analysing the coordinates, an interesting point appeared concerning the relation between
the given numerical coordinates of positions, as listed in Ptolemy’s Geographia and the
same positions as they are graphically depicted in the later derived Ptolemaic maps. In
this case the comparison can be done, only after the georeference of the maps to their
proper coordinates (Livieratos 2006: 51-59).
An example of this process is shown in Fig.8, where the georeference of de Turre’s
(Rome 1490) Tabula X representation to the point-coordinates is performed in two ways:
with respect to the coordinates given in Geographia and with respect to the geographic
graticule (parallels and meridians). The comparison is done first as a point-wise process
and second as a graticule-wise process.
(a) (b)
Figure 8. Vector-wise visualization of the displacements of the points on de Turre’s Tabula X representation after
its georeference to the coordinates of the points projected to a map. The georeference of the map is made by two
ways: (a) using the operational coordinates as derived from the least coordinate discrepancy process and (b) using
the graticule of the digital version of the map.
Studies based on processing Ptolemy’s coordinates
Apart from the coordinate analysis and comparisons based on the coordinates listed in the
different Geographia versions, some geodetic methods and techniques are also applied
and tested in order to analyse the coordinates from a geodetic point of view, since λ, φ
generate spherical geometry, which is of geodetic interest. Some of the topics tackled in
this issue are listed below followed by an illustrative example.
The coordinate difference approach
An innovative point in this Project is that the focus on the geographic coordinate issue is
not so given to the coordinates of single points as much as to the coordinate-differences
between the points. The interest is thus concentrated on the treatment of the relative posi-
tion of the places introducing in geodetic analyses mostly the coordinate differences and
the spherical shortest lengths (geodesics). The use of the coordinate-difference or in other
words of the “relative positioning” in the analytic approach is a major contribution of the
Project since was never tested in the past in any attempt to treat Ptolemy’s positioning.

e-Perimetron, Vol. 3, No. 1, 2008 [22-39] www.e-perimetron.org | ISSN 1790-3769
[29]
With the coordinate difference approach the locality of the positioning properties are pre-
served opening new insights in the possible analyses using the Ptolemy’s coordinates, es-
pecially as the longitude differences are concerned.
A key issue here is the implementation of the spherical approximation of the “direct” and
“inverse” geodetic problems well-known in classical geodesy. In the “direct” case, given
the coordinates φ, λ of one point, the length and the orientation of the shortest line (geo-
desic) interconnecting a second point it is possible the computation of the coordinates of
the second point on a given sphere. In the “inverse” case, as it is the case in Geographia,
two given pairs of λ, φ defining two points on the sphere is enough for the computation of
the length and the orientation of the relevant interconnecting shortest line (geodesic) on a
given sphere. In Fig.9, are illustrated the length differences of the lines interconnecting
the most distant points in the overall Geographia area treated in the Project. It can be seen
the difference between the spherical length of the interconnecting line on a plane (ref:
“distance”) and the plane geodesic counterpart.
Figure 9. Geodesic lines and arc distances between points
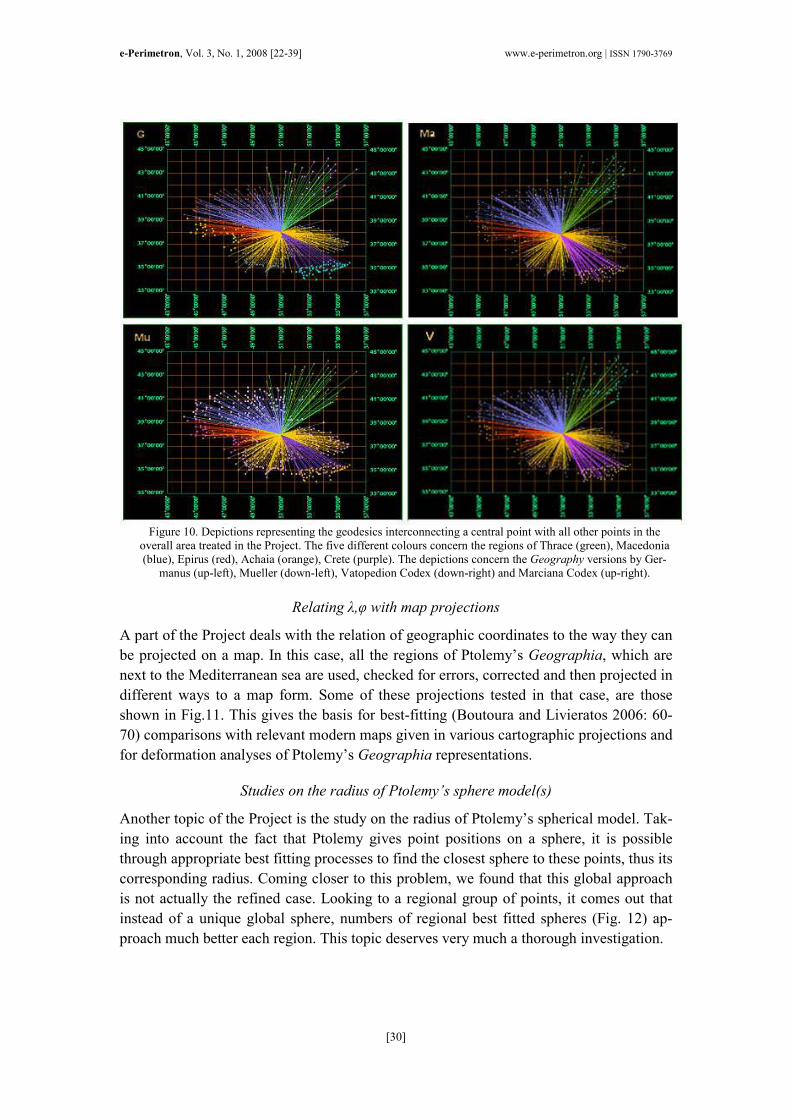
In Fig.10 it is depicted the images of the geodesic interconnecting a central point with all
other points in the overall area treated in the Project as they are computed from coordi-
nates listed in a number of Geographia versions. This type of visualization offers a direct
and comprehensive view of the differences and the similarities in the pattern of geodesics
enriching relevant comparative and classification studies concerning the numerical con-
tent of the Geographia versions.
e-Perimetron, Vol. 3, No. 1, 2008 [22-39] www.e-perimetron.org | ISSN 1790-3769
[30]
Figure 10. Depictions representing the geodesics interconnecting a central point with all other points in the
overall area treated in the Project. The five different colours concern the regions of Thrace (green), Macedonia
(blue), Epirus (red), Achaia (orange), Crete (purple). The depictions concern the Geography versions by Ger-
manus (up-left), Mueller (down-left), Vatopedion Codex (down-right) and Marciana Codex (up-right).
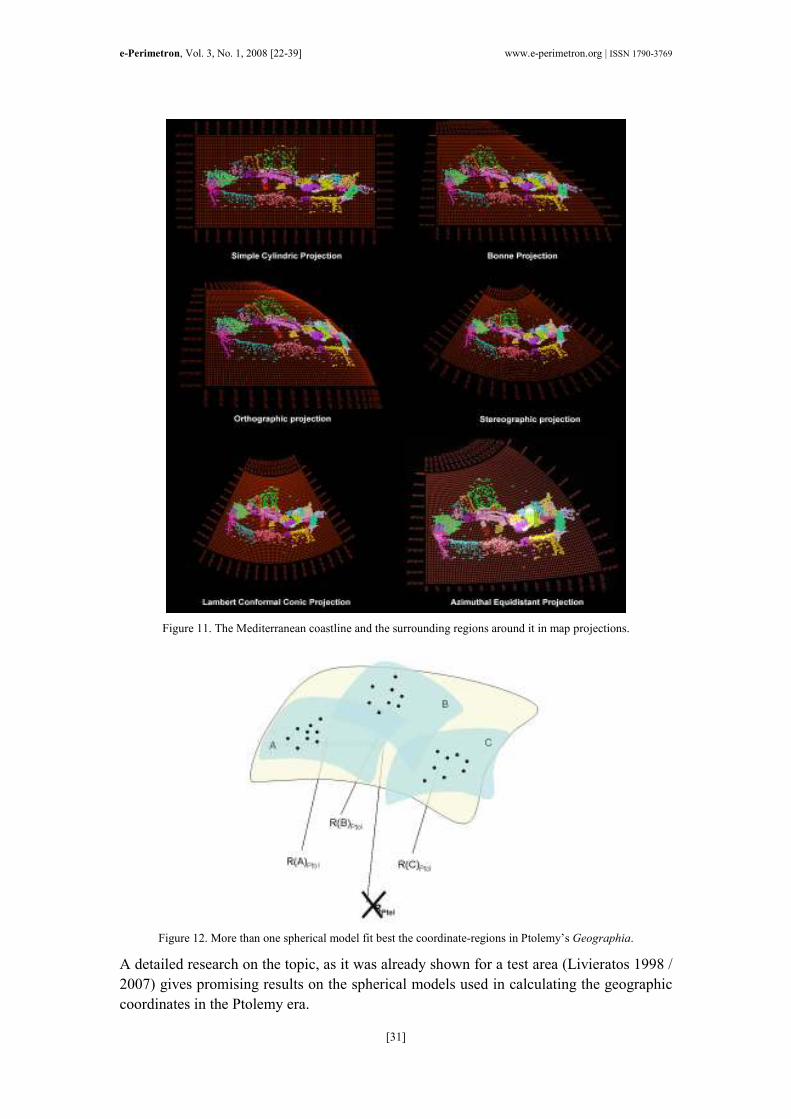
Relating λ,φ with map projections
A part of the Project deals with the relation of geographic coordinates to the way they can
be projected on a map. In this case, all the regions of Ptolemy’s Geographia, which are
next to the Mediterranean sea are used, checked for errors, corrected and then projected in
different ways to a map form. Some of these projections tested in that case, are those
shown in Fig.11. This gives the basis for best-fitting (Boutoura and Livieratos 2006: 60-
70) comparisons with relevant modern maps given in various cartographic projections and
for deformation analyses of Ptolemy’s Geographia representations.
Studies on the radius of Ptolemy’s sphere model(s)
Another topic of the Project is the study on the radius of Ptolemy’s spherical model. Tak-
ing into account the fact that Ptolemy gives point positions on a sphere, it is possible
through appropriate best fitting processes to find the closest sphere to these points, thus its
corresponding radius. Coming closer to this problem, we found that this global approach
is not actually the refined case. Looking to a regional group of points, it comes out that
instead of a unique global sphere, numbers of regional best fitted spheres (Fig. 12) ap-
proach much better each region. This topic deserves very much a thorough investigation.
e-Perimetron, Vol. 3, No. 1, 2008 [22-39] www.e-perimetron.org | ISSN 1790-3769
[31]
Figure 11. The Mediterranean coastline and the surrounding regions around it in map projections.
Figure 12. More than one spherical model fit best the coordinate-regions in Ptolemy’s Geographia.
A detailed research on the topic, as it was already shown for a test area (Livieratos 1998 /
2007) gives promising results on the spherical models used in calculating the geographic
coordinates in the Ptolemy era.
e-Perimetron, Vol. 3, No. 1, 2008 [22-39] www.e-perimetron.org | ISSN 1790-3769
[32]
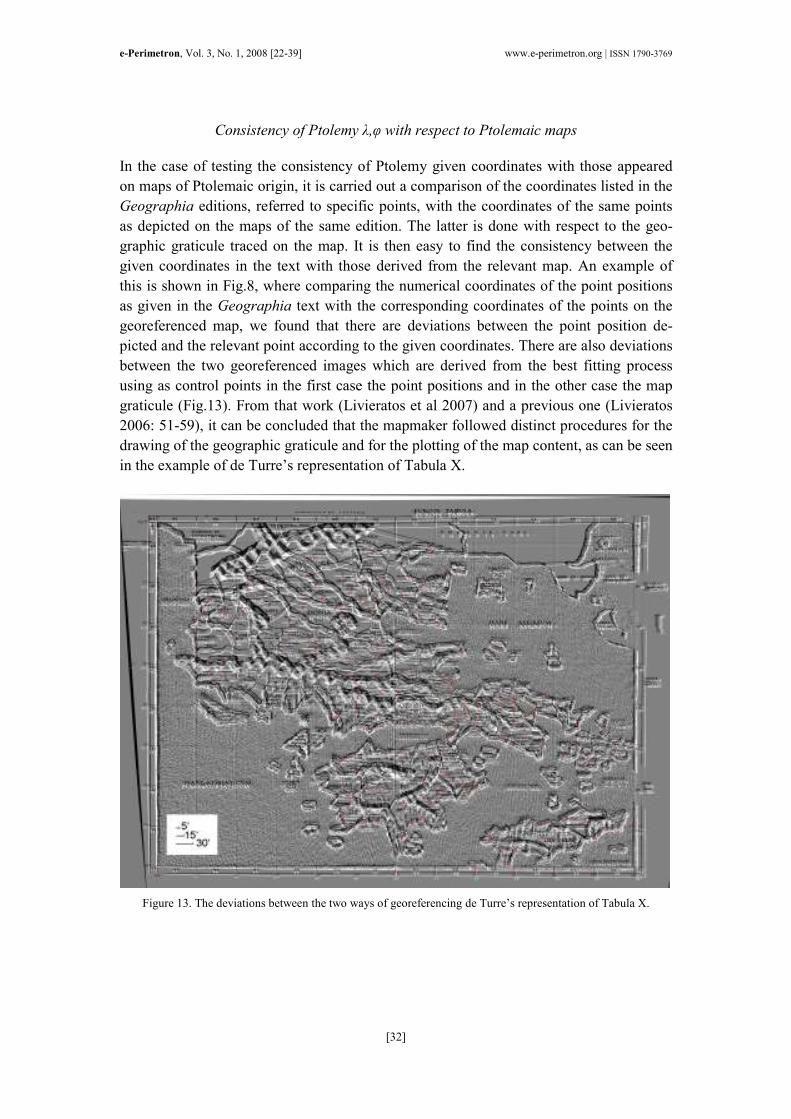
Consistency of Ptolemy λ,φ with respect to Ptolemaic maps
In the case of testing the consistency of Ptolemy given coordinates with those appeared
on maps of Ptolemaic origin, it is carried out a comparison of the coordinates listed in the
Geographia editions, referred to specific points, with the coordinates of the same points
as depicted on the maps of the same edition. The latter is done with respect to the geo-
graphic graticule traced on the map. It is then easy to find the consistency between the
given coordinates in the text with those derived from the relevant map. An example of
this is shown in Fig.8, where comparing the numerical coordinates of the point positions
as given in the Geographia text with the corresponding coordinates of the points on the
georeferenced map, we found that there are deviations between the point position de-
picted and the relevant point according to the given coordinates. There are also deviations
between the two georeferenced images which are derived from the best fitting process
using as control points in the first case the point positions and in the other case the map
graticule (Fig.13). From that work (Livieratos et al 2007) and a previous one (Livieratos
2006: 51-59), it can be concluded that the mapmaker followed distinct procedures for the
drawing of the geographic graticule and for the plotting of the map content, as can be seen
in the example of de Turre’s representation of Tabula X.
Figure 13. The deviations between the two ways of georeferencing de Turre’s representation of Tabula X.
e-Perimetron, Vol. 3, No. 1, 2008 [22-39] www.e-perimetron.org | ISSN 1790-3769
[33]
Studies on the consistency of ‘Geographia’ λ,φ with respect to modern counterpart values
In this part of the research, it is studied the relation between Ptolemy’s geographical co-
ordinates with their modern counterpart values. In order to perform such a comparison
and to identify the possible coincidence of places in Ptolemy’s era with their today’s
counterparts, it is important first, to compare the toponyms of each area with the
toponyms of the corresponding area of actual territory of Greece, based mainly on rele-
vant references with historical and archeological evidence.
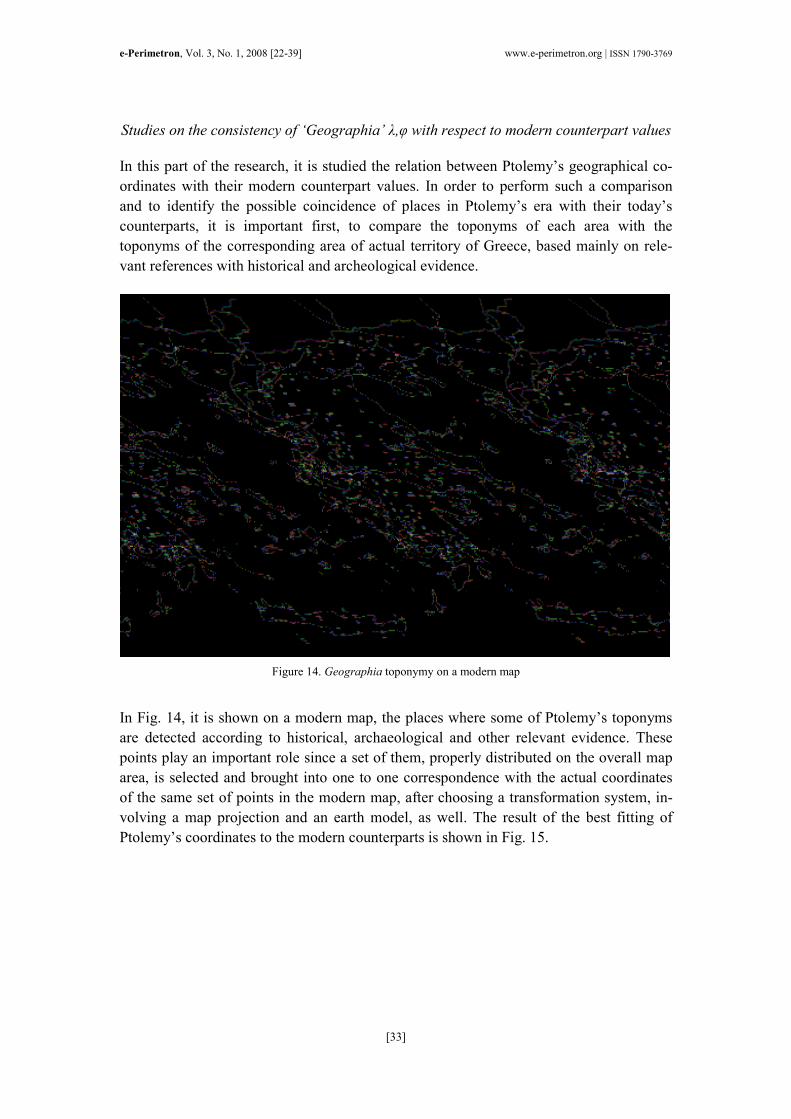
Figure 14. Geographia toponymy on a modern map
In Fig. 14, it is shown on a modern map, the places where some of Ptolemy’s toponyms
are detected according to historical, archaeological and other relevant evidence. These
points play an important role since a set of them, properly distributed on the overall map
area, is selected and brought into one to one correspondence with the actual coordinates
of the same set of points in the modern map, after choosing a transformation system, in-
volving a map projection and an earth model, as well. The result of the best fitting of
Ptolemy’s coordinates to the modern counterparts is shown in Fig. 15.

e-Perimetron, Vol. 3, No. 1, 2008 [22-39] www.e-perimetron.org | ISSN 1790-3769
[34]
Figure 15. Second order polynomial best fitting of Ptolemy’s representation into a modern map
Studies on λ,φ differences between Ptolemy’s ‘Geographia’ and modern maps
Figure 16. The isolines of longitude differences, in degrees, between Ptolemy’s values and their actual counterparts
e-Perimetron, Vol. 3, No. 1, 2008 [22-39] www.e-perimetron.org | ISSN 1790-3769
[35]
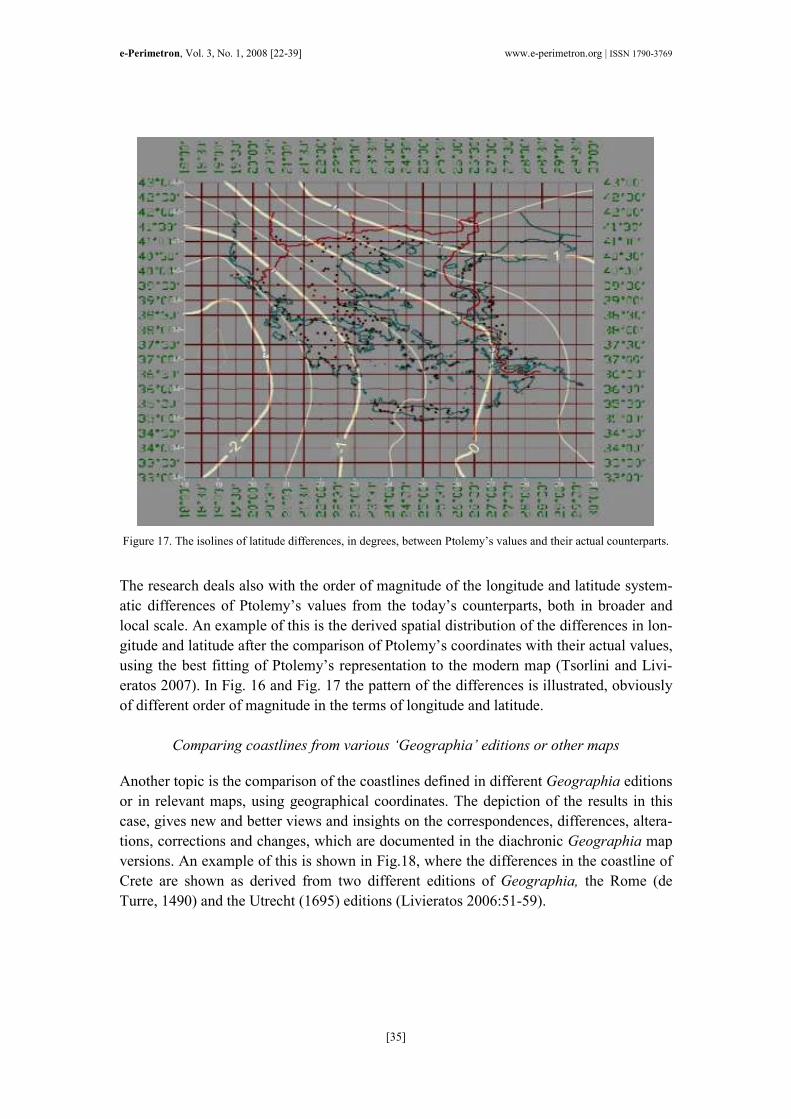
Figure 17. The isolines of latitude differences, in degrees, between Ptolemy’s values and their actual counterparts.
The research deals also with the order of magnitude of the longitude and latitude system-
atic differences of Ptolemy’s values from the today’s counterparts, both in broader and
local scale. An example of this is the derived spatial distribution of the differences in lon-
gitude and latitude after the comparison of Ptolemy’s coordinates with their actual values,
using the best fitting of Ptolemy’s representation to the modern map (Tsorlini and Livi-
eratos 2007). In Fig. 16 and Fig. 17 the pattern of the differences is illustrated, obviously
of different order of magnitude in the terms of longitude and latitude.
Comparing coastlines from various ‘Geographia’ editions or other maps
Another topic is the comparison of the coastlines defined in different Geographia editions
or in relevant maps, using geographical coordinates. The depiction of the results in this
case, gives new and better views and insights on the correspondences, differences, altera-
tions, corrections and changes, which are documented in the diachronic Geographia map
versions. An example of this is shown in Fig.18, where the differences in the coastline of
Crete are shown as derived from two different editions of Geographia, the Rome (de
Turre, 1490) and the Utrecht (1695) editions (Livieratos 2006:51-59).

e-Perimetron, Vol. 3, No. 1, 2008 [22-39] www.e-perimetron.org | ISSN 1790-3769
[36]
Figure 18. The island of Crete coastline in Rome (de Turre, 1490) and Utrecht (1695) Geographia editions.
Archaeological analysis of Ptolemy’s coordinates
In cooperation with archeologists and in addition to the geodetic analysis, the evidence
offered from archaeological research and historical sources is used for the analysis of
Ptolemy’s coordinates and their possible approximation to not yet identified sites of
historical interest.
For the area studied in this Project, some of the ancient cities mentioned by Ptolemy, are
known since either they exist today (Thessaloniki, Veroia etc.), or they are identified
through important findings (e.g. inscriptions) during archaeological excavations (Dion,
Pella etc.). However, many of Ptolemy’s ancient cities are still unidentified (Tristolos,
Euporia etc.). In Fig. 19 these categories of ancient cities are shown on a modern map.
One of the targets of this Project is the attempt to approximate the relative positions of
Ptolemy’s unidentified cities by examining the positions of their neighbouring known
locations. As an example, it is taken the ancient city of Aegae, the first capital of ancient
Macedonia. In Fig.20, it is shown the Ptolemy’s positioning of Aegae (dark grey spot), on
a modern map of the area, within a 10 km radius circle of uncertainty (light grey circle).
An alternative positioning of Aegae (dark grey star) is according to a similarity best
fitting of the Ptolemy’s site triangle “Edessa-Pella-Veroia” into its actual georeferenced
counterpart. In the modern map it is shown that the closer archaeological site to this circle
is that of Vergina (in red), only some ca. one to one and half kilometres far from this
circle to North-East. The result confirms and amplifies the upshot by some experts, that
Aegae is situated in the archaeological site of Vergina, the most probable place of Aegae
(Manoledakis and Livieratos 2006: 31-41).

e-Perimetron, Vol. 3, No. 1, 2008 [22-39] www.e-perimetron.org | ISSN 1790-3769
[37]
Figure 19. Known, identified and non-identified ancient cities and places from
Ptolemy’s Geographia on a modern map.
Figure 20. The position of Ptolemy’s Aegae and the archaeological site of Vergina,
only one to one and half kilometres away to North-East.

e-Perimetron, Vol. 3, No. 1, 2008 [22-39] www.e-perimetron.org | ISSN 1790-3769
[38]
The gained experience working with archaeologists confirms that this kind of analysis is
very useful in analysing the various hypotheses and scenarios in the process for the
identification of important ancient sites and locations.
Concluding remarks
Ptolemy’s Geographia is a work, referenced mainly for the historic, artistic and editorial
value of its editions and of the maps included in it, but it is still almost unknown for the
numerical part of its content. The new processing methods and technologies, of great im-
portance for the study of the geometric properties of early cartographic documents which
are massively available today allow tackling this issue as well. The exploitation of geo-
graphical coordinates listed in Ptolemy’s Geographia is a good start in this domain.
Comparative analyses of geographic coordinates between various editions are important
to detect errors and discrepancies and to possibly derive a corrected list of coordinates for
the places recorded by Ptolemy. Best fitting techniques are appropriate in order to com-
pare early relevant cartographic representations with their modern counterparts. Geodetic
analyses of the coordinates offer a new perspective for research and the approximation of
Ptolemy’s toponyms with respect to their modern counterparts broadens the interest on
the issue not only of cartographers but also of archaeologists who deal with the identifica-
tion of archaeological sites on the ground confirming or rejecting relevant positioning hy-
potheses and scenarios.
Acknowledgements
Thanks are due to Sylvia Ioannou and Artemis Scoutari for kindly giving access to Sylvia
Ioannou private collection (Ruschelli, Mercator and to Pirckeymer editions of Ptolemy’s
Geographia). Also to Carme Montaner and Raphael Roset at the Map Library of the In-
stitut Cartogràfic de Catalunya for providing additional data concerning the Codex Urbi-
nas facsimile.
References
Boutoura C., E. Livieratos 2006. Some fundamentals for the study of the geometry of
early maps by comparative methods. e_Perimetron 1 (1): 60-70 [In digital form www.e-
perimetron.org].
Fischer J. 1991. Introduction. In E. L. Stevenson (ed.) Claudius Ptolemy, The Geo-
graphy. New York: Dover, 3-15.
Livieratos E. 2006. Graticule versus point positioning in Ptolemy cartographies.
e_Perimetron 1 (1): 51-59 [In digital form www.e-perimetron.org].
Livieratos E. 2006. On the Study of the Geometric Properties of Historical Cartographic
Representations. Cartographica (volume41, issue2) 165-175.

e-Perimetron, Vol. 3, No. 1, 2008 [22-39] www.e-perimetron.org | ISSN 1790-3769
[39]
E. Livieratos 2007 (1998). 25 Aiōnes chartografias kai xartōn. Mia periēgēsē apo tous
Iōnes ston Ptolemaio kai ton Rēga, Thessaloniki: Ziti.
Manoledakis M., E. Livieratos 2006. On the digital placement of Aegae, the first capital
of ancient Macedonia, according to Ptolemy’s Geographia. ICA - First International
Workshop Digital Approaches to Cartographic Heritage, Thessaloniki, 18 – 19 May.
Published in e_Perimetron 2 (1): 31-41 [In digital form www.e-perimetron.org].
Livieratos E., A. Tsorlini, C. Boutoura 2006. Coordinate analysis of Ptolemy’s
Geographia Europe Tabula X with respect to geographic graticule and point positioning
in a Ptolemaic late 15th century map. ICA - First International Workshop Digital Ap-
proaches to Cartographic Heritage, Thessaloniki, 18 – 19 May. Published in
e_Perimetron 2 (2): 80-91 [In digital form www.e-perimetron.org].
Tsorlini A., E. Manoledakis, C. Boutoura, E. Livieratos 2007: Thessaloniki Project on
Ptolemy’s Geographia, 22nd International Conference on the History of Cartography,
Berne, 8-13 July.
Tsorlini A., E. Livieratos 2007. Digital Approaches in eliminating the higher order sys-
tematic effects in Ptolemy’s ‘Geographia’ longitude and latitude differences, XXIII In-
ternational Cartographic Conference, Moscow, 4-10 August
Editions of Ptolemy’s Geographia
Marciana Codex 15th century (Codex CCCLXXXVIII) in facsimilae, Athens: Militos
Publ.
Mercator G. 1605. Claudii Ptolemaei Alexandrini,Geographiae libri octo Graeco Latini.
Amsterdam
Müller C. 1883-1901. Claudii Ptolemaei Geographia. Bd. 1-2, Paris.
Nobbe C. (Hrsg., 1843-45). Klaudios Ptolemaios: Geographia. Leipzig. Reprint 1966.
Hildesheim.
Nordenskiöld A. E. 1978. Facsimile. Atlas to the early history of cartography. New York:
Dover.
Pirckeymer B. 1535. Claudii Ptolemaei Alexandrini,Geographicae Enarrationis libri
octo Ex Bilibaldi Birckeymheri tralatione, sed ad graeca & prisca exemplaria à
Michaële Villanovano iam primum recogniti. Adiecta insuper ab eodem scholia, quibus
exoleta urbium nomina ad nostri seculi morem exponuntur. ex officina Melchioris et
Gasparis Trechsel fratrum, Lyon.
Ruschelli G. 1574. La Geographia di Claudio Tolomeo Alexandrino. Venice.
Stevenson E. L., ed. 1991. Claudius Ptolemy, The Geography. New York: Dover.
Stueckelberger A., G. Grasshof, 2006. Ptolemaios, Handbuch der Geographie. Basel.
Urbinas Codex Lat.277, in fascimilae, Biblioteca Apostolica Vaticana, 1472-1473. Map
library of Institut Cartographic de Catalunya, Barcelona.
Vatopedion Codex 13th century, in facsimilae, Athens: Militos Publ.


![Spatial distribution of Ptolemy’s Geographia coordinate ... · e-Perimetron , Vol. 4, No. 4, 2009 [247-266] | ISSN 1790-3769 [249] known Ptolemaic reference system of parallels](https://static.fdocuments.us/doc/165x107/5b152b2a7f8b9a4e2c8de404/spatial-distribution-of-ptolemys-geographia-coordinate-e-perimetron-.jpg)