PT Mitra Pinasthika Mustika Tbk - MPM Group FY15...PT Mitra Pinasthika Mustika Tbk Mission To...
24
FY15 MPMX ANALYST & INVESTOR PRESENTATION 14 APRIL 2016 www.mpmgroup.co.id PT Mitra Pinasthika Mustika Tbk
Transcript of PT Mitra Pinasthika Mustika Tbk - MPM Group FY15...PT Mitra Pinasthika Mustika Tbk Mission To...
FY15 MPMX ANALYST & INVESTOR PRESENTATION
14 APRIL 2016
www.mpmgroup.co.id
PT Mitra Pinasthika Mustika Tbk

Mission To provide integrated, high quality automotive products and services that excite our customer and deliver sustainable returns to our stakeholders through synergistic capabilities and passionate people across our businesses
MPM CREDO
Vision To become a respected automotive products and services corporation recognized for our friendly household name
MPM Core Values
1. Passion for Excellence
2. Customer Focus
3. Continuous Improvement
4. Respect & Humble
5. Gratefulness
6. Integrity
7. Adaptability
8. Teamwork
KEY MESSAGES
3
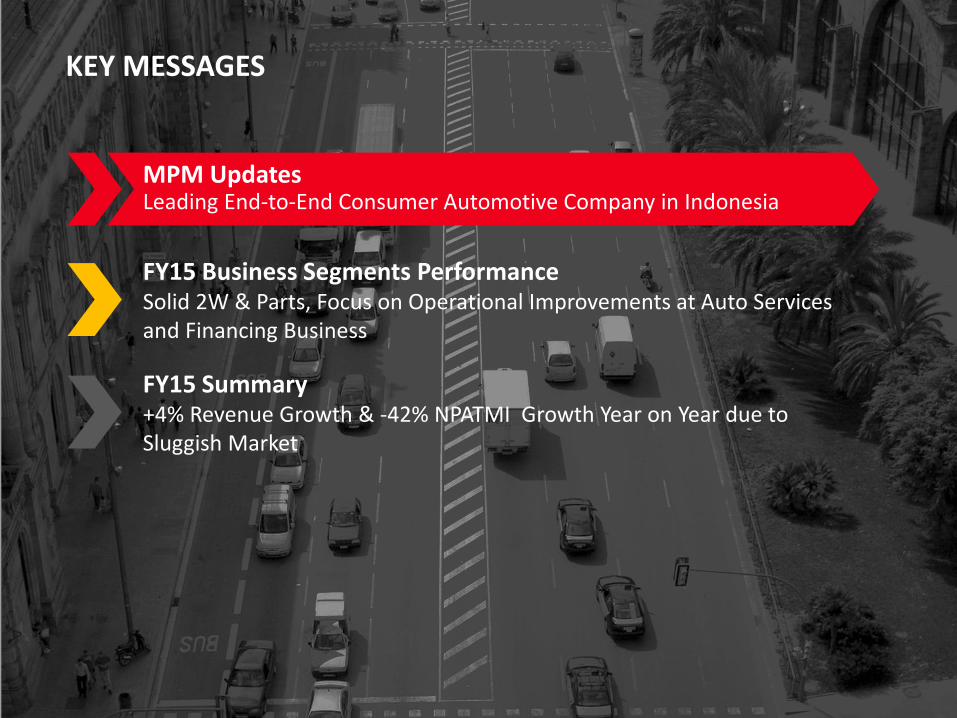
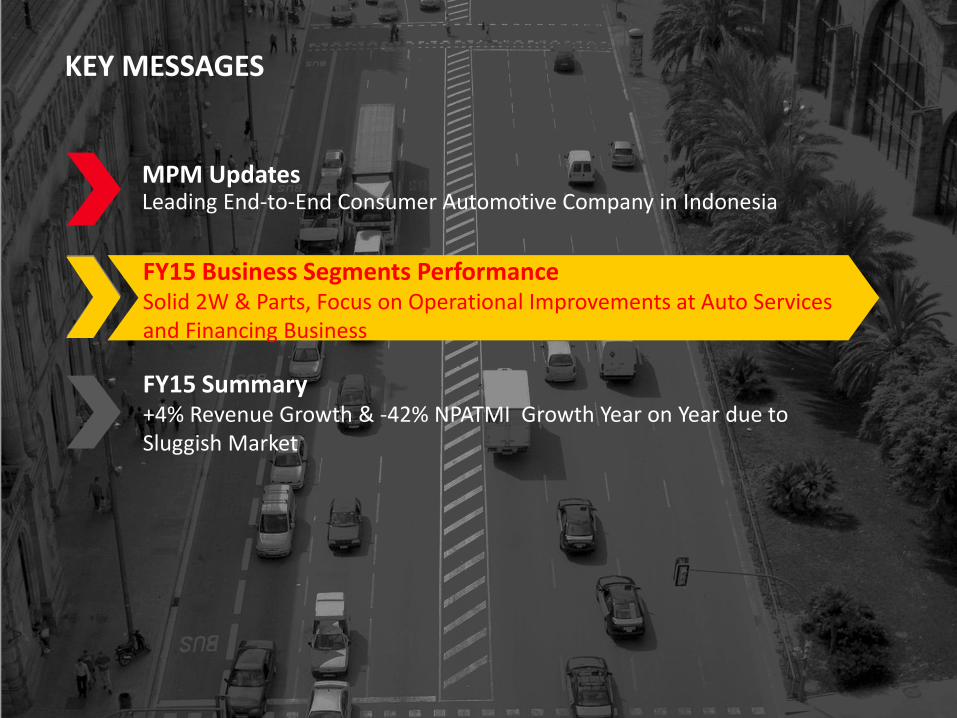
MPM Updates Leading End-to-End Consumer Automotive Company in Indonesia
FY15 Business Segments Performance Solid 2W & Parts, Focus on Operational Improvements at Auto Services and Financing Business
FY15 Summary +4% Revenue Growth & -42% NPATMI Growth Year on Year due to Sluggish Market

28 YEAR SUCCESSFUL LEGACY AND EXPERTISE IN AUTOMOTIVE...
4
1987
Founded by William Soeryadjaya as 2W
distribution business
1988
FKT was established
1992
MPMMotor 1st retail outlet was
opened
Establishment – Pre 2012
1994
Acquired initial shareholding in SAF,
originally established in 1982
2010 - 2011
Mulia was established; distribution business was transferred from
MPM to Mulia
Jan ‘12
2012 - Present
Acquired MPMRent and MPMFinance
May ‘12
MPMInsurance was established
Dec ‘12
JACCS acquired significant
minority shares in SAF + options
May ‘13
Listed in Indonesian Stock Exchange, Ticker:
MPMX
May-Jun‘14
Merger of MPMFinance –
SAF, JACCS becomes 40%
owner
Aug ‘13
MPMAuto was established, signed
Dealer & Service Agreement with Nissan
Motor Indonesia
Sep‘14
Successfully issued USD 200
million bond listed in SGX

5
AN END-TO-END NATIONWIDE ECOSYSTEM SERVING VAST CONSUMERS IN AUTOMOTIVE SECTOR...
3,7M+ active 2W customers,
~3,900 4W sale since inception in ‘14
3,300+ 2W Federal Oil Centers, 20,000+ 3rd
party retailers
1,300+ corporate clients
190K+ finance & lease customers, 126K+ insurance
clients
DISTRIBUTION & RETAIL AUTO CONSUMER PARTS AUTO SERVICES FINANCIAL SERVICES
2W engine lubricant brand principal with 35
distributors and 20,000+ outlets nationwide
4W engine lubricants launched in ’15 through 1,000+ retail workshops
nationwide
Independent 4W rental/lease company
with 33 outlets and workshops
Independent 2W, 4W, lease financing business
with 145 outlets nationwide
Non-life insurance including 2W, 4W, cargo,
& property with 15 offices & 4 service points
nationwide
2W Honda distribution in E. Java + E. Nusa
Tenggara with 289 dealer relationships
2W Honda retail dealers with 40 outlets
nationwide
N/A
4W Nissan & Datsun dealership with 8
dealers, opened 1st outlet in Mar ’14
Data as of FY15
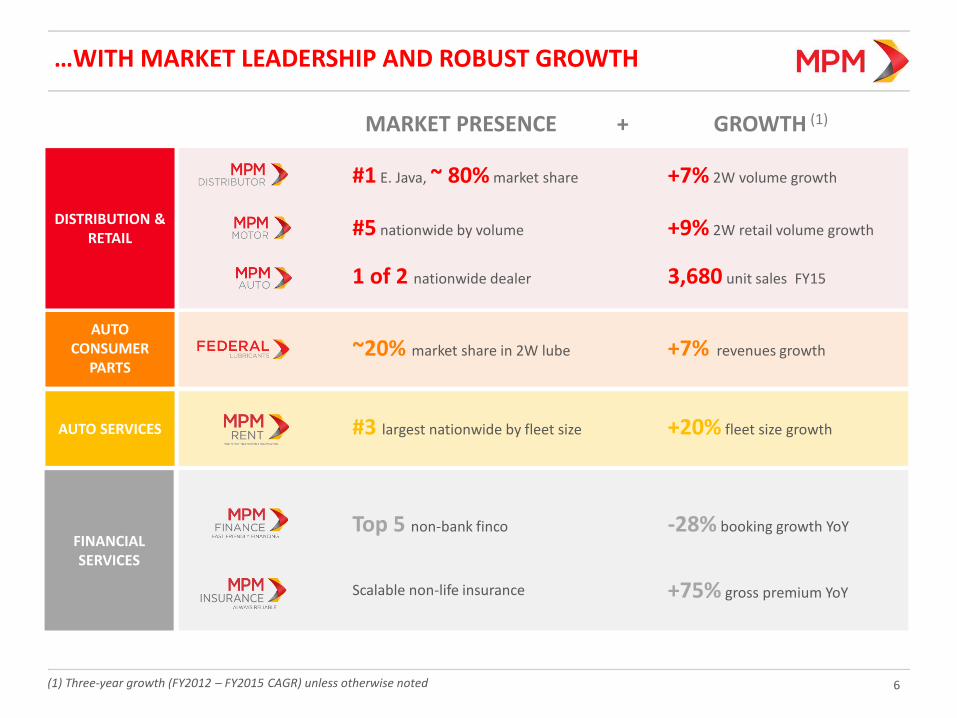
…WITH MARKET LEADERSHIP AND ROBUST GROWTH
6
+7% 2W volume growth
GROWTH (1) MARKET PRESENCE +
#1 E. Java, ~ 80% market share
+9% 2W retail volume growth #5 nationwide by volume
3,680 unit sales FY15 1 of 2 nationwide dealer
+7% revenues growth ~20% market share in 2W lube
+20% fleet size growth #3 largest nationwide by fleet size
-28% booking growth YoY Top 5 non-bank finco
+75% gross premium YoY Scalable non-life insurance
DISTRIBUTION & RETAIL
AUTO CONSUMER
PARTS
AUTO SERVICES
FINANCIAL SERVICES
(1) Three-year growth (FY2012 – FY2015 CAGR) unless otherwise noted

7
2%
56%
43%
Revenues FY14
IDR 16.1T
SEGMENT CONTRIBUTION IN THE ECOSYSTEM
Revenues FY15
IDR 16.6T
NPATMI FY14
IDR 487B NPATMI FY15
IDR 285B
Distribution & Retail Auto Consumer Parts Auto Services Financial Services
-42% YoY
7% 7%
9%
77%
+4% YoY
1) Non Financial Services : Mulia, MPMMotor, FKT, PMP, MPMAuto, MPMMobil, MPMRent and subsidiaries 2) Financial Services : MPMFinance & MPMInsurance
NPAT: - Non Financial Services : ↓ 40% - Financial Services : ↓ 41%
7% 7%
10%
76%
+16% YoY
8% 7%
37%
48% -7%
YoY
-1%

8
STRONG GOVERNANCE AND MANAGEMENT IN PLACE WITH ACTIVE MAJOR SHAREHOLDERS
BOARD OF COMMISSIONERS BOARD OF DIRECTORS BoC brings strong mix of operational, strategy, M&A, and governance expertise
BoD members bring over 79 years of combined professional experience
47.6%
15.3%
6.8%
30.3%
PT Saratoga Investama Sedaya Tbk and Affiliates
Morninglight Investments S.a.r.l
Claris Investment Pte. Ltd.
Public & Others
Shareholder Composition as of 31 Dec 2015
Tossin Himawan
Simon Halim
Lee Chul Joo Danny Walla
Istama Siddharta
Commissioner
Independent Commissioner
Commissioner Commissioner
Independent Commissioner
Troy Parwata President Director
Agung Kusumo Vice President Director
Titien Supeno HR Director
Andi Esfandiari Director
Edwin Soeryadjaya Chairman
9
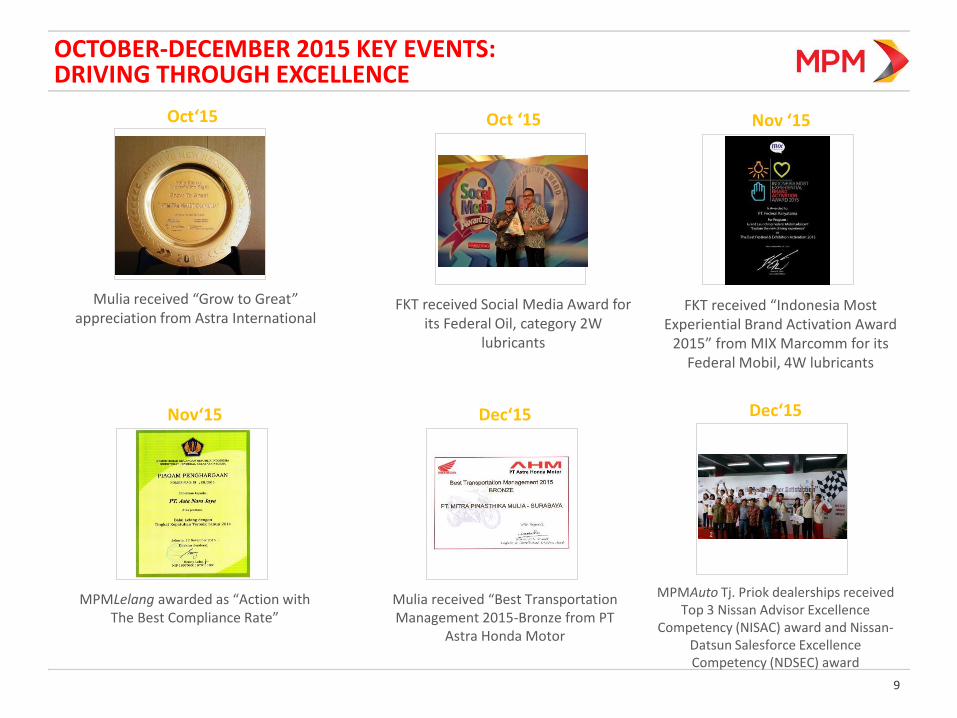
OCTOBER-DECEMBER 2015 KEY EVENTS: DRIVING THROUGH EXCELLENCE
Mulia received “Grow to Great” appreciation from Astra International
Oct‘15 Oct ‘15
FKT received Social Media Award for its Federal Oil, category 2W
lubricants
MPMAuto Tj. Priok dealerships received Top 3 Nissan Advisor Excellence
Competency (NISAC) award and Nissan-Datsun Salesforce Excellence Competency (NDSEC) award
Dec‘15
Mulia received “Best Transportation Management 2015-Bronze from PT
Astra Honda Motor
Dec‘15
Nov ‘15
FKT received “Indonesia Most Experiential Brand Activation Award
2015” from MIX Marcomm for its Federal Mobil, 4W lubricants
MPMLelang awarded as “Action with The Best Compliance Rate”
Nov‘15

10
USD SENIOR NOTES HEDGING COVERAGE – ORIGINAL & TOP UP
Rp 12,000
Rp 14,000
Rp 15,000
Rp 16,000
USD Spot Rate
@ Market Spot Rate
@ Rp 12,000
Original Coverage Settlement
@ Rp 2,000 subsidy – (Spot Rate – Rp 15,000)
@ Rp 2,000 subsidy
@ Rp 1,000 subsidy
Ave. Premium
Coverage
Participants
2.18%
Principal @ maturity (Sep 2019)
Coupon up to 2017
Deutsche Bank, Morgan Stanley, ANZ, MUFG
Top-Up Coverage Settlement
@ Market Spot Rate
Back to original cover
@ Rp 14,000
0.73% p.a.
Principal @ maturity (Sep 2019)
Deutsche Bank, Morgan Stanley
+
KEY MESSAGES
MPM Updates Leading End-to-End Consumer Automotive Company in Indonesia
Company Updates Continued scale building and growth across all business segments Company Updates Continued scale building and growth across all business segments
9
FY15 Business Segments Performance Solid 2W & Parts, Focus on Operational Improvements at Auto Services and Financing Business
FY15 Summary +4% Revenue Growth & -42% NPATMI Growth Year on Year due to Sluggish Market

12
FY15 CONSOLIDATED REVENUE RESULTS
803
39 (52) (3) 16,640
FY15
16,076
FY14
IDR B
% Growth from LY
+6% +2% -4% -0%
Distribution & Retail
Auto Consumer Parts
Auto Services Financial Services
Elimination
+4%
Positive group revenue growth
(223)
13
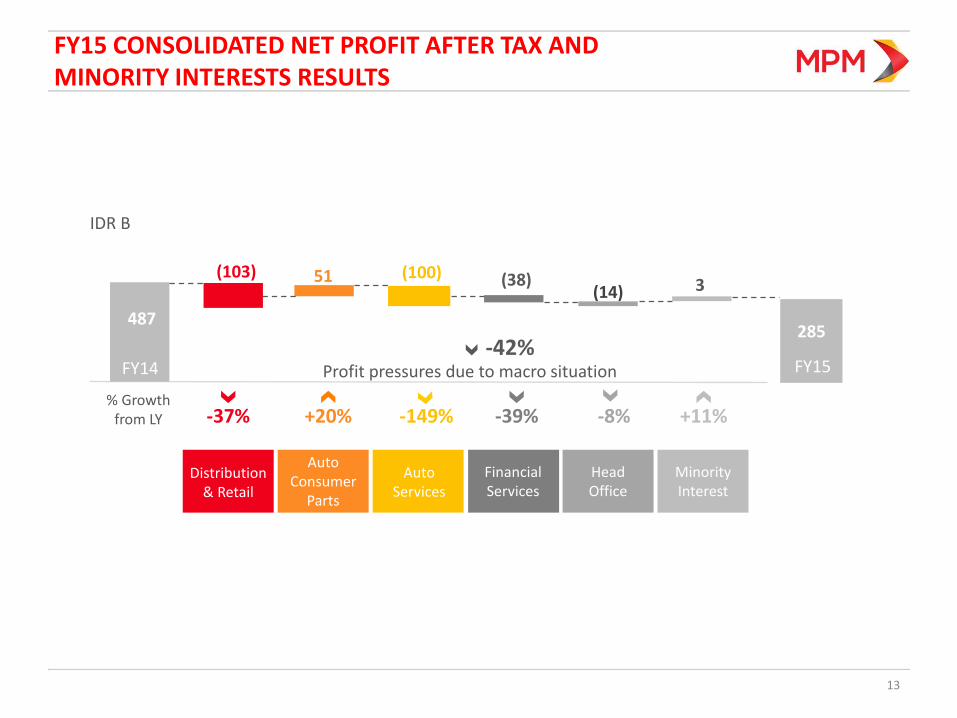
FY15 CONSOLIDATED NET PROFIT AFTER TAX AND MINORITY INTERESTS RESULTS
3
IDR B
% Growth from LY -37% +20% -149% -39%
Distribution & Retail
(103) 51 (100) (38)
FY15
(14)
487
FY14
Auto Consumer
Parts
Auto Services
Financial Services
-42%
-8% +11%
Elimination Head Office
Minority Interest
285
Profit pressures due to macro situation
14
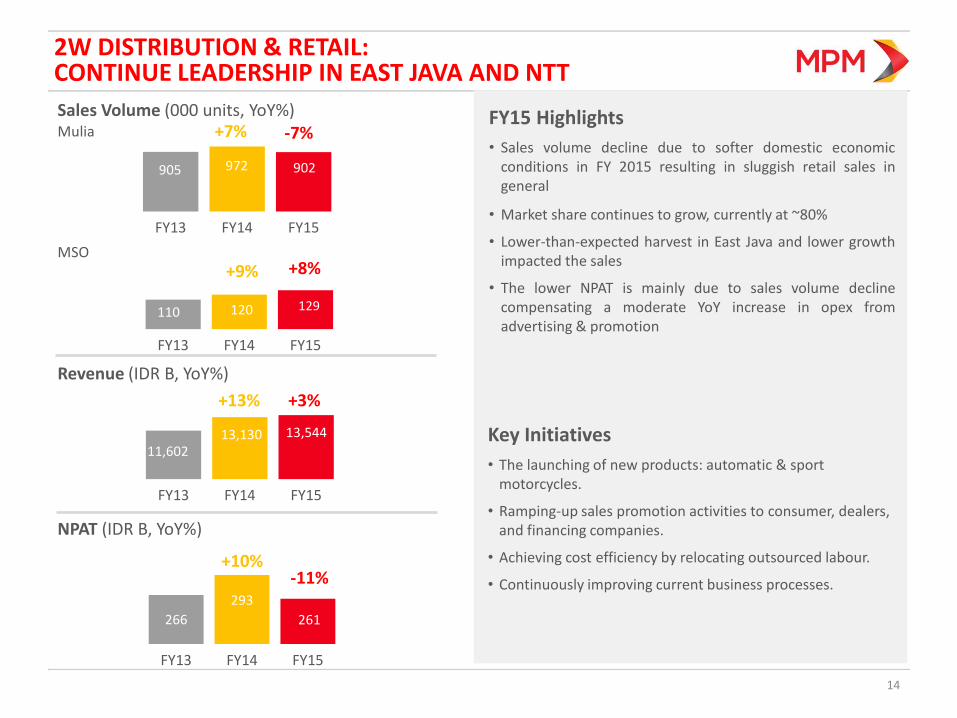
2W DISTRIBUTION & RETAIL: CONTINUE LEADERSHIP IN EAST JAVA AND NTT
905 972 902
FY13 FY14 FY15
-7% +7% Sales Volume (000 units, YoY%)
266
293
261
FY13 FY14 FY15
+10%
Revenue (IDR B, YoY%)
NPAT (IDR B, YoY%)
FY15 Highlights
• Sales volume decline due to softer domestic economic conditions in FY 2015 resulting in sluggish retail sales in general
• Market share continues to grow, currently at ~80%
• Lower-than-expected harvest in East Java and lower growth impacted the sales
• The lower NPAT is mainly due to sales volume decline compensating a moderate YoY increase in opex from advertising & promotion
Mulia
110 120 129
FY13 FY14 FY15
+9% MSO
FY13 FY14 FY15
13,130 13,544
+13%
Key Initiatives
• The launching of new products: automatic & sport motorcycles.
• Ramping-up sales promotion activities to consumer, dealers, and financing companies.
• Achieving cost efficiency by relocating outsourced labour.
• Continuously improving current business processes.
11,602
+8%
+3%
-11%

0 -14
FY13 FY14 FY15
-85
15
4W DEALERSHIP: BUILD NETWORK AND COMPETITIVE CAPABILITY
Sales Volume (Car Units, YoY%)
NPAT (IDR B, YoY%)
FY15 Highlights
FY13 FY14 FY15
130 1,382
3,680
Revenue (IDR B, YoY%)
FY13 FY14 FY15
643
260
FY13
• Sales volume increase due to better productivity and additional fully-operating branches in FY 2015
• Negative NPAT in FY 2015 due to opex from opening up of new branches and larger discounts offered to customers during economy slowdown
+166%
+147%
-512%
FY14 FY15
Key Initiatives
• Increasing sales productivity.
• Fine-tuning dealership development programs as part of business expansion.
23
-0

16
CONSUMER PARTS: CONTINUE STRENGTHEN CHANNEL DEVELOPMENT
FY13 FY14 FY15
-5% +2%
Sales Volume (KL, YoY%)
221 251
FY13 FY14 FY15
+14%
Revenue (IDR B, YoY%)
NPAT (IDR B, YoY%)
FY15 Highlights
1,444
FY13 FY14 FY15
1,592
+10%
60,632 62,116
• Sales volume and revenues relatively stable during market slowdown
• High levels of dealers’ inventory and decline in the demand for cub motorcycles has some impact on the growth
• Building momentum in Federal Mobil (4W) product
• Higher NPAT because of lower COGS (mainly oil price) and operational improvements
• Higher other operating income from a one-off sale of fixed assets while preparing for a move to new plant
59,200
Key Initiatives
Federal Oil • Establishing new distribution center in East Java. • Focusing on channel development and spreading task
force. • Monitoring product quality. Federal Mobil • Focusing on market growth in Surabaya and B2B channels.
1,582
-1%
+20%
301
17
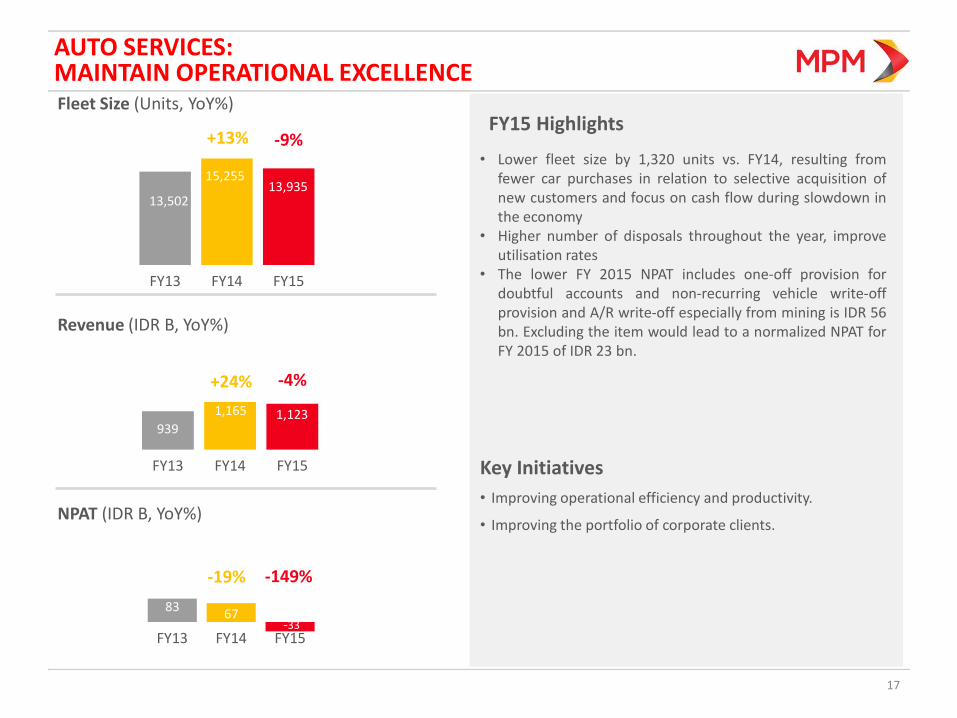
AUTO SERVICES: MAINTAIN OPERATIONAL EXCELLENCE
FY13 FY14 FY15
+13%
Fleet Size (Units, YoY%)
Revenue (IDR B, YoY%)
NPAT (IDR B, YoY%)
FY15 Highlights
939
FY13 FY14 FY15
1,165 1,123
+24%
15,255
13,502 13,935
• Lower fleet size by 1,320 units vs. FY14, resulting from fewer car purchases in relation to selective acquisition of new customers and focus on cash flow during slowdown in the economy
• Higher number of disposals throughout the year, improve utilisation rates
• The lower FY 2015 NPAT includes one-off provision for doubtful accounts and non-recurring vehicle write-off provision and A/R write-off especially from mining is IDR 56 bn. Excluding the item would lead to a normalized NPAT for FY 2015 of IDR 23 bn.
-9%
-4%
-149%
Key Initiatives
• Improving operational efficiency and productivity.
• Improving the portfolio of corporate clients.
-19%
83 67
-33 FY13 FY14 FY15
18
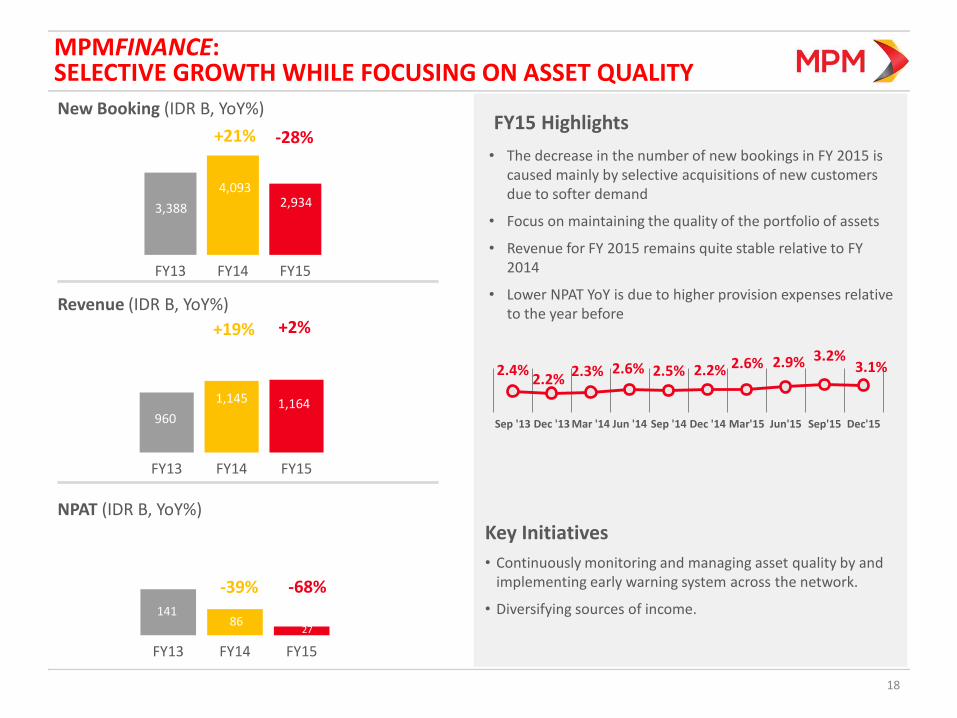
MPMFINANCE: SELECTIVE GROWTH WHILE FOCUSING ON ASSET QUALITY
3,388
4,093 2,934
FY13 FY14 FY15
+21%
New Booking (IDR B, YoY%)
960
1,145 1,164
FY13 FY14 FY15
+19%
141 86
27
FY13 FY14 FY15
-39%
Revenue (IDR B, YoY%)
NPAT (IDR B, YoY%)
FY15 Highlights
• The decrease in the number of new bookings in FY 2015 is caused mainly by selective acquisitions of new customers due to softer demand
• Focus on maintaining the quality of the portfolio of assets
• Revenue for FY 2015 remains quite stable relative to FY 2014
• Lower NPAT YoY is due to higher provision expenses relative to the year before
2.4% 2.2%
2.3% 2.6% 2.5% 2.2% 2.6% 2.9% 3.2% 3.1%
Sep '13 Dec '13 Mar '14 Jun '14 Sep '14 Dec '14 Mar'15 Jun'15 Sep'15 Dec'15
-28%
+2%
-68%
Key Initiatives
• Continuously monitoring and managing asset quality by and implementing early warning system across the network.
• Diversifying sources of income.
19
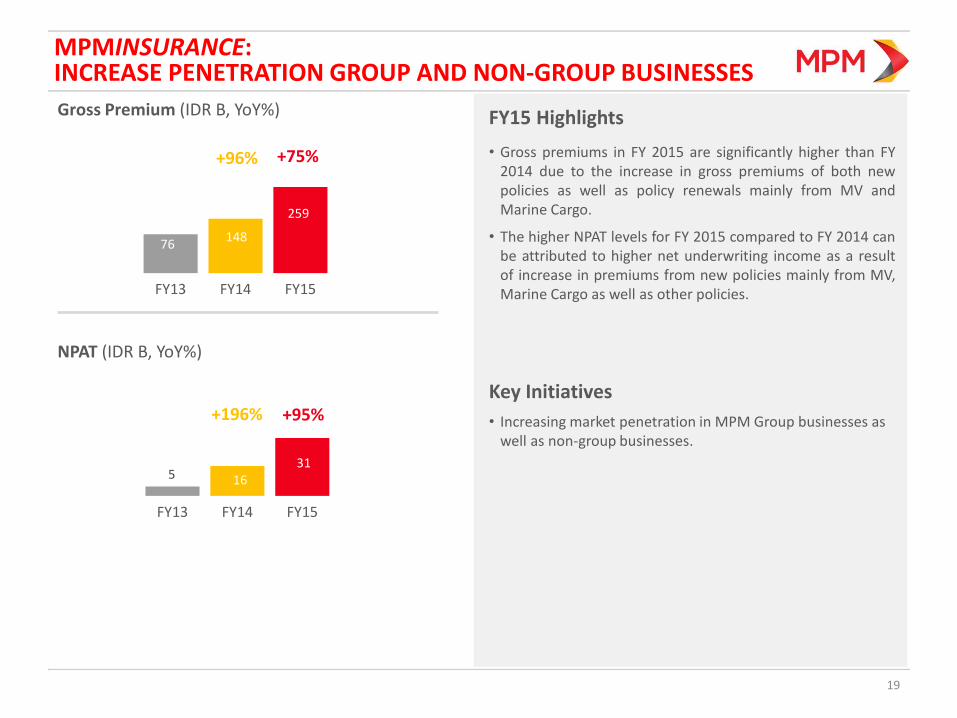
MPMINSURANCE: INCREASE PENETRATION GROUP AND NON-GROUP BUSINESSES
Gross Premium (IDR B, YoY%)
16 31
FY13 FY14 FY15
+95% +196%
NPAT (IDR B, YoY%)
FY15 Highlights
148
FY13 FY14 FY15
+96%
76
• Gross premiums in FY 2015 are significantly higher than FY 2014 due to the increase in gross premiums of both new policies as well as policy renewals mainly from MV and Marine Cargo.
• The higher NPAT levels for FY 2015 compared to FY 2014 can be attributed to higher net underwriting income as a result of increase in premiums from new policies mainly from MV, Marine Cargo as well as other policies.
259
5
+75%
Key Initiatives
• Increasing market penetration in MPM Group businesses as well as non-group businesses.
+96%

KEY MESSAGES
MPM Updates Leading End-to-End Consumer Automotive Company in Indonesia
1Q14 Summary & Business Segments Performance Stable 2W business despite natural disasters, Strong 4W business growth 1Q14 Summary & Business Segments Performance Stable 2W business despite natural disasters, Strong 4W business growth
20
FY15 Business Segments Performance Solid 2W & Parts, Focus on Operational Improvements at Auto Services and Financing Business
FY15 Summary +4% Revenue Growth & -42% NPATMI Growth Year on Year due to Sluggish Market
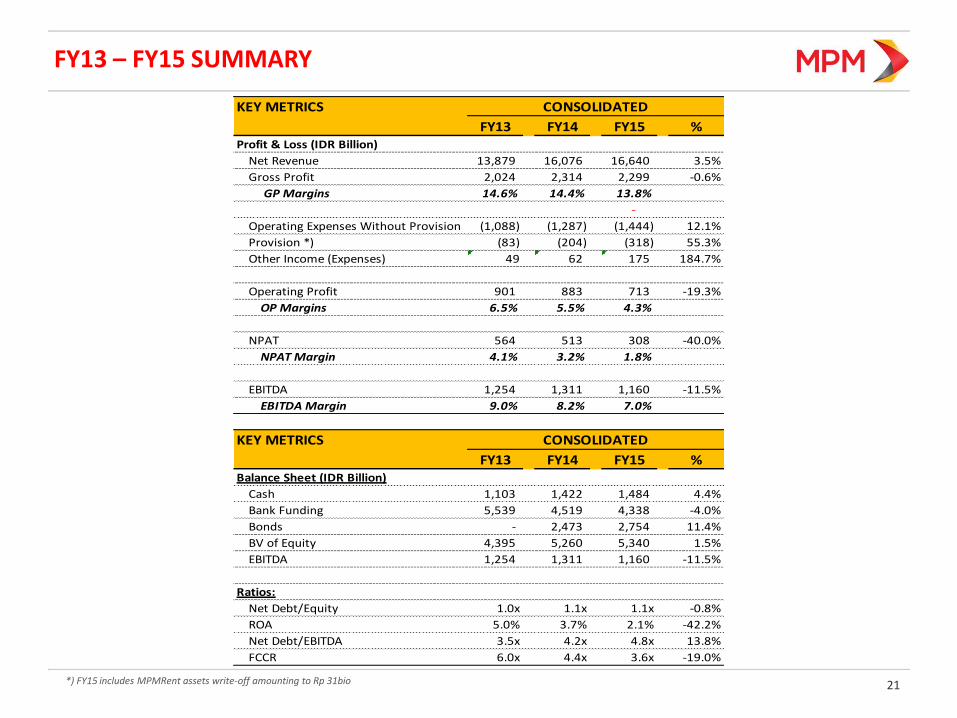
FY13 – FY15 SUMMARY
21 *) FY15 includes MPMRent assets write-off amounting to Rp 31bio
KEY METRICS
FY13 FY14 FY15 %Profit & Loss (IDR Billion)
Net Revenue 13,879 16,076 16,640 3.5%
Gross Profit 2,024 2,314 2,299 -0.6%
GP Margins 14.6% 14.4% 13.8%
-
Operating Expenses Without Provision (1,088) (1,287) (1,444) 12.1%
Provision *) (83) (204) (318) 55.3%
Other Income (Expenses) 49 62 175 184.7%
Operating Profit 901 883 713 -19.3%
OP Margins 6.5% 5.5% 4.3%
NPAT 564 513 308 -40.0%
NPAT Margin 4.1% 3.2% 1.8%
EBITDA 1,254 1,311 1,160 -11.5%
EBITDA Margin 9.0% 8.2% 7.0%
KEY METRICS
FY13 FY14 FY15 %Balance Sheet (IDR Billion)
Cash 1,103 1,422 1,484 4.4%
Bank Funding 5,539 4,519 4,338 -4.0%
Bonds - 2,473 2,754 11.4%
BV of Equity 4,395 5,260 5,340 1.5%
EBITDA 1,254 1,311 1,160 -11.5%
Ratios:
Net Debt/Equity 1.0x 1.1x 1.1x -0.8%
ROA 5.0% 3.7% 2.1% -42.2%
Net Debt/EBITDA 3.5x 4.2x 4.8x 13.8%
FCCR 6.0x 4.4x 3.6x -19.0%
CONSOLIDATED
CONSOLIDATED

FY13 – FY15 SUMMARY (CONTINUED)
22 *) FY15 includes MPMRent assets write-off amounting to Rp 31bio
KEY METRICS
FY13 FY14 FY15 %Profit & Loss (IDR Billion)
Net Revenue 12,872 14,895 15,471 3.9%
Gross Profit 1,414 1,556 1,581 1.6%
GP Margins 11.0% 10.4% 10.2%
Operating Expenses Without Provision (716) (830) (1,004) 21.0%
Provision *) (3) (6) (58) 898.0%
Other Income (Expenses) 44 59 143 143.6%
Operating Profit 738 779 662 -15.0%
OP Margins 5.7% 5.2% 4.3%
NPAT 418 422 254 -39.8%
NPAT Margin 3.2% 2.8% 1.6%
EBITDA 1,318 1,194 1,093 -8.4%
EBITDA Margin 10.2% 8.0% 7.1%
KEY METRICS
FY13 FY14 FY15 %Balance Sheet (IDR Billion)
Cash 848 1,107 1,160 4.8%
Bank Funding 1,987 675 936 38.6%
Bonds - 2,473 2,754 11.4%
BV of Equity 4,102 4,387 4,399 0.3%
EBITDA 1,318 1,194 1,093 -8.4%
Ratios:
Net Debt/Equity 0.3x 0.5x 0.6x 23.6%
ROA 5.8% 4.7% 2.6% -44.7%
Net Debt/EBITDA 0.9x 1.7x 2.3x 35.3%
FCCR 6.3x 4.0x 3.4x -16.1%
NON-FINANCIAL SERVICES
NON-FINANCIAL SERVICES
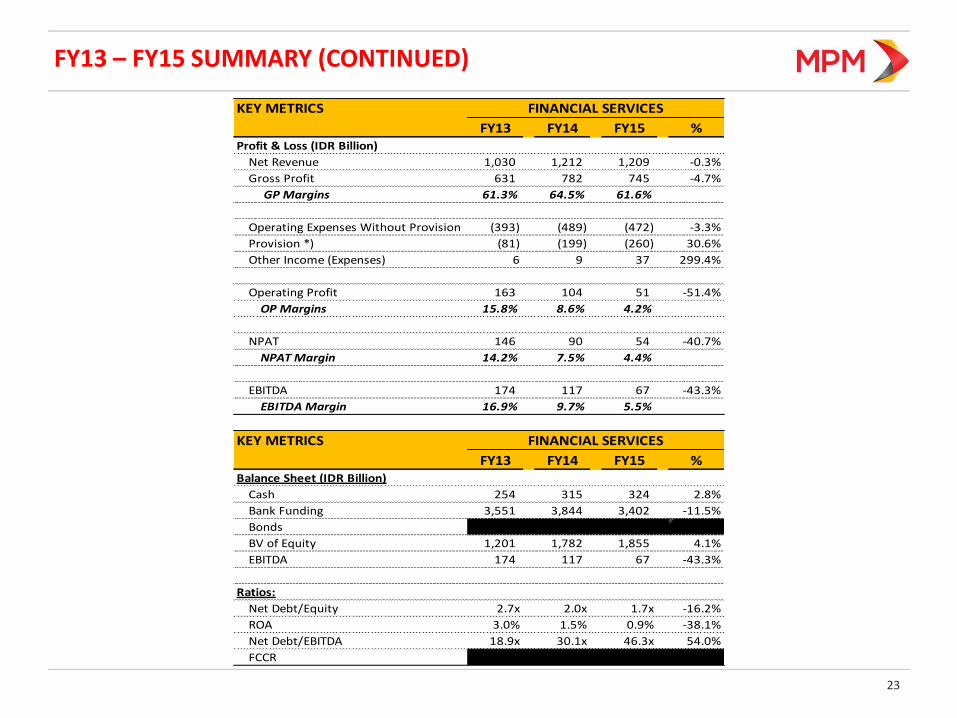
FY13 – FY15 SUMMARY (CONTINUED)
23
KEY METRICS
FY13 FY14 FY15 %Profit & Loss (IDR Billion)
Net Revenue 1,030 1,212 1,209 -0.3%
Gross Profit 631 782 745 -4.7%
GP Margins 61.3% 64.5% 61.6%
Operating Expenses Without Provision (393) (489) (472) -3.3%
Provision *) (81) (199) (260) 30.6%
Other Income (Expenses) 6 9 37 299.4%
Operating Profit 163 104 51 -51.4%
OP Margins 15.8% 8.6% 4.2%
NPAT 146 90 54 -40.7%
NPAT Margin 14.2% 7.5% 4.4%
EBITDA 174 117 67 -43.3%
EBITDA Margin 16.9% 9.7% 5.5%
KEY METRICS
FY13 FY14 FY15 %Balance Sheet (IDR Billion)
Cash 254 315 324 2.8%
Bank Funding 3,551 3,844 3,402 -11.5%
Bonds - - - #DIV/0!
BV of Equity 1,201 1,782 1,855 4.1%
EBITDA 174 117 67 -43.3%
Ratios:
Net Debt/Equity 2.7x 2.0x 1.7x -16.2%
ROA 3.0% 1.5% 0.9% -38.1%
Net Debt/EBITDA 18.9x 30.1x 46.3x 54.0%
FCCR - - - 0.0%
FINANCIAL SERVICES
FINANCIAL SERVICES

Disclaimer
24
• These materials have been prepared by PT Mitra Pinasthika Mustika Tbk (the “Company”, “MPM”) and have not been
independently verified. No representation or warranty, expressed or implied, is made and no reliance should be placed on the
accuracy, fairness or completeness of the information presented or contained in these materials. The Company or any of its
affiliates, advisers or representatives accepts no liability whatsoever for any loss howsoever arising from any information
presented or contained in these materials. The information presented or contained in these materials is subject to change
without notice and its accuracy is not guaranteed.
• These materials may contain statements that constitute forward-looking statements. These statements include descriptions
regarding the intent, belief or current expectations of the Company or its officers with respect to the consolidated results of
operations and financial condition of the Company. These statements can be recognized by the use of words such as “expects,”
“plan,” “will,” “estimates,” “projects,” “intends,” or words of similar meaning. Such forward-looking statements are not
guarantees of future performance and involve risks and uncertainties, and actual results may differ from those in the forward-
looking statements as a result of various factors and assumptions. The Company has no obligation and does not undertake to
revise forward-looking statements to reflect future events or circumstances.
• These materials are for information purposes only and do not constitute or form part of an offer, solicitation or invitation of any
offer to buy or subscribe for any securities of the Company, in any jurisdiction, nor should it or any part of it form the basis of, or
be relied upon in any connection with, any contract, commitment or investment decision whatsoever. Any decision to purchase
or subscribe for any securities of the Company should be made after seeking appropriate professional advice.