PT. Indosat Tbk.assets.indosatooredoo.com/Assets/Upload/PDF/Investor Memo... · 2016-03-24 ·...
32
PT. Indosat Tbk. Full Year 2015 Results
Transcript of PT. Indosat Tbk.assets.indosatooredoo.com/Assets/Upload/PDF/Investor Memo... · 2016-03-24 ·...

PT. Indosat Tbk.
Full Year 2015 Results

Reborn

3
Indosat Ooredoo reborn
PT Indosat Tbk – FY 2015 Results
Market and consumers are evolving…
DIGITALIZATION is a new opportunity for us to win the market
Why
Change?
• Increase Attractive to help the business
• Quality perception and retention challenges
• Faster growth, renewed sense of purpose
We can leverage the Ooredoo brand to capture this opportunity
Innovative & global brand association Technical & funding support Data and digital leadership
The New Indosat Ooredoo Positioning & Streams
We are building Indonesia's leading digital telco, enabling access and…
greater Liberating products
& services 1 Affordability &
Accessibility 4G LTE for Everybody
New Behavior & Customer-
centric Experience
A data strong
network 2 We treat our
customer like a friend 3
✓ New look & feel! New logo & designs, reskinned Galeri/ outlets/ office/ materials
✓ Digital customer experience! Revamped digital touchpoints, Apps Corner
✓ New culture & behavior! Can-do attitude, Reform mindset: positive & curious
What does
this mean?

Reborn and Rebranding
4
Reborn represented opportunity to embrace role in
transforming 48 years of pride into a movement to
ready the business for a digital world.
A co-branded identity was developed to leverage
Ooredoo brand assets and create a world class
telecommunications brands that resonates with
Indonesian consumer.
Our new identity represents a pulse of energy
- a youthful, dynamic new look which is instantly
recognizable as Ooredoo and positions our
company as a leading digital brand.
Adding Ooredoo to Indosat name emerged as
optimal scenario for rebranding:
Research with nearly 15,000 consumers and
employees clearly showed that across the
customer base bringing the two brands together
was commercially stronger than using Indosat,
any of its sub-brands or Ooredoo on their own
PT Indosat Tbk – FY 2015 Results

5
Consumer Feedback on Indosat Ooredoo
Indosat Ooredoo & IM3 Ooredoo
79% 86%
74%
86%
19% 21%
Indosat IM3 IM3
Pre Reborn Post Reborn
Brand Awareness
Brand Preference
Customer perception post Reborn
Brand Awareness significantly
increase Post Reborn & gives
more traction to be the
preferred Brand
Consumer perceive if Indosat
Ooredoo will present better
digital world and 4G experience
PT Indosat Tbk – FY 2015 Results
Indosat
Ooredoo

4G Journey

~40mn
Indosat Ooredoo 4G
7
Population coverage
# BTS
# New cities covered
Launch Q4 2015 Q1 2016 Q4 2016
75 3,361
• Makassar
• Balikpapan
• Padang
• Lampung
• Denpasar
• Surabaya
• Malang
• Banyumas
• Surakarta
• Yogyakarta
• Bandung
• Tasik
• Jepara
• Kudus
• Pati
• Rembang
• Semarang
• Pontianak
• Bogor
• Jakarta & its
satellite cities
• Sukabumi
• Tuban
• Blora
• Grobogan
Coverage expansion across Indonesia,
focus on high-value areas
+24
for Everyone PT Indosat Tbk – FY 2015 Results
50 to 70mn

Financial and
Operational Highlights
9
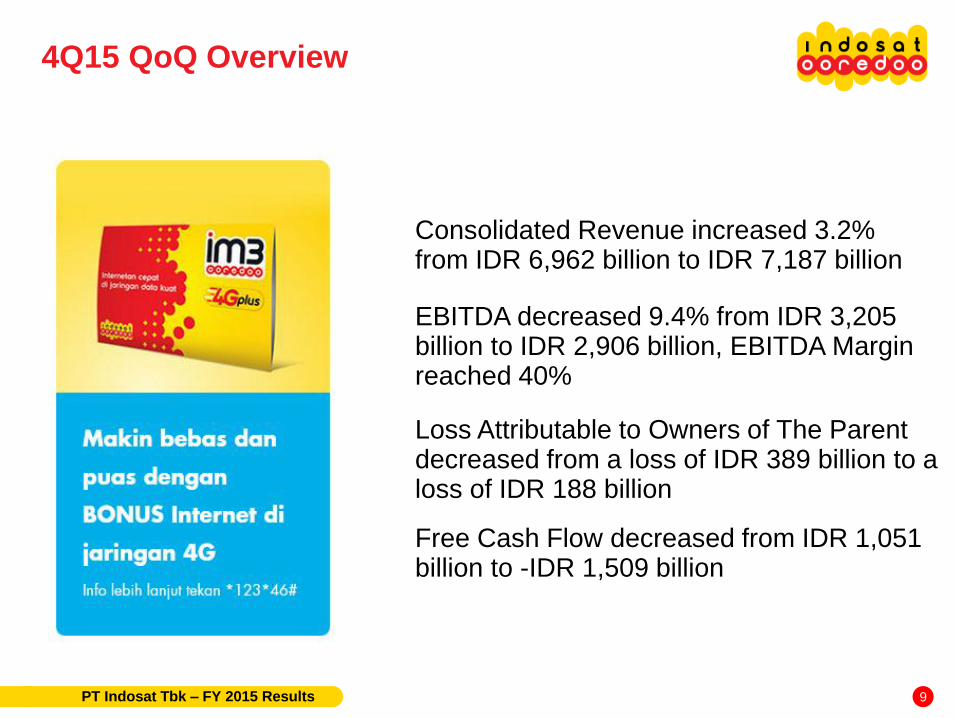
4Q15 QoQ Overview
Consolidated Revenue increased 3.2% from IDR 6,962 billion to IDR 7,187 billion
EBITDA decreased 9.4% from IDR 3,205 billion to IDR 2,906 billion, EBITDA Margin reached 40%
Loss Attributable to Owners of The Parent decreased from a loss of IDR 389 billion to a loss of IDR 188 billion
Free Cash Flow decreased from IDR 1,051 billion to -IDR 1,509 billion
PT Indosat Tbk – FY 2015 Results

10
FY15 YoY Overview
Consolidated Revenue increased 11.1% from IDR 24,085 billion to IDR 26,769 billion
EBITDA increased 14% from IDR 10,033 billion to IDR 11,473 billion, EBITDA Margin reached 43%
Loss Attributable to Owners of The Parent decreased from a loss of IDR 2,008 billion to a loss of IDR 1,310 billion
Free Cash Flow decreased from IDR 2,345 billion to IDR 1,120 billion
PT Indosat Tbk – FY 2015 Results
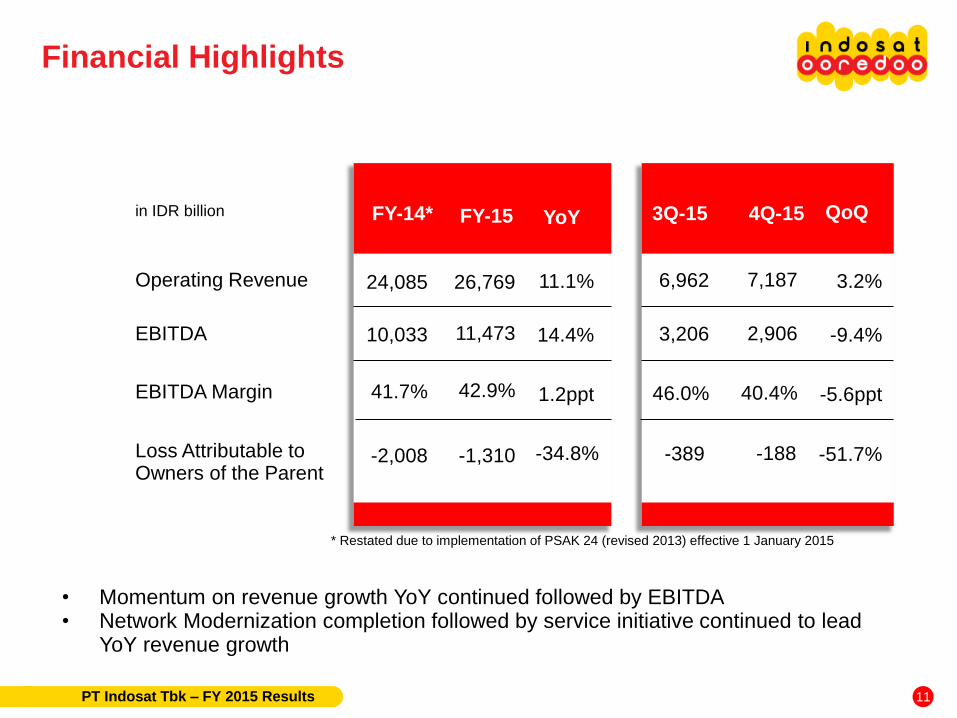
Operating Revenue
EBITDA
EBITDA Margin
Loss Attributable to Owners of the Parent
26,769
FY-14* FY-15 YoY
11.1%
11,473 14.4%
42.9% 1.2ppt
-1,310 -34.8%
7,187
3Q-15 4Q-15 QoQ
3.2%
2,906 -9.4%
40.4% -5.6ppt
-188 -51.7%
in IDR billion
24,085
10,033
41.7%
-2,008
* Restated due to implementation of PSAK 24 (revised 2013) effective 1 January 2015
• Momentum on revenue growth YoY continued followed by EBITDA • Network Modernization completion followed by service initiative continued to lead
YoY revenue growth
6,962
3,206
46.0%
-389
Financial Highlights
PT Indosat Tbk – FY 2015 Results 11

916 900 936 921 997
262 290 271 272 286
in IDR billion +3.2% QoQ +12.9% YoY
1Q-15 4Q-14
Cellular Fixed Data Fixed Voice
+5.0% / +9.0%
+8.2% / +8.9%
+2.4% / +13.8%
QoQ / YoY
5,190
2Q-15
4,903
6,368
5,321
6,093
• Revenue in all segment developing well in quarter and annual basis
3Q-15
5,768
6,527
Operating Revenue Breakdown
5,904
6,962
Segment Revenue Overview
PT Indosat Tbk – FY 2015 Results
4Q-15
7,187
12

Voice
SMS
Data
VAS
4.4%
FY15 YoY
10.0%
56.9%
14.7%
1.5%
4Q15 QoQ
0.1%
13.3%
-6.3% Increased VAS usage from various gaming & content packages
- Increased number of customers boost usage in all services
- Voice, SMS and Data usage increased during year end holiday
Cellular Revenue Performance
PT Indosat Tbk – FY 2015 Results 13
63.2 66.5 68.5 69.0 69.7
2Q-15
+10.3% YoY +1.1% QoQ
1Q-15 4Q-14
Number of cellular customers in million
2Q-15 1Q-15 4Q-14
in million
9.0
3.3
2.0
0.5 0.8
3Q-15 3Q-15
Net cellular customers additions
• Number of customer continued to grow, acquiring data early adopter as well as conventional voice and SMS user
4Q-15 4Q-15
Cellular Customer Base
PT Indosat Tbk – FY 2015 Results 14

ARPU and ARPM Voice Traffic and MOU
• ARPU has improved in 4Q15 in line with increasing usage and focus on monetizing traffic • MOU and voice traffic improving due to year end celebration and impact of new tariff
launched with reborn
78 67 67 70
76
142 140 145 143 135
13.6 13.2 13.5 14.6 15.6
+14.7% YoY
2Q-15
+7.0% QoQ
1Q-15 4Q-14
Voice Traffic
in billion minutes (Voice Traffic)
in minute/subscriber (MOU)
MOU
28.0 24.0 25.3 26.9 27.9
1Q-15 4Q-14
+3.6% QoQ -0.4% YoY
2Q-15
ARPU
in thousand IDR (ARPU)
ARPM
3Q-15 3Q-15 4Q-15 4Q-15
in IDR (ARPM)
Improving ARPU
PT Indosat Tbk – FY 2015 Results 15

Data Usage SMS Delivered
• Increase in data traffic driven by increase in number of data users and usage per subscriber
• Stronger growth on data monetization
59 56
60 62 59
in TByte
+2.5% QoQ +91.6% YoY
2Q-15 1Q-15 4Q-14
in billion
+0.6% YoY
1Q-15
-4.4% QoQ
4Q-14 3Q-15 2Q-15 4Q-15 3Q-15
Strong Data Usage
PT Indosat Tbk – FY 2015 Results
4Q-15
29,891
39,880
46,027
55,871 57,276
16
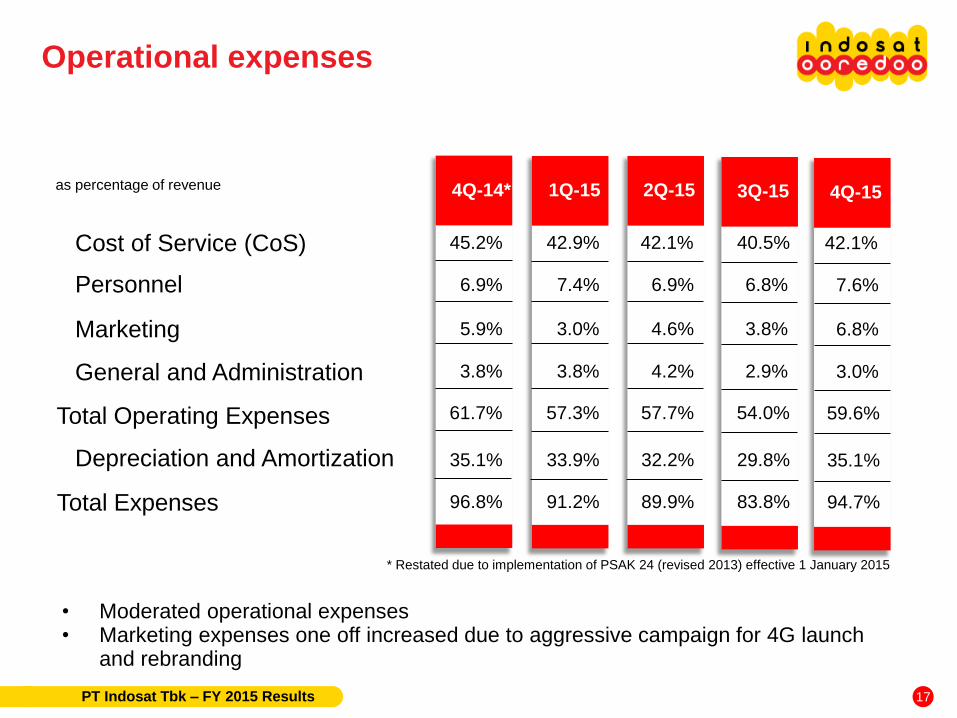
• Moderated operational expenses • Marketing expenses one off increased due to aggressive campaign for 4G launch
and rebranding
Cost of Service (CoS)
Depreciation and Amortization
Personnel
Marketing
as percentage of revenue
General and Administration
Total Expenses
Total Operating Expenses
4Q-14*
45.2%
35.1%
6.9%
5.9%
3.8%
96.8%
61.7%
1Q-15
42.9%
33.9%
7.4%
3.0%
3.8%
91.2%
57.3%
2Q-15
42.1%
32.2%
6.9%
4.6%
4.2%
89.9%
57.7%
* Restated due to implementation of PSAK 24 (revised 2013) effective 1 January 2015
3Q-15
40.5%
29.8%
6.8%
3.8%
2.9%
83.8%
54.0%
Operational expenses
PT Indosat Tbk – FY 2015 Results
4Q-15
42.1%
35.1%
7.6%
6.8%
3.0%
94.7%
59.6%
17

2,440 2,604 2,758
3,205 2,906
EBITDA and EBITDA margin
-9.4% QoQ +19.1% YoY
1Q-15 4Q-14*
EBITDA
in IDR billion
EBITDA Margin
38.3% 42.7%
2Q-15
• Normalized 4Q15 EBITDA margin showed improvement on annual basis
• Revenue development continued to improve supported by strict cost management
3Q-15
42.3%
* Restated due to implementation of PSAK 24 (revised 2013) effective 1 January 2015
46.0%
EBITDA performance
PT Indosat Tbk – FY 2015 Results
4Q-15
40.4%
18

-1,310
73
Net profit Normalized net loss bridge
• FY15 net loss still impacted mainly by IDR depreciation • Accelerated depreciation on obsolete equipment after network modernization completion
-2,788
-2,008
-1,310
+34.8% YoY +28.0% YoY
FY-15 FY-14* FY-13*
in IDR billion in IDR billion FY-15
Normalized Net – FX Loss Reported
1,383
* Restated due to implementation of PSAK 24 (revised 2013) effective 1 January 2015
Normalized net profit
PT Indosat Tbk – FY 2015 Results 19

2.70 2.73
2.42
Gross debt* and gross debt/EBITDA Net debt* and net debt/EBITDA
• Gearing level improved significantly amid Rupiah depreciation • Reducing US debt portion is progressing
* IDR 3.94tn, IDR 4.05tn and IDR 3.97tn of obligation under finance lease are included in FY13, FY14 and FY15 respectively
28,053 27,346 27,721
FY-14 FY-13 FY-15
+1.4% YoY
Gross Debt
in IDR billion
Gross Debt/EBITDA
FY-15 FY-13 FY-14
Net Debt Net Debt/EBITDA
in IDR billion
Balance sheet
PT Indosat Tbk – FY 2015 Results
2.49 2.38
2.09
25,819 23,866 24,098
+1.0% YoY
20

25.4 23.2 21.1
26.8
37.6
1,618 1,414 1,372
1,869
2,699
Free cash flow Capex and Capex/Revenue
• Accelerated capex in 4Q drove higher cash out capex on investing • Cash out capex stayed within guidance
in IDR billion
-206
481
1,096 1,051
-1,509
2Q-15 1Q-15 4Q-14
2Q-15 1Q-15 4Q-14
Capex
in IDR billion
Capex/Revenue 3Q-15
3Q-15
4Q-15
4Q-15
Free cash flow & Capex
PT Indosat Tbk – FY 2015 Results 21
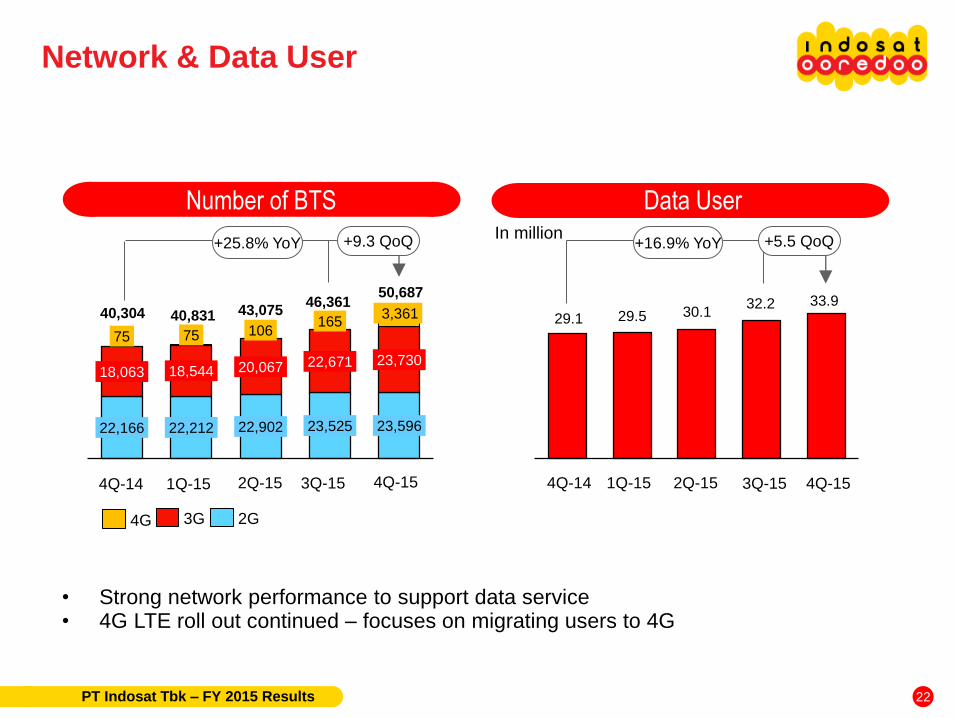
Number of BTS Data User
• Strong network performance to support data service • 4G LTE roll out continued – focuses on migrating users to 4G
22,166 22,212 22,902 23,525 23,596
18,063 18,544 20,067 22,671 23,730
75 75 106 165
3,361
+9.3 QoQ +25.8% YoY
1Q-15 4Q-14
2G 3G
In million
2Q-15
40,304 40,831
3Q-15
43,075 46,361
2Q-15 1Q-15 4Q-14 3Q-15 4Q-15
29.1 29.5 30.1 32.2 33.9
+5.5 QoQ +16.9% YoY
Network & Data User
PT Indosat Tbk – FY 2015 Results
4Q-15
50,687
4G
22

Management focus
& Key updates
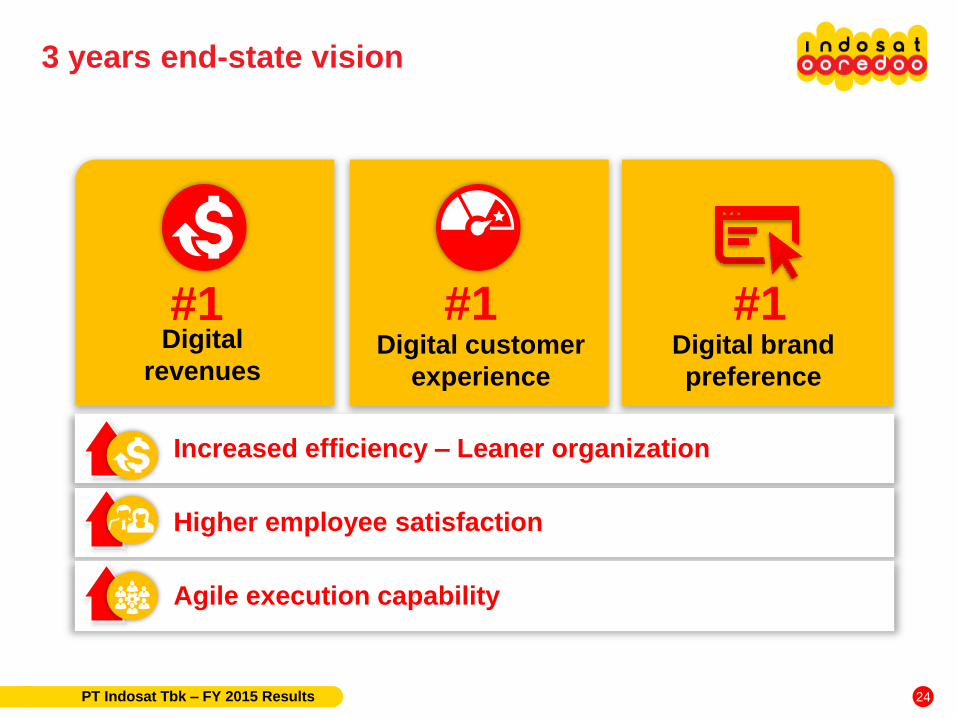
3 years end-state vision
PT Indosat Tbk – FY 2015 Results
#1 #1 Digital customer
experience
Digital
revenues Digital brand
preference
Increased efficiency – Leaner organization
Higher employee satisfaction
Agile execution capability
#1
24

FY 2015 Actual FY 2016 Guidance
Consolidated Revenue Growth 11.1% In line with market
EBITDA Margin* 42.9% Low to Mid 40’s
CAPEX IDR 7.3 trillion IDR 6.5 – 7.5 trillion
* Restated due to implementation of PSAK 24 (revised 2013) effective 1 January 2015
2016 Guidance
PT Indosat Tbk – FY 2015 Results 25

Thank You Investor Relations & Corporate Secretary Jl. Medan Merdeka Barat No. 21 Jakarta - 10110 Tel: +62 21 30442615 [email protected]

Supplemental
Information
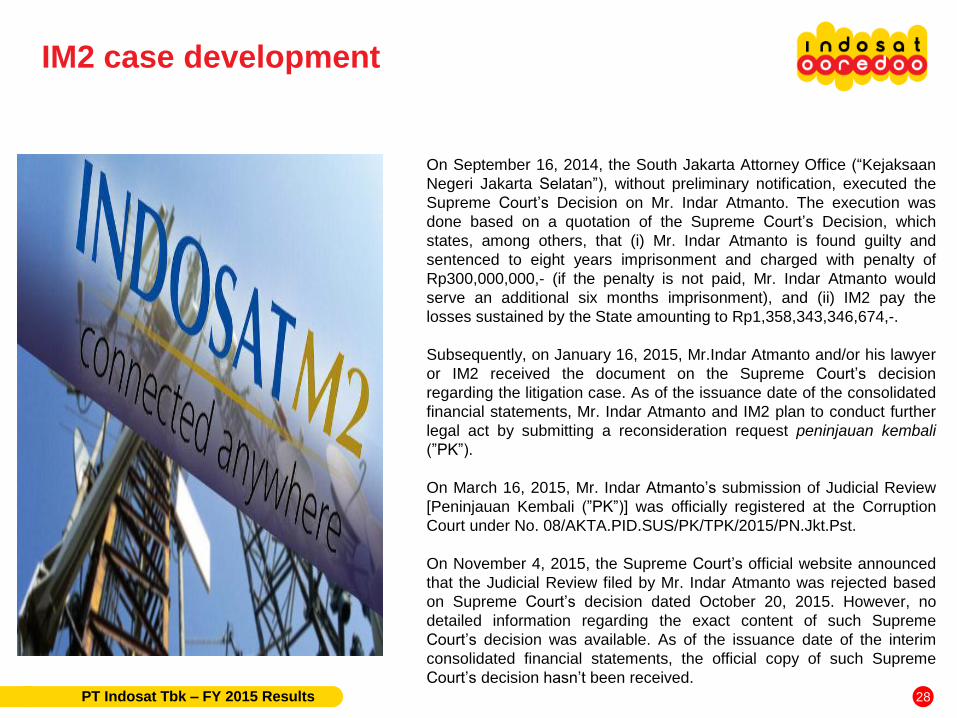
On September 16, 2014, the South Jakarta Attorney Office (“Kejaksaan
Negeri Jakarta Selatan”), without preliminary notification, executed the
Supreme Court’s Decision on Mr. Indar Atmanto. The execution was
done based on a quotation of the Supreme Court’s Decision, which
states, among others, that (i) Mr. Indar Atmanto is found guilty and
sentenced to eight years imprisonment and charged with penalty of
Rp300,000,000,- (if the penalty is not paid, Mr. Indar Atmanto would
serve an additional six months imprisonment), and (ii) IM2 pay the
losses sustained by the State amounting to Rp1,358,343,346,674,-.
Subsequently, on January 16, 2015, Mr.Indar Atmanto and/or his lawyer
or IM2 received the document on the Supreme Court’s decision
regarding the litigation case. As of the issuance date of the consolidated
financial statements, Mr. Indar Atmanto and IM2 plan to conduct further
legal act by submitting a reconsideration request peninjauan kembali
(”PK”).
On March 16, 2015, Mr. Indar Atmanto’s submission of Judicial Review
[Peninjauan Kembali (”PK”)] was officially registered at the Corruption
Court under No. 08/AKTA.PID.SUS/PK/TPK/2015/PN.Jkt.Pst.
On November 4, 2015, the Supreme Court’s official website announced
that the Judicial Review filed by Mr. Indar Atmanto was rejected based
on Supreme Court’s decision dated October 20, 2015. However, no
detailed information regarding the exact content of such Supreme
Court’s decision was available. As of the issuance date of the interim
consolidated financial statements, the official copy of such Supreme
Court’s decision hasn’t been received.
IM2 case development
PT Indosat Tbk – FY 2015 Results 28
On 25 January 2016, Standard & Poor's Ratings Services (“S&P”) affirmed its 'BB+‘ long-
term corporate credit rating on PT Indosat Tbk. The outlook is positive. S&P also affirmed
their 'axBBB+' long-term ASEAN regional scale rating on the Indonesia-based
telecommunications company. S&P affirmed the rating because they expect Indosat to
maintain its solid No.2 position in Indonesia's growing cellular market. The positive outlook
reflects their view that the company's financial risk profile will improve over the next 12-18
months.
On 28 September 2015, PEFINDO has affirmed its “idAAA” ratings for PT Indosat Tbk
(ISAT) and its Shelf-Registered Bond I/2014-2016, Bonds V/2007 Serie B, Bonds VII/2009
Serie B, and Bonds VIII/2012. PEFINDO has also affirmed its “idAAA(sy)” ratings for ISAT’s
Sukuk Ijarah I/2014-2016, Sukuk Ijarah IV/2009 Serie B, and Sukuk Ijarah V/2012. The
outlook for the corporate rating is “stable”. The ratings reflect ISAT’s strong support from its
majority shareholder, strong market position, and stable operating performance.
On 21 October 2015, Moody's Investors Service says that PT Indosat Tbk's (Ba1 stable)
1H 2015 results were in line with their expectations, with continued improvement in
operating performance from the second half of 2014. The stable outlook reflects Moody's
expectation that Indosat will maintain its position as a leading mobile operator in
Indonesia amid increasing competition for data services, and leverage, in terms of
adjusted debt/EBITDA will remain in the 2.5x -3.0x range for the next 12 - 15 months as
Indosat continues its high capex for network modernization.
On 15 March 2016, Fitch Ratings has upgraded the Long-Term Local-Currency Issuer
Default Rating (LC IDR) of Indonesia’s second-largest telecommunications operator, PT
Indosat Tbk (Indosat Ooredoo), to ‘BBB+’ from ‘BBB’. The agency has simultaneously
affirmed Indosat Ooredoo’s Long-Term Foreign-Currency IDR (FC IDR) and its foreign-
currency senior unsecured rating at ‘BBB’. Fitch has also affirmed the National Long-Term
Rating at ‘AAA(idn)’. The Outlook on the ratings is Stable.
Credit ratings
PT Indosat Tbk – FY 2015 Results 29

1.55
3.86
0.28 0.28
5.53
2.98
2.46 2.27
0.95 0.36 2.08
0.36 0.81
PT Indosat Tbk – FY 2015 Results
In IDR trillion
2020 2019 2022 2018 2017 2016
IDR
USD in IDR
2021 2025
* Excluding obligation under capital lease
2024
Debt maturity profile*
30

Number of BTS
10.0
900 Mhz
7.5
7.5
Indosat
Telkomsel
XL Axiata
20.0
1800 Mhz
22.5
22.5
10.0
2100 Mhz
15.0
15.0
in Mhz
Hutchison - 10.0 10.0
2.5
850 Mhz
3.5 – 5.0*
-
-
* Telkom and Bakrie Telekom have the same spectrum, differentiated by its operational areas
15.0**
2300 Mhz
15.0**
-
-
** Indosat/IM2: West Java exclude Bogor, Depok & Bekasi ; Telkom/Telkomsel: Maluku & North Maluku
Spectrum overview
PT Indosat Tbk – FY 2015 Results 31

• PT Indosat Tbk ( “Indosat” or “Company” ) cautions investors that certain statements contained in this document state its management's intentions, hopes, beliefs, expectations, or predictions of the future are forward-looking statements
• The Company wishes to caution the reader that forward-looking statements are not historical facts and are only estimates or predictions. Actual results may differ materially from those projected as a result of risks and uncertainties including, but not limited to:
• The Company’s ability to manage domestic and international growth and maintain a high level of customer service
• Future sales growth
• Market acceptance of the Company’s product and service offerings
• The Company’s ability to secure adequate financing or equity capital to fund our operations
• Network expansion
• Performance of the Company’s network and equipment
• The Company’s ability to enter into strategic alliances or transactions
• Cooperation of incumbent local exchange carriers in provisioning lines and interconnecting our equipment
• Regulatory approval processes
• Changes in technology
• Price competition
• Other market conditions and associated risks
• The company undertakes no obligation to update publicly any forward-looking statements, whether as a result of future events, new information, or otherwise
Disclaimer
PT Indosat Tbk – FY 2015 Results 32