PT Indoritel Makmur Internasional Tbk -...
34
PT Indoritel Makmur Inter Company presentation Company presentation September 2013 For interna rnasional Tbk al use only
Transcript of PT Indoritel Makmur Internasional Tbk -...
PT Indoritel Makmur InterCompany presentationCompany presentationSeptember 2013
For interna
rnasional Tbk
al use only

Disclaimer
This presentation and its contents may not be forwarded or distributed to any other person and mreproduction of this presentation in whole or in part is unauthorised and may result in a violation ofp p p ysecurities laws. This presentation is for information purposes only and for your reading only during thpresentation is not intended for potential investors and does not constitute or form part of an advertisemnor should it or any part of it form the basis of, or be relied in any connection with, any contract ordecision in securities in PT Indoritel Makmur Internasional Tbk (the "Company"). The information conta
No representation or warranty expressed or implied is made as to, and no reliance should be placed opresentation. None of the Company, Deutsche Bank AG, Hong Kong Branch, PT Buana Capital, Cradvisers or representatives shall have any liability whatsoever (in negligence or otherwise) for anyadvisers or representatives shall have any liability whatsoever (in negligence or otherwise) for anypresentation or its contents or otherwise arising in connection with this presentation.
The third party information and statistical data in this presentation have been obtained from sources thof the included information. This presentation does not contain all material information concerning thinformation in this document is presented as of 30 June 2013; its accuracy is not guaranteed; and itBuana Capital, Credit Suisse (Singapore) Limited or PT CIMB Securities Indonesia is under any obliga
Neither this presentation nor any copy or portion of it may be sent or taken, transmitted or distributedpublic offer for the sale of securities of the Company in the Republic of Indonesia or an offer for sale ofmay not be publicly offered in the Republic of Indonesia absent of a registration statement under theoffered or sold in the United States absent registration or an exemption from registration under the UnRepublic of Indonesia and the United States would be made by means of a prospectus that could binformation about the Company and its management, as well as financial statements. The Company dosecurities in the Republic of Indonesia and the United States.
This presentation may contain forward-looking statements that involve risks, uncertainties and other fincluding words such as “target,” “believe,” “expect,” “aim,” “intend,” “may,” “anticipate,” “estimate,” “plmeaning or the negative thereof.
Actual results, performance or achievements of the Company may be materially different from any fuSuch forward-looking statements are based on numerous assumptions regarding the Company's preseand must be read together with such assumptions. Predictions, projections or forecasts of the economand must be read together with such assumptions. Predictions, projections or forecasts of the economthe Company. Past performance is not necessarily indicative of future performance. The future financthese forward-looking statements.
This presentation also contains certain statistical data (the “Statistical Information”) which have beengiven as to the Statistical Information’s accuracy, appropriateness or completeness in any particular coreflect present market conditions or future market performance.
For interna
may not be copied or reproduced in any manner whatsoever. Any forwarding, distribution, copying orf applicable laws. Any failure to comply with these restrictions may constitute a violation of applicablepp y p y y pphe presentation and will be taken back by the Company (as defined below) after the presentation. Thisment, recommendation, offer, solicitation or invitation of any offer, to buy or subscribe for any securities,r commitment whatsoever. This presentation should not be relied upon as the basis of an investmentained in this presentation has not been independently verified.
on, the fairness, accuracy, completeness or correctness of the information or opinions contained in thisredit Suisse (Singapore) Limited or PT CIMB Securities Indonesia or any of their respective affiliates,y loss howsoever arising whether directly or indirectly from any use reliance or distribution of thisy loss howsoever arising, whether directly or indirectly, from any use, reliance or distribution of this
he Company believes to be reliable but there can be no assurance as to the accuracy or completenesshe Company and the information set forth in these materials is subject to change without notice. Themay be incomplete or condensed. None of the Company, Deutsche Bank AG, Hong Kong Branch, PTtion to update or keep current the information contained herein.
d, directly or indirectly, into Indonesia, Japan, Canada or the United States. This presentation is not af the securities of the Company in the United States or any other jurisdiction. Securities of the CompanyLaw Number 8 of 1995 on Capital Markets and prevailing capital markets regulations, as amended, or
nited States Securities Act of 1933, as amended. Any public offering of securities of the Company in thee obtained from the Company or the selling shareholder, as relevant, and that would contain detailedoes not intend to register any offering of securities in the United States or to conduct a public offering of
factors. These statements may include, without limitation, any statements preceded by, followed by oran,” “project,” “will,” “can have,” “likely,” “should,” “would,” “could” and other words and terms of similar
uture results, performance or achievements expressed or implied by such forward-looking statements.ent and future business strategies and the environment in which the Company will operate in the future,
my or economic trends of the markets are not necessarily indicative of the future or likely performance ofmy or economic trends of the markets are not necessarily indicative of the future or likely performance ofcial performance of the Company is not guaranteed. You are cautioned not to place undue reliance on
n prepared in reliance upon information from other third party sources. As such, no assurance can beontext, nor as to whether the Statistical Information and/or the assumptions upon which they are based
al use only

S ti 1Indoritel at a GlanceSection 1

Indoritel at a glanceg
M b d dMi i k t
One of Indonesia’s l
40 0% Mass-bread produMinimarket
1
40.0% stake
Largest m92.0% marke
Market cap: R
N b f i
Largest minimarket chain operator32.4% market share(a)
Number of stores: 8,039(c)
FY12 PATMI R 547b / US$56
1
1
Number of poi
FY12 PATMI:
FY12 PATMI: Rp547bn / US$56m
Market leadership across key consumer segmen
For interna
Note: Exchange rate as at 31 Dec 2012 for PATMI and as at 4 Sep 2013 for market cap(a) Based on the number of minimarket stores as of Dec 2012(b) Based on 2012 retail sales(c) Operating data as of Jun 2013Source: Bloomberg, FactSet as at 30 Jun 2013 and 4 Sep 2013
Q i k i t t
leading consumer groups
31.5% 35.8%ucer Quick service restaurant31.5% stake
35.8%stake
mass-bread produceret share(b)
Rp6.2trn / US$558.1m
t f l 45 895(c)
Largest QSR chain28.8% market share(b)
Market cap: Rp3.8trn / US$351.6m
N b f t t 446(c)
1
nts of sale: 45,895(c)
Rp149bn / US$15m
Number of restaurants: 446(c)
FY12 PATMI: Rp206bn / US$21m
ts of Indonesia supported by iconic household brands
al use only
1

Indoritel intends to actively support thedevelopment of our Associate Companp p
Board of CommissionersBoard of Commissioners
Benny Setiawan Santoso President Commissioner
Ferry Noviar Yosaputra(a) Commissioner
Soedarsono Commissioner
Budi Santosa Heryanto Commissioner
Bambang Subianto Independent Commissioner
Adi Pranono Leman Independent Commissioner
40.0% 31.5%
Common Commissioner
(2nd largest shareholder)
Board of CommissionersDjisman Simanjuntak President Commissioner
Soenardi Winato Commissioner
Board of Com
Benny Setiawan Santoso
Tan Huang HuatSoenardi Winato Commissioner
Soedarsono Commissioner
Tan Huang Huat
Seah Kheng Hong Conrad
PT Indomarco Perdana (55.6%) Bonlight Investments (26.5%
PT Lentera Bumi Mas (3.1%) Shikishima Baking (8.5%)
Sinarman Jonatan (1.3%) Sojitz Corporation (4.25%)
For interna
Public (29.25%)
(a) Ferry Noviar Yosaputra is also Vice President Director of FAST(b) Haliman Kustejo is also Director of Indomaret
e continued growth and ies
Board of Directors
Indoritel board representation in all A i t C iBoard of Directors
Alex Wreksoremboko President Director andNon-Affiliated Director
Evensius Go Director
Haliman Kustedjo(b) Director
Associate Companies
One of top 2 shareholders in each Associate Company
Associate Companies to share market insights
35.8%
share market insights through common Indoritel commissioners
(Largest shareholder) (2nd largest shareholder)
Director of Associate Companies
mmissioners
President Commissioner
Commissioner
Board of Commissioners
Anthony Salim President Commissioner
Eli b th G l l Vi P id t C i iCommissioner
Independent Commissioner
Elizabeth Gelael Vice President Commissioner
Rudy Tanudjaja Saputra Commissioner
Benny Setiawan Santoso Commissioner
Ken Leksono Independent Commissioner
P.L. Gunawan Solaiman Independent Commissioner
PT Gelael Pratama (43.9%)%)
Public (20.3%)
al use only
2

S ti 2Investment highlights and growth strategySection 2

Key investment highlights
Attractive exposure to large and
y g g
Attractive exposure to large and in Indonesia1
Dominant market leaders2
Extensive nationwide s3
Large-scale operation an4
Proven business models that r5
For interna
growing middle-income class and underpenetrated marketsgrowing middle income class and underpenetrated markets
hip positions complemented by iconic brands
store network supported by efficient distribution platform
d market leadership positions drive operational synergies
reinforce market positions and drive future growth
al use only
3

Attractive exposure to large and grocompelling consumption trends1 p g p
Attractive Indonesia macro story…
4th most populated in the world c. 247 million people as of 2012
VAST
GROWING
18.9
25.46.9%
Real GDP CAGR Disposable income per capita
13.3
2008 2012 2015E
5.8%
2008 – 12 2012 – 15E
Rp
(m)
RISING CONSUMER EXPENDITURE
3 107 3,484 3,905 4,369
R tr
illion
939 1,018 1,138 1,276 1,403 1,561 1,739 1,930 2,079 2,285 2,518 2,793 3,107 ,
2008 2009 2010 2011 2012 2013F 2014F 2015F
IDR
Expenditure on food items Expenditure on non-food items
For interna
(a) Based on expenditure per capita per monthSource: Frost & Sullivan
owing middle-income class driving
…supporting favourable industry outlook
MinimarketR 73 0 t
CAGR
26.0%2008 – 12
Rp 73.0 trnmarket size
(2012) 13.5%2012 – 15E
BreadRp 10.6 trnmarket size
(2012)
10.0%
8 7%
2008 – 12
2012 15E
QSR
8.7%2012 – 15E
11.4%2008 – 12QSR
Rp 15.1 trnmarket size
(2012)9.9%2012 – 15E
al use only
4

Significantly underpenetrated marke1 g y p
Minimarkets Bread
60
102
Indonesia
Philippines
2012E modern retail sales per capita (US$) 2012E bread sales
Strong growth potential
Stron
4
5
Philipines
Indonesia102
206
325
781
Philippines
Malaysia
Thailand
Singapore
Stron5
6
8
Indonesia
Thailand
Malaysia
Hong Kong
844Hong Kong
% of total modern retail sales % of total b% of retail value
Singapore
47% 50% 51% 53% 54% 55% 56%
59% 53% 51% 49% 47% 46% 45% 44%
92% 92% 91% 8
41% 47% 50% 51% 53% 54% 55%
2008 2009 2010 2011 2012 2013E 2014E 2015E
Minimarkets Supermarket / Hypermarket
Minimarket is the winning modern retail format Rising popularity o
8% 8% 9% 1
2009 2010 2011 2
Mass-produced
For interna
Minimarket is the winning modern retail format g p p ypackaged bread
Source: Frost & Sullivan
ets with strong growth potentialg g p
QSR
s per capita (US$) 2012E QSR sales per capita (US$)
g growth potential
Strong growth potential 7
27
Indonesia
Philippinesg growth potential
29
27
38
49
169
Philippines
Thailand
Malaysia
Singapore
bread sales % of total QSR sales
22% 21% 20% 19% 18% 17% 16% 16%
34 319 Hong Kong
78% 79% 80% 81% 82% 83% 84% 84%
22% 21% 20% 19% 18% 17% 16% 16%
88% 87% 85% 84%
of mass-produced Chained QSR continues to dominate with
2008 2009 2010 2011 2012 2013E 2014E 2015E
Chained Independent
12% 13% 15% 16%
2012 2013E 2014E 2015E
Home / Boutique
al use only
5
p better brand exposure

Dominant market leadership positio2 p p
1 1
32.4% 31.6%Market share by 2012 number of stores Market share by 2012 sa
92.0%
3.1%1.4%
Alfamart Alfamidi Circle K
Iconic brands with unique and distinctive value propositions reinforce our ma
Good value merchandise at easily accessible locations
High quality and ioffering with distin
various
For interna
Source: Frost & Sullivan
ons complemented by iconic brandsp y
1
ales (mass-production) Market share by 2012 number of stores12.1% KFC has 28.8%
market shared based
8.0%
6.6%5.9% 5.6%
on retail value
arket-leading positions
Others California Fried Chicken
Baskin Robbins
Pizza hut
innovative product nctive packaging of s brands
Innovative menu offerings catering to Indonesian taste
al use only
6

Extensive nationwide store network distribution platform
3p
1,239 stores
Sumatra
23 stores
Kalimantan
,
4,703 POS
84 outlets
26 outlets
2,985 stores
27,389 POS
155 outlets
Greater Jakarta
155 outlets
Our nationwide presence supported by efficient distribution infrastructure pro
18 Indomaret DCs 24 ROTI Note: As at 30 Jun 2013
Better access and service our customers
Identify key trends that may affect our operations and business model
Our nationwide presence supported by efficient distribution infrastructure pro
For interna
supported by efficient
243 stores
Sulawesi
10 outlets
East Indonesia
904 POS
32 outlets
3,549 stores
12,899 POS
Java
ovides a platform to ...
139 outlets
production lines 25 KFC warehouses
Identify new market opportunities in Indonesia in a timely and cost-efficient manner
Supply merchandise and raw materials nationwide with short lead times and cost-effective manner
ovides a platform to ...
al use only
and cost effective manner
7

Large-scale operations and market leadesynergies
4
1 1
Operationa
Market leade
Increased bargaining power
Favorable prices from suppliers through bulk purchases
Stronger access to new retail locations and distribution channels
Talent recruitment for key executive positions
Supplier management Merchandising / raw material procurement
Supply chain management system is scal
For interna
pp y g y
ership positions drive operational
1
al scale
ership
Economies of scale
Maintain per unit fixed costs low and competitive
Maximise efficiency of operations
Sustainability of strong profit margins
Warehousing / distribution centres Retail network
lable to support future growth and expansion
al use only
8
pp g p

Proven business models that reinforgrowth
5g
Standardised minimarket store format → limits fit-out time and capex → faster speed to market
Successful franchising model → faster and li ht i f t
Solid brand equity → and barriers to entry
Strong access to rapii i k t h i
capex-light expansion of new stores
Advanced merchandise data system and distribution infrastructure → just-in-time delivery and optimal stock level
minimarket chains →
State-of-the-art autom→ cost efficiency to
Indomaret stores Sari Roti pro
Proven business models supported by strong track record of execution posit
4,955
6,003
7,245 8,039
2,146
2,554 2,837
11
17
3,058 3,857
4,691 5,202
1,897
2010 2011 2012 1H 2013
11
2010 2011
For interna
Owned Franchised
(a) Cleanliness, Hospitality, Accuracy, Maintenance, Products and Speed
rce market positions and drive future
strong pricing power
dly expanding hi h t ti
Strategic support from YUM! → product R&D and operational excellence
Standardised CHAMPS(a) implementation lid ti i t i
higher penetration
mated production linesdrive expansion
→ solid execution in new store openings
Constant innovation of product and menu offerings → reinforce dominance in QSR
duction lines KFC outlets
tions us for future profitable growth
24 24
398421 441 446
2012 1H 2013 2010 2011 2012 1H 2013
al use only
9

Three-prong growth strategy to further leading consumer company in Indonesg p y
Enhance brand equity and market leading positions Enhance brand equity and market leading positions 1
Support the continued growth and development of Associate Companies
1) Continuous and rapid expansion across Indonesia
2) Further increasing customer demand and sales productivity
3) Continued focus on operational and distribution efficiency
A
B
C
Continue to improve profitability and return on capitalContinue to improve profitability and return on capital
3) Continued focus on operational and distribution efficiencyC
2
Leverage on scale, market-leading positions and pan-Indonesian presence of Associate Companies
Increase productivity of Associate Companies to improve profit margins and capital efficiency
Opportunistically consider and evaluate expansion into new business
Evaluate new and complementary business opportunitiesEvaluate new and complementary business opportunities3
pp y psegments
Complementary to existing business and leverage on competencies residing within the Group
For interna
cement our position as the ia
Indoritel will offer an attractive exposure to fast-growing consumer
i i I d icompanies in Indonesia
Focus on delivering profitability, sustainable growth and return to shareholders
al use only
10

S ti 3Overview of Associate CompaniesSection 3

Indomaret is the largest minimarket chag
Key highlights
Extensive nationwide store footprint with established di t ib ti l tf
Largest minimarket chain operator with 32.4%
k t h (a)
1 2
Unrivalled supply chain management for deeper store penetration
Effective and attractive franchise business model
distribution platformmarket share(a)
3 4
Minimarkets Convenience stores
No of stores: 7,953 No of stores: 86
Store selling area (sqm): 60 – 200
Product mix: food and non-food merchandise, groceries, fresh produce
Store selling area (sqm): 160 – 350
Product mix: groceries, ready-to-eat, ready-to-drink
For interna
(a) Frost & Sullivan
ain operator in Indonesiap
Product mix focus on young patrons and family consumption
2012 sales mixBeverages
13%
Tobacco10%
Other37%
Food
d
Baby food9%
Snacks8%
Margerine and cooking oilBody care
4%MilkPhone vouchers
Detergent4%
Baby and child care3%
Non
-foo
resh
du
ce
Large selection of c.4,000 merchandise items at affordable prices
Tailored to each store’s local target market at appropriate price points
4%4%Milk4%
Phone vouchers4% Fr pr
o
IT-driven integrated distribution system
18 DCs with total capacity of 94,313m3
Each DC supports 500-600 Indomaret stores
100-110 trucks per DC
Efficient digital picking system
Daily tracking of inventory levels per store and automated order requests
al use only
11
automated order requests

Indomaret has clear growth strategies tg g
Continuous and rapid store expansion across IndonesiaContinuous and rapid store expansion across Indonesia1
Target 3 – 5 new store openings daily
Expect to open up to 1,600 new stores for 2013 and up to 1,300 – 1,400 new stores p.a. for 2014 and 2015
Focus on store expansion outside Greater Jakarta with greater growthFocus on store expansion outside Greater Jakarta with greater growth potential and under-served areas
New stores typically cash flow positive in 1st year with 3 – 4 years payback period
New store expansion focus on outside Greater Jakarta
36.0% 47.0%2010 26.6%
35.9%
2012 28.3%
34.5%
2013E
16.9% 37.4% 37.2%
1,152New stores
1,366New stores
1,600New stores
Greater Jakarta Java Outside Java(a)
For interna
(a) Excludes Greater Jakarta
Greater Jakarta Java Outside Java
to strengthen its market leadershipg p
Drive customer traffic and sales productivityDrive customer traffic and sales productivity2
Targeted marketing campaigns
Develop suite of innovative value-added services
– Indomaret card, Indomaret ATM, jakcard, t-cash, Indomaret Order Delivery Collect (PAAI)
Continuously tailor and optimise merchandise mix at individual store level
Increase sales of private label brands (currently >300 SKUs)
– Key products include facial tissue, mineral water and sugar
– Higher margins than regular merchandise
Increasing sales productivityIncreasing private label sales
3.3%
3.7%4.0%
4.3%
% to
tal s
ales
9.0 9.711.7 11.0
Rpm
/day
/sto
re
2010 2011 2012 1H 2013 2010 2011 2012 1H 2013
al use only
12
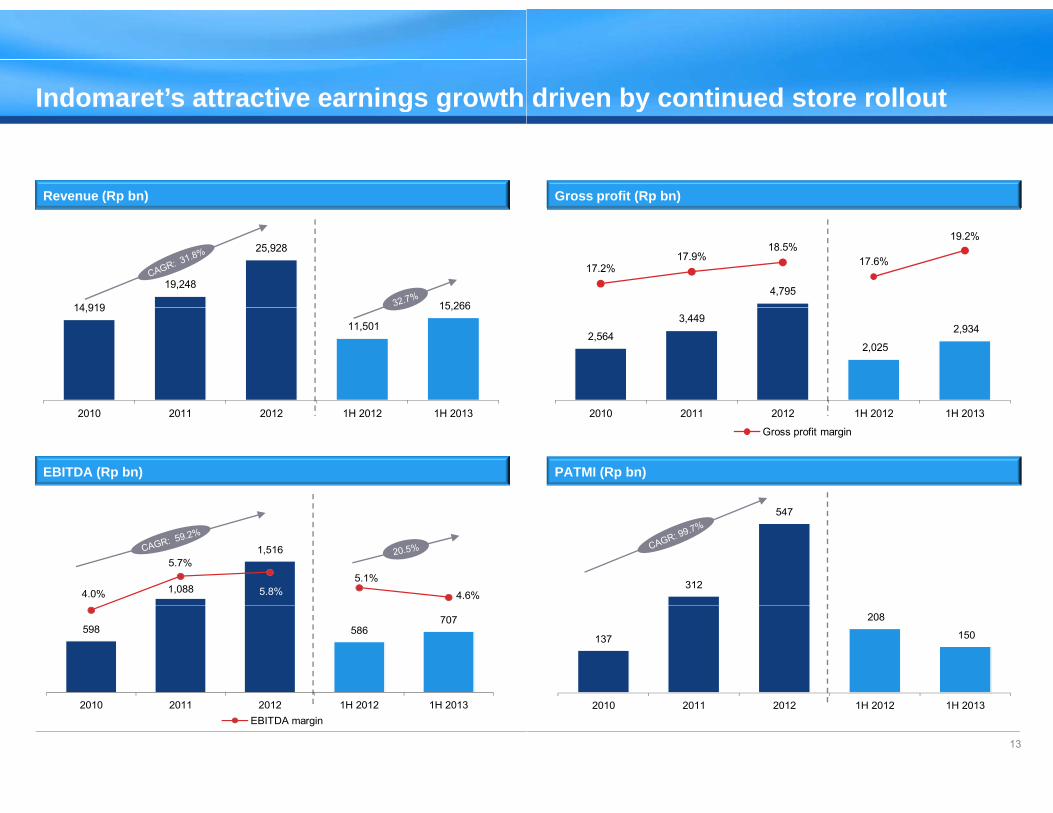
Indomaret’s attractive earnings growth g g
Revenue (Rp bn)
14 919
19,248
25,928
15 26614,919
11,501
15,266
EBITDA (Rp bn)
2010 2011 2012 1H 2012 1H 2013
1,088
1,516
4.0%
5.7%
5.8%5.1%
4.6%
598 586707
2010 2011 2012 1H 2012 1H 2013
For interna
2010 2011 2012 1H 2012 1H 2013EBITDA margin
driven by continued store rollouty
Gross profit (Rp bn)
4,795
17.2% 17.9%
18.5% 17.6%
19.2%
2,564
3,449
2,025
2,934
PATMI (Rp bn)
2010 2011 2012 1H 2012 1H 2013
Gross profit margin
312
547
137
208
150
2010 2011 2012 1H 2012 1H 2013
al use only
13
2010 2011 2012 1H 2012 1H 2013

Indomaret has a robust capital structurp
Total debt and cash (Rp bn)
1,996
2,995 2,558 2,706
Rp2.6trn equity injection
1,563
474 607
1,163
2010 2011 2012 1H 2013
Total debt / EBITDA
Total debt Cash
2.6x
1.8x 2.0x
1.6x
2010 2011 2012 LTM 1H 2013
For interna
re to support future expansionpp p
Total debt / equity
1.3x 1.3x1.5x
1.1x
2010 2011 2012 LTM 1H 2013
Capital expenditure (Rp bn)
342
253
381
255
158
2010 2011 2012 1H 2012 1H 2013
al use only
14
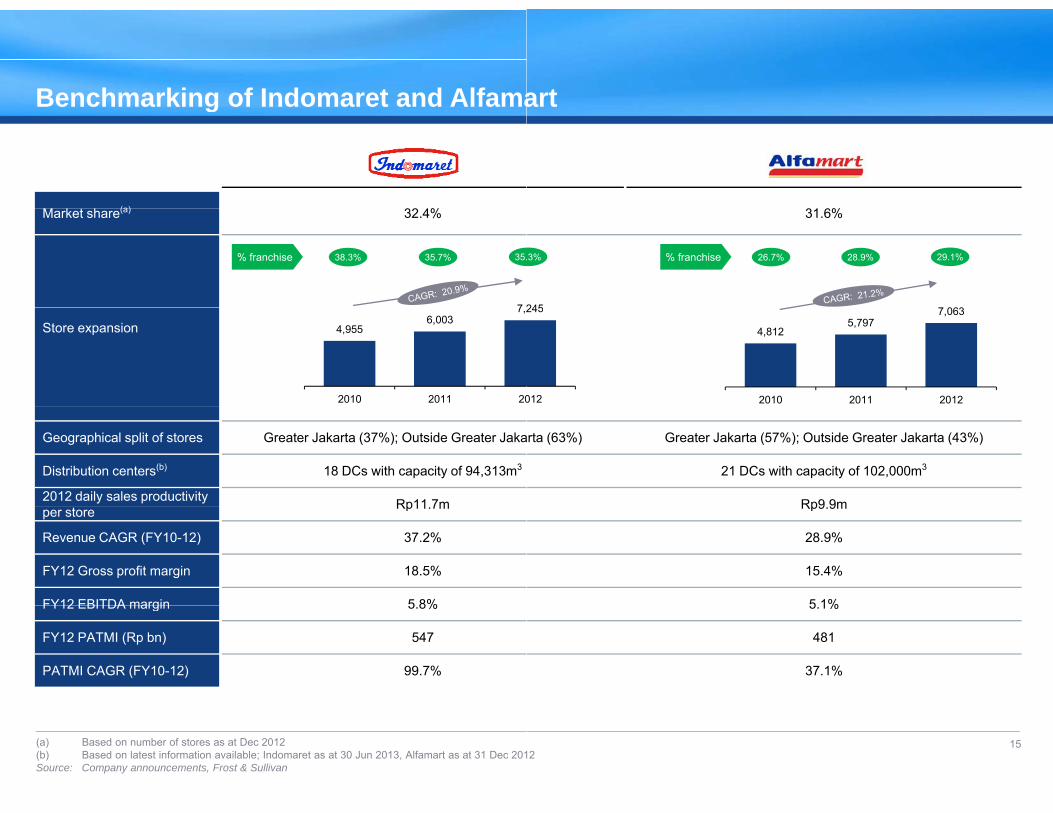
Benchmarking of Indomaret and Alfama
M k h (a) 32 4%
g
Market share(a) 32.4%
38.3% 35.7% 35.% franchise
7 2
Store expansion 4,9556,003
7,2
2010 2011 20
Geographical split of stores Greater Jakarta (37%); Outside Greater Jaka
Distribution centers(b) 18 DCs with capacity of 94,313m3
2012 daily sales productivity Rp11 7mper store Rp11.7m
Revenue CAGR (FY10-12) 37.2%
FY12 Gross profit margin 18.5%
FY12 EBITDA margin 5 8%FY12 EBITDA margin 5.8%
FY12 PATMI (Rp bn) 547
PATMI CAGR (FY10-12) 99.7%
For interna
(a) Based on number of stores as at Dec 2012(b) Based on latest information available; Indomaret as at 30 Jun 2013, Alfamart as at 31 Dec 201Source: Company announcements, Frost & Sullivan
art
31 6%31.6%
7 063
.3% 26.7% 28.9% 29.1%
245
% franchise
4,8125,797
7,063
2010 2011 2012
245
012
arta (63%) Greater Jakarta (57%); Outside Greater Jakarta (43%)
21 DCs with capacity of 102,000m3
Rp9 9mRp9.9m
28.9%
15.4%
5 1%5.1%
481
37.1%
al use only
1512
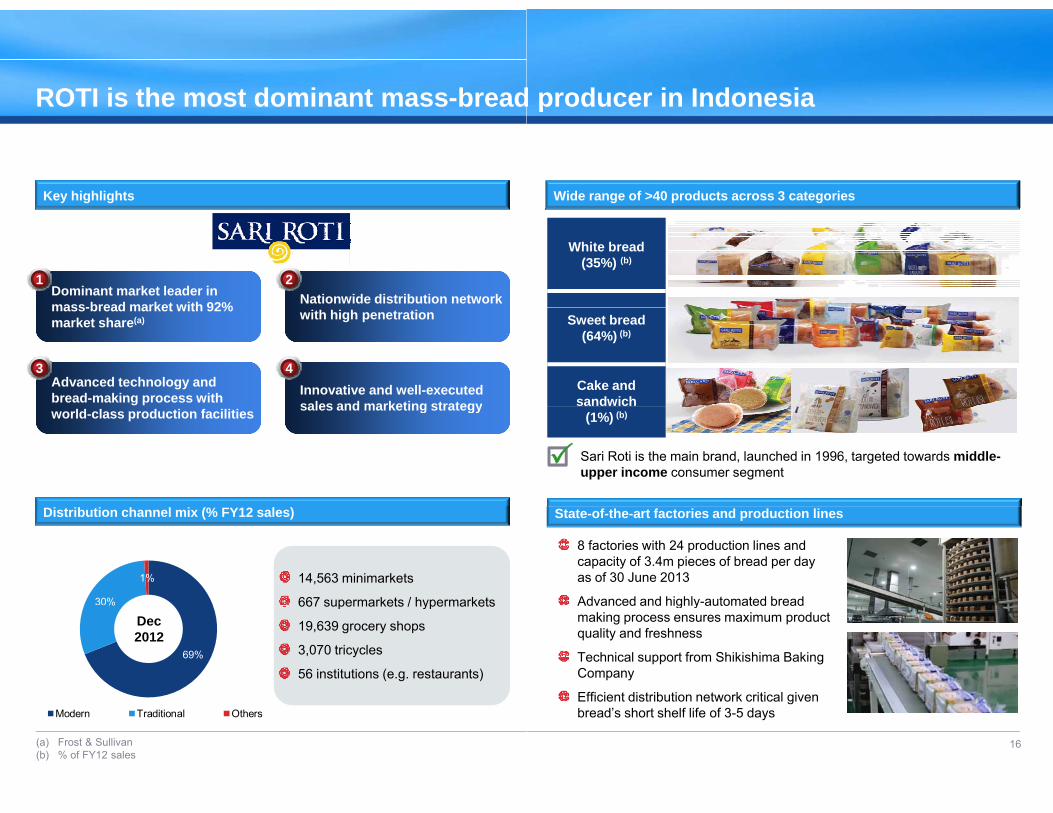
ROTI is the most dominant mass-bread
Key highlights
Dominant market leader in mass-bread market with 92%
1Nationwide distribution network
2
mass-bread market with 92% market share(a)
Advanced technology and bread-making process with
3
with high penetration
Innovative and well-executed sales and marketing strategy
4
world-class production facilities sales and marketing strategy
Distribution channel mix (% FY12 sales)
14,563 minimarkets
667 supermarkets / hypermarkets30%
1%
Dec2012
667 supermarkets / hypermarkets
19,639 grocery shops
3,070 tricycles
56 institutions (e.g. restaurants)69%
%
For interna
(a) Frost & Sullivan(b) % of FY12 sales
Modern Traditional Others
d producer in Indonesiap
Wide range of >40 products across 3 categories
White bread(35%) (b)
Sweet bread(64%) (b)
Cake and sandwich
(1%) (b)
Sari Roti is the main brand, launched in 1996, targeted towards middle-upper income consumer segment
State-of-the-art factories and production lines
8 factories with 24 production lines and capacity of 3.4m pieces of bread per day as of 30 June 2013
Advanced and highly-automated breadAdvanced and highly automated bread making process ensures maximum product quality and freshness
Technical support from Shikishima Baking Company
Efficient distribution network critical given
al use only
16
bread’s short shelf life of 3-5 days

ROTI has clear growth strategies to streg g
Penetrate into underPenetrate into under--served regions of Indonesiaserved regions of Indonesia1
Plans to open 3 new factories in Java and Kalimantan (currently no factory present) and 6 additional production lines by end 2013
– Increase capacity to 4.3m pieces of bread per day by end of 2013
Targets to build 5 10 new production lines each year to supportTargets to build 5 – 10 new production lines each year to support expansion outside Java
Further growth through minimarkets as ROTI only covered 46% of all minimarkets as of end 2012
Expansion of factories outside Java
Location 2010 2011 2012
Greater Jakarta 2 3 3
Java 1 2 2
Sumatra – 1 2
Sulawesi – – 1
Total 3 6 8
For interna
Outside Java
engthen its market leadershipg p
Enhance product offering to strengthen customer loyaltyEnhance product offering to strengthen customer loyalty2
Strong brand name provides unique leverage to effectively roll out new product launches in the Indonesian bread market
Continual research and development to produce new and innovative bread products in line with industry trends
– Evaluate 6 – 10 new products each year
Development of healthy products that contain dietary fiber, high calcium, DHA, Omega 3 fatty acids and other health beneficial elements
Constant rollout of new innovative products
2013Sandwich Blueberry Double soft white bread
2013
2012
Sobek Coklat Blueberry
Sandwich Krim Keju Double sandwich
Tawar Kurma Tawar Keju
Roti Isi Mix Fruit Tawar 6 slice
2010
2011
Chiffon Coklat dan Pandan
Sobek Coklat Blueberry Roti Isi Chicken Teriyaki Roti Isi Beef Barbeque Chiffon Strawberry, Mei
Sandwich Coklat Sandwich Kacang
Roti Tawar Pandan
al use only
17
2010Sobek Coklat Nanas

ROTI’s attractive earnings growth driveg g
Revenue (Rp bn)
813
1,191
707612 570
707
EBITDA (Rp bn)
2010 2011 2012 1H 2012 1H 2013
161 178
241
115143
26.3%
21 8%
20.2%
115 21.8% 20.2% 20.3%
2010 2011 2012 1H 2012 1H 2013
For interna
EBITDA margin
en by production line expansiony p p
Gross profit (Rp bn)
379
556
47.2% 46.6% 46.7% 45.9% 46.3%
289
379
262 327
PATMI (Rp bn)
2010 2011 2012 1H 2012 1H 2013
Gross profit margin
100
116
149
72 76
2010 2011 2012 1H 2012 1H 2013
al use only
18

ROTI has a robust capital structure to sp
Total debt and cash (Rp bn)
Higher debt to fund expansion of new factories
and production lines937
493
0 33
303
12148 38
493
2010 2011 2012 1H 2013
Total debt / EBITDA
Total debt Cash
3.5x
0.0x0.2x
1.3x
For interna
2010 2011 2012 LTM 1H 2013
support future expansionpp p
Total debt / equity
1.3x
0.0x 0.1x
0.5x
2010 2011 2012 LTM 1H 2013
Capital expenditure (Rp bn)
224
389
212
163 164
al use only
19
2010 2011 2012 1H 2012 1H 2013

FAST is the leading QSR chain and sole
Key highlights
g
Largest QSR chain in Indonesia with 28.8% Extensive nationwide store
t k ith 446 tl t
1 2
market share(a)
Unrivalled distribution platform to support future expansion
network with 446 outlets
Sole KFC franchise with strategic support from YUM!
3 4
Internationally reputable and highly recognized KFC brand
Dominant market share of 85.2% in chicken-based QSR
>50% customers’ share of QSR visits according to BITS(b)
Consistently won franchise awards from YUM!
Highest CMS(c) score of 99.2 in 2012 - highest score for KFC franchisees in Asia Pacific
For interna
(a) Frost & Sullivan(b) Defined as Brand Image Tracking Study(c) Defined as CHAMPS Management System
e KFC franchise in Indonesia
Focus on innovative product and menu offerings
Consistently ranked for the best tasting fried chicken
Catering to Indonesian taste and preference
“Value for money” packaged menu combinations (e.g. Super Besar,
Value for money packaged menu combinations (e.g. Super Besar, Goceng, Praktis, Kids Meal, Krushers)
Strategic benefits from YUM! franchise relationship
Access to innovativeAccess to innovative products developed by
YUM! R&D
Access to YUM! global procurement capabilities
Participation in KFC advertising and marketing
promotions
Regular audit by YUM! to achieve best-in-class
customer services and operations
al use only
20
p operations

FAST has clear growth strategies to strg g
Disciplined rollout of new restaurantsDisciplined rollout of new restaurants1
Plans to open 34 new KFC restaurants by end 2013, of which 11 – 12 restaurants are free standing format
Target to open 50% of new KFC restaurants in Java and 50% outside Java
Continue to renovate/refurbish existing restaurants to maintain contemporary design and feel, increase seat capacity and service speed
Focus on free-standing restaurant format
40% 36%
16%8%
Jun2013
446 outlets
33% 52%
8%7%
Dec 2010
398 outlets
Cheaper than restaurant opening in shopping malls
More flexible hours of operation
446 outlets398 outlets
Mall In-line Airport Free standing Foodcourt
For interna
More latitude in adding additional facilities (e.g. KFC coffee counter)
rengthen its market leadershipg p
Strengthen KFC brand image and grow sales productivityStrengthen KFC brand image and grow sales productivity2
Optimise dining experience and focus on consistent quality products
Focus on exceptional customer-focused services
Continue to offer new products and limited time promotions to maintain and improve SSSG %and improve SSSG %
Work closely with YUM! for R&D to launch new tailored product offerings that cater to local tastes and preferences
Maintaining strong SSSG% over the past years
8.6%8.0% 7.9%
(%)
2010 2011 2012
al use only
21

FAST’s attractive earnings growth driveg g
Revenue (Rp bn)
2,827 3,184
3,559
1,668 1,849
EBITDA (Rp bn)
2010 2011 2012 1H 2012 1H 2013
315
384 387
11 1%12.1%
10 9%9.4%
157 131
11.1% 10.9%7.1%
2010 2011 2012 1H 2012 1H 2013
For interna
2010 2011 2012 1H 2012 1H 2013
EBITDA margin
en by continued outlet rollouty
Gross profit (Rp bn)
1,657 1,877
2,083
58.6% 58.9% 58.5%
58.8% 59.7%
981 1,104
PATMI (Rp bn)
2010 2011 2012 1H 2012 1H 2013
Gross profit margin
200
229206
78
49
2010 2011 2012 1H 2012 1H 2013
al use only
22
2010 2011 2012 1H 2012 1H 2013
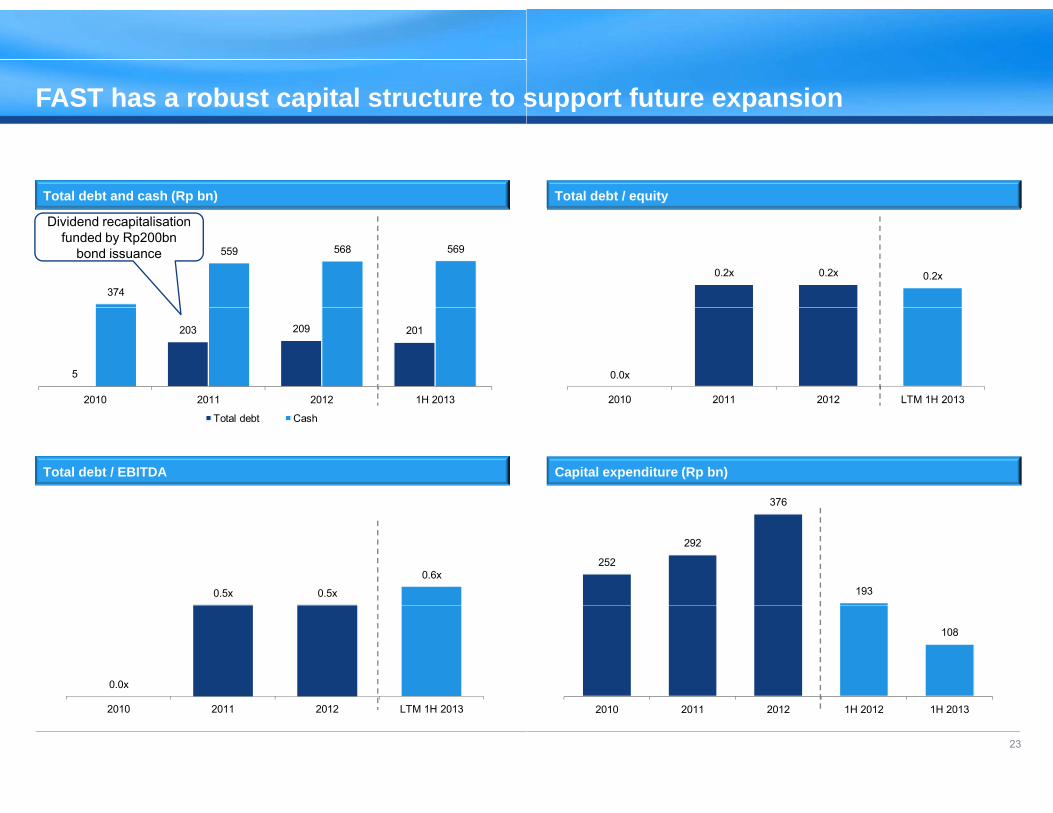
FAST has a robust capital structure to sp
Total debt and cash (Rp bn)
374
559 568 569
Dividend recapitalisation funded by Rp200bn
bond issuance
5
203 209 201
2010 2011 2012 1H 2013
Total debt / EBITDA
Total debt Cash
0.5x 0.5x
0.6x
0.0x
For interna
2010 2011 2012 LTM 1H 2013
support future expansionpp p
Total debt / equity
0.2x 0.2x 0.2x
0.0x
2010 2011 2012 LTM 1H 2013
Capital expenditure (Rp bn)
376
252
292
193
108
al use only
23
2010 2011 2012 1H 2012 1H 2013
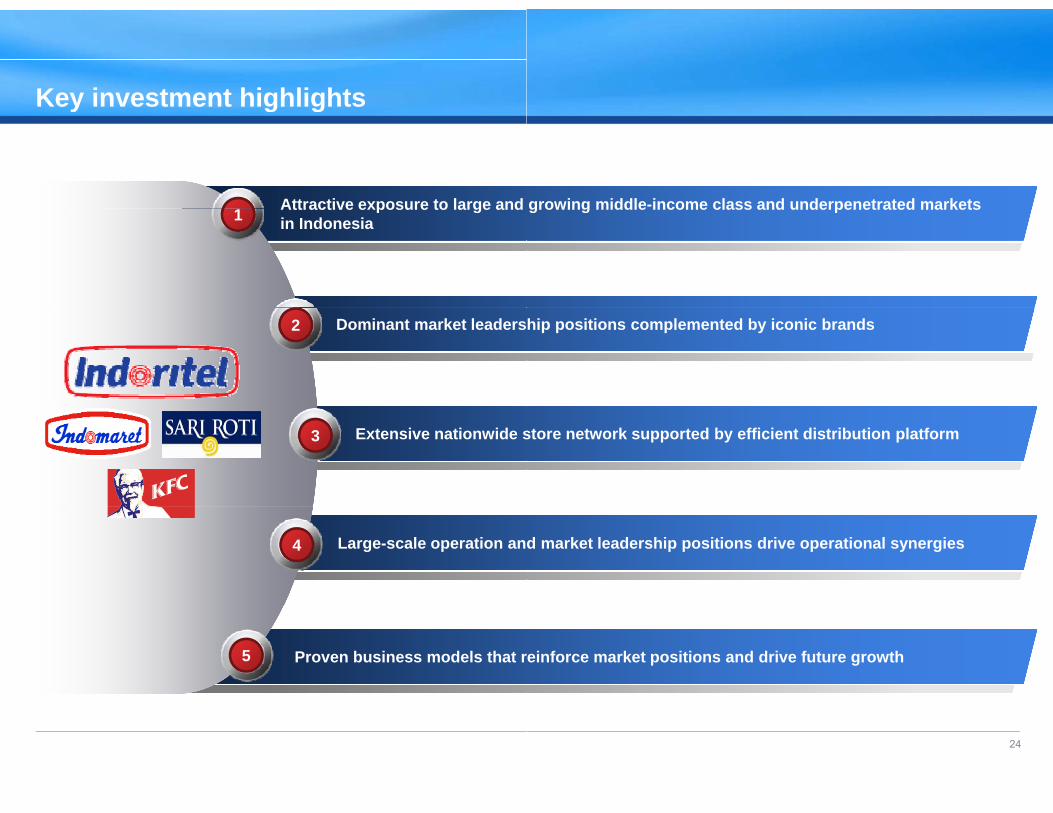
Key investment highlights
Attractive exposure to large and
y g g
Attractive exposure to large and in Indonesia1
Dominant market leaders2
Extensive nationwide s3
Large-scale operation an4
Proven business models that r5
For interna
growing middle-income class and underpenetrated marketsgrowing middle income class and underpenetrated markets
hip positions complemented by iconic brands
store network supported by efficient distribution platform
d market leadership positions drive operational synergies
reinforce market positions and drive future growth
al use only
24

A di IAdditional materialsAppendix I
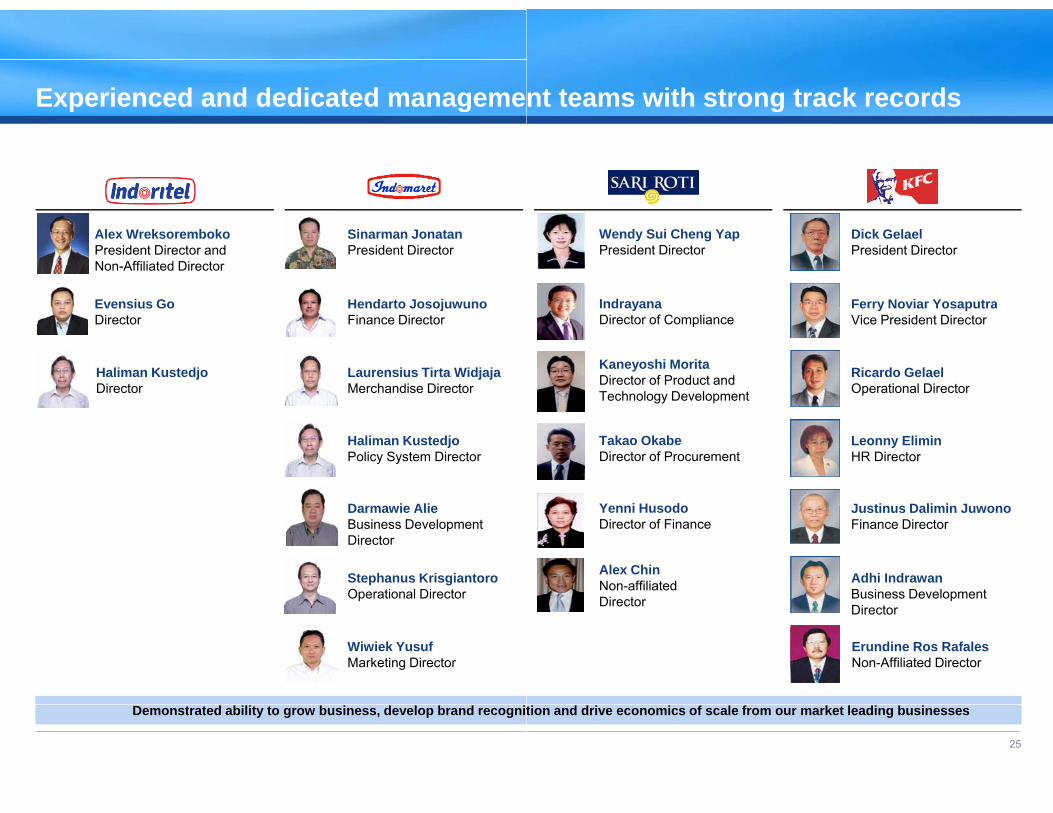
Experienced and dedicated managemep g
Alex WreksorembokoPresident Director and Non-Affiliated Director
Evensius Go
Sinarman JonatanPresident Director
Hendarto JosojuwunoEvensius GoDirector
Hendarto JosojuwunoFinance Director
Laurensius Tirta WidjajaMerchandise Director
Haliman KustedjoDirector
Haliman KustedjoPolicy System Director
Darmawie AlieDarmawie AlieBusiness Development Director
Stephanus KrisgiantoroOperational Director
Wiwiek YusufMarketing Director
For interna
Demonstrated ability to grow business, develop brand recognit
nt teams with strong track records g
Wendy Sui Cheng YapPresident Director
Indrayana
Dick GelaelPresident Director
Ferry Noviar YosaputraIndrayanaDirector of Compliance
Kaneyoshi MoritaDirector of Product and Technology Development
Ferry Noviar YosaputraVice President Director
Ricardo GelaelOperational Director
Takao OkabeDirector of Procurement
Yenni Husodo
Leonny EliminHR Director
Justinus Dalimin JuwonoYenni HusodoDirector of Finance
Alex ChinNon-affiliated Director
Justinus Dalimin JuwonoFinance Director
Adhi IndrawanBusiness Development Di tDirector Director
Erundine Ros RafalesNon-Affiliated Director
al use only
tion and drive economics of scale from our market leading businesses
25

FAST showcase
Free standing Drive thru
Coffee counter Marketing promotions
For interna
Renovation of existing restaurants
After
Before
al use only
26

ROTI showcase
Product offering
For interna
Production facilities
al use only
27

Indomaret showcase
Store layout
Indomaret cardIndomaret card
For interna
Promotions
Private label offeringsPrivate label offerings
al use only
28