PT Bank Negara Indonesia (Persero) Tbk · PDF file31.03.2009 · Section Page 0Page...
49
Corporate Presentation Corporate Presentation PT Bank Negara Indonesia (Persero) Tbk FY FY - - 2008 2008 A TURN AROUND STORY FOR SUSTAINABLE GROWTH Disclaimer: This report has been prepared by PT Bank Negara Indonesia (Persero) Tbk (Bank BNI) independently and is circulated for the purpose of general information only. It is not intended to the specific person who may receive this report. The information in this report has been obtained from sources which we deem reliable. No warranty (expressed or implied) is made to the accuracy or completeness of the information. All opinions and estimations included in this report constitute our judgment as of this date and are subject to change without prior notice. We disclaim any responsibility or liability without prior notice of Bank BNI and/or their respective employees and/or agents whatsoever arising which may be brought against or suffered by any person as a result of acting in reliance upon the whole or any part of the contents of this report and neither Bank BNI and/or its affiliated companies and/or their respective employees and/or agents accepts liability for any errors, omissions, negligent or otherwise, in this report and any inaccuracy herein or omission here from which might otherwise arise.
Transcript of PT Bank Negara Indonesia (Persero) Tbk · PDF file31.03.2009 · Section Page 0Page...
Section
Page 0Page 0
Corporate PresentationCorporate PresentationPT Bank Negara Indonesia (Persero) Tbk
FY FY -- 20082008
A TURN AROUND STORY FOR SUSTAINABLE GROWTH
Disclaimer: This report has been prepared by PT Bank Negara Indonesia (Persero) Tbk (Bank BNI) independently and is circulated for the purpose of general information only. It is not intended to the specific person who may receive this report. The information in this report has been obtained from sources which we deem reliable. No warranty (expressed or implied) is made to the accuracy or completeness of the information. All opinions and estimations included in this report constitute our judgment as of this date and are subject to change without prior notice. We disclaim any responsibility or liability without prior notice of Bank BNI and/or their respective employees and/or agents whatsoever arising which may be brought against or suffered by any person as a result of acting in reliance upon the whole or any part of the contents of this report and neither Bank BNI and/or its affiliated companies and/or their respective employees and/or agents accepts liability for any errors, omissions, negligent or otherwise, in this report and any inaccuracy herein or omission here from which might otherwise arise.
Page 1
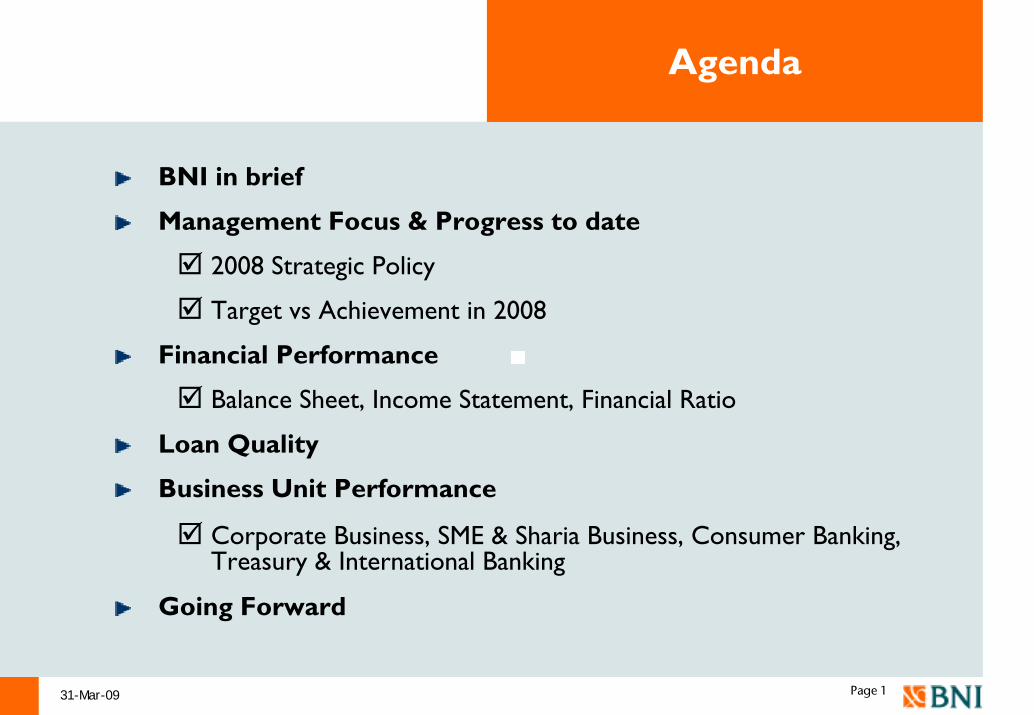
Agenda
BNI in brief
Management Focus & Progress to date
2008 Strategic Policy
Target vs Achievement in 2008
Financial Performance
Balance Sheet, Income Statement, Financial Ratio
Loan Quality
Business Unit Performance
Corporate Business, SME & Sharia Business, Consumer Banking, Treasury & International Banking
Going Forward
31-Mar-09

Section
Page 2
BNI in brief
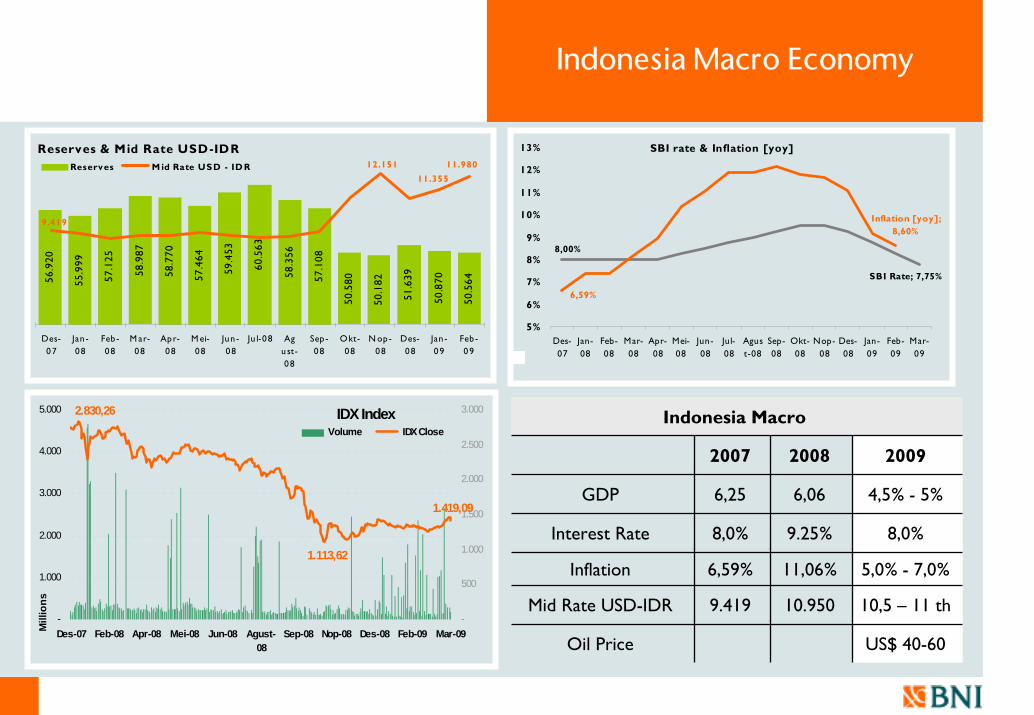
Indonesia Macro Economy
Reserves & Mid Rate USD-IDR
56.9
20
55.9
99
57.1
25
58.9
87
58.7
70
57.4
64
59.4
53
60.5
63
58.3
56
57.1
08
50.5
80
50.1
82
51.6
39
50.8
70
50.5
64
11.980
11.355
9.419
12.151
Des-07
Jan -08
Feb -08
M ar-08
Apr-08
M ei-08
Jun -08
Ju l-08 Agu st-08
Sep -08
Okt-08
N op-08
Des-08
Jan -09
Feb -09
Reserves M id Rate USD - ID R
SBI rate & Inflation [yoy]
8,00%
SBI Rate; 7,75%
Inflation [yoy]; 8,60%
6,59%
5%
6%
7%
8%
9%
10%
11%
12%
13%
Des-07
Jan-08
Feb-08
Mar-08
Apr-08
Mei-08
Jun-08
Jul-08
Agust-08
Sep-08
Okt-08
Nop-08
Des-08
Jan-09
Feb-09
Mar-09
Indonesia Macro
2007 2008 2009
GDP 6,25 6,06 4,5% - 5%
Interest Rate 8,0% 9.25% 8,0%
Inflation 6,59% 11,06% 5,0% - 7,0%
Mid Rate USD-IDR 9.419 10.950 10,5 – 11 th
Oil Price US$ 40-60
IDX Index2.830,26
1.113,62
1.419,09
-
1.000
2.000
3.000
4.000
5.000
Des-07 Feb-08 Apr-08 Mei-08 Jun-08 Agust-08
Sep-08 Nop-08 Des-08 Feb-09 Mar-09Mill
ions
-
500
1.000
1.500
2.000
2.500
3.000
Volume IDX Close
Page 4
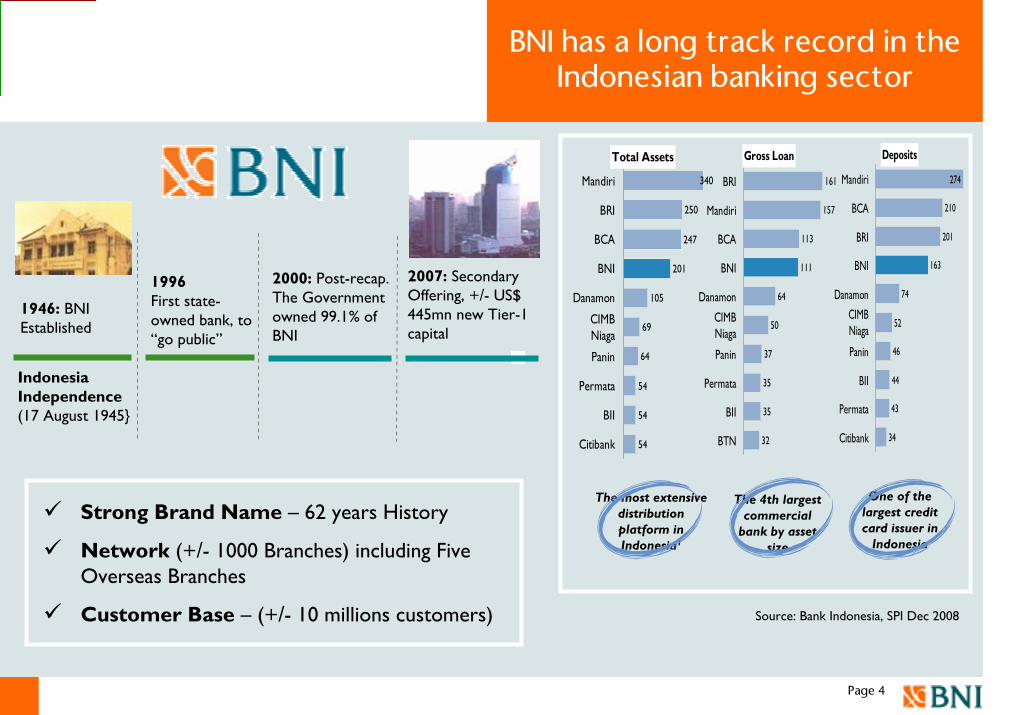
BNI has a long track record in the Indonesian banking sector
Total Assets
340
250
247
201
105
69
64
54
54
54
Mandiri
BRI
BCA
BNI
Danamon
CIMBNiaga
Panin
Permata
BII
Citibank
Gross Loan
161
157
113
111
64
50
37
35
35
32
BRI
Mandiri
BCA
BNI
Danamon
CIMBNiaga
Panin
Permata
BII
BTN
Indonesia Independence(17 August 1945}
1946: BNI Established
1996First state-owned bank, to “go public”
2000: Post-recap. The Government owned 99.1% of BNI
2007: Secondary Offering, +/- US$ 445mn new Tier-1 capital
The most extensive distribution platform in Indonesia¹
The 4th largest commercial
bank by asset size
One of the largest credit card issuer in
Indonesia
Deposits
274
210
201
163
74
52
46
44
43
34
Mandiri
BCA
BRI
BNI
Danamon
CIMBNiaga
Panin
BII
Permata
Citibank
Strong Brand Name – 62 years History
Network (+/- 1000 Branches) including Five Overseas Branches
Customer Base – (+/- 10 millions customers) Source: Bank Indonesia, SPI Dec 2008
Page 5
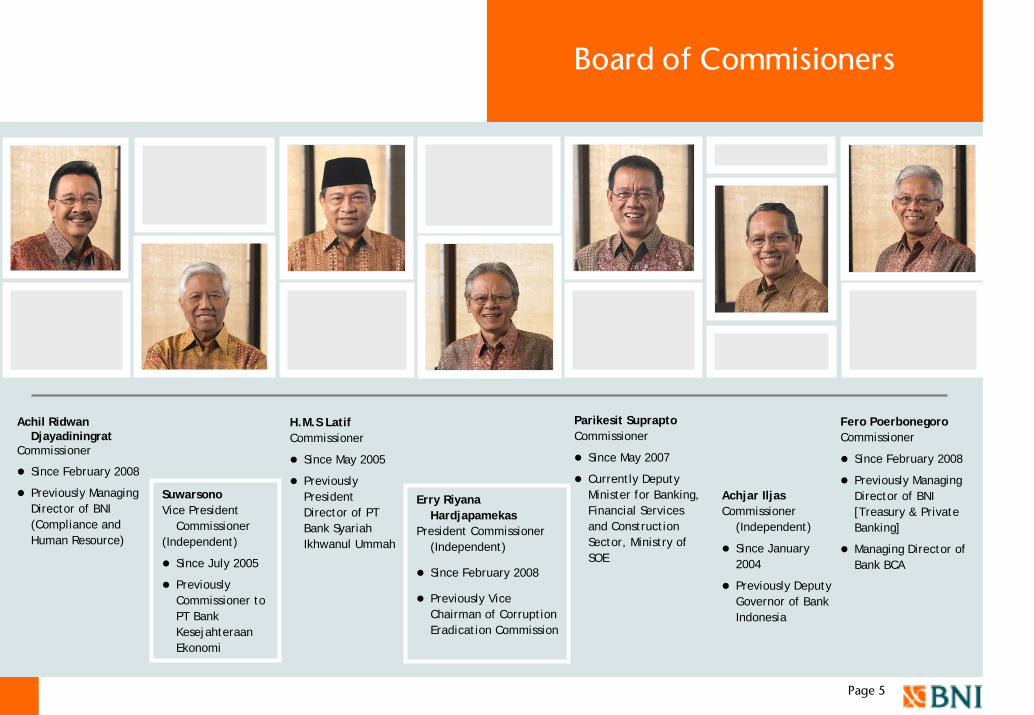
Board of Commisioners
Erry RiyanaHardjapamekas
President Commissioner (Independent)
Since February 2008
Previously Vice Chairman of Corruption Eradication Commission
SuwarsonoVice President
Commissioner(Independent)
Since July 2005
Previously Commissioner to PT Bank KesejahteraanEkonomi
Achil RidwanDjayadiningrat
Commissioner
Since February 2008
Previously Managing Director of BNI (Compliance and Human Resource)
H.M.S LatifCommissioner
Since May 2005
PreviouslyPresident Director of PT Bank SyariahIkhwanul Ummah
Fero PoerbonegoroCommissioner
Since February 2008
Previously Managing Director of BNI [Treasury & Private Banking]
Managing Director of Bank BCA
Achjar IljasCommissioner
(Independent)
Since January 2004
Previously Deputy Governor of Bank Indonesia
Parikesit SupraptoCommissioner
Since May 2007
Currently Deputy Minister for Banking, Financial Services and Construction Sector, Ministry of SOE
Page 6
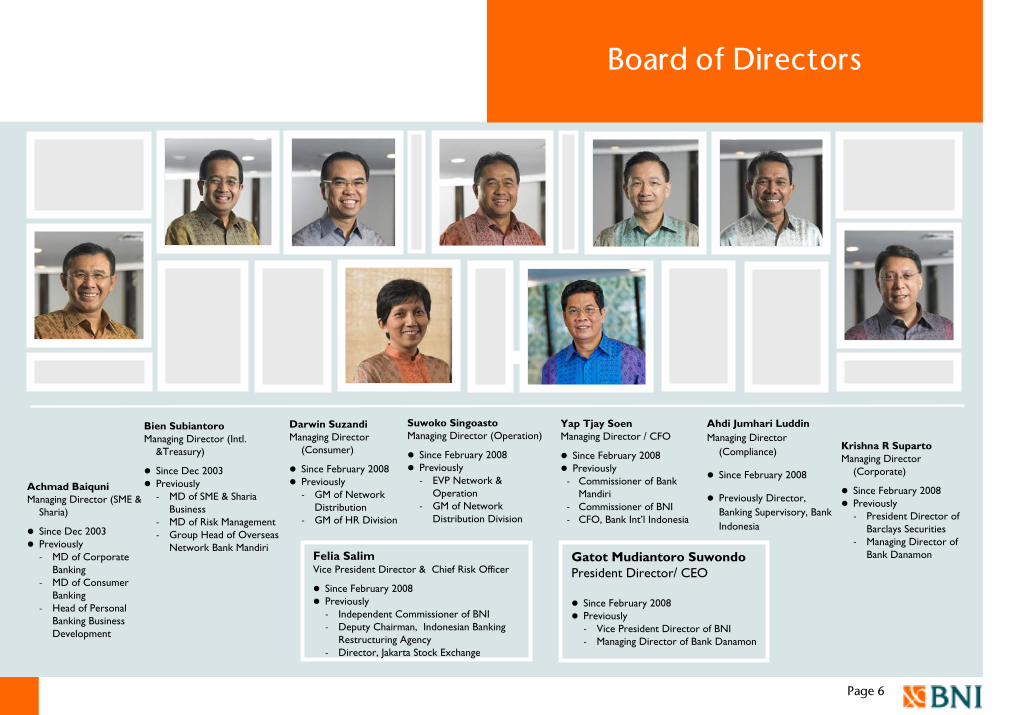
Board of Directors
Felia SalimVice President Director & Chief Risk Officer
Since February 2008Previously- Independent Commissioner of BNI- Deputy Chairman, Indonesian Banking
Restructuring Agency- Director, Jakarta Stock Exchange
Gatot Mudiantoro SuwondoPresident Director/ CEO
Since February 2008Previously - Vice President Director of BNI- Managing Director of Bank Danamon
Yap Tjay SoenManaging Director / CFO
Since February 2008Previously
- Commissioner of Bank Mandiri
- Commissioner of BNI- CFO, Bank Int’l Indonesia
Achmad BaiquniManaging Director (SME &
Sharia)
Since Dec 2003Previously - MD of Corporate
Banking- MD of Consumer
Banking- Head of Personal
Banking Business Development
Bien SubiantoroManaging Director (Intl.
&Treasury)
Since Dec 2003Previously - MD of SME & Sharia
Business- MD of Risk Management- Group Head of Overseas
Network Bank Mandiri
Suwoko SingoastoManaging Director (Operation)
Since February 2008Previously - EVP Network &
Operation- GM of Network
Distribution Division
Darwin SuzandiManaging Director
(Consumer)
Since February 2008 Previously - GM of Network
Distribution - GM of HR Division
Ahdi Jumhari LuddinManaging Director
(Compliance)
Since February 2008
Previously Director, Banking Supervisory, Bank Indonesia
Krishna R SupartoManaging Director
(Corporate)
Since February 2008 Previously - President Director of
Barclays Securities- Managing Director of
Bank Danamon
Page 7
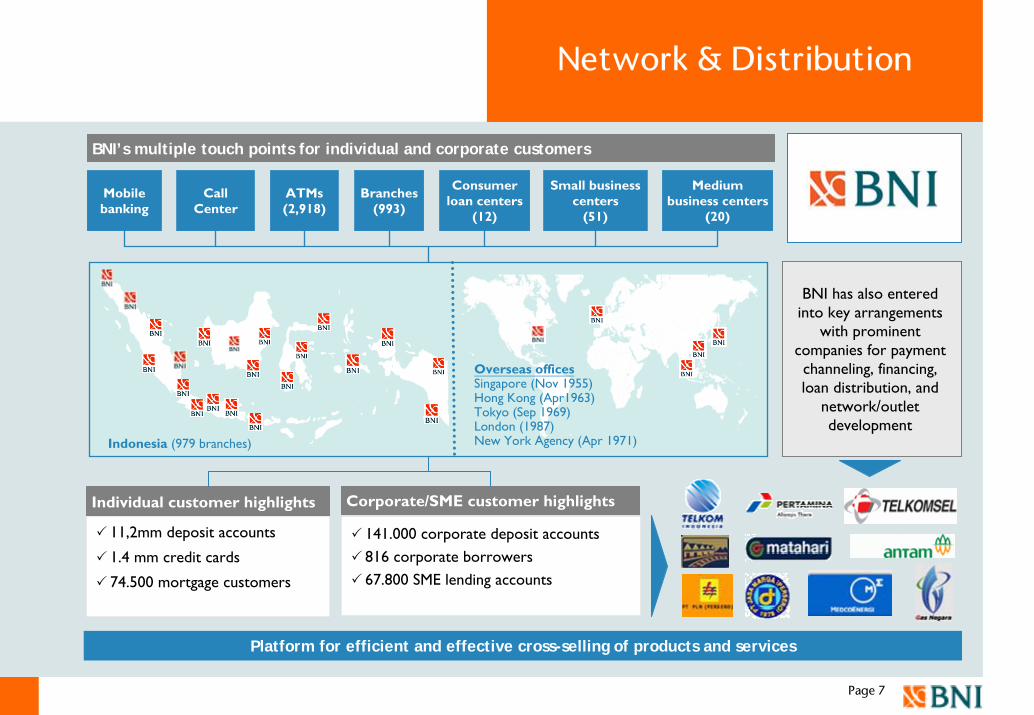
Network & Distribution
BNI’s multiple touch points for individual and corporate customers
Individual customer highlights
11,2mm deposit accounts
1.4 mm credit cards
74.500 mortgage customers
Corporate/SME customer highlights
141.000 corporate deposit accounts
816 corporate borrowers
67.800 SME lending accounts
Mobile banking
Call Center
Consumer loan centers
(12)
ATMs(2,918)
Branches(993)
Small business centers
(51)
Platform for efficient and effective cross-selling of products and services
Medium business centers
(20)
Indonesia (979 branches)
Overseas officesSingapore (Nov 1955)Hong Kong (Apr1963)Tokyo (Sep 1969)London (1987)New York Agency (Apr 1971)
BNI has also entered into key arrangements
with prominent companies for payment channeling, financing, loan distribution, and
network/outlet development
Page 8
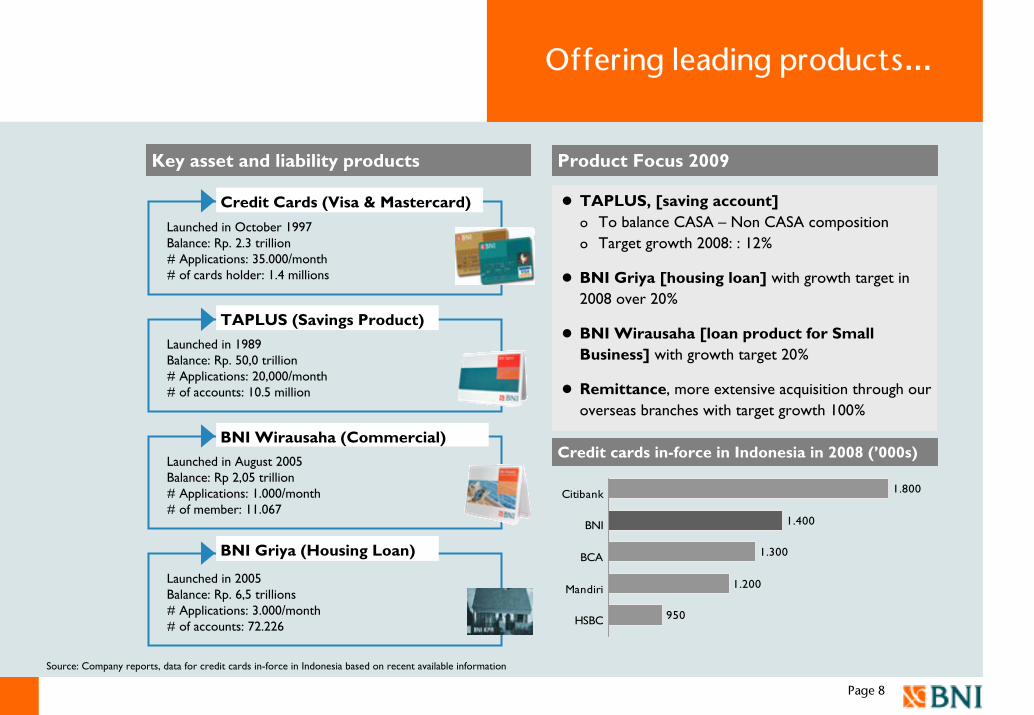
Offering leading products…
Source: Company reports, data for credit cards in-force in Indonesia based on recent available information
Product Focus 2009
Credit cards in-force in Indonesia in 2008 (’000s)
1.400
1.300
950
1.800
1.200
Citibank
BNI
BCA
Mandiri
HSBC
TAPLUS, [saving account]o To balance CASA – Non CASA compositiono Target growth 2008: : 12%
BNI Griya [housing loan] with growth target in 2008 over 20%
BNI Wirausaha [loan product for Small Business] with growth target 20%
Remittance, more extensive acquisition through our overseas branches with target growth 100%
Key asset and liability products
Credit Cards (Visa & Mastercard)
Launched in October 1997Balance: Rp. 2.3 trillion# Applications: 35.000/month# of cards holder: 1.4 millions
BNI Wirausaha (Commercial)
Launched in August 2005Balance: Rp 2,05 trillion# Applications: 1.000/month# of member: 11.067
BNI Griya (Housing Loan)
Launched in 2005Balance: Rp. 6,5 trillions# Applications: 3.000/month# of accounts: 72.226
TAPLUS (Savings Product)
Launched in 1989Balance: Rp. 50,0 trillion# Applications: 20,000/month# of accounts: 10.5 million
Page 9
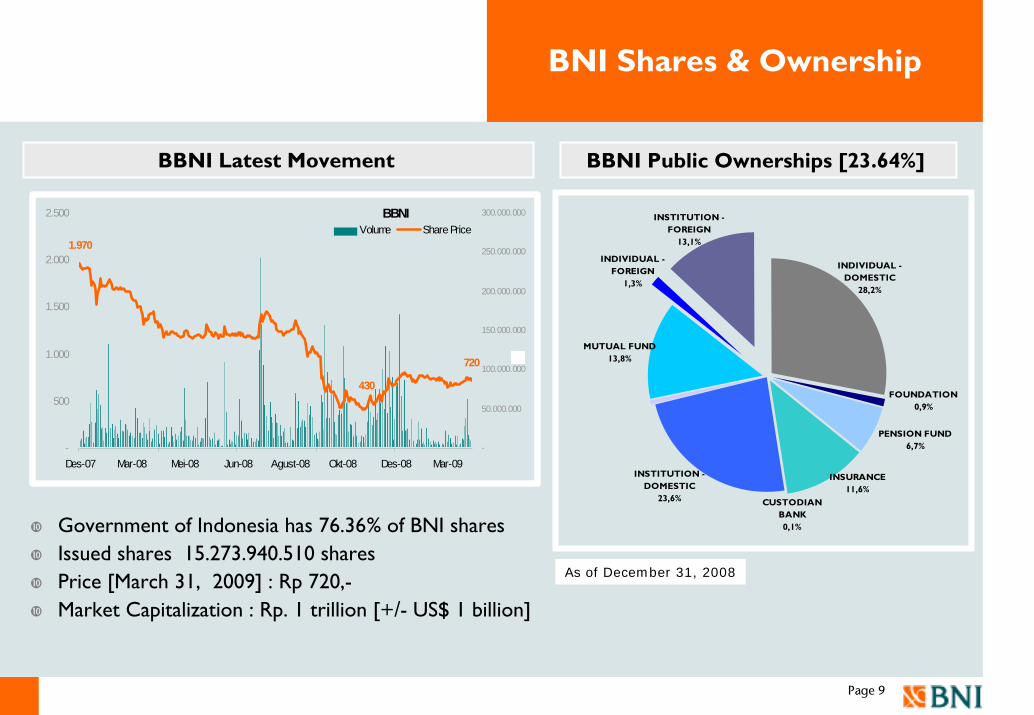
BNI Shares & Ownership
Government of Indonesia has 76.36% of BNI sharesIssued shares 15.273.940.510 sharesPrice [March 31, 2009] : Rp 720,-Market Capitalization : Rp. 1 trillion [+/- US$ 1 billion]
As of December 31, 2008
BBNI Latest Movement BBNI Public Ownerships [23.64%]
PENSION FUND 6,7%
INSURANCE 11,6%
CUSTODIAN BANK 0,1%
INDIVIDUAL - FOREIGN
1,3%
INDIVIDUAL - DOMESTIC
28,2%
INSTITUTION - FOREIGN
13,1%
FOUNDATION0,9%
MUTUAL FUND 13,8%
INSTITUTION - DOMESTIC
23,6%
BBNI
430
720
1.970
-
500
1.000
1.500
2.000
2.500
Des-07 Mar-08 Mei-08 Jun-08 Agust-08 Okt-08 Des-08 Mar-09-
50.000.000
100.000.000
150.000.000
200.000.000
250.000.000
300.000.000
Volume Share Price
Page 10
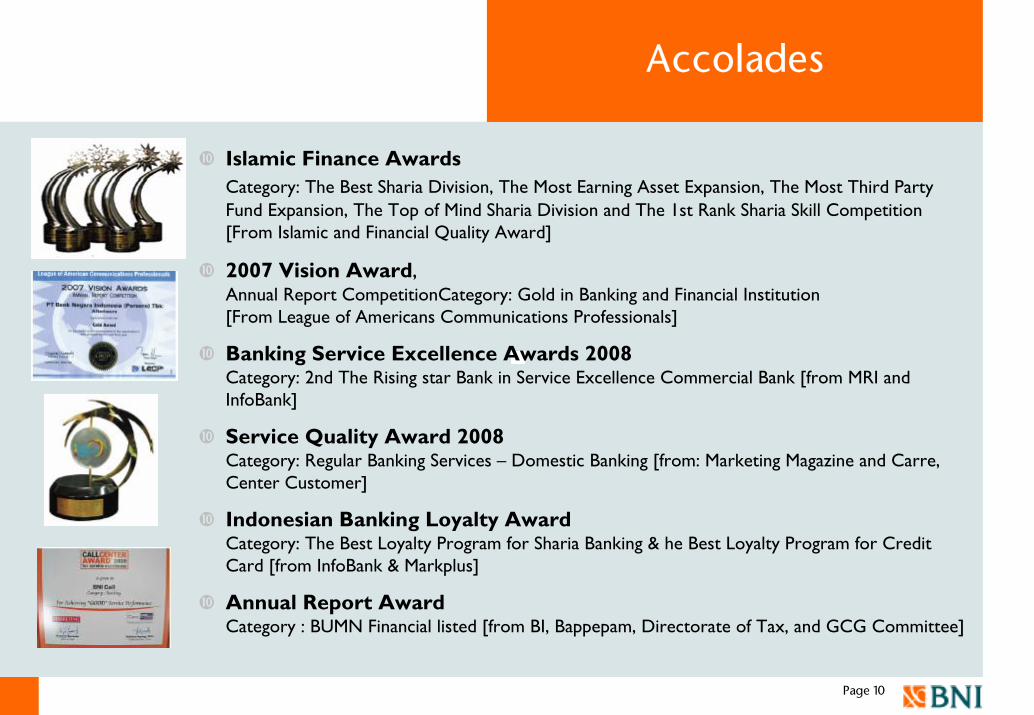
Accolades
Islamic Finance AwardsCategory: The Best Sharia Division, The Most Earning Asset Expansion, The Most Third Party Fund Expansion, The Top of Mind Sharia Division and The 1st Rank Sharia Skill Competition [From Islamic and Financial Quality Award]
2007 Vision Award,Annual Report CompetitionCategory: Gold in Banking and Financial Institution[From League of Americans Communications Professionals]
Banking Service Excellence Awards 2008Category: 2nd The Rising star Bank in Service Excellence Commercial Bank [from MRI and InfoBank]
Service Quality Award 2008Category: Regular Banking Services – Domestic Banking [from: Marketing Magazine and Carre, Center Customer]
Indonesian Banking Loyalty AwardCategory: The Best Loyalty Program for Sharia Banking & he Best Loyalty Program for Credit Card [from InfoBank & Markplus]
Annual Report AwardCategory : BUMN Financial listed [from BI, Bappepam, Directorate of Tax, and GCG Committee]
Page 11
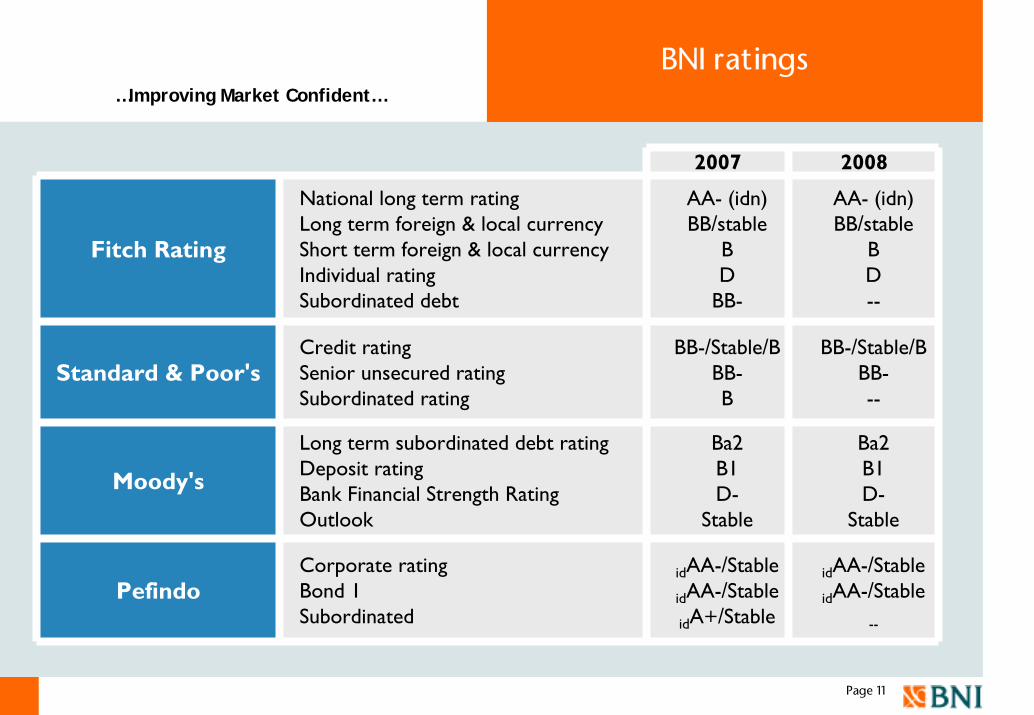
BNI ratings
2007 2008
Fitch Rating
National long term rating Long term foreign & local currencyShort term foreign & local currencyIndividual rating Subordinated debt
AA- (idn)BB/stable
BD
BB-
AA- (idn)BB/stable
BD--
Standard & Poor's Credit rating Senior unsecured rating Subordinated rating
BB-/Stable/BBB-B
BB-/Stable/BBB---
Moody's
Long term subordinated debt rating Deposit rating Bank Financial Strength Rating Outlook
Ba2B1D-
Stable
Ba2B1D-
Stable
PefindoCorporate rating Bond 1 Subordinated
idAA-/Stable
idAA-/Stable
idA+/Stable
idAA-/Stable
idAA-/Stable
--
…Improving Market Confident…
Section
Page 12
Management Focus & Progress to date
Page 13
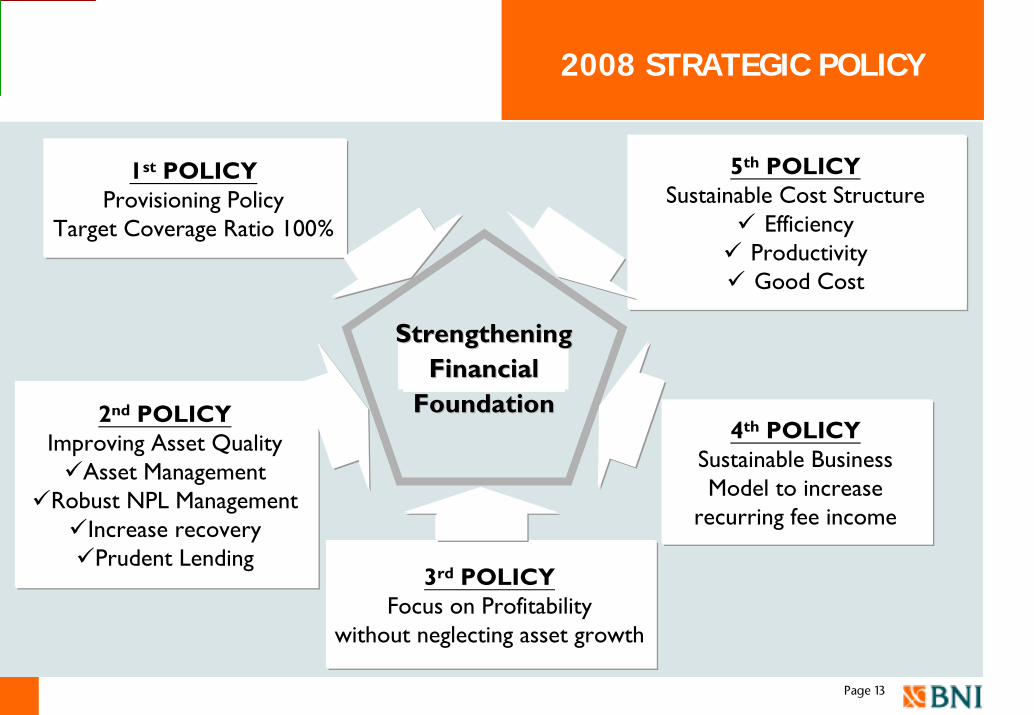
2008 STRATEGIC POLICY
5th POLICYSustainable Cost Structure
Efficiency Productivity Good Cost
4th POLICYSustainable Business Model to increase
recurring fee income
2nd POLICYImproving Asset Quality
Asset ManagementRobust NPL Management
Increase recoveryPrudent Lending
3rd POLICYFocus on Profitability
without neglecting asset growth
1st POLICYProvisioning Policy
Target Coverage Ratio 100%
Strengthening Strengthening Financial Financial
FoundationFoundation
Page 14
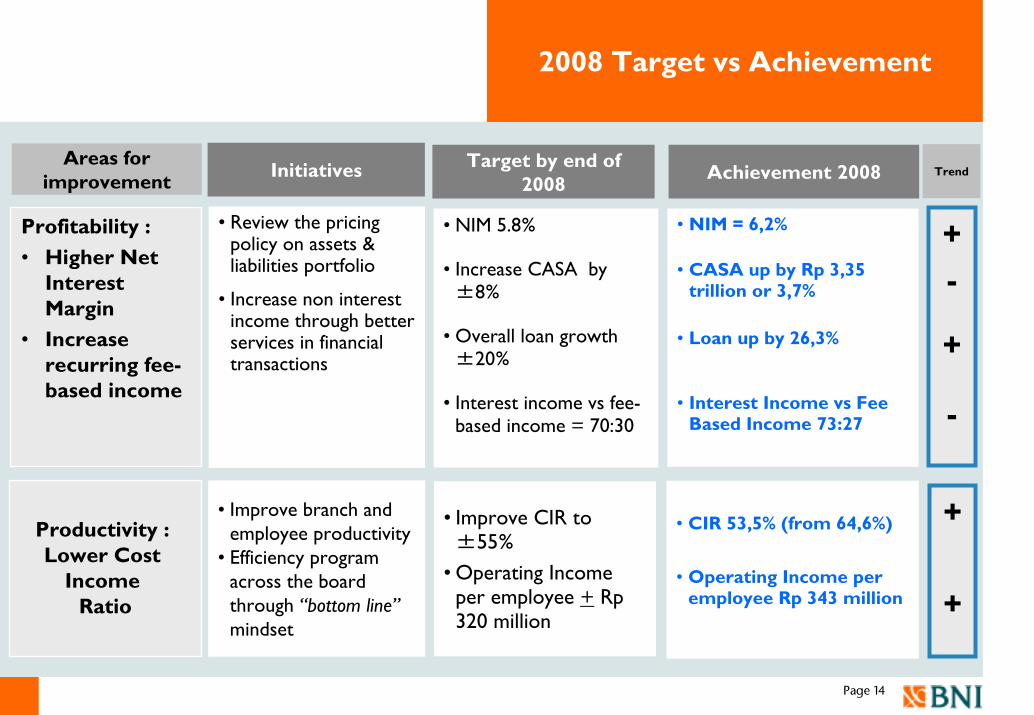
2008 Target vs Achievement
Areas for improvement Achievement 2008
Profitability : • Higher Net
Interest Margin
• Increase recurring fee-based income
• NIM = 6,2%
• CASA up by Rp 3,35 trillion or 3,7%
• Loan up by 26,3%
• Interest Income vs Fee Based Income 73:27
Productivity : Lower Cost
Income Ratio
• CIR 53,5% (from 64,6%)
• Operating Income per employee Rp 343 million
Target by end of 2008
• NIM 5.8%
• Increase CASA by ±8%
• Overall loan growth ±20%
• Interest income vs fee-based income = 70:30
• Improve CIR to ±55%
• Operating Income per employee + Rp320 million
Initiatives
• Review the pricing policy on assets & liabilities portfolio
• Increase non interest income through better services in financial transactions
• Improve branch and employee productivity
• Efficiency program across the board through “bottom line”mindset
Trend
+-
+
-
+
+
Page 15
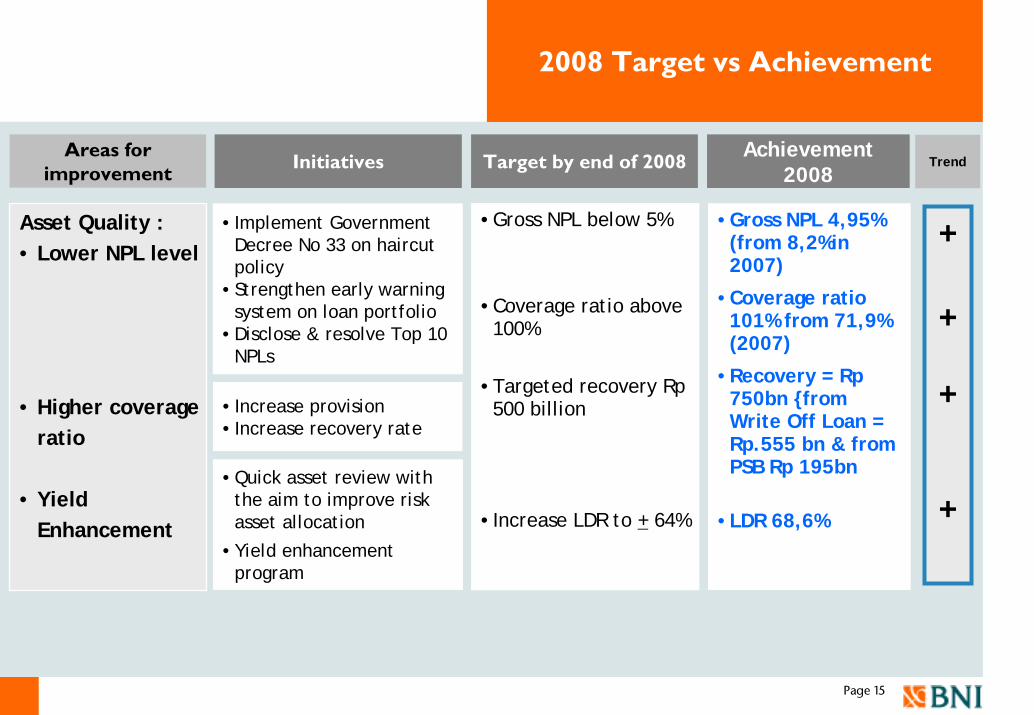
2008 Target vs Achievement
Areas for improvement
Achievement 2008
Target by end of 2008
Asset Quality :• Lower NPL level
• Higher coverageratio
• Yield Enhancement
•Gross NPL below 5%
•Coverage ratio above 100%
•Targeted recovery Rp500 billion
•Increase LDR to + 64%
•Gross NPL 4,95% (from 8,2%in 2007)
•Coverage ratio 101% from 71,9% (2007)
•Recovery = Rp750bn {from Write Off Loan = Rp.555 bn & from PSB Rp 195bn
•LDR 68,6%
Initiatives
•Implement Government Decree No 33 on haircut policy
•Strengthen early warning system on loan portfolio
•Disclose & resolve Top 10 NPLs
• Increase provision• Increase recovery rate
•Quick asset review with the aim to improve risk asset allocation
•Yield enhancement program
Trend
+
+
+
+
Page 1631-Mar-09
Financial PerformanceFY 2008FY 2008
I. Balance SheetII. Profit & LossIII. Financial Ratio
Page 17
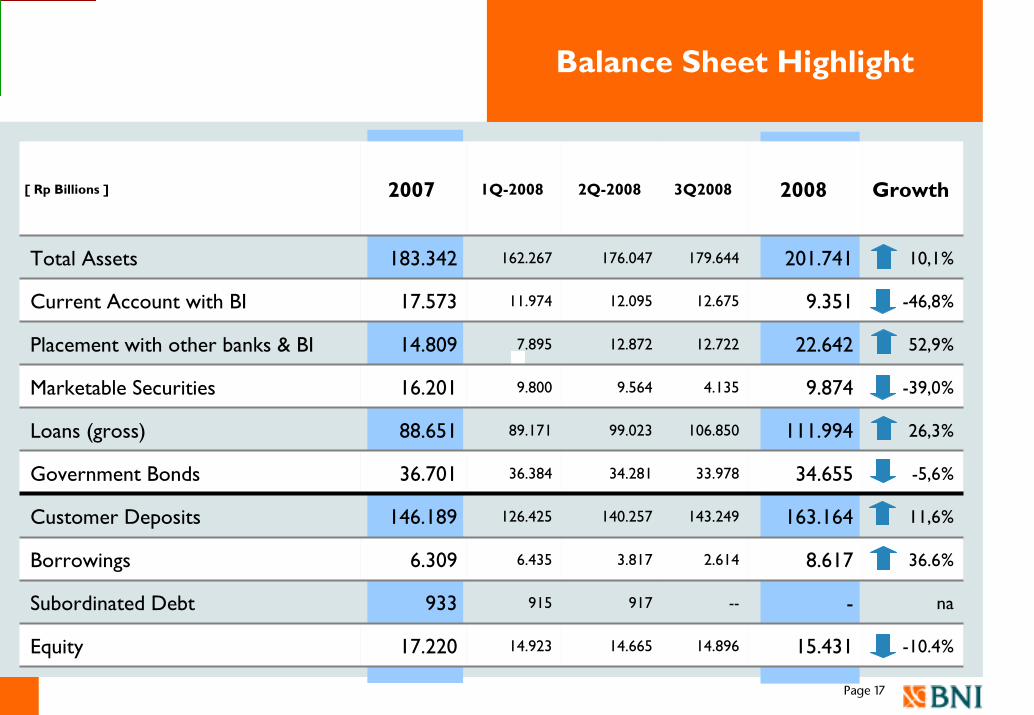
Balance Sheet Highlight
[ Rp Billions ] 2007 1Q-2008 2Q-2008 3Q2008 2008 Growth
Total Assets 183.342 162.267 176.047 179.644 201.741 10,1%
Current Account with BI 17.573 11.974 12.095 12.675 9.351 -46,8%
Placement with other banks & BI 14.809 7.895 12.872 12.722 22.642 52,9%
Marketable Securities 16.201 9.800 9.564 4.135 9.874 -39,0%
Loans (gross) 88.651 89.171 99.023 106.850 111.994 26,3%
Government Bonds 36.701 36.384 34.281 33.978 34.655 -5,6%
Customer Deposits 146.189 126.425 140.257 143.249 163.164 11,6%
Borrowings 6.309 6.435 3.817 2.614 8.617 36.6%
Subordinated Debt 933 915 917 -- - na
Equity 17.220 14.923 14.665 14.896 15.431 -10.4%
Page 18
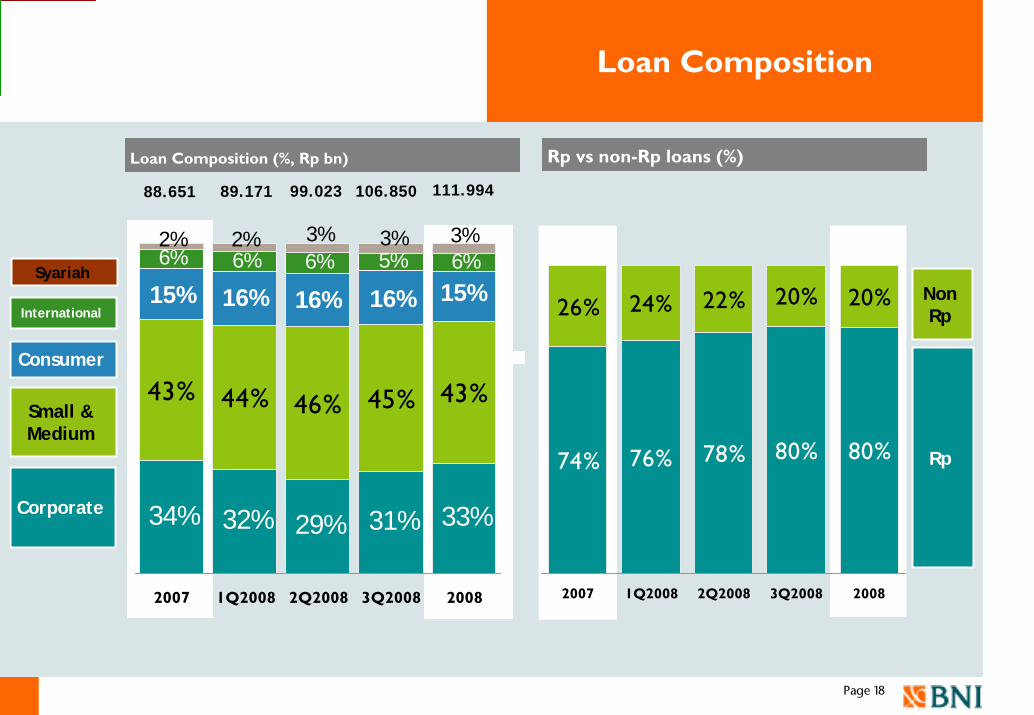
Loan Composition
Rp vs non-Rp loans (%)
74% 76% 78% 80% 80%
26% 24% 22% 20% 20%
2007 1Q2008 2Q2008 3Q2008 2008
Loan Composition (%, Rp bn)
34% 32% 29% 31% 33%
43% 44% 46% 45% 43%
6% 6% 6% 5% 6%
16%16%15% 16% 15%
3%2% 3%2% 3%
2007 1Q2008 2Q2008 3Q2008 2008
99.023 111.994
Corporate
Small & Medium
Consumer
International
Rp
NonRp
Syariah
88.651 89.171 106.850
Page 19
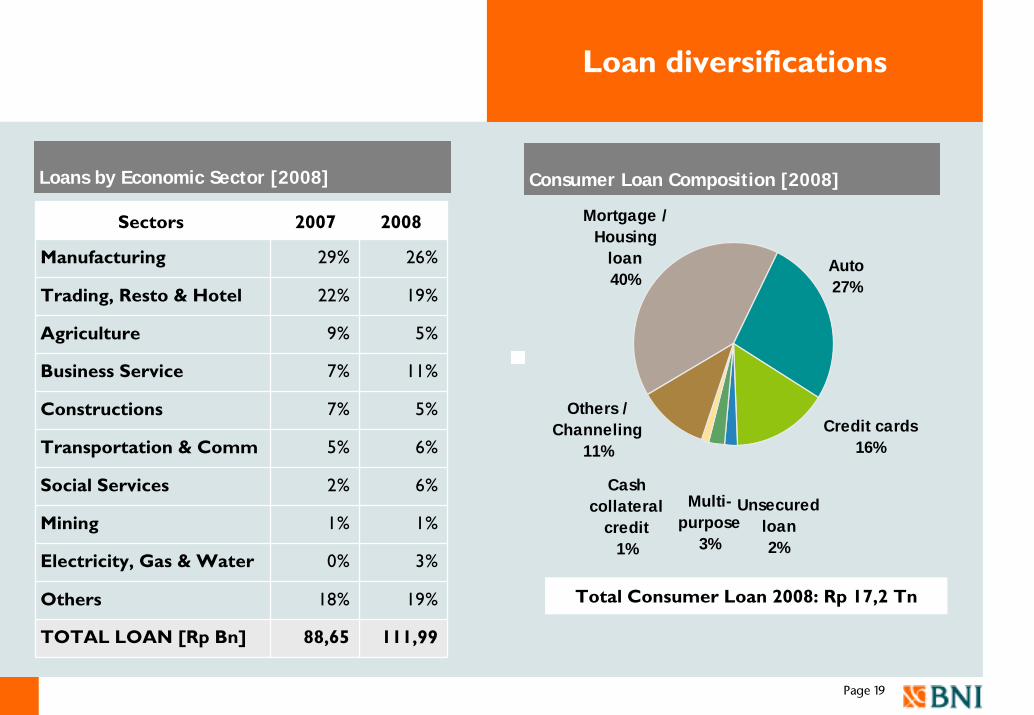
Auto27%
Mortgage / Housing
loan40%
Multi-purpose
3%
Unsecured loan2%
Credit cards16%
Others / Channeling
11%
Cash collateral
credit1%
Loan diversifications
Sectors 2007 2008
Manufacturing 29% 26%
Trading, Resto & Hotel 22% 19%
Agriculture 9% 5%
Business Service 7% 11%
Constructions 7% 5%
Transportation & Comm 5% 6%
Social Services 2% 6%
Mining 1% 1%
Electricity, Gas & Water 0% 3%
Others 18% 19%
TOTAL LOAN [Rp Bn] 88,65 111,99
Loans by Economic Sector [2008] Consumer Loan Composition [2008]
Total Consumer Loan 2008: Rp 17,2 Tn
Page 20
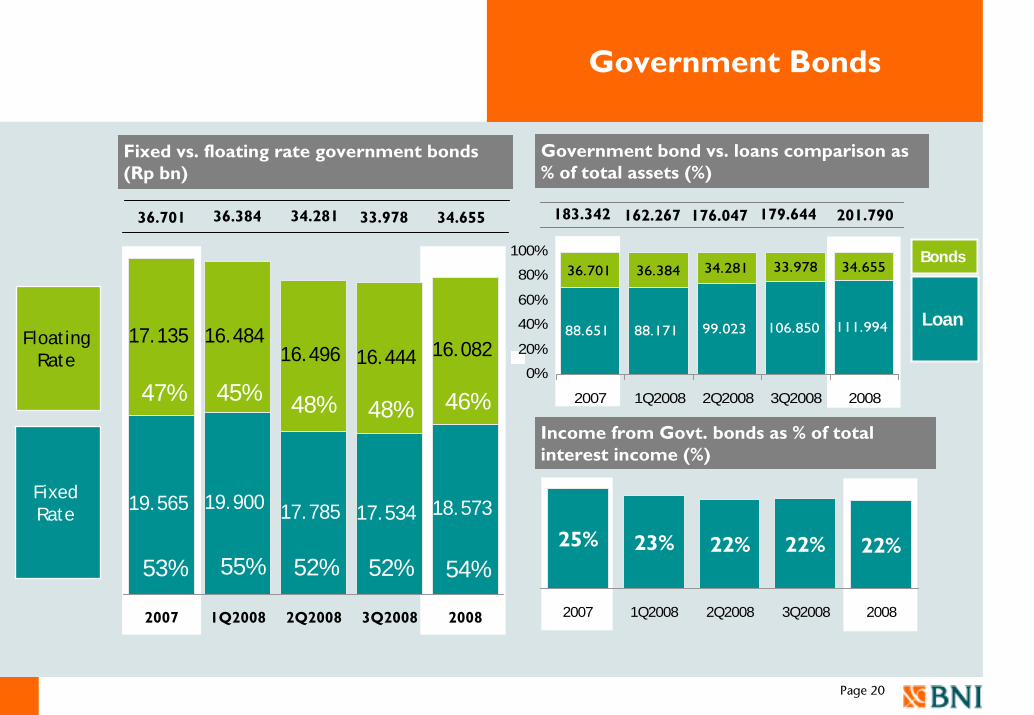
162.267183.342
Government Bonds
Government bond vs. loans comparison as % of total assets (%)
Income from Govt. bonds as % of total interest income (%)
25% 22% 22% 22%23%
2007 1Q2008 2Q2008 3Q2008 2008
88.651 88.171 99.023 106.850 111.994
36.701 36.384 34.281 33.978 34.655
0%
20%
40%
60%
80%
100%
2007 1Q2008 2Q2008 3Q2008 2008
Fixed vs. floating rate government bonds (Rp bn)
19.565 19.900 17.785 17.534 18.573
17.135 16.48416.496 16.444 16.082
2007 1Q2008 2Q2008 3Q2008 2008
34.281 176.04736.38436.701 34.655
47% 45% 48%
53% 55% 52%
Fixed Rate
Floating Rate
Loan
Bonds
48%
52%
201.790
46%
33.978
54%
179.644
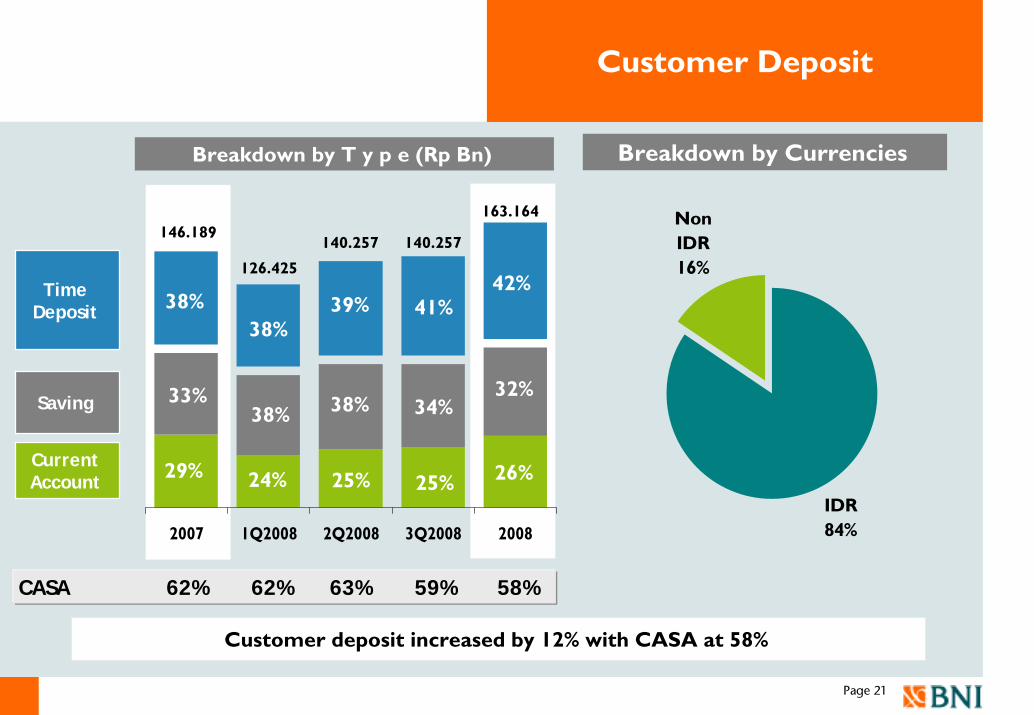
Page 21
2007 1Q2008 2Q2008 3Q2008 2008
Customer Deposit
IDR84%
Non IDR16%
140.257
Breakdown by T y p e (Rp Bn) Breakdown by Currencies
Customer deposit increased by 12% with CASA at 58%
Current Account
Saving
Time Deposit
146.189163.164
126.425
39%38%
38%42%
33%38% 38%
32%
29% 24% 25% 26%
140.257
41%
34%
25%
CASA 62% 62% 63% 59% 58%
Page 22
Profit & Loss
[ Rp Billions ] 2007 1Q-2008 2Q-2008 3Q-2008 2008Growth
[yoy]
Net Interest Income 7.467 2.233 4.629 7.163 9.912 32.7%
Fee Income
- Reccuring Fee-- Non Recurring Fee
4.130
2.9071.223
839
842(3)
1.699
1.720(21)
2.538
2.580(42)
3.549
3.692(143)
-14,1%
27,0%
Operating Income 11.597 3.072 6.328 9.700 13.461 16,1%
Operating Expense (7.626) (1.650) (3.559) (5.266) (7.228) -5,2%
Net Non OperatingIncome/(Expense) 213 (13) 27 26 58 -72.9%
Pre-Provision Operating Income 4.185 1.409 2.796 4.460 6.291 50.3%
Provisioning (2.704) (1.199) (2.154) (3.258) (4.359) 61,2%
Net Income before Tax 1.481 210 642 1.202 1.932 30,5%
Net Income 898 153 439 832 1.222 36,1%
Net Income per share [full amount] 64 10 28 54 80 25,0%
Page 23
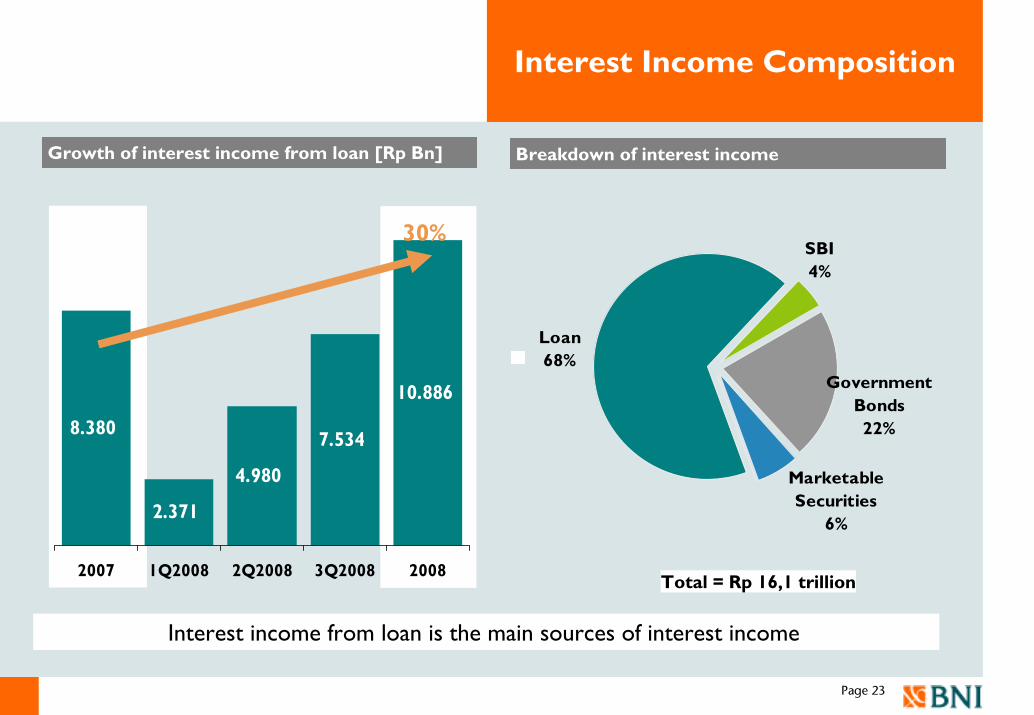
Interest Income Composition
Breakdown of interest income
SBI4%
Government Bonds22%
Loan68%
Marketable Securities
6%
Total = Rp 16,1 trillion
8.380
2.371
4.980
7.534
10.886
2007 1Q2008 2Q2008 3Q2008 2008
Growth of interest income from loan [Rp Bn]
Interest income from loan is the main sources of interest income
30%
Page 24
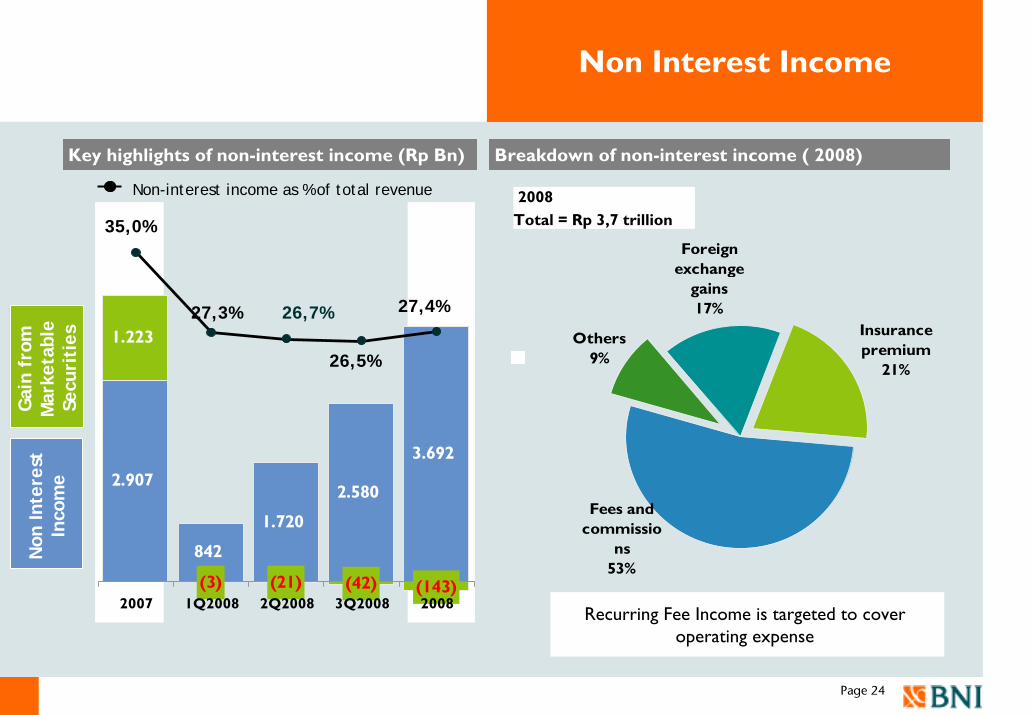
Non Interest Income
2.907
1.720
2.580
3.692
842
1.223
(3) (42) (143)(21)
35,0%
27,3% 26,7%
26,5%
27,4%
2007 1Q2008 2Q2008 3Q2008 2008
Key highlights of non-interest income (Rp Bn)
Non-interest income as % of total revenue
Breakdown of non-interest income ( 2008)
Others9%
Foreign exchange
gains 17%
Fees and commissio
ns53%
Insurance premium
21%
2008 Total = Rp 3,7 trillion
Non
Inte
rest
In
com
e
Gai
n fr
om
Mar
keta
ble
Secu
riti
es
Recurring Fee Income is targeted to cover operating expense
Page 25
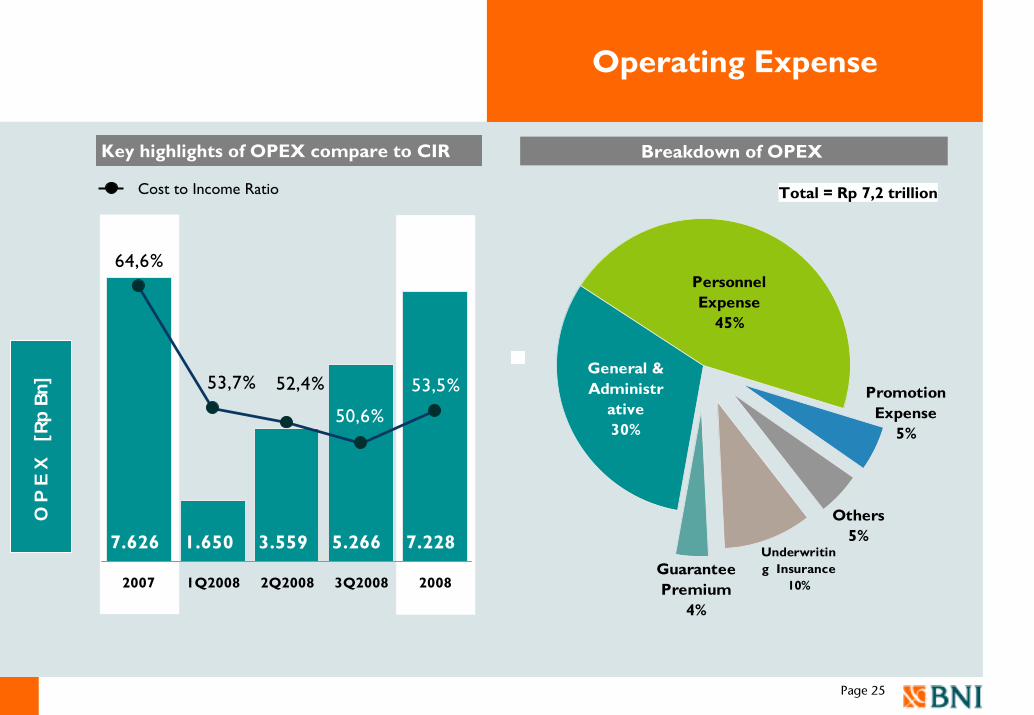
Operating Expense
7.626 3.559 5.266 7.2281.650
64,6%
53,5%53,7%
50,6%
52,4%
2007 1Q2008 2Q2008 3Q2008 2008
Key highlights of OPEX compare to CIR
Cost to Income Ratio
Breakdown of OPEX
Guarantee Premium
4%
Personnel Expense
45%
Promotion Expense
5%
General & Administr
ative30%
Others5%
Underwriting Insurance
10%
Total = Rp 7,2 trillion
O P
E X
[R
pBn
]
Page 26
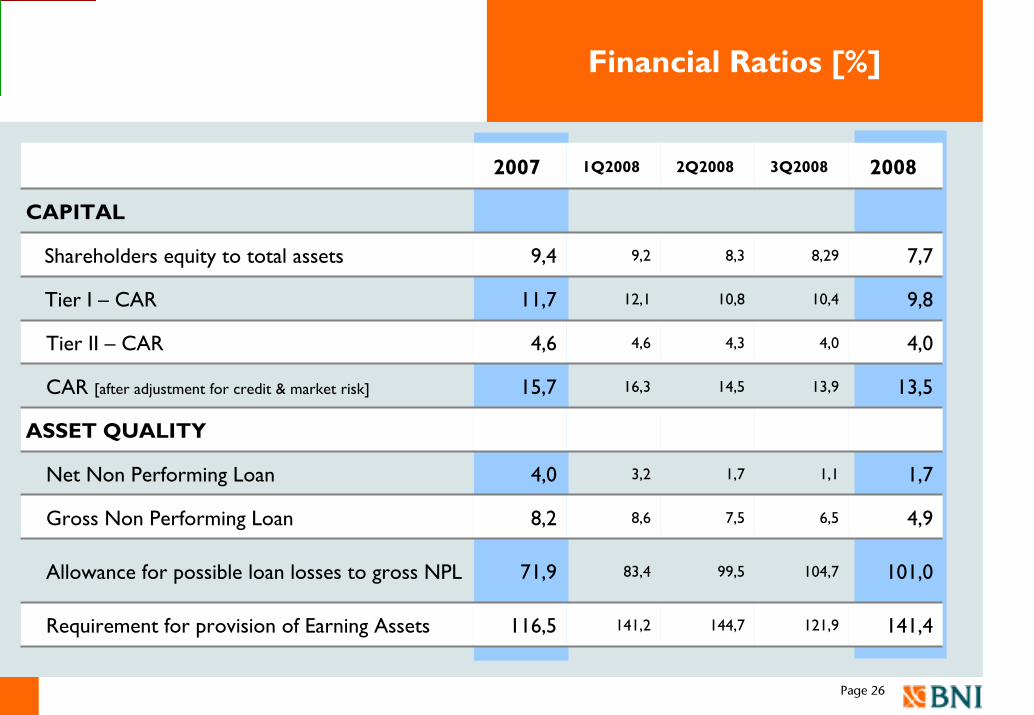
Financial Ratios [%]
2007 1Q2008 2Q2008 3Q2008 2008
CAPITAL
Shareholders equity to total assets 9,4 9,2 8,3 8,29 7,7
Tier I – CAR 11,7 12,1 10,8 10,4 9,8
Tier II – CAR 4,6 4,6 4,3 4,0 4,0
CAR [after adjustment for credit & market risk] 15,7 16,3 14,5 13,9 13,5
ASSET QUALITY
Net Non Performing Loan 4,0 3,2 1,7 1,1 1,7
Gross Non Performing Loan 8,2 8,6 7,5 6,5 4,9
Allowance for possible loan losses to gross NPL 71,9 83,4 99,5 104,7 101,0
Requirement for provision of Earning Assets 116,5 141,2 144,7 121,9 141,4
Page 27
Financial Ratios [%]
2007 1Q-2008 2Q-2008 3Q-2008 2008
RENTABILITY
ROA 0,5 0,4 0,5 0,9 1,1
ROE 5,6 3,3 6,2 8,1 9,0
Net Interest Margin 5,0 6,0 6,1 6,2 6,3
EFFICIENCY
BOPO 93,0 95,1 93,2 91,5 90,2
Cost to Income Ratio 64,6 53,8 52,4 50,6 53,5
LIQUIDITY
Loan to Deposit Ratio 60,2 70,5 69,6 73,2 68,6
COMPLIANCE
Statuary Reserve Requirement (Rupiah) 14,7 12,1 10,0 10,0 6,7
Net Open Position 5,9 6,0 6,6 4,3 7,6

Section
Page 28
Loan Quality
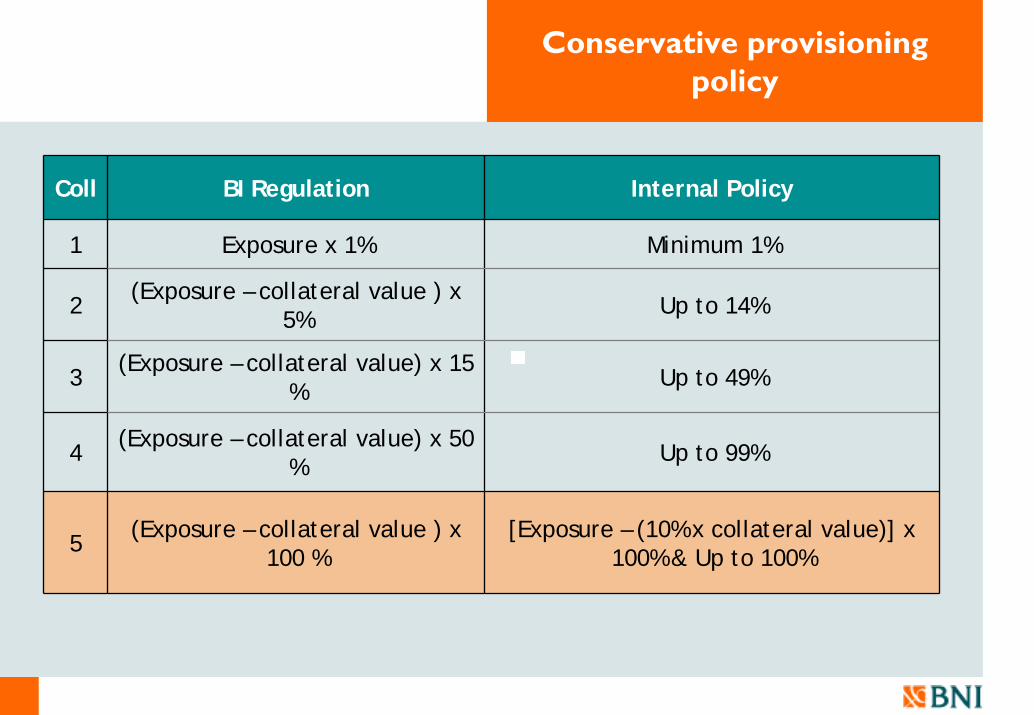
Conservative provisioning policy
Coll BI Regulation Internal Policy
1 Exposure x 1% Minimum 1%
2(Exposure – collateral value ) x
5% Up to 14%
3(Exposure – collateral value) x 15
% Up to 49%
4(Exposure – collateral value) x 50
% Up to 99%
5 (Exposure – collateral value ) x 100 %
[Exposure – (10% x collateral value)] x 100% & Up to 100%
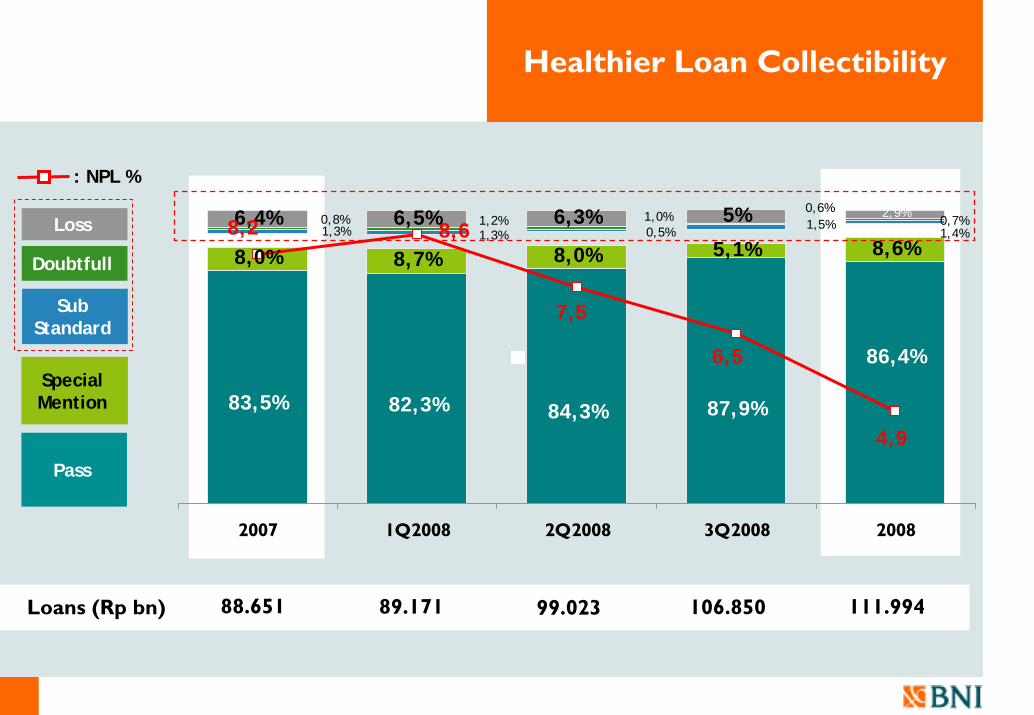
998 99.023 111.994
8,0% 8,7% 8,0% 5,1% 8,6%
82,3% 87,9%
86,4%
83,5% 84,3%
1,3% 0,5%1,5%
1,4%1,3%
0,6%0,7%1,0%1,2%0,8%6,4% 6,5% 5%6,3% 2,9%
4,9
8,6
6,5
7,5
8,2
2007 1Q2008 2Q2008 3Q2008 2008
Healthier Loan Collectibility
Loans (Rp bn) 88.651
Pass
Special Mention
Sub Standard
Doubtfull
Loss
: NPL %
89.171 106.850
Page 31
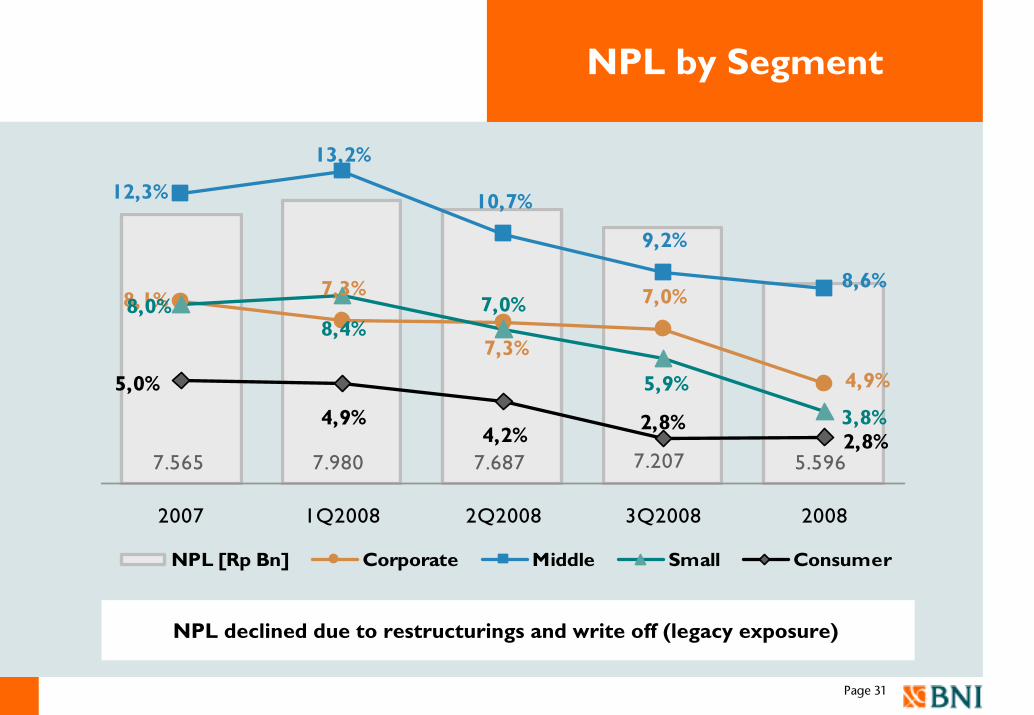
NPL by Segment
7.565 7.980 7.687 5.5967.207
7,3% 7,0%
13,2%
10,7%
9,2%
8,4%
4,9%4,2%
8,1%
7,3%
4,9%
12,3%
8,6%
5,9%
8,0% 7,0%
3,8%
5,0%
2,8%2,8%
2007 1Q2008 2Q2008 3Q2008 2008
NPL [Rp Bn] Corporate Middle Small Consumer
NPL declined due to restructurings and write off (legacy exposure)
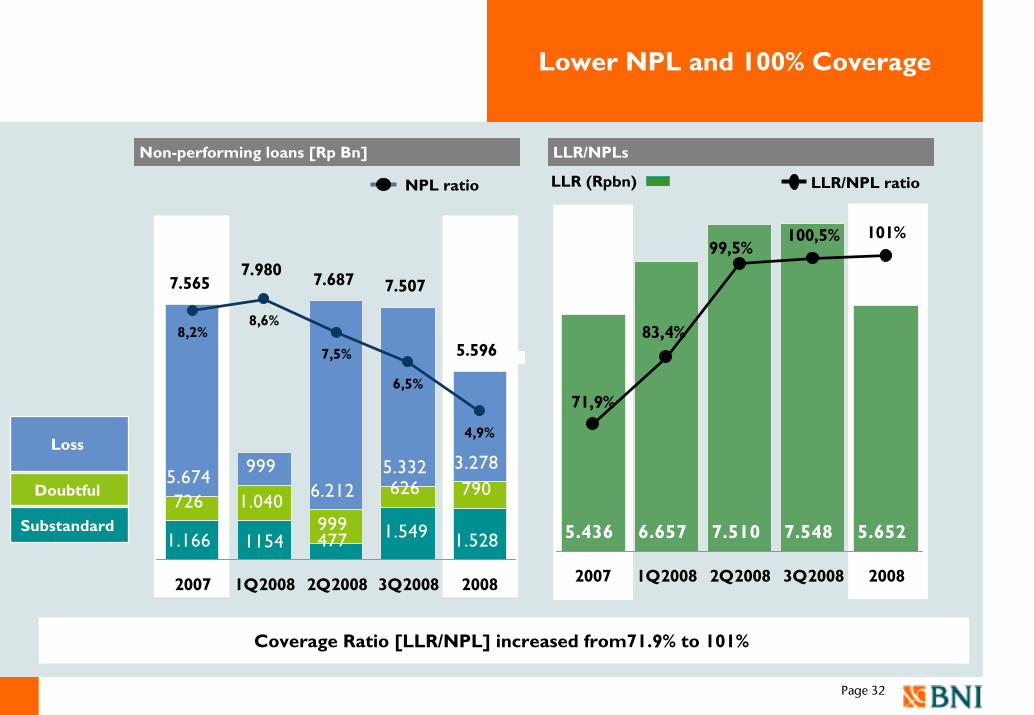
Page 32
LLR/NPLs
Lower NPL and 100% Coverage
1.166 1154 477 1.528
726 1.040999
626 7905.674 999
6.2125.332 3.278
1.549
8,2%8,6%
7,5%
6,5%
4,9%
7.5657.980 7.687 7.507
5.596
2007 1Q2008 2Q2008 3Q2008 2008
Non-performing loans [Rp Bn]
7.548 5.6527.5106.6575.436
100,5% 101%
83,4%
71,9%
99,5%
2007 1Q2008 2Q2008 3Q2008 2008
LLR (Rpbn) LLR/NPL ratio
Coverage Ratio [LLR/NPL] increased from71.9% to 101%
Loss
Substandard
Doubtful
NPL ratio
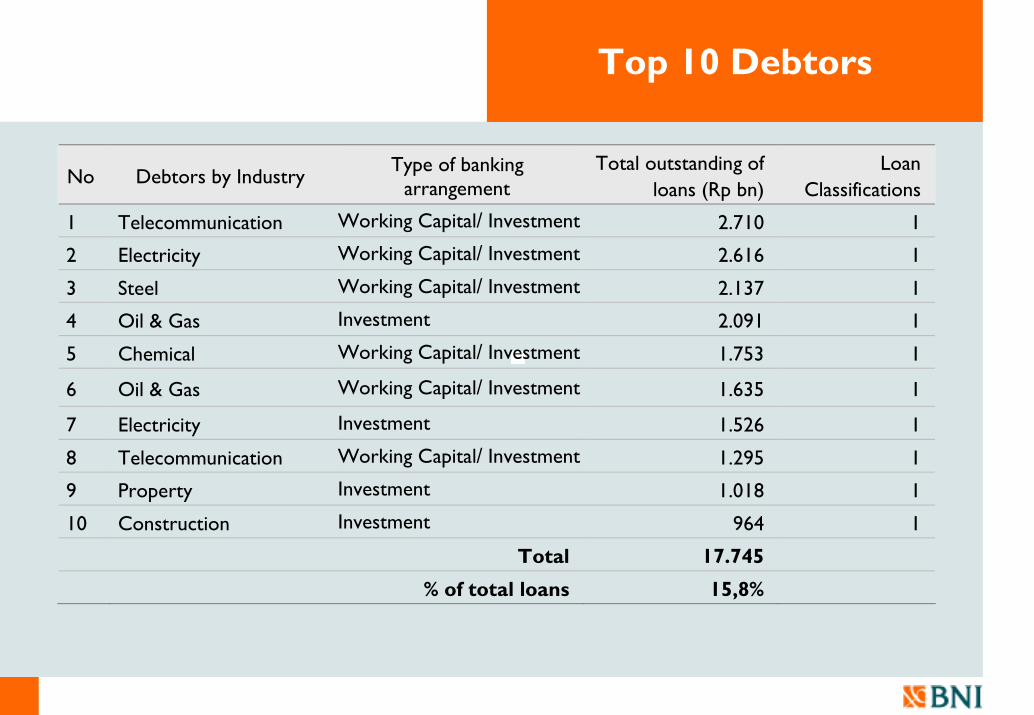
Top 10 Debtors
No Debtors by Industry Type of banking
arrangement Total outstanding of
loans (Rp bn) Loan
Classifications
1 Telecommunication Working Capital/ Investment 2.710 1
2 Electricity Working Capital/ Investment 2.616 1
3 Steel Working Capital/ Investment 2.137 1
4 Oil & Gas Investment 2.091 1
5 Chemical Working Capital/ Investment 1.753 1
6 Oil & Gas Working Capital/ Investment 1.635 1
7 Electricity Investment 1.526 1
8 Telecommunication Working Capital/ Investment 1.295 1
9 Property Investment 1.018 1
10 Construction Investment 964 1
Total 17.745
% of total loans 15,8%
Page 34
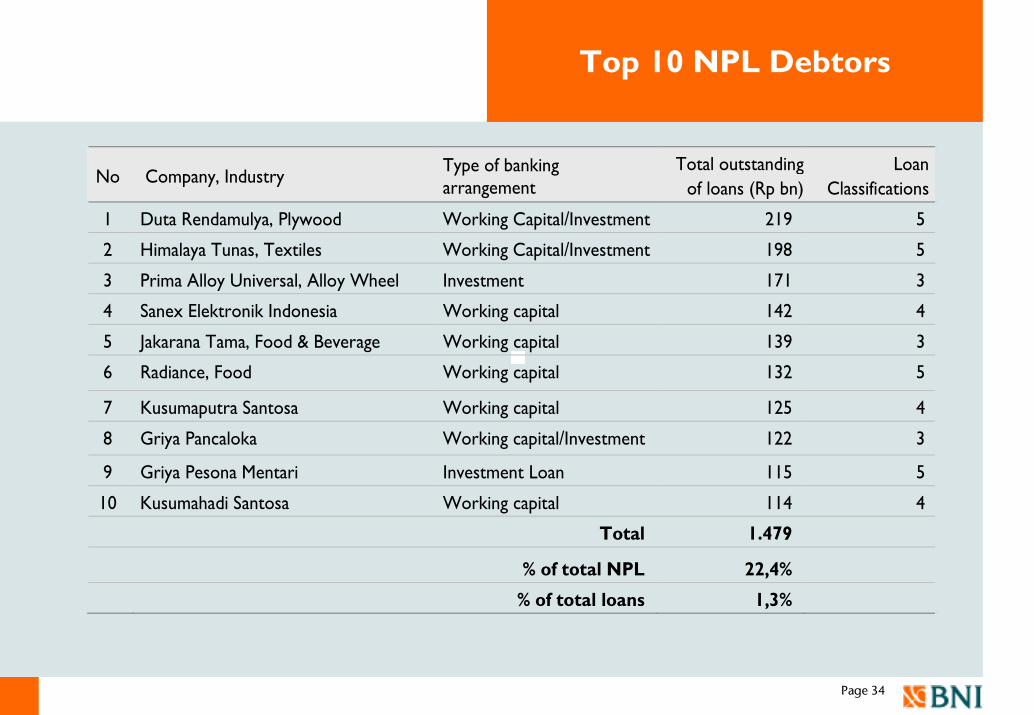
Top 10 NPL Debtors
No Company, Industry Type of banking arrangement
Total outstanding of loans (Rp bn)
Loan Classifications
1 Duta Rendamulya, Plywood Working Capital/Investment 219 5
2 Himalaya Tunas, Textiles Working Capital/Investment 198 5
3 Prima Alloy Universal, Alloy Wheel Investment 171 3
4 Sanex Elektronik Indonesia Working capital 142 4
5 Jakarana Tama, Food & Beverage Working capital 139 3
6 Radiance, Food Working capital 132 5
7 Kusumaputra Santosa Working capital 125 4
8 Griya Pancaloka Working capital/Investment 122 3
9 Griya Pesona Mentari Investment Loan 115 5
10 Kusumahadi Santosa Working capital 114 4
Total 1.479
% of total NPL 22,4%
% of total loans 1,3%
Page 35
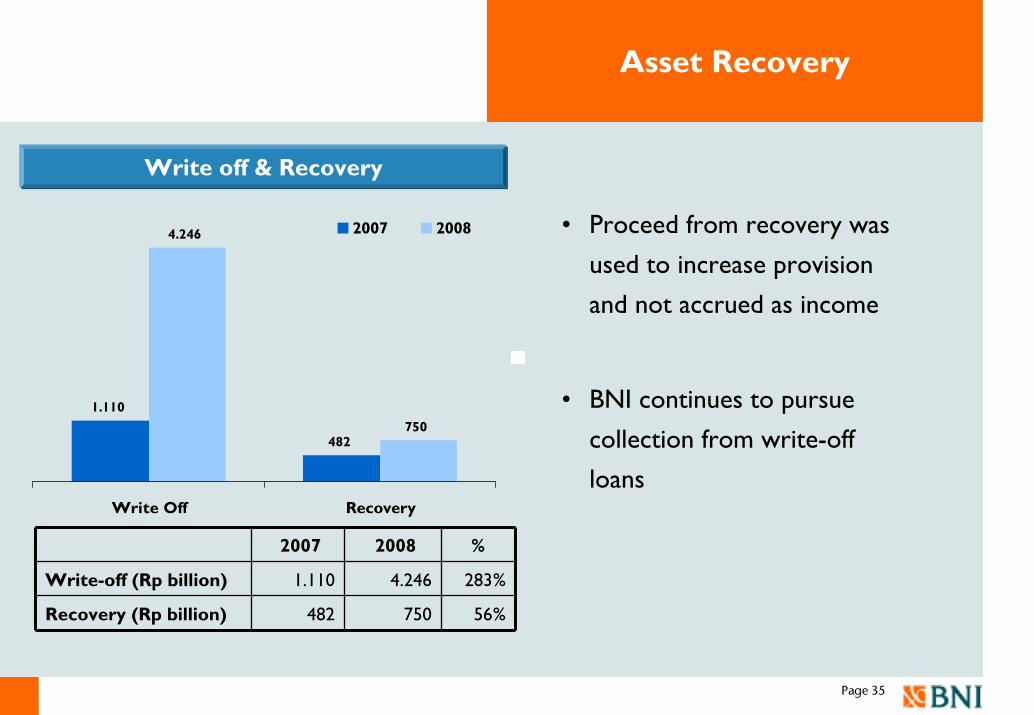
Asset Recovery
• Proceed from recovery was
used to increase provision
and not accrued as income
• BNI continues to pursue
collection from write-off
loans
Write off & Recovery
2007 2008 %
Write-off (Rp billion) 1.110 4.246 283%
Recovery (Rp billion) 482 750 56%
1.110
482
4.246
750
Write Off Recovery
2007 2008
Section
Page 36
Business Unit Highlight
Page 37
Corporate( > $ 10mn)
SME & Sharia(M: $ 1mn - $ 10mn)
(S: < $ 1mn)Consumer Treasury & Int’l
To be a premier corporate bank providing total financial solutions.
• Leading bank with extensive network & cap market competence
• Excellence Services
Focus on leading largest both in private publicly-listed companies & SOE with strategic value
• Focus to industry with sustainable growth
• Strong backward linkage
Targeting affluent, mass-market segment
Corporate clients & middle segment with treasury, trade finance and International activities
• Corporate Finance• Loan Syndication• Trade Finance• Cash Management
• Wide product-range & tailor-made product
• Integrated Islamic & conventional banking with global partner
• Trade finance & remittance• Inter-bank placement• Leading in money market &
capital market
• Value Chain including Synergizing with subsidiaries
• Value Added Services• Quick turnaround with
constant service level
• Value chain approach• Faster processing time• Adding more Account
Officers
• Overseas branches & 757 correspondent banks
• Centralized trade finance processing
• Treasury Remote Area
Target Segment
• Friendly local character with international exposure
• Competitive value
• Bank with large customer base and excellent in service
• Strong domestic & overseas network
• Transaction and investment for liabilities product
• High yield loan mortgage product
• New Branch Concept, supported with strong active sales team and user friendly electronic channel
• Hassle-free open account initiation program
• Cross Selling & Strategic Alliances
Business Model & Strategy
Brand Position
Key Product
Channel / Process
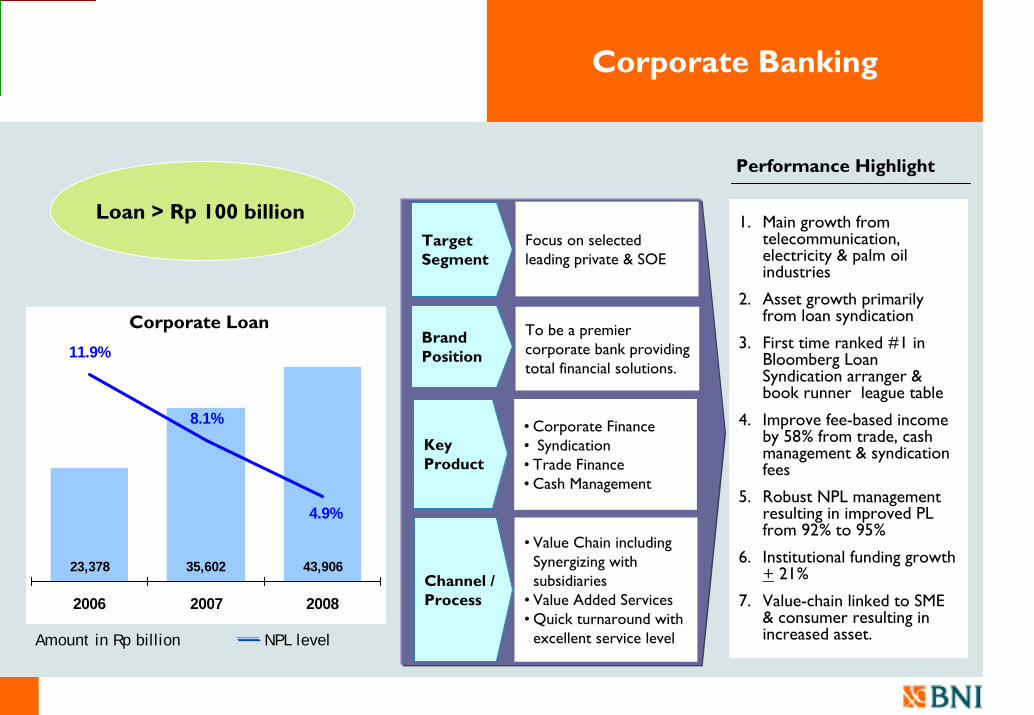
Corporate Banking
23,378 35,602 43,906
11.9%
8.1%
4.9%
2006 2007 2008
Target Segment
Brand Position
Channel / Process
To be a premier corporate bank providing total financial solutions.
Focus on selected leading private & SOE
• Value Chain including Synergizing with subsidiaries
• Value Added Services• Quick turnaround with
excellent service level
Performance Highlight
1. Main growth from telecommunication, electricity & palm oil industries
2. Asset growth primarily from loan syndication
3. First time ranked #1 in Bloomberg Loan Syndication arranger & book runner league table
4. Improve fee-based income by 58% from trade, cash management & syndication fees
5. Robust NPL management resulting in improved PL from 92% to 95%
6. Institutional funding growth + 21%
7. Value-chain linked to SME & consumer resulting in increased asset.
• Corporate Finance• Syndication• Trade Finance• Cash Management
Key Product
Loan > Rp 100 billion
Corporate Loan
Amount in Rp billion NPL level
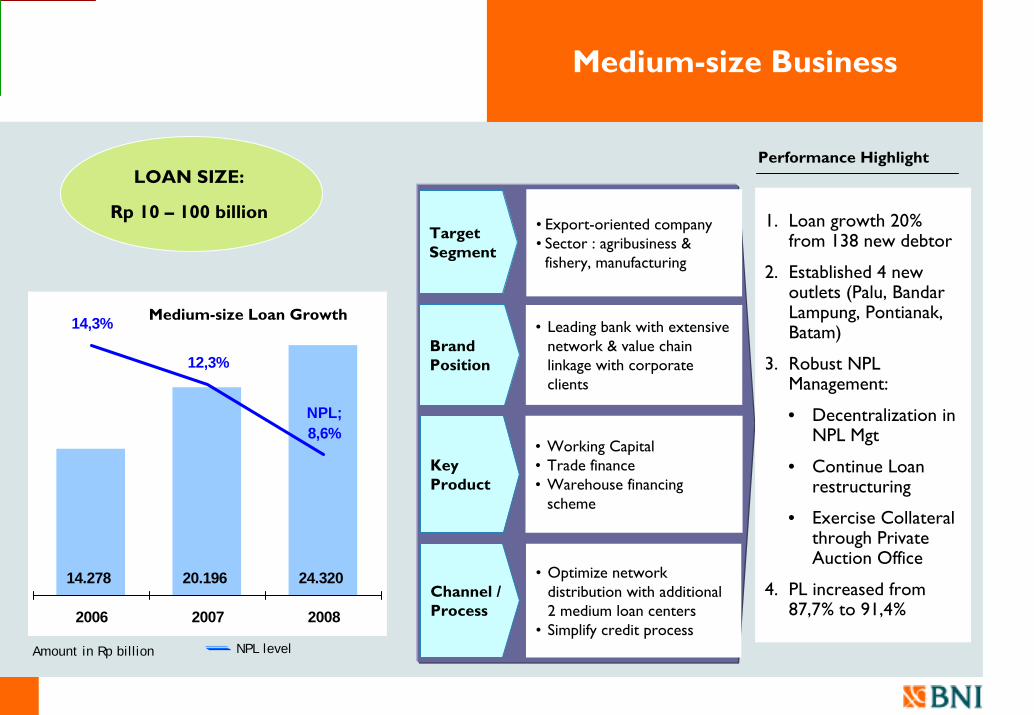
Medium-size Business
14.278 20.196 24.320
14,3%
12,3%
NPL; 8,6%
2006 2007 2008
1. Loan growth 20% from 138 new debtor
2. Established 4 new outlets (Palu, Bandar Lampung, Pontianak, Batam)
3. Robust NPL Management:
• Decentralization in NPL Mgt
• Continue Loan restructuring
• Exercise Collateral through Private Auction Office
4. PL increased from 87,7% to 91,4%
Target Segment
Brand Position
Channel / Process
• Leading bank with extensive network & value chain linkage with corporate clients
• Export-oriented company• Sector : agribusiness &
fishery, manufacturing
• Optimize network distribution with additional 2 medium loan centers
• Simplify credit process
Performance Highlight
Key Product
• Working Capital• Trade finance• Warehouse financing
scheme
LOAN SIZE:
Rp 10 – 100 billion
Medium-size Loan Growth
Amount in Rp billion NPL level
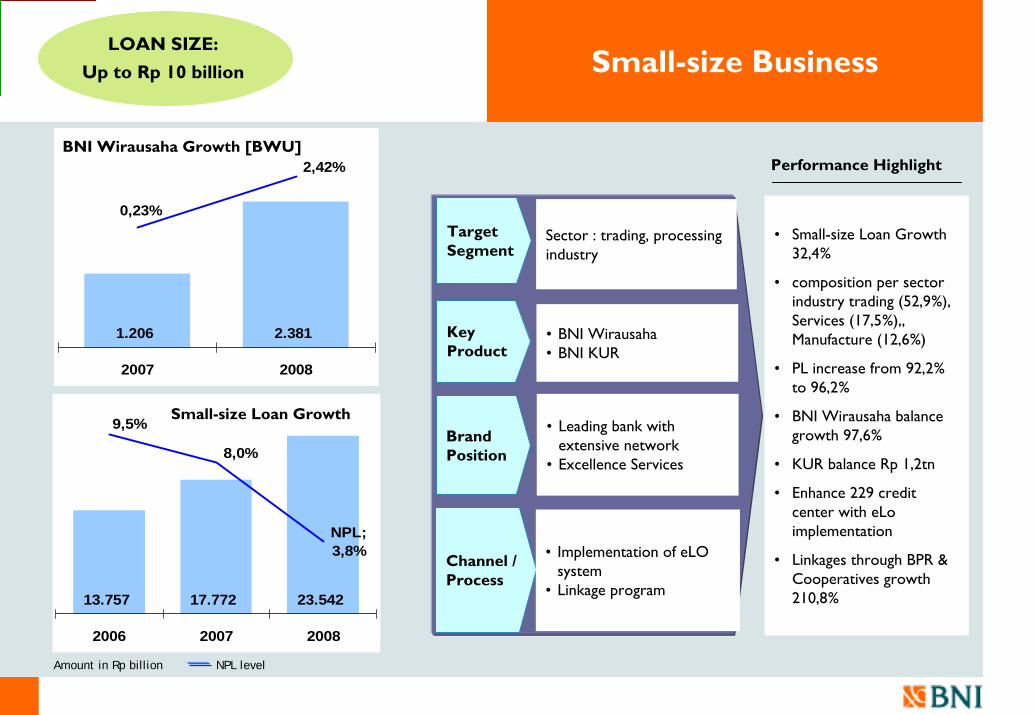
Small-size Business
13.757 17.772 23.542
9,5%
8,0%
NPL; 3,8%
2006 2007 2008
• Small-size Loan Growth 32,4%
• composition per sector industry trading (52,9%), Services (17,5%),, Manufacture (12,6%)
• PL increase from 92,2% to 96,2%
• BNI Wirausaha balance growth 97,6%
• KUR balance Rp 1,2tn
• Enhance 229 credit center with eLoimplementation
• Linkages through BPR & Cooperatives growth 210,8%
Target Segment
Brand Position
Channel / Process
• Leading bank with extensive network
• Excellence Services
Sector : trading, processing industry
• Implementation of eLOsystem
• Linkage program
Performance Highlight
• BNI Wirausaha• BNI KUR
Key Product
Small-size Loan Growth
LOAN SIZE:
Up to Rp 10 billion
1.206 2.381
0,23%
2,42%
2007 2008
BNI Wirausaha Growth [BWU]
Amount in Rp billion NPL level
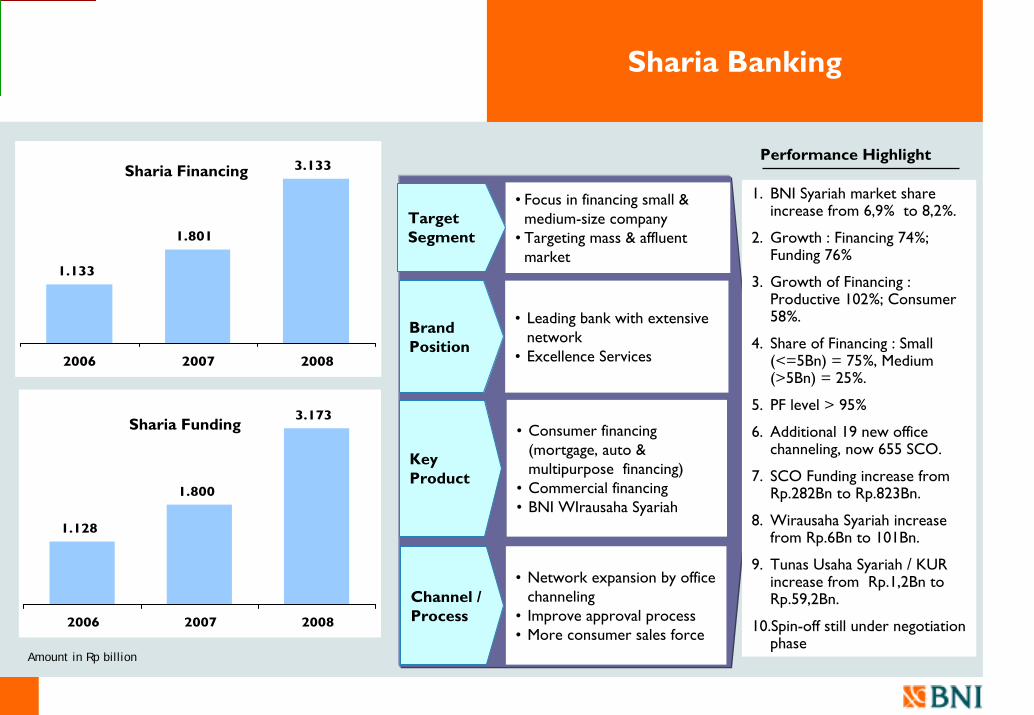
Sharia Banking
1.133
1.801
3.133
2006 2007 2008
Performance Highlight
• Focus in financing small & medium-size company
• Targeting mass & affluent market
• Network expansion by office channeling
• Improve approval process• More consumer sales force
• Leading bank with extensive network
• Excellence Services
Target Segment
Brand Position
Channel / Process
1. BNI Syariah market share increase from 6,9% to 8,2%.
2. Growth : Financing 74%; Funding 76%
3. Growth of Financing : Productive 102%; Consumer 58%.
4. Share of Financing : Small (<=5Bn) = 75%, Medium (>5Bn) = 25%.
5. PF level > 95%
6. Additional 19 new office channeling, now 655 SCO.
7. SCO Funding increase from Rp.282Bn to Rp.823Bn.
8. Wirausaha Syariah increase from Rp.6Bn to 101Bn.
9. Tunas Usaha Syariah / KUR increase from Rp.1,2Bn to Rp.59,2Bn.
10.Spin-off still under negotiation phase
1.128
1.800
3.173
2006 2007 2008
Key Product
• Consumer financing (mortgage, auto & multipurpose financing)
• Commercial financing • BNI WIrausaha Syariah
Sharia Financing
Sharia Funding
Amount in Rp billion
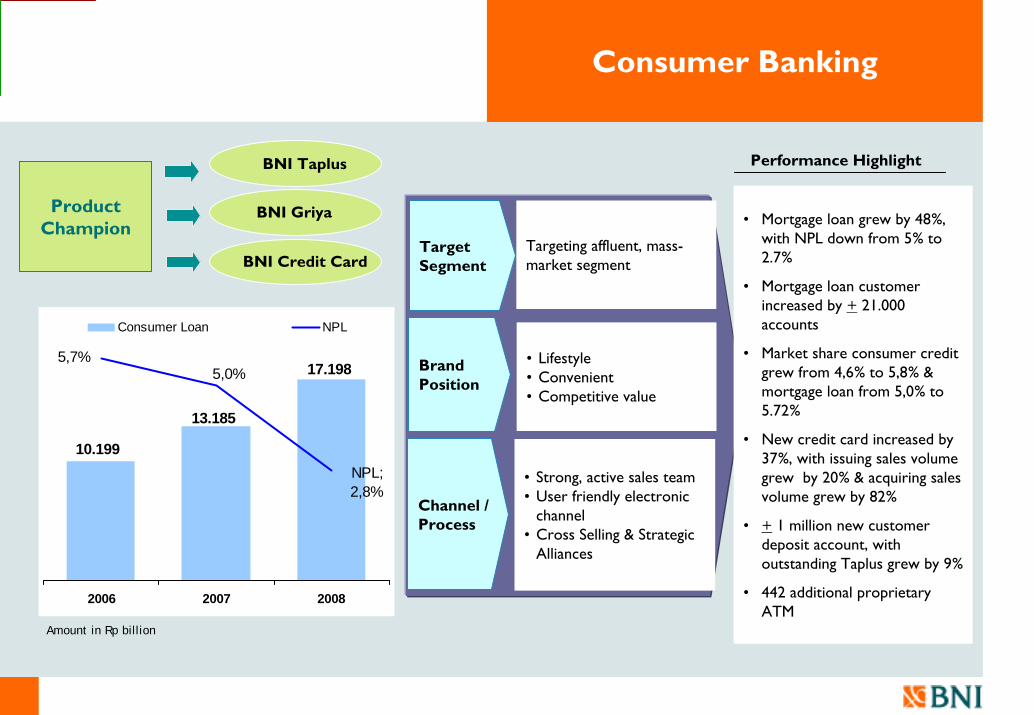
Consumer Banking
17.198
13.185
10.199
5,7%5,0%
NPL; 2,8%
2006 2007 2008
Consumer Loan NPL
BNI Credit Card
BNI Griya
BNI Taplus
Brand Position
Channel / Process
Target Segment
Targeting affluent, mass-market segment
• Lifestyle • Convenient • Competitive value
• Strong, active sales team • User friendly electronic
channel• Cross Selling & Strategic
Alliances
• Mortgage loan grew by 48%, with NPL down from 5% to 2.7%
• Mortgage loan customer increased by + 21.000 accounts
• Market share consumer credit grew from 4,6% to 5,8% & mortgage loan from 5,0% to 5.72%
• New credit card increased by 37%, with issuing sales volume grew by 20% & acquiring sales volume grew by 82%
• + 1 million new customer deposit account, with outstanding Taplus grew by 9%
• 442 additional proprietary ATM
Product Champion
Performance Highlight
Amount in Rp billion
Treasury & International Business
• BNI maintain Secondary Reserve at a
level above the required level by Risk
Management Policy
• As per 31 December 2008 our
Secondary Reserve was IDR 16,268
billion, and USD 714 million
• BNI has commitment from creditor
to continue to support BNI’s liquidity
• Bilateral loan totaling USD 400
million
2008 Performance highlight
Rupiah Secondary Reserve
1Q2008 2Q2008 3Q2008 4Q2008
% Avg. Sec. Reserve to Required SR
478 % 223 % 114 % 324 %
1Q2008 2Q2008 3Q2008 4Q2008
% Avg. Sec. Reserve to Required SR
137 % 141 % 121 % 144 %
USD Secondary Reserve
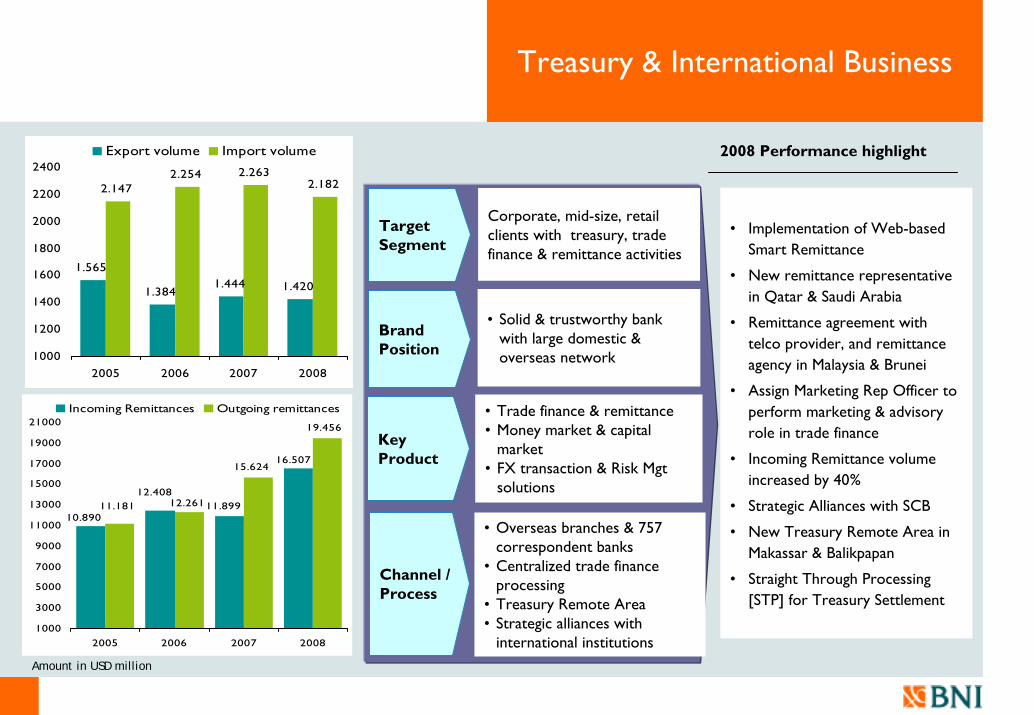
Treasury & International Business
1.565
1.384 1.420
2.1472.254 2.263
2.182
1.444
1000
1200
1400
1600
1800
2000
2200
2400
2005 2006 2007 2008
Export volume Import volume
• Implementation of Web-based Smart Remittance
• New remittance representative in Qatar & Saudi Arabia
• Remittance agreement with telco provider, and remittance agency in Malaysia & Brunei
• Assign Marketing Rep Officer to perform marketing & advisory role in trade finance
• Incoming Remittance volume increased by 40%
• Strategic Alliances with SCB
• New Treasury Remote Area in Makassar & Balikpapan
• Straight Through Processing [STP] for Treasury Settlement
16.507
12.408
10.89011.899
15.624
11.181 12.261
19.456
1000
3000
5000
7000
9000
11000
13000
15000
17000
19000
21000
2005 2006 2007 2008
Incoming Remittances Outgoing remittances
Target Segment
Brand Position
Channel / Process
Corporate, mid-size, retail clients with treasury, trade finance & remittance activities
• Overseas branches & 757 correspondent banks
• Centralized trade finance processing
• Treasury Remote Area• Strategic alliances with
international institutions
• Solid & trustworthy bank with large domestic & overseas network
• Trade finance & remittance• Money market & capital
market• FX transaction & Risk Mgt
solutions
Key Product
2008 Performance highlight
Amount in USD million
Section
Page 45
Going Forward
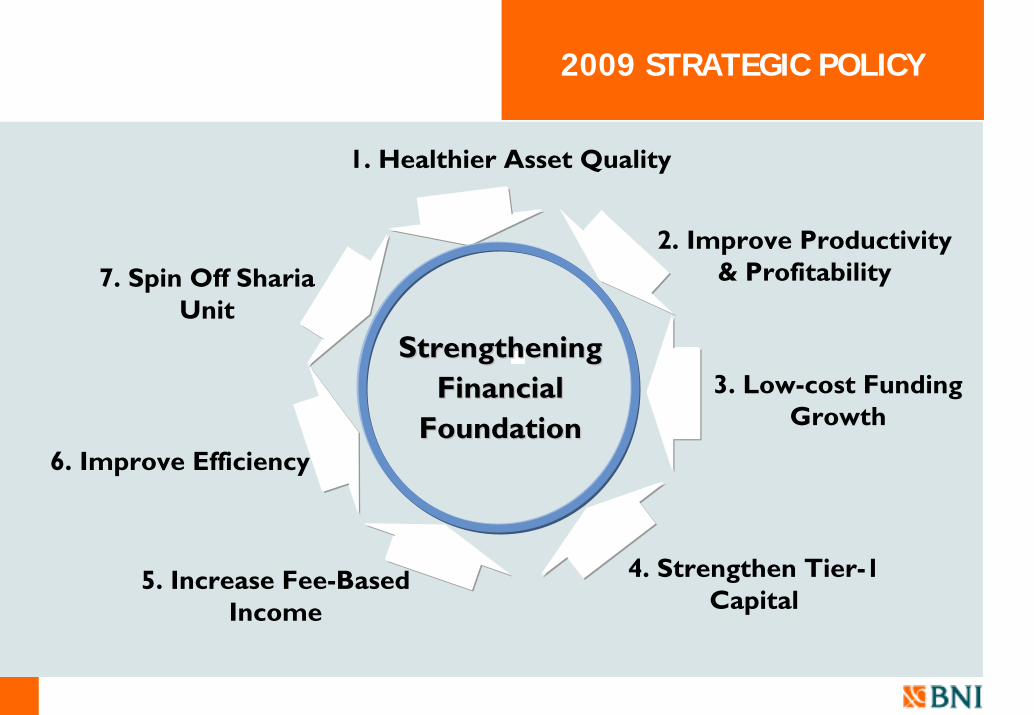
2009 STRATEGIC POLICY
Strengthening Strengthening Financial Financial
FoundationFoundation
2. Improve Productivity & Profitability7. Spin Off Sharia
Unit
3. Low-cost Funding Growth
5. Increase Fee-Based Income
6. Improve Efficiency
1. Healthier Asset Quality
4. Strengthen Tier-1 Capital
2009 Financial Target
Indicators Target by end of 2009
Profitability : • Maintain NIM
• Increase recurring FBI
• Maintain NIM 5.5% - 6,5%• Increase CASA by 12% - 14%• Overall loan growth 14% - 16% • Recurring Fee in increase 30%-40%
Productivity : Lower Cost Income Ratio
• Maintain CIR max 55%• Increase Operating Income per
employee to Rp 350mn – Rp 400mn
Initiatives
• Increase lower cost funding source (CASA)
• Very selective loan growth
• Increase non-interest income
• Efficiency program
• Improve branch & employee productivity
Healthier Asset Quality :- Higher coverage ratio
- Prevent NPL formation • Gross NPL below 6%
• Net NPL between 1% - 1,5%
• Coverage: 110 - 120%
• Targeted recovery : Rp 750 bn – Rp1,0 tn
• Strengthen early warning system on loan portfolio
• Proactive monitoring on Pre-NPL portfolio• Resolve Top 10 NPLs
• Establish provision policy in line with peers & economy climate
• Increase recovery rate
Strengthen Tier-1 Capital • Tier 1 Capital targeted above 10%• Dividend Pay Out Ratio
• Asset Quality
PT Bank Negara Indonesia (Persero) TbkCorporate Communication Division, Investor Relations GroupBNI Building, 24th FloorJl Jend Sudirman kav. 1 Jakarta 10220T: 62-21-5728868F: 62-21-5728053E: [email protected]
Thank you


![PT Perusahaan Gas Negara (Persero) TBK v CRW Joint Operation · PT Perusahaan Gas Negara (Persero) TBK v [2015] SGCA 30 CRW Joint Operation 3 4 In the course of the project, CRW submitted](https://static.fdocuments.us/doc/165x107/5d38334188c99366578bcbfe/pt-perusahaan-gas-negara-persero-tbk-v-crw-joint-operation-pt-perusahaan-gas.jpg)