PT ASTRA INTERNATIONAL TBK First Quarter 2017 - … Business Update 1Q17_Final.pdf · The materials...
30
PT ASTRA INTERNATIONAL TBK First Quarter 2017 - Results Presentation
Transcript of PT ASTRA INTERNATIONAL TBK First Quarter 2017 - … Business Update 1Q17_Final.pdf · The materials...

PT ASTRA INTERNATIONAL TBK First Quarter 2017 - Results Presentation

The materials in this presentation have been prepared by PT Astra International Tbk (Astra) and are general background information about Astra Group business performances current as at the date of this presentation and are subject to change without prior notice. This information is given in summary form and does not purport to be complete. Information in this presentation, including forecast financial information, should not be considered as advice or a recommendation to investors or potential investors in relation to holding, purchasing or selling securities or other financial products or instruments and does not take into account their particular investment objectives, financial situation or needs. Before acting on any information, readers should consider the appropriateness of the information having regard to these matters, any relevant offer document and in particular, readers should seek independent financial advice. This presentation may contain forward looking statements including statements regarding our intent, belief or current expectations with respect to Astra businesses and operations, market conditions, results of operation and financial condition, capital adequacy, specific provisions and risk management practices. Readers are cautioned not to place undue reliance on these forward looking statements; past performance is not a reliable indication of future performance. Astra does not undertake any obligation to publicly release the result of any revisions to these forward looking statements to reflect events or circumstances after the date hereof to reflect the occurrence of unanticipated events. We disclaim any responsibility or liability whatsoever arising which may be brought or suffered by any person as a result of acting in reliance upon the whole or any part of the contents of this report and neither Astra and/or its affiliated companies and/or their respective employees and/or agents accepts liability for any errors, omissions, negligent or otherwise, in this report and any inaccuracy herein or omission here from which might otherwise arise.
Disclaimer
1
2
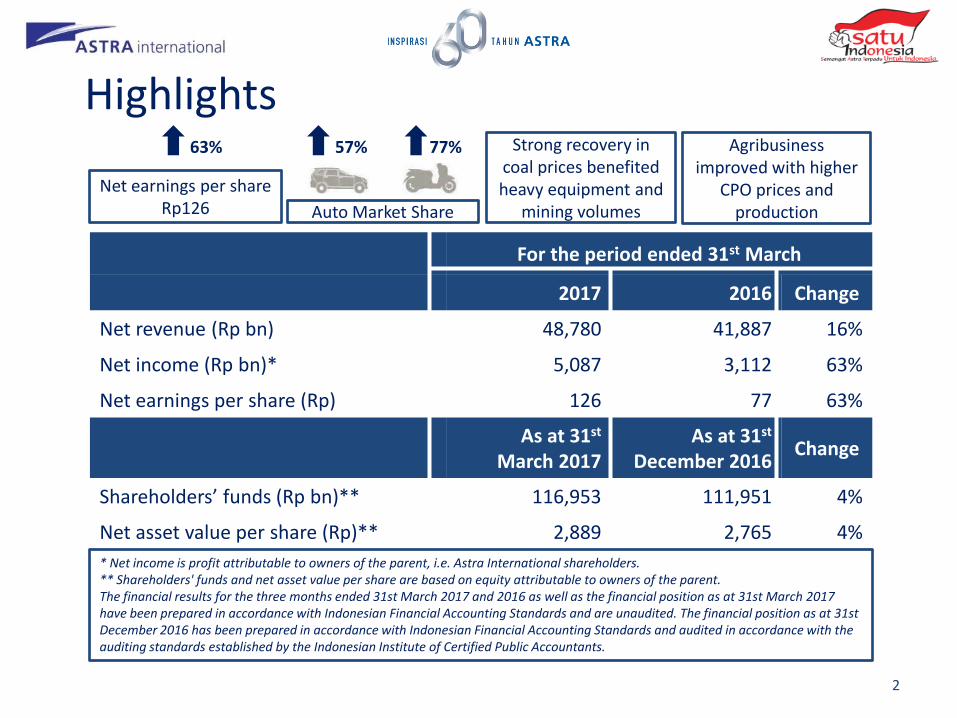
For the period ended 31st March
2017 2016 Change
Net revenue (Rp bn) 48,780 41,887 16%
Net income (Rp bn)* 5,087 3,112 63%
Net earnings per share (Rp) 126 77 63%
As at 31st March 2017
As at 31st December 2016
Change
Shareholders’ funds (Rp bn)** 116,953 111,951 4%
Net asset value per share (Rp)** 2,889 2,765 4%
* Net income is profit attributable to owners of the parent, i.e. Astra International shareholders. ** Shareholders' funds and net asset value per share are based on equity attributable to owners of the parent. The financial results for the three months ended 31st March 2017 and 2016 as well as the financial position as at 31st March 2017 have been prepared in accordance with Indonesian Financial Accounting Standards and are unaudited. The financial position as at 31st December 2016 has been prepared in accordance with Indonesian Financial Accounting Standards and audited in accordance with the auditing standards established by the Indonesian Institute of Certified Public Accountants.
Strong recovery in coal prices benefited heavy equipment and
mining volumes
Agribusiness improved with higher
CPO prices and production
Highlights
Net earnings per share
Rp126
63% 57% 77%
Auto Market Share

Business Structure
Automobile • Toyota • Daihatsu • Isuzu • BMW • Peugeot • UD Trucks
Other
Motorcycle •Honda
Component •Astra
Otoparts
Others •AstraWorld
Automobile •Astra Credit
Companies •Toyota Astra
Finance
Motorcycle • Federal
International Finance
Heavy Equipment • SAN Finance • Komatsu Astra
Finance
Banking • Bank Permata
Insurance • Asuransi Astra
Buana • Astralife
Construction Machinery • United Tractors • Traktor Nusantara
Mining Contracting • Pamapersada Nusantara
Mining • Tuah Turangga Agung
Construction Industry • Acset Indonusa
Toll Road • MMS • MHI • MTN • TMJ • TBS • LMS
Logistics • SERA / TRAC • Mobil88 • SELOG • TFSI
Water Supply • Palyja
Sea Port • Eastkal
Document Solution •Astra Graphia
IT Solution •Astra Graphia
Information Technology
Office Services •Astragraphia Xprins
Indonesia
• Menara Astra • Brahmayasa Bahtera • Samadista Karya • Astra Land Indonesia • Astra Modern Land
3
Palm Oil Plantation • Astra Agro Lestari Olein Refinery • Tanjung Sarana Lestari • Kreasijaya Adhikarya Commodity Trading • Astra-KLK Pte.Ltd
Cattle in Palm Oil Plantation • Agro Menara Rahmat
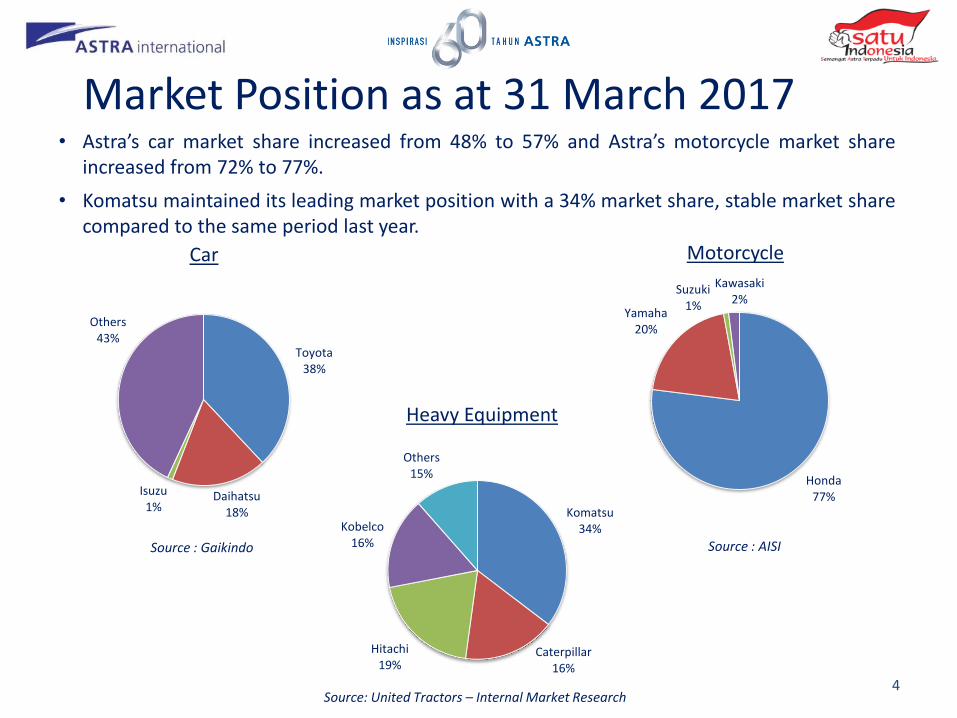
Toyota 38%
Daihatsu 18%
Isuzu 1%
Others 43%
Car
• Astra’s car market share increased from 48% to 57% and Astra’s motorcycle market share increased from 72% to 77%.
• Komatsu maintained its leading market position with a 34% market share, stable market share compared to the same period last year.
Source : Gaikindo
Honda 77%
Yamaha 20%
Suzuki 1%
Kawasaki 2%
Motorcycle
Source : AISI
Source: United Tractors – Internal Market Research
Heavy Equipment
Market Position as at 31 March 2017
4
Komatsu 34%
Caterpillar 16%
Hitachi 19%
Kobelco 16%
Others 15%

5
Corporate Actions
Mar‘17 • Bhumi Jati Power, 25%-owned by UT, which will develop and operate two 1,000 MW thermal power plants in Central Java, completed its project financing agreement with lenders. This build, operate and transfer project is expected to cost approximately US$4.2 billion and is scheduled to start commercial operation in 2021. Bhumi Jati Power is a joint venture amongst wholly owned subsidiaries of United Tractors, Sumitomo Corporation and Kansai Electric Power Co Inc.
Mar‘17
Jan ‘17 • Astratel Nusantara completed the acquisition of an initial 40% interest in PT Baskhara Utama Sedaya, which owns 45% of the operator of the fully operational 116km Cikopo-Palimanan toll road, and has subsequently conditionally agreed to acquire the remaining 60% interest.
• United Tractors through its subsidiary Tuah Turangga Agung, acquired 80.1% stake in PT Suprabari Mapanindo Mineral, a coking coal company in Central Kalimantan.

Financial Performances
6

In Billion Rupiah 1Q17 1Q16 Change
IDR / USD, average 13,337 13,506 (1%)
Net Revenue 48,780 41,887 16%
Gross Profit 10,012 7,973 26%
Selling, General and Administrative Expenses
(4,939) (4,594) 8%
Other Income 398 290 37%
Shares of Results of Joint Ventures and Associates
1,893 818 131%
Income Tax Expenses (1,281) (848) 51%
Non-controlling Interests (996) (527) 89%
Net Income 5,087 3,112 63%
“Astra saw good performances from most of its businesses in the first quarter of 2017. Looking ahead, the Group is expected to benefit from the continued growth in the Indonesian economy, supported by higher commodity prices, although its automotive activities are expected to face increasing price competition.”
- Prijono Sugiarto, President Director -
Consolidated Income Statement
7

2001 2015 2016 1Q17
Auto (Incl. auto related Financial Services)
89%
76%
85%
64%
Non-Auto
11%
24%
15%
36%
Share of Net Income (%) Ownership % 1Q17 1Q16
Auto Non-Auto Auto Non-Auto 4W Automotive SO – Toyota, Daihatsu, Isuzu Toyota Astra Motor Astra Daihatsu Motor Isuzu Astra Motor Indonesia
100 51 32 50
25
27
2W Automotive Astra Honda Motor Honda SO
50
100
18
22
Component Astra Otoparts
80
2
2
Financial Services Astra Sedaya Finance Federal International Finance Toyota Astra Financial Services Komatsu Astra Finance SAN Finance Asuransi Astra Buana Permata Bank Astra Life
86
100 50 50 60 96 45 50
19
3
27
(7)
Heavy Equipment & Mining United Tractors Pamapersada Nusantara Tuah Turangga Agung Acset Indonusa Traktor Nusantara
60 60 60 30 50
18
14
Agribusiness Astra Agro Lestari
80
12
11
Infrastructure, Logistics, IT & Property Marga Mandalasakti SERA Palyja Astra Graphia Menara Astra Brahmayasa Bahtera Samadista Karya
79
100 49 77
100 60
100
3
4
8
Astra Portfolio as at 31 March 2017

• Net asset value per share was Rp2,889 at 31st March 2017, 4% higher than at the end of 2016
• Net cash, excluding the Group’s financial services subsidiaries, was Rp131 billion, significantly lower compared with net cash of Rp6.2 trillion at the end of 2016, mainly due to toll road and power plant investments made in the first quarter of 2017. The Group’s financial services subsidiaries had net debt of Rp46.4 trillion, compared with Rp47.7 trillion at the end of 2016.
In Billion Rupiah 31-Mar-17 31-Dec-16 Change
Cash and Cash Equivalents 30,683 29,357 5%
Trade Receivables 21,722 19,426 12%
Inventories 20,210 17,771 14%
Financing Receivables 64,774 64,639 0%
Investment in Joint Ventures and Associates 36,658 33,987 8% Fixed Assets 44,917 43,237 4%
Other Assets 60,843 53,438 14%
Total Assets 279,807 261,855 7%
Short-term Borrowings 21,169 18,764 13%
Trade Payables 25,841 22,489 15%
Long-term Debt 55,818 52,146 7%
Other Liabilities 31,115 28,550 9%
Total Liabilities 133,943 121,949 10%
Equity Attributable to the Owners of The Parent 116,953 111,951 4%
Non – controlling Interest 28,911 27,955 3%
Total Equity 145,864 139,906 4%
Net Debt 46,304 41,553 11%
Net Cash (Excl. Financial Services) (131) (6,193) (98%)
Consolidated Balance Sheet
9

In Billion Rupiah 1Q17 1Q16 Change
Cash generated from operations 4,845 6,944 (2,099)
Tax Payments (809) (1,166) 357
Interest Received 380 317 63
Dividend Received 39 - 39
Net Cash flow provided from Operating Activities 4,455 6,095 (1,640)
Net Capex (2,606) (1,632) (974)
Net Investment (3,331) (349) (2,982)
Other Investing (2,453) (276) (2,177)
Net Cash flow used in Investing Activities (8,390) (2,257) (6,133)
Net Proceeds / (Repayments) of Debt 5,781 (2,777) 8,558
Finance Costs Paid (539) (453) (86)
Other Financing (11) - (11)
Net Cash flow provided from / (used in) Financing Activities 5,231 (3,230) 8,461
Increase in Cash 1,296 608 688
Opening Cash Balance (incl. Bank Overdraft) 29,356 27,072 2,284
Exchange Rate Adjustment (31) (553) 522
Closing Cash Balance (incl. Bank Overdraft) 30,621 27,127 3,494
Consolidated Cash Flow As at 31 March 2017, Astra’s ending consolidated cash balance (incl. Bank Overdraft) was Rp30.6 trillion.
10

Business Updates
11

Astra’s car sales were 10% higher at 421,000 units, resulting in an increase in market share from 50% to 54%.
Automotive – Wholesale Car Market
Astra 160,943 / 57% Astra
126,880 / 47.4%
Non Astra 121,653 / 43%
Non Astra 140,422 / 52.6%
4x2 & 4x4 170,096 / 60.2%
4x2 & 4x4
163,598 / 61.2%
Commercial 58,673 / 20.7%
Commercial 59,180 / 22.2%
LCGC 51,389 / 18.2% LCGC
41,520 / 15.5%
Toyota 107,611 / 38.1%
Toyota
80,513 / 30.1%
Daihatsu 49,730 / 17.6%
Daihatsu 42,452 / 15.9%
Isuzu 3,594 / 1.3%
Isuzu 3,906 / 1.5%
Other Brands 121,653 / 43%
Other Brands 140,422 / 52.6%
M/S 1Q17
Market Segment
Brand
M/S 1Q16
Market Segment
Brand
Sedan 3,004 / 1.1%
Sedan 2,438 / 0.9%
1Q17 1Q16
267,302 282,596
Astra’s car sales were 27% higher at 161,000 units, resulting in an increase in market share from 48% to 57%.
6%
Source: Gaikindo 12
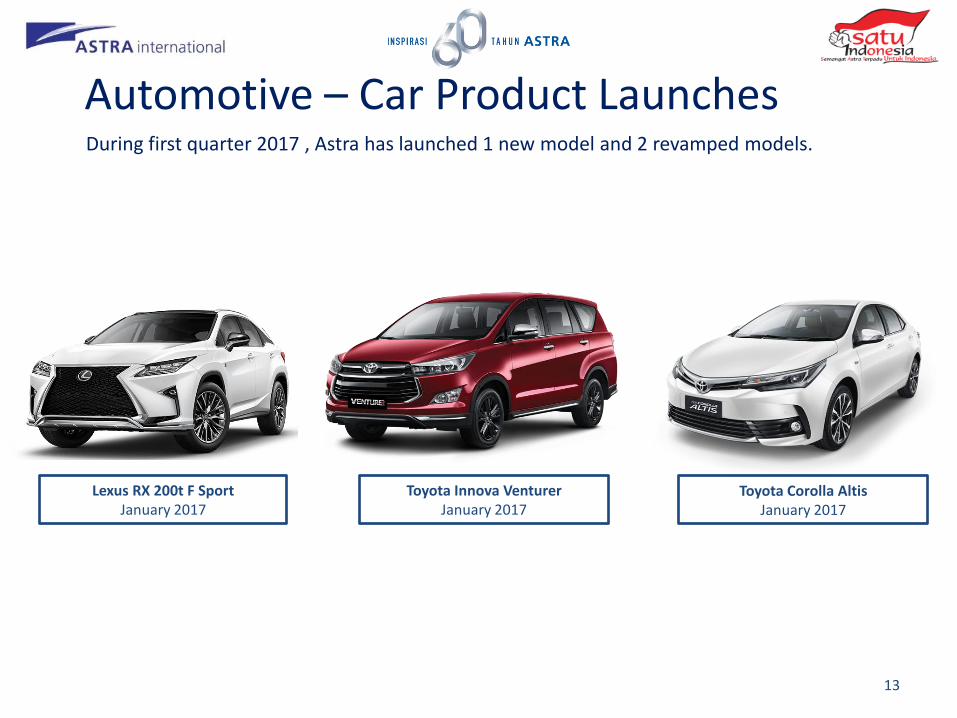
Toyota Corolla Altis January 2017
Lexus RX 200t F Sport January 2017
During first quarter 2017 , Astra has launched 1 new model and 2 revamped models.
Automotive – Car Product Launches
Toyota Innova Venturer January 2017
13

Honda 1,073,184
76.6%
Honda 1,090,610
72.5%
Yamaha 285,668 20.4%
Yamaha 359,775 23.9%
Kawasaki 1.7% Suzuki 1.5%
Kawasaki 2.1%
Cub 70,416 / 6.6%
Cub 85,348 / 7.8%
Scooter 926,212 86.3%
Scooter 940,126 86.2%
Sport/Others 7.1%
Sport/Others 6%
Cub 70,416 68.8%
Cub 85,348 59.9%
Scooter 926,212
80%
Scooter 940,126
80%
Sport/Others 53.9%
Sport/Others 36.1%
Cub 102,334
7.3%
Cub 142,456
9.5%
Scooter 1,157,241
82.6%
Scooter 1,181,782
78.5%
Sport/Others 10.1%
Sport/Others 12%
Brand 1Q17
Honda Segment
Honda Product M/S
Segment
Brand 1Q16
Honda Segment
Honda Product M/S
Segment
Source: AISI
Astra Honda Motor’s domestic sales were 2% lower at 1.1 million units; however, its market share increasing from 72% to 77%.
Automotive – Wholesale Motorcycle Market
7%
14
Suzuki 1,3%
1Q17 1Q16
1,504,463 1,401,538

Honda PCX 150 January 2017
Honda CRF 250 February 2017
Honda CRF 1000L Africa Twin February 2017
Automotive – Motorcycle Product Launches During first quarter 2017, Astra Honda Motor has launched 4 new models and 6 revamped models.
15
Honda CMX 500 Rebel March 2017
Honda Scoopy March 2017
Honda CBR 250 R February 2017
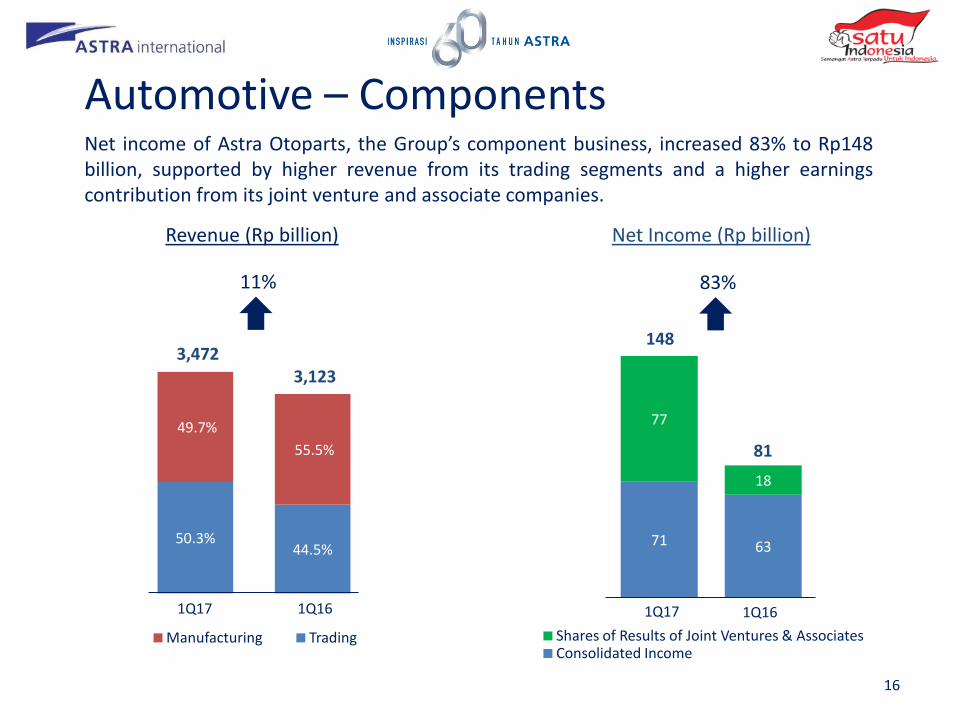
71 63
77
18
Shares of Results of Joint Ventures & Associates Consolidated Income
50.3% 44.5%
49.7%
55.5%
Manufacturing Trading
Net Income (Rp billion)
81
Revenue (Rp billion)
1Q17 1Q16 1Q17 1Q16
3,123 3,472
148
Net income of Astra Otoparts, the Group’s component business, increased 83% to Rp148 billion, supported by higher revenue from its trading segments and a higher earnings contribution from its joint venture and associate companies.
Automotive – Components
16
11% 83%

Net income from the Group’s financial services division increased 75% to Rp1.1 trillion, with improved contributions from most financial services businesses, including Permata Bank.
Amount Financed (Rp billion) 1Q17 1Q16 %
Auto
ACC (Incl. HE) 7,316 6,522 12
TAF 3,447 2,424 42
Total 4W 10,763 8,945 20
FIF (Incl.Electronics) 7,926 7,030 13
Total Auto 18,689 15,975 17
HE
SANF 655 653 0
KAF* 647 366 77
Total HE 1,302 1,019 28
• 1Q17 consolidated net income Rp453 billion
(1Q16 : consolidated net loss Rp376 billion).
• Loan book decreased by 22% to Rp96.5 trillion.
• LDR 75% & CAR 17%.
• Gross-NPL ratio down from 8.8% at the end of 2016 to 6.4%.
Asuransi Astra
• Higher net income by 4% to Rp215 billion.
• 1Q17 Gross Written Premium down by 12% year on year to Rp1.1 trillion.
• RBC: 267%**, requirement 120%.
Permata Bank
Unit Financed 1Q17 1Q16 %
Auto
ACC (new & used cars) 41,683 44,874 (7)
TAF 20,297 14,642 39
Total 4W 61,980 59,516 4
FIF (Incl.Electronics)’000 846 765 11
HE
ACC (HE - units) 103 154 (33)
SANF 167 105 59
KAF 130 75 73
Total SANF & KAF 297 180 65
Financial Services
*Average exchange rate USD/IDR: 13,337 (1Q17) & 13,506 (1Q16) ** tentative figure, waiting from OJK confirmation
17
169.7
165.4
Overburden Removal (mn bcm)
18
1,900 1,751
TTA Mine (all in thousand tonnes)
25.0 24.6
Coal Production (mn tonnes)
4,792 3,371
6,299
5,583
2,082
1,284
506
458
Construction Machinery Mining Contracting
Mining Construction Industry
41%
21%
20%
16%
26%
48%
13%
15%
Mining Forestry Construction Agro
Mining Contracting
Coal Mines: Sales Komatsu Unit Sales
499
Revenue (Rp billion)
1Q17 1Q16 1Q17 1Q16
1Q17 1Q16 1Q17 1Q16
28%
Coal Production
2%
OB Removal
3%
9% 70%
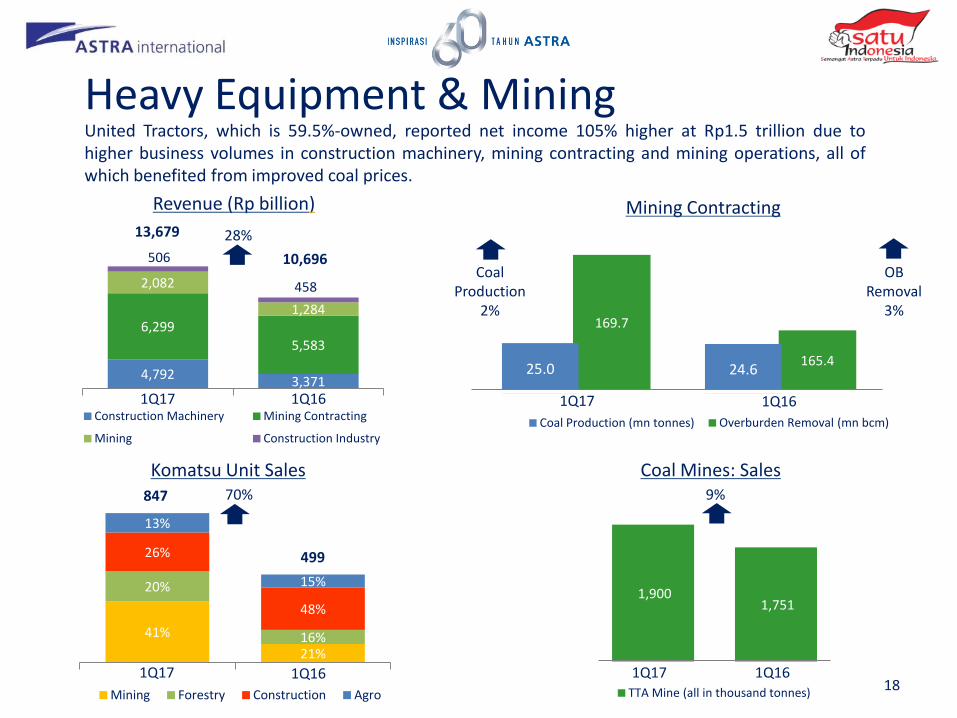
United Tractors, which is 59.5%-owned, reported net income 105% higher at Rp1.5 trillion due to higher business volumes in construction machinery, mining contracting and mining operations, all of which benefited from improved coal prices.
Heavy Equipment & Mining
13,679
10,696
847
19
267 259
30 39
Immature
Mature 387 339
410 405
CPO Production CPO & Derivates Sales
0.96 0.85
3,015 1,967
1,475
1,051 Export
Local
Area Maturity (‘K Ha)*
Revenue (Rp billion)
CPO & Sales (‘K tonnes) 297 298
* Incl. plasma plantation
CPO Yield (tonne/Ha)
3,018
1Q17 1Q16
39% 13%
CPO Production
14%
4,491
1Q17 1Q16
1Q17 1Q16 1Q17 1Q16
CPO & Derivatives Sales
1%
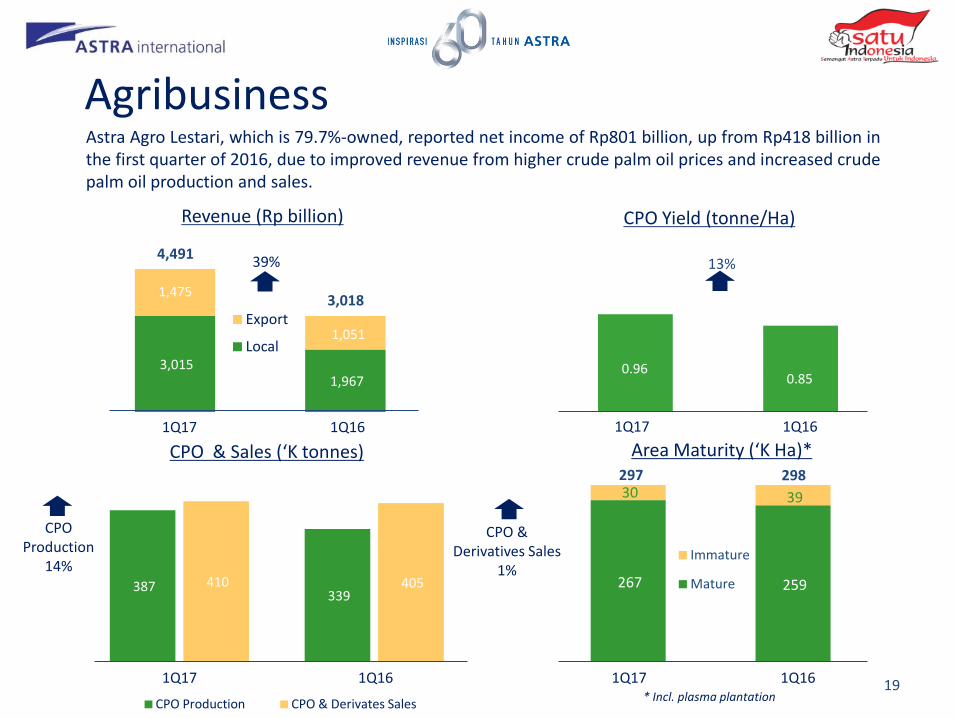
Astra Agro Lestari, which is 79.7%-owned, reported net income of Rp801 billion, up from Rp418 billion in the first quarter of 2016, due to improved revenue from higher crude palm oil prices and increased crude palm oil production and sales.
Agribusiness

23,474 23,926
SERA Unit in Contract (unit)
12,000 11,485
MMS Vehicle Traffic Volume (‘K unit)
1Q17 1Q16
1Q17 1Q16
2%
5%
The 72km Tangerang-Merak toll road, operated by 79.3%-owned Marga Mandalasakti, saw traffic volumes increase by 5% to 12 million vehicles.
Serasi Autoraya’s net income increased by 82% to Rp40 billion, due to higher net margins in its car leasing and rental and logistics businesses, despite a 2% decline in contracted vehicles in its car leasing and rental business.
Infrastructure & Logistics
20

59% 52%
41% 48%
Astragraphia Revenue (Rp billion)
1Q17 1Q16
AGDS
7%
578 620
Information Technology
AGIT
22%
33
44
Astragraphia Net Income (Rp billion)
1Q17 1Q16
23%
Astra Graphia, which is 76.9%-owned, reported a 23% decline in net income to Rp33 billion mainly due to lower revenues from its IT solutions business.
21
42
13
Net Income (Rp billion)
1Q17 1Q16
Property
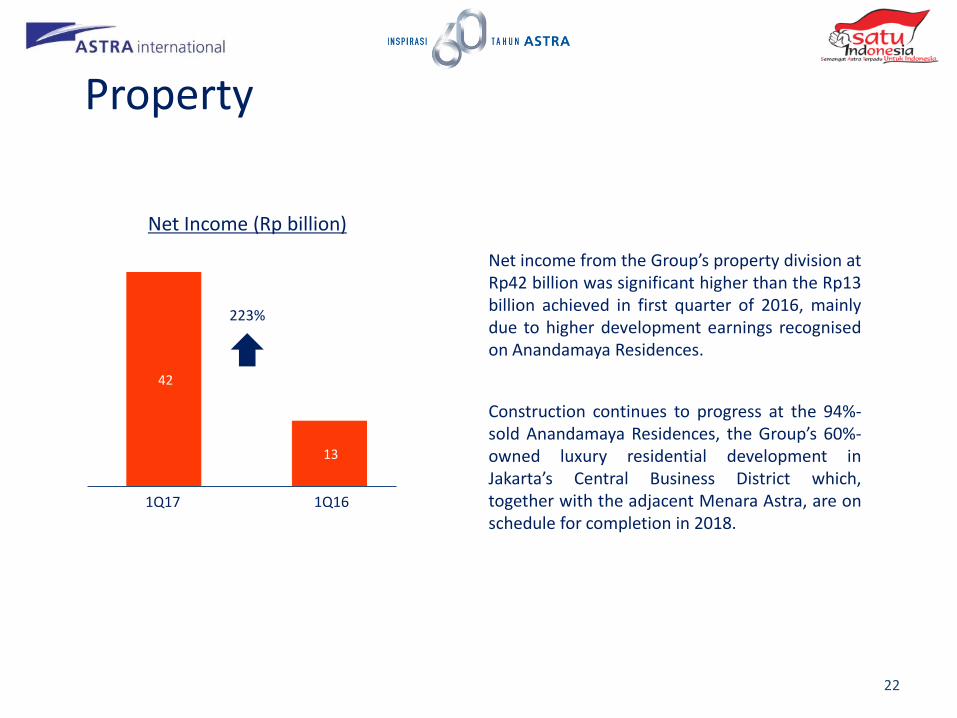
Construction continues to progress at the 94%-sold Anandamaya Residences, the Group’s 60%-owned luxury residential development in Jakarta’s Central Business District which, together with the adjacent Menara Astra, are on schedule for completion in 2018.
223%
Net income from the Group’s property division at Rp42 billion was significant higher than the Rp13 billion achieved in first quarter of 2016, mainly due to higher development earnings recognised on Anandamaya Residences.
22

Appendices
23

In Billion Rupiah 1Q17 1Q16 Change
Automotive 23,891 21,800 10%
Financial Services 4,505 4,172 8%
Heavy Equipment & Mining 13,602 10,629 28%
Agribusiness 4,491 3,018 49%
Infrastructure & Logistics 1,787 1,741 3%
Information Technology 502 524 (4%)
Property 2 3 (33%)
Total 48,780 41,887 16%
Divisional Net Income
In Billion Rupiah 1Q17 1Q16 Change
Automotive 2,288 1,580 45%
Financial Services 1,124 641 75%
Heavy Equipment & Mining 902 442 104%
Agribusiness 638 333 92%
Infrastructure & Logistics 67 69 (3%)
Information Technology 26 34 (24%)
Property 42 13 223%
Total 5,087 3,112 63%
Divisional Net Revenue and Net Income Divisional Net Revenue
24
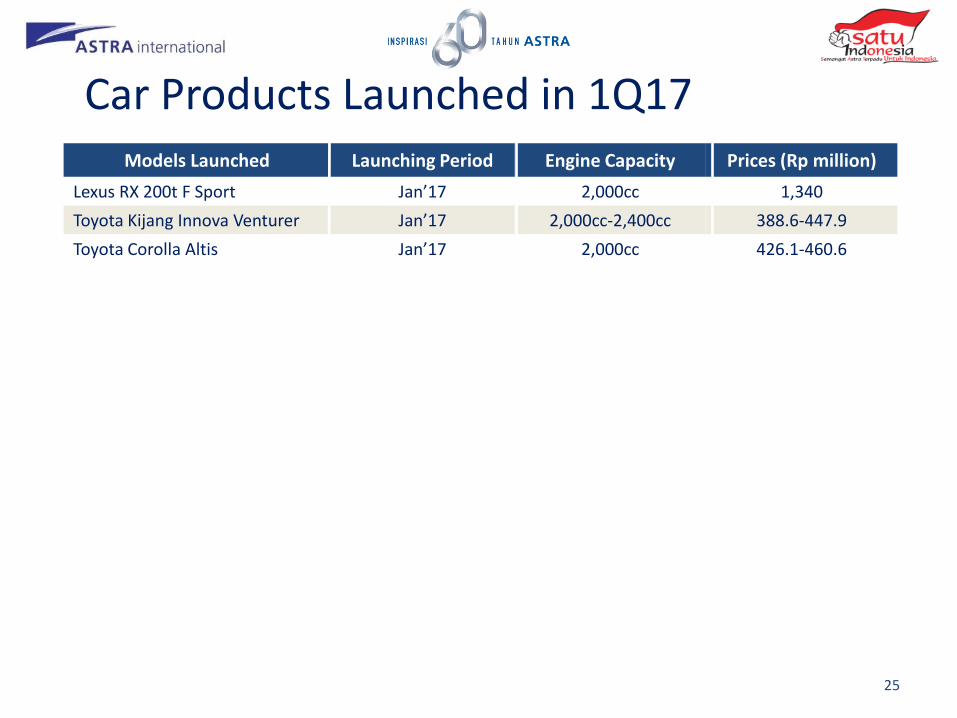
Models Launched Launching Period Engine Capacity Prices (Rp million)
Lexus RX 200t F Sport Jan’17 2,000cc 1,340
Toyota Kijang Innova Venturer Jan’17 2,000cc-2,400cc 388.6-447.9
Toyota Corolla Altis Jan’17 2,000cc 426.1-460.6
Car Products Launched in 1Q17
25

Models Launched Launching Period Engine Capacity Prices (Rp million)
Honda PCX 150 Jan’17 150cc 40.1
Honda CRF 250 Feb’17 250cc 62.9
Honda CRF 1000L Africa Twin Feb’17 1,000cc 464-499
Honda CBR 250 R Feb’17 250cc 63.2-72
Honda CB 500 F Feb’17 500cc 139.3
Honda CBR 500 R Feb’17 500cc 144.3
Honda Supra X 125 Feb’17 125cc 16.8-17.8
Honda Scoopy Mar’17 110cc 17.8
Honda CB 500 X Mar’17 500cc 147.4
Motorcycle Products Launched in 1Q17
26

National Market Data 1Q17 1Q16
Major Brands Wholesale Astra Wholesale Astra
Car
Non LCGC 218,376 50% 226,001 45% Toyota – Avanza, Innova, Fortuner; Honda – HR-V, Mobilio, BR-V, Daihatsu – Xenia, Terios, Gran Max
LCGC 64,220 81% 41,301 59% Astra Toyota – Calya, Agya; Astra Daihatsu – Sigra, Ayla; Honda - Brio Satya; Datsun - GO Panca; Suzuki - Karimun Wagon R
Total 282,596 57% 267,302 48%
Mo
torc
ycle
Cub 102,334 69% 142,456 60% Honda - Supra Series, Revo Series, Blade; Yamaha – Jupiter MX King, Jupiter ZX, Vega Force; Suzuki – Smash; Kawasaki - ZX130, Edge
Scooter 1,157,241 80% 1,181,782 80% Honda - BeAT, Vario, Scoopy; Yamaha - Mio, N-Max, Fino; Suzuki – Address, Nex
Sport 141,963 54% 180,225 36% Honda - CB 150 R Street Fire, Verza, CBR 150R, Sonic 150R; Yamaha - V-ixion R - 15, Xabre, Byson; Suzuki - Satria F 150; Kawasaki – Ninja
Total 1,401,538 77% 1,504,463 72%
27

No Brokerage Analyst Email
1 Bahana Securities Leonardo Henry Gavaza [email protected] 2 BCA Sekuritas Darmawan Halim [email protected] 3 CIMB Securities Indonesia Erindra Krisnawan [email protected]
4 Ciptadana Securities Arief Budiman [email protected]
5 Citigroup Investment Research Ferry Wong [email protected] 6 CLSA Indonesia Sarina Lesmina [email protected] 7 Credit Suisse Securities Indonesia Jahanzeb Naseer [email protected]
8 Danareksa Sekuritas Stefanus Darmagiri [email protected]
9 DBS Vickers Maynard Priajaya Arif [email protected]
10 Deutsche Verdhana Securities Reggy Susanto [email protected]
11 Goldman Sachs Pramod Kumar [email protected]
12 HSBC Tarun Bhatnagar [email protected]
13 IndoPremier Securities Chandra Pasaribu [email protected]
14 J.P. Morgan Aditya Srinath [email protected]
15 Mandiri Sekuritas Ariyanto Kurniawan [email protected]
16 Macquarie Capital Securities Jayden Vantarakis [email protected]
17 Maybank Kim Eng Securities Isnaputra Iskandar [email protected]
18 Merrill Lynch Swati Chopra [email protected]
19 MNC Securities Edwin Sebayang [email protected]
20 Morgan Stanley Andri Ngaserin [email protected]
21 Nomura Indonesia Elvira Tjandrawinata [email protected]
22 Onix Capital Bagus Hananto [email protected]
23 Reliance Securities Robertus Yanuar Hardi [email protected]
24 RHB OSK Securities Indonesia Andrey Wijaya [email protected]
25 Samuel Sekuritas Akhmad Nurcahyadi [email protected]
26 Trimegah Securities Frederick Daniel [email protected]
27 UBS Securities Indonesia Ronald Liem [email protected]
28 UOB Kay Hian Securities Stevanus Juanda [email protected] 29 Valbury Asia Securities Budi Rustanto [email protected] 30 Yuanta Securities Indonesia Kim Kwi Sjamsudin [email protected]
Equity Research Contact Details
28

For further information please contact:
PT Astra International Tbk
Corporate Investor Relations
P: (+62 21) 652 2555
F: (+62 21) 6530 4953
29