PT ASTRA INTERNATIONAL TBK - astra.co.id Mar 2017/AI Business Update 2016... · Astra does not...
36
Full Year 2016 – Results Presentation PT ASTRA INTERNATIONAL TBK
Transcript of PT ASTRA INTERNATIONAL TBK - astra.co.id Mar 2017/AI Business Update 2016... · Astra does not...

Full Year 2016 – Results Presentation
PT ASTRA INTERNATIONAL TBK

The materials in this presentation have been prepared by PT Astra International Tbk (Astra) and are generalbackground information about Astra Group business performances current as at the date of this presentation andare subject to change without prior notice.
This information is given in summary form and does not purport to be complete. Information in this presentation,including forecast financial information, should not be considered as advice or a recommendation to investors orpotential investors in relation to holding, purchasing or selling securities or other financial products or instrumentsand does not take into account their particular investment objectives, financial situation or needs. Before acting onany information, readers should consider the appropriateness of the information having regard to these matters,any relevant offer document and in particular, readers should seek independent financial advice.
This presentation may contain forward looking statements including statements regarding our intent, belief orcurrent expectations with respect to Astra businesses and operations, market conditions, results of operation andfinancial condition, capital adequacy, specific provisions and risk management practices. Readers are cautioned notto place undue reliance on these forward looking statements; past performance is not a reliable indication offuture performance. Astra does not undertake any obligation to publicly release the result of any revisions to theseforward looking statements to reflect events or circumstances after the date hereof to reflect the occurrence ofunanticipated events.
We disclaim any responsibility or liability whatsoever arising which may be brought or suffered by any person as aresult of acting in reliance upon the whole or any part of the contents of this report and neither Astra and/or itsaffiliated companies and/or their respective employees and/or agents accepts liability for any errors, omissions,negligent or otherwise, in this report and any inaccuracy herein or omission here from which might otherwisearise.
Disclaimer
1

2
For the years ended 31st December 2016
2016 2015 Change
Net revenue (Rp bn) 181,084 184,196 (2%)
Net income (Rp bn)* 15,156 14,464 5%
Net earnings per share (Rp) 374 357 5%
As at 31st
December 2016As at 31st
December 2015Change
Shareholders’ funds (Rp bn)** 111,951 102,043 10%
Net asset value per share (Rp)** 2,765 2,521 10%
* Net income is profit attributable to owners of the parent, i.e. Astra International shareholders.** Shareholders' funds and net asset value per share are based on equity attributable to owners of the parent.The financial results for the year ended 31st December 2016 and 2015 as well as the financial position as at 31st December 2016 and2015 have been prepared in accordance with Indonesian Financial Accounting Standards and are audited in accordance with theauditing standards established by the Indonesian Institute of Certified Public Accountants.
Higher Result in heavy equipment and
mining as well as agribusiness
Significant increase in loan loss provisions
reported by Permata Bank
Highlights
Net earnings per shareRp374
5% 56% 74%
Auto Market Share

Business Structure
Automobile• Toyota• Daihatsu• Isuzu• BMW• Peugeot• UD Trucks
Other
Motorcycle•Honda
Component•Astra
Otoparts
Others•AstraWorld
Automobile•Astra Credit
Companies•Toyota Astra
Finance
Motorcycle• Federal
InternationalFinance
Heavy Equipment • SAN Finance• Komatsu Astra
Finance
Banking• Bank Permata
Insurance• Asuransi Astra
Buana• Astralife
Construction Machinery• United Tractors• Traktor Nusantara
Mining Contracting• Pamapersada Nusantara
Coal Mining • Tuah Turangga Agung
Construction Industry• Acset Indonusa
Palm Oil Plantation• Astra Agro Lestari
Olein Refinery• Tanjung Sarana Lestari
• Kreasijaya Adhikarya
Commodity Trading• Astra-KLK Pte.Ltd
Cattle in Palm Oil Plantation• Agro Menara Rahmat
Toll Road• MMS• MHI• MTN• TMJ• TBS• LMS
Logistics• SERA / TRAC• Mobil88 • SELOG• TFSI
Water Utility• Palyja
Sea Port• Eastkal
Document Solution•Astra Graphia
IT Solution• Astra Graphia
Information Technology
Office Services• Astragraphia Xprins
Indonesia
• Menara Astra• Brahmayasa Bahtera• Samadista Karya• Astra Land Indonesia• Astra Modern Land
3
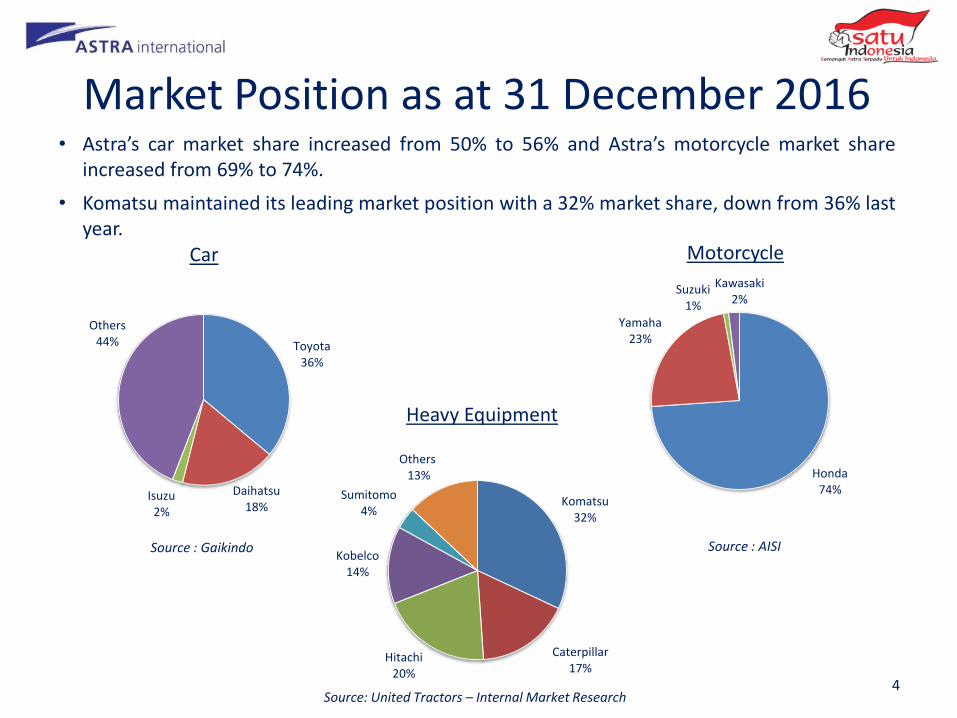
Toyota36%
Daihatsu 18%
Isuzu2%
Others44%
Car
• Astra’s car market share increased from 50% to 56% and Astra’s motorcycle market shareincreased from 69% to 74%.
• Komatsu maintained its leading market position with a 32% market share, down from 36% lastyear.
Source : Gaikindo
Honda74%
Yamaha23%
Suzuki1%
Kawasaki2%
Motorcycle
Source : AISI
Source: United Tractors – Internal Market Research
Heavy Equipment
Market Position as at 31 December 2016
4
Komatsu 32%
Caterpillar17%
Hitachi 20%
Kobelco14%
Sumitomo 4%
Others13%

5
Corporate Actions
Jun ‘16 • Permata Bank completed a rights issue which raised Rp5.5 trillion in order tostrengthen its capital base.
• General contractor Acset Indonusa, a 50.1% subsidiary of United Tractors,completed a rights issue raising Rp600 billion to support its business growth.
• Astra Agro Lestari completed a Rp4.0 trillion rights issue to strengthen itsbalance sheet.
Jul ‘16
Apr ‘16 • Astratel Nusantara acquired 25% stakes in PT Trans Bumi Serbaraja, a companythat operates 30km long Serpong Balaraja Toll Road.
• United Tractors, through PT Karya Supra Perkasa, established PT SupraAlphaplus Handal, a synergy in its construction business in manufacturing anddistributing concrete products.

6
Corporate Actions
Oct ‘16 • PT Astra Land Indonesia, owned 50% by Astra and 50% by Hongkong Land,signed an agreement with a subsidiary of PT Modernland Realty Tbk to acquireand jointly develop a 67-hectare site in Cakung, East Jakarta.
• UT, through PT Tuah Turangga Agung, signed a Conditional Shares and PurchaseAgreement (CSPA) to acquire coal mining company (coking coal) in CentralKalimantan, PT Suprabari Mapindo Mineral.
Dec‘16 • AAL and its subsidiary, PT Eka Dura Perdana, acquired all stakes in PT MitraBarito Gemilang, a rubber plantation company, rising AAL’s total rubberplantation land to 1,700 hectare.

Financial Performances
7

In Billion Rupiah 2016 2015 Change
IDR / USD, average 13,330 13,458 (1%)
Net Revenue 181,084 184,196 (2%)
Gross Profit 36,432 36,710 (1%)
Selling, General and Administrative Expenses
(18,898) (19,498) (3%)
Impairment Losses Related to MiningProperties
- (5,255) (100%)
Other Income 1,370 3,206 (57%)
Shares of Results of Joint Ventures andAssociates
3,349 4,467 (25%)
Income Tax Expenses (3,951) (4,017) (2%)
Non-controlling Interests (3,146) (1,149) 174%
Net Income 15,156 14,464 5%
“The Group’s underlying trading results for the year were satisfactory with steadyprogress seen in a number of areas. The outlook for 2017 appears positive with improvingeconomic conditions and the benefit of higher coal prices.”
- Prijono Sugiarto, President Director -
Consolidated Income Statement
8

2001 2014 2015 2016
Auto (Incl. autorelated Financial Services)
89% 63% 76% 85%
Non-Auto 11% 37% 24% 15%
Share of Net Income (%) Ownership %2016 2015
Auto Non-Auto Auto Non-Auto4W Automotive
SO – Toyota, Daihatsu, IsuzuToyota Astra MotorAstra Daihatsu MotorIsuzu Astra Motor Indonesia
100513250
34 31
2W AutomotiveAstra Honda MotorHonda SO
50100
24 19
ComponentAstra Otoparts 80 2 2
Financial ServicesAstra Sedaya FinanceFederal International FinanceToyota Astra Financial ServicesKomatsu Astra FinanceSAN FinanceAsuransi Astra BuanaPermata BankAstra Life
86100505060964550
25 (20)* 24 1
Heavy Equipment & MiningUnited TractorsPamapersada NusantaraTuah Turangga AgungAcset IndonusaTraktor Nusantara
6060603050
20 16
AgribusinessAstra Agro Lestari 80 11 3
Infrastructure, Logistics, IT & PropertyMarga MandalasaktiSERAPalyjaAstra GraphiaMenara AstraBrahmayasa BahteraSamadista Karya
791004977
10060
100
4 4
Astra Portfolio as at 31 December 2016
9* Permata Bank reported a loss of Rp6.5 trillion in 2016. (2015: Permata Bank net income of Rp247 billion).

• Astra’s net asset value per share of Rp2,765 at 31 December 2016 was 10% higher than at the end of2015.
• Net cash, excluding the Group’s financial services subsidiaries, was Rp6.2 trillion at 31st December2016, compared to net cash of Rp1.0 trillion at the end of 2015. The Group’s financial servicessubsidiaries had net debt of Rp47.7 trillion, compared to Rp44.6 trillion at the end of 2015.
In Billion Rupiah 31-Dec-16 31-Dec-15 Change
Cash and Cash Equivalents 29,357 27,102 8%
Trade Receivables 19,426 18,088 7%
Inventories 17,771 18,337 (3%)
Financing Receivables 64,639 60,105 8%
Investment in Joint Ventures and Associates 33,987 29,640 15%Fixed Assets 43,237 41,702 4%
Other Assets 53,438 50,461 6%
Total Assets 261,855 245,435 7%
Short-term Borrowings 18,764 11,975 57%
Trade Payables 22,489 20,557 9%
Long-term Debt 52,146 58,674 (11%)
Other Liabilities 28,550 27,696 3%
Total Liabilities 121,949 118,902 3%
Equity Attributable to the Owners of The Parent 111,951 102,043 10%
Non – controlling Interest 27,955 24,490 14%
Total Equity 139,906 126,533 11%
Net Debt 41,553 43,547 (5%)
Net Cash (Excl. Financial Services) (6,193) (1,034) 499%
Consolidated Balance Sheet
10

In Billion Rupiah 2016 2015 Change
Cash generated from operations 22,734 31,117 (8,383)
Tax Payments (4,706) (6,498) 1,792
Interest Received 1,379 1,280 99
Dividend Received 3,820 3,554 266
Net Cash flow provided from Operating Activities 23,227 29,453 (6,226)
Net Capex (8,368) (7,499) (869)
Net Investment (6,263) (2,251) (4,012)
Other Investing 13 (954) 967
Net Cash flow used in Investing Activities (14,618) (10,704) (3,914)
Net Proceeds / (Repayments) of Debt 2,685 (2,120) 4,805
Finance Costs Paid (2,042) (718) (1,324)
Dividend Payments (8,140) (10,585) 2,445
Other Financing 1,609 16 1,593
Net Cash flow used in Financing Activities (5,888) (13,407) 7,519
Increase in Cash 2,721 5,342 (2,621)
Opening Cash Balance (incl. Bank Overdraft) 27,072 20,728 6,344
Exchange Rate Adjustment (437) 1,002 (1,439)
Closing Cash Balance (incl. Bank Overdraft) 29,356 27,072 2,284
Consolidated Cash FlowAs at 31 December 2016, Astra’s ending consolidated cash balance (incl. Bank Overdraft)was Rp29.4 trillion.
11

Business Updates
12

Segment 2007 2008 2009 2010 2011 2012 2013 2014 2015 2016
Sedan 6% 6% 5% 4% 3% 3% 3% 2% 2% 1%
4x2 & 4x4 66% 64% 69% 67% 64% 67% 65% 57% 54% 58%
Commercial 28% 30% 26% 29% 33% 30% 28% 27% 28% 19%
LCGC 0% 0% 0% 0% 0% 0% 4% 14% 16% 22%
223318 281
427 483605 655 614
510 591211
290205
338411
511575 594
503471
2007 2008 2009 2010 2011 2012 2013 2014 2015 2016
Astra Others
Lehman Crisis(↓20%)
LTV Policy(↑25%)
Historical Domestic Car Sales
In thousand units
In 2016, car sales grew due to many new products introduction, mostly coming from Astra’sbrand.
13
1,116
894
765
486
608
434
Source: Gaikindo
1,230 1,208
1,013
Weak GDP of 4.79% (↓16%)
1,062

Astra’s car sales were 10% higher at 421,000 units, resulting in an increase in market sharefrom 50% to 54%.
Automotive – Wholesale Car Market
Astra590,982 / 55.7% Astra
510,224 / 50.4%
Others470,877 / 44.3% Others
503,067 / 49.6%
4x2 & 4x4 612,835 / 57.7% 4x2 & 4x4
553,808 / 54.7%
Commercial200,530 / 18.9%
Commercial,276,627 / 27.3%
LCGC 235,171 / 22.1%
LCGC165,434 / 16.3%
Toyota382,610 / 36% Toyota
322,466 / 31.8%
Daihatsu 189,683 / 17.9% Daihatsu
167,808 / 16.6%
Isuzu, 16,848 / 1.6%
Isuzu, 19,350 / 1.9%
Other Brands470,877 / 44.3% Other Brands
503,067 / 49.6%
M/S2016
Market Segment Brand M/S2015
Market Segment Brand
Sedan17,422 / 1.7%
Sedan13,323 / 1.3%
2016 2015
1,013,2911,061,859
Astra’s car sales were 16% higher at 591,000 units, resulting in an increase in market sharefrom 50% to 56%.
5%
Source: Gaikindo14

Isuzu FVR 34 P HDOctober 2016
BMW i8August 2016
Toyota All New FortunerJanuary 2016
Daihatsu Hi-Max November 2016
In 2016, Astra has launched 14 new models and 9 revamped models.
Automotive – Car Product Launches
Astra Daihatsu SigraAugust 2016
Toyota SientaJuly 2016
15

2,141 2,875 2,701
3,416 4,274 4,089 4,697 5,051 4,454 4,381
2,547
3,341 3,151
3,957 3,739
2,975 3,047 2,816
2,026 1,550
2007 2008 2009 2010 2011 2012 2013 2014 2015 2016
Astra OthersIn thousand units
Segment 2007 2008 2009 2010 2011 2012 2013 2014 2015 2016
Cub 73% 63% 52% 45% 37% 26% 19% 16% 12% 9%
Scooter 18% 26% 39% 46% 52% 60% 63% 68% 75% 79%
Sport 9% 11% 9% 9% 11% 14% 18% 16% 13% 12%
Historical Domestic Motorcycle SalesWholesale market for motorcycles decreased by 8% to 5.9 million units in 2016.
Scooter matic segment continues to dominate the motorcycle market.
16
4,688
7,373
5,8526,216
8,013
7,064
Lehman Crisis(↓6%)
Source: AISI
7,8677,744
LTV Policy(↓12%)
6,480
Weak GDP of 4.79% (↓16%)
5,931
•
•

Honda4,380,888
73.9%
Honda 4,453,888
68.7%
Yamaha1,394,078
23.5%
Yamaha1,798,630
27.8%
Kawasaki 1.6%Suzuki 1.7%
Kawasaki 1.8%
Cub363,906
8.3%
Cub404,872
9.1%
Scooter3,661,284
83.6%
Scooter3,750,803
84.2%
Sport/Others8.1%
Sport/Others6.7%
Cub363,90669.7%
Cub404,87255.4%
Scooter3,661,284
78.1%
Scooter3,750,803
76.9%
Sport/Others49.3%
Sport/Others34.2%
Cub522,082
8.8%
Cub522,08211.3%
Scooter4,688,004
79%
Scooter4,688,004
75.3%
Sport/Others12.2%
Sport/Others13.4%
Brand2016
Honda Segment Honda Product M/S
Segment Brand2015
Honda Segment Honda Product M/S
Segment
Source: AISI
2016 2015
6,480,1555,931,285
Astra Honda Motor’s domestic sales were 2% lower at 4.4 million units; however, its marketshare increasing from 69% to 74%.
Automotive – Wholesale Motorcycle Market
8%
17
Suzuki 1%

Honda CBR150RFebruary 2016
Honda Vario 150 eSPFebruary 2016
Honda Supra GTR 150May 2016
Automotive – Motorcycle Product LaunchesIn 2016, Astra Honda Motor has launched 7 new models and 8 revamped models.
Honda BeAT Sporty EspAugust 2016
Honda CB 150 Street fireAugust 2016
Honda CBR 250 RRJuly 2016
18

188
287
230 31
Shares of Results of Joint Ventures & AssociatesConsolidated Income
48% 48%
42%41%
10%11%
Export After Market OEM
Net Income (IDR billion)
319
Revenue (IDR billion)
9%
2016 2015 2016 2015
11,72412,807
418
Net income at Astra Otoparts, the Group’s component business, increased 31% to Rp418billion, with higher revenue from its OEM and aftermarket segments combined with higherearnings contribution from its associated companies.
Automotive – Components
31%
19
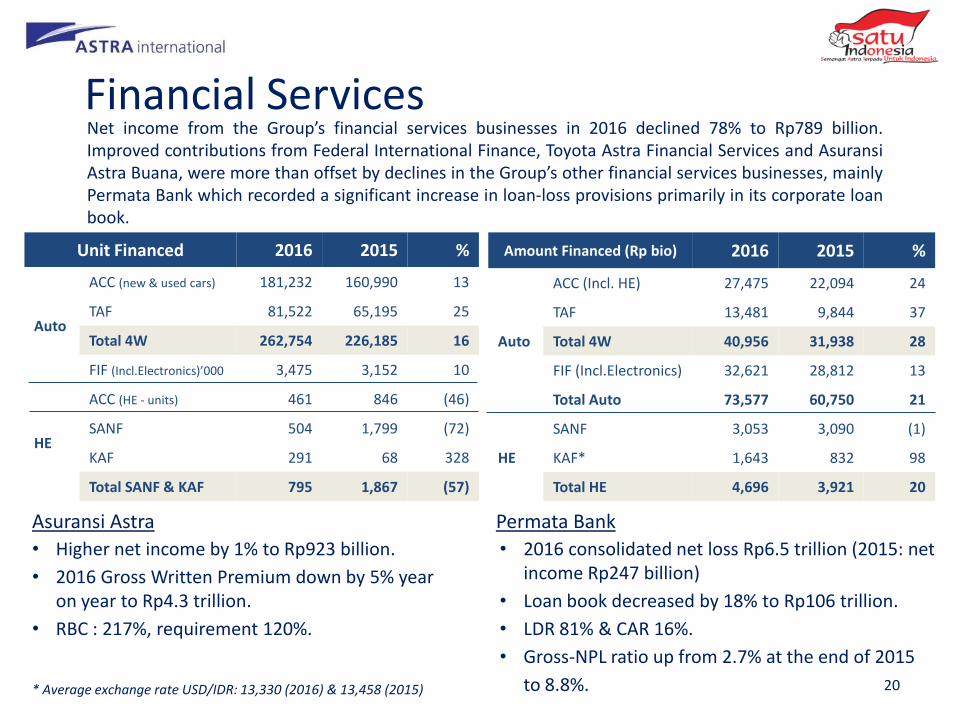
Net income from the Group’s financial services businesses in 2016 declined 78% to Rp789 billion.Improved contributions from Federal International Finance, Toyota Astra Financial Services and AsuransiAstra Buana, were more than offset by declines in the Group’s other financial services businesses, mainlyPermata Bank which recorded a significant increase in loan-loss provisions primarily in its corporate loanbook.
Amount Financed (Rp bio) 2016 2015 %
Auto
ACC (Incl. HE) 27,475 22,094 24
TAF 13,481 9,844 37
Total 4W 40,956 31,938 28
FIF (Incl.Electronics) 32,621 28,812 13
Total Auto 73,577 60,750 21
HE
SANF 3,053 3,090 (1)
KAF* 1,643 832 98
Total HE 4,696 3,921 20
• 2016 consolidated net loss Rp6.5 trillion (2015: net income Rp247 billion)
• Loan book decreased by 18% to Rp106 trillion.
• LDR 81% & CAR 16%.
• Gross-NPL ratio up from 2.7% at the end of 2015
to 8.8%.
Asuransi Astra
• Higher net income by 1% to Rp923 billion.
• 2016 Gross Written Premium down by 5% year on year to Rp4.3 trillion.
• RBC : 217%, requirement 120%.
Permata Bank
Unit Financed 2016 2015 %
Auto
ACC (new & used cars) 181,232 160,990 13
TAF 81,522 65,195 25
Total 4W 262,754 226,185 16
FIF (Incl.Electronics)’000 3,475 3,152 10
HE
ACC (HE - units) 461 846 (46)
SANF 504 1,799 (72)
KAF 291 68 328
Total SANF & KAF 795 1,867 (57)
Financial Services
* Average exchange rate USD/IDR: 13,330 (2016) & 13,458 (2015) 20

Historical Heavy Equipment Market
3,454 4,345 3,111
5,404
8,467 6,202
4,203 3,513 2,124 2,181
3,584
5,339
3,533
6,377
8,893
8,219
6,049 5,354
3,788 4,663
2007 2008 2009 2010 2011 2012 2013 2014 2015 2016
Others Komatsu
6,8447,038
9,684
6,644
11,781
17,360
14,421
Market Share 2007 2008 2009 2010 2011 2012 2013 2014 2015 2016
Komatsu 49% 45% 47% 46% 49% 43% 41% 40% 36% 32%
Caterpillar 22% 23% 21% 16% 18% 19% 19% 18% 22% 17%
Hitachi 16% 17% 18% 19% 15% 21% 21% 20% 18% 20%
Others 13% 15% 14% 19% 18% 17% 19% 22% 24% 31%
21
Heavy equipment market in 2016 slightly improved due to better coal price index in thefinal quarter of the year.
In Units
Source: UT’s internal research
10,2528,867
5,912
•
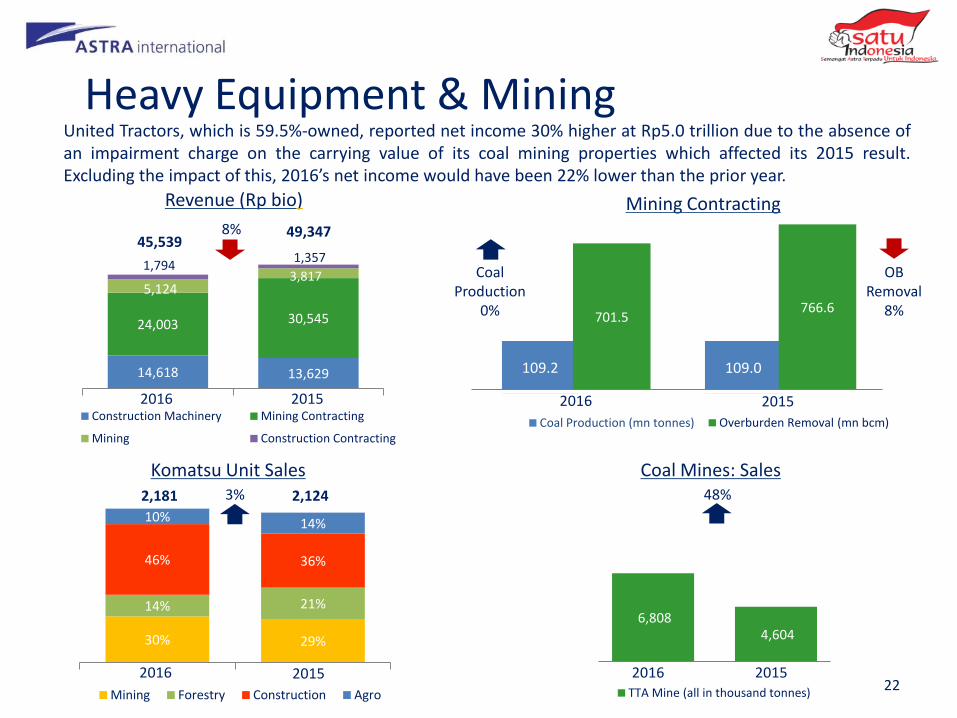
22
6,808 4,604
TTA Mine (all in thousand tonnes)
109.2 109.0
Coal Production (mn tonnes)
701.5 766.6
Overburden Removal (mn bcm)
14,618 13,629
24,003 30,545
5,124 3,817
1,794 1,357
Construction Machinery Mining Contracting
Mining Construction Contracting
30% 29%
14% 21%
46% 36%
10% 14%
Mining Forestry Construction Agro
Mining Contracting
Coal Mines: SalesKomatsu Unit Sales2,124
Revenue (Rp bio)
2016 2015 2016 2015
2016 2015 2016 2015
8%
Coal Production
0%
OB Removal
8%
48%3%
United Tractors, which is 59.5%-owned, reported net income 30% higher at Rp5.0 trillion due to the absence ofan impairment charge on the carrying value of its coal mining properties which affected its 2015 result.Excluding the impact of this, 2016’s net income would have been 22% lower than the prior year.
Heavy Equipment & Mining
45,53949,347
2,181

17.3 19.4 21.0 22.1 24.3 26.9 28.5
31.3 33.4 31.8
2007 2008 2009 2010 2011 2012 2013 2014 2015 2016
In million tonnes
Historical Palm Oil Production
23
Palm Oil Area 2007 2008 2009 2010 2011 2012 2013 2014 2015 2016
Mature (Million hectare)
4.54 4.95 5.37 5.74 6.08 6.65 7.72 8.15 8.63 9.13
Yields (T/Ha) 3.80 3.92 3.91 3.85 4.00 4.05 3.69 3.84 3.61 3.22
The growth of Indonesia’s CPO production is mainly due to the added planted areas by the palmoil producers in Indonesia during commodities boom in 2010.
Source : Oil World (as of 16 December 2016)
•

24
266 258
31 39
Immature
Mature1,554 1,737
1,014 1,042
320 412
Production Sales Olein Sales
3.84 4.68
9,422 8,693
4,700 4,366
Export
Local
Area Maturity (‘K Ha)*
Revenue (Rp bio)
CPO Production & Sales (‘K tonnes)297 298
* Incl. plasma plantation
CPO Yield (tonne/Ha)
13,059
2016 2015
8% 18%
CPO Production
11%
14,122
2016 2015
2016 2015 2016 2015
CPO Sales 3%
Astra Agro Lestari, which is 79.7%-owned, reported net income of Rp2.0 trillion, up from Rp619 billion,due to improved revenue from higher crude palm oil prices and the benefit of the stronger rupiah on thetranslation of its US dollar monetary liabilities.
Agribusiness

23,853 24,573
SERA Unit in Contract (unit)
47,829 46,475
MMS Vehicle Traffic Volume (‘K unit)
2016 2015
2016 2015
3%
3%
The 72.5km Tangerang-Merak toll road, operated by79.3%-owned Marga Mandalasakti, saw trafficvolume increase by 3% to 48 million vehicles.
Serasi Autoraya’s net income increased by 96% toRp100 billion, due to higher net margins in its carleasing and rental, used vehicle sales and logisticsbusinesses, despite a 3% decline in contracted vehiclesin its car leasing and rental business.
Infrastructure & Logistics
25

59% 61%
41% 39%
Astragraphia Revenue (Rp bio)
2016 2015
AGDS
1%
2,713 2,655
Information Technology
AGIT
7%
255 265
Astragraphia Net Income (Rp bio)
2016 2015
4%
Astra Graphia, which is 76.9%-owned, reported a 4% decline in net income to Rp255 billion, despite an increase in revenue mainly due to lower net margins.
26
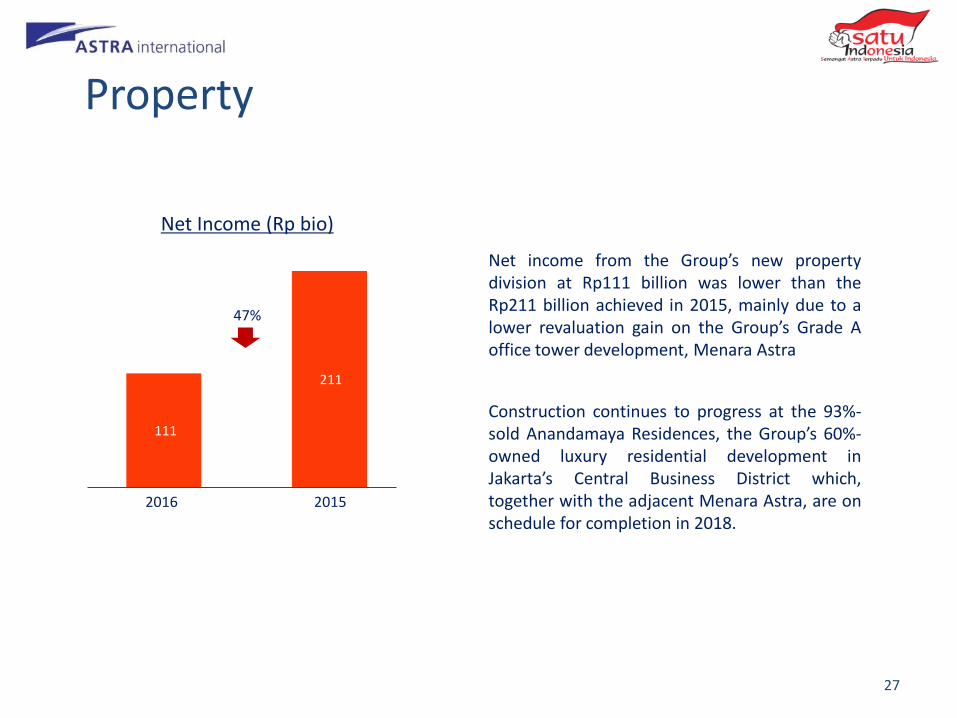
111
211
Net Income (Rp bio)
2016 2015
Property
Construction continues to progress at the 93%-sold Anandamaya Residences, the Group’s 60%-owned luxury residential development inJakarta’s Central Business District which,together with the adjacent Menara Astra, are onschedule for completion in 2018.
47%
Net income from the Group’s new propertydivision at Rp111 billion was lower than theRp211 billion achieved in 2015, mainly due to alower revaluation gain on the Group’s Grade Aoffice tower development, Menara Astra
27

Appendices
28

In Billion Rupiah 2016 2015 Change
Automotive 94,440 95,434 (1%)
Financial Services 17,762 17,074 4%
Heavy Equipment & Mining 45,112 49,209 (8%)
Agribusiness 14,121 13,059 8%
Infrastructure & Logistics 7,189 6,935 4%
Information Technology 2,451 2,474 (1%)
Property 9 11 (18%)
Total 181,084 184,196 (2%)
Divisional Net Income
In Billion Rupiah 2016 2015 Change
Automotive 9,166 7,464 23%
Financial Services 789 3,555 (78%)
Heavy Equipment & Mining 3,032 2,342 30%
Agribusiness 1,599 493 224%
Infrastructure & Logistics 263 195 35%
Information Technology 196 204 (4%)
Property 111 211 (47%)
Total 15,156 14,464 5%
Divisional Net Revenue and Net IncomeDivisional Net Revenue
29

Models Launched Launching Period Engine Capacity Prices (Rp mio)
Toyota All New Fortuner Jan’16 2,400cc-2,700cc 442-631.5
Daihatsu Sirion Sport Jan’16 1,300cc 168.3-179.3
Toyota Rush Feb’16 1,500cc 237.8-262.5
Daihatsu Terios Feb’16 1,500cc 228.1-242.2
Lexus GSF Mar’16 2,000cc 1,245
Lexus GS Mar’16 2,000cc 1,185
Lexus LX Mar’16 5,700cc 3,015
BMW M2 Apr’16 3,000cc 1,349*
Isuzu NMR 71T May’16 4,500cc 387.5-302.5
BMW X1 18i May’16 1,500cc 619*
BMW X1 18i xLine May’16 1,500cc 659*
Toyota Sienta Jul’16 1,500cc 230-295
BMW i8 Aug’16 1,500cc 3,499*
Astra Daihatsu Sigra Aug’16 1,000cc-1,200cc 106.6-147.4
Astra Toyota Calya Aug’16 1,200cc 132.5-150
Isuzu MU-X 2.5 VGS Aug’16 2,500cc 448-478
Isuzu D-MAX 2.5 VGS Aug’16 2,500cc 341-514.5
Car Products Launched in 2016
*off the road price
30

Models Launched Launching Period Engine Capacity Prices (Rp mio)
Isuzu FTR 90 T Oct’16 5,193cc 515
Isuzu FVR 34 P HD Oct’16 7,790cc 604.5
Isuzu LT1 34 (Big Bus) Oct’16 7,790cc 700
Toyota Vios Oct’16 1,500cc 272.4-323.8
Toyota Yaris Nov’16 1,500cc 228.3-277.3
Daihatsu Hi-Max Nov’16 1,000cc 95.3-103.3
Car Products Launched in 2016
31

Models Launched Launching Period Engine Capacity Prices (Rp mio)
Honda BeAT POP eSP Jan’16 110cc 14.3-15
Honda CBR 150 R Feb’16 150cc 32.5-33.3
Honda CBR 500 R Feb’16 500cc 144
Honda PCX 150 Feb’16 150cc 39.8
Honda Vario 150 eSP Feb’16 150cc 20.7
Honda Vario 125 eSP Feb’16 125cc 17.7-18.3
Honda CB 500 F Feb’16 500cc 133-139
Honda CB 500 X Feb’16 500cc 147
Honda CB 650 F Feb’16 650cc 235
Honda Supra GTR 150 May’16 150cc 21.3-21.5
Honda CBR 250 RR Jul’16 250cc 47.8-56.2
Honda BeAT Sporty eSP Aug’16 110cc 14.7-15.4
Honda CB 150 R Street Fire Aug’16 150cc 25.6-26.6
Honda Sonic 150R Aug’16 150cc 21.4-22
Honda BeAT Street eSP CBS Oct’16 110cc 15.4
Motorcycle Products Launched in 2016
32

National Market Data2016 2015
Major BrandsWholesale Astra Wholesale Astra
Car
Non LCGC 826,564 51.7% 847,857 49.2%Toyota – Avanza, Innova, Fortuner; Honda – HR-V, Mobilio, BR-V, Daihatsu – Xenia, Terios, Gran Max
LCGC 235,171 69.4% 165,434 56.1%Astra Toyota – Calya, Agya; Astra Daihatsu – Sigra, Ayla; Honda - Brio Satya; Datsun - GO Panca; Suzuki - Karimun Wagon R
Total 1,061,735 55.7% 1,013,291 50.4%
Mo
torc
ycle
Cub 522,082 69.7% 731,166 55.4%Honda - Supra Series, Revo Series, Blade; Yamaha –Jupiter MX King, Jupiter ZX, Vega Force; Suzuki –Smash; Kawasaki - ZX130, Edge
Scooter 4,688,004 78.1% 4,877,725 76.9%Honda - BeAT, Vario, Scoopy; Yamaha - Mio, N-Max,Fino; Suzuki – Address, Nex
Sport & Others 721,199 49.3% 871,264 34.2%Honda - CB 150 R Street Fire, Verza, CBR 150R, Sonic 150R; Yamaha - V-ixion R - 15, Xabre, Byson; Suzuki - Satria F 150; Kawasaki – Ninja
Total 5,931,285 73.9% 6,480,155 68.7%
33
No Brokerage Analyst Email
1 Bahana Securities Leonardo Henry Gavaza [email protected] 2 BCA Sekuritas Darmawan Halim [email protected] CIMB Securities Indonesia Erindra Krisnawan [email protected]
4 Ciptadana Securities Arief Budiman [email protected]
5 Citigroup Investment Research Ferry Wong [email protected] 6 CLSA Indonesia Sarina Lesmina [email protected] 7 Credit Suisse Securities Indonesia Jahanzeb Naseer [email protected]
8 Danareksa Sekuritas Stefanus Darmagiri [email protected]
9 DBS Vickers Maynard Priajaya Arif [email protected]
10 Deutsche Verdhana Securities Reggy Susanto [email protected]
11 Goldman Sachs Pramod Kumar [email protected]
12 HSBC Tarun Bhatnagar [email protected]
13 IndoPremier Securities Chandra Pasaribu [email protected]
14 J.P. Morgan Aditya Srinath [email protected]
15 Mandiri Sekuritas Ariyanto Kurniawan [email protected]
16 Macquarie Capital Securities Jayden Vantarakis [email protected]
17 Maybank Kim Eng Securities Isnaputra Iskandar [email protected]
18 Merrill Lynch Swati Chopra [email protected] MNC Securities Edwin Sebayang [email protected]
20 Morgan Stanley Andri Ngaserin [email protected]
21 Nomura Indonesia Elvira Tjandrawinata [email protected]
22 Onix Capital Bagus Hananto [email protected]
23 Reliance Securities Robertus Yanuar Hardi [email protected]
24 RHB OSK Securities Indonesia Andrey Wijaya [email protected] 25 Samuel Sekuritas Akhmad Nurcahyadi [email protected]
26 Trimegah Securities Frederick Daniel [email protected]
27 UBS Securities Indonesia Ronald Liem [email protected]
28 UOB Kay Hian Securities Stevanus Juanda [email protected] Valbury Asia Securities Budi Rustanto [email protected] Yuanta Securities Indonesia Kim Kwi Sjamsudin [email protected]
Equity Research Contact Details
34
For further information please contact:
PT Astra International Tbk
Corporate Investor Relations
P: (+62 21) 652 2555
F: (+62 21) 6530 4953
35