PSYCHOLOGICAL PRICES AND RICE IGIDITY IN GROCERY RETAILING...
29
PSYCHOLOGICAL PRICES AND PRICE RIGIDITY IN GROCERY RETAILING: ANALYSIS OF GERMAN SCANNER DATA* by Roland HERRMANN** and Anke MOESER*** - Selected Paper, American Agricultural Economics Association – 2005, Annual Meeting, July 24-27, 2005, Providence, Rhode Island - - This is a preprint of an article accepted for publication in “Agribusiness: An International Journal” under the title “Do Psychological Prices Contribute to Price Rigidity? Evidence from German Scanner Data on Food Brands” - * Financial support provided by Deutsche Forschungsgemeinschaft in the project “Intertemporal Price Formation in the Grocery-retailing Sector: Theory and Empirical Tests” (He 1419/8-1) is gratefully acknowledged. This project made it possible to use the scanner dataset on which the empirical analysis is based. Thanks are due to seminar participants in the Institute of Agricultural Policy and Market Research, University of Giessen, and to two anonymous referees of this journal for very helpful comments on an earlier version and Simone THEUERKAUF for very helpful research assistance. ** Prof. Dr. Roland HERRMANN, Institute of Agricultural Policy and Market Research, University of Giessen, Senckenbergstr. 3, D-35390 Giessen, Germany. E-mail: [email protected] *** Dr. Anke MOESER is a postgraduate research scholar at the Institute of Nutrition Science, University of Giessen, Senckenbergstr. 3, D-35390 Giessen, Germany.
Transcript of PSYCHOLOGICAL PRICES AND RICE IGIDITY IN GROCERY RETAILING...
PSYCHOLOGICAL PRICES AND PRICE RIGIDITY IN GROCERY RETAILING:
ANALYSIS OF GERMAN SCANNER DATA*
by
Roland HERRMANN**
and
Anke MOESER***
- Selected Paper, American Agricultural Economics Association – 2005, Annual Meeting, July 24-27, 2005, Providence, Rhode Island - - This is a preprint of an article accepted for publication in “Agribusiness: An International Journal” under the title “Do Psychological Prices Contribute to Price Rigidity? Evidence from German Scanner Data on Food Brands” -
* Financial support provided by Deutsche Forschungsgemeinschaft in the project
“Intertemporal Price Formation in the Grocery-retailing Sector: Theory and Empirical Tests” (He 1419/8-1) is gratefully acknowledged. This project made it possible to use the scanner dataset on which the empirical analysis is based. Thanks are due to seminar participants in the Institute of Agricultural Policy and Market Research, University of Giessen, and to two anonymous referees of this journal for very helpful comments on an earlier version and Simone THEUERKAUF for very helpful research assistance.
** Prof. Dr. Roland HERRMANN, Institute of Agricultural Policy and Market Research, University of Giessen, Senckenbergstr. 3, D-35390 Giessen, Germany.
E-mail: [email protected]
*** Dr. Anke MOESER is a postgraduate research scholar at the Institute of Nutrition Science, University of Giessen, Senckenbergstr. 3, D-35390 Giessen, Germany.
1 Introduction
There is increasing evidence from scanner data that branded foods in the grocery retailing
sector contain a substantial amount of price rigidity (HERRMANN/MÖSER 2003). One of the
many alternative explanations for price rigidity is the existence of psychological pricing
points. We define psychological pricing points as round numbers, which may be seen by
decision-makers as price barriers: If those are exceeded, this may lead to a substantial
reduction in consumption. Consequently, psychological pricing is defined here as just-below-
the-round-figure pricing1). There is evidence that such prices, e.g. 0.49 DM or 4.99 €, have
been used frequently (FENGLER/WINTER 2001; SCHINDLER/KIRBY 1996). The economic
literature has been most hesitant against this theory and, in a survey, BLINDER et al. (1998)
found no strong support based on the views of business managers. In that study, however,
retail trade is underrepresented. The theory of psychological pricing points continues to be an
important concept for pricing in firms which directly sell to consumers. Empirical findings in
various studies, e.g. in the early work by FRIEDMAN (1967) for food retailing, suggest that
psychological prices are widely used in the retailing sector. Hence, it is the objective of this
paper to elaborate to which extent psychological pricing plays a role in grocery retailing and
whether it contributes to price rigidity of branded foods in Germany. The empirical analysis
will be based on scanner data of weekly prices for 20 branded foods in Germany in the period
1996-99.
The paper is organized as follows. The literature on the theory and evidence of psychological
pricing will be surveyed in Section 2. Then, the scanner data base is sketched in Section 3 and
an overview of price rigidity in food markets is given. In Section 4, an empirical analysis of
the importance of psychological pricing for branded foods follows. It will then be discussed in
Section 5 whether psychological pricing is a main cause of food price rigidity. Conclusions
are drawn and major results are summarized in Section 6.
1

2 Theory and Evidence of Psychological Pricing Points in the Literature
We have to distinguish the industrial organization (IO) literature from the marketing literature
on psychological pricing points. The treatment of the issue differs between the two branches
of the literature. The increasing number of IO studies on price rigidity is partly driven by the
major interest macroeconomists have in the microeconomic foundation of macroeconomic
behaviour. More specifically, sticky prices are crucial in Keynesian macroeconomics
(CARLTON 1986). Many studies have dealt with the question whether prices in the economy
are actually sticky and why. Here, psychological pricing points come into play as they can
cause price rigidity. There is also a natural interest of IO authors in the role of psychological
prices for price rigidity as psychological prices are an outcome of imperfect markets. The
marketing literature differs from the IO literature. Psychological prices are discussed there as
to whether they are an adequate tool to realize firms’ profit objectives. The question is
addressed, too, which kind of psychological prices performs best in terms of the marketing
objectives.
2.1 The IO literature
In the IO literature on price rigidity, the theory of psychological pricing points has received
some attention in the important book by BLINDER et al. (1998). BLINDER et al. surveyed
decision-makers in firms on how they set prices and which explanations of price stickiness are
important for their decisions. Psychological pricing points has been one of twelve theories of
price stickiness which was included: It is one of the few theories of nominal rigidity.
According to the theory of psychological pricing points, nominal pricing points are
psychologically so important to consumers that these react with a strong decrease in demand
if prices go beyond the psychological pricing point. Firms following the theory of
psychological prices would, thus, start from the presumption of a kinked demand curve – with
several kinks at different pricing points – where demand is strongly elastic above the kinks.
2

At each kink, it is then optimal to leave the price unchanged for at least some variation in
marginal costs. Hence, psychological pricing points are a cause of price rigidity if firms are
profit maximizers.
BLINDER et al. (1998) came up with some very interesting empirical conclusions. In general,
the theory of psychological pricing points is ranked eighth out of twelve theories – with a
generally low score of agreement. However, the authors find a significantly stronger
agreement for those firms selling directly to consumers. Psychological pricing points, as far as
they are regarded as important, are also seen as a cause of price asymmetry. Pricing points are
rather viewed as a wall against further price increases than as a general guideline where each
price change implies a move from one psychological pricing point to the next. Moreover,
BLINDER et al. detect that those who think that quality is judged by price and who assess
demand as elastic, rate psychological pricing points high, too.
There are some other studies commenting on the role of psychological pricing for price
stickiness. KASHYAP (1995), in his often-cited study on warehouse catalogue prices, found
that “being near a price point in the low inflation period reduced the probability of a price
change” (p. 268). He found some limited evidence for psychological pricing points. KÖHLER
(1996), in a business-survey study, reached conclusions similar to BLINDER et al. for
Germany. The theory of psychological pricing points was not supported by most participants
of the study. However, there is a substantial amount of uncertainty regarding customers’
reactions to price changes which may cause price stickiness. The uncertainty about
psychological pricing points seems to be part of this general uncertainty (KÖHLER 1996, pp.
172-174). In a further study with German data, FENGLER and WINTER (2001) strongly confirm
the relevance of psychological pricing points for coffee retail prices. The authors explore
information of the Gesellschaft für Konsumforschung (GfK) consumer panel and show that
86 % of more than 14,000 purchases in 1995 were subject to psychological focal pricing
3

(FENGLER/WINTER 2001, p. 100). Furthermore, it is elaborated that individual psychological
prices matter for the dynamics of the general price adjustment.
2.2 The marketing literature
The marketing literature on psychological prices has a different focus compared to the IO
literature. A major discussion exists on whether “psychological pricing”, “odd pricing” or
“just-below-the-round-figure pricing” is justified from a marketing perspective or whether
this pricing strategy leads to a major loss compared with even prices2). Of course, it is crucial
for the answer to this question whether and how strongly consumers react to odd as opposed
to even prices. It is also important whether firms have full information on the behaviour of
their customers or not.
In the German literature, KAAS and HAY (1984) showed that the firms’ decisions for odd
rather than even prices may induce high aggregate losses, although, e.g., the difference
between 2.99 and 3.00 DM seems negligible. Based on their finding and a survey of the
related literature on psychological pricing, GEDENK/SATTLER (1999) argued that the firms’
decisions may be justified under uncertainty. They agree that high losses may occur if existing
price thresholds are ignored. Additionally, they derive that the error is many hundred times
more severe, if existing price thresholds are ignored than if non-existing price thresholds are
considered with a general pricing strategy ending at digit 9. Thus, firms suffering from
uncertainty about their customers’ behaviour are better advised if they follow an odd-pricing
strategy.
Some recent contributions in the marketing literature are based on explanations of price
endings based on cognitive psychology. Some major hypotheses are empirically tested and the
sales effect of odd prices measured (STIVING/WINER 1997; SCHINDLER/KIBARIAN 1996;
SCHINDLER/KIRBY 1997). A common result is that prices ending at digit 9 may raise sales.
STIVING/WINER (1997) distinguish level and image effects for specific price endings. One
4

level effect, also stressed by SCHINDLER/KIBARIAN (1996) and SCHINDLER/KIRBY (1997), is
due to rounding down. Consumers are expected to round down prices and, thus, an incentive
exists for firms to utilize just-below prices ending at digits 9 or 99. Another explanation for a
level effect is left-to-right comparison. This implies that consumers tend to compare prices by
considering the digits from left to right. Image effects mean that consumers attach a low- or
high-price image or a low- or high-quality image to certain price endings, e.g. digit 9. Based
on empirical results for tuna and yoghurt, STIVING and WINTER find that level and image
effects do exist and market shares are affected by price endings. SCHINDLER and KIBARIAN
show with an experiment that prices ending in the digits 99 rather than 00 increase consumer
purchasing at a direct-mail women’s clothing retailer. SCHINDLER and KIRBY use a sample of
retail price advertisements and find that 9-ending prices are overrepresented. They argue that
the tendency of consumers to underestimate prices is responsible for this pattern and for a
positive sales effect. ANDERSON/SIMESTER (2003) confirm in field experiments for sales of
US retailers that the use of $ 9 endings has a direct demand-increasing effect on dresses, in
particular for new items in retailers’ catalogues.
We can summarize that the IO as well as the marketing literature contain various theoretical
arguments for the relevance of psychological pricing points to consumers. Despite this,
economists often treat the rationale for psychological pricing points with caution. Given this
background, the following empirical analysis is supposed to clarify whether psychological
pricing is widespread in German grocery retailing and whether it actually contributes to price
rigidity. If psychological pricing is important, the evidence will also be interpreted in the
context of the IO and the marketing literature.
5

3 Data and Empirical Evidence on Price Rigidity
In this section, the scanner dataset is described and empirical findings on price rigidity for the
20 selected food brands are summarized. The evidence on price rigidity is based on these
scanner data as is the evidence on psychological pricing in Section 4.
3.1 The Scanner Data
The quantitative analysis is based on a commercially available scanner data set provided by
MADAKOM GmbH (MADAKOM 1999a). It captures scanner data from the German food-
retailing sector for 144 weeks, i.e. the period from September 30, 1996, to June 28, 1999.
Four types of retailing firms were selected for this study: (i) large consumer markets (1,500 to
5,000 m2 sales area); (ii) small consumer markets (800 to 1,499 m2 area); (iii) supermarkets
(400 to 799 m2) and (iv) discounters. A further selection criterion was that data were available
for 100 consecutive weeks. 38 stores remained in the sample after applying this criterion as
well as the rule that the regional distribution of stores should approximately picture the
structure of the German food-retailing sector. Data for several retailing companies were
included.
The selection of brands covers breakfast products in the broadest sense. The national food
brands included are summarized in Appendix 1.
The individual articles could be identified with their EAN codes. EAN codes contain 13 or 8
numbers which are printed on the product and they contain an identification of the
manufacturer and the details of the product. Comprehensive information was available on the
items. This information includes the quantity sold, the product price, the name of the product
and the package size. Information on different promotion activities at the point of sale were
available as well as a variable accounting for price discounts. Those price actions are
measured as those prices which remain for four weeks or less by at least five percent below
6
the normal price. After more than four weeks, such low prices are counted as normal price
(MADAKOM 1999b).
It has to be stressed that this is a unique dataset at the individual retailers’ level. Substantial
work in recent years is based on consumer panel data (e.g., FENGLER/WINTER 2001;
LOY/WEISS 2003) which might include the customers’ switching from store to store and, thus,
a different type of price rigidity3). The utilized scanner dataset covers the retailers’ pricing
decisions irrespective of potential consumer switching between stores. However, as is in most
comparable studies, the data do not include sociodemographic variables of consumers as these
are typically not available in either retailer or consumer panels.
3.2 Empirical Evidence on Price Rigidity
Table 1 summarizes price rigidity of the selected food brands. Price rigidity (PRIG) is
measured as the mean duration of unchanged prices, following POWERS and POWERS (2001):
(1) PRIG = PCHww / .
w stands for the number of weekly price observations, wPCH is the number of weeks with price
changes.
The following results can be summarized:
1. There is a substantial degree of price rigidity at the retail level which differs strongly
across brands. There are brands where the mean duration of unchanged prices is as
high as 53 weeks. If we compute the median of the medians for the 20 food brands, it
is 18.9 weeks. Apparently, the median price rigidity indicates that prices of branded
foods remain unchanged for 19 weeks.
2. Price rigidity varies strongly across grocery-retailing firms. It can be shown that the
same holds true for the importance of price actions (see, HERRMANN/MOESER/WEBER
2004). Differences are so strong that no uniform pricing pattern for all retail chains
7

can be discovered. This is an indication of market power and the potential to set prices
independently of the competitors’ behaviour. On a competitive market, similar pricing
patterns would not occur under ceteris-paribus conditions as input costs would affect
all retailers similarly.
3. If price actions are additionally considered, it is striking that price rigidity is lower for
those brands and in those firms which are characterized by a larger number of price
actions. The correlation coefficient between price rigidity and price actions is negative
and significantly different from zero (cf. Table 4).
8

Table 1: Evidence on Price Rigidity in German Food Stores, 20 Brands, Weekly Prices, 1996-99a)
Average Price Rigidity (PRIG) in Six Grocery-Retailing Firmsb)Brands
A B C D E F Median
1 200.5 72.4 175.0 -d) 134.0 69.3 134.0 2 35.9 11.2 8.5 23.2 139.0 11.9 17.6 3 35.8 8.7 3.8 19.6 94.5 9.5 14.6 4 16.3 2.7 7.2 11.1 18.0 9.3 10.2 5 24.1 6.3 6.7 18.3 9.9 12.7 11.3 6 14.1 14.9 6.5 104.0 9.4 5.0 11.8 7 73.7 93.3 11.3 -c) 24.1 15.2 24.1 8 50.8 9.6 7.1 16.8 48.9 10.4 13.6 9 36.6 17.9 17.7 33.6 34.0 7.4 25.8
10 23.3 5.1 7.1 37.8 16.9 27.7 20.1 11 -d) 21.2 6.9 63.4 -d) -c) 21.2 12 22.0 8.9 21.6 69.0 81.5 22.2 22.1 13 16.7 6.7 7.3 14.5 10.5 15.1 12.5 14 39.5 5.2 6.8 59.3 60.3 10.2 24.9 15 42.6 5.6 7.1 127.4 49.0 11.6 27.1 16 17.9 3.9 19.5 16.3 69.6 13.6 17.1 17 10.2 3.3 7.4 10.9 39.8 7.2 8.8 18 19.9 4.5 4.2 18.7 139.3 8.2 13.5 19 46.3 26.7 39.3 29.3 31.1 56.1 35.2 20 123.3 23.1 10.2 82.6 -c) 17.8 23.1
Median 35.8 8.8 7.3 26.3 44.3 11.9 19.1e)/18.9f)
a) The sample period and the included stores are explained in the text. The number of observations differs across the grocery-retailing firms and products. - b) Price rigidity is measured as in equation (1) in the text. – c) Not computed as no price changes were observed. – d) Not distributed in this grocery retailing firm. – e) Median of the medians, computed across firms. – f) Median of the medians, computed across brands.
Source: Authors’ computations.
4 Empirical Analysis of Psychological Pricing in German Grocery Retailing
We investigate in this section how important psychological pricing actually is in grocery
retailing and whether the statistical evidence is consistent with the presented hypotheses from
cognitive psychology on the level and image effects of price endings. Like in the analysis of
price rigidity, psychological pricing is analyzed for the selected 20 food brands in six different
9

German grocery-retailing firms. As mentioned earlier, we define psychological prices as those
prices which are slightly below psychological pricing points, e.g. 0.49 DM, 0.99 DM or 4.99
DM.
The most important psychological prices of all 20 brands have been analyzed in detail for all
six grocery-retailing firms. We define those psychological prices as important ones which
include 5% or more of all observed prices in the respective firms. Two brands are covered in
Appendices 2 and 3 as examples; they provide an impression of the importance of
psychological prices in individual firms’ pricing decisions for two very different brands.
Brands 4 and 20 are selected in Appendices 2 and 3. Brand 4, the ground coffee, is very often
utilized for price actions. Therefore, this is the brand where the two most important
psychological prices reach the lowest share of all observed prices among the 20 brands. For
brand 20, the crispbread with chocolate, on the other hand, the share of the two most
important prices is the highest among all brands.
A common result for the two examples and, actually, for all 20 brands is that psychological
pricing is most significant in German grocery retailing. A high share of all observed prices are
psychological prices for the two examples in Appendices 2 and 3 and the other 18 brands, too.
A further common result is that a relatively small number of psychological prices, e.g. five,
accounts for a major share of all observed prices. This suggests that psychological pricing
points along the lines of Sweezy’s kinked demand function may well be relevant for retailers’
pricing decisions. Stronger differences across brands occur, however, when the share of very
few psychological prices – e.g. two or three – in all prices are measured. The differences
between the two selected brands in Appendices 2 and 3 are cases in point. When
psychological prices are important for a brand but the concentration on very few
psychological prices does not exist, this indicates that no strong price barriers are involved.
10

Rather, pricing seems to be consistent with the arguments forwarded by cognitive psychology,
e.g. rounding down or left-to-right comparisons.
In Tables 2 and 3, concentration ratios are presented for the five (two) most important
psychological prices for all 20 products in the six firms. The CR5 (CR2) values indicate the
relative importance of these five (two) prices in pricing decisions across all brands.
The results in Tables 2 and 3 confirm that psychological prices for branded foods in Germany
are extremely important. For eight out of 20 branded foods, Table 2 reveals that five or less of
the important psychological prices covered more than 90 % of all observed prices in all six
grocery-retailing firms. In additional eight cases, such a situation is given in five of the six
grocery-retailing firms. And in all other cases, there are more than half of the grocery-
retailing firms where five important psychological prices cover more than 90 % of all
observed prices.
In all cases, the relative significance of the five most important psychological prices, i.e. CR5,
is very high. In no case it is less than 70 %. The lowest share was 71.1 % (brand 4, firm B). In
almost all cases it was higher than 80 % (114 of 117) and most often higher than 90 % (95 of
117 cases).
We know from U.S. studies that other price endings than digit 9 have some importance,
especially digits 0 and 5 (SCHINDLER/KIRBY 1997). The detailed analysis at the brand level
indicates that it is clearly the digit 9 which dominates as price ending for the selected German
food brands. Appendix 4 presents only a few prices with other endings than digit 9 that
reached 5 % or more of all observed prices in individual retailing firms. Only digits 5, 7 and 8
are somewhat important, but they must be regarded as exceptions rather than the rule. Firm-
specific patterns are evident here, too. The price endings at digit 7 occurred – with one
exception – only in the grocery-retailing firm F. In three cases, prices ended at digit 8 in firm
C gained some importance. In individual cases prices ending at digit 5 were important for four
11

different firms, but never for B and F. In two of these cases, a significant share of all observed
prices were reached (28.4 % for the price 1.65 DM of brand 11 and 23.1 % for the price 2.85
DM of brand 18, both at firm D).
Table 2: Concentration Ratios of the Five Most Important Psychological Prices for 20 Brands in Six German Grocery-Retailing Firms (CR5), 1996-99
Grocery-Retailing Firms Brands
A B C D E F Median
1 99.8b) 99.7d) 96.6b) n.d.e) 100b) 99.2c) 99.7 2 98.8c) 94.2d) 89.3d) 99.2d) 100b) 97.9 98.4 3 98.7c) 95.0b) 89.8b) 98.6d) 100b) 89.7 96.8
4 94.6d) 70.9 83.1 86.5 93.7d) 85.6 86.1
5 94.7c) 93.5 88.1c) 90.9 95.9d) 85.2 92.2 6 97.5d) 98.4 83.1a) 99.0b) 93.5b) 86.9 95.5 7 99.6c) 99.4b) 97.5c) 100b) 97.1a) 98.0 98.7 8 99.5b) 91.3d) 89.2c) 95.8d) 100c) 95.7c) 95.8 9 98.2c) 94.9 91.6c) 87.2 99.2d) 90.6 93.3
10 98.3b) 90.7d) 92.9c) 93.8c) 97.0b) 94.0 93.9 11 n.d.e) 96.6a) 91.1b) n.d.e) 99.2b) 100b) 95.2 12 98.5c) 95.1 98.1c) 99.3b) 99.4a) 97.8 98.3 13 93.6c) 85.0 89.1d) 95.5c) 95.0b) 77.1 91.4 14 98.8b) 98.0d) 92.5d) 97.6d) 99.1a) 87.8b) 97.8 15 98.7b) 96.3d) 90.7c) 95.7b) 98.8a) 88.8b) 96.0 16 97.8c) 82.1d) 98.3c) 92.6d) 99.3b) 91.2c) 95.2 17 88.1 87.9 87.5a) 92.7c) 99.1b) 89.6d) 88.9 18 94.6c) 80.4c) 90.0d) 92.4c) 100b) 90.2c) 91.3 19 99.8b) 90.9 95.8 96.1d) 100c) 98.9 97.5 20 99.6b) 96.9c) 93.8c) 99.7b) 100a) 97.4b) 98.5
Median 98.5 94.6 90.9 96.0 99.2 90.9 95.7f)/95.3g)
a), b), c), d) Concentration ratios of the single, two, three, four most important psychological price(s). – e) Not distributed. – f) Median of the medians, computed across firms. – g) Median of the medians, computed across brands.
Source: Authors’ computations.
The descriptive statistics on the role of psychological prices suggest as a general result that
level and image effects posited by cognitive psychology do exist. With regard to the level
effects, the dominant influence of prices ending at digit 9 indicate that rounding down prices
and left-to-right comparisons are consistent with the data.
12

Although psychological prices are significant in all grocery-retailing firms and for all brands,
there are substantial differences in the psychological-pricing strategies across brands and
firms. Table 3 summarizes to which extent pricing is concentrated on the two most important
psychological prices, respectively.
Table 3: Concentration Ratios of the Two Most Important Psychological Prices for 20 Brands in Six German Grocery-Retailing Firms (CR2), 1996-99
Grocery-Retailing Firms Brands
A B C D E F Median
1 99.8 86.7 96.8 n.d.b) 100 91.3 96.8 2 92.3 63.5 69.2 77.8 100 62.7 73.5 3 92.9 95.0 89.8 83.1 100 58.1 91.4
4 67.0 42.9 50.1 58.2 51.6 57.8 54.7
5 83.6 55.3 72.2 55.1 71.1 40.5 63.2 6 76.3 66.0 83.1a) 99.0 93.5 58.9 79.7 7 83.5 99.4 92.3 100 97.1a) 59.6 87.9 8 99.5 66.1 65.3 65.9 91.1 68.3 67.2 9 84.1 65.4 75.7 50.7 82.4 47.3 70.6
10 98.3 65.3 77.9 81.9 97.0 50.7 79.9 11 n.d.b) 96.6a) 91.1 99.2 n.d.b) 100 97.9 12 87.7 55.6 88.7 99.3 99.4a) 56.9 88.2 13 73.5 46.6 69.6 82.7 95.0 36.2 71.6 14 98.8 83.0 81.6 85.3 99.1a) 87.8 86.6 15 98.7 81.7 83.5 95.7 98.9a) 88.8 92.3 16 83.6 56.9 75.2 72.4 98.3 72.7 74.0 17 91.1 60.6 87.5a) 83.4 99.1 58.4 85.5 18 71.9 66.4 63.7 74.1 100 84.1 73.0 19 99.8 66.3 68.4 83.3 74.7 64.8 71.6 20 99.6 84.5 88.3 99.7 100a) 97.4 98.5
Median 91.1 66.1 79.8 83.1 98.3 61.2 81.5c)/79.8d)
a) Concentration ratio of the single most important psychological price. – b) Not distributed. – c) Median of the medians, computed across firms. – d) Median of the medians, computed across brands.
Source: Authors’ computations.
When we consider the median CR2 across brands for the individual grocery-retailing firms,
the two most important psychological prices capture at least 61.2 % (firm F), but in four of
the six firms 80 % or more. The highest median values are those for firms E (98.3 %) and A
(91.1 %). These two firms do stick most to only a few psychological prices for a wide sample
13

of food brands. Interestingly, the grocery-retailing firms A and E are also characterized by the
lowest number of price actions and the highest price rigidity.
The median CR2 for the individual brands across the six firms differs strongly, too. However,
it never falls below 50 %. The lowest median of CR2 is 54.7 % (brand 4), followed by 63.2 %
(brand 5) and 67.2 % (brand 8). Two of these three products with the lowest CR2 are also
among those three with the lowest price rigidity (brands 4 and 5). The median CR2 is much
higher for other products and is in three cases above 95 %: 98.5 % (brand 20), 97.9 % (brand
11) and 96.8 % (brand 1). One of these, brand 1, also ranks highest among all 20 brands in
terms of price rigidity.
These individual cases suggest already that the concentration on a few psychological prices in
food retailing, as measured by CR2, might be associated positively with price rigidity (PRIG)
and negatively with price instability (INST) and the number of price actions (ACTIONS). It is
a further interesting question whether psychological pricing is more concentrated on just a
few prices when the unit price of a brand (PRICE) is higher.
These hypotheses are tested first within a correlation analysis. All variables are measured on
the basis of the scanner dataset, and only the 18 brands which are distributed in all firms are
included. PRIG and CR2 are available from Tables 1 and 3 respectively. Data for the number
of price actions (ACTIONS), on the average prices of the brands (PRICE) and on price
instability (INST) are available from the authors upon request. The computation of price
instability is based on the trend-corrected coefficient of variation as suggested by CUDDY and
DELLA VALLE (1978).
Table 4 presents the correlation results for the pooled dataset of 18 brands and six firms4). The
major results of Table 4 are as follows:
1. There is some correlation between psychological-pricing strategies and the other
variables. The concentration on a few psychological prices in food retailing is
14

significantly stronger where price instability and the number of price actions are lower
and where price rigidity is higher. It also seems that brands with a high per-unit price
are associated with a lower CR2, but the correlation coefficient does not reach the
95 %-level of statistical significance.
2. Apart from psychological prices, the number of price actions is positively correlated
with price instability and negatively with price rigidity.
The general pattern shown in Table 4 is not only valid in the comprehensive dataset for all
firms, but holds true for the individual firms in most cases5).
Table 4: Correlation Coefficients Between the Concentration of Psychological Prices (CR2) and Other Variables, German Food Brands, All Firmsa)
Variables INST ACTIONS PRICE PRIG CR2 INST 1.000 ACTIONS 0.427*** 1.000 PRICE 0.222* 0.174 1.000 PRIG -0.492*** -0.459*** -0.071 1.000 CR2 -0.530*** -0.562*** -0.175 0.525*** 1.000 ***, **, * Statistically significant at the 99.9 %-, 99 %-, 95 %-level. a) The variables are defined in the text. Data for PRIG and CR2 are from Tables 1 and 2. Only those 18 brands
are included which are distributed in all firms (n = 108).
Source: Authors’ computations.
5 Psychological Pricing as One Determinant of Price Rigidity in German Grocery Retailing
Table 4 has shown that psychological-pricing strategies are correlated with price rigidity and
with the number of price actions. Correlation, however, is not causality. From an industrial-
organization perspective, the question arises whether the kind of psychological pricing leads
to additional price rigidity. This question will be analyzed in the following. It has been
elaborated in the literature that price promotions are a major component of retailers’ pricing
strategies (HOSKEN/REIFFEN 2001) and a major determinant of food price variability
15

(HERRMANN/MOESER 2003). Moreover, differential firm strategies have also been identified
in retailers’ price policies. In particular, an “everyday low price” (EDLP) strategy is adopted
by some retailers and Hi-Lo pricing with a promotion-oriented strategy by others
(HOCH/DRÈZE/PURK 1994). Firm strategies as well as the number of price promotions should
affect price rigidity.
We model price rigidity across brands and firms within a regression analysis where we
consider ACTIONS and firm-specific variables as main determinants of price rigidity.
Additionally, the psychological-pricing strategy is included as explanatory variable by CR2.
Several alternative model specifications are presented in Appendix 5. Price rigidity is the
endogenous variable in all these models, as we know that retail sales are an important
strategic variable for intertemporal price discrimination by firms. Arguments have been
provided above why psychological prices may be used as strategic variable, too. By
definition, price rigidity will be affected by the extent to which these strategic variables are
utilized. Thus, we can expect that PRIG is affected by ACTIONS and CR2 and not vice
versa6).
The major result of the empirical analysis is that – apart from price promotions and firm-
specific characteristics as introduced by dummy variables – psychological pricing contributes
significantly to the explanation of price rigidity. The coefficient for the impact of CR2 on
PRIG is positive in all model specifications. The change of the regression coefficients in
Model 3 compared with Models 1 and 2 indicates the existence of some multicollinearity.
However, both coefficients – for ACTIONS and CR2 – are statistically significant in Model 3.
The regression coefficients remain rather stable, too, when additional variables are included
as in Models 4 and 5. Models 4 and 5 illustrate that the level of the unit price and intercept
dummies for firms do not affect price rigidity when the number of sales and the
psychological-pricing pattern are already taken into account. However, the introduction of
16

slope dummies shows that there are firm-specific effects of price actions on price rigidity for
firms A, B and E which are at least significant at the 90 %-level.
If differential effects of sales on price rigidity are introduced in the regression model, the
preferred specification is:
(2)
(3.31)2CR**0.7226
(-1.84)(2.67)ACTIONSEDUMMYACTIONSBDUMMY
ACTIONSADUMMYACTIONSEPRIG
⋅+
⋅⋅−⋅⋅+
−−−⋅−⋅−−=
[*]
[*]
3096.1**3236.0
)66.1()85.3()29.0(7315.0***5440.07996.5
( 2R = 0.36; F = 13.01***, n = 108)
EPRIG is the estimated value of price rigidity (PRIG); DUMMY A (DUMMY B, DUMMY E)
are dummy variables for the grocery-retailing firms A (B, E) with 1 for the respective firm and
0 otherwise. Other variables are defined as before; ***, **, *, [*] indicate the 99.9 %-,
99 %-, 95 %-, 90 %-levels of statistical significance.
Equation (2) indicates that
(i) the marginal impact of one additional retail sale on price rigidity in the reference group,
i.e. firms C, D and F, is a negative one with a decrease of 0.54 in the number of weeks
with unchanged prices;
(ii) this negative marginal impact of an additional retail sale is even stronger in firms A and
E, by 0.73 and 1.31 weeks respectively, but weaker in firm B, by 0.32 weeks;
(iii) an increase in CR2, i.e. the share of the two most important psychological prices in
price-setting, by one percentage point raises the number of weeks with unchanged prices
by 0.72.
17

We can conclude from the analysis of the pooled data set that, as expected, the number of
price promotions is a significant determinant of the rigidity of food prices. An increasing
number of promotions reduces price rigidity the most in retailing firms with a relatively low
number of price actions (firms A and E). On the other hand, the effect is weakest in the firm
with the highest number of price actions (firm B). Moreover, psychological pricing of retailers
does affect food price rigidity, too.
When the importance of price actions and psychological pricing for price rigidity is tested for
the individual grocery-retailing firms in separate regressions, some similarities and some
differences compared with the pooled results are visible. Again, the influence of price actions
on price rigidity is a negative one in all equations of Appendix 6. The coefficients are
statistically different from zero in four of six firms. The psychological-pricing variable is only
for firm D significantly positive as expected. This suggests that firms’ individual strategies
with regard to psychological pricing matter and might lead to a significant coefficient of CR2
in equation (2) and, more generally, in the analysis of the pooled data set. Apparently, it is the
differential use of psychological prices across firms which contribute to the explanation of the
variation in price rigidity.
6 Summary and Conclusions
It was the objective of this paper to elaborate in how far psychological pricing plays a role in
grocery retailing and whether it contributes to price rigidity of branded foods in Germany. For
this purpose, a large scanner dataset is exploited.
In the explanation of price stickiness, economists and many business managers do not rank
the marketing argument of psychological pricing points very highly. Despite this, the analysis
shows that psychological pricing points are extremely important in German food retailing.
When prices of 20 food brands are investigated at the point of sale across 38 stores for 144
18

weeks in the period 1996-99, it is striking that prices ending at digit 9 are by far most
important. Moreover, there is often a strong concentration in pricing on only a few
psychological prices. This concentration is clearly higher for firms with an EDLP compared
to a Hi-Lo strategy and it differs across brands. The CR5 of the five most important
psychological prices is in all cases remarkable: It never falls below 70 % of all prices and
ranges above 90 % in roughly four out of five cases.
Moreover, psychological pricing seems to be one major determinant of price rigidity in
German grocery retailing. Prices of branded foods are surprisingly sticky given the high
variability of agricultural commodity prices in food retailing. Apparently, prices do not
change much – apart from sales – and if they do, they tend to move from one psychological
price to the next. Regression results show that price rigidity is higher for products where
concentration on a few psychological prices is more important. It is lower for products with a
high number of price discounts. Additionally, price rigidity as well as the CR2 for the most
important psychological prices differs widely across firms – i.e., grocery retailers do not
follow one uniform pricing strategy.
There are interesting questions remaining for future research. It is not transparent why exactly
psychological pricing points are viewed as important by grocery retailers. Survey results,
similar to those by BLINDER et al. but within the retailing sector, could solve this puzzle.
Furthermore, it is most likely that there are other determinants of price rigidity in grocery
retailing than the importance of sales, psychological prices, and firm-specific effects. It
remains a challenge to collect additional data, e.g. on the competitive situation or on menu
costs, in order to test for other theories of price rigidity, too.
19

Notes
1) Of course, this is a restricted view of psychological pricing. Price-setting by decision-makers may be related, e.g., to consumers’ perception of product quality. It may be the objective to send out quality signals via prices in order to affect the consumers’ behaviour independent of the objective quality of the product. Such behaviour would have to be included in a wider definition of psychological pricing.
2) See, e.g., BLATTBERG/NESLIN (1990, pp. 349 et seq.) for a survey of the importance of psychological pricing in retailers’ promotional activities.
3) Several U.S. studies are based on the so-called BLS data of the Bureau of Labor Statistics, e.g., BILS/KLENOW (2002). These data are the basis for the consumer price index and include prices on 70,000 to 80,000 non-housing goods and services per month, collected from around 22,000 outlets across 88 geographic areas. An information on “no price change” is also available that can be used as one indicator of price rigidity.
4) Here and in the following analysis in Section 5, the following assumption has been made. PRIG is set to 200 by assumption in those two cases where brands were distributed in all six firms but no price changes did occur in one of these firms: brand 7/firm D; brand 20/firm E. It would have been a distortion to leave the two cases with the highest price rigidity out. It would have been a distortion, too, to insert the value infinity which the equation (1) for PRIG yields in these two cases, if an infinitisemal value rather than zero is introduced for the number of price changes.
5) When we start from a statistical significance level of 95% or more, CR2 is positively correlated with PRIG in firms A, B, and D. CR2 is negatively correlated with INST and ACTIONS in firms A, B, D, and E. A high unit price is strongly negatively correlated with a low CR2 and vice versa in firms A and E, i.e. in two firms with very different levels of price rigidity. In all six firms, ACTIONS is positively correlated with price instability and negatively with price rigidity.
6) There is some additional evidence in HERRMANN/MOESER/WEBER (2004) which deals with price rigidity within an equation system. The results support the view of PRIG being the endogenous and not an exogenous variable.
20

Literature
ANDERSON, E. T. and D. I. SIMESTER (2003), Effects of $9 Price Endings on Retail Sales:
Evidence from Field Experiments. “Quantitative Marketing and Economics”, Vol. 1,
Issue 1, pp. 93-110.
BILS, M. and P. J. KLENOW (2002), Some Evidence on the Importance of Sticky Prices.
(NBER Working Paper 9069), National Bureau of Economic Research, Cambridge, Mass.
BLATTBERG, R. C. and S. A. NESLIN (1990), Sales Promotion. Concepts, Methods, and
Strategies. Prentice Hall: Upper Saddle River, NJ.
BLINDER, A. S. E. R. D. CANETTI, D. E. LEBOW and J. B. RUDD (1998), Asking About Prices.
A New Approach to Understanding Price Stickiness. New York: Russell Sage
Foundation.
CARLTON, D. W. (1986), The Rigidity of Prices. “American Economic Review”, Vol. 76, No.
4, pp. 637-658.
CUDDY, J. D. A. and P. A. DELLA VALLE (1978), Measuring the Instability of Time Series
Data. “Oxford Bulletin of Economics and Statistics”, Vol. 40, No. 1, pp. 79-85.
FENGLER, M. and J. WINTER (2001), Price-Setting and Price-Adjustment Behavior for Fast-
Moving Consumer Goods. In: PAPASTEFANOU, G., P. SCHMIDT, A. BÖRSCH-SUPAN, H.
LÜDTKE and U. OLTERSDORF (eds.), Social and Economic Research with Consumer Panel
Data. (ZUMA Spezial Band 7), Zentrum für Umfragen, Methoden und Analysen
(ZUMA), Mannheim, pp. 95-113.
FRIEDMAN, L. (1967), Psychological Pricing in the Food Industry. In: PHILLIPS, A. and O. E.
WILLIAMSON (eds.), Prices: Issues in Theory, Practice, and Public Policy. Philadelphia,
PA: University of Pennsylvania Press, pp. 187-201.
21

GEDENK, K. and H. SATTLER (1999), Preisschwellen und Deckungsbeitrag – Verschenkt der
Handel große Potentiale? „Zeitschrift für betriebswirtschaftliche Forschung“, Vol. 51, No.
1, pp. 33-59.
HERRMANN, R., A. MOESER and S. WEBER (2004), Price Rigidity in the German Grocery-
Retailing Sector: Scanner-Data Evidence on Magnitude and Causes. “Journal of
Agricultural & Food Industrial Organization”, forthcoming.
HERRMANN, R. and A. MOESER (2003), Price Variability or Rigidity in the Food-retailing
Sector? Theoretical Analysis and Evidence from German Scanner Data. Contributed
Paper, 25th International Conference of the International Association of Agricultural
Economists, Durban, South Africa, 16-22 August.
HOCH, S. J., X. DRÈZE and M. E. PURK (1994), EDLP, Hi-Lo, and Margin Arithmetic.
“Journal of Marketing”, Vol. 58, pp. 16-27.
HOSKEN, D. and D. REIFFEN (2001), Multiproduct Retailers and the Sale Phenomenon.
“Agribusiness – An International Journal”, Vo. 17, No. 1, pp. 115-137.
HOSKEN, D. and D. REIFFEN (2004), Patterns of Retails Price Variation. “Rand Journal of
Economics”, Vol. 35, No. 1, pp. 128-146.
KAAS, K. P. and C. HAY (1984), Preisschwellen bei Konsumgütern – eine theoretische und
empirische Analyse. „Zeitschrift für betriebswirtschaftliche Forschung (ZfbF)“, Vol. 36,
No. 5, pp. 333-346.
KASHYAP, A. K. (1995), Sticky Prices: New Evidence from Retail Catalogs. “The Quarterly
Journal of Economics”, Vol. 110, No. 1, pp. 245-274.
KÖHLER, A. G. (1996), Nominale Preisrigiditäten auf Gütermärkten. Eine empirische
Überprüfung neukeynesianischer Erklärungsansätze. (CIRET Studien 51), Munich.
22

LOY, J.-P. and C. WEISS (2003), Staggering and Synchronisation of Pricing Behaviour: New
Evidence from German Food Retailers. “Agribusiness – An International Journal”, Vol.
18, No. 4, S. 437-457.
MADAKOM GMBH (ed.) (1999a), Madakom Pool für Scannerdaten. Cologne: July 29.
MADAKOM GMBH (1999b), Written information by Mr. T. Bartram. August 17.
POWERS, E. T. and N. J. POWERS (2001), The Size and Frequency of Price Changes: Evidence
from Grocery Stores. “Review of Industrial Organization”, Vol. 18, No. 4, pp. 397-416.
SCHINDLER, R. M. and T. M. KIBARIAN (1996), Increased Consumer Sales Response Through
Use of 99-Ending Prices. “Journal of Retailing”, Vol. 72, No. 2, pp. 187-199.
SCHINDLER, R. M. and P. N. KIRBY (1997), Patterns of Rightmost Digits Used in Advertised
Prices: Implications for Nine-Ending Effects. “Journal of Consumer Research”, Vol. 24,
No. 2, pp. 192-201.
STIVING, M. and R. S. WINER (1997), An Empirical Analysis of Price Endings with Scanner
Data. “Journal of Consumer Research”, Vol. 24, No.1, pp. 57-67.
23

Appendix 1: Foods Brands Included in the Statistical Analysis
Brand Description Brand Name 1 170g-bottle of coffee cream with 12% fat Baerenmarke "Feine 12", 170g 2 170g-bottle of evaporated milk with 8% fat Baerenmarke Kaffeetraum 8%, 170g
3 Nine-piece-package of frozen rolls Coppenrath & Wiese "Unsere Goldstuecke", 9 Stueck
4 500g-package of ground coffee Dallmayr Prodomo, 500g 5 Package of four bottles at 100g of a probiotic drink Danone Actimel Drink Classic, 4x100g 6 500g-package of butter toast Golden Toast Butter Toast, 500g 7 Eight-piece-package of warm up rolls Golden Toast Sonntagsbroetchen, 8 Stueck
8 200g-tin of cappuccino with 10g milk chocolate Jacob's Café Zauber Cappuccino, 200g plus 10g Milchschokolade
9 375g-package of cornflakes Kellogg's Cornflakes, 375 g 10 250g-piece of Irish butter Kerrygold Original Irische Butter, 250g 11 1l-bottle of fresh milk with 3.8% fat Landliebe Landmilch 3.8%, 1l 12 500g-package of full corn bread Lieken Urkorn "Das Vollkorn-Saftige", 500g 13 500ml-beaker of chocolate drink Muellermilch Schoko, 500ml 14 375g-package of breakfast cereals Nestlé Cini Minis, 375g
15 375g-package of muesli-like breakfast cereals Nestlé Nesquik fuer ein Knusperfruehstueck, 375g
16 400g-glass of nut-and-chocolate cream Nutella, 400g 17 500g-beaker of margarine Rama, 500g 18 450g-glass of strawberry jam Schwartau Extra Erdbeerkonfituere Extra, 450g 19 Package of 25 tea bags Teekanne Teefix, 43.75g, 25 Teebeutel 20 150g-package of crispbread with chocolate Wasa Schoko Wikinger, 150g
Source: Own compilation.
24
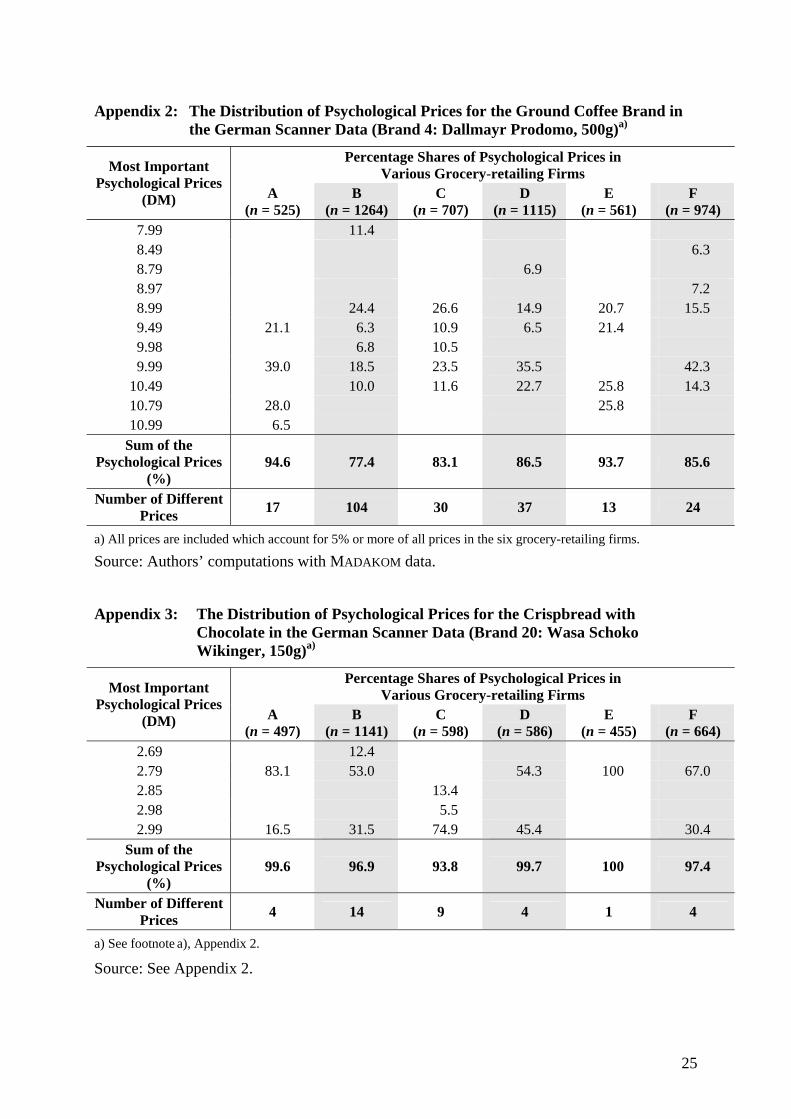
Appendix 2: The Distribution of Psychological Prices for the Ground Coffee Brand in the German Scanner Data (Brand 4: Dallmayr Prodomo, 500g)a)
Percentage Shares of Psychological Prices in Various Grocery-retailing Firms Most Important
Psychological Prices (DM) A
(n = 525) B
(n = 1264) C
(n = 707) D
(n = 1115) E
(n = 561) F
(n = 974) 7.99 11.4 8.49 6.3 8.79 6.9 8.97 7.2 8.99 24.4 26.6 14.9 20.7 15.5 9.49 21.1 6.3 10.9 6.5 21.4 9.98 6.8 10.5 9.99 39.0 18.5 23.5 35.5 42.3
10.49 10.0 11.6 22.7 25.8 14.3 10.79 28.0 25.8 10.99 6.5
Sum of the Psychological Prices
(%) 94.6 77.4 83.1 86.5 93.7 85.6
Number of Different Prices 17 104 30 37 13 24
a) All prices are included which account for 5% or more of all prices in the six grocery-retailing firms.
Source: Authors’ computations with MADAKOM data.
Appendix 3: The Distribution of Psychological Prices for the Crispbread with Chocolate in the German Scanner Data (Brand 20: Wasa Schoko Wikinger, 150g)a)
Percentage Shares of Psychological Prices in Various Grocery-retailing Firms Most Important
Psychological Prices (DM) A
(n = 497) B
(n = 1141) C
(n = 598) D
(n = 586) E
(n = 455) F
(n = 664) 2.69 12.4 2.79 83.1 53.0 54.3 100 67.0 2.85 13.4 2.98 5.5 2.99 16.5 31.5 74.9 45.4 30.4
Sum of the Psychological Prices
(%) 99.6 96.9 93.8 99.7 100 97.4
Number of Different Prices 4 14 9 4 1 4
a) See footnote a), Appendix 2.
Source: See Appendix 2.
25

Appendix 4: Important Prices with other Endings than Digit 9, 20 German Food Brands, 1996-99a)
Price (DM) Brand Firm
Share of All Observed Prices for the Brand in the Respective
Firm (%) 1.15 13 E 16.4 1.65 11 D 28.4 2.25 17 A 8.1 2.85 20 C 13.4 2.85 18 D 23.1 0.97 13 D 12.8 1.37 13 F 9.3 1.87 17 F 15.4 1.97 17 F 15.8 2.47 3 F 8.5 3.47 9 F 6.9 3.77 19 F 6.5 3.77 9 F 18.9 8.97 4 F 7.2 1.98 17 E 18.5 2.88 18 C 6.8 2.98 20 C 5.5 9.98 4 B and C 6.8 and 10.5
a) All prices are included that do not end at digit 9 and have a share of all observed prices for the brand in the respective firm of 5% or more.
Source: Authors’ Computations.
26

Appendix 5: Determinants of Price Rigidity, German Food Brands, Alternative Modelsa)
Estimated Coefficients Explanatory Variables Model 1 Model 2 Model 3 Model 4 Model 5
46.4257*** -61.0614*** -29.3988 -33.0158 -26.0260 Constant (10.64) (-412) (-1.52) (-1.60) (-1.33)
-0.3891*** -0.2030* -0.2069* -0.2292*
ACTIONS (-5.32) (-2.45) (-2.48) (-2.34)
1.1789*** 0.8766*** 0.8894*** 0.8217**
CR2 (6.36) (4.00) (4.02) (3.56)
0.8200 PRICE (0.54)
-7.2165 DUMMY A (-0.79)
-6.6416 DUMMY B (0.67)
12.2927 DUMMY E (1.30)
2R 0.20 0.27 0.30 0.30 0.31 F 28.32*** 40.39*** 24.16*** 16.09*** 10.54***
***, **, *, [*] Statistically significant at the 99.9 %-, 99 %-, 95 %-, 90 %-level. a) The variables are defined in the text. For the data sources, see the text, too. Only those 18 products are
included which are distributed in all firms (n = 18). Values in parentheses are t values.
Source: Authors’ computations.
27

Appendix 6: Marginal Changes in Price Rigidity Due to a Change in the Number of Price Actions and a Change in Psychological Pricinga)
Marginal Changes in PRIG Due to a Change in … Grocery-retailing Firms ACTIONS CR2 2R F
-0.7275 0.8097 A (-1.28) (1.27) 0.22 3.40[*]
-0.0872 0.5312 B (-1.18) (1.57) 0.29 4.49*
-0.2654*** -0.1119 C (-4.48) (-0.84) 0.52 10.04**
-0.9005[*] 1.4356*
D (-2.09) (2.17) 0.52 10.07**
-4.4875* -0.046 E (-2.43) (-0.00) 0.36 5.72*
-0.2443* -0.1481 F (-2.58) (-0.94) 0.22 3.35[*]
***, **, *, [*] Statistically significant at the 99.9 %-, 99 %-, 95 %-, 90 %-level. a) The variables are defined in the text. For the data sources, see the text, too. Only those 18 products are
included which are distributed in all firms (n = 18). Values in parentheses are t values. The regression equations for which the corrected coefficient of determination and F-values are presented contain a constant additionally.
Source: Authors’ computations.
28