PSY 6450 Unit 6 Performance and Pay 1. Schedule 2 Today and Monday, Lecture Exam on Wednesday,...
92
PSY 6450 Unit 6 Performance and Pay 1
-
Upload
jeffry-austin -
Category
Documents
-
view
214 -
download
1
Transcript of PSY 6450 Unit 6 Performance and Pay 1. Schedule 2 Today and Monday, Lecture Exam on Wednesday,...

PSY 6450Unit 6
Performance and Pay
1

Schedule
2
Today and Monday, Lecture Exam on Wednesday, 11/06

A Little Introduction
3
Over the years, much of my research has examined the effects of individual and small group monetary incentives on employee performance and satisfaction
Most of this work is “bridge/translational” research Laboratory simulations that address practical
questions from organizational settings

How I Got My Start: The Practical Beginning
4
Union National Bank, Little Rock, AR Individual monetary incentive systems
implemented in early 1980s William B. Abernathy, H. Hall McAdams, Wayne Dierks,
Kathleen McNally By the late 1980s, 75 systems had been
installed, covering 70% of the bank’s 485 employees Productivity increases of 200%-300% Net profit per employee $11,000 compared to $4,950 for
other Little Rock banks
Program committee for ABA While scheduling, call from someone important
(Aamodt mentions UNB)
How I Got My Start:The Academic Beginning
5
The role of financial compensation in industrial motivation
Opsahl & Dunnette (1966)
Appealed to researchers to conduct controlled laboratory studies because:

Opsahl & Dunnette, 1966
6
“Strangely, in spite of the large amounts of money spent and the obvious relevance of behavioral theory for industrial compensation practices, there is probably less solid research in this area than in any other field related to worker performance.” (p. 94)

Individual Monetary Incentives:Research Since 1966*
7
In 1986, 20 years later: only 28 systematic studies of individual monetary incentives
Jenkins (1986) 12 years after that: 39 systematic studies
of individual monetary incentives, lab & applied
Jenkins et al. (1998) Meta-analytic review Individual incentives had an overall effect size of .34
(medium) Studies conducted by operant/expectancy researchers
had stronger effects than goal-setting or cognitive Situation remains pretty much the same in
2013*excludes survey studies(interesting – we know how to set up contingencies – note one category for OBM/expectancy)

Group Incentive Research*
8
~13 published studies
Honeywell-Johnson et al., 2002; Culig, 2005
Only 8 have compared the effects of individual incentives and small group incentives (N = 2-12 group members) My students and I have done 3 of those
* excludes survey studies* excludes survey studies

Prevalence in Business:Individual Monetary Incentives
9
90% of Fortune 1000 companies have some type of individual incentive plan
47% of 1045 companies surveyed by Hewitt had individual incentive plans Rewards were based on specific
employee performance criteria

Prevalence in Business:Group Monetary Incentives
10
87% of Fortune 1000 companies have work group or team incentives
Fortune 1000 companies increased their use of work group or team incentives by 50% during the past decade

Effectiveness of monetary incentives Stajkovic & Luthans (2003) conducted a meta-
analysis to determine the effectiveness of money, social recognition, and feedback on performance in applied studies
Money improved performance 23% Social recognition improved performance 17% Feedback improved performance 10% The combination of all three improved
performance 45%
11(would be interesting to compare money vs. other types of tangible rewards)

About The Beginning Again
12
My students and I began this research In the late 1980s when only about 20 systematic studies had been conducted
We began with questions raised by both Union National Bank and Opsahl & Dunnette What relationship is there between the % of
incentive pay and performance? What relationship is there between the absolute
amount of the incentive offered and performance?
Are small group incentives just as effective as individual incentives?
Do small group incentives decrease the performance of high performers?

Caveat: Quote of the Day
13
“A careful examination of criticisms of monetary pay-for-performance systems indicates not that they are ineffective, but that they are too effective.” (p. 597)
Baker, Jensen, & Murphy (1988)

Finally, SO1: Components of a compensation plan
14
Security Base pay (market value and job evaluation) Benefits
Adjustments Location (NYC vs. upstate NY) Shift
Incentive: motivate and reward employees Variable Pay
Individual Group (Aamodt does not include this) Organizational
(computer programmers vs. secretaries, Business and engineering profs vs psychology vs English, behavior analysts tend only to focus on 3) )

SO2: The Motivation Problem with Hourly and Salary Pay
15
You get what you pay forIf you pay for hours, you get hours, not performance. Economically it makes more sense for employees to take as much time as possible to complete their work. And, if you can finagle overtime, all the better (Overtime = 150% or 200% of base)
Consequences In hourly wage systems, there are clear consequences for performing below a minimally acceptable performance level (criticism, threats of dismissal), but there are no clear consequences for performing above that level. Thus, hourly wage systems tend to support minimally acceptable performance

SO3: Skinner on incentives
16
We know, without a doubt that monetary incentives will increase performance but
They have been given a bad rap - perhaps for good reasons - many object to them Primary reason - they are exploitative
And they can be, but they don’t have to be - don’t throw the baby out with the bath water!
Skinner maintained that incentive systems may, in fact, be less aversive than hourly pay systems

SO3A: According to Skinner, what maintains performance under hourly wage systems?
17
No one works on Monday morning because he is reinforced by a paycheck on Friday afternoon. The employee who is paid by the week works during the week to avoid losing a standard of living which depends upon a weekly wage. A supervisor who can discharge him is an essential part of the system. Rate of work is determined by the supervisor (with or without the pacing stimuli of a production line), and special aversive contingencies maintain quality. The pattern is therefore still aversive.Somewhat better contingencies are available under schedules of reinforcement based on counters rather than clocks. (ratio schedules of reinforcement)
(what Skinner is pointing out here is that hourly wage systems control behavior via aversive contingencies - use this as a defense of reward systems ingeneral, by the way)

SO3B: Skinner on incentive systems
18
Incentive systems:
May evoke feelings of confidence, certainty of success, and enjoyment arising from a sense of mastery and effectiveness, and interest in the job as occurs when behaviors are frequently reinforced.
Note that Skinner is not addressing performance issues here, but rather addressing the fact that incentive systems may be less aversive emotionally.
Also, note the italicized section - this is important Incentive systems are no different in this respect than any type of
reinforcement system where individuals are frequently reinforced Respondent behavior interpretation:
R (work) ––> Sr (incentives)CS (incentives) ––> CR (feelings of confidence,
etc.)
(anectodal - MI disposal aunt, happier, loyal, improved marriage; UNB proof operators, Kate acousted in grocery store - don’t hire anyone else))

SO4: Descriptions of popular pay plans (NFE)
19
I just want to reassure you, I will not ask you any questions over this material, but I wanted to explain them to you since Aamodt did mention them
In SO6, I will talk a bit about profit sharing

SO5: Why is merit pay often unpopular and not likely to improve performance?
20
Merit pay hourly increasesEven if companies adopt a “merit pay” policy, there is still a weak link between performance and pay.
Why? Merit pay is almost always based on annual subjective performance appraisals. Two issues:
As indicated in previous units, self-assessments often do not agree with supervisory assessments (we rate ourselves higher than our supervisors rate us); hence employees do not believe their pay is related to their performance in a meaningful way
Supervisors may inflate ratings due to factors that are unrelated to the employee’s performance – usually giving higher evaluations- increase pay, increase positive relations/avoid negative relations
(oppose each other)

Bucklin & Dickinson, intro, NFE
21
Barbara and I were interested in determining whether different types of monetary incentive systems affected performance differently (not whether incentives were effective, we knew they were)
We discovered, as did Jenkins et al., simply was not a lot of research
Only three thematic lines of research that have investigated/manipulated parameters of incentive systems Percentage of incentive earned: 5 studies Schedules of reinforcement: 8 studies Per piece amount: 2 studies

Bucklin & Dickinson intro, cont, NFEThree Thematic Lines
22
The percentage of total pay or base pay earned in incentive pay 3%-100% of total wages or base pay wages
earned in incentive pay Schedules of reinforcement
Incentives delivered on different fixed and variable ratio schedules (“CRF”, “FR2”, “VR2”, VR4”)
Linear, accelerating and decelerating piece rate pay systems Piece rate amount remains constant, increases or
decreases as the number of pieces completed increases

SO6A: Conclusions, for exam
23
Incentives increase performance The critical determinant of performance is the
ratio schedule contingency between performance and pay; that is, that Individuals earn a specified amount of money for
the number of work units they complete Variations in the parameters of the incentive
system do not appear to affect performance differently
(quite unexpected - simple rule, the harder I work, the more I earn)

SO6B: Implications
24
You don’t have to worry a lot about the details of how incentives/consequences are related to performance - as long as they ARE related in some type of ratio schedule, delivered fairly frequently, and supported by some type of on-going feedback system.
SO7: Three reasons why it is not surprising that profit sharing often does not increase performance
25
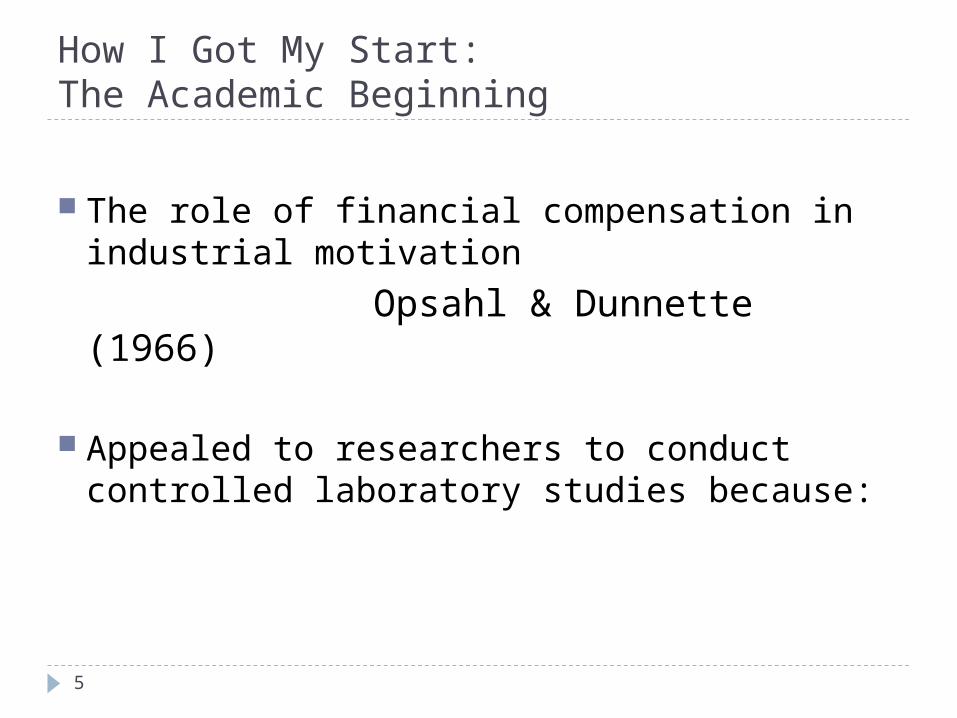
Profit sharing is the most prevalent of the variable pay plans
Also represents the “other end of the continuum” from individual incentives with respect to two very important variables that affect performance Number of individuals whose performance
contributes to the determination of how much money each employee gets
Disbursement system - how frequently the money is disbursed
So I am going to analyze this system, and you can do similar analyses for the ones “in between”

SO7: Essential features of profit sharing
26
When annual profits are above a predetermined level, part of those profits are distributed to employees
Formulas for distribution are quite complicated, but usually the amount of money that is distributed to any one employee is based on a percentage of the employee’s salary, thus employees do NOT get the same amount
The money is usually distributed annually, or more commonly, placed directly into the employee’s retirement account (tax benefits)

SO7: The first reason why profit sharing often does not increase employee performance
27
Profits are based on the aggregate performance of all members of the organization. Thus (depending upon the size of the company) one person’s performance contributes only a very small proportion to the total performance of the organization. Hence a person’s performance is not strongly related to his/her pay. Even with only 100 employees, any one
individual’s performance contributes only 1% to the total performance of the organization
In small companies, however, profit sharing might just affect performance
(in sos, but not explained adequately for the exam; mistake - it’s not that everyone gets a small $$)

SO7: The second reason why profit sharing often does not increase employee performance
28
Profits are often affected by factors that (a) have little to do with the performance of individuals and (b) are outside of their control such as Mergers, acquisitions, building a new factory or
plant, investment of funds in research, product recalls making bonuses uncertain and the amount unpredictable (include these examples in your answer) Union National Bank - the performance of the proof
operators actually had little to do with the overall profitability of UNB
(what is the main factor that influences bank profits?)

SO7: The third reason why profit sharing often does not increase employee performance
29
Annual distribution of profit-sharing bonuses or distribution of money into retirement accounts Simply too delayed to have much effect on
performance

Percentage of Base Pay or Total Pay Earned in Incentive Pay
30 (next several SOs relate to the incentive percentage studies)

Percentage of Incentive
31
In most incentive systems employees receive a base pay and can earn additional money in incentives when performance exceeds a specified standard
Given that the total amount that can be earned remains constant, as the percentage increases, more of a person’s pay becomes dependent upon performance

Incentives as a Percentage of Total Pay
Total PayTotal Pay Percentage Percentage of Incentiveof Incentive
Hourly PayHourly Pay Incentive Incentive PayPay
$10.00$10.00 0%0% $10.00$10.00 $0.00$0.00
$10.00$10.00 25%25% $7.50$7.50 $2.50$2.50
$10.00$10.00 50%50% $5.00$5.00 $5.00$5.00
$10.00$10.00 75%75% $2.50$2.50 $7.50$7.50
$10.00$10.00 100%100% $0.00$0.00 $10.00$10.00
32

Percentage of Incentive Studies:Main Research Questions (NFE)
33
What is the lowest percentage of incentive pay that affects performance?
Do different percentages of incentive pay affect performance differently?

SO10: What’s the “magic” percentage of incentive according to compensation experts?
34
Magic number is 30% Performance will not be affected if the
percentage is less than 30% Performance will not be appreciably higher if
the percentage is greater than 30%
(but in article; based on tradition - WWII, war labor relations board)

35
Authors Subjects Task Percent of total or base pay
Riedel et al.(1988)
Collegestudents
Formscoded
0%, 25%, 50% 75%, 100%, 125% of base pay
Frisch &Dickinson(1990)
Collegestudents
Partsassembled
0%, 3%, 11%, 20%, 35% of total pay (0%, 10%, 30%, 60%, 100%of base pay)
Dickinson &Gillette(1993)
Collegestudents
Dataentry,computer
27%, 100% of total pay
LaMere et al.(1996)
Truckdrivers
Job pointsearned
0%, 3%, 6%, 9%of total pay
Matthews &Dickinson(2000)
Collegestudents
Qualityinspection,computer
0%, 10%, 100%of total pay

SO11 : Employee perceptions of fairness of incentive percentages
36
If employees do not have a high degree of control over their performance, why are they likely to perceive high percentages of incentive to be unfair? And perhaps even moderate percentages? A sizable portion of their total earnings will be
based on those factors, and further, If those factors fluctuate from day to day or
week to week, their earnings will not be predictable People have fixed living expenses:
Apt rent or home mortgage Car payments Expenses for kids

Frisch & Dickinson, 1990
37
Participants: 75 college students Five conditions
Hourly pay: (0% of pay) Incentives:
Planned: 10%, 30%, 60%, or 100% of base pay Actual: 3%, 13%, 25%, 54% of base pay (can’t calculate
this until after the study is over and you know how much participants actually earned - we assumed participants would perform better than they did)
Sessions: Fifteen 45-minute sessions Task: Simple assembly task
Assembling parts from bolts, nuts and washers Measure: Number of correctly assembled
parts

Summary of Results: Frisch & Dickinson
38
Participants who were paid incentives performed significantly better than those who were paid hourly
Participants who were paid incentives performed comparably, regardless of the percentage 3%, 13%, 25%, and 54% of base pay
(graph next)

39
Hourly payHourly pay
Incentive pay
25%54% 3%13%
Mean n
um
ber
of
qualit
y p
art
s
Sessions

40
SO13A: The relationship between the SO13A: The relationship between the amount of pay earned and the percentage of amount of pay earned and the percentage of incentiveincentive
0%3%
13%25%
54%
Least $$
Most $$
Inverse relationship between the amount earned and incentive percentage
Sessions
Mean d
olla
rs e
arn
ed

SO13B: Why is that relationship important?
41
It helps answer the following two questions: Did people perform better because they earned
more money? In other words, does the total amount of money earned
affect performance? Is that a critical determinant of performance?
Did people perform better because they received more money per piece (per part assembled?) In other words, does the amount of the per piece
incentive affect performance?
(students have had trouble with this so in the past, so I want to start with this material - the actual answers are on the next slide)

SO13B: So, why is that relationship important?
42
Participants who earned incentives made less money than those who were paid hourly, but performed significantly better; thus the total amount of money earned cannot account for the higher performance
Participants in the four incentive groups received different per piece incentives, yet they performed the same, thus the per piece incentive did not affect performance
(in the past, this has given students some trouble; material in italics is important)

SO14: Frisch & Dickinson:Particularly Interesting Results
43
Those who received only 3% of their base pay in incentives - only 11¢ per 45-minute session - performed significantly better than those paid hourly
Higher percentages of incentives did not result in better performance - rather participants who earned different percentages of incentives performed the same

LaMere et al. Field Study, 1996, intro
44
There is actually only one study objective for the exam over this study, but it was a very important study from our perspective
In Frisch & Dickinson we had found that a very low incentive percentage (3%)
significantly increased performance and higher incentive percentages did not increase
performance Was that an artifact of the study being conducted
in the laboratory? In the LaMere et al. field study we were able to
examine the effects of three incentive percentages (3%, 6%, and 9%) on the performance of actual workersSO15: Lowest and highest incentive percentage examined?

LaMere et al. Field Study, 1996, intro
45
Participants: 22 roll-off truck drivers Deliver large waste disposal dumpsters to
commercial and construction sites Multiple baseline design across 2 groups
Hourly pay: G1, 20 weeks; G2 34 weeks 3% incentive: G1, 28 weeks, G2: 15 weeks 6% incentive: Both groups, 39 weeks 9% incentive: Both groups, 107 weeks
(collected data for almost 4 years!)

Roll-off Trucks
46

LaMere et al. Field Study
47
Incentive pay Per job incentive for above average weekly
performance Controlled for different types of jobs and the
number of miles driven Lost incentives for the week for a chargeable
accident Received as part of weekly paycheck, but the
amount of incentives was listed separately on the pay stub
Feedback Daily self-recorded feedback Group performance was graphed weekly and
publicly posted

Results: LaMere et al.
48
Both groups significantly increased their performance when the incentive system was introduced
Both groups maintained their high performance for the rest of the study (almost 3 years)
Both groups performed comparably when paid 3%, 6% and 9% incentives
Conclusions: LaMere et al.
49
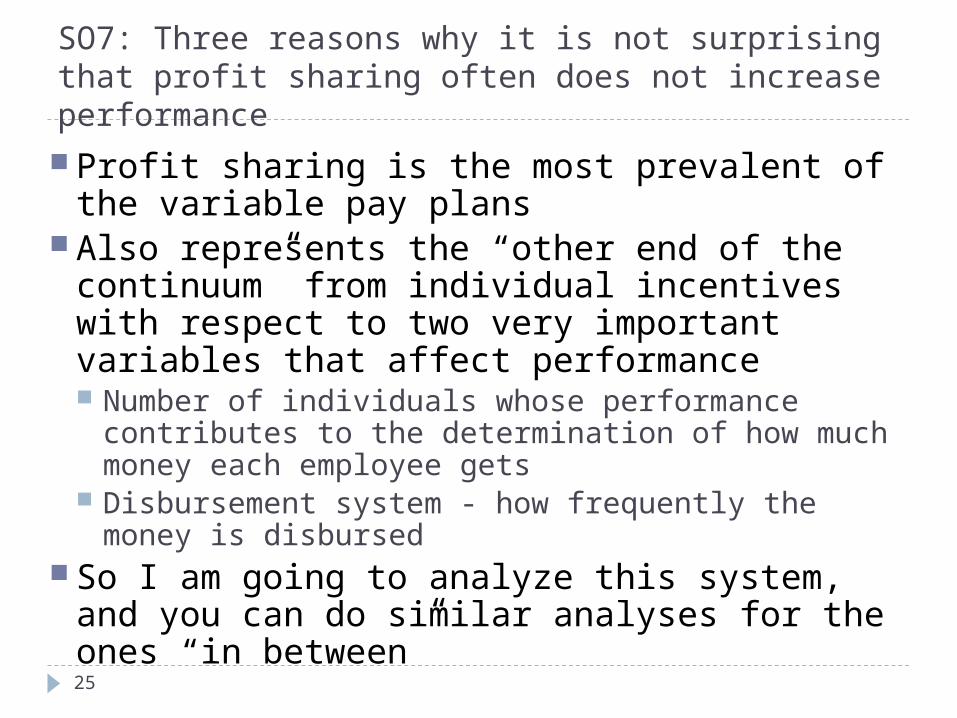
Results supported our laboratory study Small percentages of incentives, as low as 3% of
total pay, can significantly increase performance Higher percentages do not result in incrementally
better performance Small percentages of incentives can sustain
performance over time (3%-9%)

SO17: Conclusions: Percentage of Incentive Studies
50
Results of all five studies were consistent (3% - 100% of total pay) Different incentive percentages resulted in the
same level of performance: that is, higher incentive percentages have not increased performance more
Low percentages of incentive, as low as 3%, have significantly increased performance
(I realize this is basically the same answer as the answer to SO14: why the results of Frisch & Dickinson were particularly interesting - but I wanted youto note those results before we got to this point in the article.)

SO17: Contrasting results, Oah & Lee, 2011 (this part of the SO, NFE)
51
Workers in a simulated study (N=4) were more productive when they earned 100% of their pay in incentives than when they earned 10% of their pay in incentives
Conducted the study because they felt our laboratory simulation was faulty Our sessions and study were too short
In this study 4 participants attended 30 six-hour sessions Our alternate off-task activities (computer games) were not
sufficiently reinforcing (if there is nothing else interesting to do, participants may spend all of their time “working” which may mask any differences between/among incentive amounts) Allowed access to the internet Selected two pairs of friends who worked at the same time
to increase the likelihood of socializing as an off-task activity
(doesn’t account for LaMere et al. but % increases were not experimentally controlled)

SO17: Contrasting results, Oah & Lee, 2011 (this part of the SO, NFE)
52
Different results may be due to the fact that actual percentage of incentives for the 10% group was too low Ps in that group actually only earned an average of
1.6% of their pay in incentives 1.6% incentives were too low: 2 Ps performed the same
under 1.6% and hourly; and when group data were statistically analyzed, no statistically significant difference between 1.6% and hourly
Different results may be due to his experimental design which was an alternating treatments design – contrast effects Within-subject vs. group designs: Komaki & Goltz, 2001 Important research question that needs to be examined
(interesting to follow-up; moving to schedules of reinforcement)

Schedules of Reinforcement, intro
53
Results of comparisons of different schedules of delivery (reinforcement) are ambiguous at best
Although incentive pay increased performance in 7 of 8 studies, no uniform differences emerged as a function of the schedule of delivery
The preponderance of data from well controlled laboratory studies, absent implementation problems in the field, suggest that different ratio schedules of delivery result in comparable performance

SO19: Two factors that could account for the performance differences in applied studies of ratio schedules (give example)
54
Although the data suggest that performance does not differ under different schedules of delivery, sometimes performance has been better under one schedule than another These differences have occurred only in applied
settings, not well controlled laboratory studies What are the two factors?
Rule statements Social contingencies

Example
55
Results were very different in two very similar studies that compared hourly pay with a VR schedules In one workers performed better when paid hourly
than when they received the incentives (Yukl & Latham, 1975)
In the other workers performed better when they received the incentives than when they were paid hourly (Latham & Dossett, 1978: study from last week)

Yukl & Latham: Hourly pay better
56
Participants were tree planters Received a base pay $4.00 on a “VR2” for planting a bag of trees
“VR2” was achieved by tossing a coin and having workers guess “heads” or “tails” Workers had a one-in-two (50%) chance of getting the
$4.00 each time, which probabilistically equals a “VR2” schedule

Yukl & Latham: Hourly pay better
57
Several workers believed that the coin toss was gambling and the “devil’s doing” and sinful
One of the supervisors was a part-time minister who also believed the above, and thus did not always implement the coin toss as planned
One worker believed management had cheated her on her taxes with respect to the incentives and told others Management had made a mistake but by the time it was
discovered and fixed, the study was over What the workers said about the incentives:
The VR schedule was “unfair” “Too much of a risk” “ A real let-down to lose after you have planted 1,000 trees”
(one bag = 1,000 seedlings)
(study conducted in the Bible belt in the south; yet in the other study…..)

Latham & Dossett: Incentives better
58
Participants were from the same company, but were beaver trappers
Received a base pay $4.00 on a VR4 schedule for each beaver
trapped VR4 was achieved by placing four different
colored marbles in a bag and having workers guess the color of the marble before they drew one Workers had a one-in-four (25%) chance to be correct,
which probabilistically equals a VR4

Latham & Dossett: VR Incentives better
59
All workers gathered around while a worker “guessed” the color of the marble and cheered when he guessed correctly
What the supervisor said about the variable schedule The guys want to get on the variable schedule. The
men are inspired by it. They get a real kick out of it. What the workers said about the schedule:
We really get psyched out by the variable, man Like the variable, it adds something to the job It makes the job more exciting and fun; there is
real excitement

SO20: Oah & Dickinson:Linear vs Accelerated Piece Rate Pay
Four generations of behavior analysts, ABAI, 2009!
60
Rich O’Brien,My undergraduate advisor
Shezeen Oah,My first Ph.D. student
Dr. Oah’sGraduate studentsChung Ang UniversitySeoul, Korea

SO20: Oah & Dickinson:Linear vs Accelerated Piece Rate Pay
61
Does accelerated incentive pay affect performance differently than linear incentive pay? Linear incentive pay: The employee earns the
same incentive pay regardless of how productive he/she is
Accelerated incentive pay: The employee earns more and more incentive pay the more
productive he/she is
(SO: results - introduce the article)
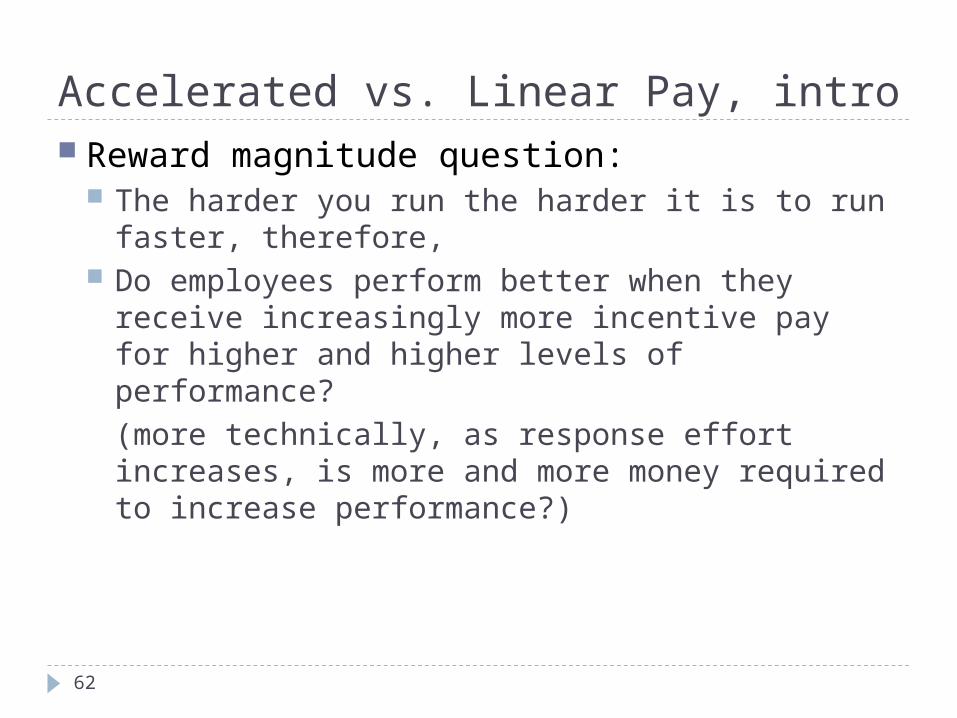
Accelerated vs. Linear Pay, intro
62
Reward magnitude question: The harder you run the harder it is to run faster,
therefore, Do employees perform better when they receive
increasingly more incentive pay for higher and higher levels of performance?(more technically, as response effort increases, is more and more money required to increase performance?)

Oah & Dickinson, 1992, intro
63
Modeled after the proof operator incentive system at Union National Bank
Participants: 40 college students Task: Data entry task
Checks of different cash values were presented on the computer screen and Ps entered the cash values

Oah & Dickinson, 1992, intro
64
Two conditions Linear relation between performance and pay
Incentive amount remained the same 1.5 exponentially-increasing relation between
performance and pay Sessions: Fifteen 45-minute sessions Measure: Number of correctly completed
checks

65

SO20: Results and important conclusions
66
Results Participants in the two groups performed comparably Participants in the 1.5 exponential group earned
significantly more money Conclusions
Linear and accelerated incentive pay did not affect performance differently (more piece rate pay was not better)
The amount of incentive pay did not affect performance differently (similar to the incentive percentage studies)
(again, for some reason, a few students have missed this)

SO21: Two factors that influence satisfaction ratings with different types of incentive pay plans
67
Exposure to all of the pay systems you are going to ask employees about (behavioral choice is the best method to obtain satisfaction data) If you use a between group design and each participant is
exposed to only one pay system and then asked to rate his/her satisfaction with it, you get different ratings than if each participant is exposed to all pay systems before rating his/her satisfaction with it
Makes sense - participants can only make meaningful ratings and comparisons after exposure to the different pay systems
Probably true for other types of interventions as well - not just pay systems, so it is a good thing to keep in mind when doing research
(no consistent data with respect to employee satisfaction with different types of pay systems - fixed vs incentive or different types of incentive pay)

SO21: Two factors that influence satisfaction ratings with different types of incentive pay plans
68
The amount of money employees earn under the different pay systems - not surprisingly, “The pay system I like best is the one where I earn the most money.” It is VERY difficult to equalize the amount of money
individuals earn under various pay conditions and systems The optimal situation would be where a person earns, let’s
say, $6.00 an hour when paid hourly and $6.00 an hour when paid incentives
With incentive systems, however, a person’s performance determines how much he or she will earn, and it is very hard to predict how well a person will perform when you are setting up the incentive rates at the beginning of a study
(this is very influential factor and one that makes it difficult to assess employee satisfaction with different pay systems)

SO22: Do results from the lab generalize to actual work settings?
69
Reviews of incentive studies, though few in number, have indicated that the results of field studies and laboratory studies are similar Jenkins (1986), Jenkins, Mitra, Gupta & Shaw (1998) Hantula (2001) Anderson, Lindsay, & Bushman (1999)
We have found similarities as well Frisch & Dickinson (1990) LaMere, Dickinson, Henry, Henry & Poling (2000)
In both, performance increased significantly when participants received only 3% of their total or base pay in incentives
In both, higher percentages of incentives did not increase performance further
(as I indicated earlier - important!!)

SO22: Also true for other IVs in IO
70
Locke, E. A. (1986) (Ed.). Generalizing from laboratory to field settings. Lexington, MA: D.C. Heath & Company Each article in the book analyzed the extent to which the
results of laboratory and field studies were similar for a particular performance improvement intervention
When there was sufficient data to make the comparison, every review reported that the results in laboratory and field settings were similar
True for monetary incentives, feedback, goal setting, training, participation (among others)
Interestingly, the author who reviewed feedback (Kopelman) reported that while the general effects of feedback were the same in both settings, the effects of feedback were actually less in lab studies; that is, the results from the laboratory underestimated the extent to which feedback affected performance in actual work settings This makes sense - why, based on what you learned about
feedback in U4 and U6?(next slide, quote from Locke)

SO22: Quote from Locke, p. 6 (NFE)
71
Both college students and employees appear to respond similarly to goals, feedback, incentives, participation, and so forth, perhaps because the similarities among these subjects (such as in values) are more crucial than their differences. Task differences do not seem to be overwhelmingly important. Perhaps all that is needed is that the participants in either setting become involved in what they are doing.
(handy book to know about)

SO23: Honeywell-Johnson et al. article
72
Purpose of the study (NFE) To compare the effects of individual and small
group monetary incentives on the performance and satisfaction of high performers
(we examined small group incentives, but results may well generalize to any type of performance consequence that is dependent upon the group’s performance:grade on a project or in a class?? This is why I added group incentives to Aamodt’s classification of individual and organizational: to us, size of group is important)

SO23A: Conceptually why might individual incentives control performance more effectively than small group incentives?
73
When individuals are paid individual incentives, the amount of pay they earn is directly dependent on their own performance. Thus, they have complete control over what they earn
With small group incentives, the amount of pay workers receive is not only dependent on their own performance, but on the performance of others in the group. Thus, they can’t influence their earnings to the same extent as they can when they are paid individual incentives
(both points are important)

SO23B: On the other hand, why might small group incentives control performance just as well as individual incentives?
74
When the group is small, certainly when the group is only 2 – 3 members, the individual can still greatly influence the performance of the group, and hence his or her pay. There is still a pretty tight contingency between performance and pay (Malott’s certainty factor?).
But, as the group size increases, the individual’s contribution to the group’s performance becomes less and less, and earnings are not as contingent upon performance

SO24: Summarize the results of studies that have compared individual incentives and equally-divided small group incentives, intro
75
Equally-divided small group incentives are the most common type of small group incentives in business and industry
The incentives that a person gets depends upon how well the entire group performs
Each individual in the group gets the same amount of incentive, regardless of his or her contribution For example, if a group completes an average of 100
widgets per hour during the week, each member earns an additional $100.00 per week in incentives ($1.00 per widget in the average) If one worker averages only 90 widgets per hour and another
averages 110, they both get the same amount of incentive

SO24: Summarize the results of studies that have compared individual incentives and equally-divided small group incentives (for exam)
76
Only five studies have compared performance when individuals were paid individual incentives and when they were paid small group incentives
Groups have ranged in size from 2 - 12 members In 4 of the 5 studies, equally-divided small group
incentives sustained performance as well as individual monetary incentives
While there are not a lot of satisfaction data available, when satisfaction was examined, participants reported that they were equally satisfied with the individual and small group incentives
(include range of participants in the small groups in these studies - this is important)

SO25A: When would an individual be expected to perform the same when paid individual incentives and small group incentives and why?
77
When all members of the small group, including the individual, perform at approximately the same level
Why? If all group members perform at approximately the
same level, then their pay would not differ much when they were paid individual incentives and when they were paid small group incentives
(this seems to be a difficult notion for students to understand: example on next slide)

SO25A: ExampleSorry about the “clutter.” Neither J. Bailey and D. Johnson would be happy with me, but some things need to be on one pg.
78
If all group members perform at approximately the same level, then their pay would not differ much when they were paid individual incentives and when they were paid small group incentives Assume: under the individual incentive condition, a person is
paid 10¢ per widget assembled. If the individual assembled 50 widgets, he or she would earn $5.00 in incentive pay
Assume: under the group incentive condition, each individual gets paid 10¢ per widget based on the average performance of the members of the group. If each individual in a 5-person group assembled 50 widgets the total number of widgets assembled by the group would be 250, and the individual would still earn $5.00 in incentive pay 250/5 = 50, 50 X 10¢ = $5.00
Essentially, the pay contingency is the same for the above individual whether or not he or she is paid individual or small group monetary incentives. We analyze contingencies from the perspective of the behaver.
(we know, as does the individual of course, that they are being paid either individual or small group incentives, but if they get paid the same, the contingencybetween their performance and pay is the same under both pay systems)

SO25B: When would an individual be expected to perform better when paid individual incentives and perform worse (decrease performance) when small group incentives? Why?
79
When an individual was a high performer in comparison to the other members in the group
Why? A top performer would earn less money when he
or she was paid small group incentives than when she or she was paid individual incentives because of the lower performance of the other members of the group
Hence, over time, the high performer may decrease his or her performance because his or her earnings decrease
(example on the next page)

SO25B: Example
80
Assume: under the individual incentive condition, a person is paid 10¢ per widget assembled. If the individual assembled 50 widgets, he or she would earn $5.00 in incentive pay
Assume: under the group incentive condition, each individual gets paid 10¢ per widget based on the average performance of the members of the group. Also, now assume each of the other individuals in a 5-person group assembled 35 widgets. The total number of widgets assembled by the group would be 190 (4 members X 35 = 140, plus the 50 widgets assembled by the top performer). The individual would only earn $3.80 in incentive pay. 190/5 = 38, 38 X 10¢ = $3.80
Our top performer thus may perform lower when paid small group incentives than when paid individual monetary incentives Recognizing of course that if he or she did increase performance, he or
she would earn even less money in incentives. For example, if our top performer now only assembled 35 widgets, he or she would earn only $3.50 in incentive pay - however, the small difference between $3.50 and $3.80 might not be sufficient to keep our top performer making 50 widgets

Honeywell-Johnson et al., intro (NFE)
81
Participants were 4 college students Task was a computerized task with four
sub-tasks presented simultaneously Memory task, arithmetic task, visual monitoring
task and an auditory monitoring task DV: points earned for correct responses Design: ABCB, 5-10 2-hour sessions per
phase A = hourly pay with feedback B = individual incentives with feedback C = small group monetary incentives

Honeywell-Johnson et al., intro (NFE)
82
Group incentive condition Participants were told that they were members of
a 10-person group and their data would be combined with the point scores of the other nine members to determine the amount of incentive Worked on networked computers to increase
“believability” of this deception At the end of the study, each participant was asked how
many members were in their group, and all responded “10”
Their comments (some rather nasty and hostile) during the group incentive condition indicated they believed they were in a group of 10
The group’s average performance was contrived/calculated in a manner that insured that the participant’s performance was always quite a bit higher than the group’s average performance

SO26: Results of the study and what they indicate
83
Three of the four participants performed an average of 14% lower (12%, 14%, and 16%) when they were paid small group monetary incentives than when they were paid individual incentives
The data suggest that high performers are indeed likely to decrease their performance when paid small group monetary incentives (with N=10 members)

SO27
84
27A: Which of the three pay systems did all four high performers prefer? All preferred the individual monetary incentive
system Even though they found the individual incentive system to
be more stressful than the hourly pay condition (which was the least stressful of all three)
All four said they preferred the individual monetary incentive system because they earned the most money While this is a confound - it is also the case that in actual work
settings high performers would always earn more when they were paid individual incentives than when they were paid small group incentives, so I am not overly concerned about this confound
27B: Which of the three pay systems did the majority of performers (3 of 4) find to be the most stressful? The small group monetary incentive system

SO27, NFE, but interesting…
85
The preference data are interesting Most people would probably assume that the
individual incentive pay would be the most stressful of the three pay systems, yet three of the four reported that the group incentive system was the most stressful
Also, in spite of the fact that three of the four participants found the hourly pay to be the least stressful, all four preferred the individual incentive pay
We have confirmed the effects of group incentives on high performers in a subsequent study conducted by Dr. McGee as her doctoral dissertation. It has been published in the Performance Improvement Quarterly (ISPI funded the research)

Incentives – new directions Incentive programs in human service
settings Still very rare
Vince Carbon, Carbone Clinic, Valley Cottage, NY Center for autism Began an incentive program for staff in 2005 Staff can earn up to $300 per month in incentive
pay, $3600 a year I am going to present the details of this in U8
86 (Trumpet, next slide)

Incentives – new directions Linda LeBlanc, Clinical Director, Trumpet
Behavioral Health Centers for autism, primarily in the west
21 locations in AZ, CA, CO, Hawaii, MO, OH She and I interacted for over a year re the design of an
incentive system for staff; hired one of my former MA students as an OBM person – eventually I expect this to happen
Carl Sundberg, Behavior Analysis Center for Autism Four centers for autism, Indiana Contacted me and is pursuing implementation of an
incentive system for staff (I referred him to Vince)
Interesting: all are centers for autism; may have to do with funding of services.
87

Incentives – new directions for research
88
Monetary vs. non-monetary incentives that have “cash” value Merchandise programs, travel, pre-paid debit cards –
almost no research whatsoever Pre-paid cards easy substitute for $$ - are they really different?
Open-loop vs. closed-loop pre-paid cards None examining effect of cash vs. non-cash on
performance using a “behavioral” incentive program Trophy value of non-cash rewards (i.e., merchandise, travel)
Spot (give-and-go) awards or bonuses vs. long-term program in which “if-then” is clarified in advance
Incentives for wellness programs – this has become a very big industry over the past few years
(A lot of executives in reward industry advocate short-term programs with noncash incentives;Prevents it from becoming part of regular compensation, too difficult to change)

Incentives – interesting things to know
89
A 2007 World at Work survey of 300 private companies ~80% of respondents have short-term incentive plans
52% of those have one plan, the rest have two or more in place
Types of plans: bonus, individual, profit-sharing, team/unit/small group Bonuses and individual incentives were awarded most frequently
to executives and managers Only ~33% have long-term incentive plans
73% of those have only one long-term plan Types of plans include stock options (33%), performance
plans (33%), phantom stock, stock appreciations rights, and restricted stocks are used to a lesser degree
(Phantom stock?? be careful, when we talk about incentives and incentive plans, we are often not talking about the same thing aspeople in business or people in the “incentive business” – consultants; I carefully restricted my work)

90
QUESTIONS OR COMMENTS?
For more on incentive pay and organization-wide systems:
Abernathy, W. B. (2011). Pay for profit: Designing an organization-wide performance-based compensation system. Atlanta, GA: Performance Management Publications, Inc.
(Personal note: Bill is my hero!)
(ADI)

Theory behind profit-sharing
91
Profit-sharing was not originally developed to increase employee performance; rather it is based on “macro-economic theory” (good of the company and the society)
Profit-sharing would increase the flexibility of labor costs for organizations (not decrease labor costs) When profits went up, labor costs would go up When profits went down, labor costs would go down
When profits were down, profit-sharing was supposed to protect the company by automatically decreasing labor costs
Protect the employees because the company could afford to keep more employees rather than lay them off
Ultimately, both of the above would protect the country’s economy Fewer people would lose their jobs and prevent the economy
from a deeper recession

However, the catch….
92
Cost savings to companies was based on the notion that the base wages of employees would be below market value. When profits were high, employee wages would be above market value; when profits were low, employee wages would be below market value. It has not worked out that way - rather predictably, perhaps, profit-sharing has become “gravy.” Base salaries are at market value, so companies do pay out more when profits are good, but don’t recoup sufficient labor costs when profits go down.


![AMD Radeon™ HD 6450 - HISdigital1]… · Use of this copyright protection technology must be ... latest documentation. ii AMD Radeon™ HD 6450 ... 4.1 AMD Radeon HD 6450 Connections](https://static.fdocuments.us/doc/165x107/5b2d59c87f8b9ab66e8bd1cc/amd-radeon-hd-6450-1-use-of-this-copyright-protection-technology-must.jpg)