PSY 511 Repeated-Measures ANOVA - Zeigler-Hill · • Sphericitycan be evaluated when there are...
13
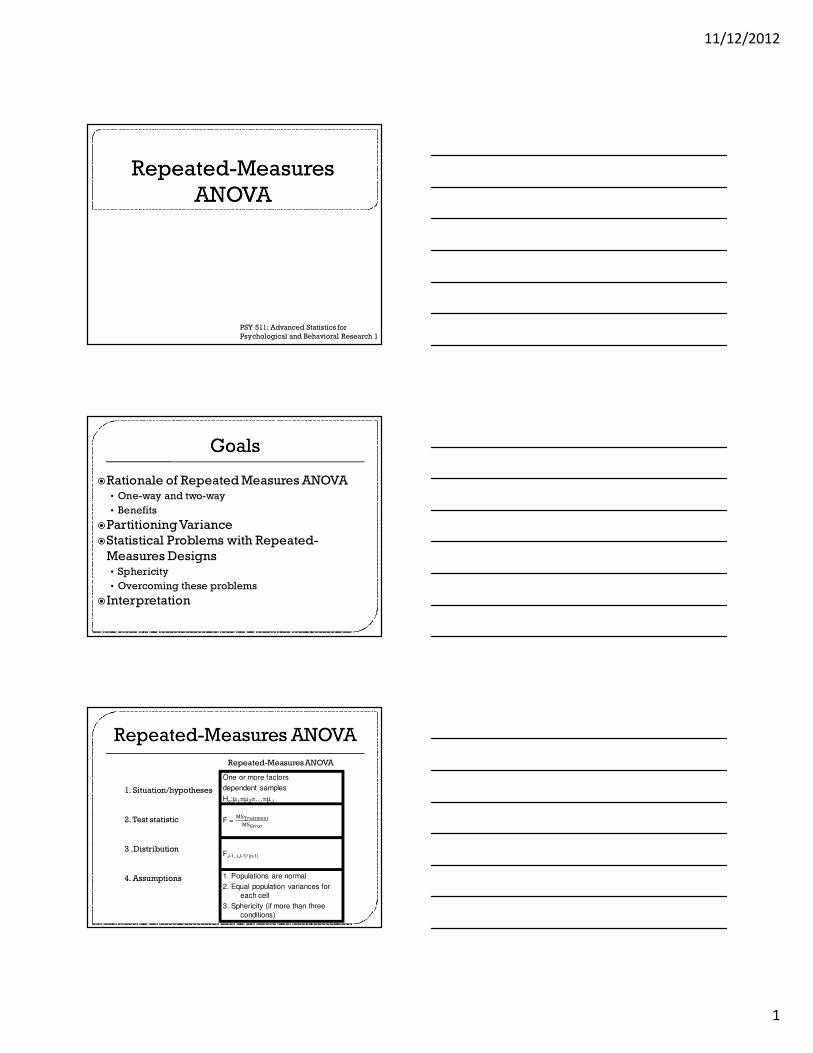
11/12/2012 1 PSY 511: Advanced Statistics for Psychological and Behavioral Research 1 Rationale of Repeated Measures ANOVA • One-way and two-way • Benefits Partitioning Variance Statistical Problems with Repeated- Measures Designs • Sphericity • Overcoming these problems Interpretation 1. Situation/hypotheses 2. Test statistic 3 .Distribution 4. Assumptions One or more factors dependent samples H o :μ 1 =μ 2 =…=μ J F = F J-1, (J-1)*(n-1) 1. Populations are normal 2. Equal population variances for each cell 3. Sphericity (if more than three conditions) Repeated-Measures ANOVA
Transcript of PSY 511 Repeated-Measures ANOVA - Zeigler-Hill · • Sphericitycan be evaluated when there are...
11/12/2012
1
PSY 511: Advanced Statistics for
Psychological and Behavioral Research 1
�Rationale of Repeated Measures ANOVA• One-way and two-way
• Benefits
�Partitioning Variance
�Statistical Problems with Repeated-
Measures Designs• Sphericity
• Overcoming these problems
�Interpretation
1. Situation/hypotheses
2. Test statistic
3 .Distribution
4. Assumptions
One or more factors
dependent samples
Ho:µ1=µ2=…=µJ
F = ����������
������
FJ-1, (J-1)*(n-1)
1. Populations are normal
2. Equal population variances for
each cell
3. Sphericity (if more than three
conditions)
Repeated-Measures ANOVA
11/12/2012
2
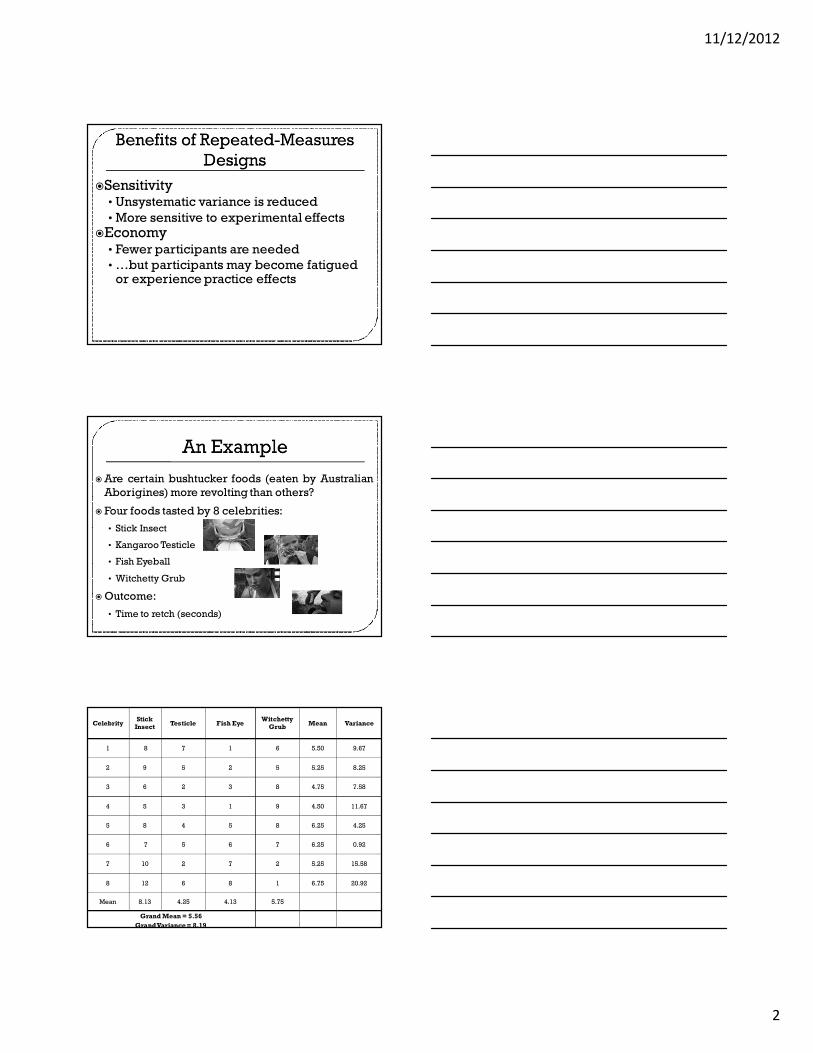
�Sensitivity• Unsystematic variance is reduced
•More sensitive to experimental effects
�Economy• Fewer participants are needed
•…but participants may become fatigued or experience practice effects
�Are certain bushtucker foods (eaten by Australian
Aborigines)more revolting than others?
� Four foods tasted by 8 celebrities:
• Stick Insect
• KangarooTesticle
• Fish Eyeball
• Witchetty Grub
�Outcome:
• Time to retch (seconds)
CelebrityStick
InsectTesticle Fish Eye
Witchetty
GrubMean Variance
1 8 7 1 6 5.50 9.67
2 9 5 2 5 5.25 8.25
3 6 2 3 8 4.75 7.58
4 5 3 1 9 4.50 11.67
5 8 4 5 8 6.25 4.25
6 7 5 6 7 6.25 0.92
7 10 2 7 2 5.25 15.58
8 12 6 8 1 6.75 20.92
Mean 8.13 4.25 4.13 5.75
Grand Mean = 5.56
Grand Variance = 8.19
11/12/2012
3
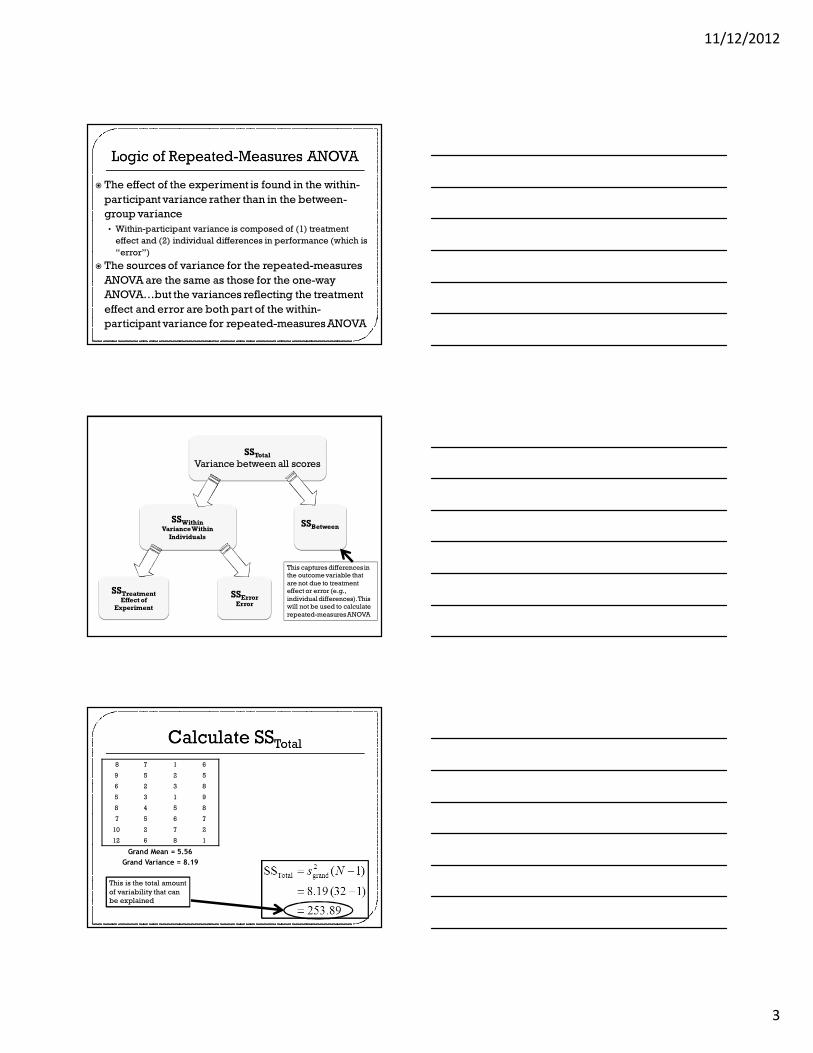
� The effect of the experiment is found in the within-
participant variance rather than in the between-
group variance
• Within-participant variance is composed of (1) treatment
effect and (2) individual differences in performance (which is
“error”)
� The sources of variance for the repeated-measures
ANOVA are the same as those for the one-way
ANOVA…but the variances reflecting the treatment
effect and error are both part of the within-
participant variance for repeated-measures ANOVA
SSTotalVariance between all scores
SSWithinVariance Within
Individuals
SSBetween
SSTreatmentEffect of
Experiment
SSErrorError
This captures differences in the outcome variable that
are not due to treatment effect or error (e.g.,
individual differences). This will not be used to calculate
repeated-measures ANOVA
8 7 1 6
9 5 2 5
6 2 3 8
5 3 1 9
8 4 5 8
7 5 6 7
10 2 7 2
12 6 8 1
Grand Mean = 5.56
Grand Variance = 8.19
This is the total amount
of variability that can
be explained

11/12/2012
4
This is the amount of
variability that is
explained by within-
participant features (i.e.,
both treatment and
error)
This is the amount of variability that
is explained by the foods
This is the amount of variability that is explained by error

11/12/2012
5
�MSTreatment = ����������
� ��������= ��.��
�= 27.71
�MSError = ������
� ����= ���.��
��= 7.30
�dfWithin = n*(J – 1) = 8*3 = 24
�dfTreatment = J – 1 = 4 – 1 = 3
�dfError = (J-1)*(n-1) = 3*7 = 21
�F = ����������
������= ��.��
�.��= 3.79
�This is conceptually similar to the one-way
ANOVA
� Same participants in all conditions
• Scores across conditions correlate
• Violates the assumption of independence
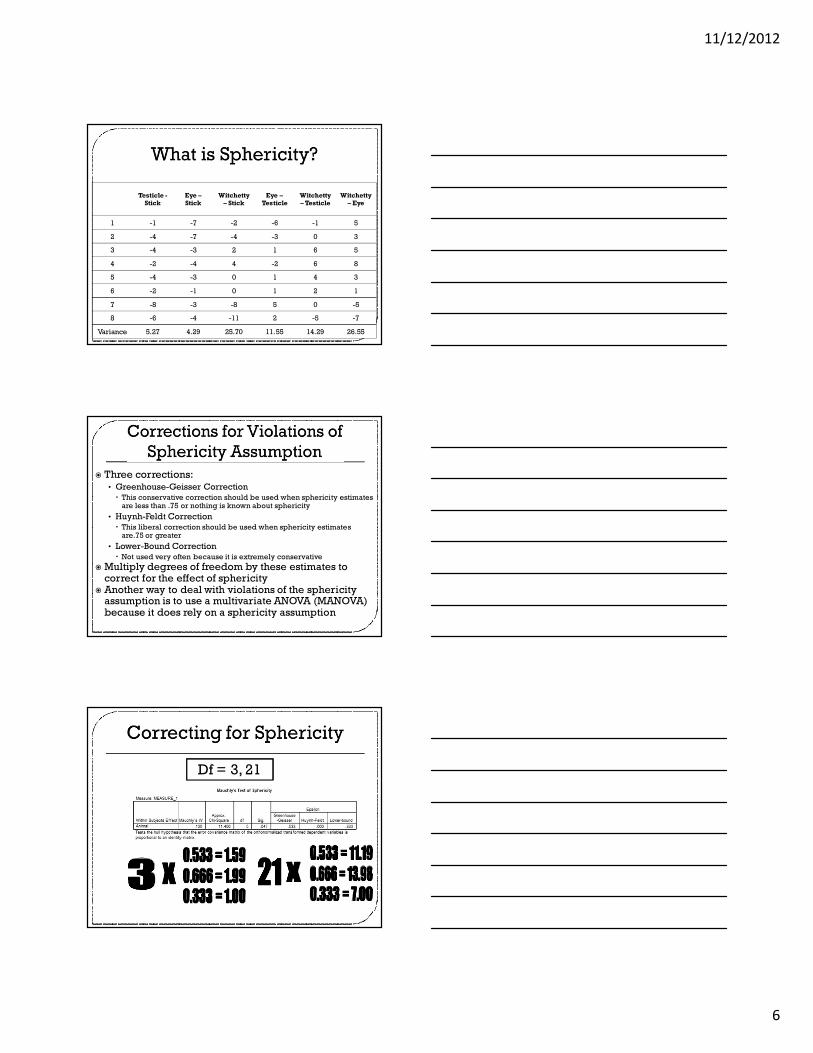
� Assumption of Sphericity
• Sphericity refers to the condition where the variances of the differences between all
possible pairs of groups (i.e., levels of the factor) are equal
• The violation of sphericityoccurs when the variances of the differences between all
combinations of the groups are not equal
• If sphericity is violated, then the variance calculations may be distorted which would
result in an inflated F-ratio
• Sphericity can be evaluated when there are three or more levels of a repeated-
measures factor and, with each additional repeated-measures factor, the risk for
violating sphericity increases
• If sphericity is violated, the degrees of freedom for the repeated-measures ANOVA
should be adjusted to correct for this violation
• Sphericity is measured using Mauchly’s test� p < .05 means that the sphericity assumption is violated
� p > .05 means that the sphericity assumption is met
11/12/2012
6
Testicle -
Stick
Eye –
Stick
Witchetty
– Stick
Eye –
Testicle
Witchetty
–Testicle
Witchetty
– Eye
1 -1 -7 -2 -6 -1 5
2 -4 -7 -4 -3 0 3
3 -4 -3 2 1 6 5
4 -2 -4 4 -2 6 8
5 -4 -3 0 1 4 3
6 -2 -1 0 1 2 1
7 -8 -3 -8 5 0 -5
8 -6 -4 -11 2 -5 -7
Variance 5.27 4.29 25.70 11.55 14.29 26.55
� Three corrections:• Greenhouse-Geisser Correction � This conservative correction should be used when sphericity estimates are less than .75 or nothing is known about sphericity
• Huynh-Feldt Correction� This liberal correction should be used when sphericity estimates are.75 or greater
• Lower-Bound Correction� Not used very often because it is extremely conservative
�Multiply degrees of freedom by these estimates to correct for the effect of sphericity
� Another way to deal with violations of the sphericityassumption is to use a multivariate ANOVA (MANOVA) because it does rely on a sphericity assumption
Df = 3, 21

11/12/2012
7
This is the amount of variability
that is explained by the
treatment effect
This is the amount of
variability that is explained
by error
This is the F-ratio…notice that it is the
same whether we assume the
sphericity assumption is met and or
violated (because the corrections only
adjust degrees of freedom)
If we use the Greenhouse-Geisser correction, then we would retain the null hypothesis.
However, if we had used the Huynh-Feldt, then we would have rejected the null
�Compare each mean against all others (t-tests)
� In general terms they use a stricter criterion to
accept an effect as significant
• They control the familywise error rate
• Bonferronimethod for controllingType I error:
�Two factors• Two-way = 2 factors
• Three-Way = 3 factors
�The same participants in all conditions• Repeated Measures = ‘same participants’
• This should be used to analyze data from a within-
subjects design

11/12/2012
8
�Effects of advertising on evaluations of
different drink types
• Factor A (Drink): Beer, Wine, Water
• Factor B (Imagery): Positive, Negative, Neutral
• Outcome Variable: Evaluation of product from -100
(dislike very much) to +100 (like very much)
SSTotalVariance between all
participants
SSWithinVariance explained by the
experimental
manipulations
SSBetweenBetween-
Participant
Variance
SSAEffect of
Drink
SSBEffect of
Imagery
SSA ×××× BEffect of
Interaction
SSErrorAError for
Drink
SSErrorBError for
Imagery
SSErrorA ×××× BError for
Interaction

11/12/2012
9

11/12/2012
10
The sphericity assumption is
violated for the main effect of
drink…so we should use the
Greenhouse-Geisser correction
The sphericity assumption is
violated for the main effect of
imagery…so we should use the
Greenhouse-Geisser correction

11/12/2012
11
The sphericity assumption is
met for the interaction…so we
do not need to correct the
degrees of freedom
The main effect for
drink is significant
The main effect for
imagery is
significant

11/12/2012
12
The interaction is
significant
There was a significant main effect of the type of drink for the
attitude rating, F(1.15, 21.93) = 5.11, p < .05.
Needs
MCPs to
determine
which
means are
different
There was a significant main effect of the type of imagery for the
attitude rating, F(1.50, 28.40) = 122.57, p < .001.
Needs
MCPs to
determine
which
means are
different

11/12/2012
13
There was a significant interaction between the type of
drink and the type of imagery for the attitude rating,
F(4, 76) = 17.16, p < .001.
It appears that the interaction
between drink and imagery
is due to individuals
reporting relatively positive
attitudes when they drank
beer while being exposed to
negative imagery…but this
would need to be confirmed
using post-hoc tests