PSU Web 2013: User Research Power Tool: Pareto Principle Based User Research
48
User Research Power Tool: Pareto Principle Based User Research Presented By: Jennifer Aldrich Content Strategist at Schoolwires Inc.
-
Upload
jennifer-aldrich -
Category
Technology
-
view
36 -
download
2
Transcript of PSU Web 2013: User Research Power Tool: Pareto Principle Based User Research

User Research Power Tool: Pareto Principle Based User Research
Presented By: Jennifer Aldrich Content Strategist at Schoolwires Inc.

Who are you?
Jennifer Aldrich
• Content Strategist for Schoolwires Inc.• Lover of all things UX • Twitter Addict @jma245• Blogger http://userexperiencerocks.com
I’m also...
A Mom

An Amateur Photographer

Our Plan
This is our plan of attack for today’s session:1. Discuss the Pareto Principle.2. Examine how it can be applied to user
research.3. Go through the start to finish process of how
to set up, conduct and analyze your own Pareto Principle based usability study.
4. Brainstorm industry applications & answer questions.

Part 1. What is the Pareto Principle?

Also known as the…
• 80/20 Rule• Law of the Vital Few• Principle of Least Effort• Principle of Imbalance• 80/20 Principle• Pareto Law

Pareto Principle
80% of Results 20% of Effects

Vilfredo Pareto
• Pareto realized in 1897 that the distribution of wealth in England was predictably unbalanced, and then he realized that the same was true in other countries throughout history. [1]
• He broke it down by given an example that 20 percent of the population could control 80 percent of the wealth, and so on. [1]
• It turns out that this principle can be applied to all kinds of situations in life. [1]

Joseph Moses Juran
• Juran realized that it applied to crime among criminals, accidents among dangerous processes, and tons of other situations in life [1]
• Juran also figured out that you could combine the 80/20 principle with statistics to improve industrial and consumer goods. [1]
• At first no one in the US took him seriously, so he went to Japan and made a killing.

Which companies have taken advantage of the Pareto Principle?
• IBM applied the Pareto Principle in the 60’s. They found that 80 percent of a computers time is spent using 20 percent of its operating code, so they rewrote their operating code and made the most used 20 percent very accessible and user friendly. [1]
• Apple, Lotus, and Microsoft also followed suit, applying the 80/20 rule to improve their systems and software. [1]

Why should I care?
• The reason this concept is so important is because it’s completely counter intuitive.– All features and services and problems are NOT
created equal. Some things have a gigantic impact, and identifying and resolving them can mean the difference between your product or company sinking, or swimming.

Part 2: How is this related to user research?
• My research was inspired by a blog post by Jeff Sauro: http://www.measuringusability.com/blog/pareto-ux.php
• Apply the Pareto Principle to usability research to identify the top percentage of your product pain points, then fix them!
• In my case, this ended up bizarrely accurate, 18% of our core product areas were causing 83% of our clients’ frustration! (I’ll show you the stat breakdown soon, I promise!)

Part 3: How do I set this up?

Step 1: Recruit Testers
• Who do I recruit?
– Internal Clients vs. General Public• Pros and Cons
– General Public Recruiting Services• Survey Monkey Audience

I’ve got my testers, now what?

Step 2: Create your Survey
• What tools do I need?– Survey Monkey (It’s cheap!) or equivalent
• What should I ask? – Question 1: If you could change one aspect of
our product, what would you change? • Give a list of all core content areas, allow them to
select only one.
– Question 2: How would you change it? • Make this open ended paragraph format.

Survey: Check. What’s next?
My Survey Rocks!

Step 3: Launch Your Survey
• What tools do I need?– MailChimp (It’s free or cheap!) or equivalent• Dashboard with killer stats• Great for tracking• Create lists and groups• Campaign Templates• Unsubscribe canned spam rules are handled for you

I launched it! I’m patiently awaiting responses!

I have a flood of data! What do I do with all of it?!
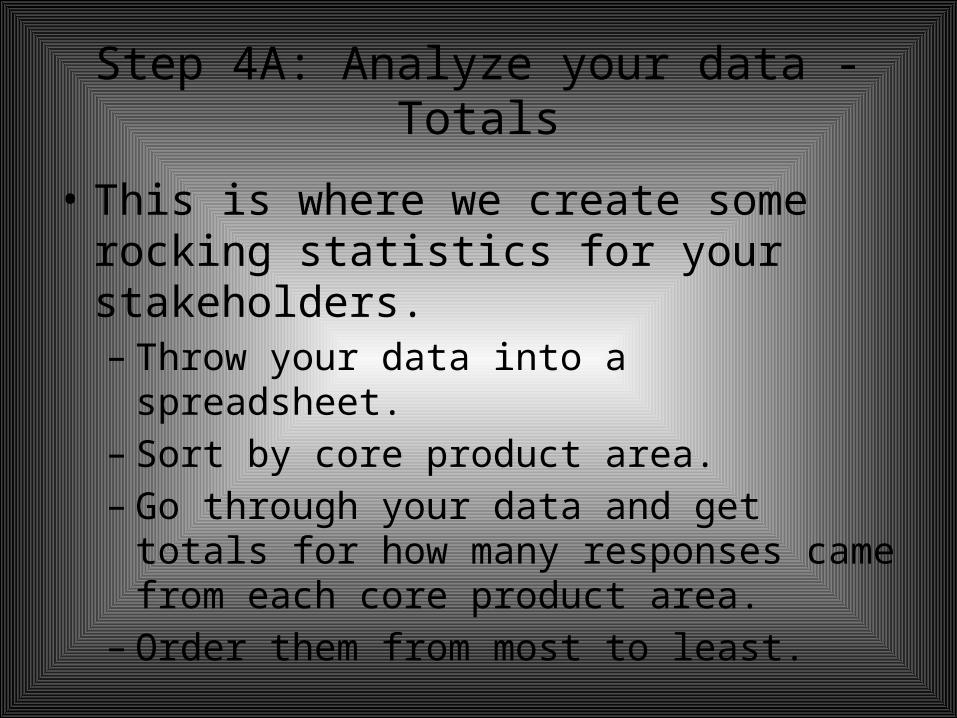
Step 4A: Analyze your data - Totals
• This is where we create some rocking statistics for your stakeholders. – Throw your data into a spreadsheet.– Sort by core product area.– Go through your data and get totals for how many
responses came from each core product area.– Order them from most to least.

It’ll look something like this:
• Headlines – 26 • Editor – 21 • Files and Folders – 21 • Forms and Surveys – 21 • Groups – 17 • Calendar – 12 • Reports - 8 • Remaining 33 Areas Total - 26
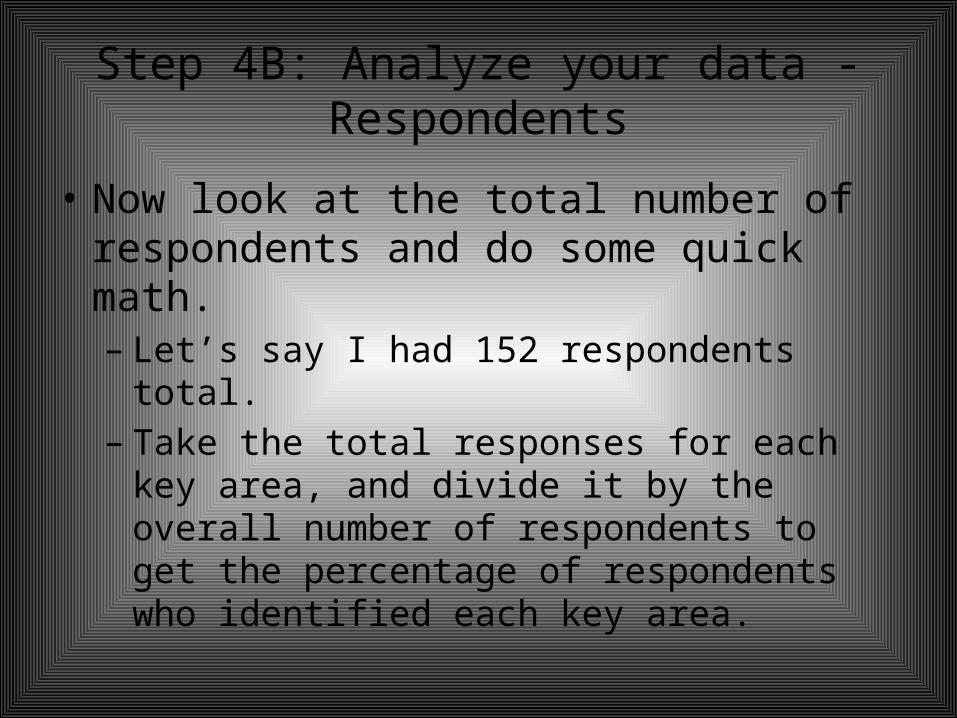
Step 4B: Analyze your data - Respondents
• Now look at the total number of respondents and do some quick math. – Let’s say I had 152 respondents total.– Take the total responses for each key area, and
divide it by the overall number of respondents to get the percentage of respondents who identified each key area.
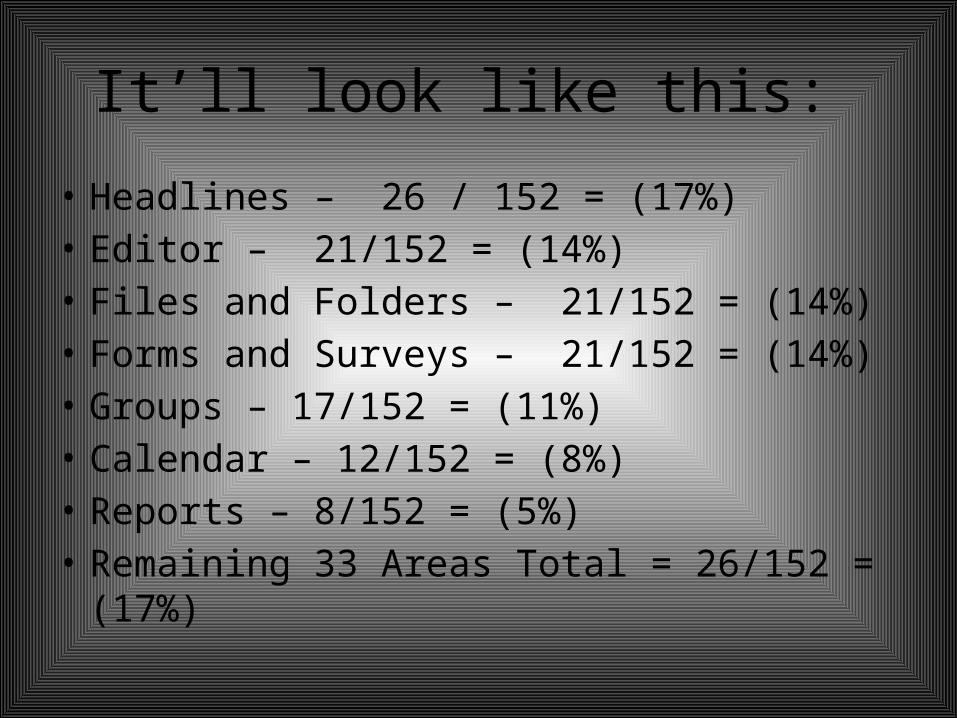
It’ll look like this:
• Headlines – 26 / 152 = (17%)• Editor – 21/152 = (14%)• Files and Folders – 21/152 = (14%)• Forms and Surveys – 21/152 = (14%)• Groups – 17/152 = (11%)• Calendar – 12/152 = (8%)• Reports – 8/152 = (5%) • Remaining 33 Areas Total = 26/152 = (17%)

Show me the data…
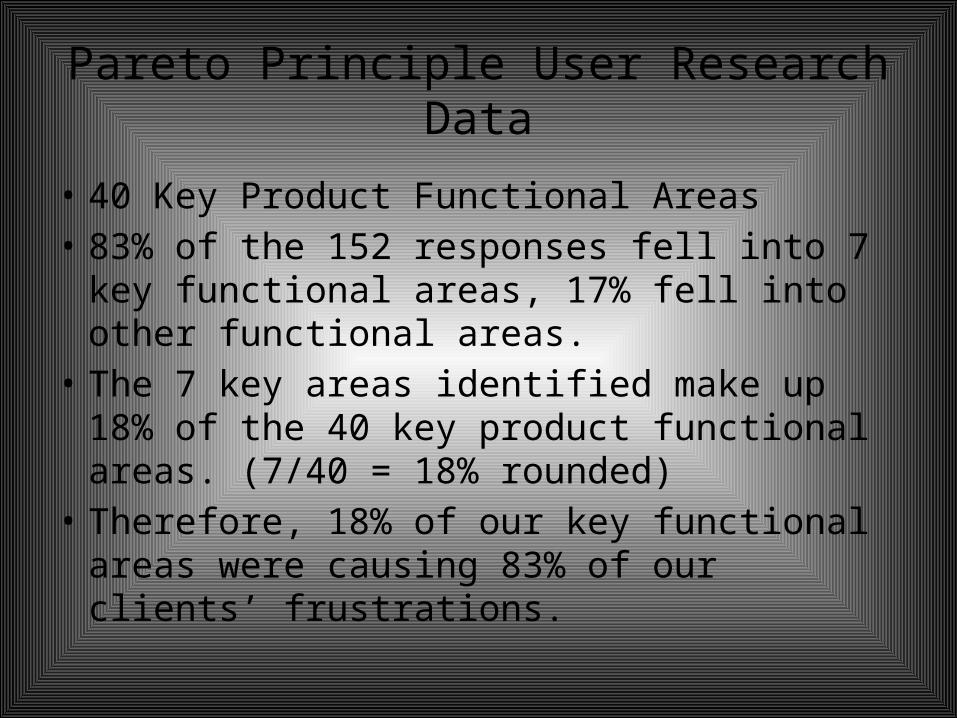
Pareto Principle User Research Data
• 40 Key Product Functional Areas• 83% of the 152 responses fell into 7 key
functional areas, 17% fell into other functional areas.
• The 7 key areas identified make up 18% of the 40 key product functional areas. (7/40 = 18% rounded)
• Therefore, 18% of our key functional areas were causing 83% of our clients’ frustrations.

Crazy Right? Dead on. Report Time.
• First I gave an overview of Pareto Principle in 2 sentences, then the gave the 83% 18% finding information.
• Then I gave our stakeholders the deeper stats: – The 7 Key Functional Areas Identified:
• Headlines 17%• Editor 14%• Files & Folders 14%• Forms & Surveys 14%• Groups 11%• Calendar 8%• Reports 5%

Finally, I grouped the user feedback by functional area
• It made a neat package that my stakeholders loved.– At a glance they could see the big picture• These are the little things we can fix to make a BIG
impact!• I don’t know about you, but my stakeholders love
statistics!
– If they wanted to deep dive, they could.• Including the individual pieces of feedback organized by
area gave an in depth account of what the users reported, and the changes they were requesting.

We were STUNNED by some of the areas that were identified!

Why Should My Organization Do This Research? Top 5 Reasons

1. Awesome for feature enhancement planning! You know what they want!

2. It will save you a boat load of cash in potentially wasted development hours.

3. Stakeholder meetings go from this:

To This

4. Clients feel they are being heard

5. Method is Cheap and Effective

Part 4: Industry Applications
• Let’s take some time to review some ways that this research can be applied to specific industries.

Tech Company
• List your core content areas and replicate this study exactly the way we’ve described it.
• To apply this research to any other industry, you just need to identify the core content areas, or primary tasks that you want your testers to evaluate.

Health Software
• View account• Submit claim• Check claim status• Locate contact information• Find a provider, etc.

Educational Websites
• Navigation• Sign in process• Ease of locating contact information• Content organization• Quality of search functionality

Mobile App Research
• Sign in screen• App content• Navigation• Icon clarity• Completeness of services offered

Retail Store Research
• Ease of locating product prices• Store layout• Customer service • Check out process• Staff professionalism• Quality of goods sold• Availability of products sold

The Sky is the Limit
• This type of research can really be applied to any industry out there.
• It’s quick, cheap and easy to conduct, and scales beautifully whether you’re a start up or a major corporation.

References
Koch, Richard. The 80/20 Principle: The Secret of Achieving More with Less. London: Nicholas Brealey Publishing, 2001. Print.

Tools Mentioned
• Survey Monkey http://www.surveymonkey.com/
• Survey Monkey Audience http://www.surveymonkey.com/mp/audience/ • MailChimp
http://mailchimp.com/

Favorite Design Book
• The Design of Everyday Things By: Donald Norman

Thank you!
Thank you so much for your time! We’re going to break for questions now.
If you think of a question after the session, or just want to say hello, I’d love to hear from you!
• Twitter: @jma245• Email: [email protected]• Blog: http://userexperiencerocks.com
I’ll be posting an overview of this session on my blog in the next day or two.