![Stability of bacteriophages in burn wound care products · sidered is phage therapy [6–8], i.e. the use of bacterial viruses named bacteriophages (phages for short) to treat bacterial](https://static.fdocuments.us/doc/165x107/5ecd79c66a5b361e1e24365d/stability-of-bacteriophages-in-burn-wound-care-products-sidered-is-phage-therapy.jpg)
PSEUDOMONAS AERUGINOSA STRAINS AND DIFFERENT P....
65
COMPARISON OF THE IMMUNE RESPONSE AGAINST DIFFERENT PSEUDOMONAS AERUGINOSA STRAINS AND DIFFERENT P. AERUGINOSA PHAGES Liesl Phlypo Student number: 01503264 Supervisor: Prof. Dr. Mario Vaneechoutte Scientific guidance: Drs. Jonas Van Belleghem Department: Dept. Clinical Chemistry, Microbiology and Immunology (GE06), Laboratory of Bacteriology Research (LBR) A dissertation submitted to Ghent University in partial fulfilment of the requirements for the degree of Master of Science in the Biomedical Sciences Academic year: 2016-2017
Transcript of PSEUDOMONAS AERUGINOSA STRAINS AND DIFFERENT P....

I
COMPARISON OF THE IMMUNE RESPONSE AGAINST DIFFERENT
PSEUDOMONAS AERUGINOSA STRAINS AND
DIFFERENT P. AERUGINOSA PHAGES
Liesl Phlypo Student number: 01503264
Supervisor: Prof. Dr. Mario Vaneechoutte
Scientific guidance: Drs. Jonas Van Belleghem
Department: Dept. Clinical Chemistry, Microbiology and Immunology (GE06),
Laboratory of Bacteriology Research (LBR)
A dissertation submitted to Ghent University in partial fulfilment
of the requirements for the degree of
Master of Science in the Biomedical Sciences
Academic year: 2016-2017

I
Preface
Five years ago, I knew I wanted to work in the microbiological field. In this dissertation, I got the
chance to work not only with bacteria, but with phages as well, at the laboratory of Professor
Vaneechoutte: the Laboratory Bacteriology Research. In these two years, I have learned so many
things and I was supported by many people, so I would like to extend my gratitude.
Thanks to my promotor, Professor Vaneechoutte, for giving me the opportunity for this master
thesis, to teach me critical thinking and to dot the i's and cross the t's on my dissertation.
This work would not have been possible without the scientific guidance by Drs. Jonas Van
Belleghem. Many thanks for your advice, knowledge and patience. Thank you for helping me to
process the huge amount of samples and your support throughout the two years. I would also like to
thank everyone of the LBR for being the great team that you are. In short: thank you for helping me
to become a good scientist.
And finally, I would like to thank my friends and family. Thanks to roommates, my friends in
Aarschot, Hasselt and in Ghent for all the friendship you gave me. Many thanks to my parents and
sister for their continued support, understanding of me and to help me put things into perspective
throughout my life.
Liesl Phlypo, Ghent 16 May 2017
II
Table of contents
Preface ......................................................................................................................................... I
Table of contents..........................................................................................................................II
List of abbreviations .................................................................................................................... V
Samenvatting............................................................................................................................. VII
Achtergrond........................................................................................................................... VII
Methoden .............................................................................................................................. VII
Resultaten ............................................................................................................................. VII
Besluiten................................................................................................................................ VII
Summary ...................................................................................................................................VIII
Background ...........................................................................................................................VIII
Methods.................................................................................................................................VIII
Results ..................................................................................................................................VIII
Conclusion.............................................................................................................................VIII
1 Introduction............................................................................................................................... 1
1.1 A short history of phages................................................................................................... 1
1.1.1 The discovery of phages ............................................................................................ 1
1.1.2 The first decades of phage therapy............................................................................ 2
1.2 Phage therapy ................................................................................................................... 2
1.2.1 Antibiotics resistance .................................................................................................. 3
1.3 Phage classification and morphology ................................................................................ 3
1.4 Life cycles of phages ......................................................................................................... 4
1.4.1 Lytic life cycle ............................................................................................................. 4
1.4.2 Lysogenic life cycle..................................................................................................... 5
1.5. Bacterial resistance mechanisms against phages ............................................................ 6
1.6 Advantages and challenges of phage therapy compared to antibiotics ............................. 7
1.6.1 Major advantages of phage therapy in comparison to antibiotic therapy .................... 7
1.6.2 Challenges in the phage therapy field ........................................................................ 7
1.7 Immunogenicity .................................................................................................................. 8
1.7.1 Antiphage innate immunity.......................................................................................... 8
1.7.2 Antiphage adaptive immunity ...................................................................................... 9
1.8. Scope of thesis ............................................................................................................... 10
2 Materials and methods ........................................................................................................... 11
2.1 Bacterial strains ............................................................................................................... 11
2.2 Identification of bacteria................................................................................................... 11
2.2.1 Identification by matrix-assisted laser desorption/ionization-time of flight.................. 11
2.2.2 Identification by 16S rRNA gene sequencing ............................................................ 11
III
2.3 Host specificity ................................................................................................................. 12
2.4 Nucleic acid extraction of bacteria and phages................................................................ 13
2.4.1 Pretreatment of samples........................................................................................... 13
2.4.2 Nucleic acid extraction by NucliSens EasyMag ......................................................... 13
2.4.3 Nucleic acid extraction by the column based method of Roche ................................ 13
2.4.4 Nucleic acid concentration determination of the standard series .............................. 13
2.5 Quantification of bacteria by culture ................................................................................ 14
2.6 Gradient polymerase chain reaction ................................................................................ 14
2.7 Quantitative polymerase chain reaction........................................................................... 15
2.8 Phage propagation .......................................................................................................... 16
2.9 Phage titration ................................................................................................................. 16
2.10 Phage purification by cesiumchloride (CsCl) density ultracentrifugation ........................ 17
2.11 PBMC isolation .............................................................................................................. 17
2.12 Stimulation assays ......................................................................................................... 18
2.13 RNA extraction of peripheral blood mononuclear cells................................................... 19
2.14 cDNA synthesis.............................................................................................................. 19
2.15 Statistical analysis ......................................................................................................... 19
3 Results and discussion ........................................................................................................... 20
3.1 Host specificity ................................................................................................................. 20
3.1.1 Identification of isolates ............................................................................................ 20
3.1.2 Evaluation of the host specificity............................................................................... 21
3.2 DNA extraction efficacy for bacteria and phages ............................................................. 23
3.2.1 Primer specificity and annealing temperature ........................................................... 23
3.2.2 DNA extraction efficacy of S. aureus and P. aeruginosa........................................... 26
3.2.3 DNA extraction efficacy in presence of PBMCs ......................................................... 28
3.2.4 Amplification efficiency of S. aureus in presence of phages and vice versa ............. 30
3.2.5 FemA primers qPCR product identification of samples with a constant concentration
of ISP and a S. aureus dilution .......................................................................................... 33
3.3 Stimulation of PBMCs by bacteria and phages ................................................................ 34
3.3.1 Stimulation assay with standard cRPMI 1640complete cell medium............................... 34
3.3.2 Stimulation assay with cRPMI 1640no antibiotics cell medium ......................................... 36
4 General conclusion................................................................................................................. 39
5 References ............................................................................................................................. 43
6 Addendum ................................................................................................................................. i
6.1 Support information: Host specificity ................................................................................... i
6.2 Support information: DNA extraction efficacy for bacteria and phages ...............................ii
6.2.1 Primer specificity and annealing temperature ..............................................................ii
6.2.2 DNA extraction efficacy of S. aureus and P. aeruginosa............................................. v
6.2.3 DNA extraction efficacy in presence of PBMCs ...........................................................vi

IV
6.2.4 Amplification efficiency of S. aureus in presence of phages and vice versa .............. vii
6.2.5 FemA primers qPCR product identification of samples with a constant concentration
of ISP and a S. aureus dilution ............................................................................................ xi
V
List of abbreviations
Abbreviation Explanation
cDNA Complementary desoxyribonucleic acid
CRISPR Clustered regularly interspaced short palindromic repeats
CsCl Cesiumchloride
dNTP Desoxyribonucleotide triphosphate
ds Double stranded
Hoc Head outer capsid
IHF Integration host factor
IL Interleukin
IP Intellectual property
kb Kilo base pairs
LPS Lipopolysaccharide
MALDI-TOF Matrix-assisted laser desorption/ionization-time of flight mass spectrometry
MO Micro-organisms
MS Mass spectrometry
NF-κB Nuclear factor kappa B
PAMP Pathogen-associated molecular pattern
PBMC Peripheral blood mononuclear cell
PEG Polyethylene glycol
PICI Phage-inducible chromosomal islands
RIG Retinoic acid-inducible gene
ROS Reactive oxygen species
RPMI medium Roswell Park Memorial Institute medium

VI
Abbreviation Explanation
Sie system Superinfection exclusion system
TLR Toll-like receptor
TNF-α Tumor necrosis factor-alpha
UV Ultraviolet
WBC White blood cell or leukocyte

VII
Samenvatting
Achtergrond
Antibioticaresistente bacteriën vormen een dreiging, maar kunnen worden gedood door fagen. De
interactie van fagen met het menselijk immuunsysteem is echter weinig gekend. Deze masterthesis
onderzoekt of fagen een invloed hebben op de afdoding van faaggevoelige en faagongevoelige
bacteriële stammen in aanwezigheid van perifere bloed mononucleaire cellen (PBMCs).
Methoden
Eerst werd de gastheerspecificiteit van Staphylococcus aureus faag ISP en van de Pseudomonas
aeruginosa fagen LUZ19, 14-1, vB_Pae-Kakheti25 en PNM onderzocht. Vervolgens werd de DNA-
extractiedoeltreffendheid van S. aureus faag ISP bepaald, evenals van twee S. aureus stammen
(namelijk een faaggevoelige en een faagongevoelige stam) en een P. aeruginosa stam. Tenslotte
werden PBMCs gestimuleerd met fagen, al dan niet in combinatie met één van deze bacteriële
stammen en gekwantificeerd via kweek of qPCR.
Resultaten
Stimulatie van de PBMCs met de S. aureus gastheerstam en S. aureus faag ISP had een minder
gevoelige detectielimiet dan bij enkel de bacteriestam of de faag. Wanneer S. aureus werd
toegevoegd aan PBMCs kon een verhoogd bacteriënaantal waargenomen worden na 20 h
stimulatie in tegenstelling tot P. aeruginosa waar de concentratie constant bleef gedurende de
incubatieperiode. De groei van de S. aureus faag ISP ongevoelige stam STA04 na stimulatie was
zwakker in aanwezigheid van S. aureus faag ISP. De hoeveelheid fagen bleef gelijk voor en na de
stimulatie.
Besluiten
Fagen worden niet gefagocyteerd of gelyseerd na 20 h PBMC stimulatie, ook niet in aanwezigheid
van de bacteriën. De faagongevoelige bacteriële S. aureus stam daarentegen verminderde na
blootstelling aan PBMCs en S. aureus faag ISP.

VIII
Summary
Background
Phage therapy is a promising alternative for antibiotics with the emerging of antibiotic resistance.
Although the target of phages are bacteria, little is known about the interaction of phages with the
human immune response. We investigated whether phages have anti-inflammatory properties by
evaluating the killing of phage sensitive and phage insensitive bacterial strains in the presence of
peripheral blood mononuclear cells (PBMCs), by means of culturing or qPCR.
Methods
First, the host specificity of Staphylococcus aureus phage ISP and of Pseudomonas aeruginosa
phages LUZ19, 14-1, vB_Pae-Kakheti25 and PNM was determined. Subsequently, the DNA
extraction efficacy of S. aureus phage ISP, two S. aureus strains (i.e. one phage sensitive and one
insensitive strain), and one P. aeruginosa strain was determined. Finally, PBMCs were stimulated
for 20 h with phage, whether or not combinated with one of these bacterial strains.
Results
The stimulation of PBMCs with S. aureus host bacteria and S. aureus phages had a less sensitive
detection limit compared to samples with only bacteria or phage. When S. aureus was added to
PBMCs, an increase in bacterial count was detected in contrast to P. aeruginosa where the
concentration remained stable after stimulation. The growth of S. aureus strain STA04 was weaker
after stimulation in presence of S. aureus phage ISP. The phage concentration remained stable in
all stimulation conditions.
Conclusion
There is no phagocytosis or lysation of phages after 20 h of PBMC stimulation, independently of
bacterial presence. However, the phage insensitive S. aureus strain decreased in presence of
PBMCs and phage.

1
1 Introduction
Bacteriophages, or short phages, are viruses that infect prokaryotes. These viruses are able to lyse
bacterial cells by a lytic life cycle [1]. With the increasing antibiotic-resistance of bacteria, new
strategies have to be developed and the use of phages to combat pathogenic bacteria ( i.e. phage
therapy) comes into the spotlight. Phage therapy can be used for example to treat antibiotic-
resistant bacteria and to control burn wound infections. Bacteria important to control in burn wound
infections are common colonizers, e.g., Staphylococcus aureus, and life-threatening bacteria in the
infections, e.g., Pseudomonas aeruginosa [2]. To use phages as a treatment for burn wound
infections in the future, the immune response of these phages in humans has to be clarified.
Recently, it was shown at the Laboratory for Bacteriology Research (LBR) that S. aureus and P.
aeruginosa phages are able to induce an immune response (PhD research Jonas Van Belleghem,
submitted for publication).
The aim of this master dissertation is to determine the effect of phages on the survival of bacteria in
the presence of human immune cells. We tried to clarify whether there is an effect of the immune
response induced by the phages on the survival of the phages themselves instead of merely on the
survival of the bacteria and also whether the presence of phages influences the speed of clearing
of the bacteria in presence of immune cells [3].
1.1 A short history of phages
The British bacteriologist Ernest Hanbury Hankin investigated in 1896 why there were no cholera
epidemics at villages near the Indian rivers Ganga and Yamuna, although cholera is a waterborne
disease. By adding Vibrio cholerae cultures to the river water and cultivating the suspension at
different time points (1 h - 49 h), he could observe a remarkable decline of bacteria [4]. Filtrated
river water (using a Chamberland filter) had no bacterial colonies left , three hours after addition of
Vibrio cholerae. However, autoclaved river water showed an increase of bacteria, similar to that of
filtered well water, after the addition of Vibrio cholerae. Hankin called the source of bactericidal
activity a volatile 'antiseptic substance', but was not able to identify it any further. This was the first
time lytic phage activity was documented [4].
1.1.1 The discovery of phages
Phages were officially discovered independently by the British scientist Frederick Twort and the
French-Canadian scientist Félix d’Herelle one century ago. Twort discovered bacteriolytic agents
while he was studying the growth of vaccinia virus on cell-free agar media. These agents could pass
through millipore filters and were not able to grow in absence of bacteria. Twort described them as
bacterial secretes in 1915 [5]. Two years later, Félix d’Herelle isolated a so-called ‘anti-Shiga
microbe’ from stools of patients that were recovering from shigellosis, by incubating stool at 37 °C

2
and then filtering it through a Chamberland L3 filter [6]. The bacteria-free filtrate was inoculated to a
culture of Shiga bacilli and was able to cause lysis of the bacilli [5,7]. d’Herelle introduced the name
bacteriophage for this filtrate, derived from ‘bacteria’ and ‘phagein’, not for the Greek word for ‘to
eat’ but as a meaning of ‘developing at the expense of’ [5,8].
1.1.2 The first decades of phage therapy
d’Herelle noted a correlation of the presence of phages with the clearance of the disease in
dysentery patients in his first paper. This lead to a series of trials investigating phage therapy for
treating bacterial infections in 1919 [9]. The clinical significance of phages was demonstrated by
oral inoculation to rabbits and chickens, as a protection against shigellosis and avian typhosis
respectively [5,7,9]. The first published paper of phage therapy in patients was published in 1921 by
Bruynoghe and Maisin in Belgium [5]. They treated cutaneous furuncles and carbuncles (typically
caused by Staphylococcus infection) by injection of Staphylococcus phages near the base of the
boils [5]. The safety of the phage preparation produced by d’Herelle was tested by injection on
himself, his family and co-workers. This safety evaluation was found to be sufficient and the
treatment was given as a therapy to dysentery patients. The attention for phage therapy increased
further when d’Herelle was able to treat the bubonic plague in four patients by injection of
antiplague phage preparations [7]. It was also used in the 1920s for wound infections because of
the accessibility of the infection for treatment and a relative simple pathogenesis [7].
The report of the Council on Pharmacy and Chemistry about phage therapy in the late 1930s was
the start of a period of general critical scepticism of phage therapy. Phage therapy for clinical use
was already in the field, though the biological nature of phages remained poorly understood. In
normal circumstances, this report would have led to more research to find better answers.
Nevertheless, the discovery of antibiotics caused a decline in research and use of phage therapy.
The broad spectrum, the ease of production and the stability of the preparations of antibioti cs gave
them several advantages over phages. Only in the Soviet Union and some Eastern European
countries, clinical use of phage therapy continued [10]. The Institute in Tbilisi founded by d’Herelle
and Georgyi Eliava (George Eliava Institute of Bacteriophage, Microbiology and Virology in Georgia)
became a major source of phages and equally importantly preserved the knowledge of phage
therapy [7].
1.2 Phage therapy
Because virulent phages (1.4.1 Lytic life cycle) can cause bacterial lysis, d’Herelle had the idea to
use phages as a therapy. For this merit, d’Herelle was nominated three times for the Nobel Prize,
but he was never awarded one [11]. Phage therapy is the use of phages or their products as
bioagents to treat or prevent bacterial infectious diseases [12].
3
1.2.1 Antibiotics resistance
In 2012, the director-general of the WHO warned that “The world is heading toward a post -antibiotic
era, in which many common infections will no longer have a cure” [13]. After 60 years of problem-
free use, the cure of bacterial infections became a problem again because of an increase in
antibiotic resistance. The widespread use and abuse of antibiotics lead to a greater evolutionary
pressure for bacteria to acquire antibiotic resistance. Most antibiotics are unnecessarily used in
commercial agriculture, by general practitioners uncertain of a diagnosis or for treating self-limiting
infections [14].
Four main mechanisms for acquiring antibiotic resistance are known: (1) by limiting the intracellular
drug concentration by poor penetration, efflux of the drug, modified porins or transporter proteins,
(2) by modifying enzymatically the antibiotic target, (3) by inactivating the antibiotic by hydrolysis or
modifications and (4) developing a bypass for the target metabolic process of the drug [15] .
Furthermore, the number of newly approved antibiotics declined steadily during the past 30 years.
There are no more investments in antibiotic development by 15 of the 18 largest pharmaceutical
companies due to economic and regulatory barriers [16]. In the future, it could be possible to kill
drug-resistant bacteria and to keep pace with these bacteria dynamically, by using phage
therapy [13].
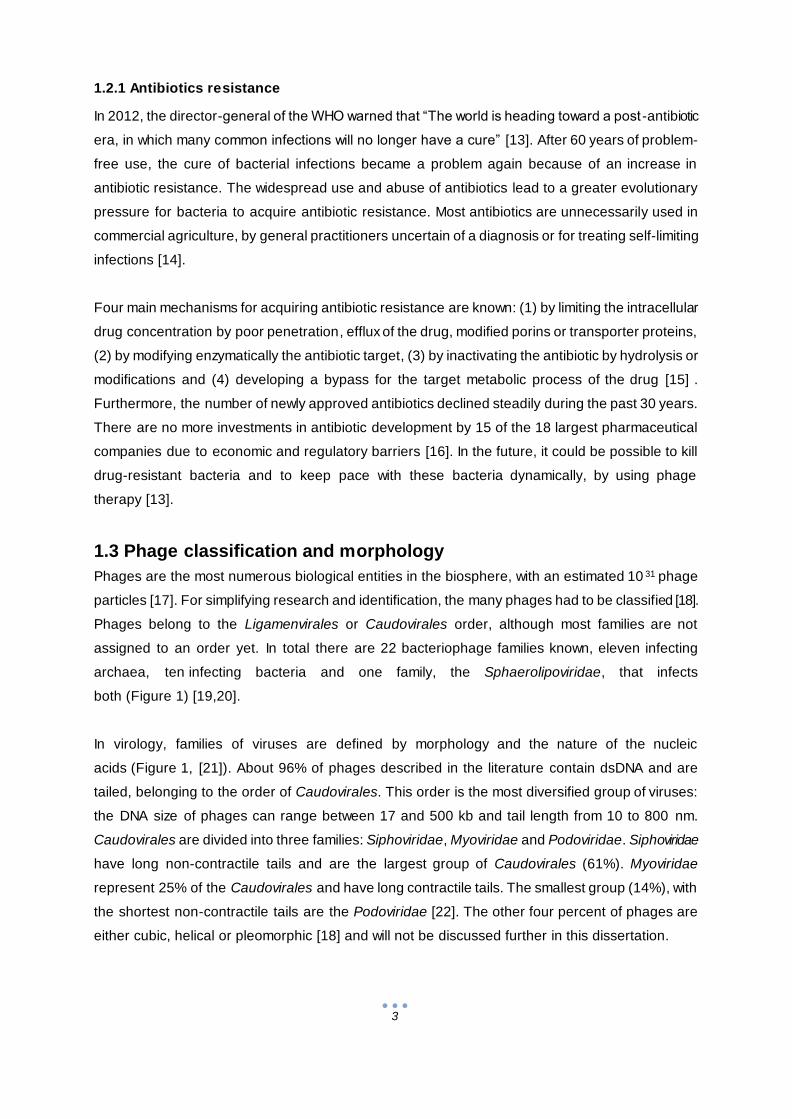
1.3 Phage classification and morphology
Phages are the most numerous biological entities in the biosphere, with an estimated 10 31 phage
particles [17]. For simplifying research and identification, the many phages had to be classified [18].
Phages belong to the Ligamenvirales or Caudovirales order, although most families are not
assigned to an order yet. In total there are 22 bacteriophage families known, eleven infecting
archaea, ten infecting bacteria and one family, the Sphaerolipoviridae, that infects
both (Figure 1) [19,20].
In virology, families of viruses are defined by morphology and the nature of the nucleic
acids (Figure 1, [21]). About 96% of phages described in the literature contain dsDNA and are
tailed, belonging to the order of Caudovirales. This order is the most diversified group of viruses:
the DNA size of phages can range between 17 and 500 kb and tail length from 10 to 800 nm.
Caudovirales are divided into three families: Siphoviridae, Myoviridae and Podoviridae. Siphoviridae
have long non-contractile tails and are the largest group of Caudovirales (61%). Myoviridae
represent 25% of the Caudovirales and have long contractile tails. The smallest group (14%), with
the shortest non-contractile tails are the Podoviridae [22]. The other four percent of phages are
either cubic, helical or pleomorphic [18] and will not be discussed further in this dissertation.
4
Figure 1: Phage families infecting bacteria. Viruses that infect bacteria belong the viral families
Corticoviridae, Cystoviridae, Inoviridae, Leviviridae, Microviridae, Myoviridae, Plasmaviridae, Podoviridae,
Siphoviridae, Sphaerolipoviridae and Tectiviridae. Adapted from [18,19,21]
Briefly, the viral particles of the Caudovirales consist of an icosahedral head and a tail structure.
The DNA is packed in the polyhedral head, as protection against the environment. The tail structure
makes contact with the bacterial cell during infection and serves to inject the phage genome into the
bacterial host [23].
1.4 Life cycles of phages
Besides their morphology, bacteriophages can be divided into two groups according to their life
style: the virulent phages which only go through the lytic cycle and the temperate phages who can
switch between a lytic and a lysogenic cycle. The lytic cycle leads to immediate replication of the
phage particles and lysis of the bacterial cell. In the he lysogenic cycle the phage genome can
become integrated into the bacterial genome, co-replicated during generations, whereafter excision
may occur. In the lysogenic cycle, excision and integration respectively are crucial steps, mediated
by DNA recombinases (i.e. integrase, excisionase) [1,24].
1.4.1 Lytic life cycle
Virulent phage particles replicate only by a lytic life cycle, whereby the genome of the phage is
replicated and progeny phage particles are synthesized and assembled. The progeny of the phage
will be liberated from the bacterial cell by bacterial lysis caused by the holin-endolysin system [1].
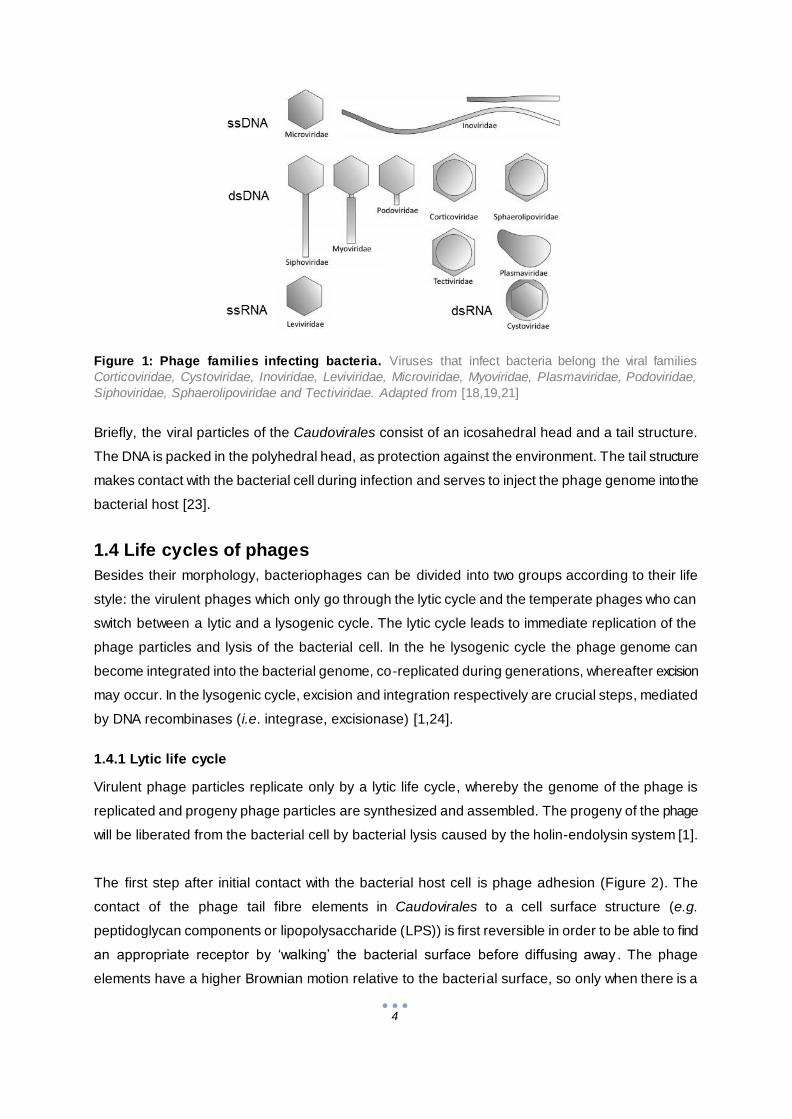
The first step after initial contact with the bacterial host cell is phage adhesion (Figure 2). The
contact of the phage tail fibre elements in Caudovirales to a cell surface structure (e.g.
peptidoglycan components or lipopolysaccharide (LPS)) is first reversible in order to be able to find
an appropriate receptor by ‘walking’ the bacterial surface before diffusing away . The phage
elements have a higher Brownian motion relative to the bacterial surface, so only when there is a
5
proper orientation between the phage element and the bacterial receptor, the attachment is
irreversible in undisturbed media [25]. Second, the cell wall will be made penetrable by enzymes like
lysozyme located in the tail [26]. The capsid remains extracellular, but the nucleic acid of the phage
is injected into the cell (Figure 2A). These steps are common to all Caudovirales. In virulent phages,
the phage genome does not integrate in the host genome. Gene expression and replication of
phage particles occur by host machinery (Figure 2B). During morphogenesis, bacterial lysis is
prepared by holin accumulation in the membrane and endolysin accumulation in the cytoplasm
(Figure 2C). Holin controls the timing of lysis and will form non-specific channels in the cytoplasmic
membrane, so endolysin can lyse the peptidoglycan layer [26]. The mature phages are then
released by the bacterial cell lysis in the lytic life cycle, in turn infecting other host
cells (Figure 2D) [27].
Figure 2: Lytic life cycle
(A) Injection of phage genome. (B) Gene expression and phage replication. (C) Morphogenesis of
phages. (D) Bacterial lysis with release of phages. Adapted from [1].
1.4.2 Lysogenic life cycle
A temperate phage can replicate in two ways: the lytic life cycle and the lysogenic life cycle. In the
lysogenic life cycle, the phage genome is integrated into the bacterial host genome as a prophage,
mediated by integrase and integration host factor (IHF) (Figure 3). Integrases are site-specific
recombinases that recognize bacterial and phage attachment sites (attB and attP respectively),
whereas IHF bends the bacterial DNA for better accessibility. The attachment sites share a part of
the sequence so cross-over can occur [1,28]. In this latent or dormant state of the phage, there is
no production of progeny phage particles. The prophage is replicated during bacterial replication,
together with the bacterial genome. Bacterial cells carrying phage genomes into their genome are
designated ‘lysogens’. During stress situations, such as DNA damage by UV irradiation or by
oxidative compounds, a switch to the lytic life cycle occurs by expression of lytic genes causing
replication of phage particles and bacterial lysis [1,29].

6
Figure 3: Lysogenic life cycle.
(A) Injection of phage genome. (B) Insertion of phage genome. (C) Latent state of the phage.
Adapted from [1].
1.5. Bacterial resistance mechanisms against phages
Because phages are very prevalent, bacteria have protection mechanisms against phages. These
mechanisms include the prevention of phage attachment. Adsorption is only successful if the phage
receptors are present, accessible and in a permissive spatial distribution. Bacteria therefore can
prevent adsoption by modifying the receptor structure through mutation or by physical barriers that
conceal the receptor. The presence of phage receptors can change by phase variation, i.e.,
receptor expression is switched reversible for heterogeneity in populations in order to ensure
survival. The injection of DNA can be blocked by superinfection exclusion (Sie) systems. These
systems are membrane-associated or membrane-anchored proteins usually phage encoded and
serve originally as a protection of a lysogenized host to other related phages [30].
If DNA is injected successfully, modification and/or restriction (by restriction-modification systems) or
destruction (by CRISPR-Cas immunity) of the foreign DNA can inhibit the phage infection and result
in bacterial survival. Restriction-modification systems are common phage resistance mechanisms
consisting of restriction enzymes and methyltransferase. Methyltransferase normally methylates
bacterial DNA at specific recognition sites to protect it from degradation by restriction enzymes,
because restriction enzymes only degrade unmethylated DNA into fragments. Depending on the
balance of processing of these two enzymes, the phage will become degraded by restriction
enzymes or protected by methyltransferases. If phage DNA is methylated, new virions become
resistant against the restriction-modification systems until it infects a bacterium encoding for another
methylase, producing new unmethylated virions that are sensitive again [31]. Recently, an adaptive
microbial immune system for viruses and plasmids, clustered regularly interspaced short palindromic
repeats (CRISPR) with CRISPR-associated (Cas) genes was identified. The CRISPR-locus in the
genome contains repeated DNA sequences with unique sequences called spacer in between.
These spacers contain fragments of foreign DNA and serve as a memory and recognition system.
The CRISPR-locus is flanked by the Cas genes, encoding for among other things nucleases and
helicases that will degrade nucleic acids from invasive elements. When genetic elements enter the
bacterium and it is recognized by one of the spacer sequences, it will be degraded by Cas
proteins [32].
7
Not all resistance mechanisms result in bacterial survival. Abortive infection systems lead to death of
the infected bacterial cell to protect the surrounding population. After a normal injection of the
phage nucleic acids, the phage development is interrupted in abortive infection systems by e.g.,
prevention of DNA replication or by rapid decay of mRNA after infection [33]. These systems
decrease or eliminate phage reproduction, but decrease the bacterial survival as well. This sacrifice
also counts when phage-inducible chromosomal islands (PICIs) are used, i.e., phage parasites that
interfere with the reproduction of phages by affecting DNA packaging. The mature phage particles
contain PICI DNA instead of phage DNA, but there is no prevention of bacterial cell death, although
phage reproduction is limited and PICIs are spread to the surrounding population [30].
1.6 Advantages and challenges of phage therapy compared to
antibiotics
Phage therapy could be a replacement or a synergistic complement of antibiotics. Therefore it is
useful to understand the advantages as well as disadvantages of phage therapy, in comparison to
antibiotic therapy.
1.6.1 Major advantages of phage therapy in comparison to antibiotic therapy
Phages are naturally occurring antibacterial agents, making isolation easy and cheap [34,35]. They
are often isolated from sewage or other waste materials where phages can multiply easily because
of high bacterial concentrations [36]. The applications of phages are also versatile: liquids, creams,
tablets are possible to provide the most suitable route of administration [35].
Phages need bacteria to multiply, explaining ‘auto dosing’ in phage therapy. Auto dosing means that
the concentration of the therapeutical agent adjusts to the concentration that is needed, starting
from a threshold concentration. This explains why a single dose (or far less frequent dosing) can be
successful in phage therapy [35,36]. Auto dosing is also an advantage in purulent wounds, where
penetration of antibiotics is limited.
An increase of antibiotic concentration can cause toxicity, whereas phages display no side
effects [35]. Also, phages have a high host-specificity, attacking only target bacteria and leaving
commensal bacteria unharmed [36].
1.6.2 Challenges in the phage therapy field
Phages are evolvable biological entities, what makes phages strong in flexible therapeutic
applications, but weak in intellectual property (IP). The ubiquity of phages makes protection of
inventions including phages difficult. Plenty of phages with the same characteristics can be
patented, making a patent less valuable [37]. These IP problems do not stimulate entrepreneurs or
investors [37]. One of the possible solutions to IP problems is genetic modification, by excluding
virulence genes like enterotoxin genes present on the phage genome or by broadening the host

8
range [38]. Chimeric phages produced by homologous recombination of 2 phages with a different
host range have an extended host range without loss in lytic activity [39]. The half-life of phages can
be increased by chemical modifications, namely PEGylation. This also reduced the T-helper type 1
immune response [40]. However, the use of genetically modified organism poses even more
problems with the regulatory authorities.
Furthermore, not all phages are suitable for therapeutic use. The phage should have appropriate
efficacy and safety for therapeutic use, lack toxins and be stable under typical storage
conditions [36]. It is very important that temperate phages are not used as therapeutics because it
is possible they encode for virulence or toxin genes besides their essential viral proteins. For
example, Streptococcus pyogenes can convert from Tox- to Tox+ by the presence of temperate
phages containing pyogenic exotoxin A [41] and as such be the cause of scarlet fever [42].
Lysogenisation can also cause superinfection immunity, causing blockage of superinfecting phages,
so that phage-sensitive bacteria can become resistant [36]. It is also preferable to use lytic phages
because speed of action can be increased because only the therapeutically useful lytic cycle is
possible.
The high host-specificity can form a limitation in clinical use. Therefore, phage cocktails are often
used. These consist of multiple phages, covering a diversity of hosts within the same bacter ial
species (or multiple bacterial species responsible for the same disease) [13,36]. This approach can
be used to broaden the spectrum of phages [34,36]. It could also be possible to use antibiotics and
phage therapy as a combination therapy, which has already been shown to be more effective than
antibiotic treatment alone [36]. Although there are phage-resistant bacteria, these often have
reduced virulence, because he receptors to which phages adhere are often virulence factors e.g.
LPS or pili on P. aeruginosa [43,44]. If phage-resistant bacteria appear, it is also relatively easy to
isolate another phage against these bacteria to kill them all the same.
1.7 Immunogenicity
Besides the effect phages have on their bacterial hosts, phages might also have an impact on the
immune system of the mammalian host of the bacterial species they infect [45]. In this section, the
reaction of the innate and adaptive immune system to phages and vice versa will be described. It is
important to note that the innate and adaptive immune system are part of one system and do
strongly interact [46].
1.7.1 Antiphage innate immunity
The innate immune system refers to non-specific immune reaction by recognizing broad molecular
patterns associated with pathogens such as pathogen-associated molecular patterns (PAMPs).
These PAMPs can be recognized by pattern recognition receptors (PRRs) such as Toll-like
receptors (TLRs) on the host cells [45,46]. The activation of these receptors (e.g. TLR-4, TLR-7,
9
TLR-8, RIG-I and TLR-9) causes release of signal molecules such as cytokines that mediate the
activation of the immune system [46]. These cytokines are important in T-cell differentiation, and
recruitment and activation of immune cells. For example, LPS stimulates TLR-4, activating the NF-
κB pathway and the production of cytokines such as TNF-α, IL-1β and IL-6 in macrophages [47].
Mice experiments have shown that the activated phagocytic cells are capable of clearing phages
rapidly after injection, especially in the thymus and liver [44].
1.7.1.1 Innate immunomodulatory effects of phages
Phages can trigger specific modulations of the immune system. Three main interaction mechanisms
between phages and the immune system have been described [48].
First, some temperate phages can modify the bacterial antigenicity, e.g., by encoding for enzymes
that can modify the O-antigen component of LPS of Salmonella. This could help bacteria escape
from the immune system and possibly from other phages that use LPS for adherence because the
recognition patterns of the bacteria are changed [49].
Second, it has also been described that some phages could serve as a non-host-derived immunity
on mucosal surfaces [50]. The four Ig-like domains of the T4 phage head outer capsid protein (Hoc)
can bind to mucin glycoproteins. This significantly slows down the diffusion of phages in mucin
solutions, increasing the chance of encountering and killing bacteria [50].
Third, it has been hypothesized that the antiviral innate immune system might sense phages when
delivered to the intracellular environment of phagocytes by phage-infected bacteria. After
degradation of the phage particle, phagocytized phage nucleic acids could be exposed t o viral
nucleic acid sensors like TLR7 or TLR9. This could induce a stimulation of antiviral cellular immunity
that might be an advantage in protection against eukaryotic pathogenic viral infections [45].
1.7.2 Antiphage adaptive immunity
Antiviral antibodies are able to neutralize the phages. It has been suggested that this inactivation of
the phages is possible by binding to crucial areas for adherence and DNA injection (e.g. phage
tails) [51]. Neutralizing antibodies help the antibody-mediated endocytosis by macrophages of the
phages and complement activation [44,51]. The phage antigens would then be presented to T-
helper cells by antigen-presenting cells, resulting in memory cells against the phages [52], what
could imply that repeated phage therapy turns not effective. However , the duration of the presence
of antibodies in circulation remains unclear. The concentration of neutralizing antibodies depends
on the dosage and route of administration of the phages [53]. Sulakvelidze et al. (2001) suggested
however that neutralizing antibodies should not be a significant obstacle in the initial treatment of
acute infections by phage therapy because the kinetics of phage replication are much higher than
the neutralizing antibody production of the host [54]. A study by Łusiak-Szelachowska et al. (2016)
confirmed this suggestion by stating that the antiphage activity of immune cells does not correlate
with the outcome of phage therapy [55].
10
Many studies have shown that serum of non-immunized humans have in fact a low level of natural
phage-neutralizing antibodies, also called natural antibodies. This phenomenon can be easily
explained by the constant natural immunization with phage antigens by the abundant presence of
phages in various environments, as well as in commensal bacteria and in food [51].
1.8. Scope of thesis
This master dissertation aims at contributing to the knowledge regarding the ability of phages and
their bacterial hosts to interact with human immune cells. More specifically, the response of
lymphocytes (T, B and NK), macrophages and dendritic cells, together called peripheral blood
mononuclear cells (PBMCs), on P. aeruginosa and S. aureus phages and their hosts was
investigated.
First, the host specificity of some S. aureus and P. aeruginosa phages was determined to select
phage sensitive and phage resistant bacterial strains. Second, the sensitivity of nucleic acid
extraction NucliSens EasyMag extraction and applicability of qPCR for quantification of both bacteria
and phages was determined.
Finally, the quantity of the phages and/or bacteria after incubation in presence of PBMCs was
determined by culture and qPCR and at the same time the immune response would have been
determined by quantifying cytokine gene expression by means of qPCR.
We expect a decrease of bacteria after stimulation. A stronger decrease of S. aureus phage ISP
sensitive bacteria is expected when the phage is added, causing an increase of S. aureus phages.
No significant decrease of S. aureus phage ISP insensitive bacteria is expected when stimulated in
presence of the phage, maintaining a constant or lower concentration than before stimulation.
Pseudomonas aeruginosa could not be investigated completely because P. aeruginosa phage PNM
primers were still in development phase.
11
2 Materials and methods
2.1 Bacterial strains
Staphylococcus species and Pseudomonas aeruginosa isolates (Table S 1) were grown at 37 °C on
tryptic soy agar with 5 % sheep blood (TSA + 5% SB) plates, except for the soil and water inhabitant
Pseudomonas fluorescens which was grown at 22 °C. Host strains were S. aureus Rosenbach
(ATCC 1884) and P. aeruginosa strain 573. These plates were stored at 4 °C and maintained by
monthly transfer to a new TSA + 5% SB plate.
One colony was picked and transferred to a 1.5% LBA medium plate (Luria Bertani Agar; Beckton
Dickinson, Erembodegem, Belgium). After overnight incubation, one colony was picked and
transferred to an LBA slant and incubated overnight at the respective optimal growth temperatures.
Dense bacterial suspensions were prepared from these slants by the addition of five ml saline to
make bacterial dilutions. These bacterial dilutions were used in the three parts of this dissertation,
i.e., host specificity determination, extraction efficacy determination and the stimulation assay.
2.2 Identification of bacteria
Samples that were stored at – 80 °C and that showed a delayed growth, i.e., more than 1 week of
culture before colonies were visible, were identified again by matrix-assisted laser
desorption/ionization-time of flight (MALDI-TOF). When there was no reliable identification by
MALDI-TOF, the samples were sent for 16S rRNA gene sequencing.
2.2.1 Identification by matrix-assisted laser desorption/ionization-time of flight
One colony of the sample (on TSA + 5% SB plates or on cetrimide plates if possible) was
transferred with a 1 µl inoculation needle to a MALDI-TOF mass spectrometry (MS) MSP 96
polished steel target plate. The colony was overlaid with one µl matrix solution (α-cyano-4-hydroxyl-
cinnamic acid (HCCA), Bruker, Evere Belgium). The matrix-sample was crystallized by air-drying for
5 minutes at room temperature. The measurements were performed on the Microflex MALDI-TOF as
described by the manufacturer (Bruker). The MALDI-TOF software (Biotyper 2.0) compares the
peak profiles of the tested strains with those of known species present in the database. The
logarithmic score between zero and three is called the score value. Reliable ident ification was
defined as a score value higher than 1.7, with a highly probable identification from 2.3 to 3 [56].
When the score value was below 1.7, 16S rRNA gene sequencing was performed.
2.2.2 Identification by 16S rRNA gene sequencing
First, nucleic acids were extracted from the bacteria (on TSA + 5% SB plates or on cetrimide plates
if possible) using an alkaline lysis. Briefly, one colony was transferred to 20 µl alkaline lysis buffer
(0.05 M NaOH, 0.25% SDS) and heated for 15 min at 95 °C. Ultra-pure water was added to 200 µl

12
before a centrifugation of 5 min at 13,000g. The supernatant was stored at -20 °C for 30 min.
Subsequently, the 16s rRNA gene was amplified on a Veriti Thermal Cycler (Thermo Fisher
Scientific, Waltham, US) using five µl lysate from each sample in a total of 50 µl with 1x Faststart
PCR master (Roche). The primers αβNOT and Ω16MB primers (Table 1) were used at a
concentration of 0.2 µM.
Table 1: Sequences of primers and probes used for PCR of bacteria and phages.
Species Primer/
Probe
Sequence
(5’ to 3’)
Annealing
Temperature
(°C)
Bacteria αβNOTa AGTTTGATCCTGGCTCAG
55 Ω16WTa TACCTTGTTACGACTTCGTCCCA
S. aureus femA-2Fa AACTGTTGGCCACTATGAGT
59 femA-2Ra CCAGCATTACCTGTAATCTCG
S. aureus SA0836-F GGCGCTTGTAAAATTTTCGT
59 SA0836-R TGCGCAAAGTTTTATTGAACA
S. aureus SA442-F GTCGGGTACACGATATTCTTCACG
65 SA442-RS CTCGTATGACCAGCTTCGGT
P. aeruginosa
oprL-Fa ATGGAAATGCTGAAATTCGGC
55 oprL-Ra CTTCTTCAGCTCGACGCGACG
oprL-TMb 6-FAM-AGAAGGTGGTGATCGCACGCAGA-BBQ
S. aureus phage ISP ISP2-F
ISP2-R Confidential 59
S. aureus phage ISP ISP5-F
ISP5-R Confidential 59
S. aureus phage ISP ISP6-F
Confidential 59 ISP6-R
S. aureus phage ISP ISP7-F
ISP7-R Confidential 59
Legend: a primer, b probe, 6-FAM is a fluorescent label, BBQ is a BlackBerry quencher.
For thermal cycling, the initial denaturation took 5 min at 95 °C. The second stage was three cycles
of 45 s at 95 °C, 2 min at 55 °C and 11 s at 72 °C. The third stage was 35 cycles of 20 s at 95 °C,
1 min at 55 °C and 1 min at 72 °C. After 5 min at 72 °C, the samples were cooled to 4 °C. Prior to
sending the PCR products to GATC Biotech (Constance, Germany), amplification was checked by
means of a 1 % agarose gel and visualized by UV-illumination of the fluorescent
intercalating ethidium bromide (Sigma Aldrich).

13
2.3 Host specificity
The bacterial suspensions (100 µl; prepared according to 2.1 Bacterial strains) were spread evenly
on 1.5% LBA plates. Hundredfold phage dilutions, ranging from 106 – 1010 PFU/ml, were added in
one µl volumes onto the plates, which were thereafter incubated at 32 °C overnight. The obtained
lysis zones were evaluated and scored as confluent lysis (CL), semi-confluent lysis (SC) and no
lysis (/).
2.4 Nucleic acid extraction of bacteria and phages
2.4.1 Pretreatment of samples
To determine the extraction efficacy of S. aureus and P. aeruginosa isolates, or S. aureus phage
ISP, a tenfold dilution series (total volume of 200 µl) of bacterial or phage suspension was made
with saline (100 – 10-8 cells/ml) and mixed with an equal volume of tissue lysis buffer (4 M urea,
200 mM Tris, 20 mM NaCl, 200 mM EDTA, pH 7.4).
All suspensions were treated with proteinase K (Merck, Overijse, Belgium) at a final concentration of
2.5 mg/ml for one h at 55 °C. For Gram-positive bacteria, mutanolysin was added after the
proteinase K treatment at a final concentration of 0.11 U/µl and incubated at 37 °C for 15 min.
2.4.2 Nucleic acid extraction by NucliSens EasyMag
The bacterial and phage suspensions (10 -1 – 10-8 dilutions) were extracted by an automated
extraction method based on magnetic beads, NucliSens EasyMag. The suspensions (volume of
400 µl) were transferred to an NucliSens EasyMag cartridge and diluted to 2 ml with lysis buffer
(Biomérieux Durham, US). The Generic 2.0.1 protocol for NucliSens EasyMag was followed for
‘other’ samples with an elution volume of 100 µl. The extraction efficacy of bacterial and phage
suspensions in presence of PBMCs were tested as well. Aliquots of 100 µl PBMC suspension
(107 cells/ml) were used as diluent for a tenfold dilution series of bacterial or phage suspension.
The pretreatment and nucleic acids extraction by NucliSens EasyMag are described above.
2.4.3 Nucleic acid extraction by the column based method of Roche
The undiluted bacterial or phage samples had a pretreatment as described earlier (2.4.1
Pretreatment of samples) but were extracted by a column based method with the High Pure PCR
Template Preparation Kit according to the manufacturer (Roche Diagnostics GmbH, Mannheim,
Germany) with 100 µl as elution volume.
2.4.4 Nucleic acid concentration determination of the standard series
The undiluted samples extracted by the column based method with the High Pure PCR Template
Preparation Kit (Roche) were diluted serially tenfold to make a standard series used for
quantification on the qPCR. The concentration of the standard series in µg/µl was determined by
measuring triplicates of the undiluted standard suspension on Nanodrop 1000 spectropho tometer
14
according to the manufacturer’s instructions (Thermo Scientific, Wilmington, US). For checking
purity of the sample, the 260/280 ratio is taken into account. Accepted values are 1.8 for DNA and
2.0 for RNA, lower values indicate contaminants are present. DNA absorbs maximally at a
wavelength of 260 nm, proteins and other contaminants absorb maximally at 280 nm. Finally, a low
(< 1.8) 260/230 ratio indicates there are co-purified contaminants present, because contaminants
absorb at 230 nm.
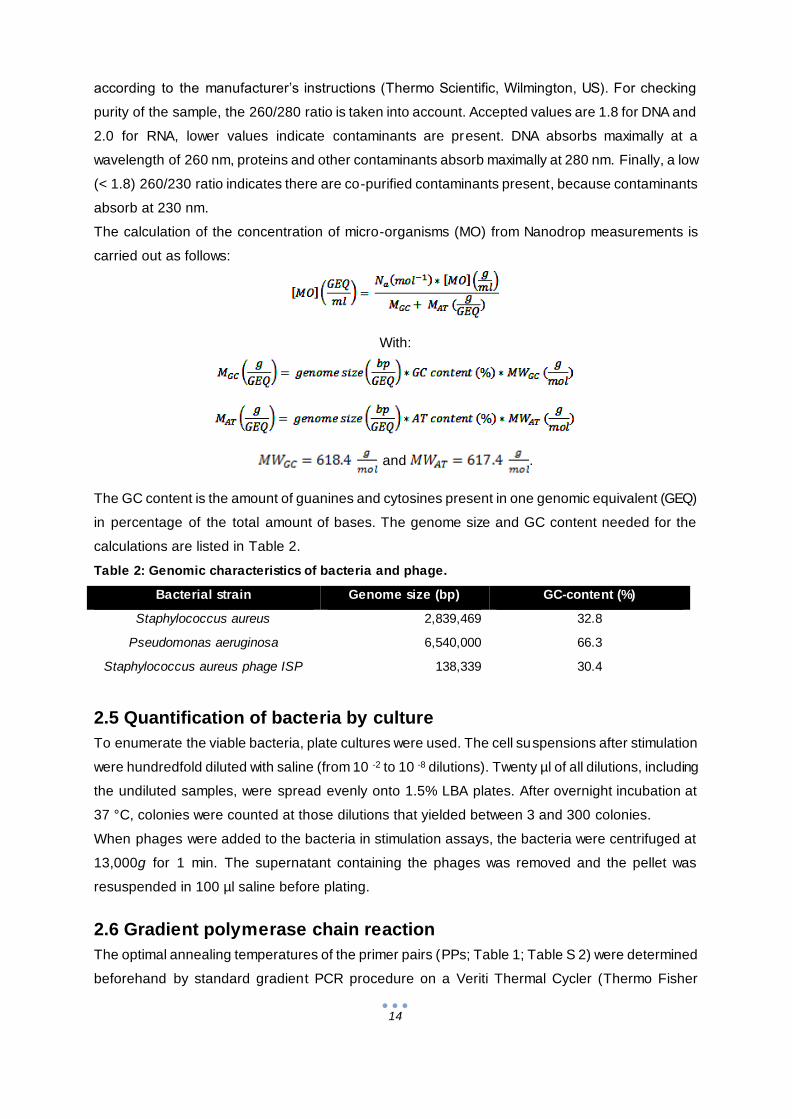
The calculation of the concentration of micro-organisms (MO) from Nanodrop measurements is
carried out as follows:
With:
and .
The GC content is the amount of guanines and cytosines present in one genomic equivalent (GEQ)
in percentage of the total amount of bases. The genome size and GC content needed for the
calculations are listed in Table 2.
Table 2: Genomic characteristics of bacteria and phage.
Bacterial strain Genome size (bp) GC-content (%)
Staphylococcus aureus 2,839,469 32.8
Pseudomonas aeruginosa 6,540,000 66.3
Staphylococcus aureus phage ISP 138,339 30.4
2.5 Quantification of bacteria by culture
To enumerate the viable bacteria, plate cultures were used. The cell suspensions after stimulation
were hundredfold diluted with saline (from 10 -2 to 10 -8 dilutions). Twenty µl of all dilutions, including
the undiluted samples, were spread evenly onto 1.5% LBA plates. After overnight incubation at
37 °C, colonies were counted at those dilutions that yielded between 3 and 300 colonies.
When phages were added to the bacteria in stimulation assays, the bacteria were centrifuged at
13,000g for 1 min. The supernatant containing the phages was removed and the pellet was
resuspended in 100 µl saline before plating.
2.6 Gradient polymerase chain reaction
The optimal annealing temperatures of the primer pairs (PPs; Table 1; Table S 2) were determined
beforehand by standard gradient PCR procedure on a Veriti Thermal Cycler (Thermo Fisher

15
Scientific). Briefly, nucleic acid extracts were made by the alkaline lysis method as described in
“2.2.2 Identification by 16S rRNA gene sequencing”. One µl of the nucleic acid extracts was added
to 1x Faststart PCR master (Roche) and the primers in a final concentration of 0.2 µM. The initial
denaturation took 5 min at 95 °C, followed by 35 cycles of 20 s at 95 °C for denaturation, 1 min at
55 - 65 °C of 6 steps and 1 min at 72 °C. The gradient PCR annealing temperatures were 55 °C,
57 °C, 59 °C, 61 °C, 63 °C and 65 °C. After 5 min at 72 °C, the PCR products were cooled to 4 °C
and loaded on 1% agarose gel and visualized with ethidium bromide (Sigma Aldrich) staining.
2.7 Quantitative polymerase chain reaction
The quantitative polymerase chain reactions (qPCR) were performed with the LightCycler 480. For
the S. aureus isolates and phages, two µl of extract was used in a total of ten µl. The initial
denaturation for S. aureus extracts took 5 min at 95 °C and 55 cycles of amplification consisting of
30 s at 95°C, 30 s at optimal temperature determined per primer pair and 30 s at 72 °C. The
fluorescence of Resolight in High Resolution Melting Master (HRM, Roche Diagnostics) was
measured after each cycle. After amplification, a melting curve analysis was performed by 5 s at
95 °C, 1 s at 65 °C and continuously 97 °C. The samples were cooled for 30 s at 40 °C. The
primers (femA and SA442) were used at a final concentration of 0.5 µM with annealing temperatures
59 °C respectively 65°C. The SA0836 primer pair was used at a concentration of 1 µM and the
SA0836 probe at a final concentration of 0.25 µM in LC480 Probes Master (Roche Diagnostics) with
annealing temperature of 59°C.
For the quantification of S. aureus phage ISP with HRM, the initial denaturation was 5 min at 95 °C.
The amplification with 55 cycles consisted of 10 s at 95 °C, 15 s at 59 °C and 15 s at 72 °C. The
melting curve analysis was performed by 1 min at 95 °C, 1 min at 40 °C, 1 s at 60 °C and
continuously 97 °C, whereafter the samples were cooled for 30 s at 40 °C. The ISP primers
(Table 1) and MgCl2 were used at a final concentration of 0.2 µM and 0.002 µM respectively.
For P. aeruginosa isolates, 2.5 µl extract in a total of ten µl with LC480 Probes Master was used
(Roche Diagnostics). The initial denaturation took 5 min at 95 °C; the 55 cycles of amplification
contained 10 s at 95 °C, 30 s at 55 °C and 1 s at 72 °C. The cooling step was identical to the qPCR
for S. aureus. The oprL primers (Table 1) were used at a final concentration of 0.5 µM, the TaqMan
probe at a concentration of 0.1 µM.
The qPCR of the cDNA for RNA expression of PBMCs (See 2.12 RNA extraction and cDNA
synthesis) was performed using HRM and 0.002 µM MgCl2. The primers (Table S 2) were used at a
final concentration of 0.05 µM. The initial denaturation took 5 min at 95 °C. The 55 cycles of
amplification contained 30 s at 95 °C, 10 s at 59 °C and 30 s at 72 °C. The melting curve analysis
was performed by 5 s at 95 °C, 1 min at 59 °C and continuously 97 °C. Cooling of the samples took
30 s at 40 °C.

16
2.8 Phage propagation
Bacteriophage (Table 3) stocks were prepared using the double-agar overlay method as described
in Merabishvili et al. (2009). Briefly, one ml of the phage preparation containing 10 6 plaque forming
units (PFU) of bacteriophages, as determined by bacterial webbing, was mixed with 3 ml of molten
(45 °C) LB top Bacto agar (0.6 %; Becton Dickinson) and 100 µl of the host strain suspension (end
concentration of 107 CFU/ml) in a sterile 14 ml tube (Falcon, Becton Dickinson). After solidification,
the plates are incubated overnight at 32 °C. Subsequently, 200 µl chloroform (Sigma-Aldrich,
Bornem, Belgium) was added on the lid of the Petri dish and incubated at 4 °C for 1 h. The top layer
of the double-agar layer was scraped off using a sterile Drigalski spatulum and transferred to a
sterile 50 ml centrifugation tube and centrifuged at 6000g for 20 min. The supernatant was
aspirated with a 10 ml sterile syringe (Becton Dickinson) and filtered (0.45 µm, Sartorius, Göttingen,
Germany). The filtered supernatants is centrifuged at 35,000g for 60 min. The supernatant was
removed and five ml saline was added to the phage pellet. This suspension was incubated at 4 °C
overnight, after which the phage suspension was transferred to a sterile 15 ml Falcon tube and the
phage titer was determined.
Table 3: Characteristics of the bacteriophages used.
Legend: a: Phage ISP was isolated from the Intravenous Staphylococcal Phage (ISP) preparation,
produced by the Eliava Institute of Bacteriophage, Microbiology and Virology, Tbilisi, Georgia, in the
1970s.
2.9 Phage titration
The phage titer was determined using a serial hundredfold dilution of the initial phage stock
(provided by the lab) with the overlay method as described earlier by Merabishvilli et al. (2009).
Briefly, one ml of each dilution was mixed with three ml molten (45 °C) LB top Bacto agar (0.6 %)
and 100 µl of the host strain (107 CFU/ml) in a sterile 14 ml tube. The mixture was vortexed and
spread onto 1.5% LB agar plates and incubated overnight at 32 °C. The original phage
concentration could be estimated by counting the distinguishable (< 100 PFU/plate depending on
the plaque size) homogenous plaques, taking the dilution of the initial preparation into account. It is
also possible to determine the phage dilution where bacterial webbing will occur. When the highest
Phage ISP LUZ19 vB_Pae-
Kakheti25 14-1 PNM
Host species S. aureus P. aeruginosa P. aeruginosa P. aeruginosa P. aeruginosa
Initial source From ISP
preparationa
Hospital
sewage Sewage water Sewage water Mtkvari River
Initial place of isolation Tbilisi,
Georgia
Leuven,
Belgium
Kakheti,
Georgia
Regensburg,
Germany
Tbilisi,
Georgia
Initial date of isolation 1920-1930 2004 2012 2000 1999
Family of Caudovirales Myoviridae Podoviridae Siphoviridae Myoviridae Podoviridae

17
amount of distinguishable plaques are formed, the bacteria leave a trace that looks like a web
between the plaques. This phenomenon is called bacterial webbing. The maximum amount of
phages can be produced by taking a tenfold dilution of the phage concentration causing bacterial
webbing (Figure 4).
Figure 4: Bacterial webbing. Webbing occurs when there is maximal amount of distinguishable plaques
formed and the bacterial growth remains visible in a structure that resembles a web.
2.10 Phage purification by cesiumchloride (CsCl) density
ultracentrifugation
The phage preparation was further purified through cesiumchloride (CsCl) density
ultracentrifugation, prior to use in the PBMC stimulation assay, to remove most of the bac terial
contaminants. The phage particles were purified by CsCl gradient ultracentrifugation as described
by Van Belleghem et al. (2017) [58]. Briefly, the phage particles were ultracentrifugated (104,000g
at 4°C) in a CsCl (PanReac AppliChem, Darmstadt, Germany) gradient with densities of 1.33 to 1.70
g/cm³ for 3.5 h. To remove residual CsCl, the phage suspension was dialyzed three times with a
slide-A-lyzer Mini Dialysis device (10,000 molecular weight cut-off; Thermo Scientific, Hudson, NH)
for 30 min at 4 °C against 1 l of saline. The CsCl-purified phage samples were stored at 4°C and
the phage titer was determined the next day. This purification and titration were performed by Drs.
Jonas Van Belleghem.
2.11 PBMC isolation
Peripheral Blood Mononuclear Cells (PBMCs) were isolated from a buffycoat after informed consent
(Blood Transfusion Centre, Ghent), using a Lymphoprep (Axis-Shield, Dundee, Scotland) gradient.
Prior to the PBMC isolation, the buffy coat was diluted to a total volume of 300 ml with HBSS (without
Ca2+ and Mg2+; Thermo Fisher Scientific). Lymphoprep (Axis-Shield, Dundee, Scotland) density
centrifugation was used by first transferring 30 ml buffy coat to a sterile 50 ml Falcon tube fol lowed
by the addition of 10 ml Lymphoprep underneath the buffy coat (underloading). The suspension
was centrifuged at 900g for 20 min to separate different cell types in the blood. The different layers
are formed by density differences (Figure 5).

18
Four layers can be distinguished: (1) polymorphonuclear cells and erythrocytes, (2) the
Lymphoprep solution layer, (3) a small layer of PBMCs and (4) a large top layer of plasma.
Figure 5: PBMC isolation by using lymphoprep.
The PBMCs can be isolated after the centrifuge step when lymphoprep was added. The four cell layers
are formed because of density differences. The layers from bottom to top consist out of:
(1) polymorphonuclear cells and erythrocytes, (2) the lymphoprep solution, (3) PBMCs and (4) plasma.
The PBMCs at the interphase (white cloudy ring) were transferred to a sterile 50 ml Falcon tube and
diluted to 50 ml with HBSS without Ca2+ and Mg2+. After centrifugation (10 min at 450g), the
supernatant was removed. The pellet was resuspended in 50 ml HBSS without Ca2+ and Mg2+. White
blood cell (WBC) counting was done on Sysmex KX-21 (Sysmex Corporation, Kobe, Japan)
according to the manufacturer. The remaining cell suspension was centrifuged (10 min at 350g) and
the cell pellet was resuspended to a final concentration of 2 x 10⁷ PBMCs/ml in heat inactivated fetal
calf serum supplemented with 10% cryoprotectant dimethyl sulfoxide (DMSO). The cells were stored
in liquid nitrogen.
2.12 Stimulation assays
When stored PBMCs were used, the cell suspension was thawed in a 37 °C water bath. Hanks’
Balanced Salt solution without Ca2+ and Mg2+ (HBSS, Thermo Fisher Scientific) was added to thawed
PBMCs until a total volume of 10 ml. This suspension was centrifuged at 350g for 10 min. The
supernatant was removed and the cells were resuspended in five ml HBSS. Cell counting was done
on Sysmex KX-21 (Sysmex Corporation, Kobe, Japan) according to the manufacturer. The
remaining cell suspension was centrifuged at 350g for 10 min. After supernatant removal, the cells
were resuspended in Roswell Park Memorial Institute (RPMI) medium supplemented in 10% heat
inactivated fetal calf serum, 1x minimum essential medium (MEM), 2mM L-glutamin, 0.05 mM 2-
mercaptoethanol, 60 U/ml penicillin and 60 µg/ml streptomycin (cRPMI 1640complete) at a final
concentration of 107 cells/ml. When penicillin and streptomycin were omitted, the cell medium was
called cRPMI 1640no antibiotics. The cell suspension (106 cells per well in a 100 µl volume) of six
different donors were seeded in 96 well plates. A negative control without addition of stimulant was
included. The PBMCs were immediately stimulated with ten µl of S. aureus strain STA04 and

19
SA6538, or P. aeruginosa strain PA573 suspensions (final concentrations: Table 4 ) and with or
without S. aureus phage ISP suspension at a final concentration of 6.68 x 10⁹ GEQ/106 PBMCs or
20 µl of a bacterial and ISP suspension combined for 20 h at 37 °C at 5% CO2. The diluent depends
on the further treatment of the cells.
Bacterial strains Log concentration (GEQ/106 PBMCs)
Stimulation with
cRPMI 1640complete*
Stimulation with
cRPMI 1640no antibiotics*
STA04 7.75 6.32
SA6538 6.81 5.24
PA573 9.02 6.56
Table 4: Final concentrations of bacterial dilutions added to PBMCS.
* cRPMI 1640complete contains 60 U/ml penicillin and 60 µg/ml streptomycin,
cRPMI 1640no antibiotics is cRPMI 1640complete without penicillin and streptomycin.
2.13 RNA extraction of peripheral blood mononuclear cells
After stimulation, the suspensions used for RNA extraction were stored in one ml Qiazol (Qiagen,
Antwerp, Belgium) at -80 °C until use. The nucleic acid extraction for the defrosted Qiazol cell
suspensions was performed by NucliSens EasyMag as described previously (2.4.2 Nucleic acid
extraction by NucliSens EasyMag). The nucleic acid extract was thereafter exposed to 0.2 U/µl RNA
qualified DNase I (Promega, Leiden, Netherlands) in the presence of a 10x reaction buffer
(Promega) for 30 min at 37 °C. DNase was inactivated by adding RQ1 DNase Stop Solution for
10 min at 65 °C as described by the manufacturer (Promega).
2.14 cDNA synthesis
The RNA was reverse transcribed by adding 10 U/µl RevertAid RT, 1 mM deoxynucleotide
triphosphate (dNTP) mix, 5 µM random hexamer primer, 1 U/µl Riboclock RNase Inhibitor and
reaction buffer in nuclease free water to 40 µl of RNA in triplicate. The suspensions were loaded on
the Veriti Thermal Cyler (Thermo Fisher Scientific) for 5 min at 25 °C followed by 60 min at 42 °C.
The cDNA synthesis reactions is terminated by heating the suspensions for 5 min at 70 °C. The
newly synthesized cDNA was stored at – 80 °C prior to use in an RT-qPCR.
2.15 Statistical analysis
Data were analyzed using the PC-statistical package JMP (Version 10. SAS Institute Inc., Cary, NC,
US). Data were analyzed with ANOVA and mean comparisons were performed for each parameter
by Student’s t-test. Error bars in graphs represent the standard error.

20
3 Results and discussion
In this master dissertation, the amount of bacteria and phages in presence of peripheral
mononuclear blood cells (PBMCs) were determined. First, the sensitivity of the bacterial strains for
the phages was tested (3.1 Host specificity) on different bacterial strains to determine phage
sensitive and phage insensitive bacterial strains (Table 3). Secondly, the DNA extraction efficacy
(3.2 DNA extraction efficacy for bacteria and phages) was determined for DNA extracted from the
bacterial strains or from the phages. Third, is quantity of phages and bacteria after PBMC
stimulation was determined (3.3 Stimulation of PBMCs by bacteria and phages) by culture and
qPCR. This last part is the main subject of this master dissertation.
3.1 Host specificity
The host specificity of phages was determined using different bacterial isolates (Table 3,Table S 1).
The phages used during this master dissertation are known to infect Staphylococcus aureus (ISP)
or Pseudomonas aeruginosa (LUZ19, vB_Pae-Kakheti25, 14-1 and PNM). For the S. aureus phage
and the four P. aeruginosa phages, we also used bacterial strains from closely related species as
negative controls, i.e. S. epidermidis, S. haemolyticus, S. saprophyticus, S. schleiferi, and P.
fluorescens, P. putida.
3.1.1 Identification of isolates
The isolates (Table S 1) were defrozen and spread on a TSA + 5% SB plate. After overnight
incubation at 37 °C, all isolates had formed visible colonies, except the P. fluorescens and P. putida
strains (Figure 6A): P. fluorescens PSE029 did not grow and P. fluorescens PSE028, PSE031 and
P. fluorescens PSE108 had a delayed growth (> 1 week incubation).
Figure 6: Plating strategy for P. fluorescens and P. putida that did not grow or had a delayed
growth. (A) First, all bacteria were plated on a TSA + 5% SB. (B) Pseudomonas fluorescens and P.
putida did not grow or had a delayed growth in A and were plated on a MacConkey and a new TSA + 5%
SB. (C) The colonies formed on the TSA + 5% SB plate in B were transferred on a P. aeruginosa
selective medium cetrimide and a new TSA + 5% SB plate. Colonies grown on cetrimide plates were
identified, if there were no colonies on cetrimide, the colonies on TSA + 5% SB were used.

21
Therefore, the complete suspension of the isolate, that was stored at – 80 °C, was defrosted and
half of the content was plated on a non-selective TSA + 5% sheep blood plate and a Gram-negative
selective MacConkey plate (Figure 6B). There were no colonies found on the MacConkey plates of
the samples after more than 2 days incubation, which might indicate that there were no Gram-
negative bacteria present, the growth was strongly delayed, or the bacteria were not viable anymore
after storage.
The overnight incubated TSA + 5% SB plates colonies were subsequently transferred to a new TSA
+ 5% SB plate and a cetrimide plate (Figure 6C). There was visible growth on the cetrimide plate
with PSE031 (reidentified as Stenotrophomonas maltophilia by 16S rRNA gene sequencing).
Cetrimide agar, containing the antibiotic cetyltrimethylammonium bromide, is a selective medium for
the isolation of P. aeruginosa. One colony from the TSA + 5 % plate was used for reidentification by
MALDI-TOF, but did not give conclusive results for two of the P. fluorescence strains, i.e. PSE031
and PSE028. Subsequently, these strains were further identified using 16S rRNA gene sequencing.
The sequencing results, after BLASTing the obtained sequences, revealed that the strains present
in the samples did not correspond to the names written on the tubes (Table 5). The P. fluorescens
strain PSE029 was reidentified as Streptococcus pneumoniae by MALDI-TOF. Pseudomonas putida
PSE108 was reidentified by MALDI-TOF as Micrococcus luteus. The P. fluorescens strains PSE031
and PSE028 could not be identified by MALDI-TOF and were reidentified by 16S rRNA gene
sequencing as Stenotrophomonas maltophilia. This indicates that either these samples were
contaminated or the initial identification was not reliable.
Table 5: Reidentification of Pseudomonas isolates.
Original number Bacterial
strain
Original identification Reidentification
LMG 02189 PSE029 P. fluorescens Streptococcus pneumoniaea
U91 04427 PSE031 P. fluorescens Stenotrophomonas maltophiliab
LMG 01794 PSE028 P. fluorescens Stenotrophomonas maltophiliac
LMG 02171 PSE108 P. putida Micrococcus luteusa
a: identified by MALDI-TOF after growth on TSA + 5% SB agar b: identified by 16S rRNA gene sequencing after growth on cetrimide agar b: identified by 16S rRNA gene sequencing after growth on TSA + 5% SB agar
3.1.2 Evaluation of the host specificity
The purpose of the evaluation of the host specificity of the phages, or the phage susceptibility of
the bacteria, was to determine which bacteria were sensitive to the phages and which were not to
select a phage insensitive strain for each species (Table 6). Previously, Vandersteegen et al.
(2011) tested the host specificity of S. aureus phage ISP for S. aureus and S. haemolyticus from
22
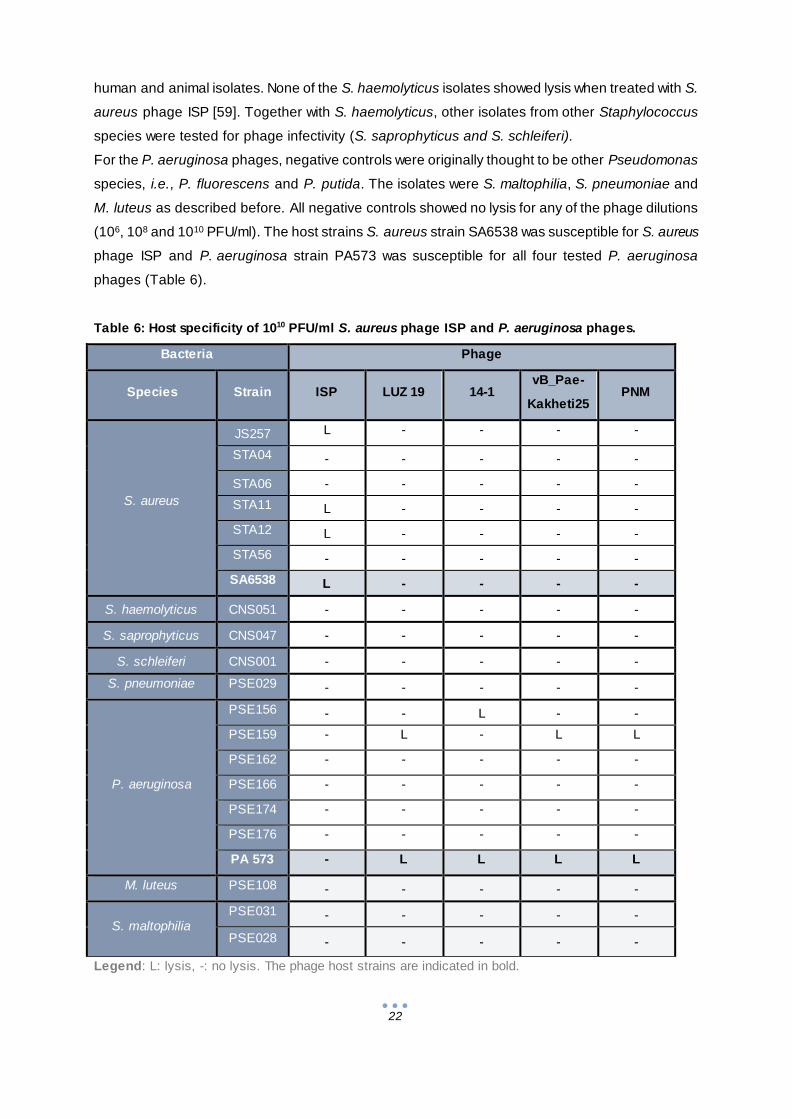
human and animal isolates. None of the S. haemolyticus isolates showed lysis when treated with S.
aureus phage ISP [59]. Together with S. haemolyticus, other isolates from other Staphylococcus
species were tested for phage infectivity (S. saprophyticus and S. schleiferi).
For the P. aeruginosa phages, negative controls were originally thought to be other Pseudomonas
species, i.e., P. fluorescens and P. putida. The isolates were S. maltophilia, S. pneumoniae and
M. luteus as described before. All negative controls showed no lysis for any of the phage dilutions
(106, 108 and 1010 PFU/ml). The host strains S. aureus strain SA6538 was susceptible for S. aureus
phage ISP and P. aeruginosa strain PA573 was susceptible for all four tested P. aeruginosa
phages (Table 6).
Table 6: Host specificity of 1010 PFU/ml S. aureus phage ISP and P. aeruginosa phages.
Legend: L: lysis, -: no lysis. The phage host strains are indicated in bold.
Bacteria Phage
Species Strain ISP LUZ 19 14-1 vB_Pae-
Kakheti25 PNM
S. aureus
JS257 L - - - -
STA04 - - - - -
STA06 - - - - -
STA11 L - - - -
STA12 L - - - -
STA56 - - - - -
SA6538 L - - - -
S. haemolyticus CNS051 - - - - -
S. saprophyticus CNS047 - - - - -
S. schleiferi CNS001 - - - - -
S. pneumoniae PSE029 - - - - -
P. aeruginosa
PSE156 - - L - -
PSE159 - L - L L
PSE162 - - - - -
PSE166 - - - - -
PSE174 - - - - -
PSE176 - - - - -
PA 573 - L L L L
M. luteus PSE108 - - - - -
S. maltophilia PSE031 - - - - -
PSE028 - - - - -

23
Most strains that were examined were insensitive for phages. For the tested S. aureus strains, three
out of six strains were lysed by the S. aureus phage ISP, i.e. JS257, STA11 and STA12. The only
susceptible strain for P. aeruginosa phage 14-1 was PSE156 and the only susceptible strain for P.
aeruginosa phages LUZ19, vB_Pae-Kakheti25 and PNM was PSE 159 (Table 6).
One phage insensitive strain was chosen for each of the two bacterial species, i.e. S. aureus strain
STA04 (insensitive to phage ISP) and P. aeruginosa strain PSE176 (insensitive against LUZ19,
14-1, vB_Pae-Kakheti25 and PNM). The host strains S. aureus strain SA6538 and P. aeruginosa
strain PA573 were used as the phage sensitive strains.
3.2 DNA extraction efficacy for bacteria and phages
To determine how many phages or bacterial cells are minimally needed to extract DNA, the
extraction efficacy was tested using tenfold dilution series of the S. aureus phage ISP or the
bacterial strain (i.e. S. aureus STA04 or SA6538 and P. aeruginosa strain PA573).
3.2.1 Primer specificity and annealing temperature
The tenfold dilution series were extracted by NucliSens EasyMag, the standard series was extracted
by the High Pure PCR Template Preparation Kit (Roche method). Before qPCRs were performed,
the optimal annealing temperature was determined using a gradient PCR (2.6 Gradient polymerase
chain reaction).
3.2.1.1 Staphylococcus aureus primer specificity and annealing temperature
In total, four S. aureus primer pairs (femA, nucB, SA0836 and SA442) were tested on STA04 and
SA6538. The femA primers amplify the gene transcribing for aminoacyltransferase femA, which
contributes to the stability of the peptidoglycan of S. aureus [60]. The nucB primers target the nucB
gene encoding for a nuclease [61]. Primer pair SA0836 (Table 1) corresponds to nucleotides
51409–51429 and 51981–51961 of the transcriptional regulator gene SA0836, uniquely present in
S. aureus [62]. The product of SA442 primers is a 178-bp fragment [63] that did not give any
alignments with the ISP genome on BLAST.
In the gradient PCR, the positive control for the primers was nucleic acid ext ract of the S. aureus
strain STA01 (ATCC 29213). An extract of S. haemolyticus served as a negative control (Figure 7).
The femA primer pair was more specific compared to the nucB primer pair, as there was
amplification at annealing temperatures ranging from 55 °C to 59 °C for S. haemolyticus (Figure 7).
For femA primers, there was only amplification at 57 °C for the S. haemolyticus negative control
strain. The optimal annealing temperature for femA primers was 59 °C. At this temperature, the
bands were most dense in the different technical replicates.

24
Figure 7: Gradient PCR for S. aureus primers femA and nucB.
Temperatures from 55 °C to 65 °C were included in the gradient PCR. Reference strain was S. aureus strain
ATCC 29213. The extracts were amplified by femA (black) and nucB (orange). L: 100 bp ladder.
For the gradient PCR for primer pair SA0836, two primer concentrations were tested. First, a final
concentration of 0.5 µM primers was tested, the same concentration used for the primers described
before. Subsequently, a final primer concentration of 1 µM was tested as described by the primer
developers [64]. The gradient PCR with a 0.5 µM primer concentration gave no visible amplification,
as no PCR products were visible on the agarose gel (Figure S 1 A). In the gradient PCR with 1 µM
SA0836 primer concentration, there was amplification for S. aureus strains but the S. aureus phage
ISP DNA was amplified as well (Figure S 1B). The optimal annealing temperature was determined by
gradient PCR as 59 °C.
Despite the alignment results, S. aureus phage ISP was still amplified by SA442 primers. An
annealing temperature of 65 °C was chosen because there was less amplification of S. aureus
phage ISP DNA and a high amplification of SA6538 DNA visible (Figure S 2).
3.2.1.2 Pseudomonas aeruginosa primer annealing temperature
For P. aeruginosa, the primer pair oprL was tested for host strain P. aeruginosa strain PA573
and for P. aeruginosa PA14 (which was used as a positive control).
The oprL primer pair amplifies the oprL gene encoding the peptidoglycan-associated lipoprotein
oprL specifically for P. aeruginosa strains [65]. The optimal annealing temperature was 59 °C as
well. For the positive control, high amplification (clear blue dots inside the bands) was seen for 59,
61 and 63 °C. In technical replicate PA573 II, there was high amplification at 57 and 59 °C. This
gradient PCRs revealed that the annealing temperature for femA, SA0836 and oprL primers were all
59 °C, whereas the annealing temperature for SA442 primers was 65 °C. The primer had already
been tested extensively by De Vos et al. (1997).

25
Figure 8: Gradient PCR for P. aeruginosa primer pair oprL.
Temperatures from 55 °C to 65 °C were included in the gradient PCR. Standard strain was P. aeruginosa
strain PA14. The extracts were amplified by oprL (blue). L: 100 bp ladder.
3.2.1.3 Staphylococcus aureus phage ISP primer specificity and annealing temperature
For phage primers, it is important that the specificity of the primers is sufficiently high to exclude
amplification of the host strain. Otherwise, possible host cell debris remaining after phage
propagation could create false positive results The S. aureus phage ISP primers were previously
developed by Stefan Vermeulen, Hans Duyvejonck performed the gradient PCR for these primers
on S. aureus phage ISP lysates directly added to the PCR mixture. The optimal annealing
temperature was 59 °C for all ISP primer pairs (data not shown).
The specificity of the four primer pairs with the most stabile melting curves, as determined by Hans
Duyvejonck (data not shown), were tested for specificity. All S. ISP primer pairs amplified S. aureus
phage ISP, as well as S. aureus strain STA04 and S. aureus strain SA6538 (Figure 9). The highest
amplification of S. aureus phage ISP was accomplished by ISP primer pair 5. ISP primer pair 6 had
the lowest amplification for the S. aureus strains. This primer pair was checked for other
Staphylococcus spp, i.e., S. haemolyticus, S. epidermidis and S. saprophyticus (Figure 10).
Figure 9: Primer specificity of S. aureus ISP primer pairs for phage sensitive (SA6538) and
phage insensitive (STA04) strains.
ISP primer pair (pp) 2, 5, 6 and 7 were used.
Legend: HPLC: negative control; L: 100 bp ladder.

26
Figure 10: Primer specificity of S. aureus phage ISP primer pairs for other Staphylococcus spp.
Bacterial nucleic acid extracts amplified by ISP pp 6 loaded on agarose gel.
Legend: L: 100 bp ladder; STAHAE: S. haemolyticus; STAEPI: S. epidermidis; STASAP: S. saprophyticus.
HPLC: negative control.
Staphylococcus haemolyticus, S. epidermidis and S. saprophyticus were amplified by ISP primer
pair 6 as well. It has to be noted that the extracts used for the PCR reactions using S. aureus
primers with positive results for S. aureus phage ISP contained high concentrations of nucleic acids
in the range of 1010 GEQ/ml (Figure 7, Figure 9, Figure 10). Therefore, we assumed that it is
possible that the problem of amplification of bacterial DNA by the phage primers was due to these
high amounts of bacterial DNA and would not pose a problem at lower concentrations of bacterial
DNA. Thus, the phage ISP qPCR was tested for amplification of different concentrations of
bacterial DNA.
3.2.2 DNA extraction efficacy of S. aureus and P. aeruginosa
First, the extraction efficacy for the four bacterial strains (STA04, SA6538, PSE176 and PA573) was
determined.
Tenfold bacterial dilution series were used for the DNA extraction by NucliSens EasyMag and
quantified by qPCR. The standard series for qPCR was extracted using the High Pure PCR
Template Preparation Kit (Roche).
The concentration of samples by qPCR can be calculated by interpolating the Cq values in the
standard curve equation. The standard curve equation (Figure 11) was obtained by plotting the log
transformed concentration of the standard dilutions (measured by Nanodrop and recalculated to
GEQ/ml as described in “2.4.4 Nucleic acid concentration determination of the standard series ”)
against the Cq value (obtained by qPCR). The coefficient of determination (R²) is a measure of
accuracy, i.e., how good a model explains and can predict outcomes, with 0 a bad fit and 1 a perfect
fit of linear regression.

27
Figure 11: Example of qPCR standard curve.
The standard curve equation is y= -0.2521 + 14.034.
Quantification of bacteria was possible by the standard dilutions of the bacteria ( Figure S 3). In
general, the bacterial extraction efficacy was relatively low (Figure 12). The S. aureus strains could
be extracted until 104 to 105 CFU/ml for STA04 and SA6538 respectively. The P. aeruginosa strains
could be extracted both until a range of 104 CFU/ml.

28
Phage resistant bacteria Phage sensitive bacteria
S.
au
reu
s
P.
aeru
gin
osa
Figure 12: Extraction efficacy of Staphylococcus aureus and Pseudomonas aeruginosa bacteria.
Bacterial concentration by culture (white) and bacteria quantification by qPCR (black):
S. aureus (A) STA04 and (B) SA6538, P. aeruginosa (C) PSE176 and (D) PA573. The concentration by
culture was theoretically determined by dividing the original concentration by 10. No bars indicates no Cq
value was obtained.
The concentration measured by qPCR was controlled by a theoretical concentration determined by
culture. The highest bacterial concentration was determined by culture. To create a theoretical
standard curve, the original concentration was divided by 10 for each tenfold dilution.
3.2.3 DNA extraction efficacy in presence of PBMCs
Improvements of the extraction efficacy by NucliSens EasyMag could be possible by including
carrier DNA. Carrier DNA is DNA originating from another species that serves as bulk DNA,
enhancing the adhesion of silica beads to DNA [67]. In the stimulation assay described in “3.3
Stimulation of PBMCs by bacteria and phages”, the bacteria will be added to human PBMCs before
extraction. Therefore it was decided to determine the extraction efficacy of the two host strains

29
S. aureus strain SA6538 and P. aeruginosa strain PA573 in the presence of PBMCs, so the DNA
from PBMCs could act as carrier DNA (Figure 13).
3.2.3.1 Extraction efficacy of S. aureus in presence of PBMCS
The quantification of S. aureus by qPCR revealed that the detection level was higher than the one
by culture, namely 5.50 x 10² CFU/ml compared to the S. aureus in presence of PBMCs. With qPCR
detection was possible until 9.40 x 10³ GEQ/ml (corresponding to a Cq value of 42.3) (Figure 13).
Quantification of bacteria was possible through use of a standard series made using a tenfold
dilution of bacterial DNA (Figure S 4). The concentration obtained by qPCR remained constant from
the 5th dilution (9.40 x 10³ GEQ/ml) onwards, whereas in theory the concentration would drop. This
indicates that the extraction limit of EasyMag extraction is 9.40 x 10³ GEQ/ml which need to be
present in order to extract DNA.
A
B
Figure 13: Extraction efficacy of S. aureus and P. aeruginosa host strains in presence of PBMCs.
Bacteria (A) S. aureus SA6538 and (B) P. aeruginosa PA573 with 106 PBMCs were extracted together and
measured on qPCR. Plating was done as a control. No bar means no Cq value was obtained.

30
The standard curve of SA6538 in the qPCR with addition of PBMCs could measure concentrations
until 103 GEQ/ml, for 102 GEQ/ml, no Cq value was obtained. The highest Cq value was 43.22,
corresponding for with 1.43 x 10³ GEQ/ml. In comparison with the standard curves, the extraction
efficacy of the bacteria with PBMCs was in the same range (4.66 x 10³ GEQ/ml).
3.2.3.2 Extraction efficacy of P. aeruginosa in presence of PBMCS
Similar to the results of S. aureus, the difference of Cq values dropped in lower dilutions for both the
P. aeruginosa extracts and P. aeruginosa in presence of PBMCs extracts (Figure 13). The
concentration obtained by qPCR remained constant from the 6 th dilution (3.02 x 10² GEQ/ml)
onwards, whereas in theory the concentration would drop. When the results with deviant Cq values
were excluded, the efficacy was equal for concentration determination by culturing and by qPCR
(detection level was 102 GEQ/ml). The addition of PBMCs as carrier DNA did not have an influence
on the extraction efficacy of P. aeruginosa. The standard curve of PA573 in the qPCR with addition
of PBMCs could measure concentrations until 103 GEQ/ml, for 102 GEQ/ml, no Cq value was
obtained (Figure S 4). For the standard curve, the highest Cq value was 43.22, corresponding to
1.29 x 10³ GEQ/ml. In comparison with the standard curves, the extraction efficacy of the bacteria
with PBMCs was lower (1.52 x 10² GEQ/ml). Extraction efficacy with this qPCR set-up could not be
improved any further.
3.2.4 Amplification efficiency of S. aureus in presence of phages and vice versa
We already hypothesize that high bacterial DNA concentration was a possible reason for false
positive amplification in S. aureus phage ISP qPCR (3.2.1.1 Staphylococcus aureus primer
specificity and annealing temperature). The concentration of bacterial nucleic acids was therefore
gradually decreased in presence of a constant high concentration of S. aureus phage ISP in a 1:1
mixture and measured by qPCR. Eight tenfold dilutions of S. aureus strain SA6538 nucleic acids
(ranging from 1.43 x 10² to 1.43 x 10⁹) were added to a high concentration of ISP nucleic acid
extracts (4.31 x 10¹⁰ GEQ/ml). ). The eight tenfold dilutions of S. aureus STA04 (ranging from 4.72 x
102 to 4.72 x 10⁹ GEQ/ml) were tested in the same concentration of ISP (Figure S 5). The reverse
was checked by qPCR as well: eight extracts of phage dilutions and a high concentration of S.
aureus nucleic acid extract (1.43 x 10¹⁰ GEQ/ml; Figure 14). Because of shortage of ISP nucleic
acids, the extraction efficacy of S. aureus STA04 was tested for two bacterial dilutions instead of
eight (Figure S 5). As a control, the standard dilutions (Figure S 7) were quantified by interpolating
the Cq values of the standard dilutions into the standard equation (Figure 14: dotted lines).
The detection threshold for S. aureus strain STA04 was 4.72 x 10⁵ GEQ/ml and 1.43 x 10⁵ GEQ/ml
for S. aureus strain SA6538. The standard dilutions of S. aureus strain SA6538 were detected as
low as 104 S. aureus strain STA04 and 104 S. aureus strain SA6538 GEQ/ml (Figure S 6,
Figure S 8).
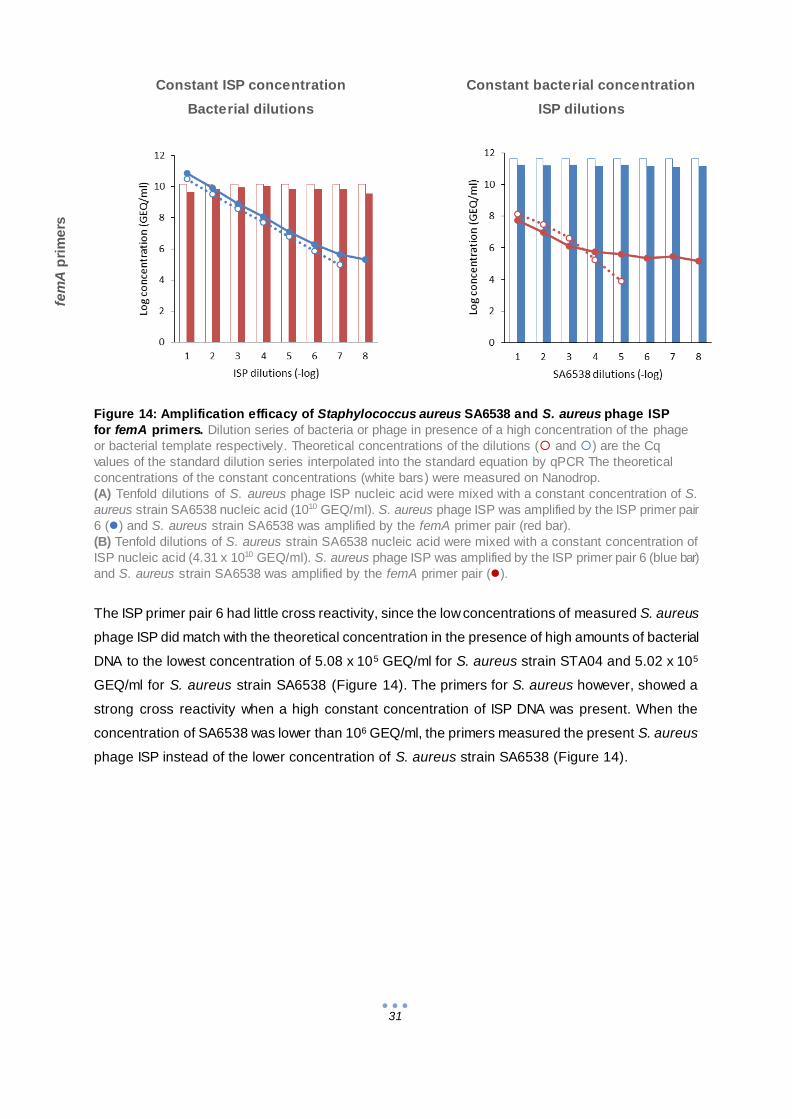
31
Figure 14: Amplification efficacy of Staphylococcus aureus SA6538 and S. aureus phage ISP
for femA primers. Dilution series of bacteria or phage in presence of a high concentration of the phage
or bacterial template respectively. Theoretical concentrations of the dilutions ( and ) are the Cq
values of the standard dilution series interpolated into the standard equation by qPCR The theoretical
concentrations of the constant concentrations (white bars) were measured on Nanodrop.
(A) Tenfold dilutions of S. aureus phage ISP nucleic acid were mixed with a constant concentration of S.
aureus strain SA6538 nucleic acid (1010 GEQ/ml). S. aureus phage ISP was amplified by the ISP primer pair
6 () and S. aureus strain SA6538 was amplified by the femA primer pair (red bar).
(B) Tenfold dilutions of S. aureus strain SA6538 nucleic acid were mixed with a constant concentration of
ISP nucleic acid (4.31 x 10¹⁰ GEQ/ml). S. aureus phage ISP was amplified by the ISP primer pair 6 (blue bar)
and S. aureus strain SA6538 was amplified by the femA primer pair ().
The ISP primer pair 6 had little cross reactivity, since the low concentrations of measured S. aureus
phage ISP did match with the theoretical concentration in the presence of high amounts of bacterial
DNA to the lowest concentration of 5.08 x 10⁵ GEQ/ml for S. aureus strain STA04 and 5.02 x 10⁵
GEQ/ml for S. aureus strain SA6538 (Figure 14). The primers for S. aureus however, showed a
strong cross reactivity when a high constant concentration of ISP DNA was present. When the
concentration of SA6538 was lower than 106 GEQ/ml, the primers measured the present S. aureus
phage ISP instead of the lower concentration of S. aureus strain SA6538 (Figure 14).
Constant ISP concentration
Bacterial dilutions
Constant bacterial concentration
ISP dilutions
fem
A p
rim
ers
A B

32
To improve the amplification efficiency of S. aureus SA6538 from 103 GEQ/ml to 102 GEQ/ml, other
primer pairs were tested with the same qPCR set-up (Table 1, Figure 15). The detection level of S.
aureus strain SA6538 primers in presence of S. aureus phage ISP when SA0836 primers were used
was very low compared to other. For DNA of S. aureus strain STA04, measurements until
STA04 109 GEQ/ml were possible, for S. aureus strain SA6538 until 108 GEQ/ml (Figure 15 A & B).
The standard curves could measure DNA until a concentration of 105 GEQ/ml for S. aureus strain
STA04 and 104 GEQ/ml for S. aureus strain SA6538 (Figure S 6, Figure S 8), indicating the qPCR
protocol was not the cause of the low amplification efficiency, but the extraction product itself
(S. aureus extract combined with S. aureus phage ISP extract).
STA04 SA6538
SA
08
36
A
B
SA
44
2
C
D
Figure 15: Extraction efficacy of S. aureus primers in presence of a constant concentration of
ISP DNA. Dilution series of bacteria in presence of a high concentration of S. aureus phage ISP.
Theoretical concentrations of the dilutions () are the standard dilution series measured by qPCR. The
constant concentrations of ISP present in the samples (white bars) were measured on Nanodrop.
Tenfold dilutions of S. aureus strain SA6538 nucleic acid (B & D) and S. aureus strain STA04 (A & C) were
mixed with a constant concentration of S. aureus phage ISP nucleic acid (4.31 x 10¹⁰ GEQ/ml). S. aureus
phage ISP was amplified by the ISP PP 6 (blue bar in A & B) and the S. aureus strains were amplified by the
SA0836 pp (A & B) and SA442 (C & D) (). STA04 is S. aureus phage ISP insensitive, Staphylococcus
aureus SA6538 is S. aureus phage ISP sensitive.

33
The concentration of S. aureus phage ISP was not measured in the qPCR using SA442 primers for
S. aureus amplification, since there were no differences found in the previous measurements of
femA and SA0836 primer qPCRs (blue bars in Figure 14 A & B and Figure 15 A & B). The constant
concentration of S. aureus phage ISP was measured by Nanodrop (white bars in Figure 15) The
concentration of STA04 and SA6538 could be determined by qPCR up until 107 and 106 GEQ/ml
respectively when SA442 primers were used. In comparison to the standard curves of S. aureus
strain SA6538 (Figure S 7), the samples with mixed bacterial and phage nucleic acids had a lower
detection limit.
3.2.5 FemA primers qPCR product identification of samples with a constant
concentration of ISP and a S. aureus dilution
The qPCR products by femA primers of S. aureus strain SA6538 dilutions in a constant amount of
S. aureus phage ISP DNA extract (Figure 14) were put on an agarose gel to check the length of the
product (Figure 16). There were bands visible for all dilutions of S. aureus strain SA6538 DNA
together with S. aureus phage ISP DNA at the same length (approximately 300 bp). The femA
primers produce a 306-bp product [68], indicating that the femA gene could be present on S.
aureus phage ISP as alignment. The melting curves of the qPCR also confirmed that a single and
the same amplicon had been generated by qPCR because all qPCR products had the same melting
temperature (Figure S 9).
Figure 16: Agarose gel electrophoresis of qPCR products by femA primers of SA6538 tenfold
dilutions in presence of a constant concentration of ISP nucleic acids.
The qPCR products by femA primers from Figure 14A were loaded on an agarose gel.
The samples resulting in this qPCR products were amplified by 16S rRNA gene primers (Table 1)
and send for 16S rRNA sequencing to determine the source (bacterial or phage) of the qPCR
products. The sequencing results, after BLASTing the obtained sequences, revealed that all
products were originating from the S. aureus phage ISP.
34
3.3 Stimulation of PBMCs by bacteria and phages
The bacteria S. aureus strain STA04 and SA6538, and P. aeruginosa strain PA573 and/or S.
aureus phage ISP were used as stimulant for PBMCs. In the first stimulation assay, standard cRPMI
1640 cell medium that includes antibiotics penicillin and streptomycin was used and there was a
centrifugation (13,000g) step to remove the phages when the stimulations were cultured. In the
second stimulation assay, the centrifugation step was omitted and penicillin and streptomycin were
not included to the cRPMI 1640 cell medium.
3.3.1 Stimulation assay with standard cRPMI 1640complete cell medium
For bacterial quantification before stimulation (t0), the bacterial suspension used as stimulant was
quantified by culturing. The PBMCs in cRPMI medium were stimulated for 20 h (t20) and stored until
further use or plated immediately.
3.3.1.1 Quantification of bacteria after stimulation with cRPMI 1640complete cell medium
For bacterial quantification at t20, the stimulation condition was cultured and quantified by qPCR, to
determine whether there was a difference between culture and qPCR quantification . Before plating,
the suspensions were centrifuged and the supernatant containing the phages was removed to avoid
false negative results by phage infection as described previously [69]. The amount of bacteria
decreased significantly at t20 for all viable bacteria (Figure 17). According to the culturing results,
there was a decrease of 4.49 x 10⁶ CFU when ISP was added to STA04, and a smaller decrease of
7.69 x 10⁴ S. aureus strain SA6538 CFU when ISP and PBMCs were present.
These decreases could not be confirmed by qPCR, as S. aureus strain SA6538 and S. aureus
strain SA6538 for qPCR had non-significant differences (Figure 17, p-values > 0.05). There was no
significant difference for P. aeruginosa strain PA573, as expected (p-value > 0.05). The primers
used could not detect bacterial concentrations lower than 104 GEQ/ml (Figure 15).

35
3.3.1.2 Quantification of phages after stimulation with cRPMI 1640complete cell medium
The quantification of phages was done by qPCR (Figure 18). There was no difference in the
amount of phages before or after treatment. The p-values for the condition stimulated with S.
aureus phage ISP in comparison with stimulations with S. aureus phage ISP in combination with S.
aureus strain STA04 or SA6538, or P. aeruginosa strain PA573 were respectively 0.47, 0.46 and
0.72.
A
B
C
Figure 17: Bacterial quantification by culture and qPCR after 20 h PBMC stimulation in cRPMI 1640 complete cell medium. Bacterial suspensions of (A) STA04, (B) SA6538 and (C) PA573 used for stimulation on t 0 (white bars), stimulation suspensions
with bacteria or bacteria and ISP as stimulant at t20 concentrations measured by culturing (grey bars) and by qPCR (black bars).
The PBMCs were suspended in cRPMIcomplete. The SA442 and oprL primers were used for qPCR. S. aureus strain SA6538 is
S. aureus phage ISP sensitive, S. aureus strain STA04 and P. aeruginosa strain PA573 are S. aureus phage ISP insensitive.
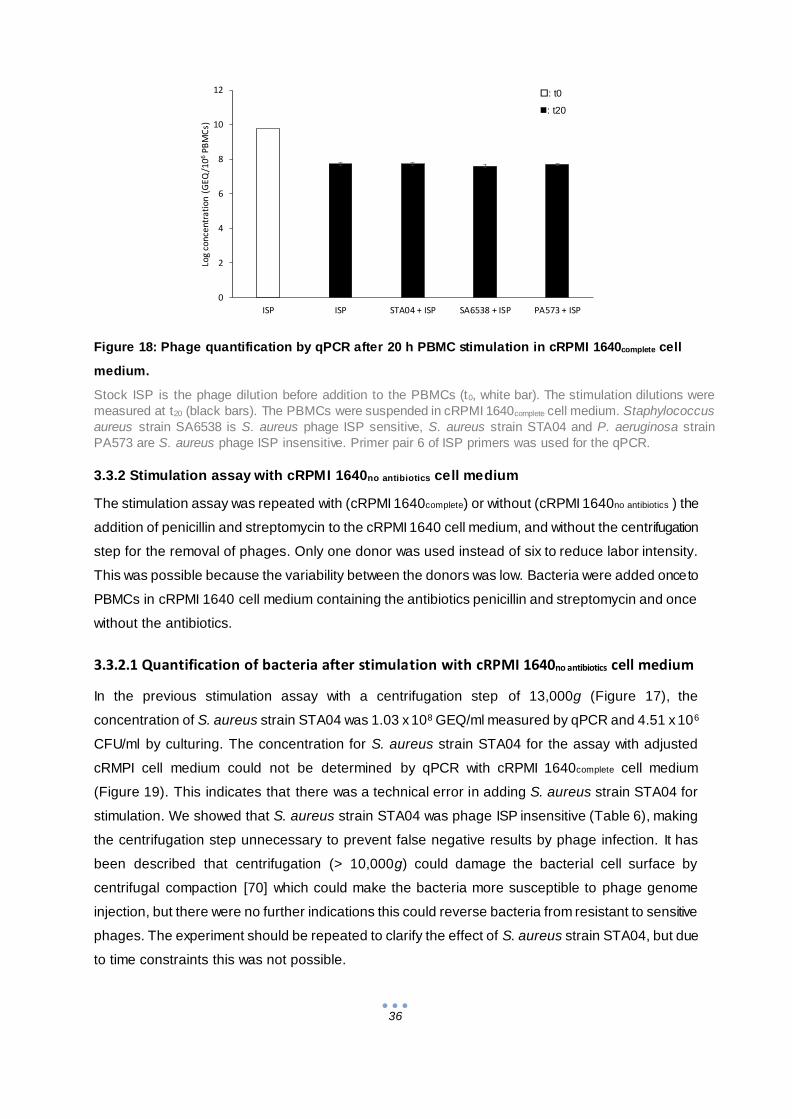
36
3.3.2 Stimulation assay with cRPMI 1640no antibiotics cell medium
The stimulation assay was repeated with (cRPMI 1640complete) or without (cRPMI 1640no antibiotics ) the
addition of penicillin and streptomycin to the cRPMI 1640 cell medium, and without the centrifugation
step for the removal of phages. Only one donor was used instead of six to reduce labor intensity.
This was possible because the variability between the donors was low. Bacteria were added once to
PBMCs in cRPMI 1640 cell medium containing the antibiotics penicillin and streptomycin and once
without the antibiotics.
3.3.2.1 Quantification of bacteria after stimulation with cRPMI 1640no antibiotics cell medium
In the previous stimulation assay with a centrifugation step of 13,000g (Figure 17), the
concentration of S. aureus strain STA04 was 1.03 x 10⁸ GEQ/ml measured by qPCR and 4.51 x 10⁶
CFU/ml by culturing. The concentration for S. aureus strain STA04 for the assay with adjusted
cRMPI cell medium could not be determined by qPCR with cRPMI 1640complete cell medium
(Figure 19). This indicates that there was a technical error in adding S. aureus strain STA04 for
stimulation. We showed that S. aureus strain STA04 was phage ISP insensitive (Table 6), making
the centrifugation step unnecessary to prevent false negative results by phage infection. It has
been described that centrifugation (> 10,000g) could damage the bacterial cell surface by
centrifugal compaction [70] which could make the bacteria more susceptible to phage genome
injection, but there were no further indications this could reverse bacteria from resistant to sensitive
phages. The experiment should be repeated to clarify the effect of S. aureus strain STA04, but due
to time constraints this was not possible.
Figure 18: Phage quantification by qPCR after 20 h PBMC stimulation in cRPMI 1640complete cell
medium.
Stock ISP is the phage dilution before addition to the PBMCs (t0, white bar). The stimulation dilutions were
measured at t20 (black bars). The PBMCs were suspended in cRPMI 1640complete cell medium. Staphylococcus
aureus strain SA6538 is S. aureus phage ISP sensitive, S. aureus strain STA04 and P. aeruginosa strain
PA573 are S. aureus phage ISP insensitive. Primer pair 6 of ISP primers was used for the qPCR.
0
2
4
6
8
10
12
ISP ISP STA04 + ISP SA6538 + ISP PA573 + ISP
Log
co
nce
ntr
ati
on
(G
EQ
/106
PB
MC
s)
: t0
: t20
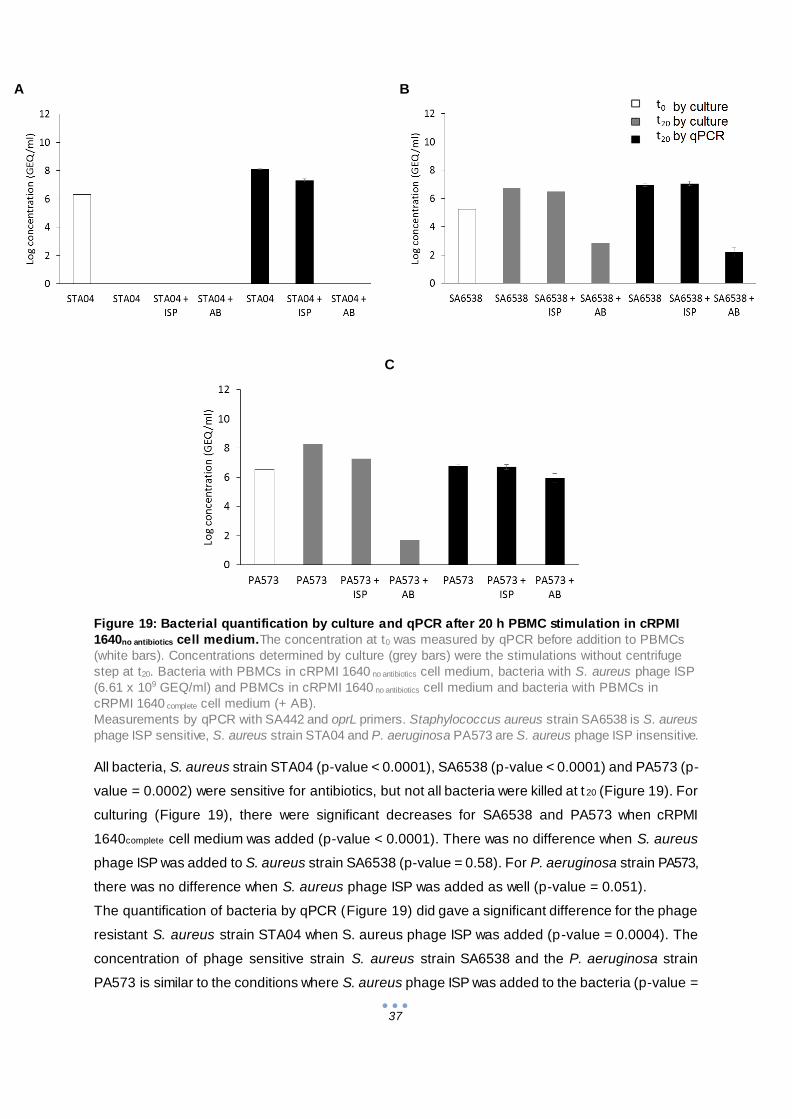
37
A
B
C
Figure 19: Bacterial quantification by culture and qPCR after 20 h PBMC stimulation in cRPMI
1640no antibiotics cell medium.The concentration at t0 was measured by qPCR before addition to PBMCs
(white bars). Concentrations determined by culture (grey bars) were the stimulations without centrifuge
step at t20. Bacteria with PBMCs in cRPMI 1640 no antibiotics cell medium, bacteria with S. aureus phage ISP
(6.61 x 10⁹ GEQ/ml) and PBMCs in cRPMI 1640 no antibiotics cell medium and bacteria with PBMCs in
cRPMI 1640 complete cell medium (+ AB).
Measurements by qPCR with SA442 and oprL primers. Staphylococcus aureus strain SA6538 is S. aureus
phage ISP sensitive, S. aureus strain STA04 and P. aeruginosa PA573 are S. aureus phage ISP insensitive.
All bacteria, S. aureus strain STA04 (p-value < 0.0001), SA6538 (p-value < 0.0001) and PA573 (p-
value = 0.0002) were sensitive for antibiotics, but not all bacteria were killed at t 20 (Figure 19). For
culturing (Figure 19), there were significant decreases for SA6538 and PA573 when cRPMI
1640complete cell medium was added (p-value < 0.0001). There was no difference when S. aureus
phage ISP was added to S. aureus strain SA6538 (p-value = 0.58). For P. aeruginosa strain PA573,
there was no difference when S. aureus phage ISP was added as well (p-value = 0.051).
The quantification of bacteria by qPCR (Figure 19) did gave a significant difference for the phage
resistant S. aureus strain STA04 when S. aureus phage ISP was added (p-value = 0.0004). The
concentration of phage sensitive strain S. aureus strain SA6538 and the P. aeruginosa strain
PA573 is similar to the conditions where S. aureus phage ISP was added to the bacteria (p-value =
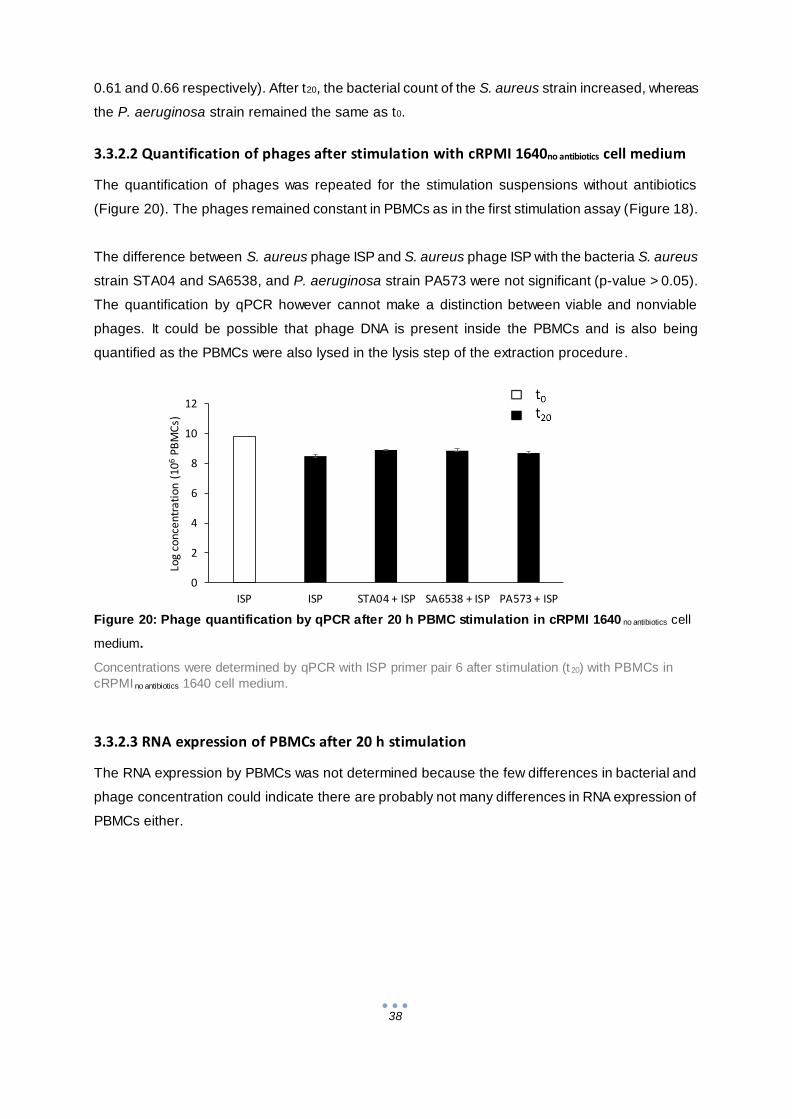
38
0
2
4
6
8
10
12
ISP ISP STA04 + ISP SA6538 + ISP PA573 + ISP
Log
con
cen
trat
ion
(1
06P
BM
Cs)
0.61 and 0.66 respectively). After t20, the bacterial count of the S. aureus strain increased, whereas
the P. aeruginosa strain remained the same as t0.
3.3.2.2 Quantification of phages after stimulation with cRPMI 1640no antibiotics cell medium
The quantification of phages was repeated for the stimulation suspensions without antibiotics
(Figure 20). The phages remained constant in PBMCs as in the first stimulation assay (Figure 18).
The difference between S. aureus phage ISP and S. aureus phage ISP with the bacteria S. aureus
strain STA04 and SA6538, and P. aeruginosa strain PA573 were not significant (p-value > 0.05).
The quantification by qPCR however cannot make a distinction between viable and nonviable
phages. It could be possible that phage DNA is present inside the PBMCs and is also being
quantified as the PBMCs were also lysed in the lysis step of the extraction procedure.
Figure 20: Phage quantification by qPCR after 20 h PBMC stimulation in cRPMI 1640 no antibiotics cell
medium.
Concentrations were determined by qPCR with ISP primer pair 6 after stimulation (t 20) with PBMCs in
cRPMI no antibiotics 1640 cell medium.
3.3.2.3 RNA expression of PBMCs after 20 h stimulation
The RNA expression by PBMCs was not determined because the few differences in bacterial and
phage concentration could indicate there are probably not many differences in RNA expression of
PBMCs either.
39
4 General conclusion
Traditionally, the studies on phages are focused on the interactions with bacterial cells. But more
and more investigations indicate that phages also could have an effect on human cells, most
importantly on immune cells [49,51,71]. The focus of the interaction of phages with the (human)
immune response is mostly directed towards the humoral responses, including the anti-phage-
neutralizing antibodies that can impede phage therapy. Cellular responses are far less
investigated [51]. An example of such a study is the one by Dean et al. (1975), using S. aureus
phage lysate (SPL), to stimulate lymphocyte (T and B) proliferation and to inhibit leukocyte
migration. However, SPL is a bacterial phage lysate, making it impossible to differentiate the effects
of bacterial cell debris and phage and thus to conclude that the observed effects were caused by
the phage. In this dissertation, PBMCs were stimulated by bacteria and by CsCl-purified phages to
investigate the outcome of each stimulant. We also used mixtures of both. Bacteria prevalent in
chronic burn wounds, S. aureus and P. aeruginosa were tested, as well as S. aureus phage ISP and
P. aeruginosa phage PNM, both components of the phage cocktail BFC-1 [57]. To assess the
effects of these stimulations on bacterial and phage loads, i.e. to assess lysis and phagocytosis of
bacteria and phages by PBMCs, an optimization was needed. The host specificity was determined of
the phages to select phage insensitive bacterial strains. The extraction efficacy and amplification
efficiency were determined of the bacteria and the phages to avoid false negative results in
quantification by qPCR.
Phage titration, the ‘golden standard’ for quantification of phages is a time consuming process, for
this reason we investigated the possibility of using a qPCR platform to determine the amount of
phage particles present in different sample types ( i.e. phage stocks and PBMC mixtures). Primers
for P. aeruginosa phage PNM were still in the development phase during this master dissertation,
and therefore only phage ISP qPCR was further studied. There are several hurdles in the
development of phage primers, e.g., phage genes could be acquired from their host, what could
produce false positive results [72]. The specificity of the S. aureus phage ISP primer pair 6 was
sufficiently high to use for the stimulation experiments where bacteria and phages were added
together because a concentration from 105 to 1011 GEQ/ml could be measured (3.2.4 Amplification
efficiency of S. aureus in presence of phages and vice versa). However, all the tested S. aureus
primers had a decreased amplification efficiency when DNA of the S. aureus phage ISP was added.
The binding of the S. aureus primers to bacterial DNA was too low to detect (detection limit:
105 GEQ/ml, Figure 14, Figure 15) in comparison with the unspecific binding to the S. aureus phage
ISP DNA present in high concentrations (1010 GEQ/ml, “3.2.4 Amplification efficiency of S. aureus in
presence of phages and vice versa” ). The explanation that this false positive reaction might be due
to the presence of ISP phage genes in the genome of S. aureus is unlikely since the S. aureus
phage ISP was extensively investigated earlier for lysogeny properties by scanning for known
40
lysogeny-related genes by genomic and proteomic analysis [57]. Another explanation might be that
there was environmental contamination with phage ISP.
In total, four S. aureus primer pairs (Table 1) were tested and we found that the primer pair with the
highest detection limit were femA primers (Figure 14). The P. aeruginosa primer pair oprL was not
tested for the specificity for P. aeruginosa phage PNM DNA because the stimulation assay was not
performed for this phage. It is therefore possible that oprL has the same issues in specificity as the
S. aureus primers.
Different quantification methods were compared in this dissertation, i.e. culturing versus qPCR. In
the stimulation assays, the concentrations of culturing were not consistent with the qPCR results
(p < 0.0001) (Figure 17, Figure 19). During DNA extraction efficacy testing however, there were no
great differences between culture and qPCR (3.2.3.1 Extraction efficacy of S. aureus in presence of
PBMCS and 3.2.3.2 Extraction efficacy of P. aeruginosa in presence of PBMCS). The detection limit
of culture method was 1 log higher for S. aureus strain SA6538 extracts and comparable with qPCR
results for P. aeruginosa PA573 extracts (Figure 13). If a high detection limit is preferred, culture is
recommended. This method is more sensitive, but also more time-consuming. The added
advantage is that by culturing the bacteria only the viable bacteria can be counted and the
disadvantage is that one colony could originate from one or more bacteria leading to an
underestimation of the amount of bacteria present. If numerous samples are included (e.g.
stimulation assay with standard cRPMI), culture is not recommended, because of time constraints.
The qPCR method is more rapid, does not depend on subjective interpretation but the primers used
in this dissertation had a low specificity. By designing a primer specific for the bacteria and
excluding phage genes, it could be possible to reach the same level of detection for S. aureus, with
continuous data (without subjective observation bias). In qPCR-based techniques, all DNA present
in the sample is measured, including dead cells, which might lead to an overestimation. This could
explain the difference in the results obtained between culturing and qPCR detection of the
bacteria (Figure 17).
The large decrease of bacteria after stimulation could be caused by the streptomycin and penicillin
present in the cRPMI 1640complete cell medium, this might be a contributing factor to the drop of the
bacteria after their addition to the PBMCs (Figure 17, Figure 19). The synergism of the two
antibiotics is associated with the stimulation of streptomycin uptake by the damage of the cell wall
caused by penicillin. Streptomycin could then interrupt the ribosomes, resulting in random protein
synthesis and ultimately killing the bacteria [73]. However, in a similar setup, adding S. aureus
(strain SA113) to macrophages in cRPMI 1640 with a higher concentration of penicillin and
streptomycin (100 µg/ml) did not cause a reported bacterial decrease. The stimulation however took
only 30 min [74]. Generally, phagocytosis takes 15 min to ingest the majority of the bacteria in
vitro [75].
41
The adsorption of S. aureus phage ISP on specifically S. aureus strain SA6538 was determined by
Vandersteegen et al. (2011). After one minute, approximately 50% of the S. aureus phage ISP
particles were adsorbed on S. aureus strain SA6538. A maximal adsorption of 85% was reached
after 25 minutes [59]. Although it has to be noted that time for adsorption depends on the host
density. The lytic cycle of S. aureus phage ISP in S. aureus strain SA6538 takes approximately 40
minutes [59]. These facts indicate that 20 h of stimulation should be ample to detect the effect of
PBMCs.
There were many misidentifications of bacteria, where one culturing result became interesting after
reidentification. Cetrimide medium is selective for P. aeruginosa, although one S. maltophilia strain
(PSE031) was able to grow in presence of this antiseptic. In 1973, there was a hospital outbreak of
S. maltophilia present in Savlon concentrate (what contains 15% cetrimide). Because cetrimide-
resistant S. maltophilia strains were described, this could be an explanation why S. maltophilia strain
PSE031 was able to grow on cetrimide and became misidentified as Pseudomonas [76].
Furthermore, a misidentification of S. maltophilia as P. fluorescens was described by Pinot et al.
(2011). They compared different methods to identify S. maltophilia isolates, including the biotyping
methods Biolog and Vitek-2. Biolog method utilizes an instrument testing the ability of bacteria to
use a range of 95 carbon sources. The Vitek-2 technology consists of 64 enzymatic and carbon
compound assimilation tests [77]. When the Biolog or Vitek-2 were used, some S. maltophilia
isolates were misidentified as P. fluorescens [77].
The S. aureus phage ISP insensitive strain S. aureus strain STA04 was tested for host specificity
previously [57]. In their experiment, there was confluent lysis visible when S. aureus phage ISP was
added. The strain JS257 was also tested in the study [57] and showed confluent lysis as identified in
this dissertation. The method to test host specificity differed: the agar was richer (2% LBA instead of
1% LBA) and a greater volume of phages (5 µl of 107 PFU/ml instead of 1 µl of 1010 PFU/ml ), with
less spotted phages in total [57].
The cytokine qPCR of the stimulated PBMCs was not performed in this master dissertation, this will
be performed in the future. The stimulation assay could be repeated in small-scale to quantify the
phages by phage titration to investigate if the phages are still viable after stimulation. The
stimulation assay could also include negative controls with phages and/or bacteria in cell medium
without PBMCs. Development of a S. aureus primer specific for the bacteria but not or less
amplifying the phage could solve the low detection limit of S. aureus primers. Phages could also be
directly enumerated by electron microscopy. This would control the intactness of the phage particles
and possibly the location of the phages (extracellular, intracellular of the bacteria or the immune
cells). Microscopy could be used as well to quantify the bacteria with visualization by Gram staining
and trypan blue to visualize dead cells. Microscopy bypasses the technical difficulties that PCR-

42
based methods are submitted to because of primer specificity. This implicates that the bacterial
strain cannot be identified. Furthermore, bacteria inside PBMCs could be quantified separately by
adding antibiotics after stimulation to kill extracellular bacteria [74].
Overall, there were no differences found after stimulation of PBMCs between the phage quantity
when bacteria were absent or not. There was a significant decrease of the phage resistant S.
aureus strain STA04 when S. aureus phage ISP was added, while in the host strain SA6538 there
were no differences in quantity. We expected that there was no influence of S. aureus phage ISP
when added to STA04 and a decrease when S. aureus phage was added. Further investigations
are needed to confirm and further explore the response of PBMCs on bacteria and phages.

43
5 References
1. Feiner, R. et al. A new perspective on lysogeny: prophages as active regulatory switches of
bacteria. Nat. Rev. Microbiol. 13, 641–650 (2015).
2. Rose, T. et al. Experimental phage therapy of burn wound infection: difficult first steps. Int J
Burn. Trauma 4, 66–73 (2014).
3. Merabishvili, M. et al. Quality-controlled small-scale production of a well-defined bacteriophage
cocktail for use in human clinical trials. PLoS One 4, (2009).
4. Hankin, E. H. L’action bactericide des eaux de la Jumna et du Gange sur le vibrion du cholera.
Ann. Inst. Pasteur II, (1896).
5. Wittebole, X., De Roock, S. & Opal, S. M. A historical overview of bacteriophage therapy as an
alternative to antibiotics for the treatment of bacterial pathogens. Virulence 5, 226–35 (2014).
6. On an invisible microbe antagonistic to dysentery bacili. Note by M.F. d’Herelle, presented by
M. Roux. Comptes Rendus Acad. des Sci. 165, 373–375 (1917).
7. Summers, W. C. Bacteriophage Therapy. Annu. Rev. Microbiol. 55, 437–451 (2001).
8. D’Hérelle, F. Le bactériophage; son rôle dans l’immunité. Masson cie (1921).
9. Salmond, G. P. C. & Fineran, P. C. A century of the phage: past, present and future. Nat. Rev.
Microbiol. 13, 777–786 (2015).
10. Stone, R. Stalin’s Forgotten Cure. Science (80-. ). 298, 728–731 (2002).
11. Chanishvili, N. Phage Therapy-History from Twort and d’Herelle Through Soviet Experience to
Current Approaches. Adv. Virus Res. 83, 3–40 (2012).
12. Matsuzaki, S. et al. Bacteriophage therapy: A revitalized therapy against bacterial infectious
diseases. J. Infect. Chemother. 11, 211–219 (2005).
13. Keen, E. C. Phage therapy: concept to cure. Front. Microbiol. 3, 238 (2012).
14. Laxminarayan, R. et al. Antibiotic resistance—the need for global solutions. Lancet Infect. Dis.
13, 1057–1098 (2013).
15. Blair, J. M. A., Webber, M. A., Baylay, A. J., Ogbolu, D. O. & Piddock, L. J. V. Molecular
mechanisms of antibiotic resistance. Nat. Rev. Microbiol. 13, 42–51 (2015).
16. Ventola, C. L. The antibiotic resistance crisis: part 1: causes and threats. P T 40, 277–83
(2015).
17. Hatfull, G. F. Bacteriophage genomics. Curr. Opin. Microbiol. 11, 447–453 (2008).
18. Calendar, R. The Bacteriophages, second edition. (Oxford University Press, 2006). at
<https://books.google.be/books?id=hYcRDAAAQBAJ&pg=PA8&dq=classification+of+bacterioph
ages&hl=en&sa=X&redir_esc=y#v=onepage&q&f=false>
19. International Committee on Taxonomy of Viruses (ICTV). (2015).
20. Pawlowski, A., Rissanen, I., Bamford, J. K. H., Krupovic, M. & Jalasvuori, M.
Gammasphaerolipovirus, a newly proposed bacteriophage genus, unifies viruses of halophilic
archaea and thermophilic bacteria within the novel family Sphaerolipoviridae. Arch. Virol. 159,
1541–1554 (2014).
21. Pietilä, M. K., Demina, T. A., Atanasova, N. S., Oksanen, H. M. & Bamford, D. H. Archaeal
viruses and bacteriophages: comparisons and contrasts. Trends Microbiol. 22, 334–344 (2014).
22. Ackermann, H. W. Frequency of morphological phage descriptions in the year 2000. Brief
review. Arch. Virol. 146, 843–57 (2001).
23. Rose, N. R. & Barron, A. L. Microbiology: Basic Principles and Clinical Applications. (Macmillan
Publishing Company, 1983).
24. Łoś, M. & Węgrzyn, G. in Adv. Virus Res. 339–349 (2012). doi:10.1016/B978-0-12-394621-
8.00019-4
25. Storms, Z. J. & Sauvageau, D. Modeling tailed bacteriophage adsorption: Insight into
mechanisms. Virology 485, 355–362 (2015).
26. Young, R. Phage lysis: three steps, three choices, one outcome. J. Microbiol. 52, 243–58
(2014).
27. Weinbauer, M. G. Ecology of prokaryotic viruses. FEMS Microbiol. Rev. 28, 127–181 (2004).
28. Groth, A. C. & Calos, M. P. Phage Integrases: Biology and Applications. J. Mol. Biol. 335, 667–
678 (2004).
44
29. Žgur-Bertok, D. DNA damage repair and bacterial pathogens. PLoS Pathog. 9, e1003711 (2013).
30. Seed, K. D. Battling Phages: How Bacteria Defend against Viral Attack. PLoS Pathog. 11,
e1004847 (2015).
31. Labrie, S. J., Samson, J. E. & Moineau, S. Bacteriophage resistance mechansims. Nat. Rev.
Microbiol. 8, 317–327 (2010).
32. Van Der Oost, J., Westra, E. R., Jackson, R. N. & Wiedenheft, B. Unravelling the structural and
mechanistic basis of CRISPR–Cas systems. doi:10.1038/nrmicro3279
33. Chopin, M.-C., Chopin, A. & Bidnenko, E. Phage abortive infection in lactococci: variations on a
theme. Curr. Opin. Microbiol. 8, 473–479 (2005).
34. Chan, B. K., Abedon, S. T. & Loc-Carrillo, C. Phage cocktails and the future of phage therapy.
Future Microbiol. 8, 769–83 (2013).
35. Kutter, E. et al. Phage therapy in clinical practice: treatment of human infections. Curr. Pharm.
Biotechnol. 11, 69–86 (2010).
36. Loc-Carrillo, C. & Abedon, S. T. Pros and cons of phage therapy. Bacteriophage 1, 111–114
(2011).
37. Pirnay, J.-P. et al. Introducing yesterday’s phage therapy in today’s medicine. Future Virol. 7,
379–390 (2012).
38. Bardy, P., Pantucek, R., Benesik, M. & Doskar, J. Genetically modified bacteriophages in
applied microbiology. J. Appl. Microbiol. 121, 618–633 (2016).
39. Mahichi, F., Synnott, A. J., Yamamichi, K., Osada, T. & Tanji, Y. Site-specific recombination of
T2 phage using IP008 long tail fiber genes provides a targeted method for expanding host range
while retaining lytic activity. FEMS Microbiol. Lett. 295, 211–217 (2009).
40. Kim, K.-P. et al. PEGylation of bacteriophages increases blood circulation time and reduces T-
helper type 1 immune response. Microb. Biotechnol. 1, 247–257 (2008).
41. Broudy, T. B. & Fischetti, V. A. In vivo lysogenic conversion of Tox(-) Streptococcus pyogenes
to Tox(+) with Lysogenic Streptococci or free phage. Infect. Immun. 71, 3782–6 (2003).
42. Yu, C.-E. & Ferretti, J. J. Molecular Epidemiologic Analysis of the Type A Streptococcal
Exotoxin (Erythrogenic Toxin) Gene (speA) in Clinical Streptococcus pyogenes Strains. 57,
43. Hosseinidoust, Z., Tufenkji, N. & Van De Ven, T. G. M. Predation in Homogeneous and
Heterogeneous Phage Environments Affects Virulence Determinants of Pseudomonas
aeruginosa. doi:10.1128/AEM.03817-12
44. Kaur, T. et al. Immunocompatibility of bacteriophages as nanomedicines. J. Nanotechnol.
(2012). doi:10.1155/2012/247427
45. Duerkop, B. A. & Hooper, L. V. Resident viruses and their interactions with the immune system.
Nat. Immunol. 14, 654–659 (2013).
46. Hodyra-Stefaniak, K. et al. Mammalian Host-Versus-Phage immune response determines phage
fate in vivo. Sci. Rep. 5, 14802 (2015).
47. Abbas, A. K., Lichtman, A. H. & Pillai, S. Basic Immunology: Functions and Disorders of the
Immune System. (2014).
48. De Paepe, M., Leclerc, M., Tinsley, C. R. & Petit, M. A. Bacteriophages: an underestimated
role in human and animal health? Front Cell Infect Microbiol 4, 39 (2014).
49. Davies, M. R., Broadbent, S. E., Harris, S. R., Thomson, N. R. & Van Der Woude, M. W.
Horizontally Acquired Glycosyltransferase Operons Drive Salmonellae Lipopolysaccharide
Diversity. (2013). doi:10.1371/journal.pgen.1003568
50. Barr, J. J. et al. Bacteriophage adhering to mucus provide a non-host-derived immunity. Proc.
Natl. Acad. Sci. U. S. A. 110, 10771–6 (2013).
51. Górski, A. et al. Phage as a Modulator of Immune Responses. Practical Implications for Phage
Therapy. Adv. Virus Res. 83, 41–71 (2012).
52. Kaur, T. et al. Immunocompatibility of Bacteriophages as Nanomedicines. J. Nanotechnol. 2012,
1–13 (2012).
53. Cisek, A. A., Dąbrowska, I., Gregorczyk, K. P. & Wyżewski, Z. Phage Therapy in Bacterial
Infections Treatment: One Hundred Years After the Discovery of Bacteriophages. Curr. Microbiol.
74, 277–283 (2017).
54. Sulakvelidze, A., Alavidze, Z. & Morris, J. G. MINIREVIEW Bacteriophage Therapy. 45, 649–659
(2001).
55. Łusiak-Szelachowska, M. et al. Antiphage activity of sera during phage therapy in relation to its
outcome. Future Microbiol. 12, 109–117 (2017).

45
56. Richter, C. et al. Evaluation of species-specific score cut-off values for various Staphylococcus
species using a MALDI Biotyper-based identification. J. Med. Microbiol. 61, 1409–1416 (2012).
57. Merabishvili, M. et al. Quality-Controlled Small-Scale Production of a Well-Defined
Bacteriophage Cocktail for Use in Human Clinical Trials. PLoS One 4, e4944 (2009).
58. Van Belleghem, J. D., Merabishvili, M., Vergauwen, B., Lavigne, R. & Vaneechoutte, M. A
comparative study of different strategies for removal of endotoxins from bacteriophage
preparations. J. Microbiol. Methods 132, 153–159 (2017).
59. Vandersteegen, K. et al. Microbiological and Molecular Assessment of Bacteriophage ISP for
the Control of Staphylococcus aureus. PLoS One 6, e24418 (2011).
60. Schneider, T. et al. In vitro assembly of a complete, pentaglycine interpeptide bridge containing
cell wall precursor (lipid II-Gly5) of Staphylococcus aureus. Mol. Microbiol. 53, 675–685 (2004).
61. Kiedrowski, M. R. et al. Staphylococcus aureus Nuc2 is a functional, surface-attached
extracellular nuclease. PLoS One 9, e95574 (2014).
62. Liu, D., Lawrence, M. L. & Austin, F. W. Evaluation of PCR primers from putative transcriptional
regulator genes for identification of Staphylococcus aureus. Lett. Appl. Microbiol. 40, 69–73
(2005).
63. Grisold, A. J., Leitner, E., Mühlbauer, G., Marth, E. & Kessler, H. H. Detection of methicillin-
resistant Staphylococcus aureus and simultaneous confirmation by automated nucleic acid
extraction and real-time PCR. J. Clin. Microbiol. 40, 2392–7 (2002).
64. Goto, M. et al. Real-time PCR method for quantification of Staphylococcus aureus in milk. J.
Food Prot. 70, 90–6 (2007).
65. Matthijs, S. et al. Evaluation of oprI and oprL genes as molecular markers for the genus
Pseudomonas and their use in studying the biodiversity of a small Belgian River. Res. Microbiol.
164, 254–261 (2013).
66. De Vos, D. et al. Direct Detection and Identification of Pseudomonas aeruginosa in Clinical
Samples Such as Skin Biopsy Specimens and Expectorations by Multiplex PCR Based on Two
Outer Membrane Lipoprotein Genes, oprI and oprL. J. Clin. Microbiol. 35, 1295–1299 (1997).
67. Haddad, Y. et al. The Isolation of DNA by Polycharged Magnetic Particles: An Analysis of the
Interaction by Zeta Potential and Particle Size. Int. J. Mol. Sci. 17, (2016).
68. Paule, S. M. et al. Direct detection of Staphylococcus aureus from adult and neonate nasal
swab specimens using real-time polymerase chain reaction. J. Mol. Diagn. 6, 191–6 (2004).
69. Merabishvili, M. et al. Characterization of Newly Isolated Lytic Bacteriophages Active against
Acinetobacter baumannii. PLoS One 9, e104853 (2014).
70. Peterson, B. W., Sharma, P. K., van der Mei, H. C. & Busscher, H. J. Bacterial cell surface
damage due to centrifugal compaction. Appl. Environ. Microbiol. 78, 120–5 (2012).
71. Przerwa, A. et al. Effects of bacteriophages on free radical production and phagocytic functions.
Med. Microbiol. Immunol. 195, 143–150 (2006).
72. Clokie, M. PCR and Partial Sequencing of Bacteriophage Genomes. Methods Mol. Biol. 502,
47–55 (2009).
73. Moellering, R. C., Weinberg, A. N. & Weinberg, A. N. Studies on antibiotic syngerism against
enterococci. II. Effect of various antibiotics on the uptake of 14 C-labeled streptomycin by
enterococci. J. Clin. Invest. 50, 2580–4 (1971).
74. Wolf, A. J. et al. Phagosomal degradation increases TLR access to bacterial ligands and
enhances macrophage sensitivity to bacteria. J. Immunol. 187, 6002–10 (2011).
75. Lamers, M. C., de Groot, E. R. & Roos, D. Phagocytosis and degradation of DNA-anti-DNA
complexes by human phagocytes I. Assay conditions, quantitative aspects and differences
between human blood monocytes and neutrophils. Eur. J. Immunol. 11, 757–764 (1981).
76. Wishart, M. M. & Riley, T. V. Infection with Pseudomonas maltophilia hospital outbreak due to
contaminated disinfectant. Med. J. Aust. 2, 710–2 (1976).
77. Pinot, C. et al. Identification of Stenotrophomonas maltophilia strains isolated from environmental
and clinical samples: a rapid and efficient procedure. J. Appl. Microbiol. 111, 1185–1193 (2011).
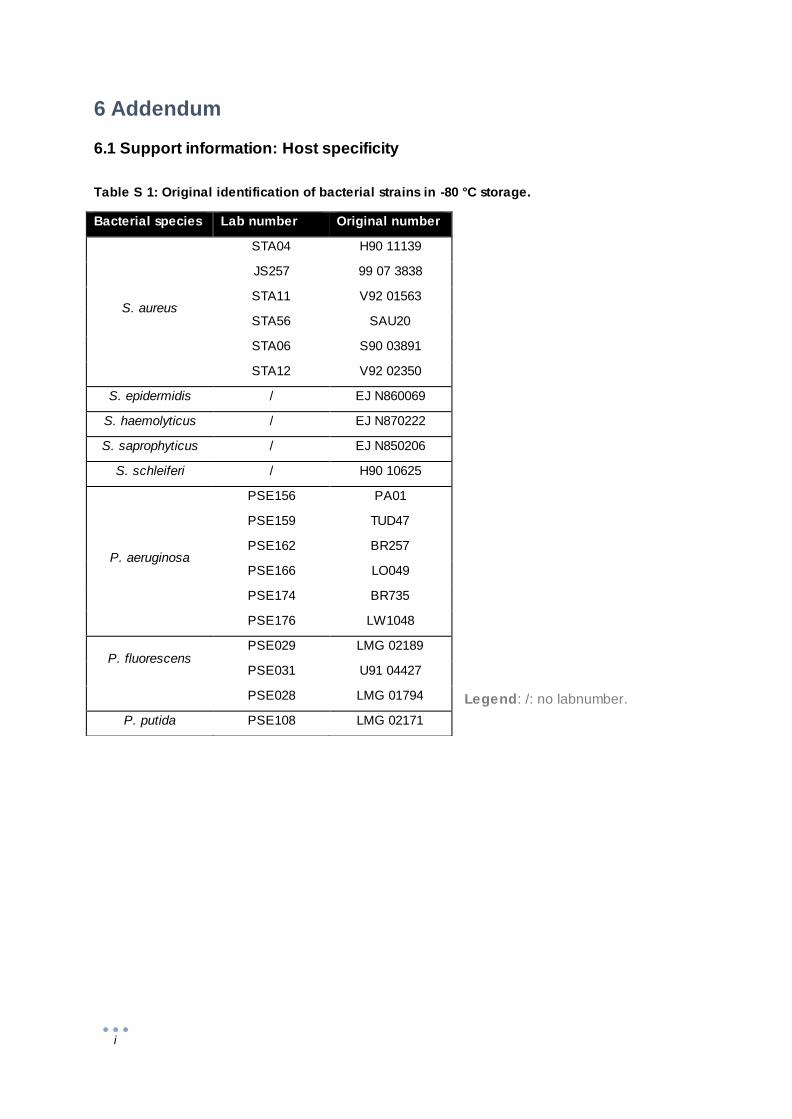
i
6 Addendum
6.1 Support information: Host specificity
Legend: /: no labnumber.
Bacterial species Lab number Original number
S. aureus
STA04 H90 11139
JS257 99 07 3838
STA11 V92 01563
STA56 SAU20
STA06 S90 03891
STA12 V92 02350
S. epidermidis / EJ N860069
S. haemolyticus / EJ N870222
S. saprophyticus / EJ N850206
S. schleiferi / H90 10625
P. aeruginosa
PSE156 PA01
PSE159 TUD47
PSE162 BR257
PSE166 LO049
PSE174 BR735
PSE176 LW1048
P. fluorescens
PSE029 LMG 02189
PSE031 U91 04427
PSE028 LMG 01794
P. putida PSE108 LMG 02171
Table S 1: Original identification of bacterial strains in -80 °C storage.

ii
6.2 Support information: DNA extraction efficacy for bacteria and phages
6.2.1 Primer specificity and annealing temperature
Table S 2: Primers used on DNA of PBMCs.
Species Primer Sequence
(5’ to 3’)
Annealing
Temperature (°C)
Homo sapiens B-actin-F976 GGATGCAGAAGGAGATCACTG
59 B-actin-R1065 CGATCCACACGGAGTACTTG
Homo sapiens CD14_F CGCTCCGAGATGCATGTG
59 CD14_R TTGGCTGGCAGTCCTTTAGG
Homo sapiens CXCL1_F GGAAAGAGAGACACAGCTGCA
59 CXCL1_R AGAAGACTTCTCCTAAGCGATGC
Homo sapiens CXCL5_F ATCTGCAAGTGTTCGCCATAG
59 CXCL5_R ACAAATTTCCTTCCCGTTCTTC
Homo sapiens IL10 F409 CATCGATTTCTTCCCTGTGAA
59 IL10 R482 TCTTGGAGCTTATTAAAGGCATTC
Homo sapiens IL1A_F CGCCAATGACTCAGAGGAAGA
59 IL1A_R AGGGCGTCATTCAGGATGAA
Homo sapiens IL1B_F GGCCACATTTGGTTCTAAGAA-A
59 IL1B_R TAAATAGGGAAGCGGTTGCTC
Homo sapiens IL1RN_F GAAGATGTGCCTGTCCTGTGT
59 IL1RN_R CGCTCAGGTCAGTGATGTTAA
Homo sapiens IL6_F GGTACATCCTCGACGGCATC
59 IL6_R GCCTCTTTGCTGCTTTCACAC
Homo sapiens LYZ_F AAAACCCCAGGAGCAGTTAAT
59 LYZ_R CAACCCTCTTTGCACAAGCT
Homo sapiens SOCS3_Fw GGCCACTCTTCAGCATCTC
59 SOCS3_Rv ATCGTACTGGTCCAGGAACTC
Homo sapiens TGFBI_F GAAGGGAGACAATCGCTTTAGC
59 TGFBI_R TGTAGACTCCTTCCCGGTTGAG
Homo sapiens TNFa-F275 CCCAGGGACCTCTCTCTAATC
59 TNFa-R358 ATGGGCTACAGGCTTGTCACT

iii
A
B
Figure S 1: Gradient PCR with SA0836 primers.
(A) A primer concentration of 0.5 µM was used. (B) A primer concentration of 1 µM was used.
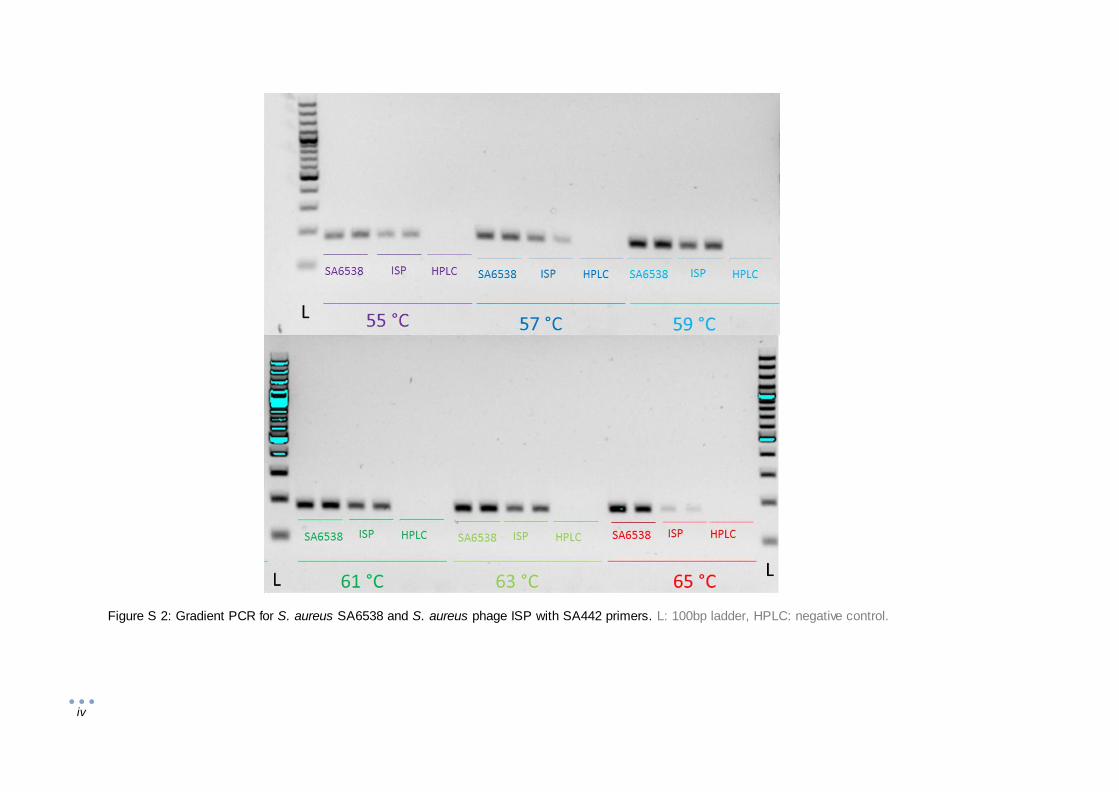
iv
Figure S 2: Gradient PCR for S. aureus SA6538 and S. aureus phage ISP with SA442 primers. L: 100bp ladder, HPLC: negative control.

v
6.2.2 DNA extraction efficacy of S. aureus and P. aeruginosa
Phage resistant Phage sensitive
S.
au
reu
s
A B
P.
ae
rug
ino
sa
C D
Figure S 3: Standard curves of bacterial strains used for determination extraction efficacy in Figure 12.
The femA primer pair was used for amplification of S. aureus, and the oprL primer pair for P. aeruginosa.
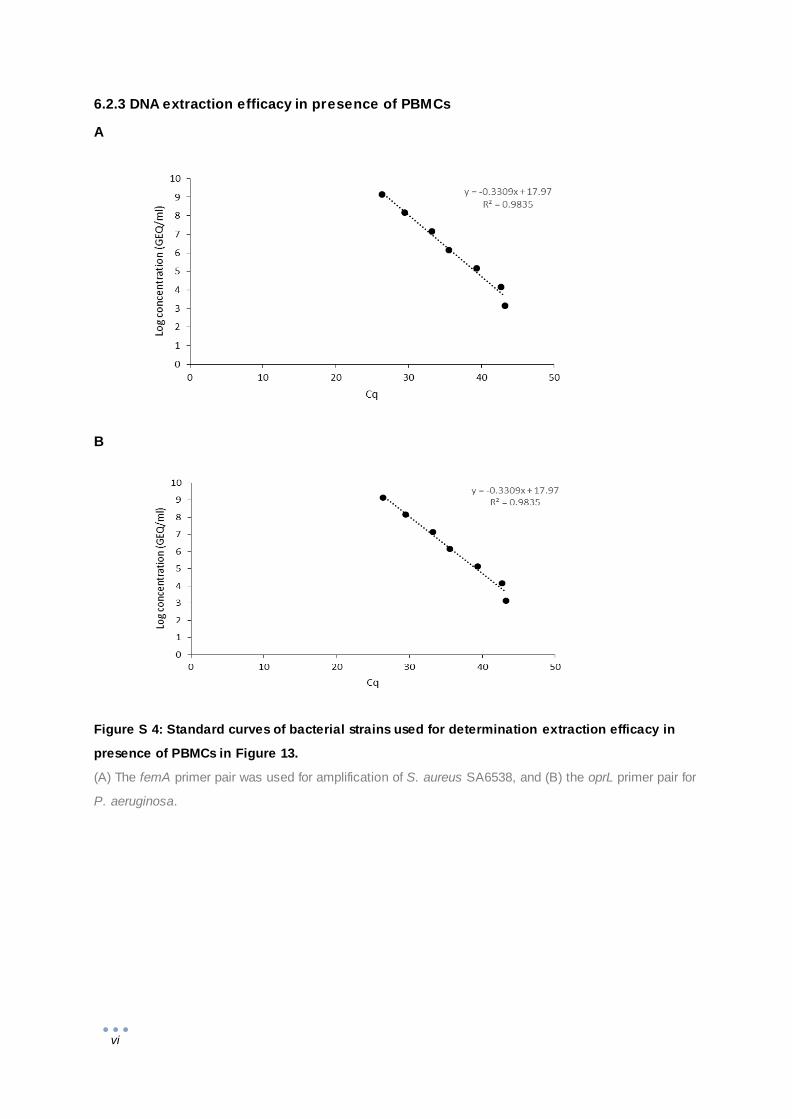
vi
6.2.3 DNA extraction efficacy in presence of PBMCs
A
B
Figure S 4: Standard curves of bacterial strains used for determination extraction efficacy in
presence of PBMCs in Figure 13.
(A) The femA primer pair was used for amplification of S. aureus SA6538, and (B) the oprL primer pair for
P. aeruginosa.

vii
6.2.4 Amplification efficiency of S. aureus in presence of phages and vice versa
Constant bacteria
ISP dilutions
Constant ISP
Bacterial dilutions
ST
A0
4
A
0
2
4
6
8
10
12
1 2 3 4 5 6 7 8
Log
conc
entr
atio
n(G
EQ/m
l)
ISP dilutions (-log)
B
0
2
4
6
8
10
12
1 2
Log
conc
entr
atio
n (G
EQ/m
l)
STA04 dilutions (-log)
Figure S 5: Extraction efficacy of S. aureus STA04 and S. aureus phage ISP using primer pair
femA primers and ISP primer pair 6.
Theoretical concentrations of the phage () and bacterial () dilutions are the standard dilution series
measured by qPCR. The theoretical concentrations of the constant concentrations (white bars ) were
measured on Nanodrop. (A) Tenfold dilutions of S. aureus phage ISP nucleic acid were mixed with a constant
concentration of S. aureus STA04 nucleic acid (4.72 x 10¹⁰ GEQ/ml). (B) Tenfold dilutions of S. aureus
STA04 nucleic acid were mixed with a constant concentration of S. aureus phage ISP nucleic acid (4.31 x
1010 GEQ/ml). ISP was amplified by the ISP primer pair 6 ( and blue bars) and the S. aureus strains were
amplified by femA primers ( and red bars).
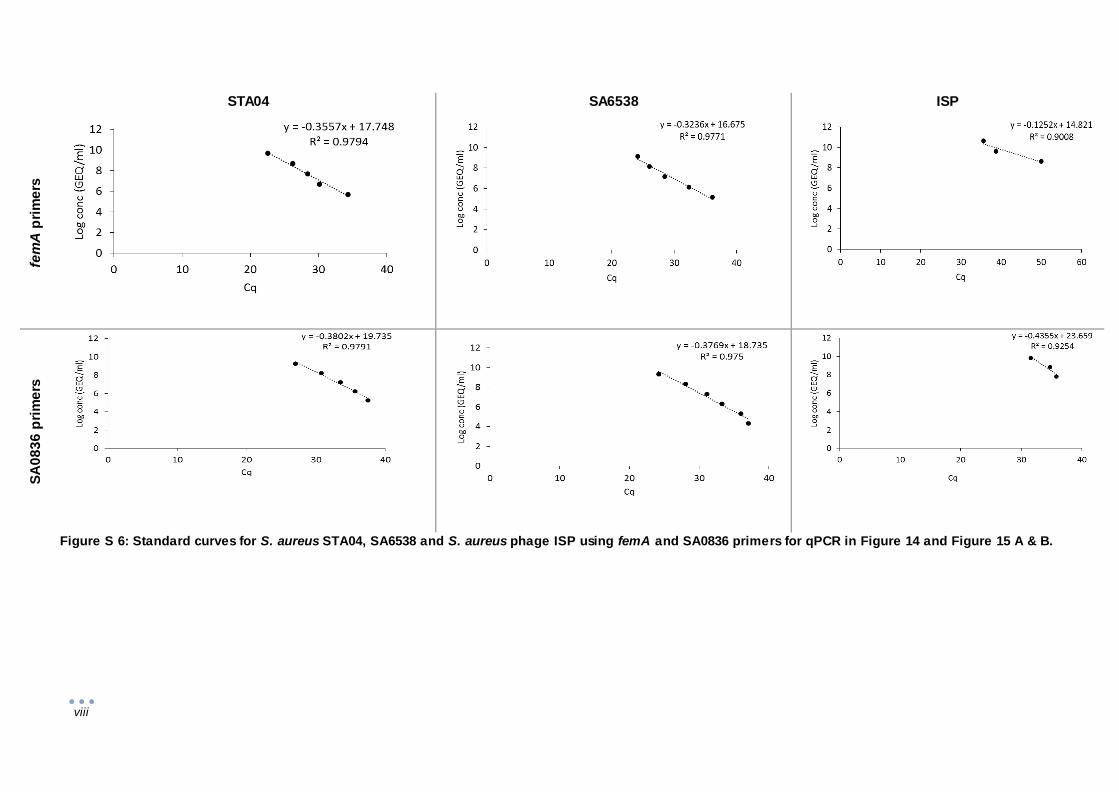
viii
STA04 SA6538 ISP
fem
A p
rim
ers
SA
08
36
pri
me
rs
Figure S 6: Standard curves for S. aureus STA04, SA6538 and S. aureus phage ISP using femA and SA0836 primers for qPCR in Figure 14 and Figure 15 A & B.

ix
STA04 SA6538 ISP
SA
44
2 p
rim
ers
Figure S 7: Standard curves for S. aureus STA04, SA6538 and S. aureus phage ISP using SA442 primers for qPCR in Figure 15 C & D.

x
Figure 14
Figure 15 A & B
Figure S 8: Standard curves for S. aureus phage ISP using ISP primer pair 6 for qPCR in Figure
12 and Figure 13 A & B.

xi
6.2.5 FemA primers qPCR product identification of samples with a constant
concentration of ISP and a S. aureus dilution
Figure S 9: Melting curves of S. aureus SA6538 dilution with a constant S. aureus phage ISP concentration
amplified by femA primers.
Melting curves of the samples from qPCR with SA6538 dilutions amplified by femA primers (Figure 12A)