PS-InSAR analysis of Colli Albani volcanic area: … WS5...PS-InSAR analysis of Colli Albani...
20
PS-InSAR analysis of Colli Albani volcanic area: comparison with in-situ data and modeled source to define a possible H-3 scenario Stramondo S. 1 , De Lotto P. 2 , Bignami C . 1 1 Istituto Nazionale di Geofisica e Vulcanologia, Rome, Italy 2 CESI, Milan, Italy 27/04/2009 TF Workshop, ESA-Esrin
Transcript of PS-InSAR analysis of Colli Albani volcanic area: … WS5...PS-InSAR analysis of Colli Albani...

PS-InSAR analysis of Colli Albani volcanic area:
comparison with in-situ data and modeled source to
define a possible H-3 scenario
Stramondo S.1, De Lotto P.2, Bignami C.1
1 Istituto Nazionale di Geofisica e Vulcanologia, Rome, Italy2 CESI, Milan, Italy
27/04/2009 TF Workshop, ESA-Esrin

27/04/2009 TF Workshop, ESA Esrin 2
Summary
Introduction
The Colli Albani volcanic complex
The SAR dataset and the PS-InSAR products (H-1)
GPS and leveling (H-2)
Data comparison
Preliminary model (H-3)
Conclusion

The Colli Albani volcanic area
The test site of H-3 product of Terrafirma project has been selected in the
Colli Albani volcanic area
Being close to the metropolitan area of Rome (about 15 km SE), this area is
of great interest for geophysicists
The Colli Albano volcano has a complex caldera, whose last eruptive
products have been dated at 20 ky
Since the Roman age the whole area has been interested by swarms of
shallow, moderate magnitude, earthquake events
The most important episode has been registered in 1989-1990.
327/04/2009 TF Workshop, ESA Esrin

The Colli Albani volcanic complex
• First volcanic product age ~ 600.000
years
• Activity cycle of ~ 50.000 years in
the last 350.000 years (Marra et al,
2002)
• Most recent products age <5.000
years (Funiciello et al., 2002)
• The most recent activities recorded
on the West side of the caldera
• Seismic recurrences of stronger
events ~ 60 years (Amato e
Chiarabba, 1995)
• Earthquakes depth between 2 and 5
km (Amato e Chiarabba, 1995)
27/04/2009 4TF Workshop, ESA Esrin

27/04/2009 TF Workshop, ESA Esrin 5
Since 1950 leveling campaigns measured significative ground uplift up to 30 cm.
GPS data are also available even though the only three monuments measuring a
displacement are in areas with no PS.
To retrieve the deformation field the PS-InSAR technique has been applied to an ERS
dataset from ascending and descending path covering 1992-2000.
PS-InSAR detected a deformation pattern with the highest rates of uplift
concentrated in the area of Albano, Ariccia and Nemi craters. Although these main
effects the whole deformation field is also characterized by further signals at
different scales.
To explain the possible causes of such results a model has been compared with PS-
InSAR pattern. The best model is located beneath the Albano crater, while the other
source is 3 km south of the older Ariccia crater.
Looking at the Colli Albani volcanic area

27/04/2009 6TF Workshop, ESA Esrin
The SAR dataset and the PS-InSAR products (H-1)

27/04/2009 TF Workshop, ESA Esrin 7
Image number Date Miss Pass Normal Baseline [m]
1 28/04/1993 ERS-1 Ascending 418.81
2 02/06/1993 ERS-1 Ascending -493.38
3 07/07/1993 ERS-1 Ascending -13.77
4 11/08/1993 ERS-1 Ascending -782.22
5 15/09/1993 ERS-1 Ascending -802.03
6 30/06/1995 ERS-1 Ascending 433.98
7 01/07/1995 ERS-1 Ascending 386.23
8 13/10/1995 ERS-1 Ascending -777.16
9 27/01/1996 ERS-2 Ascending -634.72
10 05/04/1995 ERS-1 Ascending -634.74
11 06/04/1996 ERS-2 Ascending -520.86
12 24/08/1996 ERS-2 Ascending -160.57
13 22/03/1997 ERS-2 Ascending -24.64
14 31/05/1997 ERS-2 Ascending -213.51
15 05/07/1997 ERS-2 Ascending -150.54
16 09/08/1997 ERS-2 Ascending 0.0
17 17/10/1997 ERS-1 Ascending -106.98
18 18/10/1997 ERS-2 Ascending -362.25
19 22/11/1997 ERS-2 Ascending -72.34
20 11/04/1998 ERS-2 Ascending 208.74
21 16/05/1998 ERS-2 Ascending 19.66
22 25/07/1998 ERS-2 Ascending -638.46
23 30/04/1999 ERS-1 Ascending -144.81
24 01/05/1999 ERS-2 Ascending -99.89
25 04/06/1999 ERS-1 Ascending -528.08
26 10/07/1999 ERS-2 Ascending 279.74
27 14/08/1999 ERS-2 Ascending -604.15
28 26/11/1999 ERS-1 Ascending 238.13
29 27/11/1999 ERS-2 Ascending 489.94
30 05/02/2000 ERS-2 Ascending -948.71
31 15/04/2000 ERS-2 Ascending 384.12
32 24/06/2000 ERS-2 Ascending -356.72
33 02/09/2000 ERS-2 Ascending -932.62
34 11/11/2000 ERS-2 Ascending 311.77
The SAR dataset and the PS-InSAR products (H-1)7 y
ears
of
acquis
itio
ns

27/04/2009 TF Workshop, ESA Esrin 8
Image number
Date Miss PassNormal Baseline
[m]
1 11/06/1992 ERS-1 Descending 250.76
2 16/07/1992 ERS-1 Descending -247.47
3 24/09/1992 ERS-1 Descending -223.54
4 29/10/1992 ERS-1 Descending 675.91
5 03/12/1992 ERS-1 Descending 196.88
6 07/01/1993 ERS-1 Descending -610.56
7 22/04/1993 ERS-1 Descending 678.21
8 01/07/1993 ERS-1 Descending -440.55
9 09/09/1993 ERS-1 Descending 625.72
10 18/11/1993 ERS-1 Descending 647.89
11 20/05/1995 ERS-1 Descending -215.95
12 24/06/1995 ERS-1 Descending -601.80
13 25/06/1995 ERS-2 Descending -724.91
14 03/09/1995 ERS-2 Descending -314.43
15 07/10/1995 ERS-1 Descending 387.43
16 08/10/1995 ERS-2 Descending 865.40
17 25/02/1996 ERS-2 Descending 807.95
18 30/03/1996 ERS-1 Descending -465.03
19 31/03/1996 ERS-2 Descending -570.17
20 04/05/1996 ERS-1 Descending 750.75
21 05/05/1996 ERS-2 Descending 667.12
22 09/06/1996 ERS-2 Descending -640.33
23 14/07/1996 ERS-2 Descending 314.83
24 18/08/1996 ERS-2 Descending -234.12
25 22/09/1996 ERS-2 Descending -22.88
26 27/10/1996 ERS-2 Descending 856.64
27 01/12/1996 ERS-2 Descending 842.26
28 05/01/1997 ERS-2 Descending -137.07
29 09/02/1997 ERS-2 Descending 360.06
30 16/03/1997 ERS-2 Descending 0.0
31 25/05/1997 ERS-2 Descending -97.48
32 03/08/1997 ERS-2 Descending -90.13
33 07/09/1997 ERS-2 Descending 415.42
34 11/10/1997 ERS-1 Descending 83.96
35 12/10/1997 ERS-2 Descending 311.69
36 16/11/1997 ERS-2 Descending 101.30
37 21/12/1997 ERS-2 Descending 33.54
38 25/01/1998 ERS-2 Descending -291.42
39 05/04/1998 ERS-2 Descending -541.66
40 10/05/1998 ERS-2 Descending 575.29
41 14/06/1998 ERS-2 Descending 854.91
42 19/07/1998 ERS-2 Descending -732.79
43 23/08/1998 ERS-2 Descending -339.12
44 27/09/1998 ERS-2 Descending 595.32
45 01/11/1998 ERS-2 Descending 774.68
46 06/12/1998 ERS-2 Descending -426.16
47 13/02/1999 ERS-1 Descending 1029.07
48 14/02/1999 ERS-2 Descending 823.05
49 20/03/1999 ERS-1 Descending 110.31
50 21/03/1999 ERS-2 Descending 46.10
51 25/04/1999 ERS-2 Descending -278.48
52 29/05/1999 ERS-1 Descending 742.79
53 30/05/1999 ERS-2 Descending 681.06
54 04/07/1999 ERS-2 Descending -179.37
55 08/08/1999 ERS-2 Descending 690.06
56 12/09/1999 ERS-2 Descending -744.93
57 16/10/1999 ERS-1 Descending 61.62
58 17/10/1999 ERS-2 Descending -265.08
59 21/11/1999 ERS-2 Descending -248.07
60 26/12/1999 ERS-2 Descending 338.05
61 29/01/2000 ERS-1 Descending -177.71
62 14/05/2000 ERS-2 Descending 920.49
63 18/06/2000 ERS-2 Descending -222.99
64 01/10/2000 ERS-2 Descending -514.00
65 05/11/2000 ERS-2 Descending 245.04
66 10/12/2000 ERS-2 Descending -414.82
8 years of acquisitions
The SAR dataset and the PS-InSAR products (H-1)

27/04/2009 TF Workshop, ESA Esrin 9
Ascending Orbit Descending Orbit
SAR acquisition geometry over the test site

34 ERS1-2 data
28/04/93 - 11/11/00
n° PS: 280000
coherence >0.7
27/04/2009 10TF Workshop, ESA Esrin
The SAR dataset and the PS-InSAR products (H-1)
Ascending data

66 ERS1-2 data
11/06/92-19/12/00
n° PS: 240000
coherence >0.7
27/04/2009 11TF Workshop, ESA Esrin
The SAR dataset and the PS-InSAR products (H-1)
Descending data
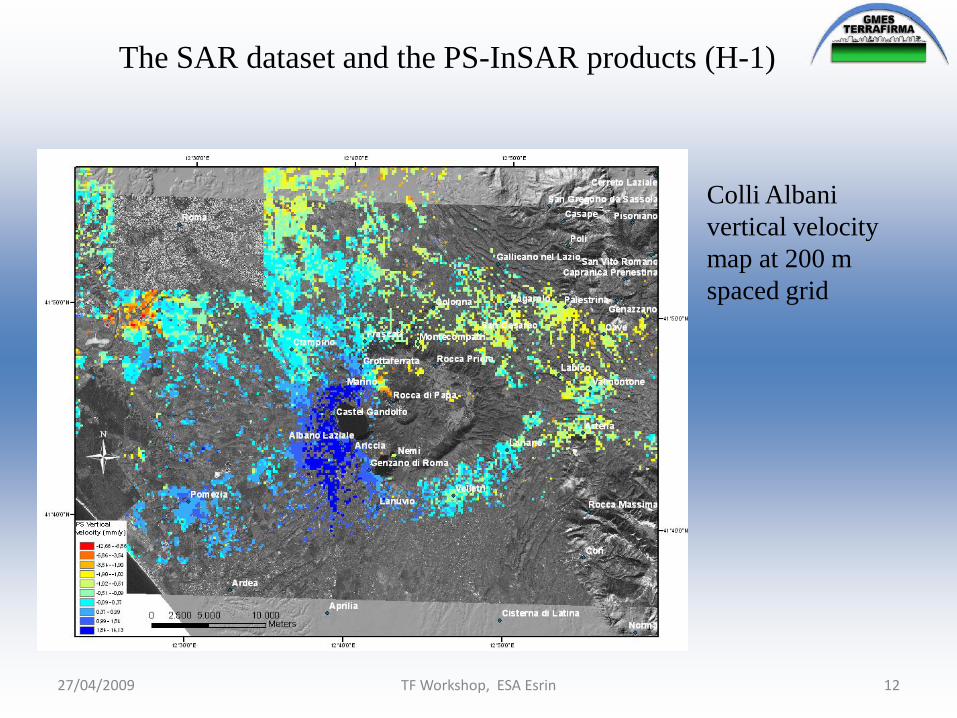
Colli Albani
vertical velocity
map at 200 m
spaced grid
27/04/2009 12TF Workshop, ESA Esrin
The SAR dataset and the PS-InSAR products (H-1)

Colli Albani
EW velocity
map at 200 m
spaced grid
27/04/2009 13TF Workshop, ESA Esrin
The SAR dataset and the PS-InSAR products (H-1)

27/04/2009 14TF Workshop, ESA Esrin
GPS measurements in
1995, 1996, 1997,
1998 do not show
significative
deformation except,
in 1995-96, when 2
cm subsidence has
been measured at
ING, CVA and VVR
(probably due to
shallow earthquakes
in 1995).
Later ING continuous
GPS is stable and can
be considered the
reference point and
PS have been
rescaled referred to it.
GPS and levelling (H-2)

17 levelling benchmarks are
available.
They were measured in two
campaings, IGM 1950 and
1997.
We selected 10 benchmarks
that are within the Asc and
Desc PS common area.
27/04/2009 15TF Workshop, ESA Esrin
Average velocity levelling 1950 - 1997
vel
oci
ty (
mm
/y)
GPS and levelling (H-2)
The maximum
uplift is detected in
Albano and Ariccia
villages (about 29
cm)

Average velocity levelling 1950 - 1997
vel
oci
ty (
mm
/y)
vel
oci
ty (
mm
/y)
Average velocity descending PS
Average velocity ascending PS
vel
oci
ty (
mm
/y)
27/04/2009 16TF Workshop, ESA Esrin
GPS and levelling (H-2)

27/04/2009 17TF Workshop, ESA Esrin
Average velocity levelling 1950 - 1997vel
oci
ty (
mm
/y)
Vertical PS Velocity (mm/yr)
-0.5
0
0.5
1
1.5
2
2.5
3
20.0 25.0 30.0 35.0 40.0
vel
oci
ty (
mm
/y)
GPS and levelling (H-2)

27/04/2009 18TF Workshop, ESA Esrin
GPS and levelling (H-2)
- The average velocity measured from levelling is obtained as
displacement/n° years. This clearly implies the hypothesis of constant rate
(1950-1997).
- The PS Asc and Desc velocity, so as the Vertical velocity, measure the
average displacement in the time interval 1992-2000.
- The different amount of average displacements can be explained as due
to a slowing phase of the phenomenon. At the moment, we have no further
measurements (GPS, levelling) enforcing such hypothesis.

Preliminary model (H-3)
27/04/2009 19TF Workshop, ESA Esrin
Two Mogi point-pressure
sources have been used
aligned NS 7 km afar.
The N source is at 7 km
depth the S at 5 km.
The model is in general
agreement with
geophysical and
volcanological data
The EW PS map has been
used to provide further
constraints to the source
position.

Conclusions
27/04/2009 20TF Workshop, ESA Esrin
The Colli Albani area has been investigated to detect possible surface
effects of deep volcanic and seismic activity.
Although the different time intervals we compared PS result 1992-2000,
leveling campaigns 1950-1997, GPS measurements.
In general, the model is in agreement with geophysical and
volcanological data.
The monitoring of the Colli Albani should provide a complete
assessment of the volcanic hazard in this area, strongly inhabited and
highly vulnerable.
New PS processing covering 2001-2009 would be necessary.