Prueba De Filtros Analisis Retencion Particulas Mb
16
Test Report Differentiating Filter Performance By Oil Analysis Results
-
Upload
manuel-rojas-nadal -
Category
Business
-
view
376 -
download
3
Transcript of Prueba De Filtros Analisis Retencion Particulas Mb
Test Report
Differentiating Filter PerformanceBy
Oil Analysis Results
SUMMARY
Purpose
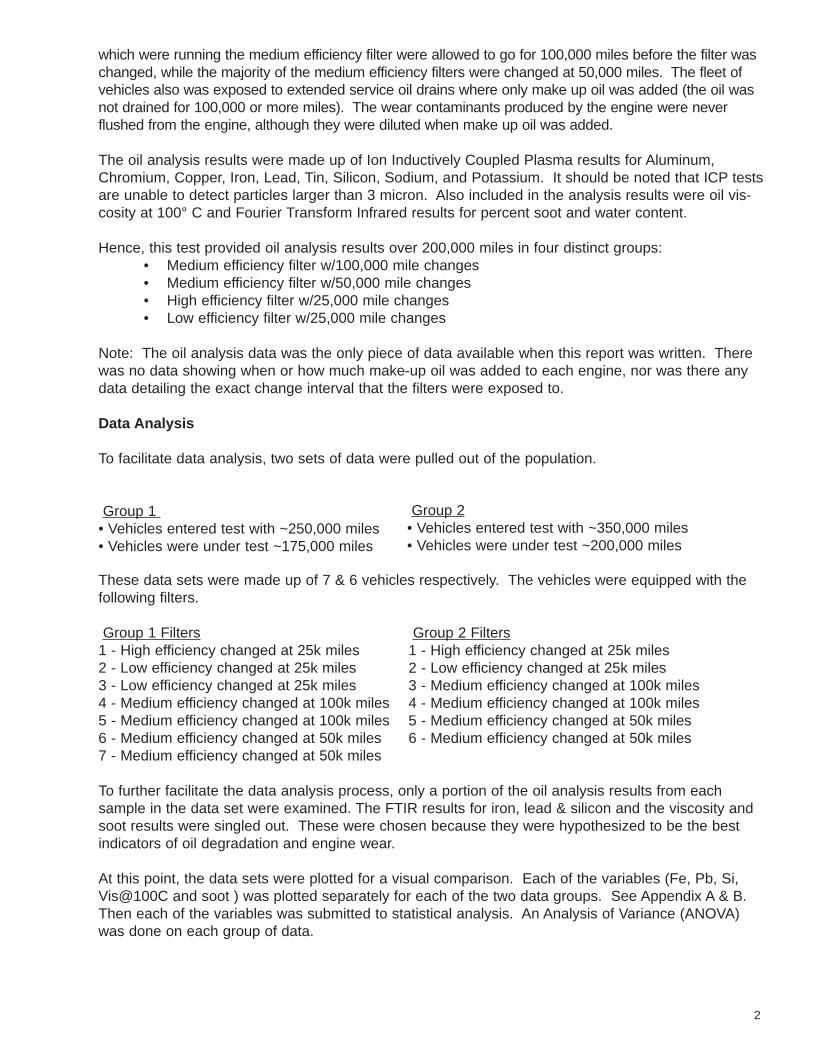
This report documents the analysis of data from a field test run jointly between Fleetguard and a majortrucking fleet in North America from April 1997 to early 1999. The test generated large amounts of oilanalysis data from three different lube filters, of low medium and high efficiency, running extended changeintervals on extended oil drains. The analysis of the data was done to determine if oil analysis alone is agood indicator of filter performance and engine wear protection levels provided by lube filters.
The purpose of this report is to document the analysis of the data from the above described field testand determine if oil analysis alone is a good indicator of filter performance and engine wear protectionprovided by a lube filter. Oftentimes, oil analysis is considered a sure-fire means of predicting thelevel of protection a filter is providing to an engine. If oil analysis were indeed a good predictor ofengine wear protection a filter provides, analysis results would provide a means of comparing different filters and theirperformance in the field. This report attempts to determine if oil analysis is oris not a good tool to use for these filter comparisons.
Field Evaluation Background/Purpose
In April of 1997, a major North American trucking fleet and a major oil company started a joint test withFleetguard. The original purpose of the test was to evaluate the effects of extended service intervals on the oil and the structural durability of the filters and the engines. However, the data generated proved to be useful in determining if oil analysis could truly differentiate filter performance. The test wascompleted in early 1999.
The test was comprised of two parts:
• First, the oil company was evaluating extended oil drain intervals. The drain intervals were extended out to 100,000 miles and beyond. Make-up oil was added when ever necessary, with a maximum of 1 gallon at any one given time.
• Second, Fleetguard was evaluating extended service intervals of filters used on heavy duty diesel engines. The filters were left in service for 50,000 miles on 75 vehicles and 100,000 miles on 8 vehicles. Oil samples were taken from the test vehicles at regular intervals.
Filter Component Information
Three filters were used for these evaluations. 1. High Efficiency - Single element filter, 99% efficient at 10 micron2. Medium Efficiency - Dual element combination filter, primary element 59% efficient at 10 micron,
bypass element 98% efficient at 10 micron3. Low Efficiency - Single element filter, 55% efficient at 10 micron
Data Description
The above described field test provided a large quantity of oil analysis data taken from a single fleet ofvehicles which were using three different levels of engine oil filtration. On top of that, some of the vehicles
1
Conclusion
Results show that the oil analysis data from the filters in the field test were deemed statisticallyequal. Because the oil analysis data from the filters were deemed statistically equal, oil analysisdata alone is not an acceptable means of comparing filter performance.
which were running the medium efficiency filter were allowed to go for 100,000 miles before the filter waschanged, while the majority of the medium efficiency filters were changed at 50,000 miles. The fleet ofvehicles also was exposed to extended service oil drains where only make up oil was added (the oil wasnot drained for 100,000 or more miles). The wear contaminants produced by the engine were neverflushed from the engine, although they were diluted when make up oil was added.
The oil analysis results were made up of Ion Inductively Coupled Plasma results for Aluminum,Chromium, Copper, Iron, Lead, Tin, Silicon, Sodium, and Potassium. It should be noted that ICP testsare unable to detect particles larger than 3 micron. Also included in the analysis results were oil vis-cosity at 100° C and Fourier Transform Infrared results for percent soot and water content.
Hence, this test provided oil analysis results over 200,000 miles in four distinct groups:• Medium efficiency filter w/100,000 mile changes • Medium efficiency filter w/50,000 mile changes• High efficiency filter w/25,000 mile changes• Low efficiency filter w/25,000 mile changes
Note: The oil analysis data was the only piece of data available when this report was written. Therewas no data showing when or how much make-up oil was added to each engine, nor was there anydata detailing the exact change interval that the filters were exposed to.
Data Analysis
To facilitate data analysis, two sets of data were pulled out of the population.
Group 1 • Vehicles entered test with ~250,000 miles• Vehicles were under test ~175,000 miles
These data sets were made up of 7 & 6 vehicles respectively. The vehicles were equipped with thefollowing filters.
Group 1 Filters1 - High efficiency changed at 25k miles2 - Low efficiency changed at 25k miles3 - Low efficiency changed at 25k miles4 - Medium efficiency changed at 100k miles5 - Medium efficiency changed at 100k miles6 - Medium efficiency changed at 50k miles7 - Medium efficiency changed at 50k miles
To further facilitate the data analysis process, only a portion of the oil analysis results from each sample in the data set were examined. The FTIR results for iron, lead & silicon and the viscosity andsoot results were singled out. These were chosen because they were hypothesized to be the bestindicators of oil degradation and engine wear.
At this point, the data sets were plotted for a visual comparison. Each of the variables (Fe, Pb, Si,Vis@100C and soot ) was plotted separately for each of the two data groups. See Appendix A & B.Then each of the variables was submitted to statistical analysis. An Analysis of Variance (ANOVA)was done on each group of data.
2
Group 2• Vehicles entered test with ~350,000 miles • Vehicles were under test ~200,000 miles
Group 2 Filters1 - High efficiency changed at 25k miles2 - Low efficiency changed at 25k miles3 - Medium efficiency changed at 100k miles4 - Medium efficiency changed at 100k miles5 - Medium efficiency changed at 50k miles6 - Medium efficiency changed at 50k miles
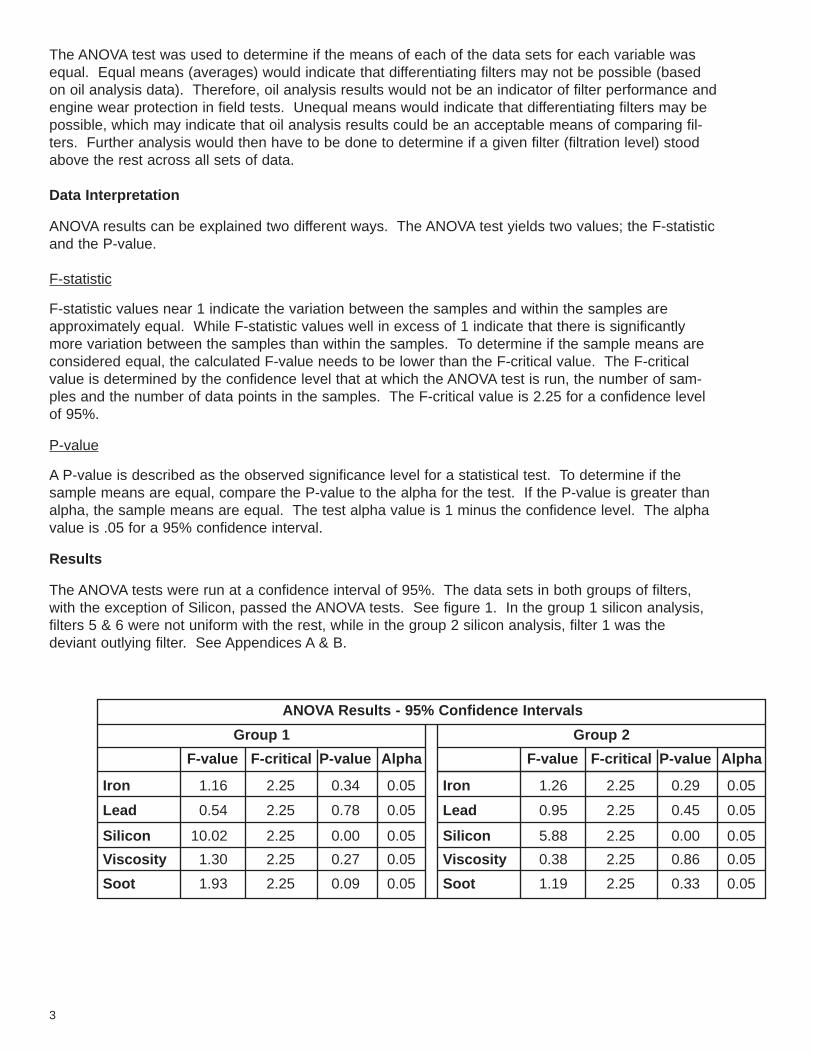
The ANOVA test was used to determine if the means of each of the data sets for each variable wasequal. Equal means (averages) would indicate that differentiating filters may not be possible (basedon oil analysis data). Therefore, oil analysis results would not be an indicator of filter performance andengine wear protection in field tests. Unequal means would indicate that differentiating filters may bepossible, which may indicate that oil analysis results could be an acceptable means of comparing fil-ters. Further analysis would then have to be done to determine if a given filter (filtration level) stoodabove the rest across all sets of data.
Data Interpretation
ANOVA results can be explained two different ways. The ANOVA test yields two values; the F-statisticand the P-value.
F-statistic
F-statistic values near 1 indicate the variation between the samples and within the samples areapproximately equal. While F-statistic values well in excess of 1 indicate that there is significantlymore variation between the samples than within the samples. To determine if the sample means areconsidered equal, the calculated F-value needs to be lower than the F-critical value. The F-criticalvalue is determined by the confidence level that at which the ANOVA test is run, the number of sam-ples and the number of data points in the samples. The F-critical value is 2.25 for a confidence levelof 95%.
P-value
A P-value is described as the observed significance level for a statistical test. To determine if thesample means are equal, compare the P-value to the alpha for the test. If the P-value is greater thanalpha, the sample means are equal. The test alpha value is 1 minus the confidence level. The alphavalue is .05 for a 95% confidence interval.
Results
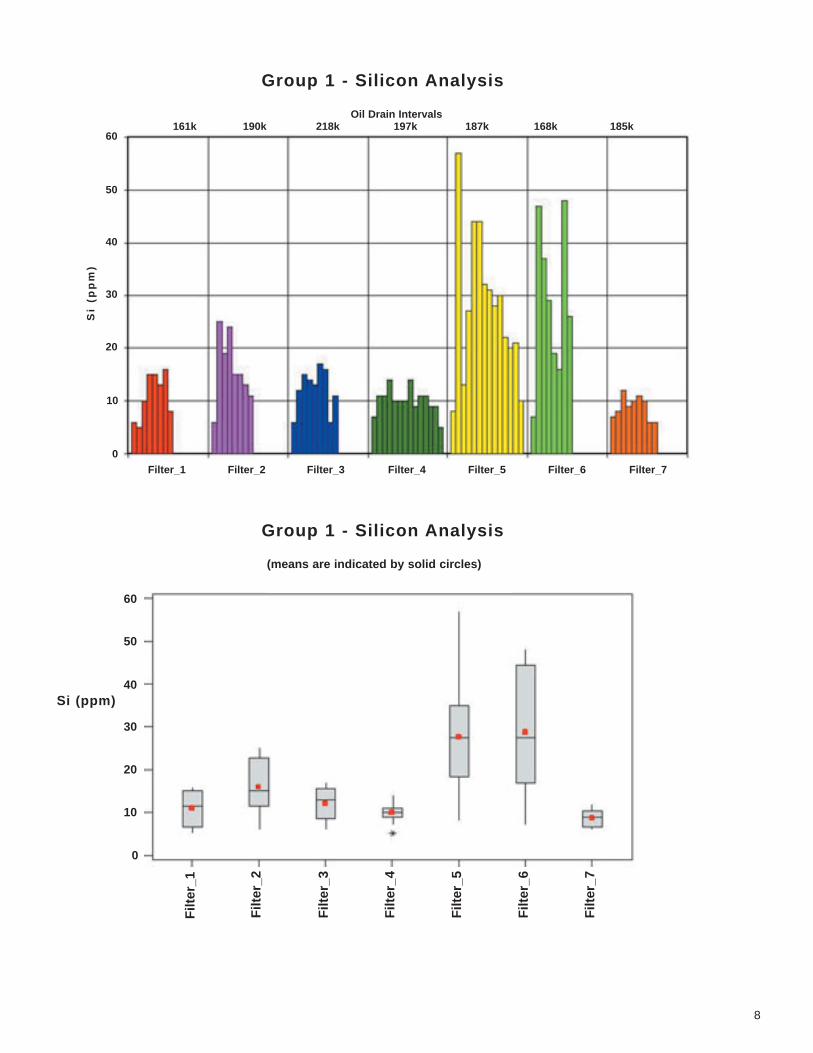
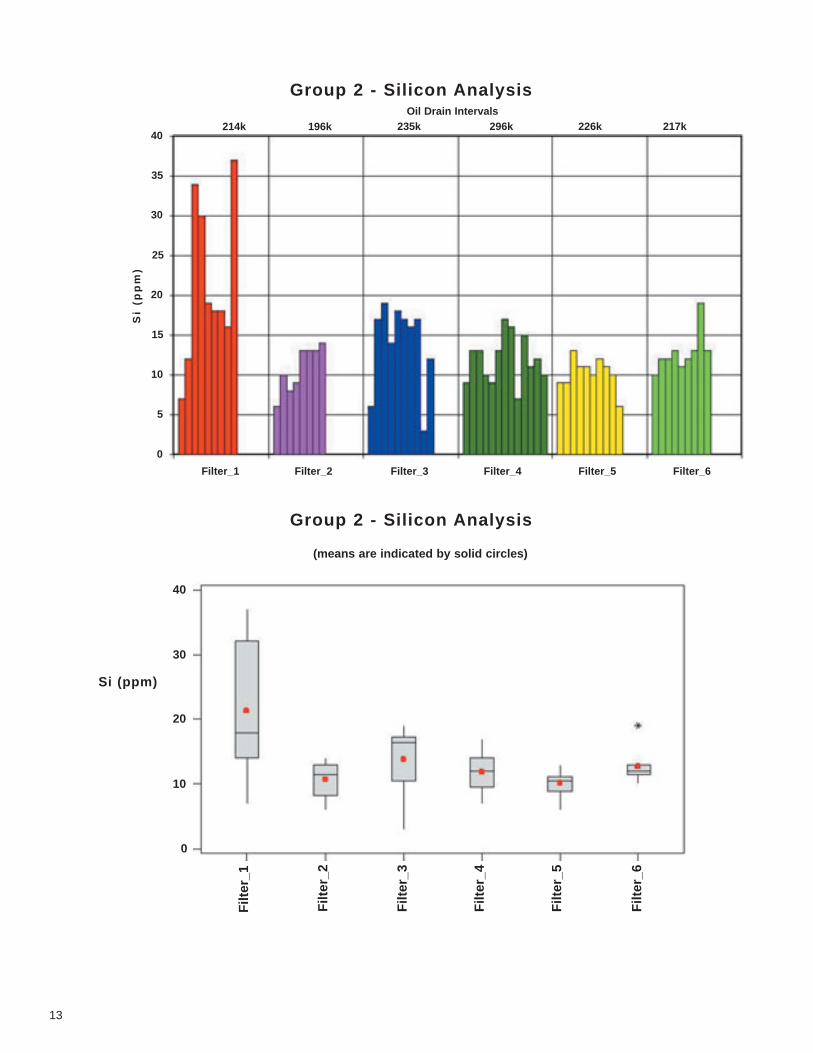
The ANOVA tests were run at a confidence interval of 95%. The data sets in both groups of filters,with the exception of Silicon, passed the ANOVA tests. See figure 1. In the group 1 silicon analysis,filters 5 & 6 were not uniform with the rest, while in the group 2 silicon analysis, filter 1 was thedeviant outlying filter. See Appendices A & B.
3
ANOVA Results - 95% Confidence Intervals
Group 1 Group 2
F-value F-critical P-value Alpha
Iron 1.16 2.25 0.34 0.05
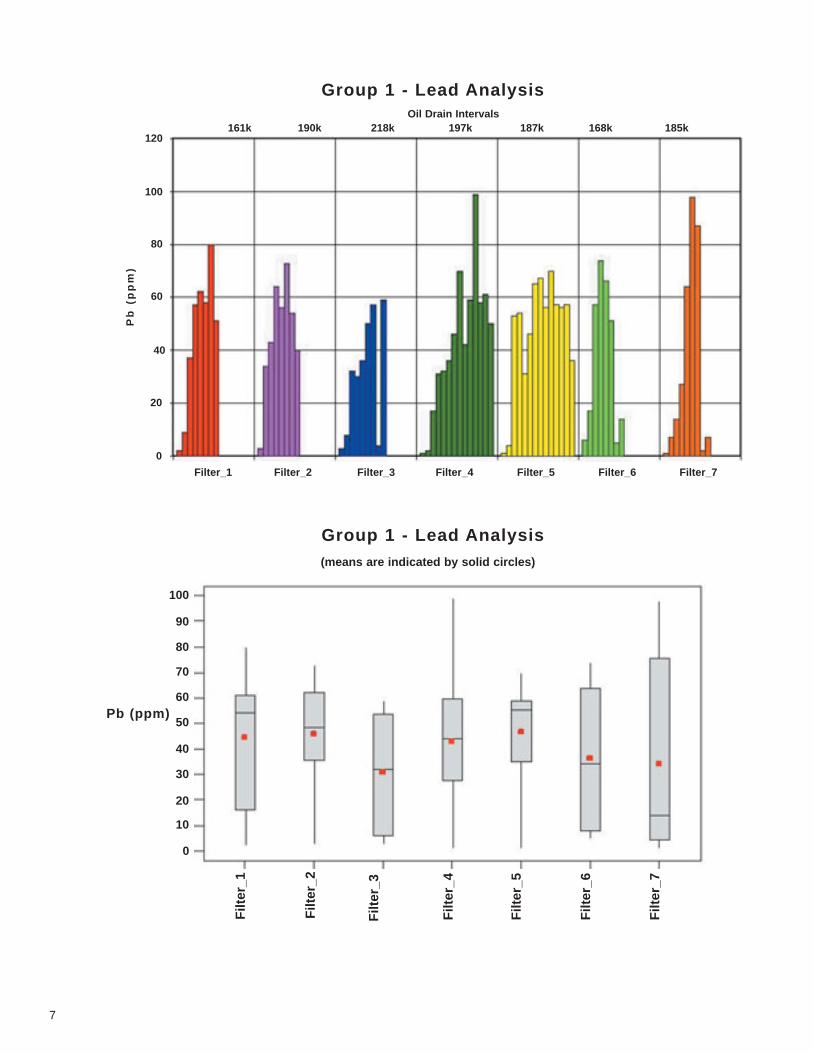
Lead 0.54 2.25 0.78 0.05
Silicon 10.02 2.25 0.00 0.05
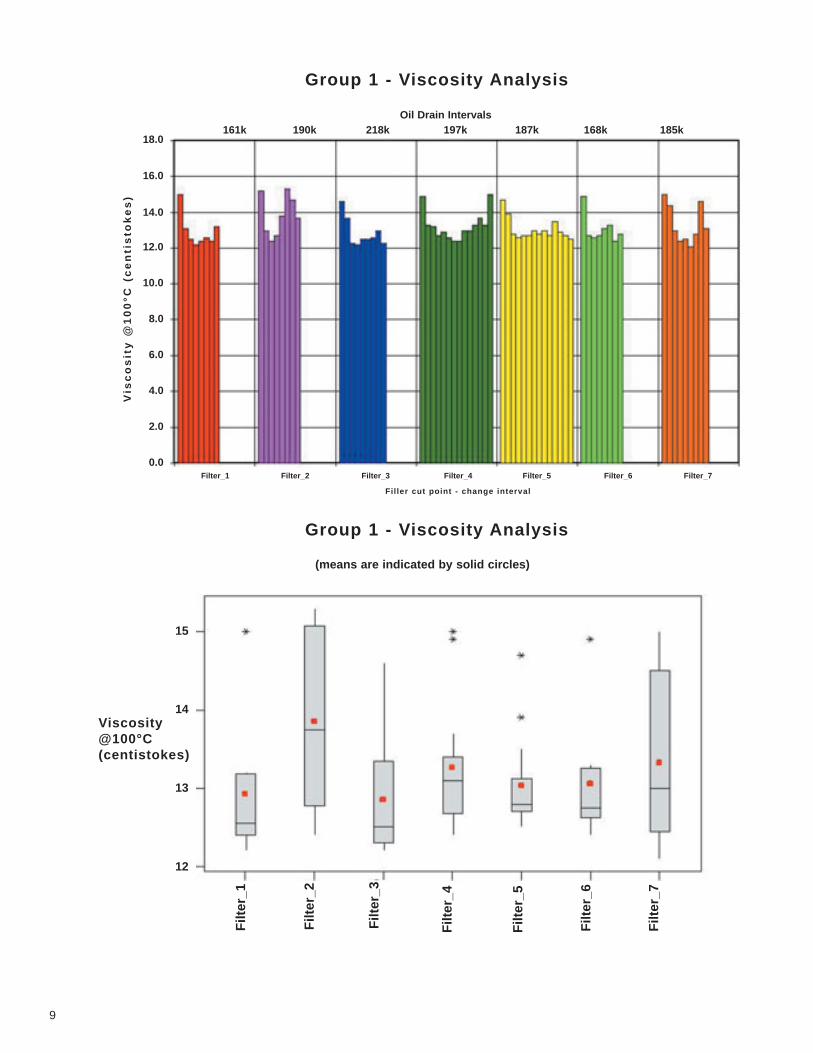
Viscosity 1.30 2.25 0.27 0.05
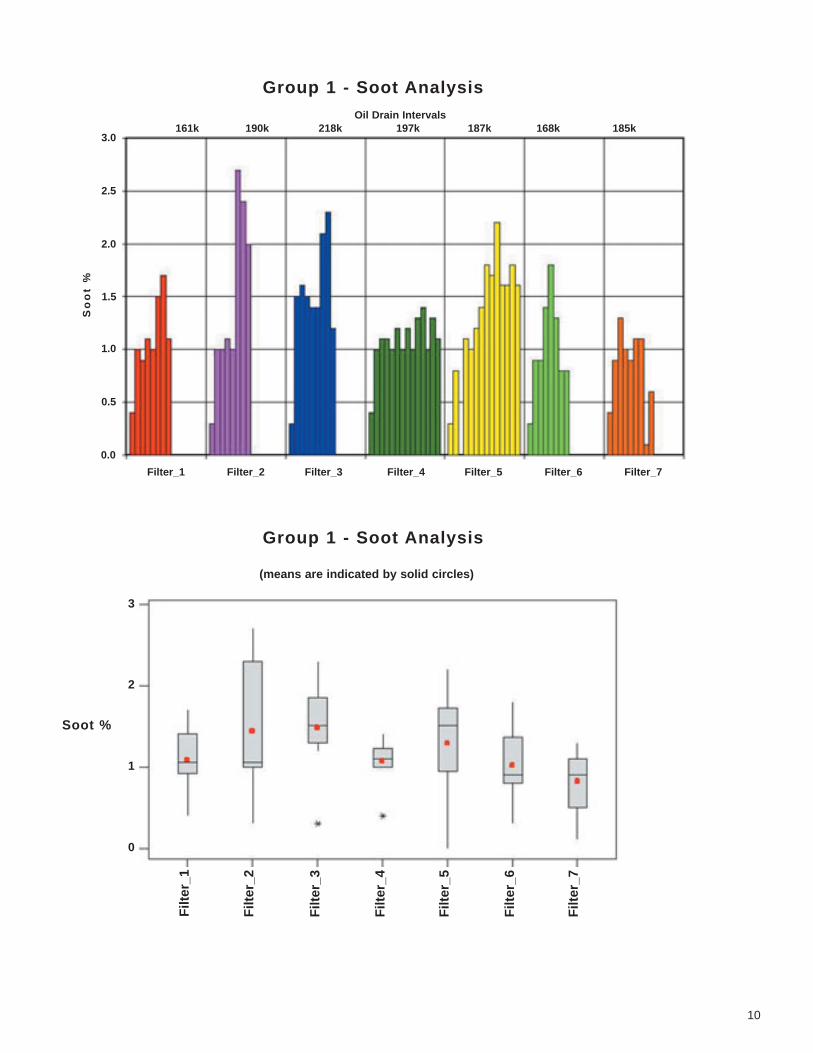
Soot 1.93 2.25 0.09 0.05
F-value F-critical P-value Alpha
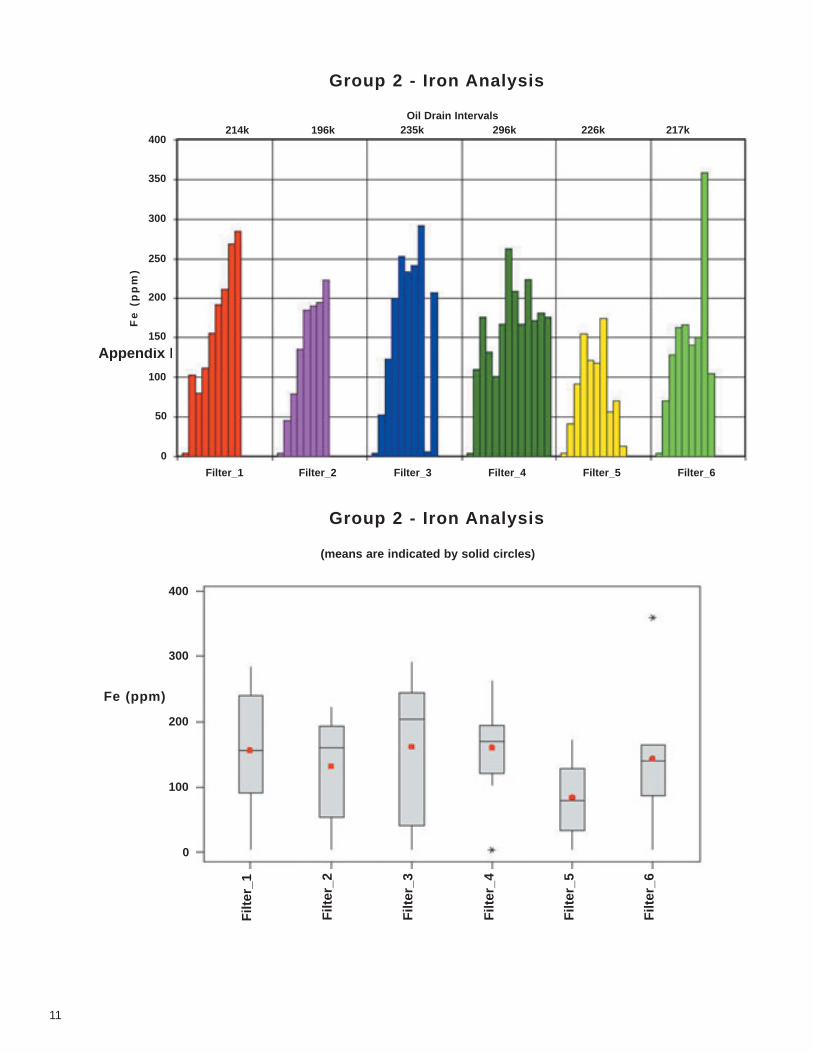
Iron 1.26 2.25 0.29 0.05
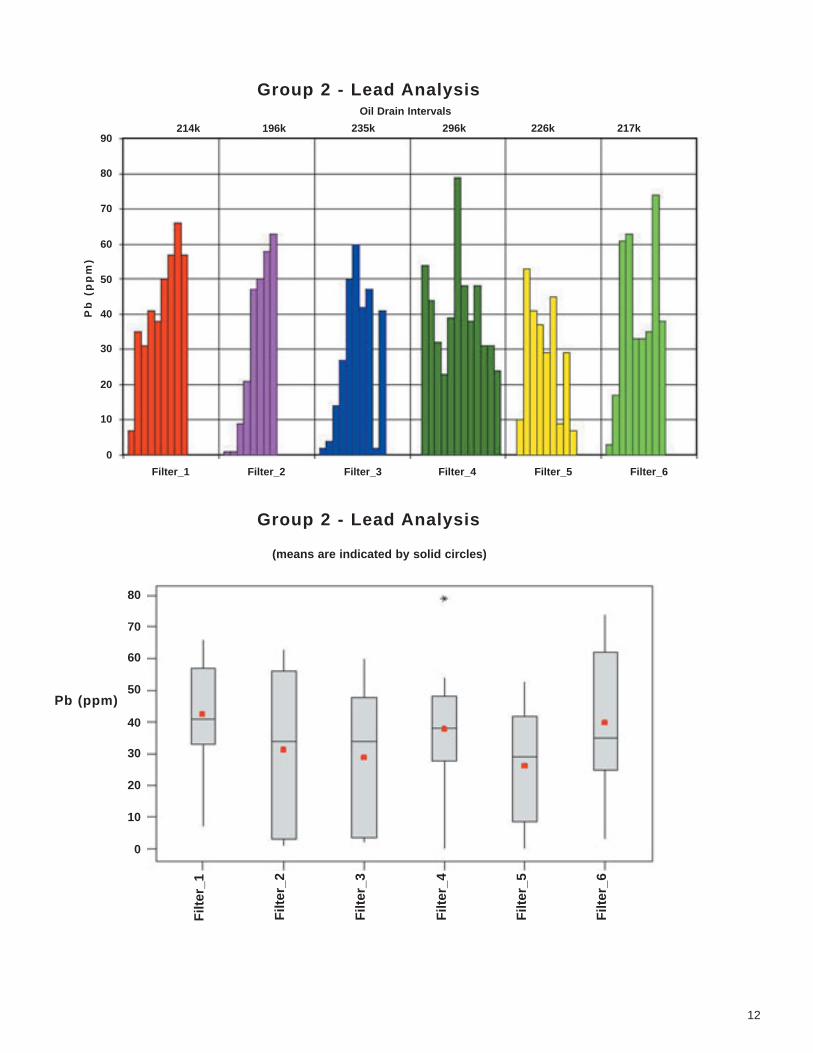
Lead 0.95 2.25 0.45 0.05
Silicon 5.88 2.25 0.00 0.05
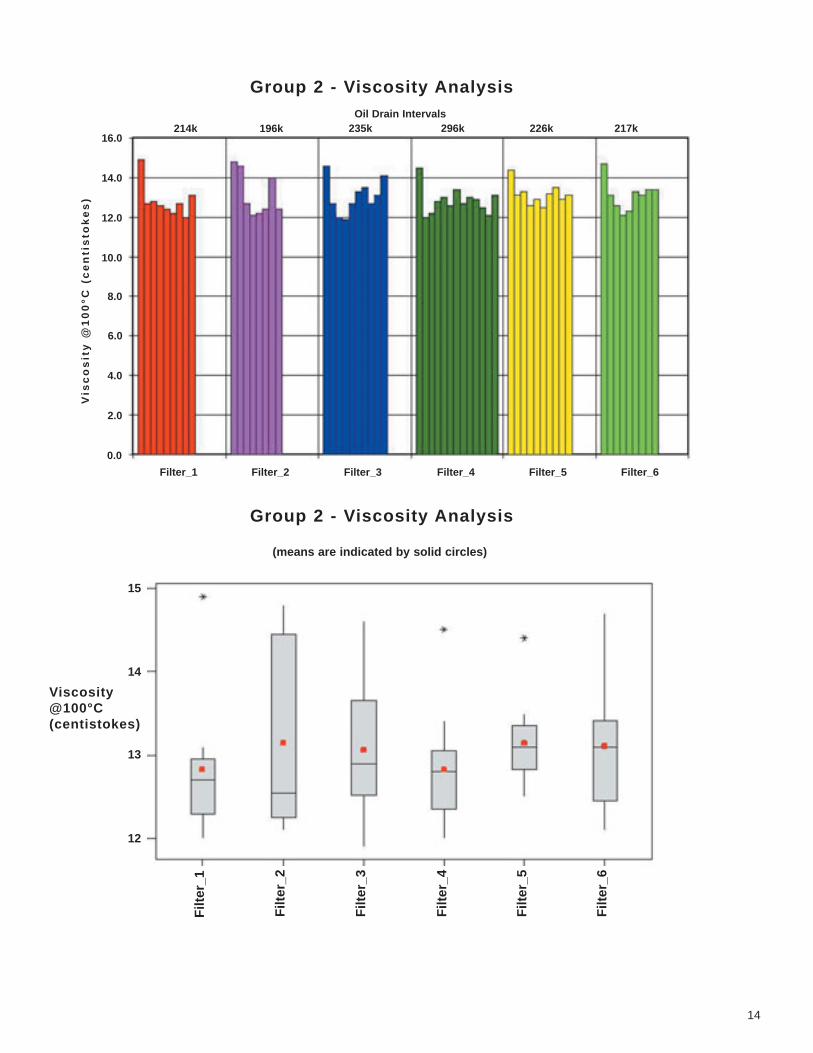
Viscosity 0.38 2.25 0.86 0.05
Soot 1.19 2.25 0.33 0.05
Figure 1 - Summarized ANOVA Results
Conclusion
Oil sampling and its related analysis results alone are not an acceptable means of differentiating filterperformance when it is based on field test data. All sample groups passed the ANOVA tests with theexception of the Silicon sample from both groups 1 & 2. But, the outlying filters, were not the same inboth instances. Therefore, these ANOVA test failures may be due to some unseen or tested variableunrelated to the filter.
Oil sample analysis may not be an acceptable means of differentiating filters for several reasons:• Engine wear rates may not be identical - There are too many variables that affect this, filters being
just one of them. This could be due to driver differences and vehicle duty cycles. • The particle size distributions for the engine wear particles may not be the same for all engines -
Particle size distribution would affect the number of particles passing under the cut point of the filter, thus causing variations in the oil samples.
• Oil analysis tests such as ICP typically are unable to detect particles larger than 3 micron - The results of the oil analysis tests will show a limited view of the actual condition of the oil. This is especially true when engine failure is imminent and wear particles would be large enough to be caught by a filter.
4
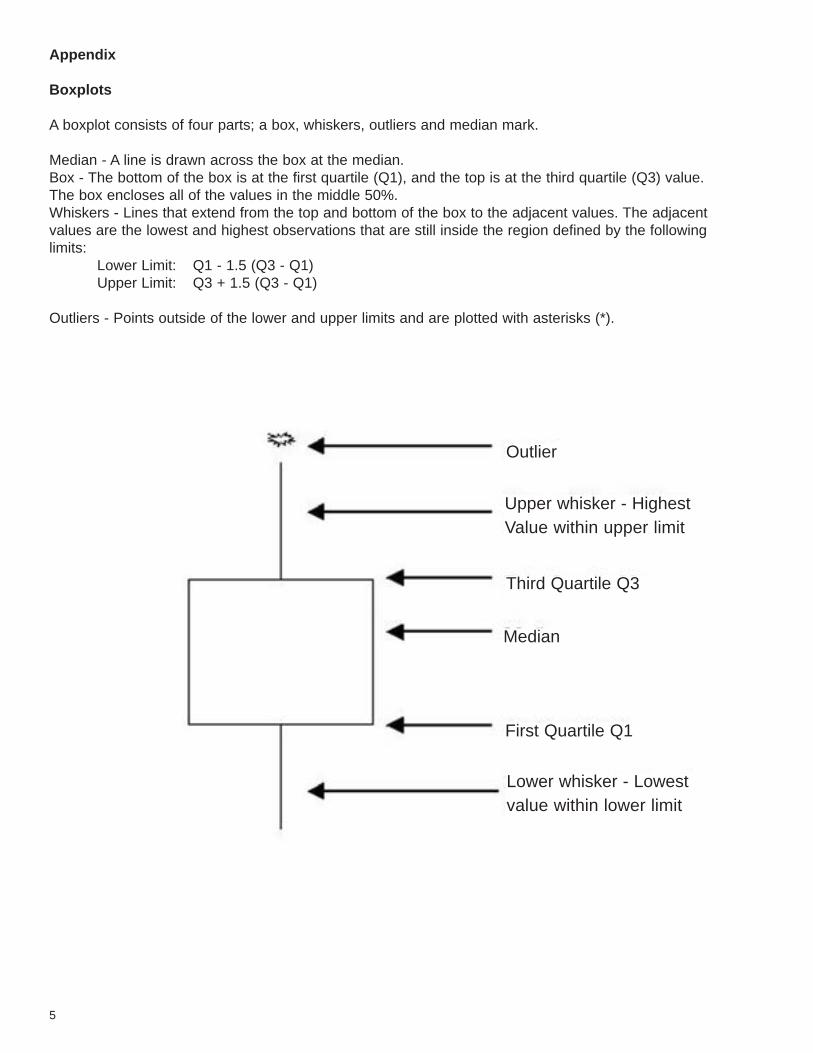
Appendix
Boxplots
A boxplot consists of four parts; a box, whiskers, outliers and median mark.
Median - A line is drawn across the box at the median. Box - The bottom of the box is at the first quartile (Q1), and the top is at the third quartile (Q3) value.The box encloses all of the values in the middle 50%. Whiskers - Lines that extend from the top and bottom of the box to the adjacent values. The adjacentvalues are the lowest and highest observations that are still inside the region defined by the followinglimits:
Lower Limit: Q1 - 1.5 (Q3 - Q1)Upper Limit: Q3 + 1.5 (Q3 - Q1)
Outliers - Points outside of the lower and upper limits and are plotted with asterisks (*).
5
Outlier
Third Quartile Q3
First Quartile Q1
Median
Upper whisker - HighestValue within upper limit
Lower whisker - Lowestvalue within lower limit
6
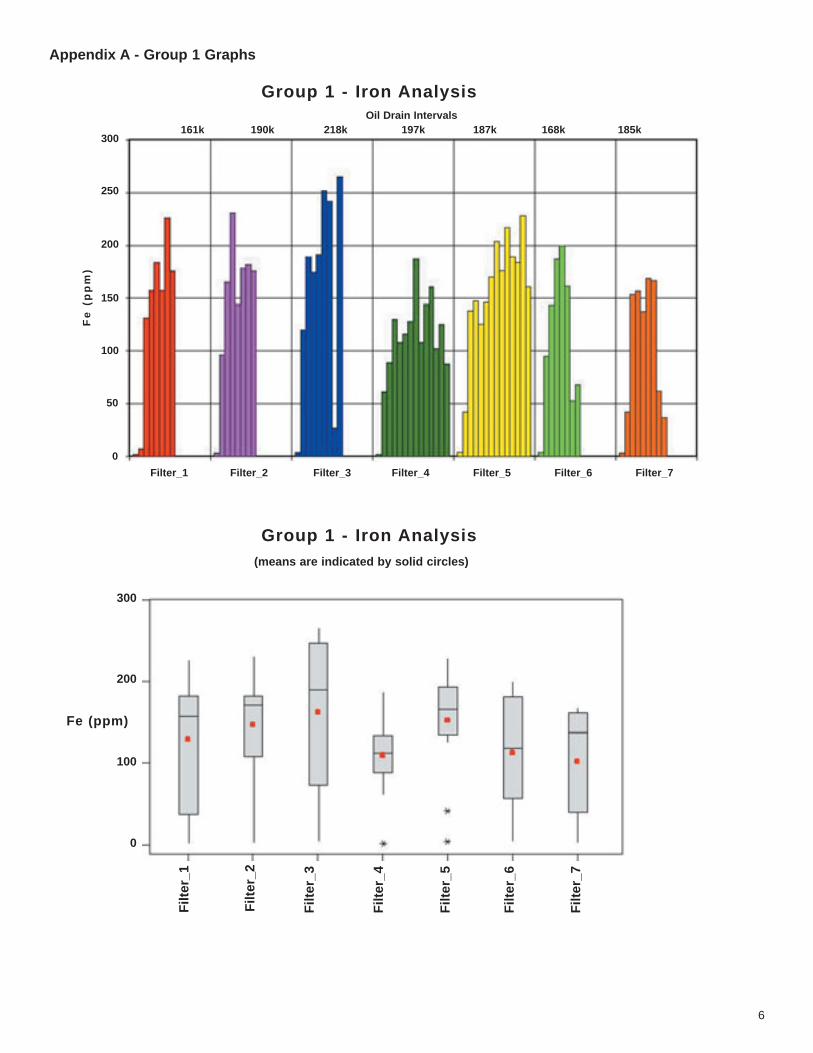
Appendix A - Group 1 Graphs
Oil Drain Intervals
(means are indicated by solid circles)
Group 1 - Iron Analysis
Group 1 - Iron Analysis
Filter_1 Filter_2 Filter_3 Filter_4 Filter_5 Filter_6 Filter_7
300
250
200
150
100
50
0
Fe (ppm)
Fe
(p
pm
)
161k 190k 218k 197k 187k 168k 185k
300
200
100
0
Filt
er_1
Filt
er_2
Filt
er_3
Filt
er_4
Filt
er_5
Filt
er_6
Filt
er_7
1 Confidential Test Report7
Oil Drain Intervals
(means are indicated by solid circles)
Group 1 - Lead Analysis
Group 1 - Lead Analysis
120
100
80
60
40
20
0
Filter_1 Filter_2 Filter_3 Filter_4 Filter_5 Filter_6 Filter_7
Pb
(p
pm
)161k 190k 218k 197k 187k 168k 185k
100
90
80
70
60
50
40
30
20
10
0
Pb (ppm)
Filt
er_1
Filt
er_2
Filt
er_3
Filt
er_4
Filt
er_5
Filt
er_6
Filt
er_7
8
Oil Drain Intervals
(means are indicated by solid circles)
Group 1 - Silicon Analysis
Group 1 - Silicon Analysis
Filter_1 Filter_2 Filter_3 Filter_4 Filter_5 Filter_6 Filter_7
Filt
er_1
Filt
er_2
Filt
er_3
Filt
er_4
Filt
er_5
Filt
er_6
Filt
er_7
60
50
40
30
20
10
0
Si
(pp
m)
Si (ppm)
161k 190k 218k 197k 187k 168k 185k
60
50
40
30
20
10
0
9
Oil Drain Intervals
(means are indicated by solid circles)
Group 1 - Viscosity Analysis
Group 1 - Viscosity Analysis
Filter_1 Filter_2 Filter_3
Filler cut point - change interval
Filter_4 Filter_5 Filter_6 Filter_7
18.0
16.0
14.0
12.0
10.0
8.0
6.0
4.0
2.0
0.0
Vis
co
sit
y @
10
0°C
(c
en
tis
tok
es
)161k 190k 218k 197k 187k 168k 185k
15
14
13
12
Viscosity @100°C (centistokes)
Filt
er_1
Filt
er_2
Filt
er_3
Filt
er_4
Filt
er_5
Filt
er_6
Filt
er_7
10
Oil Drain Intervals
(means are indicated by solid circles)
Group 1 - Soot Analysis
Group 1 - Soot Analysis
Filter_1 Filter_2 Filter_3 Filter_4 Filter_5 Filter_6 Filter_7
2.0
2.5
3.0
1.5
1.0
0.5
0.0
So
ot
%
Soot %
161k 190k 218k 197k 187k 168k 185k
3
2
1
0
Filt
er_1
Filt
er_2
Filt
er_3
Filt
er_4
Filt
er_5
Filt
er_6
Filt
er_7
1 Confidential Test Report
Appendix B - Group 2 Graphs
11
Oil Drain Intervals
(means are indicated by solid circles)
Group 2 - Iron Analysis
Group 2 - Iron Analysis
Filter_1 Filter_2 Filter_3 Filter_4 Filter_5 Filter_6
400
300
350
200
250
150
100
50
0
Fe
(p
pm
)214k 196k 235k 296k 226k 217k
Fe (ppm)
400
300
200
100
0
Filt
er_1
Filt
er_2
Filt
er_3
Filt
er_4
Filt
er_5
Filt
er_6
Confidential Test Report 112
Oil Drain Intervals
(means are indicated by solid circles)
Group 2 - Lead Analysis
Group 2 - Lead Analysis
Filter_1 Filter_2 Filter_3 Filter_4 Filter_5 Filter_6
90
80
70
60
50
40
30
20
10
0
Pb
(p
pm
)
214k 196k 235k 296k 226k 217k
80
70
60
50
40
30
20
10
0
Pb (ppm)
Filt
er_1
Filt
er_2
Filt
er_3
Filt
er_4
Filt
er_5
Filt
er_6
1 Confidential Test Report13
Oil Drain Intervals
(means are indicated by solid circles)
Group 2 - Silicon Analysis
Group 2 - Silicon Analysis
Filter_1 Filter_2 Filter_3 Filter_4 Filter_5 Filter_6
40
35
30
25
20
15
10
5
0
Si
(pp
m)
214k 196k 235k 296k 226k 217k
Si (ppm)
40
30
20
10
0
Filt
er_1
Filt
er_2
Filt
er_3
Filt
er_4
Filt
er_5
Filt
er_6
Confidential Test Report 114
Oil Drain Intervals
(means are indicated by solid circles)
Group 2 - Viscosity Analysis
Group 2 - Viscosity Analysis
Filter_1 Filter_2 Filter_3 Filter_4 Filter_5 Filter_6
8.0
10.0
12.0
14.0
16.0
6.0
4.0
2.0
0.0
Vis
co
sit
y @
10
0°C
(c
en
tis
tok
es
)
214k 196k 235k 296k 226k 217k
Viscosity @100°C (centistokes)
15
14
13
12
Filt
er_1
Filt
er_2
Filt
er_3
Filt
er_4
Filt
er_5
Filt
er_6
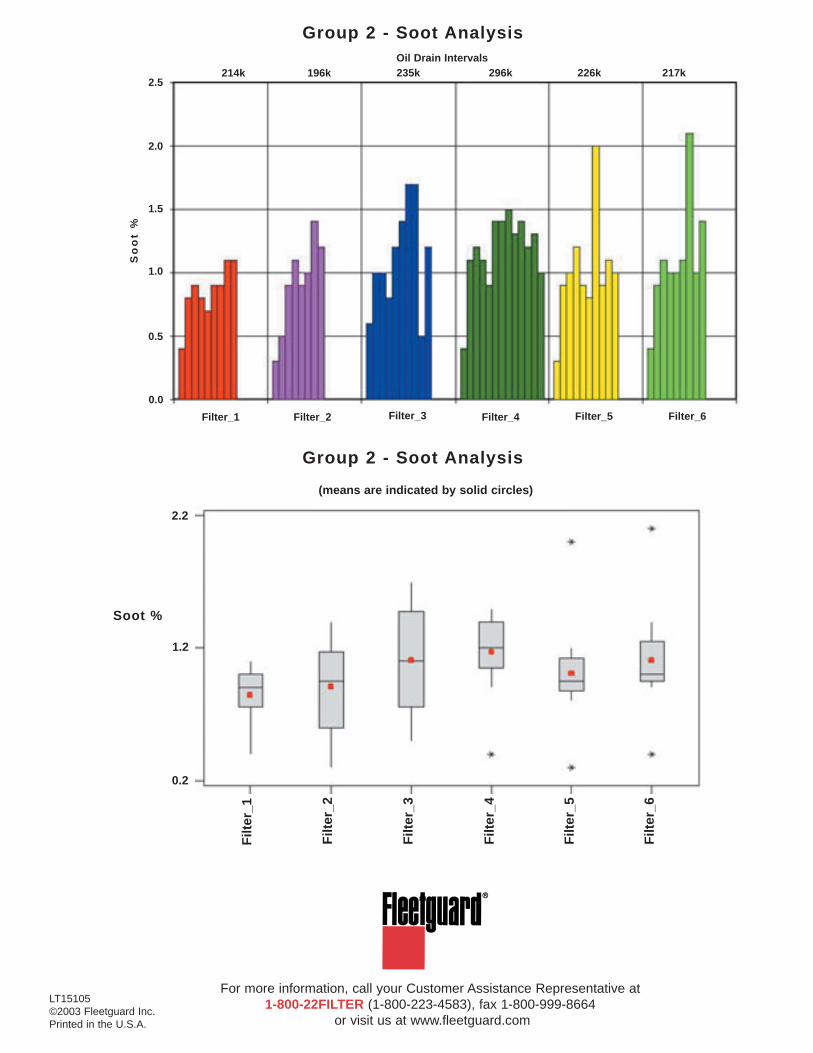
Oil Drain Intervals
(means are indicated by solid circles)
Group 2 - Soot Analysis
Group 2 - Soot Analysis
Filter_1 Filter_2 Filter_3 Filter_4 Filter_5 Filter_6
0.5
1.0
1.5
2.0
2.5
0.0
So
ot
%
214k 196k 235k 296k 226k 217k
Soot %
2.2
1.2
0.2
Filt
er_1
Filt
er_2
Filt
er_3
Filt
er_4
Filt
er_5
Filt
er_6
LT15105©2003 Fleetguard Inc.Printed in the U.S.A.
For more information, call your Customer Assistance Representative at 1-800-22FILTER (1-800-223-4583), fax 1-800-999-8664
or visit us at www.fleetguard.com