
PRtrytrghj
12
Global warming From Wikipedia, the free encyclopedia Jump to: navigation, search This article is about the current change in Earth's climate. For general discussion of how the climate can change, see Climate change. For other uses, see Global warming (disambiguation) . Global mean land-ocean temperature change from 1880 – 2012, relative to the 1951 – 1980 mean. The black line is the annual mean and the red line is the 5-year running mean. The green bars show uncertainty estimates. Source: NASA GISS. (click for larger image) The map shows the 10-year average (2000 – 2009) global mean temperature anomaly relative to the 1951 – 1980 mean. The largest temperature increases a re in the Arctic and the Antarctic Peninsula. Source: NASA Earth Observatory [1] Fossil fuel related CO 2 emissions compared to five of the IPCC's "SRES" emissions scenarios. The dips are related to global recessions. Image source: Skeptical Science . Global warming is the rise in the average temperature of Earth's atmosphere an d oceans since the late 19th century and its projected continuation. Since the early 20th c entury, Earth's mean surface temperature has increased by about 0.8 °C (1.4 °F), with about two-thirds o f the increase occurring since 1980. [2] Warming of the climate system is unequivocal, and scientists are more than 90% certain that it is primarily caused by increasing concentrations of greenhouse gases produced by human activities such as the burning of fossil fuels and deforestation. [3][4][5][6][7] These findings are recognized by the national science academies of all major industrialized nations . [8][A] Climate model projections were summarized in the 2007 Fourth Assessment Report (AR4) by the Intergovernmental Panel on Climate Change (IPCC). They indicated that during the 21st century the global surface temperature is likely to rise a further 1 .1 to 2.9 °C (2 to 5.2 °F change)
-
Upload
teena-varma -
Category
Documents
-
view
221 -
download
0
Transcript of PRtrytrghj
7/27/2019 PRtrytrghj
http://slidepdf.com/reader/full/prtrytrghj 1/11
Global warmingFrom Wikipedia, the free encyclopediaJump to: navigation , search
This article is about the current change in Earth's climate. For general discussion of how theclimate can change, see Climate change . For other uses, see Global warming (disambiguation) .
Global mean land-ocean temperature change from 1880 – 2012, relative to the 1951 – 1980 mean.The black line is the annual mean and the red line is the 5-year running mean . The green barsshow uncertainty estimates. Source: NASA GISS . (click for larger image )
The map shows the 10-year average (2000 – 2009) global mean temperature anomaly relative to
the 1951 – 1980 mean. The largest temperature increases are in the Arctic and the AntarcticPeninsula. Source: NASA Earth Observatory [1]
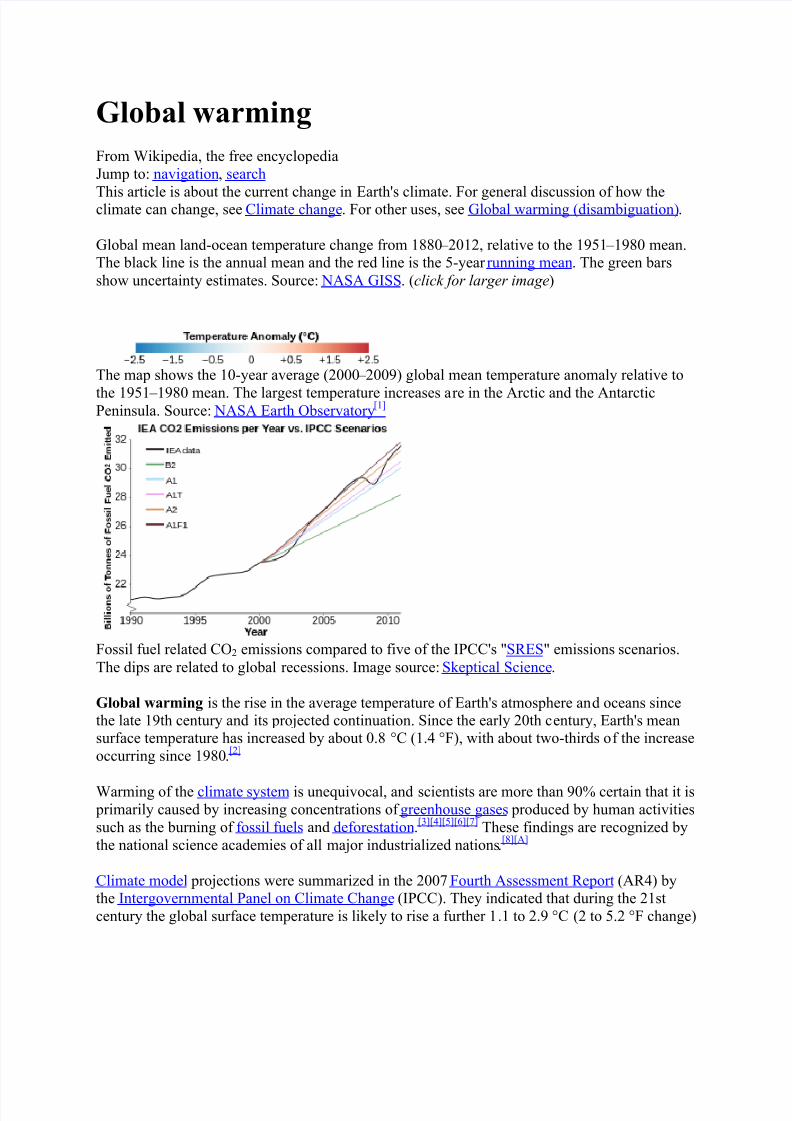
Fossil fuel related CO 2 emissions compared to five of the IPCC's " SRES " emissions scenarios.The dips are related to global recessions. Image source: Skeptical Science .
Global warming is the rise in the average temperature of Earth's atmosphere and oceans sincethe late 19th century and its projected continuation. Since the early 20th century, Earth's meansurface temperature has increased by about 0.8 °C (1.4 °F), with about two-thirds of the increaseoccurring since 1980 .[2]
Warming of the climate system is unequivocal, and scientists are more than 90% certain that it is primarily caused by increasing concentrations of greenhouse gases produced by human activitiessuch as the burning of fossil fuels and deforestation .[3][4 ][5][6 ][7] These findings are recognized bythe national science academies of all major industrialized nations .[8][A]
Climate model projections were summarized in the 2007 Fourth Assessment Report (AR4) bythe Intergovernmental Panel on Climate Change (IPCC). They indicated that during the 21stcentury the global surface temperature is likely to rise a further 1.1 to 2.9 °C (2 to 5.2 °F change)
7/27/2019 PRtrytrghj
http://slidepdf.com/reader/full/prtrytrghj 2/11
for their lowest emissions scenario and 2.4 to 6.4 °C (4.3 to 11.5 °F change) for their highest .[9] The ranges of these estimates arise from the use of models with differing sensitivity togreenhouse gas concentrations .[10][11]
Future climate change and associated impact s[12] will vary from region to region around the
globe .[13]
The effects of an increase in global temperature include a rise in sea levels and achange in the amount and pattern of precipitation , as well as a probable expansion of subtropical deserts .[14] Warming is expected to be strongest in the Arctic and would be associated with thecontinuing retreat of glaciers , permafrost and sea ice . Other likely effects of the warming includea more frequent occurrence of extreme weather events including heat waves , droughts and heavyrainfall, ocean acidification and species extinctions due to shifting temperature regimes. Effectssignificant to humans include the threat to food security from decreasing crop yields and the lossof habitat from inundation .[15][16]
Proposed policy responses to global warming include mitigation by emissions reduction,adaptation to its effects, and possible future geoengineering . Most countries are parties to the
United Nations Framework Convention on Climate Change (UNFCCC) ,[17]
whose ultimateobjective is to prevent dangerous anthropogenic (i.e., human-induced) climate change .[18] Partiesto the UNFCCC have adopted a range of policies designed to reduce greenhouse gasemission s[19] :10[20][21 ][22] :9 and to assist in adaptation to global warming .[19] :13[22] :10[23][24] Parties tothe UNFCCC have agreed that deep cuts in emissions are required ,[25] and that future globalwarming should be limited to below 2.0 °C (3.6 °F) relative to the pre-industrial level .[25][B] Reports published in 2011 by the United Nations Environment Programme [26] and theInternational Energy Agency [27] suggest that efforts as of the early 21st century to reduceemissions may be inadequate to meet the UNFCCC's 2 °C target.
bserved temperature changes
Main article: Instrumental temperature record
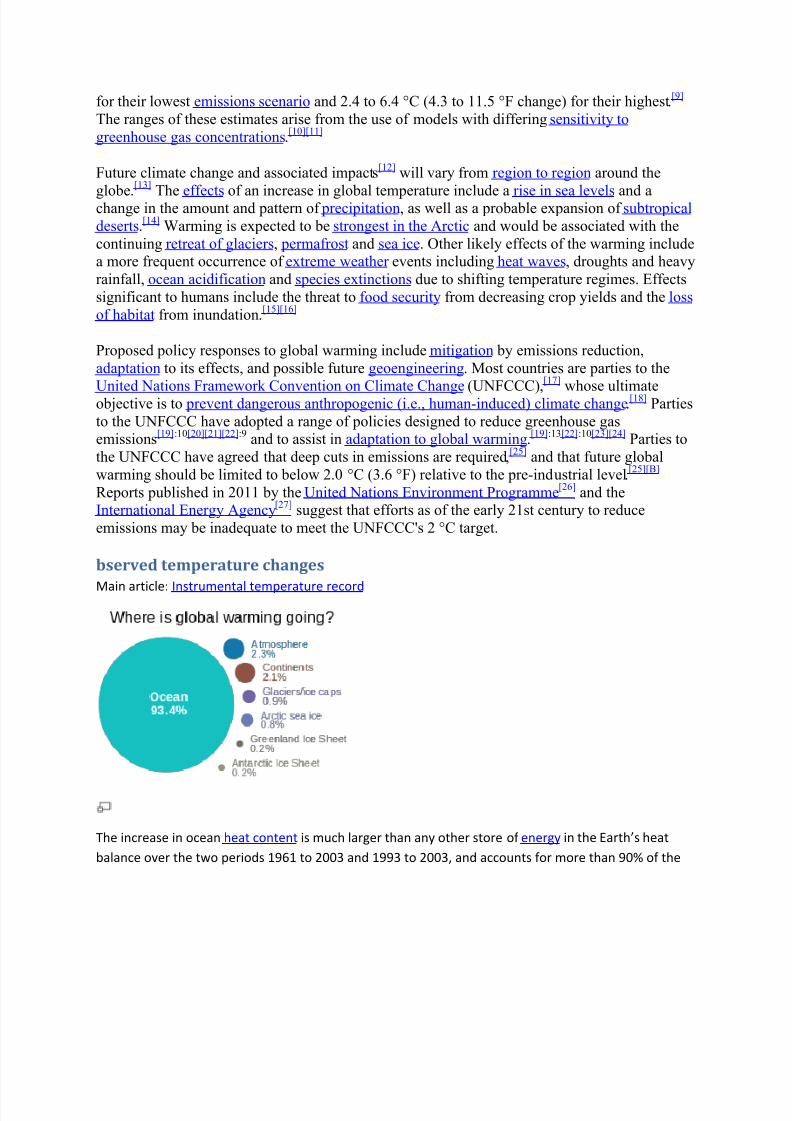
The increase in ocean heat content is much larger than any other store of energy in the Earth’s heat
balance over the two periods 1961 to 2003 and 1993 to 2003, and accounts for more than 90% of the

7/27/2019 PRtrytrghj
http://slidepdf.com/reader/full/prtrytrghj 3/11
possible increase in heat content of the Earth system during these periods .[28]
Two millennia of mean surface temperatures according to different reconstructions from climateproxies , each smoothed on a decadal scale, with the instrumental temperature record overlaid in black.
The Earth's average surface temperature rose by 0.74±0.18 °C over the period 1906 – 2005. Therate of warming over the last half of that period was almost double that for the period as a whole(0.13±0.03 °C per decade, versus 0.07±0.02 °C per decade). The urban heat island effect is verysmall, estimated to account for less than 0.002 °C of warming per decade since 1900 .[29] Temperatures in the lower troposphere have increased between 0.13 and 0.22 °C (0.22 and0.4 °F) per decade since 1979, according to satellite temperature measurements . Climate proxies show the temperature to have been relatively stable over the one or two thousand years before1850, with regionally varying fluctuations such as the Medieval Warm Period and the Little IceAge .[30]
Recent estimates by NASA 's Goddard Institute for Space Studies (GISS) and the NationalClimatic Data Center show that 2005 and 2010 tied for the planet's warmest year since reliable,widespread instrumental measurements became available in the late 19th century, exceeding1998 by a few hundredths of a degree .[36][37 ][38] Estimates by the Climatic Research Unit (CRU)show 2005 as the second warmest year, behind 1998 with 2003 and 2010 tied for third warmestyear, however, "the error estimate for individual years ... is at least ten times larger than thedifferences between these three years. "[39] The World Meteorological Organization (WMO)
statement on the status of the global climate in 2010 explains that, "The 2010 nominal value of +0.53 °C ranks just ahead of those of 2005 (+0.52 °C) and 1998 (+0.51 °C), although thedifferences between the three years are not statistically significant..." [40] Every year from 1986 to2012 has seen world annual mean temperatures above the 1961-1990 average. [41][42] [dated info ]
7/27/2019 PRtrytrghj
http://slidepdf.com/reader/full/prtrytrghj 4/11
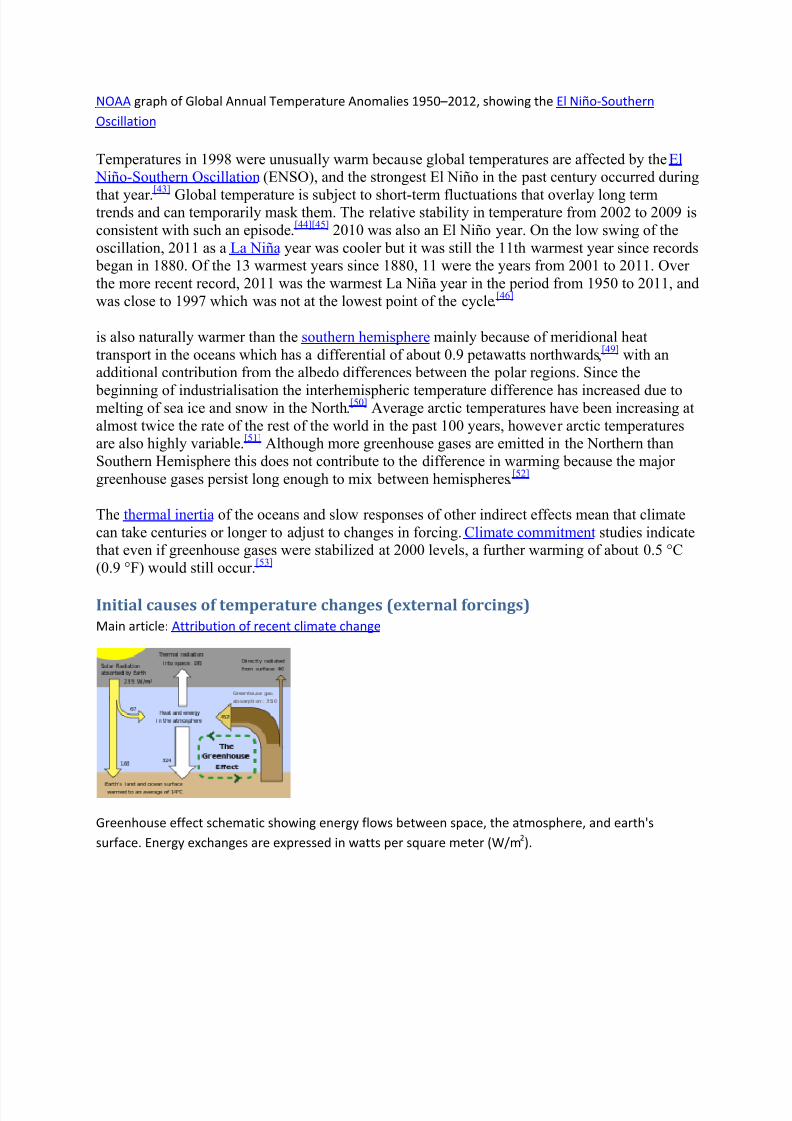
NOAA graph of Global Annual Temperature Anomalies 1950 – 2012, showing the El Niño-SouthernOscillation
Temperatures in 1998 were unusually warm because global temperatures are affected by the El Niño-Southern Oscillation (ENSO), and the strongest El Niño in the past century occurred during
that year .[43]
Global temperature is subject to short-term fluctuations that overlay long termtrends and can temporarily mask them. The relative stability in temperature from 2002 to 2009 isconsistent with such an episode .[44][45] 2010 was also an El Niño year. On the low swing of theoscillation, 2011 as a La Niña year was cooler but it was still the 11th warmest year since records
began in 1880. Of the 13 warmest years since 1880, 11 were the years from 2001 to 2011. Over the more recent record, 2011 was the warmest La Niña year in the period from 1950 to 2011, andwas close to 1997 which was not at the lowest point of the cycle .[46]
is also naturally warmer than the southern hemisphere mainly because of meridional heattransport in the oceans which has a differential of about 0.9 petawatts northwards ,[49] with anadditional contribution from the albedo differences between the polar regions. Since the
beginning of industrialisation the interhemispheric temperature difference has increased due tomelting of sea ice and snow in the North .[50] Average arctic temperatures have been increasing atalmost twice the rate of the rest of the world in the past 100 years, however arctic temperaturesare also highly variable .[51] Although more greenhouse gases are emitted in the Northern thanSouthern Hemisphere this does not contribute to the difference in warming because the major greenhouse gases persist long enough to mix between hemispheres .[52]
The thermal inertia of the oceans and slow responses of other indirect effects mean that climatecan take centuries or longer to adjust to changes in forcing. Climate commitment studies indicatethat even if greenhouse gases were stabilized at 2000 levels, a further warming of about 0.5 °C(0.9 °F) would still occur .[53]
Initial causes of temperature changes (external forcings)Main article: Attribution of recent climate change
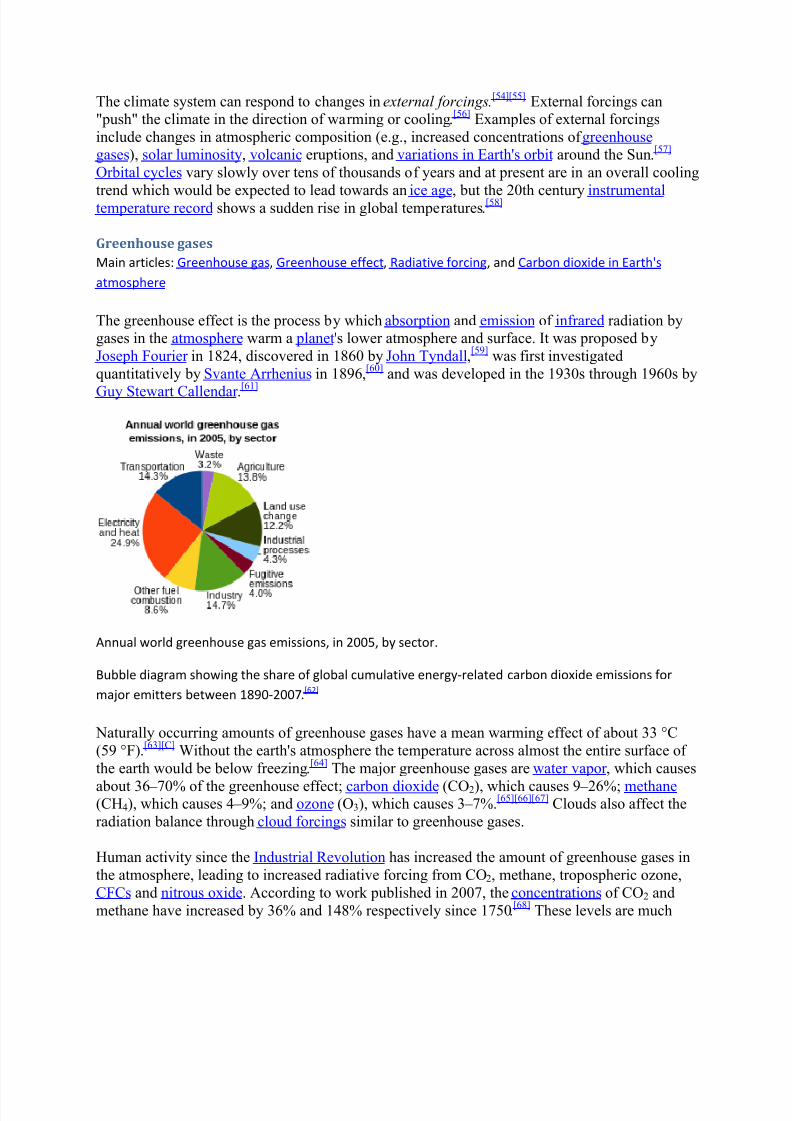
Greenhouse effect schematic showing energy flows between space, the atmosphere, and earth'ssurface. Energy exchanges are expressed in watts per square meter (W/m 2).
7/27/2019 PRtrytrghj
http://slidepdf.com/reader/full/prtrytrghj 5/11
The climate system can respond to changes in external forcings .[54][55] External forcings can"push" the climate in the direction of warming or cooling .[56] Examples of external forcingsinclude changes in atmospheric composition (e.g., increased concentrations of greenhousegases ), solar luminosity , volcanic eruptions, and variations in Earth's orbit around the Sun .[57] Orbital cycles vary slowly over tens of thousands of years and at present are in an overall cooling
trend which would be expected to lead towards an ice age , but the 20th century instrumentaltemperature record shows a sudden rise in global temperatures .[58]
Greenhouse gasesMain articles: Greenhouse gas , Greenhouse effect , Radiative forcing , and Carbon dioxide in Earth'satmosphere
The greenhouse effect is the process by which absorption and emission of infrared radiation bygases in the atmosphere warm a planet 's lower atmosphere and surface. It was proposed byJoseph Fourier in 1824, discovered in 1860 by John Tyndall ,[59] was first investigatedquantitatively by Svante Arrhenius in 1896 ,[60] and was developed in the 1930s through 1960s by
Guy Stewart Callendar .[61]
Annual world greenhouse gas emissions, in 2005, by sector.
Bubble diagram showing the share of global cumulative energy-related carbon dioxide emissions formajor emitters between 1890-2007 .[62]
Naturally occurring amounts of greenhouse gases have a mean warming effect of about 33 °C(59 °F) .[63][C] Without the earth's atmosphere the temperature across almost the entire surface of the earth would be below freezing .[64] The major greenhouse gases are water vapor , which causes
about 36 – 70% of the greenhouse effect; carbon dioxide (CO 2), which causes 9 – 26%; methane (CH 4), which causes 4 – 9%; and ozone (O3), which causes 3 – 7%.[65][66 ][67] Clouds also affect theradiation balance through cloud forcings similar to greenhouse gases.
Human activity since the Industrial Revolution has increased the amount of greenhouse gases inthe atmosphere, leading to increased radiative forcing from CO 2, methane, tropospheric ozone,CFCs and nitrous oxide . According to work published in 2007, the concentrations of CO 2 andmethane have increased by 36% and 148% respectively since 1750 .[68] These levels are much
7/27/2019 PRtrytrghj
http://slidepdf.com/reader/full/prtrytrghj 6/11
higher than at any time during the last 800,000 years, the period for which reliable data has beenextracted from ice cores .[69][70 ][71][72] Less direct geological evidence indicates that CO 2 valueshigher than this were last seen about 20 million years ago .[73] Fossil fuel burning has producedabout three-quarters of the increase in CO 2 from human activity over the past 20 years. The restof this increase is caused mostly by changes in land-use, particularly deforestation .[74] Estimates
of global CO 2 emissions in 2011 from fossil fuel combustion, including cement production andgas flaring, was 34.8 billion tonnes (9.5 ± 0.5 PgC), an increase of 54% above emissions in 1990.Coal burning was responsible for 43% of the total emissions, oil 34%, gas 18%, cement 4.9%and gas flaring 0.7% [75] In May 2013, it was reported that readings for CO 2 taken at the world's
primary benchmark site in Mauna Loa surpassed 400 ppm . According to professor BrianHoskins , this is likely the first time CO 2 levels have been this high for about 4.5 millionyears .[76][77]
Emissions scenarios , estimates of changes in future emission levels of greenhouse gases, have been projected that depend upon uncertain economic, sociological , technological , and naturaldevelopments .[83] In most scenarios, emissions continue to rise over the century, while in a few,
emissions are reduced .[84][85]
Fossil fuel reserves are abundant, and will not limit carbonemissions in the 21st century .[86] Emission scenarios, combined with modelling of the carboncycle , have been used to produce estimates of how atmospheric concentrations of greenhousegases might change in the future. Using the six IPCC SRES "marker" scenarios, models suggestthat by the year 2100, the atmospheric concentration of CO 2 could range between 541 and 970
ppm .[87] This is an increase of 90 – 250% above the concentration in the year 1750.
The popular media and the public often confuse global warming with ozone depletion , i.e., thedestruction of stratospheric ozone by chlorofluorocarbons .[88][89] Although there are a few areasof linkage , the relationship between the two is not strong. Reduced stratospheric ozone has had aslight cooling influence on surface temperatures, while increased tropospheric ozone has had asomewhat larger warming effect .[90]
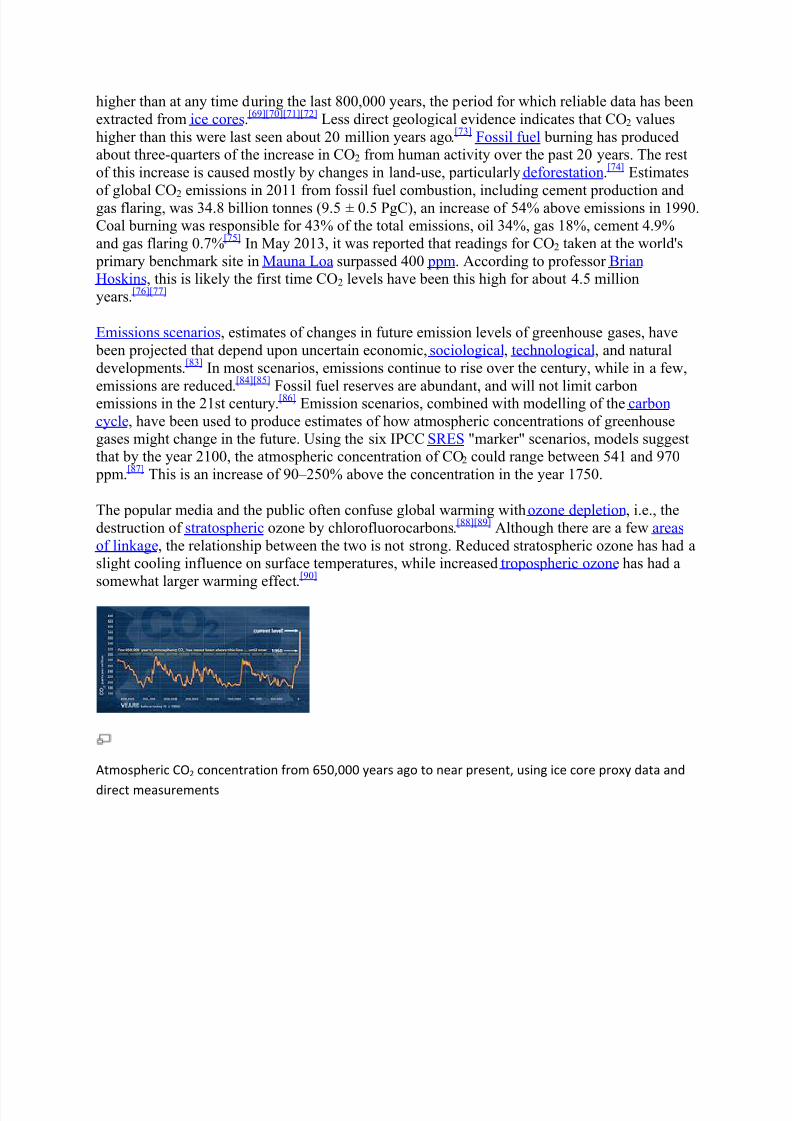
Atmospheric CO 2 concentration from 650,000 years ago to near present, using ice core proxy data and
direct measurements
7/27/2019 PRtrytrghj
http://slidepdf.com/reader/full/prtrytrghj 7/11
Particulates and soot
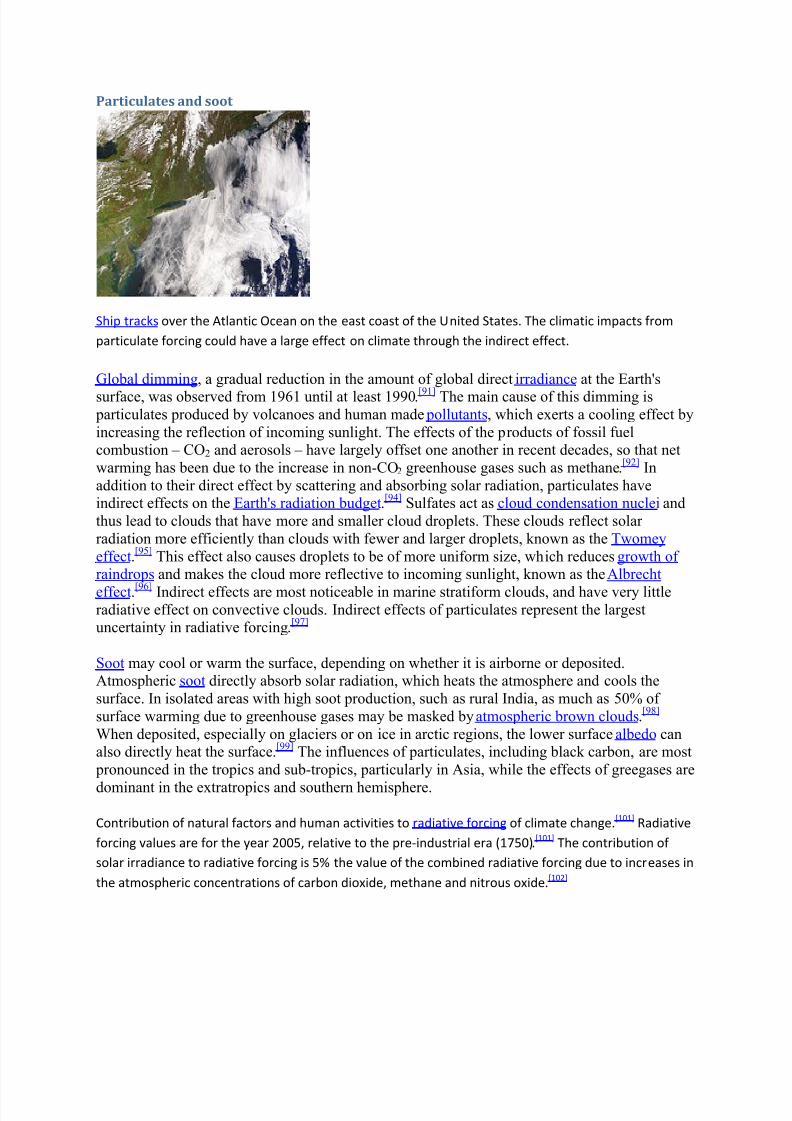
Ship tracks over the Atlantic Ocean on the east coast of the United States. The climatic impacts fromparticulate forcing could have a large effect on climate through the indirect effect.
Global dimming , a gradual reduction in the amount of global direct irradiance at the Earth'ssurface, was observed from 1961 until at least 1990 .[91] The main cause of this dimming is
particulates produced by volcanoes and human made pollutants , which exerts a cooling effect byincreasing the reflection of incoming sunlight. The effects of the products of fossil fuelcombustion – CO 2 and aerosols – have largely offset one another in recent decades, so that netwarming has been due to the increase in non-CO 2 greenhouse gases such as methane .[92] Inaddition to their direct effect by scattering and absorbing solar radiation, particulates haveindirect effects on the Earth's radiation budget .[94] Sulfates act as cloud condensation nuclei andthus lead to clouds that have more and smaller cloud droplets. These clouds reflect solar radiation more efficiently than clouds with fewer and larger droplets, known as the Twomeyeffect .[95] This effect also causes droplets to be of more uniform size, which reduces growth of raindrops and makes the cloud more reflective to incoming sunlight, known as the Albrechteffect .[96] Indirect effects are most noticeable in marine stratiform clouds, and have very littleradiative effect on convective clouds. Indirect effects of particulates represent the largestuncertainty in radiative forcing .[97]
Soot may cool or warm the surface, depending on whether it is airborne or deposited.Atmospheric soot directly absorb solar radiation, which heats the atmosphere and cools thesurface. In isolated areas with high soot production, such as rural India, as much as 50% of surface warming due to greenhouse gases may be masked by atmospheric brown clouds .[98] When deposited, especially on glaciers or on ice in arctic regions, the lower surface albedo canalso directly heat the surface .[99] The influences of particulates, including black carbon, are most
pronounced in the tropics and sub-tropics, particularly in Asia, while the effects of greegases aredominant in the extratropics and southern hemisphere.
Contribution of natural factors and human activities to radiative forcing of climate change .[101] Radiativeforcing values are for the year 2005, relative to the pre-industrial era (1750) .[101] The contribution of solar irradiance to radiative forcing is 5% the value of the combined radiative forcing due to increases inthe atmospheric concentrations of carbon dioxide, methane and nitrous oxide .[102]

7/27/2019 PRtrytrghj
http://slidepdf.com/reader/full/prtrytrghj 8/11
Solar activityMain articles: Solar variation and Solar wind
Since 1978, output from the Sun has been precisely measured by satellites .[103] Thesemeasurements indicate that the Sun's output has not increased since 1978, so the warming during
the past 30 years cannot be attributed to an increase in solar energy reaching the Earth. In thethree decades since 1978, the combination of solar and volcanic activity probably had a slightcooling influence on the climate .[104]
Climate models have been used to examine the role of the sun in recent climate change .[105] Models are unable to reproduce the rapid warming observed in recent decades when they onlytake into account variations in solar output and volcanic activity. Models are, however, able tosimulate the observed 20th century changes in temperature when they include all of the mostimportant external forcings, including human influences and natural forcings.
Feedback Sea ice, shown here in Nunavut , in northern Canada, reflects more sunshine, while open ocean absorbsmore, accelerating melting.
The climate system includes a range of feedbacks which alter the response of the system tochanges in external forcings. Positive feedbacks increase the response of the climate system to aninitial forcing, while negative feedbacks reduce the response of the climate system to an initialforcing .[110]
There are a range of feedbacks in the climate system, including water vapor , changes in ice-albedo (snow and ice cover affect how much the Earth's surface absorbs or reflects incomingsunlight), clouds , and changes in the Earth's carbon cycle (e.g., the release of carbon fromsoil ).[111] The main negative feedback is the energy which the Earth's surface radiates into spaceas infrared radiation .[112] According to the Stefan-Boltzmann law , if temperature doubles,radiated energy increases by a factor of 16 (2 to the 4th power) .[113]
Feedbacks are an important factor in determining the sensitivity of the climate system toincreased atmospheric greenhouse gas concentrations. Other factors being equal, a higher climate
sensitivity means that more warming will occur for a given increase in greenhouse gasforcing .[114] Uncertainty over the effect of feedbacks is a major reason why different climatemodels project different magnitudes of warming for a given forcing scenario. More research isneeded to understand the role of cloud s[110] and carbon cycle feedbacks in climate
projections .[115]
The IPCC projections given in the lede span the "likely" range (greater than 66% probability, based on expert judgement )[5] for the selected emissions scenarios. However, the IPCC's projections do not reflect the full range of uncertainty .[116] The lower end of the "likely" rangeappears to be better constrained than the upper end of the "likely" range .[116]
7/27/2019 PRtrytrghj
http://slidepdf.com/reader/full/prtrytrghj 9/11
Climate modelsMain article: Global climate model
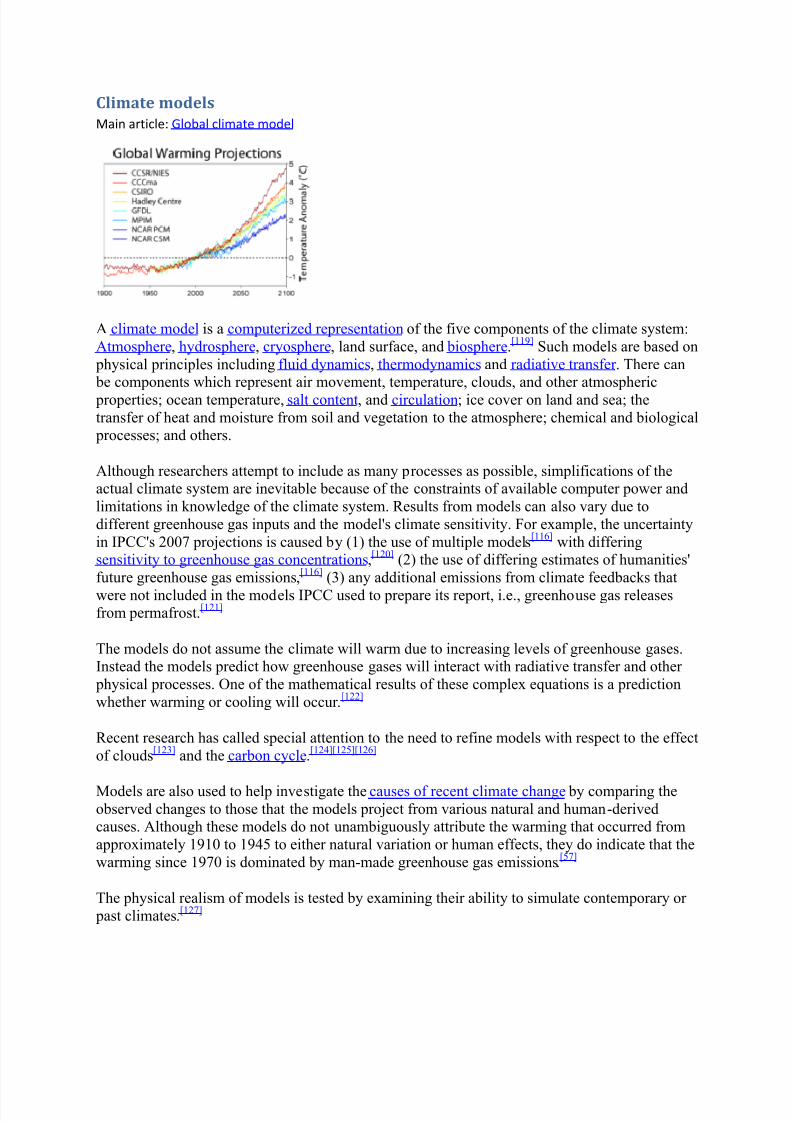
A climate model is a computerized representation of the five components of the climate system:Atmosphere , hydrosphere , cryosphere , land surface, and biosphere .[119] Such models are based on
physical principles including fluid dynamics , thermodynamics and radiative transfer . There can be components which represent air movement, temperature, clouds, and other atmospheric properties; ocean temperature, salt content , and circulation ; ice cover on land and sea; thetransfer of heat and moisture from soil and vegetation to the atmosphere; chemical and biological
processes; and others.
Although researchers attempt to include as many processes as possible, simplifications of theactual climate system are inevitable because of the constraints of available computer power andlimitations in knowledge of the climate system. Results from models can also vary due todifferent greenhouse gas inputs and the model's climate sensitivity. For example, the uncertaintyin IPCC's 2007 projections is caused by (1) the use of multiple model s[116] with differingsensitivity to greenhouse gas concentrations ,[120] (2) the use of differing estimates of humanities'future greenhouse gas emissions ,[116] (3) any additional emissions from climate feedbacks thatwere not included in the models IPCC used to prepare its report, i.e., greenhouse gas releasesfrom permafrost .[121]
The models do not assume the climate will warm due to increasing levels of greenhouse gases.Instead the models predict how greenhouse gases will interact with radiative transfer and other
physical processes. One of the mathematical results of these complex equations is a predictionwhether warming or cooling will occur .[122]
Recent research has called special attention to the need to refine models with respect to the effectof clouds [123] and the carbon cycle .[124][125 ][126]
Models are also used to help investigate the causes of recent climate change by comparing theobserved changes to those that the models project from various natural and human-derivedcauses. Although these models do not unambiguously attribute the warming that occurred fromapproximately 1910 to 1945 to either natural variation or human effects, they do indicate that thewarming since 1970 is dominated by man-made greenhouse gas emissions .[57]
The physical realism of models is tested by examining their ability to simulate contemporary or past climates .[127]
7/27/2019 PRtrytrghj
http://slidepdf.com/reader/full/prtrytrghj 10/11
Climate models produce a good match to observations of global temperature changes over thelast century, but do not simulate all aspects of climate .[128] Not all effects of global warming areaccurately predicted by the climate models used by the IPCC . Observed Arctic shrinkage has
been faster than that predicted .[129] Precipitation increased proportional to atmospheric humidity,and hence significantly faster than global climate models predict .[130][131]
Observed and expected environmental effectsMain article: Effects of global warming
Sparse records indicate that glaciers have been retreating since the early 1800s. In the 1950smeasurements began that allow the monitoring of glacial mass balance, reported to the World GlacierMonitoring Service (WGMS) and the National Snow and Ice Data Center (NSIDC)
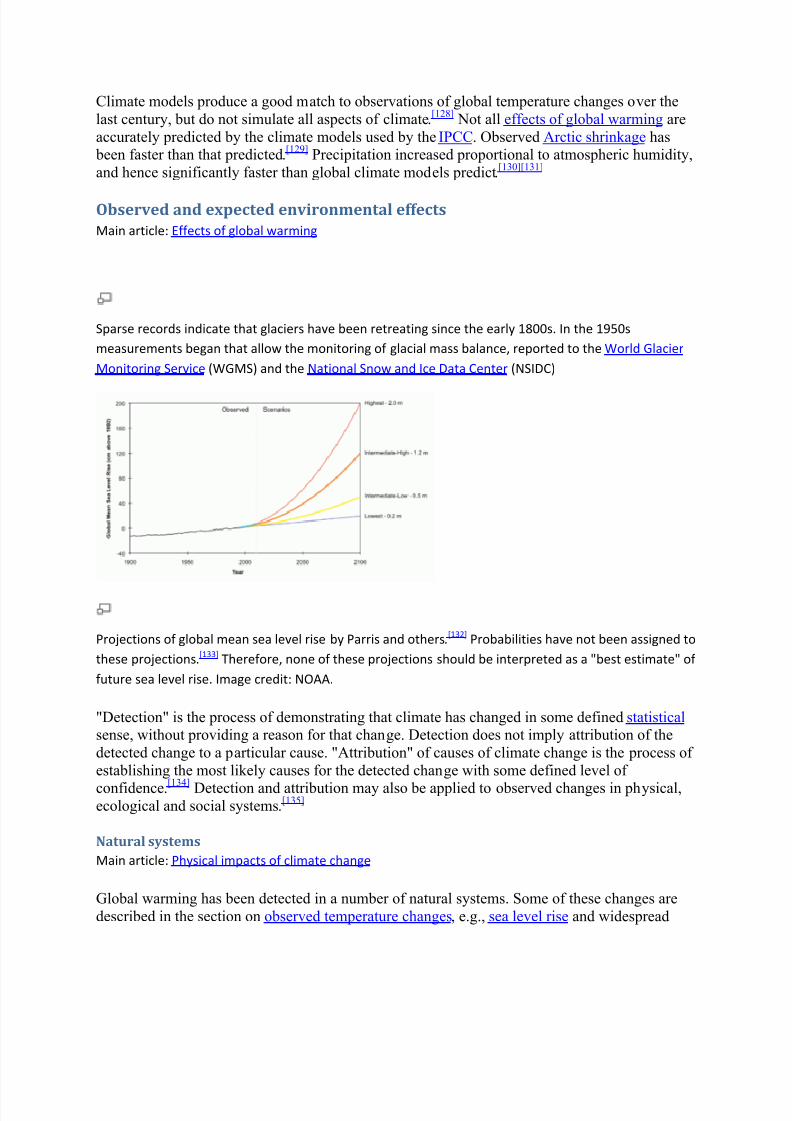
Projections of global mean sea level rise by Parris and others .[132] Probabilities have not been assigned tothese projections .[133] Therefore, none of these projections should be interpreted as a "best estimate" of future sea level rise. Image credit: NOAA.
"Detection" is the process of demonstrating that climate has changed in some defined statistical sense, without providing a reason for that change. Detection does not imply attribution of thedetected change to a particular cause. "Attribution" of causes of climate change is the process of establishing the most likely causes for the detected change with some defined level of confidence .[134] Detection and attribution may also be applied to observed changes in physical,ecological and social systems .[135]
Natural systemsMain article: Physical impacts of climate change
Global warming has been detected in a number of natural systems. Some of these changes aredescribed in the section on observed temperature changes , e.g., sea level rise and widespread
7/27/2019 PRtrytrghj
http://slidepdf.com/reader/full/prtrytrghj 11/11
decreases in snow and ice extent .[136] Anthropogenic forcing has likely contributed to some of theobserved changes, including sea level rise, changes in climate extremes (such as the number of warm and cold days), declines in Arctic sea ice extent, and to glacier retreat .[137]
Over the 21st century ,[138] the IPCC projects that global mean sea level could rise by 0.18-
0.59 m .[139]
The IPCC do not provide a best estimate of global mean sea level rise, and their upper estimate of 59 cm is not an upper-bound, i.e., global mean sea level could rise by morethan 59 cm by 2100 .[139] The IPCC's projections are conservative, and may underestimate futuresea level rise .[140] Over the 21st century, Parris and other s[132] suggest that global mean sea levelcould rise by 0.2 to 2.0 m (0.7-6.6 ft), relative to mean sea level in 1992.
Ecological systemsMain article: Climate change and ecosystems
In terrestrial ecosystems , the earlier timing of spring events, and poleward and upward shifts in plant and animal ranges, have been linked with high confidence to recent warming .[136] Future
climate change is expected to particularly affect certain ecosystems, including tundra , mangroves , and coral reefs .[142] It is expected that most ecosystems will be affected by higher atmospheric CO 2 levels, combined with higher global temperatures .[150] Overall, it is expectedthat climate change will result in the extinction of many species and reduced diversity of ecosystems .[151]
Increases in atmospheric CO 2 concentrations have lead to an increase in ocean acidity .[152] Dissolved CO 2 increases ocean acidity, which is measured by lower pH values .[152] Between1750 to 2000, surface-ocean pH has decreased by ~0.1, from ~8.2 to ~8.1 .[153] Surface-ocean pHhas probably not been below ~8.1 during the past 2 million years .[153] Projections suggest thatsurface-ocean pH could decrease by an additional 0.3-0.4 units by 2100 .[154] Future ocean
acidification could threaten coral reefs , fisheries , protected species , and other natural resources of value to society .[155][152]
Large-scale and abrupt impacts
Climate change could result in global, large-scale changes in natural and social systems .[156] Twoexamples are ocean acidification caused by increased atmospheric concentrations of carbondioxide, and the long-term melting of ice sheets , which contributes to sea level rise .[157]
Some large-scale changes could occur abruptly , i.e., over a short time period, and might alsobe irreversible . An example of abrupt climate change is the rapid release of methane from
permafrost , which would lead to amplified global warming .[158] Scientific understanding of abrupt climate change is generally poor .[159] However, the probability of abrupt changesappears to be very low .[158][160] Factors that may increase the probability of abrupt climatechange include higher magnitudes of global warming, warming that occurs more rapidly,and warming that is sustained over longer time pPublic opinionMain article: Public opinion on climate change


