prr.hec.gov.pkprr.hec.gov.pk › jspui › ... › Gugan_Jabeen...15.02.2018.pdf · iii...
213
Bio-Electrochemical Studies for Harvesting Carbon Dioxide to Organic Compounds By Gugan Jabeen CIIT/FA11-PCHEM-001/LHR PhD Thesis In Chemical Engineering COMSATS Institute of Information Technology Lahore Pakistan Fall, 2016
Transcript of prr.hec.gov.pkprr.hec.gov.pk › jspui › ... › Gugan_Jabeen...15.02.2018.pdf · iii...

Bio-Electrochemical Studies for Harvesting Carbon
Dioxide to Organic Compounds
By
Gugan Jabeen
CIIT/FA11-PCHEM-001/LHR
PhD Thesis
In
Chemical Engineering
COMSATS Institute of Information Technology
Lahore Pakistan
Fall, 2016

ii
COMSATS Institute of Information Technology
Bio-Electrochemical Studies for Harvesting Carbon
Dioxide to Organic Compounds
A Thesis Presented to
COMSATS Institute of Information Technology, Lahore
In partial fulfillment
of the requirement for the degree of
PhD (Chemical Engineering) By
Gugan Jabeen
CIIT/FA11-PCHEM-001/LHR
Fall, 2016
iii
Bio-Electrochemical Studies for Harvesting Carbon
Dioxide to Organic Compounds
A Post Graduate Thesis submitted to the Department of Chemical Engineering as
partial fulfillment of the requirement for the award of Degree of Ph.D in Chemical
Engineering.
Name Registration Number
Gugan Jabeen CIIT/FA11-PCHEM-001/LHR
Supervisor
Dr. Robina Farooq
Professor Department of Chemical Engineering
COMSATS Institute of Information Technology (CIIT)
Lahore Campus
iv
Certificate of Approval
This is to certify that the research work presented in this thesis, entitled “Bio
Electrochemical Studies for Harvesting Carbon Dioxide to Organic Compounds” was
conducted by Ms. Gugan Jabeen, CIIT/FA11-PCHEM-001/LHR, under the supervision of
Dr. Robina Farooq. No part of this thesis has been submitted anywhere else for any other
degree. This thesis is submitted to the department of Chemical Engineering, COMSATS
Institute of Information Technology Lahore, in the partial fulfillment of the requirement
for the degree of Doctor of Philosophy in the field of Chemical Engineering.

v
Author’s Declaration
I Gugan Jabeen CIIT/FA11-PCHEM-001/LHR hereby state that my PhD thesis titled “Bio-
Electrochemical Studies for Harvesting Carbon Dioxide to Organic Compounds” is my
own work and has not been submitted previously by me for taking any degree from this
University i.e. COMSATS Institute of Information Technology or anywhere else in the
country world.
At any time if my statement is found to be incorrect even after I graduate the University
has the right to withdraw my PhD Degree.
vi
Plagiarism Undertaking
I solemnly declare that the research work presented in the thesis titled “Bio-
Electrochemical Studies for Harvesting Carbon Dioxide to Organic Compounds” is solely
my research work with no significant contribution from any other person. Small
contribution help wherever taken has been duly acknowledged and that complete thesis has
been written by me.
I understand the zero tolerance policy of HEC and COMSATS Institute of Information
Technology towards plagiarism. Therefore, I as an author of the above titled thesis declare
that no portion of my thesis has been plagiarized and any material used as reference is
referred/cited.
I undertake if I am found guilty of any formal plagiarism in the above titled thesis even
after award of PhD Degree, the University reserves the right to withdraw/revoke my PhD
degree and that HEC and the University has the right to publish my name on
HEC/university website on which names of students are placed who submitted plagiarized
thesis.

vii
Certificate
It is certified that Gugan Jabeen CIIT/FA11-PCHEM-001/LHR has carried out all the work
related to this thesis under my supervision at the Department of Chemical Engineering
COMSATS Institute of Information Technology, Lahore and the work fulfills the
requirement for award of PhD degree.
.

viii
DEDICATION
I dedicate my dissertation to my elder sister Dr. Irfana Sheikh who has never left my side.
I also dedicate this dissertation to my elder brother M. Azam Sheikh who has supported
me throughout the PhD process.

ix
ACKNOWLEDGEMENTS
All praise for ALMIGHTY ALLAH Who is The Lord of the universe and very merciful.
Who guides us from darkness to light.
All and every respect is for Holy Prophet Muhammad (PBUH) enabled us to recognize our
Creator.
It has been a great experience and honor to have carried out this project at The University
of COMSATS Institute of Information Technology Lahore.
I would like to express my deep and sincere gratitude to my Research Supervisor, Prof. Dr.
Robina Farooq for her keen interest, expertise, skilled advices and for all her inspirational
mentorship in accomplishing this work.
I am thankful to Prof. Dr. Asad Ullah Khan Head of Chemical Engineering Department for
his kind and sympathetic behavior and providing me all the facilities to complete this
research work.
I offer my special thanks to Dr. Mazhar Gillani and Fawad Ashraf for his cooperation in
the Analytical lab for the use of equipment.
My special thanks to IRCBM department for their assistance in SEM and FT-IR analysis.
I extend my thanks to Lab Assistant Asif Rana who arranged and provided all necessary
chemicals and equipment for the completion of my research work.
My family deserves equal accolade. Their unwavering encouragement and reassurance that
they provided me has been integral in my completion of this degree.
Gugan Jabeen
CIIT/FA11-PCHEM-001/LHR

x
Abstract
Bio-Electrochemical Studies for Harvesting Carbon Dioxide to
Organic Compounds
Powering microbes with electricity in bio-electrochemical synthesis (BES) to produce
plethora of organics like volatile fatty acids and alcohols is an attractive bio sustainable
strategy to minimize our dependence on fossil fuels. Bio-electrochemical synthesis, a
beneficial key technique in which electro autotrophic bacteria utilize electric current as a
sole electron source from cathode to reduce CO2 to extracellular multicarbon exquisite
products through metabolic conversion. The anaerobic and autotrophic acetogens like
Sporomusa ovata, Clostridium ljungdahlii and Cupriavidus necator have been focused in
current study to convert waste greenhouse gas like CO2 into volatile fatty acids, alcohols
and Polyhydroxyalkanoates (PHA). These electroactive catalysts were able to capture
electron directly from cathode without any mediator due to the presence of C-type
cytochrome and type IV pili in Sporomusa ovata, RnF complexes for electron and proton
translocation in Clostridium ljungdahlii and Fln type adhesion on the surface of
Cupriavidus necator. The bio-electrochemical reactor was simplified to avoid time
expenditure by eliminating potentiostat and by improving start-up process of autotrophic
biocathode. The two stage strategy was integrated in this system based on heterotrophic
pre-enrichment of electro autotrophic biocatalysts on glucose or fructose, afterwards
acclimation of pre-enriched culture to BES reactor where CO2 was sole carbon source to
switch bacteria from heterotrophic to autotrophic metabolism. The biocathode was poised
at -0.4V, (versus Ag/AgCl electrode) high enough to avoid hydrogen production by DC
power source other than potentiostat to retain the high coulombic recovery in electro fuel
production. The development of pure microbial biofilm at cathode rather than mixed
culture further simplified the BES reactor from complex metabolic activities. The BES
technique was practiced first time to synthesize high quality Polyhydroxyalkanoates (while
fermentation process was followed before) merely from cheap and low cost substrates like
molasses and waste greenhouse gas CO2. Implementation of simplified reactor and specific
strategy for both batch and continuous system under ambient conditions of pH, temperature
and pressure enhanced the electroactivity of cells to transform the electrons to spectrum of

xi
extracellular products in less time duration. The net outcome was the renewable energy
which was stored in covalent bonds synthesized from waste greenhouse gas. The specific
products included acetate, butyrate, ethanol, hexanoic acid, hexanol, heptanoic acid and
heptanol by Clostridium ljungdahlii and Sporomusa ovata. The formation of heptanoic acid
and heptanol in this specific technique never reported earlier. This feature has potential to
make these electrotrophs beneficial for biotech industry. The intracellular
Polyhydroxyalkanoates accumulated as granules inside the cells are environment friendly
thermoplastics. The novel extraction techniques for the recovery of granules of carbon and
energy reserves from cell dry mass has made PHA more attractive. Gas chromatography
and mass spectrometry (GC-MS) analysis employed for identification and quantification
of electro fuels and further electroactivity was characterized by cyclic voltammetry. The
ANOVA test performed for statistical analysis between the batch and continuous system
for all three strains. ANOVA test for Sporomusa ovata proved the significant difference
between batch and continuous system rather than other two strains. The overall coulombic
recovery was more than 90% due to the redox electroactivity of these autotrophs. The
concentrations for ethanoic acid, ethanol, ethyl butyrate, hexanoic acid, heptanoic acid,
hexanol and heptanol were 2.99, 3.19, 2.2, 2.18, 2.01, 2.11 and 0.85mM at 120 hours of
medium cultivation. The Coulombic recovery was more than 80% proved the BES a
promising and remarkable technology than other chemical and photosynthetic based
chemical production.

xii
TABLE OF CONTENTS
1 Introduction ............................................................................................. 2
1.1 Significance of study ....................................................................... 7
1.2 Objectives of the study .................................................................... 7
2 Literature Review .................................................................................... 9
2.1 Autotrophic bacteria ........................................................................ 9
2.2 Microorganisms for Biosynthesis of Organic Compounds ........... 11
2.3 Substrates for Biosynthesis ............................................................ 14
2.4 Anaerobic digestion for biosynthesis............................................. 18
2.5 Anaerobic bio-reactors ................................................................... 20
2.6 Metabolic engineering to enhance product yield ........................... 21
2.7 Synthesis of organics by greenhouse gases ................................... 24
2.8 Role of Metabolic Pathways in biochemical synthesis ................. 26
2.9 Bio-electrochemical synthesis ....................................................... 28
2.10 Extracellular electron transfer (EET) ............................................. 31
2.10.1 Electron transport by fermentation products ...................................... 31
2.10.2 Electron transport by mediator ........................................................... 32
2.10.3 Direct transfer of electron .................................................................. 34
2.11 Electron transfer from electrode to microorganisms ..................... 36
3 Materials and methods ..........................................................................42
3.1 Experimental Setup ........................................................................ 42
3.1.1 Chemicals and Reagents .................................................................... 42
3.1.2 Chemicals for vitamin solution .......................................................... 42
3.1.3 Trace element solution ....................................................................... 42
xiii
3.1.4 Standards ............................................................................................ 43
3.1.5 Gasses ................................................................................................. 43
3.2 Equipment and Instruments ........................................................... 43
3.3 Bio-electrochemical reactor configuration .................................... 45
3.3.1 General setup ...................................................................................... 45
3.3.2 Electrodes ........................................................................................... 46
3.3.3 Proton exchange membrane ............................................................... 46
3.4 Coulombic Recovery ..................................................................... 48
3.5 ANOVA Test ................................................................................. 49
3.6 Cupriavidus necator ...................................................................... 50
3.6.1 Media composition ............................................................................. 50
3.6.2 Stock Solution for Trace Element ...................................................... 50
3.6.3 Carbon sources ................................................................................... 51
3.6.4 Culture growth conditions with CO2 and H2 ...................................... 51
3.6.5 Medium preparation with Molasses ................................................... 51
3.7 Reactor operation ........................................................................... 52
3.8 Cathode biofilm development ........................................................ 52
3.9 Experimental conditions of batch system for Cupriavidus necator
………………………………………………………………….54
3.10 Control cell for Cupriavidus necator ............................................. 55
3.11 Experimental conditions of continuous system for Cupriavidus
necator …………………………………………………………………..55
3.12 Cyclic voltammetry for Cupriavidus necator ................................ 56
3.13 FT-IR analysis ................................................................................ 56
3.14 Analytical Method ......................................................................... 56
3.14.1 The Biopolymer Extraction for GC-MS Analysis ............................. 56
3.15 The Biopolymer Analysis .............................................................. 57
3.15.1 SPME Procedure for Sample Preparation .......................................... 57
3.15.2 GC-MS procedure .............................................................................. 58

xiv
3.15.3 Extraction of dry PHA ....................................................................... 58
3.15.4 Calibration curve for extracted PHA ................................................. 59
3.16 Sporomusa ovata ............................................................................ 61
3.16.1 Media and cultivation method ............................................................ 61
3.16.2 Vitamin solution (medium 141) ......................................................... 61
3.17 Trace element solution SL-10 (medium 320) ................................ 61
3.18 Stock solutions preparation ............................................................ 62
3.18.1 NaHSeO3.10-7 M solution ................................................................... 62
3.18.2 Resazurin solution 500mg/1000ml .................................................... 62
3.18.3 NaHCO3 solution ................................................................................ 62
3.18.4 Lysozyme solution ............................................................................. 62
3.18.5 Phosphate buffer solution ................................................................... 63
3.18.6 Method for preparation of anaerobic medium ................................... 63
3.18.7 Medium preparation with CO2 and H2 for Sporomusa ovata ............. 64
3.18.8 Cathode biofilm development ............................................................ 64
3.18.9 Experimental conditions of batch system for Sporomusa ovata ........ 64
3.18.10 Continuous system for Sporomusa ovata........................................... 65
3.18.11 Control cell without electroactive catalysts ....................................... 65
3.18.12 Cyclic Voltammetry (CV) for Sporomusa ovata ............................... 65
3.18.13 Control Cell without electroactive catalysts ...................................... 66
3.18.14 Analytical Method for Sporomusa ovata ........................................... 66
3.18.15 Preparation of samples for GC-MS analysis ...................................... 66
3.18.16 SPME Procedure ................................................................................ 66
3.19 Calibration for volatile acids and alcohols .................................... 67
3.19.1 Calibration for volatile fatty acids ..................................................... 68
3.19.2 Calibration for volatile alcohols ......................................................... 69
3.20 Clostridium ljungdahlii .................................................................. 70
3.21 Medium and cultivation method for Clostridium ljungdahlii ....... 70
3.21.1 Vitamin solution (medium 141) ......................................................... 70

xv
3.21.2 NaHCO3 solution per 10.0ml ............................................................. 70
3.21.3 Fructose solution per 50ml. ................................................................ 71
3.21.4 Na2S.9H2O solution per 10.0ml. ........................................................ 71
3.21.5 Trace Element Solution per liter ........................................................ 71
3.22 Method for Preparation of anaerobic medium for C. ljungdahlii .. 71
3.22.1 Medium preparation with CO2 and H2 for Clostridium ljungdahlii ... 72
3.23 Cathode biofilm development ........................................................ 73
3.24 Experimental conditions for batch system for Clostridium
ljungdahlii ...................................................................................................73
3.25 Continuous system for Clostridium ljungdahlii ............................ 74
3.25.1 Control cell without electroactive catalysts ....................................... 74
3.26 Cyclic Voltammetry (CV) for Clostridium ljungdahlii ................. 74
3.26.1 Cyclic voltammetry of Control Cell without electroactive catalysts . 75
3.27 Analytical Method for volatile fatty acids and alcohols ................ 75
4 Results and discussion ...........................................................................77
4.1 Cupriavidus necator ...................................................................... 77
4.2 Gas Chromatography Mass Spectrometry analysis ....................... 79
4.3 Bio-electrochemical synthesis of PHA during batch system ........ 80
4.4 Bio-electrochemical synthesis of PHA during continuous system 81
4.4.1 Decrease in Acetic acid concentration during batch and continuous
system ………………………………………………………………………82
4.5 Coulombic Recovery ..................................................................... 85
4.6 Electrons recovery against the current consumption ..................... 86
4.6.1 Electron recovery during batch system .............................................. 86
4.6.2 Percent cathode recovery during batch system .................................. 87
4.6.3 Electron recovery during continuous system ..................................... 87
4.6.4 Percent cathode recovery during continuous system ......................... 88
4.7 Gas Chromatograms and Mass Spectrums for Cupriavidus necator
………………………………………………………………….. 89

xvi
4.8 Characterization of PHA in the presence of nitrogen supply ........ 91
4.9 Cyclic voltammetry results for Cupriavidus necator .................... 92
4.9.1 Cyclic Voltammetry analysis for Control Cell without electroactive
catalysts ............................................................................................................ 93
4.10 FT-IR Analysis .............................................................................. 94
4.11 Sporomusa ovata ............................................................................ 97
4.12 Characterization of Bio electrochemically synthesized organic
compounds ..................................................................................................98
4.13 Characterization of organic products synthesized by Sporomusa
ovata …………………………………………………………………..99
4.14 Characterization of organic compounds in Control cell .............. 100
4.14.1 Bio-electrochemical synthesis of organic acids during Batch system
……………………………………………………………………..101
4.14.2 Bio-electrochemical synthesis of alcohols during batch system...... 103
4.14.3 Bio-electrochemical synthesis of organic acids during continuous
system ……………………………………………………………………..104
4.14.4 Bio-electrochemical synthesis of alcohols during continuous system
……………………………………………………………………..105
4.15 Cyclic voltammetry (CV) analysis of biofilm ............................. 109
4.15.1 Cyclic voltammetry analysis for Control cell without electroactive
catalysts .......................................................................................................... 110
4.16 Electrons recovery against the current consumption ................... 111
4.16.1 Electron recovery during batch system ............................................ 112
4.16.2 Percent cathode recovery during batch system ................................ 113
4.16.3 Electron recovery during continuous system ................................... 114
4.16.4 Percent cathode Recovery during continuous system ..................... 115
4.17 Clostridium ljungdahlii ................................................................ 118
4.18 Characterization of Bio-electrochemically synthesized organic
compounds ................................................................................................ 119

xvii
4.19 Gas Chromatogram and Mass Spectrum for Clostridium ljungdahlii
………………………………………………………………….120
4.20 GC-MS Results for control cell without electro-autotrophs ........ 122
4.21 Bio-electrochemical synthesis of organic acids during batch system
………………………………………………………………….122
4.22 Bio-electrochemical synthesis of alcohols during batch system . 124
4.23 Bio-electrochemical synthesis of organic acids in continuous system
………………………………………………………………….124
4.24 Bio-electrochemical synthesis of Alcohols during continuous
system ………………………………………………………………….126
4.25 Cyclic voltammetry ...................................................................... 129
4.26 Electron recovery against the current consumption .................... 132
4.26.1 Electron recovery during batch system ............................................ 133
4.26.2 Percent cathode recovery during batch system ................................ 134
4.26.3 Electron recovery during continuous system ................................... 134
4.26.4 Percent cathode recovery in continuous system .............................. 136
4.27 Conclusions .................................................................................. 139
4.28 Highlights ..................................................................................... 143
4.29 Future perspective and challenges ............................................... 144
5 References .........................................................................................146
6 List of Publications ..............................................................................162
7 Appendix I ............................................................................................163

xviii
LIST OF FIGURES
Figure 2.1 Acetyl Co-A pathway for Polyhydroxyalkanoates by Cupriavidus necator ..11
Figure 2.2 Role of CO in the formation of acetyl-CoA ...................................................28
Figure 2.3 Electron transfer mechanism by Cytochrome and mediator where Cytochrome
directly transfer electron from cathode to cells and mediators in oxidized form
capture electrons from cathode and transfer to cells ......................................34
Figure 2.4 4 Mtr respiratory pathway and schematic electron flow from inner membrane
proteins CymA to outer membrane proteins OmcA and MtrC and then to
electrode ……………………………………………………………………36
Figure 2.5 Transfer of electron from cathode to electroactive cells for fumarate, nitrate
and carbon dioxide reduction to succinate, nitrite and acetate respectively ..37
Figure 2.6 Bio-electrochemical cell with bio-cathode and power supply for the synthesis
of bio-fuels .....................................................................................................39
Figure 3.1 Bio-electrochemical reactor......................................................................47
Figure 3.2 Relationship between cell dry weight concentration and absorbance at 620nm
…………………………………………………………………………..53
Figure 3.3 The optical density measured at 620nm exhibits the decrease in absorbance
per day …………………………………………………………………....54
Figure 3.4 Wet biomass on pre-weighed watch glass ....................................................59
Figure 3.5 White precipitate of extracted PHA with ethanol ..........................................59
Figure 3.6 Calibration curve between concentration and peak area for polyhydroxy
alkanoates .......................................................................................................60
Figure 3.7 Calibration curve between concentration and peak area for volatile fatty acid
mixture ……………………………………………………………………68
Figure 3.8 Calibration curve between concentration and peak area for alcohols ............69
Figure 4.1 Bio-electrochemical synthesis of 3-hydroxy dimethyl butyrate, ethyl 3-hydroxy
hexanoate, 2, 4 dimethyl heptanoate concentration in ppm against time
duration for batch system ...............................................................................81
xix
Figure 4.2 Bio-electrochemical synthesis of 3-hydroxy dimethyl butyrate, ethyl 3-hydroxy
hexanoate, 2, 4 dimethyl heptanoate concentration in ppm against time for
continuous system ..........................................................................................82
Figure 4.3 Comparison in Acetic acid concentration in both batch and continuous system
…………………………………………………………………………..83
Figure 4.4 Acetyl Co-A pathway for Polyhydroxyalkanoates (Estelle et al., 2014 and
Razaad et al., 2014) ........................................................................................85
Figure 4.5 Total current consumed by Cupriavidus necator and current recovery in
polymers during batch system .......................................................................86
Figure 4.6 Percent cathode recovery for organic polymers by Cupriavidus necator during
batch system ...................................................................................................87
Figure 4.7 Total current consumed by Cupriavidus necator and current recovery in
polymers in continuous system ......................................................................88
Figure 4.8 Percent cathode recovery for organic polymers by Cupriavidus necator in
continuous system ..........................................................................................88
Figure 4.9 Gas Chromatogram of PHA polymer ...........................................................90
Figure 4.10 Mass spectrum of poly hydroxyalkanoates ................................................90
Figure 4.11 Mass spectrum of acetic acid ...................................................................90
Figure 4.12 Gas chromatogram under nitrogen supply ..................................................91
Figure 4.13 Mass spectrum with nitrogen supply .......................................................91
Figure 4.14 Cyclic Voltammetry of Cupriavidus necator for biotic, abiotic cathode and
fresh medium against Ag/AgCl reference electrode at scan rate of 10mV/s .93
Figure 4.15 Scanning electronic micrographs of rod shaped PHB rich Cupriavidus
necator ………………………………………………………………........94
Figure 4.16 FT-IR spectroscopy of PHB biopolymer by Cupriavidus necator ...............95
Figure 4.17 Gas Chromatogram of various acids and alcohols from Sporomusa ovata...99
Figure 4.18 Mass spectrum of ethanoic acid ................................................................99
Figure 4.19 Mass spectrum of Butanoic acid...............................................................100
Figure 4.20 Mass spectrum of 2-ethylbutyric acid ........................................................100
Figure 4.21 Gas Chromatogram without Sporomusa ovata ..........................................101
Figure 4.22 Mass spectrum of medium without Sporomusa ovata ..............................101

xx
Figure 4.23 Bio-electrochemical synthesis of ethanoic acid, butanoic acid and 2-ethyl
butyrate by Sporomusa ovata in batch system ............................................102
Figure 4.24 Bio-electrochemical synthesis of ethanol, Pentanol and hexanol
concentration in mM by Sporomusa ovata in batch system ........................103
Figure 4.25 Bio-electrochemical synthesis of ethanoic acid, butanoic acid and 2-ethyl
butyrate concentration in mM by Sporomusa ovata in continuous system ..104
Figure 4.26 Bio-electrochemical synthesis of ethanol, pentanol and hexanol in
continuous system by Sporomusa ovata ......................................................105
Figure 4.27 Schematic diagram of Acetyl Co-A pathway for Acetoacetyl and Butyryl-Co-
A …………………………………………………………………………108
Figure 4.28 Cyclic Voltammetry for Sporomusa ovata for biotic, abiotic and fresh medium
against standard Ag/AgCl reference electrode at scan rate of 10mV/s ........109
Figure 4.29 Scanning electron micrographs of electrosynthetic cathode biofilms for
Sporomusa ovata ..........................................................................................111
Figure 4.30 Scanninng electron micrograph of abiotic cathode without electroactive
catalyst …………………………………………………………………..111
Figure 4.31 Current recovery in organic acids and alcohols by Sporomusa ovata in batch
system against the total electrons consumed by biofilm ..............................112
Figure 4.32 Percent Cathode Recovery for organic acids and alcohols by Sporomusa
ovata in batch system ...................................................................................113
Figure 4.33 Current recovery in organic acids and alcohols by Sporomusa ovata in
continuous system against total current consumed by biofilm .....................114
Figure 4.34 Percent cathode recovery for organic acids and alcohols by Sporomusa ovata
in continuous system ....................................................................................115
Figure 4.35 Gas chromatogram for Clostridium ljungdahlii ......................................120
Figure 4.36 Mass spectrum for ethanoic acid ............................................................120
Figure 4.37 Mass spectrum for ethyl butyrate ..............................................................121
Figure 4.38 Mass spectrum for heptanoic acid ............................................................121
Figure 4.39 Mass spectrum for heptanol.....................................................................121
Figure 4.40 Control cell without electro-autotrophs ...................................................122
Figure 4.41 Mass spectrum of Clostridium ljungdahlii without electro-autotrophs .....122

xxi
Figure 4.42 Bio-electrochemical synthesis of volatile fatty acids against time duration of
Clostridium ljungdahlii for batch system .....................................................123
Figure 4.43 Bio-electrochemical synthesis of alcohols against time duration of
Clostridium ljungdahlii for batch system .....................................................124
Figure 4.44 Bio-electrochemical synthesis of volatile fatty acids against time duration
of Clostridium ljungdahlii for continuous system ........................................125
Figure 4.45 Bio-electrochemical synthesis of ethanol, hexanol and heptanol against time
duration for continuous system by Clostridium ljungdahlii .........................126
Figure 4.46 Overview of Wood–Ljungdahl metabolic pathways involved in the synthesis
of various metabolites phases (Ramio et al., 2015). .....................................129
Figure 4.47 Cyclic Voltammetry of Clostridium ljungdahlii for biotic, abiotic cathode
and fresh medium against Ag/AgCl reference electrode at scan rate of 10mV/s
…………………………………………………………………………130
Figure 4.48 Scanning electron micrographs of electrosynthetic cathode biofilms after 24
and 72 hours .................................................................................................131
Figure 4.49 Scanning electron micrograph of abiotic cathode without electroactive
cells ……………………………………………………………………….132
Figure 4.50 Current recovery in organic acids and alcohols by Clostridium ljungdahlii
in batch system against the total electrons consumed by biofilm ................133
Figure 4.51 Percent cathode recovery for organic acids and alcohols by Clostridium
ljungdahlii in batch system ...........................................................................134
Figure 4.52 Current recovery in organic acids and alcohols by Clostridium ljungdahlii in
continuous system against the total electrons consumed by biofilm ............135
Figure 4.53 Percent Cathode Recovery for organic acids and alcohols by Clostridium
ljungdahlii in continuous system ..................................................................136
xxii
LIST OF TABLES
Table 3.1 Chemical composition of molasses....................................................................51
Table 4.1 Synthesis of PHA from dry cell mass after 48 hours .......................................79
Table 4.2 GC-MS analysis of biodegradable polymer and their chemical composition
(RT; retention time in minutes, CN; compound name, MW; molecular weight,
MF; molecular formula). ................................................................................80
Table 4.3 Comparison (ANOVA) of continuous and batch process for Cupriavidus
necator 96
Table 4.4 Determination of Sum of Squares, df, Mean Square, F and p values for
continuous and batch process for harvesting waste (molasses and carbon
dioxide) to biopolymer (PHB) using Cupriavidus necator ...........................96
Table 4.5 Chemical composition of volatile fatty acids and alcohols revealed by GC-MS
analysis 98
Table 4.6 Comparison (ANOVA) of continuous and batch process for Sporomusa ovata .
…..................................................................................................................116
Table 4.7 Determination of Sum of Squares, df, Mean Square, F and p values for
continuous and batch process for Sporomusa ovata ....................................116
Table 4.8 Chemical composition of volatile fatty acids and alcohols revealed by GCMS
analysis (RT; retention time in minutes, CN; compound name, MW; molecular
weight, MF; molecular formula, DF; displayed formula). ...........................119
Table 4.9 Comparison (ANOVA) of continuous and batch process for Clostridium
ljungdahlii ....................................................................................................137
Table 4.10 Determination of Sum of Squares, df, Mean Square, F and p values for
continuous and batch process for Clostridium ljungdahlii ...........................138
Table 7.1 Cell dry weight concentration and absorbance ...............................................164
Table 7.2 Optical density between days and absorbance ..............................................164
Table 7.3 Calibration between concentration and standard peak area for polymers .....165
Table 7.4 Standard concentration of standard volatile acid mixtures in mM and peak
area from GC-MS analysis ...........................................................................165

xxiii
Table 7.5 Standard concentration of alcohols in mM and peak area from GC-MS analysis
……………………………………………………………………………..166
Table 7.6 3-hydroxy dimethyl butyrate concentration of Cupriavidus necator for batch
system…………………………………………………………………… 166
Table 7.7 Ethyl 3-hydroxy hexanoate concentration of Cupriavidus necator for batch
system……………………………………………………………………. 167
Table 7.8 2, 4 dimethyl heptanoate concentration of Cupriavidus necator for batch system
……...167
Table 7.9 3-hydroxy dimethyl butyrate concentration of Cupriavidus necator for
continuous system ........................................................................................167
Table 7.10 Ethyl 3-hydroxy hexanoate concentration of Cupriavidus necator for
continuous system ........................................................................................168
Table 7.11 2, 4 dimethyl heptanoate concentration of Cupriavidus necator for continuous
system …………………………………………………………………..168
Table 7.12 Acetic acid concentration of Cupriavidus necator for batch system ..........168
Table 7.13 Acetic acid concentration of Cupriavidus necator for continuous system
…..................................................................................................................169
Table 7.14 Total current consumed by Cupriavidus necator and current recovery in
polymers in batch system .............................................................................169
Table 7.15 Percent Cathode Recovery for organic polymers by Cupriavidus necator in
batch system .................................................................................................170
Table 7.16 Total current consumed by Cupriavidus necator and current recovery in
polymers in continuous system ....................................................................170
Table 7.17 Percent Cathode Recovery for organic polymers by Cupriavidus necator in
continuous system ........................................................................................171
Table 7.18 Ethanoic acid concentration of Sporomusa ovata for batch system .........171
Table 7.19 Butanoic acid concentration of Sporomusa ovata for batch system .........171
Table 7.20 2-ethyl butyrate concentration of Sporomusa ovata for batch system ......172
Table 7.21 Ethanol concentration of Sporomusa ovata for batch system ..................172
Table 7.22 Pentanol concentration of Sporomusa ovata for batch system ...................172
Table 7.23 Hexanol concentration of Sporomusa ovata for batch system ...................173

xxiv
Table 7.24 Ethanoic acid concentration of Sporomusa ovata for continuous system 173
Table 7.25 Butanoic acid concentration of Sporomusa ovata for continuous system .173
Table 7.26 2-ethyl butyrate concentration of Sporomusa ovata for continuous system ....
……………………………………………………………………………..174
Table 7.27 Ethanol concentration of Sporomusa ovata for continuous system ...........174
Table 7.28 Pentanol concentration of Sporomusa ovata for continuous system ...........174
Table 7.29 Hexanol concentration of Sporomusa ovata for continuous system..........175
Table 7.30 Total current consumed by Sporomusa ovata and current recovery in organic
acids and alcohols in batch system ...............................................................175
Table 7.31 Percent cathode recovery of organic products of Sporomusa ovata vs. time
duration in batch system ...............................................................................176
Table 7.32 Total current consumed by biofilm and electrons recovered in organic
compounds in continuous system by Sporomusa ovata ...............................176
Table 7.33 Percent cathode recovery of organic products of Sporomusa ovata vs. time
duration in continuous system ......................................................................177
Table 7.34 Ethanoic acid concentration for batch system by Clostridium ljungdahlii .177
Table 7.35 Ethyl butyrate concentration for batch system by Clostridium ljungdahlii .178
Table 7.36 Hexanoic acid concentration for batch system by Clostridium ljungdahlii.178
Table 7.37 Heptanoic acid concentration for batch system by Clostridium ljungdahlii 178
Table 7.38 Ethanol concentration for batch system by Clostridium ljungdahlii .........179
Table 7.39 Hexanol concentration for batch system by Clostridium ljungdahlii .........179
Table 7.40 Heptanol concentration for batch system by Clostridium ljungdahlii ........179
Table 7.41 Ethanoic acid concentration for continuous system by Clostridium ljungdahlii
…………………………………………………………………………180
Table 7.42 Ethyl butyrate concentration for continuous system by Clostridium ljungdahlii
180
Table 7.43 Hexanoic acid concentration for continuous system by Clostridium ljungdahlii
…………………………………………………………………………180
Table 7.44 Heptanoic acid concentration for continuous system by Clostridium
ljungdahlii ....................................................................................................181
Table 7.45 Ethanol concentration for continuous system by Clostridium ljungdahlii ..181

xxv
Table 7.46 Hexanol concentration for continuous system by Clostridium ljungdahlii .181
Table 7.47 Heptanol concentration for continuous system by Clostridium ljungdahlii .182
Table 7.48 Total current consumed by Clostridium ljungdahlii and recovered in volatile
fatty acids and alcohols in batch system ......................................................182
Table 7.49 Percent cathode recovery of organic products of Clostridium ljungdahlii vs.
time duration in batch system .......................................................................183
Table 7.50 Total current consumed by biofilm and electrons recovered in organic
compounds in continuous system by Clostridium ljungdahlii .....................183
Table 7.51 Percent cathode recovery of organic products of Clostridium ljungdahlii vs.
time duration in continuous system ..............................................................184

xxvi
List of acronyms
µM Micro meter
1,3PD propane Diol
ABE Acetone-butanol-ethanol
Acetyl-CoA Acetyl coenzyme A
ADH Alcohol dehydrogenase
ASBR Anaerobic Sequencing Batch Reactor
ATP Adenosine triphosphate
BES Bio-electrochemical synthesis
CV Cyclic voltammetry
DC Direct Current
DMAP Dimethyl allyl Pyrophosphate
DRB De oiled rice bran
EET Extracellular electron transfer
ET Electron Transfer
EU Endotoxin unit
FAD Flavins adenine dinucleotide
FT-IR Fourier Transform Infra-Red Spectroscopy
GC-MS Gas Chromatography Mass spectrometry
HS-SPME A Headspace Solid Phase Micro extraction
IPPP Isoprenyl Pyrophosphate
KDC 2-keto acid decarboxylase
m/z Mass per charge ratio
MEC Microbial electrolytic cell
MES Microbial electrochemical synthesis
MFC Microbial fuel cell
mM Millie mole
mV Millie volts
NADH Nicotinamide adenine dinucleotide
xxvii
NADPH Nicotinamide adenine dinucleotide phosphate
OD Optical Density
P3HB poly (3-hydroxybutyrate)
PEM Proton exchange membrane
PHA Polyhydroxyalkanoates
PTFE polytetrafluoroethylene
SEM Scanning electron microscopy
SS Stainless Steel
UASB Up flow anaerobic sludge blanket reactor

1

1
Chapter 1
Introduction
2
1 Introduction
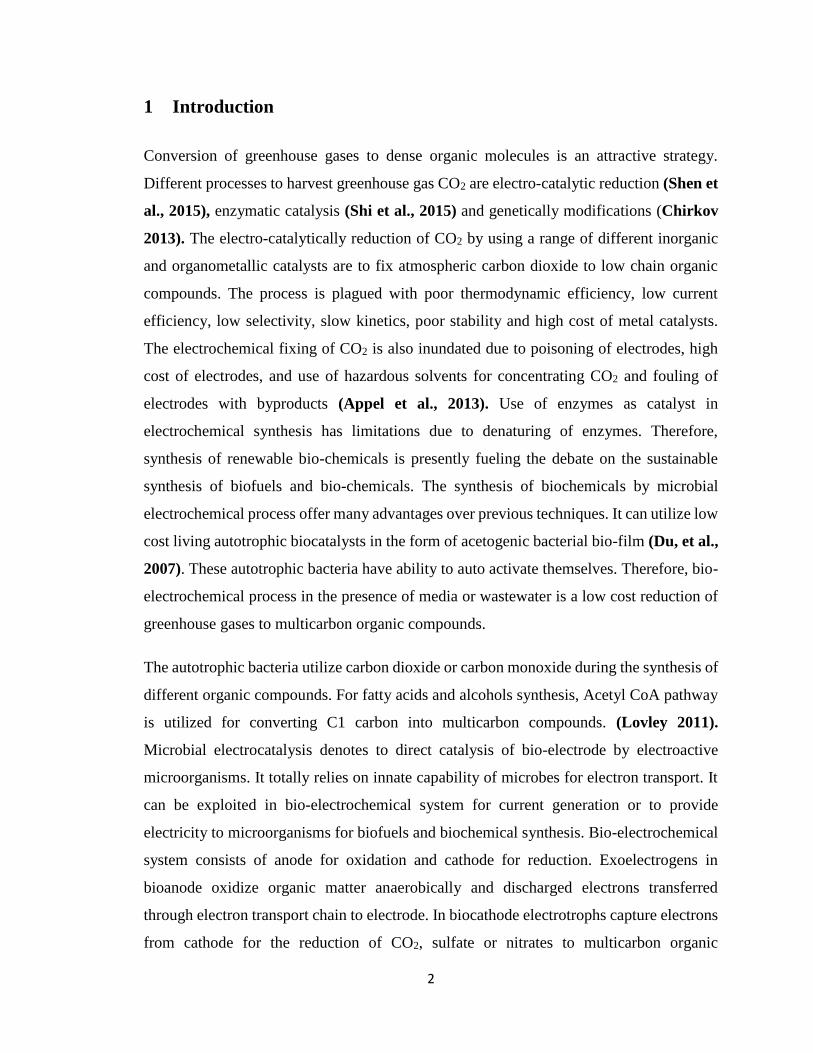
Conversion of greenhouse gases to dense organic molecules is an attractive strategy.
Different processes to harvest greenhouse gas CO2 are electro-catalytic reduction (Shen et
al., 2015), enzymatic catalysis (Shi et al., 2015) and genetically modifications (Chirkov
2013). The electro-catalytically reduction of CO2 by using a range of different inorganic
and organometallic catalysts are to fix atmospheric carbon dioxide to low chain organic
compounds. The process is plagued with poor thermodynamic efficiency, low current
efficiency, low selectivity, slow kinetics, poor stability and high cost of metal catalysts.
The electrochemical fixing of CO2 is also inundated due to poisoning of electrodes, high
cost of electrodes, and use of hazardous solvents for concentrating CO2 and fouling of
electrodes with byproducts (Appel et al., 2013). Use of enzymes as catalyst in
electrochemical synthesis has limitations due to denaturing of enzymes. Therefore,
synthesis of renewable bio-chemicals is presently fueling the debate on the sustainable
synthesis of biofuels and bio-chemicals. The synthesis of biochemicals by microbial
electrochemical process offer many advantages over previous techniques. It can utilize low
cost living autotrophic biocatalysts in the form of acetogenic bacterial bio-film (Du, et al.,
2007). These autotrophic bacteria have ability to auto activate themselves. Therefore, bio-
electrochemical process in the presence of media or wastewater is a low cost reduction of
greenhouse gases to multicarbon organic compounds.
The autotrophic bacteria utilize carbon dioxide or carbon monoxide during the synthesis of
different organic compounds. For fatty acids and alcohols synthesis, Acetyl CoA pathway
is utilized for converting C1 carbon into multicarbon compounds. (Lovley 2011).
Microbial electrocatalysis denotes to direct catalysis of bio-electrode by electroactive
microorganisms. It totally relies on innate capability of microbes for electron transport. It
can be exploited in bio-electrochemical system for current generation or to provide
electricity to microorganisms for biofuels and biochemical synthesis. Bio-electrochemical
system consists of anode for oxidation and cathode for reduction. Exoelectrogens in
bioanode oxidize organic matter anaerobically and discharged electrons transferred
through electron transport chain to electrode. In biocathode electrotrophs capture electrons
from cathode for the reduction of CO2, sulfate or nitrates to multicarbon organic

3
compounds, the precursors of liquid transportation fuel (Sharma et al., 2014 and Fan et
al., 2012). Technical breakthrough has extended the bio-electrochemical synthesis of
volatile fatty acids and alcohols at low cost as compared to other electrochemical processes
(Rabaey et al., 2010).
The enrichment of biocathode for autotrophic electrotrophs for biofuel and polymer
synthesis provides a simplified method to isolate biochemicals from different inoculum
sources. Bacteria were heterotrophically grown first on glucose, fructose or glycerol and
after pre-enrichment and acclimation of culture carbon dioxide was delivered as sole
electron acceptor. (Zaybak et al., 2013). Biocathodes catalysis proved to be less expensive
as compared to traditional cathodes which are causing toxicity, corrosion and denatured
material ( Lovley 2011). Selection of microorganisms must be specific which would be
able to switch from heterotrophic to autotrophic metabolism. This mechanism may also
provide generalized approach along with metabolic activities of microorganisms for
various electron donors or acceptors during the development of anaerobic specialized
biocathode. In order to produce valuable fuels and other organic commodities, pure culture
was employed because the diversity of autotrophic acetogens accept electrons from
negatively poised cathode for the reduction of carbon dioxide. However, columbic
efficiencies remain low.
Majority of acetogens are mesophilic bacteria which work efficiently at temperature ranges
from 20 to 450C while 37 0C is the optimal growth temperature for most of the strains.
Synthesis rates are explained by higher solubility of greenhouse gas at this optimal
temperature. Synthesis of volatile fatty acids occur in acidogenesis phase and synthesis of
alcohols occur usually when metabolism shifts from acidogenesis to solventogenesis.
Bacteria have ability to reduce CO2 and H2 to volatile fatty acids and alcohols by utilizing
reductive acetyl-CoA pathway and have recently been investigated for the conversion of
CO2 to various organic products in bio-electrochemical synthesis (BES) system. Supplying
hydrogen was unlikely to be practical because of its energy input and requirement for
extensive catalysts. Recently H2 has been replaced by bio cathode with electron supply as
4
energy and electron source in BES system. The establishment of biocathode utilize the set
potential approaches along with the addition of hydrogen and chemicals.
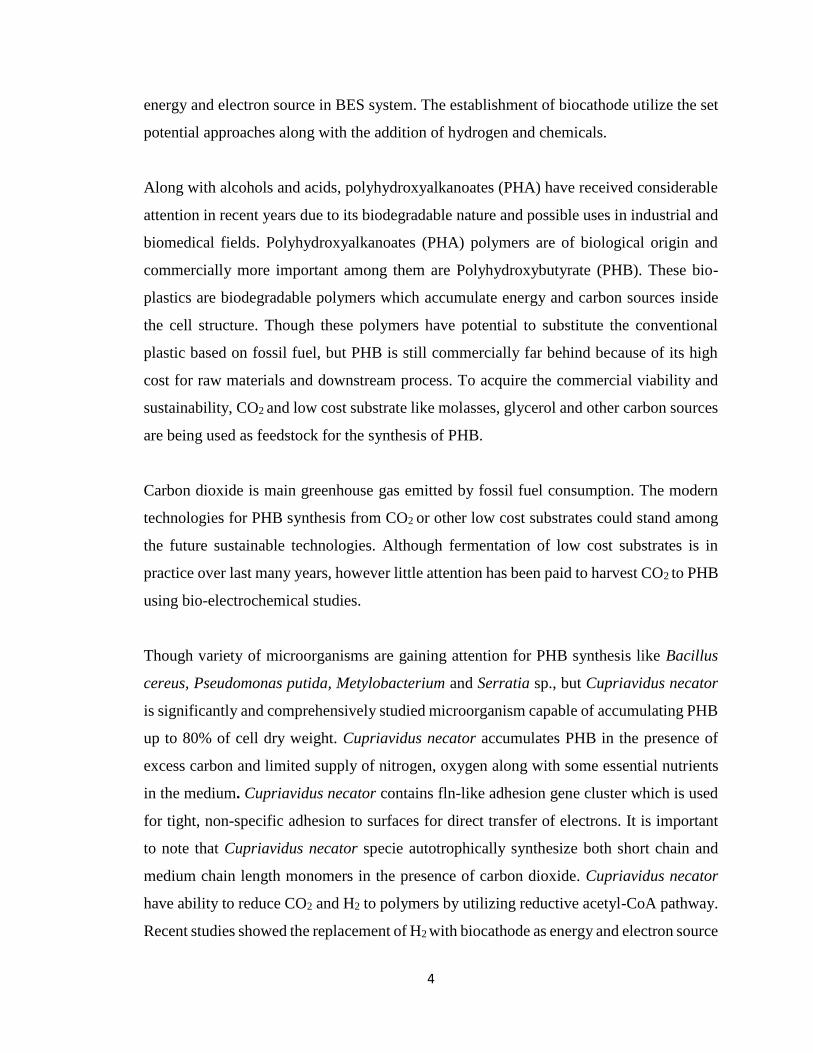
Along with alcohols and acids, polyhydroxyalkanoates (PHA) have received considerable
attention in recent years due to its biodegradable nature and possible uses in industrial and
biomedical fields. Polyhydroxyalkanoates (PHA) polymers are of biological origin and
commercially more important among them are Polyhydroxybutyrate (PHB). These bio-
plastics are biodegradable polymers which accumulate energy and carbon sources inside
the cell structure. Though these polymers have potential to substitute the conventional
plastic based on fossil fuel, but PHB is still commercially far behind because of its high
cost for raw materials and downstream process. To acquire the commercial viability and
sustainability, CO2 and low cost substrate like molasses, glycerol and other carbon sources
are being used as feedstock for the synthesis of PHB.
Carbon dioxide is main greenhouse gas emitted by fossil fuel consumption. The modern
technologies for PHB synthesis from CO2 or other low cost substrates could stand among
the future sustainable technologies. Although fermentation of low cost substrates is in
practice over last many years, however little attention has been paid to harvest CO2 to PHB
using bio-electrochemical studies.
Though variety of microorganisms are gaining attention for PHB synthesis like Bacillus
cereus, Pseudomonas putida, Metylobacterium and Serratia sp., but Cupriavidus necator
is significantly and comprehensively studied microorganism capable of accumulating PHB
up to 80% of cell dry weight. Cupriavidus necator accumulates PHB in the presence of
excess carbon and limited supply of nitrogen, oxygen along with some essential nutrients
in the medium. Cupriavidus necator contains fln-like adhesion gene cluster which is used
for tight, non-specific adhesion to surfaces for direct transfer of electrons. It is important
to note that Cupriavidus necator specie autotrophically synthesize both short chain and
medium chain length monomers in the presence of carbon dioxide. Cupriavidus necator
have ability to reduce CO2 and H2 to polymers by utilizing reductive acetyl-CoA pathway.
Recent studies showed the replacement of H2 with biocathode as energy and electron source

5
in BES system. However, bio-electrochemical harvesting of carbon dioxide to monomers
using biocathode is not reported before. The enrichment of bio cathode for autotrophic
electrotrophs for biofuel synthesis provides a simplified method to isolate biochemicals.
The bio-electrochemical synthesis of organic compounds by different exoelectrogens
Sporomusa, Clostridium and Moorella species are reported (Giddings, et al., 2015, Nevin
et al., 2011, and Nevin et al., 2010). The initial study shows the synthesis of organic acids
including acetate using H type bio-electrochemical cell and recovery of electrons in the
form of organic compounds or hydrogen (Nevin et al., 2010). However, it was found that
the product yield and electrons recovery in organic compounds remained low.
Another important factor effecting bio-electrochemical harvesting of carbon dioxide is
cathodic material. Cathode in BES where biofilm is developed plays a crucial role on the
performance of bio-electrochemical cells. Graphite plate/rod, carbon cloth, carbon felt,
carbon paper and reticulated vitrified carbon graphite brush are being used as cathodic and
anodic material. Carbon fiber type electrodes have gained importance due to their highly
porous architecture. Recently several new fiber electrodes were developed such as carbon
nanotube-textile, conductive nanowires network and electrospun carbon fiber mat and had
delivered a high current density (Pocaznoi et al., 2012). However, the direct connection of
such electrodes to external circuit remained a big challenge.
Metal materials such as stainless steel (SS) materials show excellent mechanical and
electrical properties, low-cost, environmental stability and is easy to be shaped and
connected. SS materials had been widely used as cathode or current collector of cathode in
microbial electrochemical cells (Dumas et al., 2007).
Therefore, current study was undertaken to bio-electrochemically harvest carbon dioxide
using biocathode; design a simplified method by modified cathode; and to enhance product
yield and electrons recovery in organic compounds. Three autotrophic exoelectrogens
selected were Cupriavidus necator, Sporomusa ovata and Clostridium ljungdahlii. Fixing
inorganic CO2 to organic compounds was investigated using carbon cloth along with
stainless steel, as a cathode material by providing highly porous architecture of carbon
cloth and stainless steel for being excellent mechanical and electrical properties. Bio-

6
cathodes catalysis proved to be less expensive as compared to traditional cathodes which
are causing toxicity, corrosion and denaturation of material. Selection of microorganisms
must be specific which would be able to shift from heterotrophic to autotrophic
metabolism. It is reported in previous studies that electron transportation from cathode to
cells involves the use of or the production of electron shuttles. These electron shuttles are
produced as secondary metabolites in BES system by various organisms like flavins and
phenazines (Choi et al., 2016). These chemicals directly or indirectly effect the bio-
electrochemical synthesis of commodities of chemicals. The major drawback of shuttles
are their toxicity, loss in flow through system and limited stability. The present research
was based on the selection of electrotrophs that can directly capture electron, without
exploiting intermediate electron shuttles. Previous studies were conducted by employing
mixed population of microbial communities. BES in this context tackling the complexity
of organics and basic impediment is the selectivity toward desirable end product. Second
drawback related to mixed communities was deficiency of operational growth over
extended time periods. The lack of knowledge about the mode of electron transfer and the
products synthesized are being utilized by other communities in their complex metabolic
pathways are major drawbacks which cannot be ignored. In various bio-electrochemical
cells the metabolism was driven by hydrogen a good approach toward electricity driven
bio production. However hydrogen has shortcomings for microbial metabolism. It has less
solubility due to that microbial environment has to be pressurized to get concentrations of
the products. So cathodic bio production needs to circumvent hydrogen (Rabaey et al.,
2010). Thus high quality biocathode process was aimed to provide electrons to pure
electrotrophs for specific products generation.
The designing of BES cell relied totally on bio-cathode and its potential was carefully
controlled by Potentiostat as reported in previous studies. Implementation of Potentiostat
was to control the cathode potential and to avoid potential fluctuations that could damage
the cells. It proved to be impractical because of its limited control in large scale systems.
In current study, direct current (DC) power source was utilized to provide potential
difference between electrodes. Potentiostat was used only to examine the electroactivity of

7
bio-film of pure culture, developed at cathode. These specific implementations were
developed to simplify the reactor design and maintenance of energy efficiencies. All
explicit modifications in this technique has provided general approach and additional
potential to electro fuel synthesis.
1.1 Significance of study
Energy consumed worldwide is approximately 90% derived from fossil fuels. Combustion
of fossil fuel causing considerable environmental effects like global warming and climate
change. It has been estimated that fossil fuel reserves are going to be depleted by the year
2050 due to world’s rapidly increasing population. Hence studying the process for the
synthesis of renewable bio-chemicals from greenhouse gas is the aim of this study.
1.2 Objectives of the study
Objective of current study are to
design and fabricate simplified bioelectrochemical reactor for the synthesis of
renewable chemicals from waste greenhouse gas, carbon dioxide
study of nontoxic acetogens capable of capturing electrons from electrodes for
organic compounds synthesis
investigate the effect of batch and continuous BES system for products synthesis
identify and quantify organic compounds synthesized during BES systems
analyze redox activity of exoelectrogens through cyclic voltammetry
study coulombic efficiency for reducing carbon dioxide to organic compounds
determine cathodic current recovery of compounds in both systems

8
Chapter 2
Literature review
9
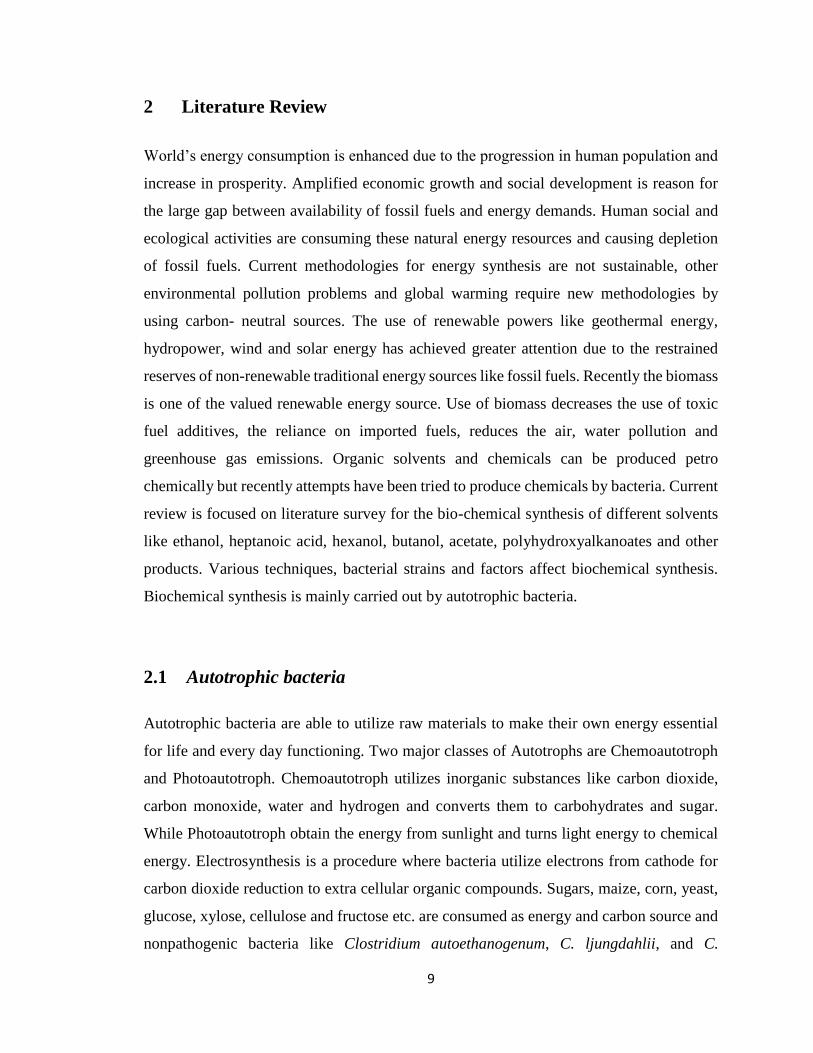
2 Literature Review
World’s energy consumption is enhanced due to the progression in human population and
increase in prosperity. Amplified economic growth and social development is reason for
the large gap between availability of fossil fuels and energy demands. Human social and
ecological activities are consuming these natural energy resources and causing depletion
of fossil fuels. Current methodologies for energy synthesis are not sustainable, other
environmental pollution problems and global warming require new methodologies by
using carbon- neutral sources. The use of renewable powers like geothermal energy,
hydropower, wind and solar energy has achieved greater attention due to the restrained
reserves of non-renewable traditional energy sources like fossil fuels. Recently the biomass
is one of the valued renewable energy source. Use of biomass decreases the use of toxic
fuel additives, the reliance on imported fuels, reduces the air, water pollution and
greenhouse gas emissions. Organic solvents and chemicals can be produced petro
chemically but recently attempts have been tried to produce chemicals by bacteria. Current
review is focused on literature survey for the bio-chemical synthesis of different solvents
like ethanol, heptanoic acid, hexanol, butanol, acetate, polyhydroxyalkanoates and other
products. Various techniques, bacterial strains and factors affect biochemical synthesis.
Biochemical synthesis is mainly carried out by autotrophic bacteria.
2.1 Autotrophic bacteria
Autotrophic bacteria are able to utilize raw materials to make their own energy essential
for life and every day functioning. Two major classes of Autotrophs are Chemoautotroph
and Photoautotroph. Chemoautotroph utilizes inorganic substances like carbon dioxide,
carbon monoxide, water and hydrogen and converts them to carbohydrates and sugar.
While Photoautotroph obtain the energy from sunlight and turns light energy to chemical
energy. Electrosynthesis is a procedure where bacteria utilize electrons from cathode for
carbon dioxide reduction to extra cellular organic compounds. Sugars, maize, corn, yeast,
glucose, xylose, cellulose and fructose etc. are consumed as energy and carbon source and
nonpathogenic bacteria like Clostridium autoethanogenum, C. ljungdahlii, and C.
10
ragsdalei, Sporomusa ovata and Cupriavidus necator etc. use waste industrial gases or
syngas as the sole carbon and energy source. The anaerobic acetogens are focused which
are helpful to convert greenhouse gases to chemicals. Autotrophic bacteria have the
potential to convert raw materials into valuable products like acetate, ethanol, acetone and
butanol. Metabolic pathways and genetic mutations are helpful for the synthesis of variety
of organic solvents.
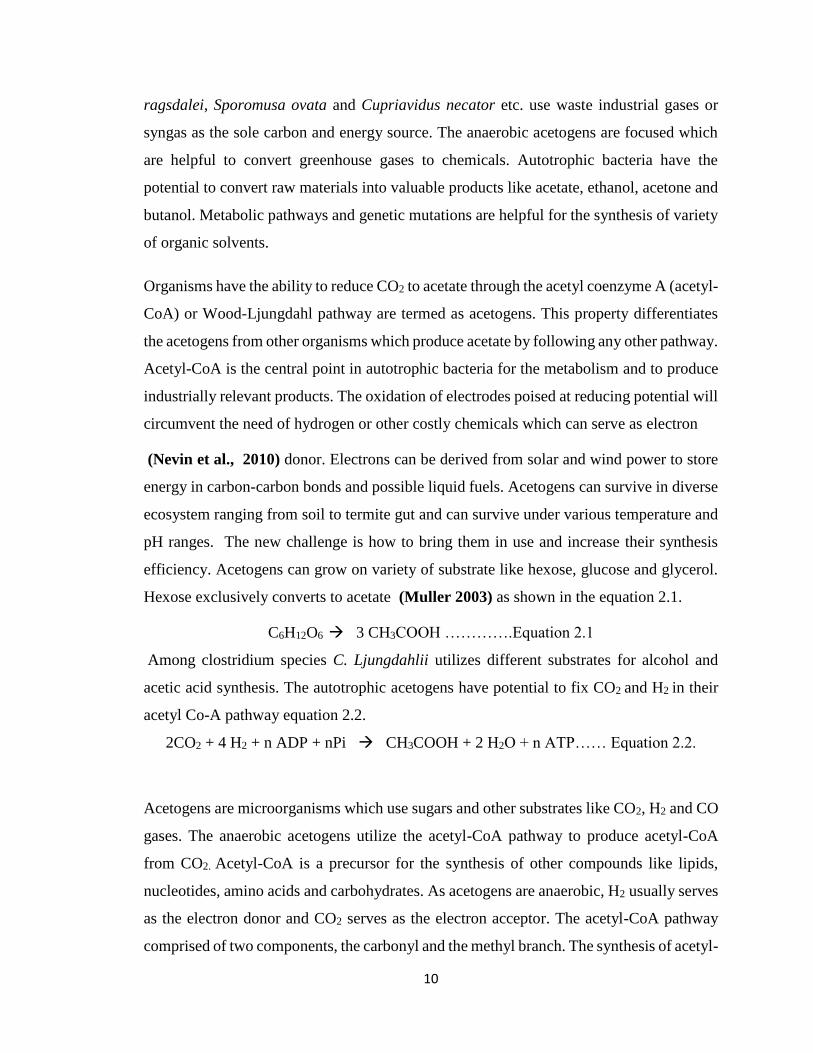
Organisms have the ability to reduce CO2 to acetate through the acetyl coenzyme A (acetyl-
CoA) or Wood-Ljungdahl pathway are termed as acetogens. This property differentiates
the acetogens from other organisms which produce acetate by following any other pathway.
Acetyl-CoA is the central point in autotrophic bacteria for the metabolism and to produce
industrially relevant products. The oxidation of electrodes poised at reducing potential will
circumvent the need of hydrogen or other costly chemicals which can serve as electron
(Nevin et al., 2010) donor. Electrons can be derived from solar and wind power to store
energy in carbon-carbon bonds and possible liquid fuels. Acetogens can survive in diverse
ecosystem ranging from soil to termite gut and can survive under various temperature and
pH ranges. The new challenge is how to bring them in use and increase their synthesis
efficiency. Acetogens can grow on variety of substrate like hexose, glucose and glycerol.
Hexose exclusively converts to acetate (Muller 2003) as shown in the equation 2.1.
C6H12O6 3 CH3COOH ………….Equation 2.1
Among clostridium species C. Ljungdahlii utilizes different substrates for alcohol and
acetic acid synthesis. The autotrophic acetogens have potential to fix CO2 and H2 in their
acetyl Co-A pathway equation 2.2.
2CO2 + 4 H2 + n ADP + nPi CH3COOH + 2 H2O + n ATP…… Equation 2.2.
Acetogens are microorganisms which use sugars and other substrates like CO2, H2 and CO
gases. The anaerobic acetogens utilize the acetyl-CoA pathway to produce acetyl-CoA
from CO2. Acetyl-CoA is a precursor for the synthesis of other compounds like lipids,
nucleotides, amino acids and carbohydrates. As acetogens are anaerobic, H2 usually serves
as the electron donor and CO2 serves as the electron acceptor. The acetyl-CoA pathway
comprised of two components, the carbonyl and the methyl branch. The synthesis of acetyl-

11
CoA from CO2 and H2 involves the formation of the methyl precursor of acetyl-CoA and
the carbonyl precursor of acetyl-CoA. The condensation of the above two precursors can
be used to make products such as acetic acid, butyric acid, ethanol, butanol and cell mass
The bio-electrochemical synthesis also involves the conversion of carbon sources to poly
hydroxyalkanoates (PHA) by Cupriavidus necator. The metabolic pathway for PHA
synthesis is exhibited in the figure 2.1 (Verlinden et al., 2007).
Figure 2.1 Acetyl Co-A pathway for Polyhydroxyalkanoates by Cupriavidus necator
2.2 Microorganisms for Biosynthesis of Organic Compounds
Numbers of microorganisms are able to switch monosaccharide and oligosaccharides to
ethanol. Yeast and Saccharomyces cerevisiae are most commonly used microorganism
(Claasen et al., 1999). Some microorganisms are more useful than yeasts because of its
capability to grow under strict anoxic conditions, high substrate concentrations and high
ethanol tolerance. S. cerevisiae converts hexose into pyruvate via glycolysis then
decarboxylate pyruvate to acetaldehyde and further reduced to ethanol. Another promising

12
bacterium is Zymomonas mobilis, which yields 0.51g ethanol /g glucose the highest yield
than reported in literature. Z. mobilis can tolerate high temperature so decreases the expense
of cooling during fermentation. The main disadvantage of these two yeasts is that they are
unable to utilize pentose. Other microorganisms like yeasts Candida shehatae, Pichia
stipitis and Pachysolen tannophilus and bacteria can ferment xylose to ethanol but their
ethanol synthesis rate is less than S. cerevisiae. Adapted strains of S. cerevisiae have been
established (Jeppsson et al., 2003) to overcome the disadvantages. Enzymes can convert
xylose via xylitol to xylulose as it was a pentose therefore can be fermented by S.
cerevisiae. The main disadvantage of these recombinant strains is that it costs so high for
the safe disposal of waste water. Thermophilic bacteria like Clostridium thermocellum, C.
thermohydrosulfuricum, C. thermosaccharolyticum and Thermoanaerobacter mathranii
have saccharolytic activities which are useful for the conversion of lignocellulosic
materials into ethanol. There are some advantages of fermentation at high temperature, the
high productivity, low threat of contamination, boosted reactor efficiency and maximum
consumption of wide range of substrate. One disadvantage of thermophilic clostridia is its
low tolerance to ethanol than conventional ethanol producer, S. cerevisiae. The conversion
of lignocellulosic substrates by thermophilic bacteria needs further improvement.
Acetone-butanol-ethanol (ABE) fermentation utilizes the carbohydrate substrate and
produces the approximate ratio 3:6:1of solvent concentration. Butanol, ethanol and acetone
are chemicals used in great diversity like fuel additives and solvents. The three major
factors that reduce the feasibility of ABE fermentation are the low concentration of the
products (due to solvent toxicity), the cost of the substrates and the high product retrieval
costs. (Derk 1995). Microorganisms included in ABE fermentation are solventogenic
clostridia. The best recognized groups are the clostridium species like C. acetobutylicum,
mesophiles and C. beijerinckii. C. acetobutylicum produces acetate, butyrate, H2 and CO2
from glucose at pH values greater than about 5.6. Low pH, growth limiting factors, high
concentrations of acids and under fermentation solventogenic conditions clostridia can
produce propanol, Isopropanol.

13
Another approach in ABE fermentation is genetically modified bacteria which reutilize the
carboxylic acid during carbohydrate degradation. Overexpression of these genes increased
the solvent synthesis (Nair et al., 1999) and decrease in the carboxylic acid concentration.
recently synthesis of butanol at pilot scale by C. beijerinckii by butanol hyper-producing
mutant strain in glucose/corn steep water medium is described. C. beijerinckii mutant
proved the economic effectiveness of ABE fermentation. (Wang et al., 2012) studied the
two pathways based on syngas and sugar for the synthesis of ethanol by lignocelluloses
biomass. The ethanol synthesis is from syngas by using bacteria converting lignin,
cellulose and hemicelluloses biomass to ethanol. Regarding to Clostridium ljungdahlii first
patent was published in 1992. The maximum concentration of ethanol 48g/L was obtained
in continuous stirred tank. Bacterium were discovered like (Abrini et al., 1994)
Clostridium autoethanogenum, Butyribacterium methylotrophicum, Clostridium
ragsdalei, Butyribacterium methylotrophicum (Grethlein et al., 1991) and Alkalibaculum
bacchi (Allen et al., 2010) that can converse syngas to ethanol and acetic acid. This
bacterium can work under similar conditions of temperature and pH. It can grow on sugar
substrate at much higher rates than syngas substrate (Cotter et al., 2009). High yeast
extract promote the acetate growth and low yeast extract increase ethanol (Klasson et al.,
1991) concentration. The ethanol synthesis was 0.063 to 12 g/L and acetate synthesis was
0.0095 to 27 g/L by Clostridium ljungdahlii through syngas fermentation. It was studied
(Younesi et al., 2005 and Phillips et al., 1993) that the synthesis of acetate and ethanol
was possible by Clostridium species. Catalytical process can convert syngas into fuels and
like methanol, methane, ethanol, acetic acid and hydrogen (Klasson et al., 1992).
Anaerobic bacteria can grow autotrophically on syngas to produce chemicals and fuels
(Braun et al., 1981). It was found that CO2, CO and H2 can be converted to acetate with
the help of several acetogens like Clostridium aceticum, Clostridium ljungdahlii,
Acetobacterium woodii and Clostridium thermoacetica. Formation of acetate was same for
all pressures of syngas at 0.8–1.8 atm as well as cell concentrations. With hydrogen and
carbon dioxide in the culture media ethanol concentration could be increased. At 1.4 atm
pressure the maximum acetate synthesis was obtained. An attractive way to convert raw
materials to 1, 3-Propane Diol (PD) with the help of microbes without any toxic byproducts
(Nakumura et al., 2003).

14
Recently more attention is given to microbial conversion. Conversion of glycerol to 1, 3-
PD K.pneumoniae has shown wide productivity. Glycerol can be dissimilated to the
product under aerobic or anaerobic conditions (Chen et al., 2003). The Clostridium species
have been used for the synthesis of 1, 3-PD (Abbad et al., 1995). The different species
used are Klebsiella species, Lactobacillus species, Citrobacter species, Enterobacter
species, and Clostridium species. C. butyricum is important strain for the conversion of
glycerol to 1, 3 propanediol without the dependence of vitamin B12. It was proved that
there was no difference between raw and commercial grade glycerol fermentation. 1, 3 PD
volumetric productivity were same. From economical point of view (Gonzalez et al.,
2004), the glycerol is an appreciated substrate for 1, 3 PD synthesis. (Himmi et al., 1999)
worked on the important nutrients required for C. butyricum for glycerol fermentation. The
aim of this work was high synthesis yield from low nutrient medium. However there are
numerous difficulties in microbial synthesis, mainly limited yield, and product separation.
These drawbacks can be overcome through the metabolic engineering (Mukhopadhyay et
al., 2008).
2.3 Substrates for Biosynthesis
Microbial synthesis of chemical organics requires numerous substrates which are specific
for different biofuels. (Michael et al., 2011) through the C. Ljungdahlii, s analysis (Tanner
et al., 1993) genome proposed the complete pathway starting from carbon monoxide to 2,3
Butane Diol. By using steel mill waste gas the metabolic end product was ethanol, small
amount of 2,3BD, traces of lactate and acetate confirmed by GC-MS (Ji et al., 2011). For
the synthesis of 2, 3 BD from CO enzymes were located from Enterobacteriaceae, Bacillus
and Clostridium acetobutylicum species (Xiao et al., 2007) C. Ljungdahlii revealed that
homologues of enzymes Pyruvate, acetolactate decarboxylase, acetolactate synthase and
2,3BD dehydrogenase in 2,3BD synthesis from the central intermediate. These genes were
also present in C. autoethanogenum and C. ragsdalei and are usually clustered in
Enterobacteriaceae and Bacillus species (Blomqvist 1993).

15
A study of Wood-Ljungdahl pathway genes provides one of the oldest existing biochemical
pathways. The fermentation process with C.ljungdahlii ethanol concentration was over 50
g/L so proved a viable industrial process. (Al-Shorgani et al., 2012 and Mariano et al.,
2011), treated the de oiled rice bran (DRB) and rice bran (RB) by using Clostridium
saccharoperbutylacetonicum N1-4 for the acetate, butanol and ethanol (ABE) synthesis.
Results revealed that pretreated DRB produced more ABE than pretreated RB. Butanol has
the ability to tolerate water contamination and blend with gasoline increase the efficiency
of gasoline, so butanol can be used in conventional engines (Durre et al., 2007). Synthesis
of butanol with clostridium species has some problems of toxicity, low productivity but
high recovery costs. Many efforts were made to enhance the separation at low cost (Lee et
al., 2008). various raw materials or agricultural crops like starch (Madihah et al., 2001)
corn and molasses (Qureshi et al., 2001) and whey can produce butanol (Ennis BM (1985),
but rice bran proved the best raw material because it contains carbohydrates and cellulosic
polysaccharides (Tanaka et al., 2006), high amount of carbohydrates and less amount of
lignin. So it proved the best feed stock for the various valuable products like single cell
protein and ethanol (Chandel et al., 2009). Dilute acid hydrolysis was employed for the
conversion of biomass into fermentable sugars. High temperature was producing
fermentation inhibitors like furan, weak carboxylic acids and phenolic which affect the
performance of bio-butanol and bio-ethanol (Palmqvist et al., 2000) synthesis in
fermenting microorganisms. They studied the Clostridium saccharoperbutylacetonicum
N1-4 can produce butanol from rice bran hydrolysates because it is also known as (Kosaka
et al., 2007) hyper-butanol-producing strain. (Qureshi 2011) reviewed the variety of
agricultural residues and energy crops by biochemical or fermentation processes for the
synthesis of acetone, butanol and ethanol (ABE). Numerous organisms are available for
this bioconversion including Clostridium beijerinckii P 260, C. beijerinckii BA101,
Clostridium acetobutylicum and Clostridium saccharobutylicum P 262. Some of these
strains (P 260 and P 262) were used in an industrial setting in South Africa. One of the
major limitations of these cultures is that none of them produce greater than 30 g/l. He
utilized both hexose and pentose from lignocellulosic hydrolysates such as maize (corn)
fiber, wheat straw (one of the novel substrates) and barley straw, maize Stover and switch
grass. He reviewed the additional carbohydrates like maize, rye, millet, molasses, potato,

16
soya molasses and agricultural wastes too. Additional carbohydrates that can be used
include dextrins, fructose, sucrose and lactose. Technologies have been developed that
integrate lignocellulosic biomass hydrolysis, fermentation and simultaneous product
recovery.
In continuous process where a product was recovered simultaneously, 461.3 g/L ABE was
produced by using 1125 g sugar in one liter culture volume. In addition to ABE CO2 and
H2 were also produced which can be sold as dry ice and energy source respectively. He
reported that beside these 30,000m3 of biogas was also produced from fermentation sludge
per day. Additional by product separated was cobalamin. (Halan, et al., 2012 and Zhang
et al., 2009) studied about the (ABE) fermentation by Clostridia beijerinckii. The effect
of dilution rate was studied on solvent synthesis for 20 days in continuous flow operation.
The solvent productivity was enhanced by increase in the dilution rate. Continuous culture
with immobilized cells is a promising technique for solvent synthesis. Cell immobilization
common techniques are entrapment and adsorption. Entrapment include carrageenan
(Davison et al., 1993) chitosan (Frick et al., 1986) calcium alginate (Krouwel et al., 1980)
and polyvinyl alcohol (Lee et al., 2008a) as matrix material. But adsorption includes bone
char (Friedl et al., 1991) and brick. Some lignocellulosic materials include wood, rice
husks and straw (Forberg et al., 1985). Many species of microorganisms can grow on corn
stalk without any additional chemicals (Shukla et al., 1989 and Arne et al., 2000)
reviewed that biofilms have been used for bioremediation. These biocatalysts have been
used for the synthesis of chemicals, bio-fuels, and bio-hydrogen along with electricity
synthesis. In his review he highlighted the advancement in biofilm characterization, biofilm
reactor developments, fine chemicals and current challenges and future of these scenarios.
Biofilms can develop on all kind of interfaces and can nourish themselves by polymeric
substances produced by them. Catalytic biofilms are dynamic but integration of the
analytical tools into bioreactor to get real data is the biggest challenge in near future
(Katarzyna et al., 2011) reviewed that 1, 3-Propanediol is an essential chemical to
synthesize monomer for polycondensations of polyesters, polyether and polyurethanes.
Recently, 1, 3-PD is also used as a monomer for the preparation of a new type of a
polyester– polytrimethylene terephthalate (Biebl et al., 1999). This polyester can be

17
produced chemically too but it is expensive due to expensive chemicals, high temperature,
pressure and catalyst. (Kajan et al., 2012) focused the assimilation of different
biochemical and bioprocessing technologies for future biomass energy programs. The dry
biomass is a polymer of carbohydrate containing carbon, hydrogen and oxygen in a ratio
of 1:1.4:0.6 approximately. During the energy constrained the CO2 is recycled to form new
biomass. So its utilization is alternative for renewable source of energy. These fuels are
derived by using conventional technologies. The residues and byproduct from sugarcane
milling are useful for the synthesis of ethanol. Oil seed crops like rapeseed, soybean,
sunflower, coconut are valuable feed stock for the biofuel synthesis (Murphy 2012).
Microorganisms use different metabolic pathways with enzymes and co enzymes to
convert feedstock substrate to fuels. Biochemical conversions are usually slow so
alterations are done in the metabolic pathways to produce environmental friendly
chemicals.
Anaerobic digestion mediates the decomposition of organic matters under anoxic
conditions via bacterial species. Agricultural waste, animal manure, industrial waste,
waste, pulp and paper residues, even microalgae are utilized in the anaerobic chambers.
The clean energy carriers are bio-methane, ethanol, bio-hydrogen, bio-butanol and
biodiesel (Ranjan et al., 2013). Bio butanol is considered as the alternative for the gasoline
and diesel. The use of rice straw followed the typical trend of acidogenesis and
solventogenesis. This paper explored the utilization of rice straw for the bio-butanol
synthesis through ABE fermentation. Acid hydrolysis releases the sugar which depicts the
effectiveness of pretreatment. Acetobutylicum species were used for batch fermentation
which converts acids to solvents. Utilization of reducing sugars is more than glucose.
Acetone was produces on the second day of fermentation and ethanol was observed during
the stationary phase of fermentation. The acid hydrolysis of rice straw at high temperature
synthesizes the hydrolysates which could be a substrate for the fermentation. (Lakaniemi
et al., 2013) has discussed effective microalgal biomass anaerobic synthesis of methane,
hydrogen, ethanol, butanol and electricity was possible. Biomass from microalgae can be
an aerobically processed to biofuels. Lipids can be extracted from the cells for the further
synthesis of biodiesel. The deficiency of lignin along with high contents of lipids, starch

18
and proteins make microalgal biomass a promising substrate for anaerobic
microorganisms. Anaerobic biodegradation is split into four main phases: hydrolysis,
acidogenesis, acetogenesis and methanogenesis. Anaerobic digestion is applicable in
digestion of sewage sludge, manure and municipal solid waste. Synthesis of CH4 differ due
to variation in protein, carbohydrate and lipid content and cell wall structure. Retention
times are relatively long to obtain maximum CH4 yields from untreated microalgal
biomass. Anaerobic digestion of microalgal biomass has been conducted both in batch and
in continuously stirred tank reactors. Ethanol can also be produced from microalgae and
microbes especially are Saccharomyces yeast, especially S. cerevisiae and Wild-type S.
cerevisiae. The green microalgae have relatively high content of carbohydrates and are
good candidates for ethanol fermentation.
2.4 Anaerobic digestion for biosynthesis
Anaerobic digestion is also known as fermentation. It is a metabolic process converting
sugars to acids and alcohols by using bacterial and yeast species. Fermentation in the
absence of electron transport chain takes the reduced carbon source like glucose,
carbohydrates and make products like acetate, ethanol etc. Fermentation is anaerobic
digestion that can generates ATP by substrate-level phosphorylation. (Ni et al., 2009)
reviewed the ABE fermentation plants. They observed the capacity of ten plants for the
fermentation of acetone, butanol and ethanol. Number of ABE plants and strains are
available for the synthesis of these solvents but mainly clostridium strains were for
industrial preparation of these solvents. C. acetobutylicum, Clostridium beijerinckii,
Clostridium saccharobutylicum, and Clostridium Saccharoperbutylacetonicum .C.
acetobutylicum and C. beijerinckii are best for acetone and butanol fermentation but C.
saccharobutylicum and C. saccharoperbutylacetonicum are suitable for making these
solvents by utilizing molasses as substrate.
Continuous fermentation system consists of 6 to 8 tanks and fresh substrate is continuously
added into first and second tank and fermentation mash is discharged from bottom. In this
continuous process three stages are generally observed. In the first stage bacteria’s grows
19
quickly and produce butyric acid and acetic acid and hydrogen gas. In second stage acetone
and butanol synthesis is decreasing the acidity and acids are taken up by the cells spores
formation is increased and carbon dioxide formation is increased. In the third stage acetone
and butanol synthesis is decreased along with gas formation. Total time period is 7 to 20
days. A series of distilleries are used to separate different solvents. Evans et al., 1988)
proposed the extractive fermentation to enhance the productivity. It was good extractant
for butanol. Supplementation of glucose and butyrate in the extractive fermentation yielded
a 47% increase in butanol. (Berezina et al., 2011) studied that butanol, Ethanol, acetic
acid and butyric acid can be produced from anaerobic bacteria like clostridium
acetobutylicum. Alcohols and acetone was produced 12.7 to 15 g/ l with 6% wheat flour
medium and synthesis of butanol was 51 to 55%. The cheapest carbon containing substrate
like domestic and agricultural waste or plant biomass is profitable to use. Optimization of
fermentation medium is future goal to achieve larger amount of solvents. Angenent et al.,
2004) reviewed that present society need is less polluted world and low dependency on
fossil fuels. Waste water treatment addresses both these goals. There is prototype shift from
disposing of waste water to utilize it. Charles Mayer studied in 1982 that when clostridium
acetobutylicum grown in a continuous culture with neutral conditions the fermentation
product were acetate, butyrate hydrogen and carbon dioxide. When pH was decreased
below 5.0 the products were acetone and butanol. If 20 to 80 mM of butyric acid was added
at pH 4.3 it shifts the fermentation to solvent formation. The butanol and acetone produced
are consumed at butanol accumulation. Batch cultures were used but the continuous culture
gave better results. Medium was kept anaerobic by passing nitrogen and culture was stirred
at 100rpm. Constant passing of medium was to prevent the bacterial growth in medium
reservoir. Dry weight was measured by weighing the cell suspension on membrane filter.
Glucose was determined by glucose dehydrogenase. Products like ethanol, butanol,
butyrate, acetone and acetate were determined by gas chromatography. Glucose was taken
as a limiting factor clostridium species were grown in continuous culture. The fermentation
results were determined. Acetate and butyrate were in the ratio of 2 to 3. Butanol and
acetone were not detected among the products. Solvents could not be produced at neutral
pH because pH was decreased step wise. The butanol and acetone synthesis can be done in
a continuous way or not. Several cultures reduce the ability of solvent synthesis. Solvent

20
synthesis is not observed when bacteria’s were in continuous culture with pH level 6.5 or
5.7. In addition cultures were unable to sporulate and were weak solvent producers in a
batch process. So solvent synthesis was not supported in chemo stat. chemo stat cultures at
neutral pH forms acids and there is a possibility to change then to solvents by decreasing
the pH and by adding butyrate.
2.5 Anaerobic bio-reactors
Bioreactors are engineered devices to support biologically active environment. Recovery
of energy and appreciated materials somewhat reduce our dependence on fossil fuels and
the cost of wastewater treatment. These strategies produce bioenergy, methane, hydrogen
and small amount of current. Hydrogen can be produced in phototrophic processes but now
they are focusing on chemotrophic processes. Biological methane synthesis from organic
material is useful because of its organic removal with up flow anaerobic sludge blanket
reactor. Round 60% of the treatment facilities worldwide are based on the same reactor
treating the industrial and food processing waste water. Recently continuously- fed
horizontal flow bioreactor have been proved to be best for organic removal rates than the
previous one. The up flow anaerobic sludge blanket reactor (UASB) reactors have some
limitations of suspended solids, granulation and reactor performance (Kalogo et al., 1999)
but it efficiently convert organic compounds in waste water to methane so it can treat
diverse range of industrial waste water (Karim et al., 2003). Anaerobic Sequencing
Batch Reactor (ASBR) reactors were developed to control high suspended solids in waste
water. It was single vessel bioreactor, waste water fed into the reactor with biomass when
both are mixed the biomass settles down and effluent is withdrawn from the reactor. This
type of reactor is useful for the treatment of agricultural waste and swine waste (Angenent
2002). The methane produced by this has been used as a fuel source usually for heating or
electricity synthesis. Methane is now also used for the synthesis of syngas and biodiesel
too. Very interesting synthesis by dark fermentation is biological hydrogen synthesis.
Efforts have been made to get considerable amount of hydrogen. Bioconversion can be
increased by coupling of two bioreactors, fermentation, and aerobic conversion of fatty
21
acids. The conversion of food and agricultural waste to the biochemicals and its separation
and purification costs are so high.
Recently advanced purification technologies short separation routs like lactic acid
separation from fermentation broths has been employed by anionic fluidized bed columns.
Supercritical fluid technology is used for separation of compounds from cultures. Usually
separation is done by using nontoxic, nonflammable solvents and achieving product
crystallization. Hence post treatment facilities should be integrated to bioprocessing
operations. (Ezeji et al., 2010) studied about anaerobic bacteria with wide range of carbon
sources like glucose, galactose, cellobiose, xylose and mannose for the synthesis of
carboxylic acid and solvents like butanol, acetone and ethanol. Solvent response
mechanisms involve energy dependent efflux pumps which can export the toxic chemicals
from these microorganisms (Ramos et al., 2002 and Ingram 1990). These efflux pumps
response to the stress of toluene in E.coli, Pseudomonas aeruginosa. Scientists
investigating the improved gene expression in ethanol tolerance and the yield of ATP, over
250 genes are implicated in solvent tolerance.
2.6 Metabolic engineering to enhance product yield
Metabolic engineering is optimizing genetic and regulatory processes within the cells for
the synthesis of certain substances. A strain development method in C. acetobutylicum was
introduced in 1994 by (Aguilera et al., 2006 and Mermelstein et al., 1994) utilizing a
plasmid vector system for introducing foreign DNA into clostridium by electro
transformation. The genetic material transfer by this technique is widely used to observe
the solvent tolerance in clostridia species. (Muller 2003) reviewed that anaerobes have
respiratory system uses oxygen but they use NO3-, NO2
- and Fe (III) in the absence of
oxygen. This is totally different in anaerobes because they obtain energy only by
fermentation. So energy gained by anaerobe is small than by aerobes. These organisms rely
on phosphorylation and one mole of hexose yields 4 moles of ATP. Other organisms can
increase (Atsumi et al., 2008) studied the biofuel synthesis from Escherichia coli.

22
According to the ‘Renewable Fuels Association’ ethanol is the important biofuel. Its
synthesis capacity and the demand for bio ethanol are increasing gradually. Ethanol has
low energy density 30% and its incompatibility with existing fuel infrastructure. Other
biofuels aims to circumvent the problems of ethanol. Ethanol cannot be distributed in the
existing conduit because of its high percentage blends with gasoline due to high tendency
of absorbing water. The second problem is higher vapor pressure which is threat to air
quality. Higher carbon chains can circumvent these problems so advance fuels involve
longer chains. Higher chain fuel compounds are not produced biologically in large
quantities except n-butanol by Clostridium species.
It is believed that with metabolic engineering Escherichia coli or Saccharomyces
cerevisiae can produce such type of fuels. Isopropanol can also be used to esterify with
various fats and oils in place of methanol. Its addition lessen the tendency of biodiesel to
crystallize at low temperatures. Isopropanol is usually made from petroleum is widely used
for plastics formation after dehydration to propylene. Isopropanol is produced by following
the acetone pathway. Acetone synthesis in E.coli has been accomplished by introducing
four genes from clostridium acetobutylicum ATCC 824, thl, ctfAB, adc coding acetyl-CoA
acetyltransferase, acetoacetyl-CoA transferase, and acetoacetate decarboxylase. This strain
was helpful in producing 5.4g/L acetone. So this proved that E.coli could be best host for
Isopropanol and acetone synthesis. In the synthesis of Isopropanol a secondary alcohol
dehydrogenase (ADH) is required for the conversion of acetone to Isopropanol in an
NADPH-dependent reaction. Clostridium beijerinckii was compared to Clostridium
brockii. The combination of these genes produced 4.91 g/L with 0.41 g/ (L h) products
which is higher than the native Clostridium strains. Butanol is hydrophobic and quite
similar to that of gasoline. It can completely take the place gasoline or by mixing with
gasoline at any ratio. Vapor pressure of butanol is quite less than ethanol. Butanol is
produced by C. acetobutylicum with pathway similar to acetone and butyrate pathways as
(Zheng et al., 2009) produced butanol by engineered pathway in microbes. Genes involved
in butanol synthesis was cloned with E.coli. With this process they produced 139g/l of
butanol under anaerobic conditions.

23
Further work is required to optimize culture conditions and coordination of multigene
expression. (Charles et al., 1986 and Hubert et al., 1982) investigated about the
metabolic engineering of E.coli for the synthesis of biofuels The host bacteria A. baylyi
were lacking of the ability to produce ethanol because they are aerobic bacteria.
Introduction of some genes to produce FAEE proved best for other bacteria to exhibit this
ability. (Woods et al., 1986) C. acetobutylicum also produces by products such as ethanol,
butyrate and acetone. A redox reaction which release CO2 during the synthesis of butanol
from glucose. M. elsdenii and S. coelicolor genes gives much lower synthesis of 1-butanol.
In this investigation they found that host pathways that compete with n-butanol pathways
for NADH and acetyl-CoA were deleted. E. coli produce threefold butanol more than wild
type and by reducing the amount of acetate, ethanol and succinate. These results were not
as high as were expected but they demonstrated the feasibility of metabolic engineering
approach. ( Atsumi et al,) diverted the metabolic intermediates to higher alcohols by taking
advantage of this capacity in the host E. coli by inserting the last two steps in the Ehrlich
pathway.2-ketoacids are intermediates in amino acids formation and he converted it to
aldehyde by 2-ketoacid decarboxylase and then to alcohols by ADH. So the 2-ketoacids
improve the productivity of alcohols.
Biodiesel is a substitute for diesel fuel extracted from palm, soybean and converted to
biodiesel by transesterification. The availability of cheap vegetable oil is insufficient so
E.coli has been engineered to produce biodiesel oil. To produce biodiesel from E.coli,
esterification of ethanol with acyl moieties was done. The engineered E.coli produced
FAEE concentration of 1.30 g/L by fed-batch method with glucose and oleic acid.
Isoprenoids are metabolites synthesized from isoprenyl pyrophosphate (IPPP) and
dimethyl allyl Pyrophosphate (DMAP) in animals, plants and bacteria (Sacchettini et al.,
1997). These molecules are synthesized either by mevalonate pathway or by
methylerythritol pathway. Only trace amount of isoprenoids are produced from natural
organisms. But engineered E.coli produced isopentenol concentration of 110 mg/L. of fuel.
(Bermejo et al., 1998) studied that a synthetic acetone is composed of four Acetobutylicum
genes coding for the acetoacetate decarboxylase, coenzyme A transferase, and thiolase was
introduced into E.coli.

24
Acetone synthesis represented that there is a reduction of acetic acid level. Different strains
are different in their growth and acetate metabolism and resulted in different concentration
of acetone but glucose fed cultures produced 150% increased acetone. With the addition of
sodium acetate there was further increase in acetone synthesis. (Finch et al., 2011) studied
the metabolic changes in clostridium acetobutylicum. They produce two voltage peaks.
Analysis designated that these dual voltage peaks were with glucose metabolism. The first
peak was related with acidogenic metabolism along with acetate and butyrate synthesis.
And other peak was related with solventogenic metabolism with acetone and butanol
synthesis. Since MFCs can process waste and generate power, they can increase the
efficiency of municipal or military systems while preventing environmental contamination
from untreated waste (Logan et al., 2008) the growth and hydrogen formation from 50 to
100% but it enhance the glucose uptake by 300%. So solvent formation is triggered to
another electron flow route.
2.7 Synthesis of organics by greenhouse gases
Clostridium ljungdahlii was able to convert CO to acetate and ethanol by following the
acetogenic pathway (Vega et al., 1989). The significant aspect of this fermentation was to
study the bioconversion of syngas to commercial fuel. A strictly anaerobic bacterium, C.
Ljungdahlii was utilized for the fermentation. It was observed that ethanol concentration
was four times greater for pressurized bioreactor. However (Chang et al., 2001) produced
ethanol by Eubacteriumlimosum KIST612 in a bubble column bio reactor. The working
volume was 0.21and gas volume was 80ml/ min. the maximum conversion of CO was 60%.
Acetate synthesis by Acetobacterium BR-446 was increased at 1.6 atm. pressure. Acetic
acid yield was 86% for CO2 consumption and 90% for H2 consumption (Morinaga et al.,
1990). Vega et al used Peptostreptococcus products U-1in a batch process for
bioconversion of carbon monoxide to acetate. The acetate yields at the lowest CO partial
pressure of 0.22 atm and at the highest CO partial pressure of 1.72 atm were 0.25 and 0.19
g acetate per gram CO. batch system is a closed system can maintain the cell viability for
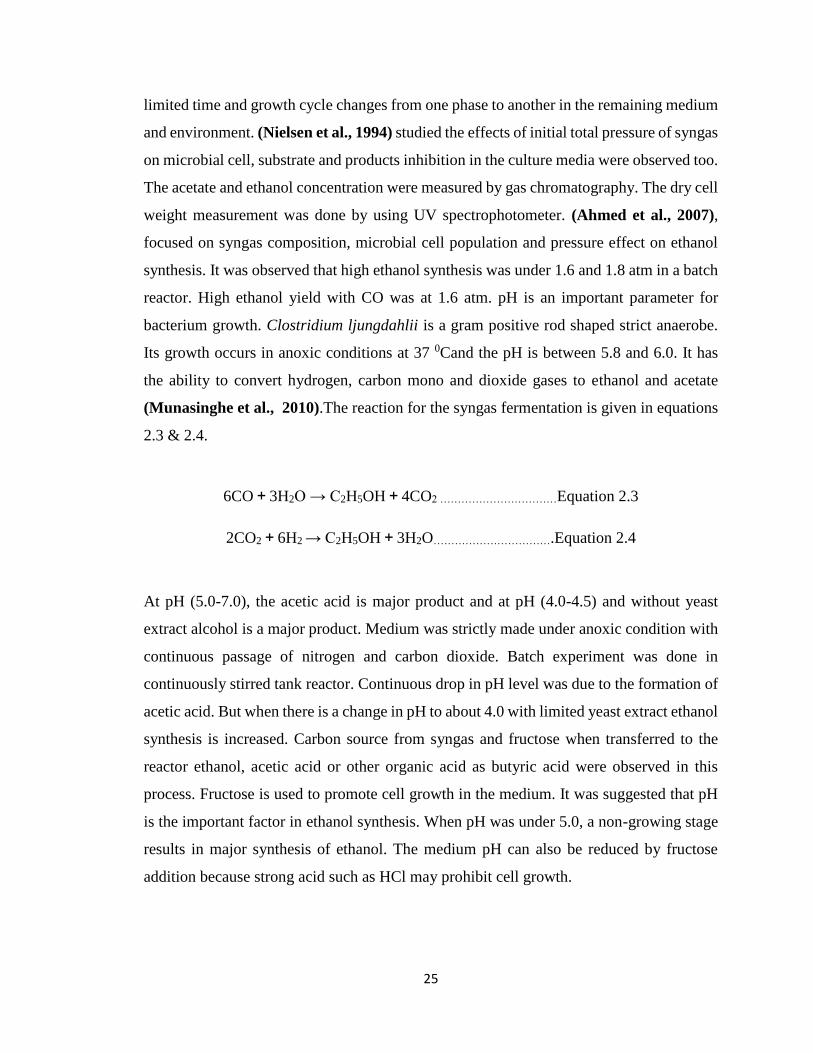
25
limited time and growth cycle changes from one phase to another in the remaining medium
and environment. (Nielsen et al., 1994) studied the effects of initial total pressure of syngas
on microbial cell, substrate and products inhibition in the culture media were observed too.
The acetate and ethanol concentration were measured by gas chromatography. The dry cell
weight measurement was done by using UV spectrophotometer. (Ahmed et al., 2007),
focused on syngas composition, microbial cell population and pressure effect on ethanol
synthesis. It was observed that high ethanol synthesis was under 1.6 and 1.8 atm in a batch
reactor. High ethanol yield with CO was at 1.6 atm. pH is an important parameter for
bacterium growth. Clostridium ljungdahlii is a gram positive rod shaped strict anaerobe.
Its growth occurs in anoxic conditions at 37 0Cand the pH is between 5.8 and 6.0. It has
the ability to convert hydrogen, carbon mono and dioxide gases to ethanol and acetate
(Munasinghe et al., 2010).The reaction for the syngas fermentation is given in equations
2.3 & 2.4.
6CO+3H2O → C2H5OH+4CO2 ……………………………Equation 2.3
2CO2+6H2 → C2H5OH+3H2O…………………………….Equation 2.4
At pH (5.0-7.0), the acetic acid is major product and at pH (4.0-4.5) and without yeast
extract alcohol is a major product. Medium was strictly made under anoxic condition with
continuous passage of nitrogen and carbon dioxide. Batch experiment was done in
continuously stirred tank reactor. Continuous drop in pH level was due to the formation of
acetic acid. But when there is a change in pH to about 4.0 with limited yeast extract ethanol
synthesis is increased. Carbon source from syngas and fructose when transferred to the
reactor ethanol, acetic acid or other organic acid as butyric acid were observed in this
process. Fructose is used to promote cell growth in the medium. It was suggested that pH
is the important factor in ethanol synthesis. When pH was under 5.0, a non-growing stage
results in major synthesis of ethanol. The medium pH can also be reduced by fructose
addition because strong acid such as HCl may prohibit cell growth.

26
2.8 Role of Metabolic Pathways in biochemical synthesis
Methanogenic archaea used to reduce CO2 to CH4 and membrane bound enzymes that
transfer Na+ and H+ which are used to drive the synthesis of ATP by ATPase. Acetogens
use the same path way for CO2 reduction. Energy conversion pathways are different in
sodium and hydrogen ions organisms. Recently it is observed that carbon dioxide is not the
electron sink in acetogens but alternate routes are also present. Organisms that can reduce
CO2 to acetate by suing acetyl coenzyme or Wood-Ljungdahl pathway are called
acetogens. This metabolic capability differentiates acetogen from other organisms that
utilize other path ways to synthesize acetate. Acetogens are anaerobic bacteria which
convert C1 compounds like H2-CO2, CO, or formate to acetate. Acetogenesis produce
billion of tons of acetate each year. Acetogens can grow on different substrates like
hexoses, C1 and C2 compounds. This fermentation is also called as homoacetogenesis. The
Wood-Ljungdahl pathway in anaerobic bacteria is used for both anabolism and catabolism.
CO2 is reduced to formate by formate dehydrogenase, and then formate is bound to
tetrahydrofolate to form H4F. Water is split off and resulting methylene group is reduced
to methyl –H4F. Acetate is produced from acetyl-CoA by phosphotransacetylase and
acetate kinase. One mole of ATP is produced and this ATP is consumed in the formyl-H4F
synthetase reaction. So net gain in ATP is zero. (Gregory et al., 2004) reported that
Acetogens are divided into two groups: the H+-dependent acetogens with Moorella
thermoacetica, the Na+ dependent acetogens with Acetobacterium woodii. The Na+
dependent acetogens does not contain cytochromes but have membrane and follow the
Wood-Ljungdahl pathway. The methanogenic archaea which are used in the path way of
Wood-Ljungdahl they depend on Na+ for CO2 reduction. So it is obvious to look for Na+
dependence of acetogenesis. A. woodii used as a model system to unravel the molecular
basis of the Na+ dependence. Although the mechanisms of energy conservation in
acetogens are still not clear but A. woodii is one in which entire energetic is based on a Na+
across the cytoplasmic membrane and represents first ATPase which combines features of
bacterial and eukaryal enzymes. This enable the organism to regulate its cellular energy
metabolism depends on its growth conditions. Moorella thermoacetica uses nitrate as an
electron acceptor the bioenergetics, and regulatory enzymology, processes involved in the

27
utilization of alternative electron acceptors presents challenge for future. The electron
transport and mechanism is still needs to be solved. Genome analyses are a way toward
understanding of energetic, biochemistry of acetogens. (Byung et al., 1984) studied the
methyl viologen-linked hydrogenase activity of Clostridium acetobutylicum but did not
explain the dehydrogenase activity of carbon monoxide. They found that addition of CO
with increasing pressure inhibited the both growth and hydrogen synthesis by C.
acetobutylicum. Glucose fermentation balance of C. acetobutylicum is dramatically altered
by CO addition. It diverts carbon and electron toward the synthesis of ethanol and butanol
and took them away from H2, CO2, and acetate and butyrate synthesis. The butanol
concentration can be increased from 65 to 106 mM that is increase by 31% when
fermentation was maintained at pH 4.5 and gassed with 85% N2-15% CO, they focused on
three topics, improvement in strain tolerance, understanding of the physiological
relationships between organic acid metabolism and the initiation of solvent synthesis and
continuous fermentation technology. Another important aspect of fermentation is
improvement of solvents produced from a given amount of substrate. The end products of
C. acetobutylicum are formed by pyruvate metabolism. CO addition could inhibit growth
and fermentation of C. acetobutylicum alters by the formation of homo lactic acid. The
purpose of this study was to determine whether exogenous CO addition could inhibit
hydrogenase activity and can enhance solvent synthesis from saccharide fermentations as
a result of decreasing acetate, hydrogen and butyrate synthesis by C.acetobutylicum.so
addition of CO can modulate hydrogenase activity of C. acetobutylicum. The practical
utility of this method improved butanol synthesis from starch. (Wood et al., 1984) studied
about the role of carbon monoxide dehydrogenase in autotrophic path way by acetogenic
bacteria. This pathway involves the reduction of CO2 to formate and its conversion to the
methyltetrahydrofolate. The function of the CO dehydrogenase is to reduce the cobalt of
the corrinoid enzyme to Co+ which is used for methyl acceptor. The dehydrogenase is not
directly involved in the formation of C intermediates. All enzymes required for the
synthesis of acetyl-CoA from CO and methyltetrahydrofolate or from
methyltetrahydrofolate and the carboxyl of pyruvate have now been purified. With these
purified enzymes it is found that CO dehydrogenase is essential for acetyl-CoA synthesis
(Figure 2.2). Furthermore, acetyl-CoA was synthesized using the C1-CO dehydrogenase

28
complex. Thus it is conclusive that CO dehydrogenase has a direct role in the formation of
the carboxyl of acetyl-CoA (Daniell et al., 2012).
Figure 2.2 Role of CO in the formation of acetyl-CoA
Numerous techniques has been utilized to enhance the biofuel productivity but most of
them leading to the consumption of expensive raw materials, catalysts, electrodes, energy
and high temperatures etc. making the processes bit difficult to acquire. Various microbes
cause severe health problems because of their contagious and infectious nature.
2.9 Bio-electrochemical synthesis
Numerous solvents, biofuels and chemicals are synthesized by acetogens by bio-
electrochemical synthesis, fermentation, electrochemical synthesis, genetic mutations and
by metabolic pathways. Bio-electrochemical synthesis consumes electrons from electrode

29
to reduce greenhouse gases like carbon dioxide to extracellular organic valued products.
It’s a potential strategy for capturing the energy in carbon bonds to distributed products
like transportation fuels. Nevin et al., 2011) reported that the acetogens, Sporomusa ovata
has the potential for electrosynthesis. Other acetogenic bacteria like Clostridium
ljungdahlii, Clostridium aceticum, and Moorella thermoacetica consumed current and
produce organic acids. Along with primary product acetate, secondary products like but,
2-oxobutyrate and formate were also formed the identified product of electrosynthesis. It
was reported that C. aceticum. S. sphaeroides, C. ljungdahlii, and M. thermoacetica had
high proficiencies to consume electrons and recovered them into renowned products but
Acetobacterium woodii has not ability for current consumption. Artificial form of
photosynthesis is powered by solar energy where autotrophs renovate water and carbon
dioxide to organic covalent compounds. Bio-electrochemical synthesis over biomass for
the synthesis of fuel by harvesting solar energy is 100 fold higher in efficiency. This avoids
the intensive agriculture and environmental degradation. Microbial electrosynthesis have
the ability to derive electrons from electrodes for the reduction of terminal electron
acceptor. The capacity of electron transfer from electrode to cell is in less consideration.
Geobacter species are capable of reducing the electron acceptors like nitrates, formate and
chlorinated solvents. Anaeromyxobacter dehalogens can reduce fumarate and
dehalogenate 2- chlorophenol. Undefined microbial consortia also contains
microorganisms have the ability to reduce electron acceptors like oxygen with electron
donor electrodes. Methanobacterium palustre reduce carbon dioxide to methane but there
is difficulty in direct electron transfer in methanogens because methanogenesis can produce
hydrogen at low potential. Geobacter and Anaeromyxobacter species can accept electrons
from graphite electrodes for the reduction of fumarate to succinate (Gregory et al., 2004),
U (1V) reduction (Gregory et al., 2005) or reductive dechlorination (Strycharz, et al.,
2010). But it was difficult to verify (Villano et al., 2010) because of the synthesis of
hydrogen required for methanogenesis. Sporomusa ovata has the tendency to derive
electrons from graphite electrodes for the reduction of carbon dioxide to acetate. S.ovata
forms biofilm on the electrode surface and has potential for current consumption to
synthesize acetate and small quantity of oxobutyrate. Acetate formation is through Acetyl
Co-A. (Nevin et al., 2011) studied about the electrodes as electron acceptors to promote

30
the anaerobic degradation of pollutants. Solar energy or other electrical energy source can
provide electrons to these microorganisms for the formation of biofuels and numerous
other valuable chemicals from carbon dioxide. Electrodes can accept electrons to support
anaerobic oxidation of organic compounds or can supply electrons for the respiration of
microorganisms. The most promising application is the formation of bio-cathode and
supply of electrons to microorganisms for useful processes. Indirectly electrons can be
transferred from electrodes to microorganisms by the reduction of electron shuttle
molecules or via the hydrogen gas. Anodes can also provide electrons to cathode at low
potential. Acetogenic microorganisms utilize hydrogen as electron donor to reduce carbon
dioxide for acetate synthesis as end product along with small amount of other organic acids
and alcohols. The cathode biofilms of acetogens prolonged their activity for months
without forming thick biofilms. Acetyl Co-A is the building block for the synthesis of wide
variety of desirable organic products and is the central intermediate in the acetate synthesis.
With genetic engineering carbon and electron flow can be diverted toward butanol
synthesis. Pure culture studies have focused on Geobacter and Shewanella species which
can utilize oxygen as an electron acceptor. Micro- organisms can catalyze proton reduction
to hydrogen gas with hydro-genases by accepting electrons from cathode. In Shewanella
oneidensis extracellular electron transfer is different. Electron transfer is through
conductive pilli. Electron transfer from Geobacter to anode is faster so results in higher
current densities. (Rabaey et al., 2011) reviewed that Microbial electrosynthesis uses
electrical energy for reducing power of microorganisms. In bio-electrochemical
progression microorganisms are used to catalyze oxidation or reduction reactions at
respective electrodes. The best example is MFC in which the electrical current is provided
by microbes to electrode for the reduction of organic substrate. Recently microbial
electrosynthesis has emerged as oxidizing and reducing power for biochemical synthesis
via electricity. In the electrochemical cells microbial cells are used as biocatalysts for
synthesis reactions. So electric current is either supplied or extracted from microorganisms
for sustainable biochemical synthesis. The conversion of carbon dioxide to acetate and
fumarate to succinate are examples of reductive processes while conversion of glycerol to
ethanol is oxidative process. Electrical energy is used to drive carbon dioxide fixation or
formation of acetyl-CoA for the synthesis of target compounds. Instead of Wood Ljungdahl

31
pathway the Calvin-Benson-Bassham cycle is leading to fermentable substrate from
electricity and carbon dioxide. So there is a hybrid metabolism when effective charge
transfers toward the cell. The electron transfer between cell and electrodes are either by
direct contact of biofilm on electrode or by mediators toward the microorganisms. Good
example of autotrophic bio synthesis is butanol synthesis by homoacetogens by using
electric current. The advantages of microbial electrosynthesis are the use of electricity for
bio synthesis and are independent of substrates need arable land and their synthesis
densities are immense.
2.10 Extracellular electron transfer (EET)
In bio-electrochemical synthesis cell the basic challenge is to transfer electrons into
microbes to get industrial level products. Three mechanisms reported are electrolysis of
water, soluble electron mediators and electron transfer directly by C-type cytochromes and
via conductive pili or nanowires
The shuttling of electrons from reductive cathode through electrolysis of water is to
produce hydrogen gas. The cathodic electrons to water form hydrogen by the following
equation 2.5.
2H2O +2e- → H2 +2OH-……………………………….Equation 2.5
The major drawback faced in this system was that large overpotential requiring large
energy input and low solubility of hydrogen reduces the electron availability in solution.
Significant transfer of electron from bacteria to electrode is by four pathways, the reduced
products, the electron shuttles, c-type cytochromes and via conductive pili or nanowires.
2.10.1 Electron transport by fermentation products
Bacterial fermentation products are oxidized an aerobically at the anode to Provide
electrons to anode like in yeast. These products include ammonia, hydrogen, and hydrogen
sulphide and alcohols (Davis et al., 2007). But it was inefficient technique because of slow
reaction of these fermentation products with anode and sometime electrode material were

32
proved to be foul with these products. One reduced product is H2S which can produce
power in MFC by utilizing sulphate reducers. Sulfate reducing bacteria in marine sediments
has ability for the reduction of sulfate compounds to HS-2 or S-2 and their oxidation product
is So. Eight electrons are required for sulphate reduction to sulphide and its oxidation to So
release only two electrons to electrode proves to be an inefficient method. Another example
is of Desulfovibrio species which oxidize their electron donors incompletely to acetate a
limiting efficiency (Lovley et al., 2006).
2.10.2 Electron transport by mediator
Extracellular electron transfer is the ability of bacteria to utilize electron acceptors or donor
external to the cell. The shuttling of electron for industrial application is the use of electro
active molecules that can be reduced or oxidized by bacteria. The oxidized shuttle can be
reduced by electrode and serve as electron donor for various bacteria. These mediators
lessen the necessity of direct contact between electrode and bacteria. Flavins, neutral red,
anthraquinone-2, 6-disulfonate and cobalt sepulchrate are mediators used by bacteria (Von
et al., 2008 and Park et al., 1999). Microbes like Escherichia coli, Pseudomonas,
Bacillus and Proteus are incapable to shuttle electrons from the internal metabolism to
outside the cell. These microbes utilized artificial mediators like thionine, neutral red, Iron
chelates and phenothiazine, thionine, potassium ferricyanide etc. These mediators induce
microbes to produce the electrochemically active reduced products, enter the cell
membrane and capture the electrons from central cell metabolism. In a reduced form they
exit from the cell and transfer these electrons to the electrode and become oxidized to
capture further electrons
Previous researches have shown that along with effectiveness of electron shuttle there are
few disadvantages as well. These mediators are highly toxic to microorganisms like neutral
red and methyl viologen have impact on bacterial viability and diffusion limitation also
affects the rate of synthesis. Finally large quantity of mediator to industrial systems is
costly and impractical. Most feasible way is to engineered the microbes to form their own
mediators with regards to product formation (Thrash et al., 2008). It has been investigated
that few mediators like neutral red capture electrons from NADH and reduced by enzyme
hydrogenase. Proteus vulgaris is another example for transfer of electrons to electrode by
oxidation of sucrose to carbon dioxide where thionine is acting as mediator. Shewanella
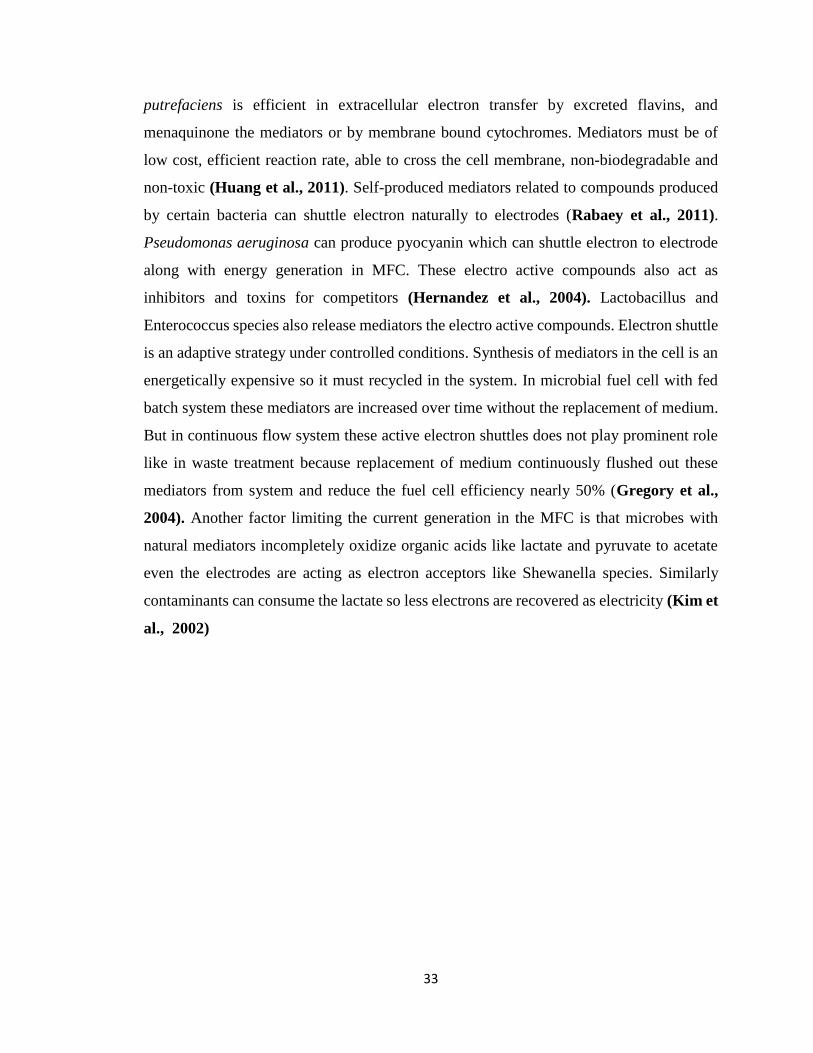
33
putrefaciens is efficient in extracellular electron transfer by excreted flavins, and
menaquinone the mediators or by membrane bound cytochromes. Mediators must be of
low cost, efficient reaction rate, able to cross the cell membrane, non-biodegradable and
non-toxic (Huang et al., 2011). Self-produced mediators related to compounds produced
by certain bacteria can shuttle electron naturally to electrodes (Rabaey et al., 2011).
Pseudomonas aeruginosa can produce pyocyanin which can shuttle electron to electrode
along with energy generation in MFC. These electro active compounds also act as
inhibitors and toxins for competitors (Hernandez et al., 2004). Lactobacillus and
Enterococcus species also release mediators the electro active compounds. Electron shuttle
is an adaptive strategy under controlled conditions. Synthesis of mediators in the cell is an
energetically expensive so it must recycled in the system. In microbial fuel cell with fed
batch system these mediators are increased over time without the replacement of medium.
But in continuous flow system these active electron shuttles does not play prominent role
like in waste treatment because replacement of medium continuously flushed out these
mediators from system and reduce the fuel cell efficiency nearly 50% (Gregory et al.,
2004). Another factor limiting the current generation in the MFC is that microbes with
natural mediators incompletely oxidize organic acids like lactate and pyruvate to acetate
even the electrodes are acting as electron acceptors like Shewanella species. Similarly
contaminants can consume the lactate so less electrons are recovered as electricity (Kim et
al., 2002)
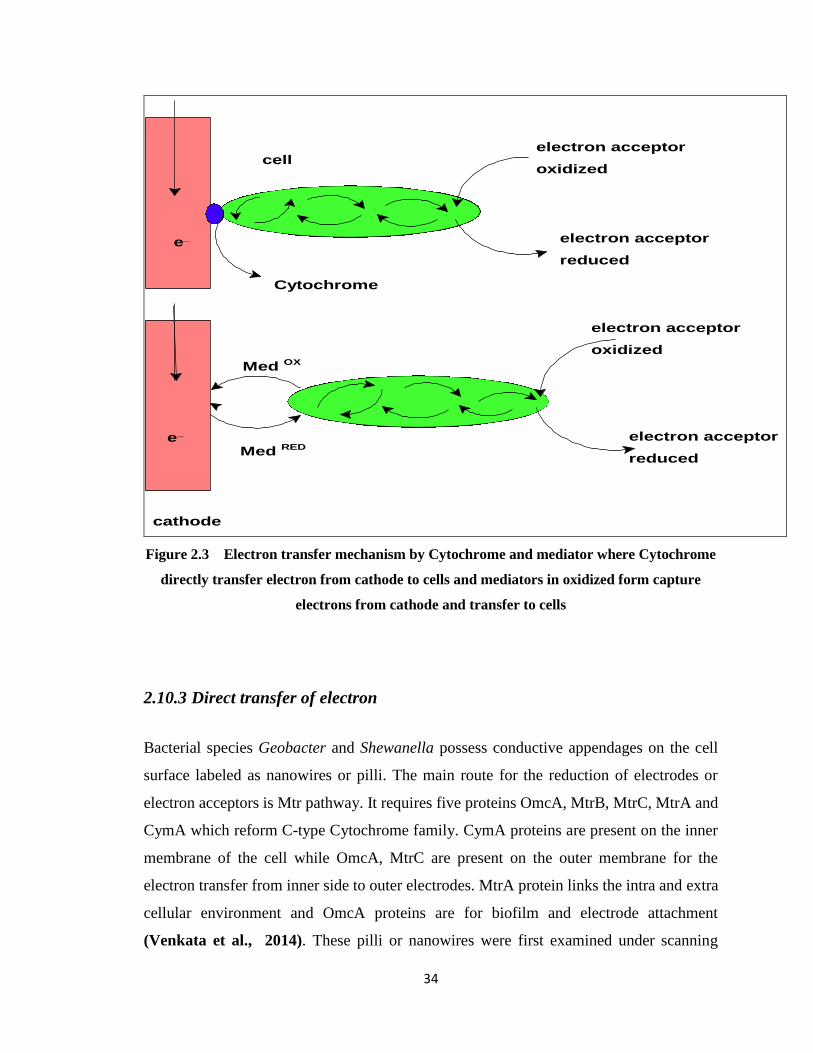
34
electron acceptor
oxidized
electron acceptor
reduced
electron acceptor
oxidized
electron acceptor
reduced
Med OX
Med REDe_
e_
cathode
cell
Cytochrome
Figure 2.3 Electron transfer mechanism by Cytochrome and mediator where Cytochrome
directly transfer electron from cathode to cells and mediators in oxidized form capture
electrons from cathode and transfer to cells
2.10.3 Direct transfer of electron
Bacterial species Geobacter and Shewanella possess conductive appendages on the cell
surface labeled as nanowires or pilli. The main route for the reduction of electrodes or
electron acceptors is Mtr pathway. It requires five proteins OmcA, MtrB, MtrC, MtrA and
CymA which reform C-type Cytochrome family. CymA proteins are present on the inner
membrane of the cell while OmcA, MtrC are present on the outer membrane for the
electron transfer from inner side to outer electrodes. MtrA protein links the intra and extra
cellular environment and OmcA proteins are for biofilm and electrode attachment
(Venkata et al., 2014). These pilli or nanowires were first examined under scanning

35
tunneling microscopy (STM). These nanowires were extremely thin with nanometer or less
in diameter. Bacterial nanowires are conductive appendages function as conduits for
electron transport between different members of biofilm layers and are able to carry
electrons from cell to the surface to extracellular electron acceptors. Nanowires produced
by G.sulsurreducens and Shewanella oneidensis are quite different. In Shewanella
oneidensis these nanowires are like thick cables may be the bundle of several conductive
wires whereas in G.sulsurreducens these nanowires are quite thin. Some Photosynthetic
bacteria like oxygenic Cyanobacteria have ability to produce nanowires. They can produce
electricity in MFC in light. It was studied that Shewanella oneidensis are conductive and
can transfer electron at rate 109 per second along with nano fabricated electrodes and 100
mV potential (Naggar et al., 2010). There is a debate on the nanowires of
G.sulsurreducens researchers are considering them as 1V pili made up of C-type
Cytochrome and PilA monomers and their conductivity is because of amino acids. Other
researchers consider nanowires as Cytochrome which connect the biofilm on electrode
(Reguera et al., 2005). Geobacter sulfurreducens with c-type cytochromes can imparts
capacitance to biofilms, which has comparison to synthetic super capacitors. This
investigation leads to effective and sustainable new capacitor designing. A recent
investigation about PilA has shown that they are not only for scaffolding electron but also
for their transport (Vargas et al., 2013). When the amino acids were replaced with aniline
they observe the decrease in conductivity. Another microorganism Pelotomaculum
thermopropionicum produce thick appendages like pilli. These appendages can relocate
electrons among bacteria like fermentative bacteria which regenerate NADH. Similarly
syntrophic methanogenic and sulfate reducing co-cultures have revealed the interspecies
electron transfer. Still detailed investigations are required for proper understanding of
electron transfer mechanism. So pili are capable of electrons transfer across the multilayer
biofilm. It was detected that in G.sulfurreducens can make contact with electrode for
electron conduction by 20um or long pili. G.sulfurreducens can make biofilms of 40 to 50
um thickness at anode so tangled pili transfer electron from cell to cell and produce nano
power network (Reguera et al., 2006).

36
CymA
MtrA
e_
MtrB
OmcA MtrC
electrode
Outer membrane
Inner membrane
CytoplasmNADH
NAD+
Peroplasm
___ _electrons
__
electron acceptor
__
Figure 2.4 4 Mtr respiratory pathway and schematic electron flow from inner membrane
proteins CymA to outer membrane proteins OmcA and MtrC and then to electrode
2.11 Electron transfer from electrode to microorganisms
The reactors studied for straight transfer of electrons from electrode to cells are termed as
electrotrophic reactors where generally the source of electrons is water. The cathode is
poised at negative potential of -400mV which is high enough for hydrogen synthesis and
low to support the anaerobic respiration. Anode and cathode compartments are separated
with selective proton exchange membrane (PEM) to limit the diffusion of oxygen.
Electrons derived from anode chamber with the synthesis of protons and oxygen. Electrons
transferred to cathode by external system and protons by proton exchange membrane.
Geobacter metallireducens can capture electron from cathode for reduction of nitrate to
nitrite. Similarly G.sulfurreducens can capture electron for fumarate reduction to succinate.
The transfer of electron to protons produce hydrogen which is captured by Geobacter
species but it is ruled out because the electrode is supplied with potential which is high for

37
hydrogen synthesis and Geobacter metallireducens is unable to use hydrogen and in
G.sulfurreducens genes for hydrogen uptake have been deleted. Further research
evaluation for transfer of electron from electrode is high research priority (Derek et al.,
2011).
The phenomenon of electron transfer from electrode to cells is still unclear when electron
acceptors are reduced to the inner side of cytoplasm. The electron acceptors consume
protons to reduced end products and proton consumption in the cytoplasm create a proton
gradient across the inner membrane (Nevin et al., 2010a). Geobacter species make quite
thin biofilms at cathode for consumption of electrons whereas biofilms at anode are quite
thick for current generation. Gene expression are quite different in both current producing
and current consuming cells. This suggests that route for transfer of electron from cells to
anode is quite different from transfer of electrons from cathode to cells (Strycharz et al.,
2011).
Figure 2.5 Transfer of electron from cathode to electroactive cells for fumarate, nitrate
and carbon dioxide reduction to succinate, nitrite and acetate respectively
But fortunately there are more way outs of transferring the direct electrons to electroactive
cells and it depends on the direct interaction between bacteria and electrode either by
conductive appendages or membrane bound proteins (Lovley et al., 2012). It was first
demonstrated by pure culture bacteria Geobacter metallireducens in direct association with
cathode along with reduction of nitrate to nitrite (Gregory et al., 2004). There was direct

38
transfer of electrons from electrode to Geobacter metallireducens. Few more examples are
including Anaeromyxobacter dehalogenans, Geobacter lovleyi and Sporomusa ovate,
(Strycharz et al., 2010, Nevin et al., 2010 and Strycharz et al., 2008).
Bio-electrochemical synthesis uses electrical energy as a source of reducing power for
microorganisms which can be easily derived from solar and wind sources. Microbially
derived products are replacing pharmaceuticals, polymers and other commodities. In this
context microbes are provided with energy rich feedstock like sugar, carbohydrates and
other energy rich substances for the synthesis of bio-products making this process costly.
For example butanol synthesis from glucose requires 3 kg glucose per kg butanol. For the
synthesis of fermentable substrate arable land water and nutrients are required and this
poses an economic constraint. The electrochemical synthesis requires basic cell,
Potentiostat and electrodes. Electrolytic conditions like good electrolyte and electrodes
which provide the favorable electron transfer properties and maximize the activation
energy for side reactions. The basic drawback in electrochemical synthesis is the use of
expensive electrodes which corrode quickly in acidic and basic electrolyte and need to be
replaced. The use of inert electrodes like platinum, gold and silver enhance the overall cost
of the reaction. Chemical synthesis requires high temperature which results in the
consumption of fuel or electrical energy thus enhance the cost and temperature of the
surroundings but bio-cathode formation is a major solution for this problem.
Bio-electrochemical treatment is recent and advance technique for the synthesis of biofuels
and biochemicals. Fermentative and respiratory pathways often need additional electrons
for desired products. Bio-electrochemical synthesis use microbes to catalyze the redox
reactions at the electrodes like microbial fuel cell. It has emerged as an alternative option
to provide the redox power via electricity for valuable products. Hence electric current
stimulates the biochemical synthesis. Autotrophic bacterial species has potential to utilize
greenhouse waste gases like carbon dioxide, carbon monoxide, hydrogen and electrons for
biochemical conversions at low temperature. Examples are the synthesis of acetate,
butyrate from CO2. Use of environment friendly microbes, like C. ljungdahlii, S.ovata and

39
C.necator, biocathode development and waste gases as substrates has made this study
attractive for new researchers. Low cost electrodes like carbon cloth and stainless steel are
cost effective. So power synthesis has led to renewed interest in energy storage or
conversion technologies for transport and storage issues with electrical energy. Bio-
electrochemical synthesis is in its infancy but can prove to be a new approach for the
conversion of electrical energy to chemical energy. The basic principal of bio-
electrochemical cell is represented in figure 2.6. The cell with anode and cathode
compartment separated by proton exchange membrane. A simplified bio-reactor with DC
power supply was employed to provide electron instead of hydrogen to electroactive cells
for the reduction of carbon dioxide to volatile fatty acids, alcohols and polyesters. Where
as in previous studies Potentiostat was exploited for the power supply was difficult to
handle on pilot scale. Low cost substrates like molasses and waste greenhouse gas like
carbon dioxide was attractive and effective strategies.
Figure 2.6 Bio-electrochemical cell with bio-cathode and power supply for the synthesis
of bio-fuels

40
In current study, a specific method was designed to initiate anaerobic autotrophic bio-
cathode centered on heterotrophic pre-augmentation. The enrichment of bio-cathode for
autotrophic electrotrophs for biofuel synthesis provides a simplified method to isolate
biochemicals from different inoculum sources. Bacteria were heterotrophically grown first
on glucose, fructose or glycerol and carbon dioxide was delivered as sole electron acceptor
after pre-enrichment and acclimation of culture. Biocathodes catalysis proved to be less
expensive as compared to traditional cathodes which are causing toxicity, corrosion and
denatured material. Selection of microorganisms must be specific which would be able to
shift from heterotrophic to autotrophic metabolism. This mechanism may also deliver
generalized approach along with metabolic activities of microorganisms for various
electron donors or acceptors during the development of anaerobic specialized biocathode.
Commercialization of microbial electrosynthesis is a challenge. In order to harvest valuable
fuels and supplementary organic commodities, pure culture was employed because the
diversity of autotrophic acetogens accepts electrons from negatively poised cathode for
carbon dioxide reduction with high columbic efficiencies. Another trial was the reactor
designing of BES cell. As BES cells relied totally on bio-cathode and its potential was
carefully controlled by Potentiostat as employed in initial studies. Implementation of
Potentiostat was to control the cathode potential and to avoid potential fluctuations that
could damage the cells. It proved to be impractical because of its limited control in large
scale systems and energy intensive for fixed potential. The direct current power source was
utilized to provide potential difference between electrodes. Potentiostat was exploited to
examine the electroactivity of bio-film developed at cathode for both experimental and
control systems. These specific implementations were developed to simplify the reactor
and maintenance of energy efficiencies. All explicit modifications in this technique has
provided general approach and additional potential to electro fuel synthesis.

41
Chapter 3
Materials and methods

42
3 Materials and methods
3.1 Experimental Setup
The present study was conducted for bio-electrochemical harvesting of greenhouse gas
carbon dioxide to organic compounds under specific conditions of substrate, temperature
and pH. Three species of autotrophic bacteria Cupriavidus necator, Sporomusa ovata and
Clostridium ljungdahlii were cultivated to develop multilayer highly structured cathodic
biofilm at specific voltage to convert waste greenhouse gas to spectrum of organics in bio-
electrochemical cell.
3.1.1 Chemicals and Reagents
The following chemicals were utilized for the preparation of medium;
K2HPO4 0.348g, KH2PO4 0.227g, NH4Cl 0.5g, MgSO4.7H2O 0.500g, CaCl2.2H2O 0.250g,
NaCl 2.25g, FeSO4.7H2O 0.002g, yeast extracts 2.0g, Casitone 2.0g, Betaine 6.70g,
NaHCO3 4.0g, Resazurin 1mg, Na2S.9H2O 0.300g (Merk Germany).
3.1.2 Chemicals for vitamin solution
Biotin 2.0 mg, folic acid 2.0 mg, pyridoxine-HCl 10.0 mg, thiamine-HCl.2H2O 5.0mg,
riboflavin 5.0 mg, nicotinic acid 5mg, D-Ca-pantothenate 5.0 mg, vitamin B12 0.10 mg,
p-Aminobenzoic acid 5.0 mg.
3.1.3 Trace element solution
FeCl2.4H2O 1.50 g, ZnCl2 70.0 mg, MnCl2. 4H2O 100.0 mg, H3BO3 6.0 mg, CoCl2.6H2O
190.00 mg, CuCl2.2H2O 2.00 mg, NiCl2.6H2O 24.00 mg, Na2MoO4.2H2O 36.00 mg,
NaHSeO3 10-7 M solution.

43
3.1.4 Standards
Various standards 2-ethylbutyric acid, volatile acid mixture, 3-hydroxybutyric acid,
benzoic acid, methanol, chloroform, acetone, NaOH, HCl, H2SO4 (Merk, Germany) were
utilized for GC-MS analysis.
3.1.5 Gasses
Gas mixture of CO2/H2 (90:10) was used as a source of carbon contents and N2 to provide
anoxic conditions in the anaerobic chamber. Helium was utilized as a carrier gas for GC-
MS analysis.
3.2 Equipment and Instruments
Bioelectrochemical Autoclave used (Shin Saeng Korea) for complete sterilization of
equipment and medium solutions, at 121 0C for 20 minutes.
Vitamin solutions were filter sterilized at 0.45µm pore size filter paper.
pH meter (Rocker EC 400 Microprocessor pH/MV) was used to monitor and maintain the
pH of medium and standards.

44
Samples were centrifuged with centrifuging incubator (Hermle labortechnik GmbH) to
separate cell dry weight, turbidity from medium broth and for further spectroscopic
analysis of supernatant.
Cell concentration in medium was determined by measuring optical density at wavelength
of 600-620nm by UV spectrophotometer (UV-1602 BMS Biotechnology Medical
services). Quartz cuvette with path length of 10 mm was used.
Bio-electrochemical products were analyzed for identification and quantification by GC-
MS analyzer Agilent Technologies (789A US GC system and 5975C inert XLEI CI MSD
detector).
Anaerobic chamber (YQK-11 Jinan Unilab Instrument Co.Ltd) was used to provide anoxic
atmosphere and gases to the exoelectrogens for batch and continuous bio-electrochemical
systems (BES). The chamber was disinfected properly with 70% ethanol and then
completely sterilized by UV irradiation for 30 minutes. Anoxic atmosphere was maintained
by supplying sterilized N2 gas. Moisture was absorbed by palladium beads throughout the
experiment.

45
3.3 Bio-electrochemical reactor configuration
3.3.1 General setup
Bio electrochemical reactor was fabricated with tubular polyacrylate chambers having 2
cm wall thickness. The chambers were partitioned by proton exchange membrane (PEM)
with internal dimensions (12x 8x 12 cm3) and of capacity (100 cm3) each. Non-catalyzed
carbon cloth and round stainless steel mesh plate with 12 cm diameter were used as cathode
for active electron transport and biofilm development whereas chrome plate of diameter 12
cm as an anode. The frame was bolted with bolts between two endplates. Provisions were
made for sampling ports and wire input points along with leak proof sealing for both gasses
and liquids. Bio-electrochemical synthesis of organic compounds in both batch and
continuous system was carried out in explosion proof anaerobic chamber (YQK-11 Jinan
Unilab Instrument Co.Ltd). Both anode and cathode chambers of 100 ml capacity each
were filled with 80 ml of sterile basal medium. Cathode compartment was inoculated by
pre-enriched culture only. The headspace was purged with H2/CO2 to establish a biofilm at
cathode. Voltage of -400mV was supplied by DC power supply (vanal DC power supply
PS-150200) to provide electron at potential for microbial electrosynthesis without the
synthesis of hydrogen gas. Solar energy can be harvested with existing photovoltaic
technology on bio-cathode with DC power supply. This suggests that microbiological
catalysts when coupled with photovoltaic and current-driven microbial carbon dioxide
reduction, represents a new platform of photosynthesis. Bio-electro catalysts were capable
of current consumption and reducing the carbon dioxide, a sole carbon source for the
synthesis of valuable products like acetate, ethanol and small amount of 2- oxobutyrate
(except in Cupriavidus necator for the synthesis of polyhydroxy alkanoates). The medium
was replaced several times to remove planktonic cells. The periodic removal of planktonic
cells enhances the growth of biofilm at cathode surface. A peristaltic pump (Longer pump
BT 100-2J) was attached with BES for converting batch to continuous mode. The
electroactivity of bio-film developed at cathode for both experimental and control systems
was monitored by Potentiostat. The whole reactor performance was conducted in an
anaerobic chamber (YQK-11 Jinan Unilab Instrument Co.Ltd). The bio-reactor was treated
with ethanol, acetone and deionized water before experimental setup. The fabrication of

46
BES was performed in laminar flow cabinet (Stream line Singapore) under UV irradiation
to avoid biological contamination.
3.3.2 Electrodes
Pure carbon cloth (C-Tex20, MAST Carbon International) and stainless steel mesh plate
served as cathode and chromium (Aldrich/GF 99465946) plate as an anode. Both anode
and cathode plates were connected to DC power supply via Platinum wires for electron
conduction. The electrodes were treated with ethanol, acetone and finally with deionized
water before use.
3.3.3 Proton exchange membrane
The proton exchange membrane (PEM, CMI-70005) was utilized for the partition of
cathode and anode and was pretreated to obtain the stable reactor operation. It was placed
in 5 wt. % NaCl solutions for one hour then in 3 wt. % NaOH solution for one hour and
finally rinsed with sterile deionized water for 20 minutes. In case of coagulation the
treatment is done with hydrogen peroxide for 20 minutes.
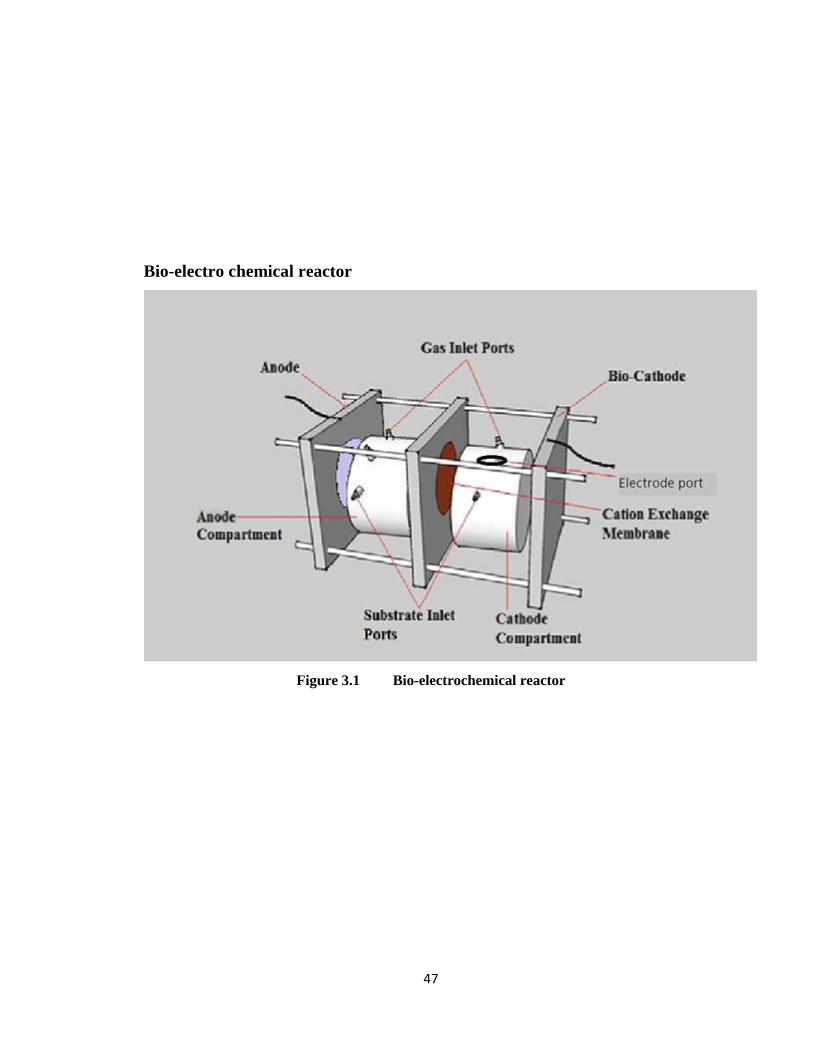
47
Bio-electro chemical reactor
Figure 3.1 Bio-electrochemical reactor
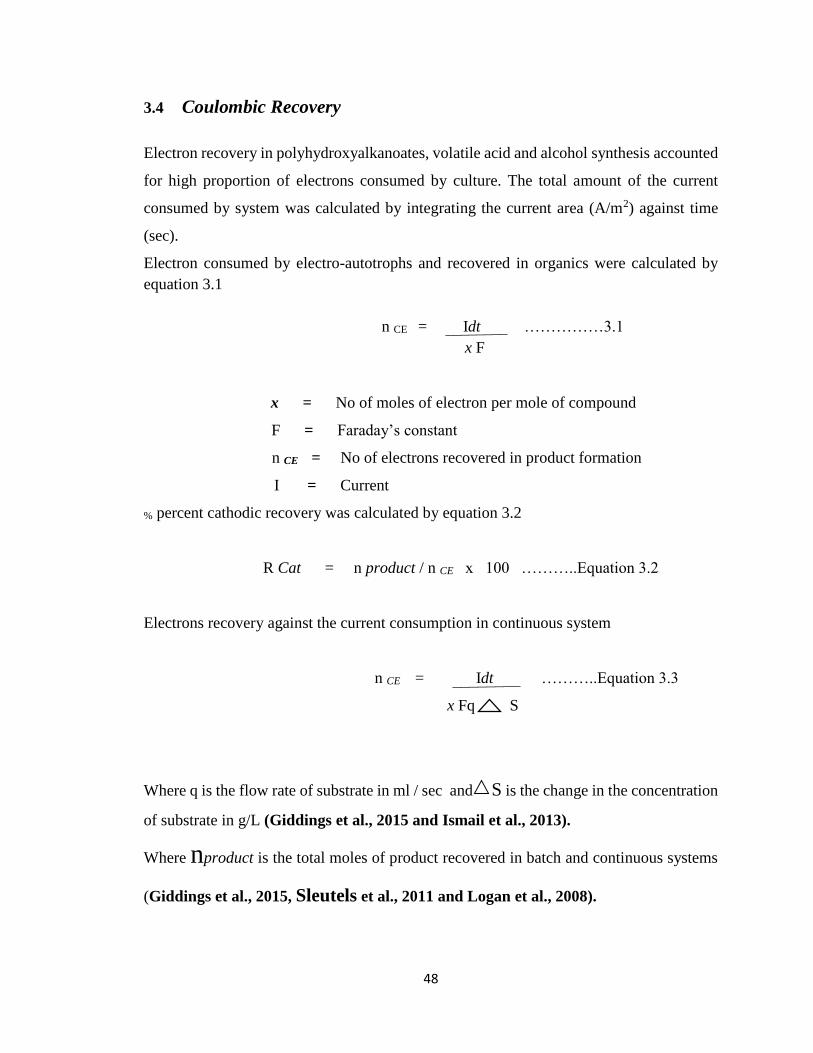
48
3.4 Coulombic Recovery
Electron recovery in polyhydroxyalkanoates, volatile acid and alcohol synthesis accounted
for high proportion of electrons consumed by culture. The total amount of the current
consumed by system was calculated by integrating the current area (A/m2) against time
(sec).
Electron consumed by electro-autotrophs and recovered in organics were calculated by
equation 3.1
n CE = Idt ……………3.1
x F
x = No of moles of electron per mole of compound
F = Faraday’s constant
n CE = No of electrons recovered in product formation
I = Current
% percent cathodic recovery was calculated by equation 3.2
R Cat = n product / n CE x 100 ………..Equation 3.2
Electrons recovery against the current consumption in continuous system
n CE = Idt ………..Equation 3.3
x Fq S
Where q is the flow rate of substrate in ml / sec and S is the change in the concentration
of substrate in g/L (Giddings et al., 2015 and Ismail et al., 2013).
Where nproduct is the total moles of product recovered in batch and continuous systems
(Giddings et al., 2015, Sleutels et al., 2011 and Logan et al., 2008).

49
3.5 ANOVA Test
Results were tested for significant differences using a one way ANOVA (Analysis Of
Variance) with the help of IBM SPSS statistics version 23 software. Data with statistically
significant findings are stated as being statistically different. The ANOVA test was
performed to compare two variances i.e., the variance within groups and between the
groups. One-Way ANOVA determined the significant difference between the batch and
continuous system for three microbial strains Cupriavidus necator, Sporomusa ovata and
Clostridium ljungdahlii. The significant value was set as 0.05, if the value was less than
this value then the difference between batch and continuous system were considered as
significant while the value greater than this digit was resulted with non-significant effect.

50
3.6 Cupriavidus necator
Cupriavidus necator is facultative gram-negative rod-shaped bacteria. This strain is non-
spore forming and non-pathogenic. Cupriavidus necator was obtained from DSMZ
(Deutsche Sammlung Mikroorganismen and Zellkulturen GmbH) and was cultured in
DSMZ medium 545 at 320C.
3.6.1 Media composition
Cells were grown in DSMZ medium 545 by utilizing chemicals of analytical grade (Sigma
Aldrich chemicals Ltd.) for the composition of medium per liter.
Yeast extract 0.3g, sodium succinate 1.0g, ammonium acetate 0.5g, iron citrate solution
(0.1% in H2O) 5ml, KH2PO4 0.5g, MgSO4. 7H2O 0.40g, NaCl 0.40g, NH4Cl 0.40g,
CaCl2.2H2O 0.05g, vitamin B12 solution (Cyanocobalamin,10mg in 100ml H2O) 0.40ml,
trace element solution 1ml, L-Cystenium chloride 0.30g, Resazurin (0.1%) 0.50ml (Sigma
Aldrich chemicals Ltd.).
Before autoclaving the pH of medium was adjusted to 6.8 with HCl and NaOH. Medium
was boiled for 5 minutes and then cooled in cold water with the purging of N2 gas and then
autoclaved at 1210C for 15 minutes for complete sterilization. Medium was transferred to
anaerobic chamber for the addition of vitamin, trace element, resazurin and L-Cystenium
chloride solutions aseptically to the basal medium after cooling. The final volume was
made up to one liter. The sterilized pH electrode was used again to reconfirm the required
pH of substrate.
3.6.2 Stock Solution for Trace Element
Trace element solution was prepared by utilizing the following components per liter.
ZnSO4. 7H2O 0.10g, MnCl2. 4H2O 0.03g, H3BO3 0.30g, CoCl2. 6H2O 0.20g, CuCl2. 2H2O
0.01g, NiCl2. 6H2O 0.02g, Na2MoO4. 2H2O 0.03g (Sigma Aldrich chemicals Ltd.).
Solution was transferred to medium bottle and stored in the refrigerator at 4 0C.

51
3.6.3 Carbon sources
The main growth substrate for heterotrophic and electro autotrophic growth of Cupriavidus
necator was molasses to supply heterotrophic conditions for cell bio-mass growth and
second source was CO2 gas for autotrophic growth of PHA in both continuous and batch
system (Tatiana et al., 2013). The basic components of molasses are in table 3.1
Table 3.1 Chemical composition of molasses
Components %
Sucrose 46.9
Glucose 5.2
Fructose 6.7
Non-carbohydrate substances 16.4
Water 14.5
protein 0
Fats 0
3.6.4 Culture growth conditions with CO2 and H2
Medium prepared as instructed in DSMZ medium 545 was used as seed medium for cell
growth in serum bottles along with the purging of gas mixture of H2/O2/CO2 (8:2:90) in an
anaerobic chamber. Stock culture of Cupriavidus necator was stored at -20 0C in falcon
tubes with 3:10 ml ratio of liquid broth and glycerol. In order to confirm the purity and cell
growth, culture was observed under microscope by gram staining after 48 hours of
incubation. The stock culture was used to inoculate the medium by transferring 3 to 5 ml
of liquid broth to the cathode compartment of BES.
3.6.5 Medium preparation with Molasses
Molasses were treated with sulfuric acid (0.75wt% pH 1.1) and then heated at 100, 115 and
130 0C for 15 minutes. The pH was adjusted to (6.8) with 5 M NaOH solution. Treated

52
molasses were filtered and sterilized by autoclaving at 121 0C for 15 minutes. Sodium
acetate (10 g/L) was used as supplement [Sharifzadeh et al., 2009).
3.7 Reactor operation
Two substrate phase strategy was employed for bio-electrochemical synthesis of bioplastic.
The first phase was heterotrophic growth of cell bio-mass with molasses followed by
second phase electro autotrophic intracellular growth of PHA content inside the cells by
CO2 source.
The pH of catholyte was controlled to 6.8 by dosing 3M HCl and 1M NaOH solutions by
means of micro pipette.
3.8 Cathode biofilm development
The cathode chamber of microbial fuel cell was loaded with 80 ml of pretreated molasses
inoculated with H2/CO2 grown culture. A carbon cloth, stainless mesh steel plate and
platinum wire were used in the cathode compartment for efficient current conduction.
Cathode was poised at -400 mV without the synthesis of hydrogen. Anode compartment
was loaded with 80 ml medium of molasses without microorganisms. Round chrome plate
as anode with platinum wire was separated from the cathode by proton exchange
membrane. The molasses media was replaced several times to remove planktonic cells.
Optimum conditions of temperature and pH trigger the heterotrophic bio-mass growth to
achieve high cell density. Microbial biofilm was developed on carbon cloth after one week
of inoculation. After the heterotrophic pre-enrichment and acclimation of biofilm at
cathode and dissipation of organic carbon contents of substrate, the system was switched
from heterotrophic to autotrophic growth by purging sterile gas mixture of O2/CO2 (10:90).
The bacterial cell concentration in the cultured media was determined by optical density at
620 nm by using spectrophotometer (UV-1602 BMS Biotechnology Medical services) with
distilled water for appropriate dilution rate. Optical density (OD) is the measure of

53
transmittance of an optical element for given wavelength. OD is the logarithm for the ratio
of transmitted and incident light as in equation 3.4.
OD = -log10 I/I0 …………………….Equation 3.4
I= Intensity of transmitted light and I0 = Intensity of incident light
Absorbance and scattering of light is increased by bacterial concentration. Solution with
higher bacterial concentration exhibits greater absorbance and less concentration reflects
increased transmittance. The enhanced transmittance and reduced absorbance against time
in days indicates the decrease of bacterial concentration in medium and most probably the
deposition of biofilm at cathode.
A curve between the cell dry weight concentrations in ppm against absorbance was made
to measure the optical density of medium to evaluate the biofilm development. The
calibration curve is represented in figure 3.2. The viability of C. necator was further
evident with scanning electron micrographs of carbon cathode surface (Montaser et al.,
2011b).
Figure 3.2 Relationship between cell dry weight concentration and absorbance at 620nm
R² = 0.9557
0
0.5
1
1.5
2
2.5
0 2 4 6 8 10 12
Ab
sorb
an
ce
Concentration of C.necator
ppm

54
The graph represented in figure 3.3 manifested that there was a decrease in the absorbance
per day because the concentration of cells were reduced in the cultured medium. Decrease
in absorbance was the indication of deposition of biofilm at cathode.
Figure 3.3 The optical density measured at 620nm exhibits the decrease in absorbance
per day
3.9 Experimental conditions of batch system for Cupriavidus necator
The two stage substrate strategy has been employed to keep the substrate and biomass
concentration in BES to a desired level. After the heterotrophic pre-enrichment and
acclimation of biofilm at cathode and dissipation of organic carbon contents of substrate,
the system was switched from heterotrophic to autotrophic growth of cells by blowing the
gas mixture of O2/CO2 (10:90). Sterilized medium was transferred to anode and cathode
compartments of bio-electrochemical reactor. The oxygen and nitrogen in limited
conditions to trigger PHA synthesis at 32 0C. Oxygen supply more than 20% suppress the
PHA synthesis and critical for the safety level in anaerobic chamber. The anaerobic
chamber was continually gassed with gas mixture to maintain anoxic conditions in the
anaerobic chamber too. DC power supply connected to cathode and its potential was
adjusted to -400mV for microbial electrosynthesis without the significant synthesis of
hydrogen. The catholyte was agitated at 250 rpm for 10 minutes with regular interval of
time. pH was controlled by HCl and NaOH solutions and temperature in the incubator of
0
0.2
0.4
0.6
0.8
1
0 2 4 6 8
Ab
sorb
an
ce
Days

55
anaerobic chamber was measured by thermometer sensor. After one week of cultivation
5ml of the samples were centrifuged for time interval of 24 hours to determine the
concentration of products.
3.10 Control cell for Cupriavidus necator
Experimental performance in the presence of nitrogen was conducted to study the effect of
nitrogen on PHA synthesis. Same set of experimental conditions were supplied to the
control cell along with nitrogen, sample was centrifuged and examined by GC-MS.
3.11 Experimental conditions of continuous system for Cupriavidus
necator
After the completion of batch system the autotrophic growth of PHB was conducted in
continuous chemostat system by connecting it with peristaltic pump (Longer pump BT
100-2J) at the dilution rate of 0.3ml/sec. Dilution of molasses to 50% enables the limitation
of cell growth in chemostat culture under steady state conditions. Steady state is a condition
in which current density, protein and substrate influent concentration is constant. The
concentration of these elements in the culture was determined by medium flow rate with
excessive level of other substrate flowing into the system. The maximum intracellular PHA
contents in autotrophic chemostat culture were obtained with CO2, carbon source at
specific growth rate of cells. The cathode compartment was spurge with gas substrate at
320C and was agitated at 250 rpm for 5 minutes for regular interval of time. DC power
supply was connected to cathode to provide -400mV. Liquid sample was transferred to
falcon tubes nearly 5ml after the time interval of 24 hours for GC-MS analysis. PHA
biosynthesis was based on dry cell concentration, polymer yield and amount of substrate
used.

56
3.12 Cyclic voltammetry for Cupriavidus necator
Cupriavidus enactor’s acceptance of electrons from cathode through direct electron transfer
was evaluated by employing cyclic voltammetry (CV) with carbon cathode the working
electrode against Ag/AgCl the reference electrode. Voltammograms were recorded by
applying a potential ramp at a scan rate of 10mV/s over the range of +0.2 to -0.6 V to the
working electrode. Cupriavidus necator showed the significant electroactivity with definite
redox peaks. CV can also be used to determine the electron shuttles or mediator produced
by bacteria (Venkata et al., 2015).
In the control cell cyclic voltammetry was performed with the fresh medium, the medium
without exoelectrogens under the same set of conditions applied in the experimental cell.
No redox reaction was observed with fresh medium and cell free culture.
3.13 FT-IR analysis
The characterization of functional groups were performed by FT-IR (Nicolet 6700 USA).
Fourier transform infrared spectroscopy is basically an analytical technique which gives
the spectra based on temporal coherence measurements from infrared source. It has ability
to identify unknown substance and chemical bonds present in it by IR-absorption spectrum.
Simple PHA structure were identified by using Nicolet FT-IR spectrometer in photo caustic
mode with spectral range and scan range of 4000-400cm-1 and rate 8m/s respectively
(Dharaiya et al., 2014 and Sergio et al., 2007).
3.14 Analytical Method
3.14.1 The Biopolymer Extraction for GC-MS Analysis
Chloroform extraction method was employed to recover PHA without its degradation and
high degree of purity. Cells with different PHA contents were collected by centrifuging

57
5ml of culture broth at 3500 rpm for 20 minutes at 25 0C. The supernatant was discarded
leaving behind the cell pellets. Solution containing 2ml of chloroform and 2ml of acidified
methanol (3% sulfuric acid) were added to cell pellets in the falcon tube with Teflon screw
caps. Mixture was heated and estrified at 100 0C for 3.5 hours. It was a developed method
for polymer extraction by (Braunegg et al., 1987). The sample was left for one hour at
room temperature for the development of three phases in the solution. The bottom phase
was transferred to the screw caped vial and used for GC-MS analysis while other two
phases of chloroform and methanol were discarded. The endotoxin level was less than
10EU/g of PHA level. The chloroform extraction method was efficient not only to reduce
the endotoxin level of gram negative bacteria but also for PHA recovery with high degree
of purity (Sang et al., 1999).
Addition of benzoic acid (2mg/ml) as an internal standard improved the reproducibility
and accuracy of polymers to be detected at low level of 0.5 ug.
3.15 The Biopolymer Analysis
The biopolymer analysis was based on procedures, SPME sample preparation, GC-MS
analysis and extraction of PHA.
3.15.1 SPME Procedure for Sample Preparation
Solid phase micro extraction (SPME) device and fiber coating polydimethylsiloxane
(100umPDMS) utilized for extraction and concentration of sample from liquid broth. For
extraction solution was placed in 20ml screw-cap vials with silicon/PTFE septa. About 2
ml of sample solution employed for sorption was stirred at 1000 rpm with magnetic stirrer
at 37 0C for 20 minutes. After extraction the fiber was desorbed directly to GC injector for
3 minutes. It was sufficient time for desorption of all analyte studied and reinserting the
fiber after the run without any carry-over (Wejnerowska et al., 2008).
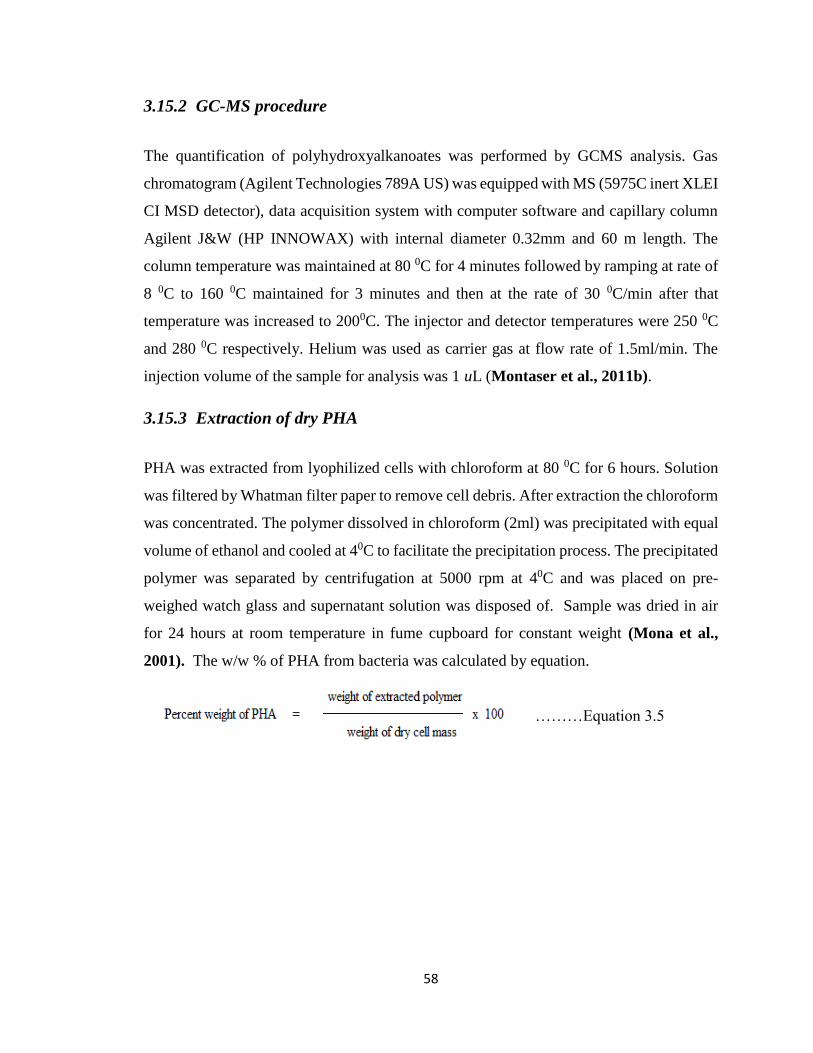
58
3.15.2 GC-MS procedure
The quantification of polyhydroxyalkanoates was performed by GCMS analysis. Gas
chromatogram (Agilent Technologies 789A US) was equipped with MS (5975C inert XLEI
CI MSD detector), data acquisition system with computer software and capillary column
Agilent J&W (HP INNOWAX) with internal diameter 0.32mm and 60 m length. The
column temperature was maintained at 80 0C for 4 minutes followed by ramping at rate of
8 0C to 160 0C maintained for 3 minutes and then at the rate of 30 0C/min after that
temperature was increased to 2000C. The injector and detector temperatures were 250 0C
and 280 0C respectively. Helium was used as carrier gas at flow rate of 1.5ml/min. The
injection volume of the sample for analysis was 1 uL (Montaser et al., 2011b).
3.15.3 Extraction of dry PHA
PHA was extracted from lyophilized cells with chloroform at 80 0C for 6 hours. Solution
was filtered by Whatman filter paper to remove cell debris. After extraction the chloroform
was concentrated. The polymer dissolved in chloroform (2ml) was precipitated with equal
volume of ethanol and cooled at 40C to facilitate the precipitation process. The precipitated
polymer was separated by centrifugation at 5000 rpm at 40C and was placed on pre-
weighed watch glass and supernatant solution was disposed of. Sample was dried in air
for 24 hours at room temperature in fume cupboard for constant weight (Mona et al.,
2001). The w/w % of PHA from bacteria was calculated by equation.
………Equation 3.5
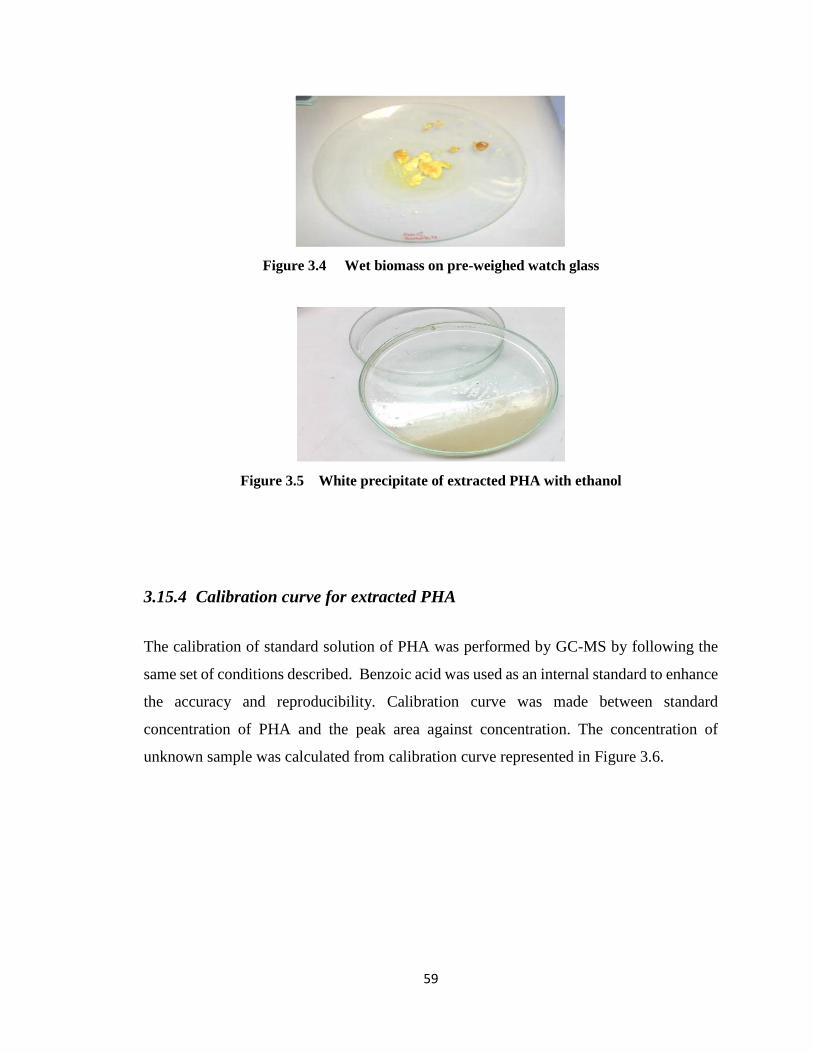
59
Figure 3.4 Wet biomass on pre-weighed watch glass
Figure 3.5 White precipitate of extracted PHA with ethanol
3.15.4 Calibration curve for extracted PHA
The calibration of standard solution of PHA was performed by GC-MS by following the
same set of conditions described. Benzoic acid was used as an internal standard to enhance
the accuracy and reproducibility. Calibration curve was made between standard
concentration of PHA and the peak area against concentration. The concentration of
unknown sample was calculated from calibration curve represented in Figure 3.6.

60
Figure 3.6 Calibration curve between concentration and peak area for polyhydroxy
alkanoates
R² = 0.9698
0.00E+00
2.00E+07
4.00E+07
6.00E+07
8.00E+07
1.00E+08
1.20E+08
1.40E+08
0 5 10 15 20 25
Standard
peak
area
Concentration
ppm
61
3.16 Sporomusa ovata
Bacterial strain Sporomusa ovata was obtained from DSMZ (Deutsche Sammlung
Mikroorganismen and Zellkulturen GmbH) strictly anaerobic, gram-negative, banana-
shaped and non-pathogenic bacteria cultured in DSMZ medium 311 at 320C.
3.16.1 Media and cultivation method
All chemicals used were of highest purity (Sigma Aldrich chemicals Ltd.) and were used
without any further purification. Cells were grown in the medium with composition
K2HPO4 0.348g, KH2PO4 0.227g, NH4Cl 0.5g, MgSO4.7H2O 0.500g, CaCl2.2H2O 0.250g,
NaCl 2.25g, FeSO4.7H2O 0.002g, NaHSeO3 (10ml of 10-5molar solution), yeast extracts
2.0g, Casitone 2.0g, betaine.H2O 6.70g, NaHCO3 4g, resazurin 1mg, Na2S.9H2O 0.300g,
vitamin solution (10ml) and trace element solution (1ml).
3.16.2 Vitamin solution (medium 141)
Vitamin solution composition per liter was as follows,
Biotin 2.00mg, folic acid 2.00mg, pyridoxine-HCl 10.0mg, thiamine-HCl.2H2O 5.00mg,
riboflavin 5.00mg, nicotinic acid 5.00mg, D-Ca-pantothenate 5.00mg, vitamin B12
0.10mg, p-Aminobenzoic acid 5.00mg and Lipoic acid 5.00mg.
All chemicals were dissolved in deionized water and total volume was made up to 1.0 L.
The solution was mixed thoroughly by passing N2/CO2. After filter sterilization, the stock
solution was stored at 40C.
3.17 Trace element solution SL-10 (medium 320)
HCl (25%, 7.7 M) 10.00ml, FeCl2.4H2O 1.50g, ZnCl2 70.00mg, MnCl2.4H2O 100.00mg,
H3BO3 6.00mg, CoCl2.6H2O 190.00mg, CuCl2.2H2O 2.00mg, NiCl2.6H2O 24.00mg,
Na2MoO4.2H2O 36.00mg.

62
FeCl2 was dissolved first in HCl then in deionized water, other salts were dissolved and
final volume was made up to 1liter.
3.18 Stock solutions preparation
3.18.1 NaHSeO3.10-7 M solution
1M NaHSeO3 = 151g/ 1000ml
10-5M NaHSeO3 = 151x10-5g/1000ml
10-7M solution was prepared from 10-5M solution by dilution method.
10 ml of 10-5 M NaHSeO3 solution was diluted to 1000ml for the preparation of 10-7 M
solution of NaHSeO3.
3.18.2 Resazurin solution 500mg/1000ml
Resazurin solution contained 12.5mg of resazurin in 250ml of deionized water. It was filter
sterilized after thorough mixing and then kept at 40C in the refrigerator.
3.18.3 NaHCO3 solution
Bicarbonate solution was prepared by dissolving 4g of NaHCO3 in 80ml of deionized water
under CO2 + N2 atmosphere.
3.18.4 Lysozyme solution
Lysozyme solution contained 0.1g /100ml of Lysozyme dissolved in 0.01N HCl first and
then volume was made 100ml by deionized water. After thorough mixing it was filter
sterilized.

63
3.18.5 Phosphate buffer solution
K2HPO4 0.348g and KH2PO4 0.227g were dissolved in deionized water and volume was
made up to 200ml. Nitrogen gas was purged for 5 minutes.
3.18.6 Method for preparation of anaerobic medium
According to Sporomusa ovata medium 311 all chemicals were weighed and transferred
to medium bottle except bicarbonates, phosphate buffer, trace elements and vitamin
solution. Chemicals were dissolved in 500ml deionized water and boiled for five minutes.
Medium was cooled in ice water with N2/CO2 purging for 15 minutes. Then solution was
autoclaved for 20 minutes at 121 0C. After autoclaving all solutions were transferred to
anaerobic chamber. The medium was amended with trace element solution 1.0ml,
phosphate buffer solution 200ml, NaHCO3 solution 80ml, NaHSeO3 solution 10ml, vitamin
solution 10ml, resazurin solution 2ml and Lysozyme 10ml. pH of the medium was adjusted
to 7.0 with HCl. 400 uL of 3M HCl of pH 3. Then volume was made one liter with
deionized water.
The 10 ml of the medium was transferred to two serum bottles each sealed with sterile
butyl rubber stopper with 5ml syringe. Only the stopper or septa of butyl rubber are
efficient to prevent the permeation of air into vials. These septa are tightly fixed by sealing
with aluminum crimp. Seed culture about 2.0 ml was used for the inoculation of serum
bottles. These serum bottles were inoculated with Sporomusa ovata and were placed in the
incubator inside the anaerobic chamber at 320C. The 2ml of fresh medium was added to
serum bottles after every 24 hours. After 48 hours bacterial growth was checked under
microscope with proper gram staining. All stock solutions were stored at 40C in
refrigerator. Stock culture was stored at -20 0C in falcon tubes with 3:10 ml ratio of glycerol
and liquid broth for preservation.
64
3.18.7 Medium preparation with CO2 and H2 for Sporomusa ovata
Culture growth for all experiments was exploited in modified growth medium by omitting
betaine, fructose, casitone and resazurin. Culture was grown in serum bottles with medium
and gas mixture of H2/CO2 (10:90) at 320C in an anaerobic chamber. Medium and gas
addition was done during regular interval of time and pure cell growth was observed under
microscope by gram staining (Nevin et al., 2011c).
3.18.8 Cathode biofilm development
Anaerobically prepared 80ml sterile basal medium was added to each chamber of bio-
electrochemical cell. Cathode compartment was inoculated by pre-enriched culture only.
The headspace was purged with H2/CO2 to establish a biofilm at cathode. The medium was
replaced several times to remove planktonic cells. The periodic removal of planktonic cells
enhances the growth of biofilm at cathode surface. Favorable conditions are provided in
heterotrophic bio-mass growth phase to achieve high cell density. Microbial biofilm was
developed on carbon cloth after one week of inoculation. The whole reactor performance
was conducted in an anaerobic chamber (YQK-11 Jinan Unilab Instrument Co.Ltd). In
cathode a round carbon cloth and round stainless mesh plate and in anode a chrome plate
connected with power supply at -400mV (Nevin et al., 2010). The viability of Sporomusa
ovata was further evident with Scanning electron micrographs of carbon cathode surface.
`
3.18.9 Experimental conditions of batch system for Sporomusa ovata
After the heterotrophic pre-enrichment and acclimation of biofilm at cathode, 80ml of the
sterilized H2/CO2 fresh medium without Betaine, fructose, Casitone and resazurin was
transferred to anode and cathode compartment of Bio-electrochemical reactor. The
catholyte consisted of an optimized general growth medium for autotrophic culture of
Sporomusa ovata. The anaerobic chamber was continually gassed with N2/CO2 mixture to
65
maintain anoxic conditions in the chamber. DC power supplier connected to cathode to
provide -400mV electrons at a potential for microbial electrosynthesis without the
significant synthesis of hydrogen. The catholyte was continuously spurge with CO2 at 32
0C with regular interval of time as sole carbon source and electron acceptor to switch
microorganisms from heterotrophic to autotrophic metabolism. Limiting conditions for
oxygen were employed to avoid the gas explosion range and anoxic conditions for the
microbial growth. After one week cultivation 5ml of the samples were collected for time
interval of 24 hours centrifuged and supernatant was transferred to falcon tubes for GC-
MS analysis.
3.18.10 Continuous system for Sporomusa ovata
The batch system was switched to continuous system with peristaltic pump at the dilution
rate of 0.3 ml/sec. Current and total applied voltage was measured by digital voltmeter.
Gas phase was switched to CO2 and consumption of electron was directly from cathode for
the reduction of carbon dioxide the only carbon source to valuable products. The samples
were collected in sterile falcon tubes for time interval of 24 hours for GC-MS analysis.
Samples collected with intervals were centrifuged and supernatant was freezed in the
refrigerator (Nevin et al., 2008).
3.18.11 Control cell without electroactive catalysts
Control cell was employed for fresh medium and cell free culture using the same set of
conditions for experimental cell. The cathode was supplied -400mV by DC supplier.
Samples were analyzed in the absence of electroactive components by GC-MS.
3.18.12 Cyclic Voltammetry (CV) for Sporomusa ovata
Sporomusa ovata, s acceptance of electrons from cathode through direct electron transfer
was evaluated by employing cyclic voltammetry (CV) with carbon cathode the working

66
electrode against Ag/AgCl the reference electrode. Voltammograms were recorded by
applying a potential ramp at a scan rate of 10 mV/s over the range of +0.2 to -0.6 V to the
working electrode. Sporomusa ovata showed the significant electroactivity with definite
redox peaks. Voltammetry studies were employed to determine the redox potential of redox
active components, electrochemical activity of microbial strains and to test the
performance of cathode material with Potentiostat. Cyclic voltammetry was employed to
determine the electron shuttles or mediator produced by bacteria.
3.18.13 Control Cell without electroactive catalysts
Cyclic voltammetry in the control cell was performed in cell free suspension where the
supernatant was obtained by centrifuging cell and in the medium without electroactive cells
under the same set of conditions applied in the experimental cell. No redox reaction was
observed when cyclic voltammetry was analyzed with the fresh medium or cell free culture
(Choi et al., 2014).
3.18.14 Analytical Method for Sporomusa ovata
Organic products were analyzed by head space solid-phase micro extraction (HS-SPME)
followed by gas chromatography mass spectrometry (GC-MS).
3.18.15 Preparation of samples for GC-MS analysis
Liquid broth samples were stored at -160C and 2 ml was pipetted out into 20 ml screw-cap
vials with silicon/PTFE septa with 0.3 uL of 2-ethyl butyric acid as internal standard and
0.75g of NaCl mixed thoroughly. The pH was adjusted to 6.8 to 7 by 3 molar HCl and 0.15
M NaOH.
3.18.16 SPME Procedure
SPME device and fiber coating polydimethylsiloxane (100um PDMS/CAR poly dimethyl
siloxane/carboxene coated fiber) utilized for extraction and concentration of sample from
67
liquid broth. For extraction 2ml of sample solution was placed in 20 ml screw-cap vials
with silicon/PTFE septa. Sample solution employed for sorption was stirred at 1000 rpm
with magnetic stirrer at 37 0C for 20 minutes. After extraction the fiber was desorbed
directly to GC injector for 3 minutes. It was sufficient time for desorption of all analyte
studied and reinserting the fiber after the run without any carry-over (Wejnerowska et al.,
2008).
The quantification of organic products was performed by GCMS analysis. Gas
chromatogram (Agilent Technologies 789A US) was equipped with MS (5975C inert XLEI
CI MSD detector), data acquisition system with computer software and capillary column
Agilent J&W (HP INNOWAX) with internal diameter 0.32mm and 60 m length. The
column temperature was maintained at 70 0C for 2 minutes followed by ramping at rate of
40C/min to 180 0C maintained for 2 minutes and then at the rate of 20 0C/min after that
temperature was increased to 2000C and holding the final temperature for 3 minutes. The
injector and detector temperatures were 250 0C and 280 0C respectively. The GC system
was operated in split less mode with Helium as carrier gas at flow rate of 1.5 ml/min. The
injection volume of the sample for analysis was 1 uL (Montaser et al., 2011 and Lin et
al., 2008).
3.19 Calibration for volatile acids and alcohols
The calibration of standard solution was performed by GC-MS by following the same set
of conditions described above, 2-ethyl butyric acid was used as an internal standard and
volatile acid mixture from (C2 to C7) as an external standard to enhance the accuracy and
reproducibility. Calibration curve was made between known concentration of the standard
volatile acid mixture and 0.3 ml of 2-ethylbutyric acid as an internal standard in each
sample. The concentration of unknown sample was calculated by taking 2 ml of sample
with 0.3ml of internal standard and 0.75g of NaCl from calibration graph as embodied in
figure 3.7 and 3.8.
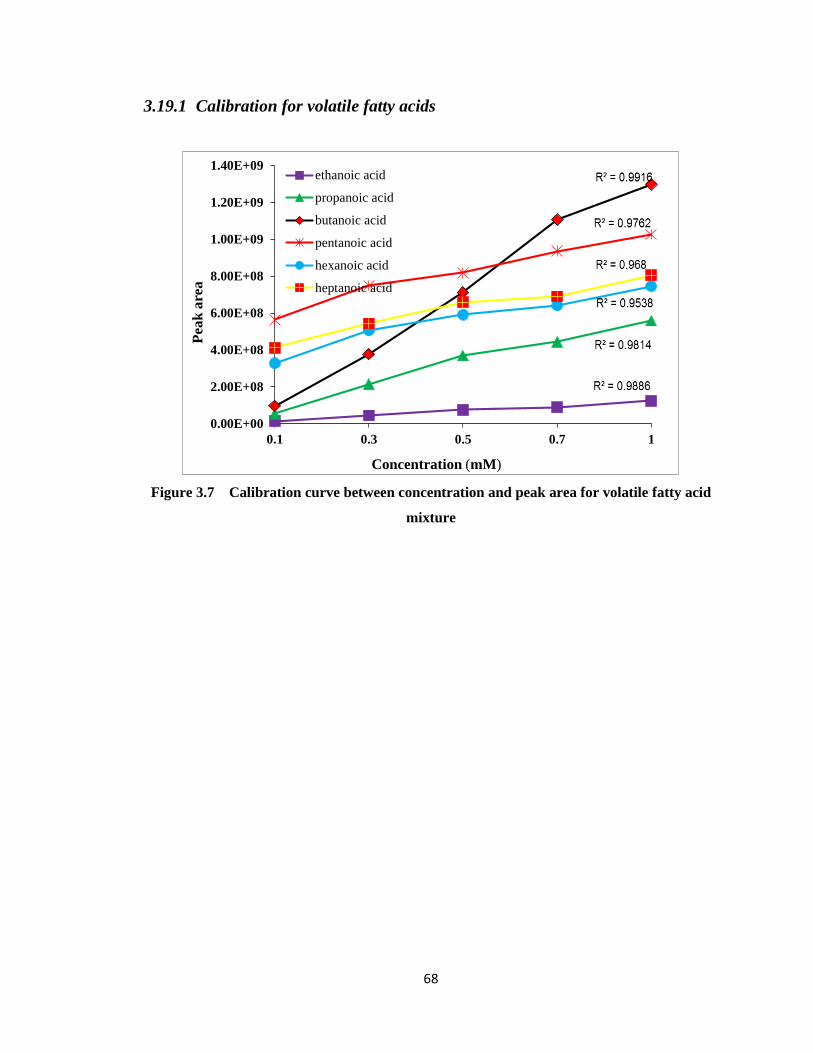
68
3.19.1 Calibration for volatile fatty acids
Figure 3.7 Calibration curve between concentration and peak area for volatile fatty acid
mixture
0.00E+00
2.00E+08
4.00E+08
6.00E+08
8.00E+08
1.00E+09
1.20E+09
1.40E+09
0.1 0.3 0.5 0.7 1
Pea
k a
rea
Concentration (mM)
ethanoic acid
propanoic acid
butanoic acid
pentanoic acid
hexanoic acid
heptanoic acid
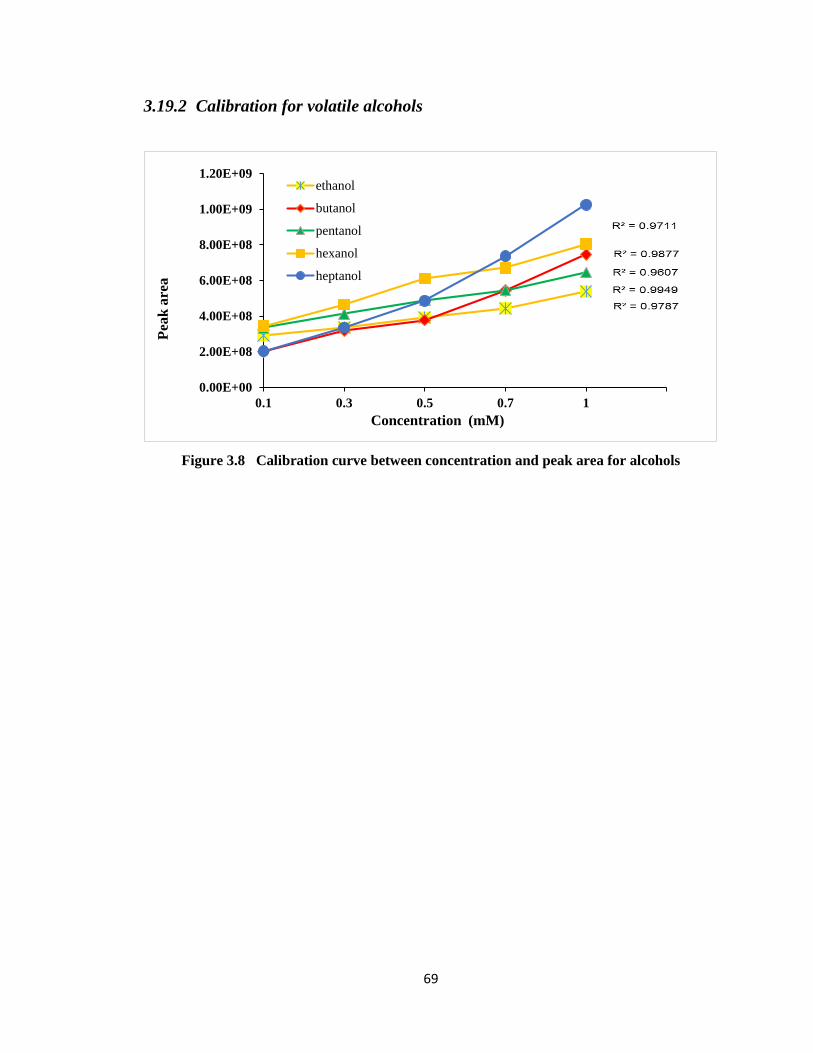
69
3.19.2 Calibration for volatile alcohols
Figure 3.8 Calibration curve between concentration and peak area for alcohols
0.00E+00
2.00E+08
4.00E+08
6.00E+08
8.00E+08
1.00E+09
1.20E+09
0.1 0.3 0.5 0.7 1
Pea
k a
rea
Concentration (mM)
ethanol
butanol
pentanol
hexanol
heptanol

70
3.20 Clostridium ljungdahlii
The third bacterial strain used in this research was Clostridium ljungdahlii, obtained from
DSMZ Deutsche Sammlung Mikroorganismen and Zellkulturen GmbH. Clostridium
ljungdahlii, endospore forming, motile, rod shaped gram positive bacteria cultured in
DSMZ medium 879 at 37 0C (Nevin et al., 2011).
3.21 Medium and cultivation method for Clostridium ljungdahlii
All chemicals used were of highest purity (Sigma Aldrich chemicals Ltd.). Cells were
grown in the medium with composition per liter as follows.
NH4Cl 1.0g, Yeast extract 1.0g, NaCl 0.8g, MgSO4.7H2O 0.2g, KCl 0.1g, KH2PO4 0.1g,
CaCl2.2H2O 0.02g, Na2WO4.2H2O 0.20mg, Fructose solution 50.0ml, Trace element
solution 10.0 ml, Vitamin solution 10.0ml, NaHCO3 solution 10.0ml and Na2S.9H2O
solution 10.0ml.
3.21.1 Vitamin solution (medium 141)
The method followed to prepare Vitamin solution 141 as described in previous section
3.17.2 page 60 for Sporomusa ovata.
3.21.2 NaHCO3 solution per 10.0ml
NaHCO3 was 1.0g dissolved in deionized water and made the volume 10.0ml. Solution
was mixed thoroughly by sparging mixture of N2:CO2 (80:20%) and then filter sterilized.
After filter sterilization, the solution was kept in refrigerator at 40C.

71
3.21.3 Fructose solution per 50ml.
Fructose solution of 5.0g/50ml was prepared in deionized water and was mixed thoroughly
by sparging N2 and then filter sterilized. After filter sterilization the solution was kept in
refrigerator at 40C.
3.21.4 Na2S.9H2O solution per 10.0ml.
Na2S.9H2O was dissolved in deionized water 0.3g and volume was made up to 10.0 ml.
solution was mixed thoroughly and sparged with N2. Solution was autoclaved at 1210C for
20 minutes and then stored anaerobically.
3.21.5 Trace Element Solution per liter
Solution composition per liter was as follows
MgSO4.7H2O 3.0g, Nitrilotriacetic acid 1.5g, NaCl 1.0g, MnSO4.2H2O 0.5g, CoSO4.7H2O
0.18g, ZnSO4.7H2O 0.18g, CaCl2.2H2O 0.1g, FeSO4.7H2O 0.1g, NiCl2.6H2O 0.025g, K.Al
(SO4)2.12H2O 0.02g, H3BO3 0.01g, Na2MoO4.4H2O 0.01g, CuSO4.5H2O 0.01g and
Na2SeO3.5H2O.
Nitrilotriacetic acid was dissolved in 500.0 ml of deionized water by adjusting the pH
6.5with KOH. Rests of the compounds were dissolved and volume was made up to one
liter.
3.22 Method for Preparation of anaerobic medium for C. ljungdahlii
According to Clostridium ljungdahlii medium 879 all chemicals were weighed and
transferred to medium bottle except bicarbonates, fructose, Na2S.9H2O, trace elements and
vitamin solution. All these chemicals were dissolved in 800 ml deionized water and boiled
for five minutes. Medium was cooled in ice water with N2:CO2 (80:20%) purging for 15
minutes then autoclaved for 20 minutes at 121 0C. After autoclaving all solutions were

72
placed in anaerobic chamber. Rests of the solutions were mixed anaerobically and
aseptically.
Trace element solution 10.0ml, NaHCO3 solution 10.0ml, Na2S.9H2O solution 10.0ml,
vitamin solution 10.0 ml, and fructose solution 50 ml. pH of the medium was adjusted to
6.8 with HCl using 400 uL of HCl of pH 3. Then volume was made up to one liter with
deionized water.
The 10.0 ml of the medium was transferred to two serum bottles each sealed with sterile
butyl rubber stopper with 5ml syringe. These septa are tightly fixed by sealing with
aluminum crimp. Seed culture was used for the inoculation of serum bottles. These serum
bottles were inoculated with Clostridium ljungdahlii and were placed in the incubator
inside the anaerobic chamber at 37 0C. Fresh medium was added to serum bottles after
every 24 hours. All stock solutions were kept at 40C in refrigerator. After48 hours the
bacterial growth was checked under microscope with proper gram staining. Stock culture
of Clostridium ljungdahlii was stored at -20 0C in falcon tubes with 3:10 ml ratio of liquid
broth and glycerol for preservation.
3.22.1 Medium preparation with CO2 and H2 for Clostridium ljungdahlii
Clostridium ljungdahlii culture growth for all experiments was exploited in modified
growth medium by omitting fructose. Culture was grown in serum bottles with this medium
and gas mixture of H2/CO2 (10:90) was purged at 37 0C in these culture bottles. Medium
and gas addition was done during regular interval of time and pure cell growth was
observed under microscope by gram staining.

73
3.23 Cathode biofilm development
Anaerobically prepared 80 ml sterile basal medium with fructose was added to each
chamber of bio-electrochemical cell. Cathode compartment was inoculated by pre-enriched
culture only. The headspace was purged with H2/CO2 to establish a biofilm at cathode. The
medium was replaced several times to remove planktonic cells. The periodic removal of
planktonic cells enhances the growth of biofilm at cathode surface. Favorable conditions
are provided in heterotrophic bio-mass growth phase to achieve high cell density. Microbial
biofilm was developed on carbon cloth after one week of inoculation. The whole reactor
performance was conducted in an anaerobic chamber (YQK-11 Jinan Unilab Instrument
Co.Ltd). The cathode was poised at -400mV with DC power supply for potential difference
between cathode and anode. The anaerobic chamber was continually gassed with N2/CO2
mixture to maintain anoxic conditions in the chamber. The microbial cell concentration in
the cultured media was determined by optical density at 620 nm based on calibration curve
by UV spectrophotometer (UV-1602 BMS Biotechnology Medical services). The decrease
in the absorbance per day indicates the deposition of biofilm at cathode (Sharifzadeh et
al., 2009). The viability of C. Ljungdahlii was further evident with Scanning electron
micrographs of carbon cathode surface.
3.24 Experimental conditions for batch system for Clostridium ljungdahlii
After the heterotrophic pre-enrichment and acclimation of biofilm at cathode, 80ml of the
sterilized H2/CO2 fresh medium without fructose was transferred to anode and cathode
compartment of bio-electrochemical reactor. The catholyte consisted of an optimized
general growth medium for autotrophic culture of Clostridium ljungdahlii. The anaerobic
chamber was continually gassed with N2/CO2 mixture to maintain anoxic conditions in the
chamber. DC power supply was connected to cathode at -400mV for microbial
electrosynthesis without the significant synthesis of hydrogen. The catholyte was
continuously spurge with CO2 at 37 0C with regular interval of time as sole carbon source
and electron acceptor to switch microorganisms from heterotrophic to autotrophic
metabolism. Limiting conditions for oxygen were employed to avoid the gas explosion and
74
to provide anoxic conditions for the microbial growth. After one week cultivation 5ml of
the samples were collected for time interval of 24 hours centrifuged and supernatant was
transferred to falcon tubes for GC-MS analysis. The sample were centrifuged and
supernatant was freezed in the refrigerator (Nevin et al., 2010).
3.25 Continuous system for Clostridium ljungdahlii
The batch system was switched to continuous system with peristaltic pump at the dilution
rate of 0.3 ml/sec. Current and total applied voltage was measured by digital voltmeter.
Gas phase was switched to CO2 and consumption of electron was initiated directly from
cathode for the reduction of carbon dioxide the only carbon source. The samples were
collected in sterile falcon tubes for time interval of 24 hours for GC-MS analysis. Samples
collected after the definite time intervals were centrifuged and supernatant was freezed in
the refrigerator.
3.25.1 Control cell without electroactive catalysts
Control cell was employed for fresh medium and cell free culture using the similar
conditions for anode, cathode, temperature and pH. The cathode was poised at -400mV by
DC supplier. Samples were analyzed in the absence of electroactive components by GC-
MS.
3.26 Cyclic Voltammetry (CV) for Clostridium ljungdahlii
Clostridium ljungdahlii acceptance of electrons from cathode through direct electron
transfer was evaluated by employing cyclic voltammetry (CV) with carbon cathode the
working electrode against Ag/AgCl the reference electrode. Voltammograms were
recorded by applying a potential ramp at a scan rate of 10mV/s over the range of +0.2 to -
0.6 V to the working electrode. Clostridium ljungdahlii showed the significant
electroactivity with definite redox peaks. Cyclic voltammetry was employed to determine
the electron shuttles or mediator produced by bacteria.

75
Voltammetry studies were employed to determine the redox potential of redox active
components, electrochemical activity of microbial strains.
When the Clostridium ljungdahlii strains were cultivated with carbon cloth vs. Ag/AgCl
reference electrode, culture showed the current consumption during 48 hours of cultivation
indicating the development of electroactive biofilm at cathode.
3.26.1 Cyclic voltammetry of Control Cell without electroactive catalysts
Cyclic voltammetry in the control cell was performed in cell free suspension where the
supernatant was obtained after centrifuging. In order to rule out the effect of medium on
redox activity of cathode, medium without electroactive catalysts under the same set of
conditions was placed in experimental cell for CV analysis No redox reaction was
observed when cyclic voltammetry was analyzed with the fresh medium or cell free culture
(Choi et al., 2014).
3.27 Analytical Method for volatile fatty acids and alcohols
Organic products were analyzed by head space solid-phase micro extraction (HS-SPME)
followed by gas chromatography mass spectrometry (GC-MS), by following the same
method adopted for Sporomusa ovata. Calibration curves for volatile fatty acids and
alcohols (figure 3.7 and 3.8) were used for the estimation of the products.

76
Chapter 4
Results and discussion
77
4 Results and discussion
Results and discussions for the three microbial strains are discussed below.
4.1 Cupriavidus necator
Current study was conducted for bio-electrochemical synthesis of PHA by exploiting
facultative autotrophic bacteria. The facultative autotrophic bacteria Cupriavidus necator
were selected to capture electron directly from cathode instead of hydrogen to reduce CO2.
Cupriavidus necator contains fln-like adhesion gene cluster which is used for tight, non-
specific adhesion to cathode surfaces for direct transfer of electrons (Pohlmann et al.,
2006). Bio-electrochemical studies have been conducted previously for harvesting waste
greenhouse gas to organic acids and alcohols where electro autotrophs utilize electric
current obtained from renewable energies (Zhang et al., 2015 and Nevin et al., 2011).
However bio-electrochemical synthesis of PHA using electric current is not previously
reported. The previous studies to synthesize PHA were based on fermentation and fed-
batch processes. The drawbacks of processes were long time duration and more chance for
contamination.
In a current study a Specific method was developed for the first time for the synthesis of
PHA based on the development of autotrophic bio-cathode centered on heterotrophic pre-
augmentation. The present research was based on bio-electrochemical synthesis with two
stage-strategy of heterotrophic-autotrophic PHA production from waste low cost
substrates. Heterotrophic approach enhanced biomass production whereas autotrophic
approach was to produce PHA. Cupriavidus necator were heterotrophically grown first on
molasses and after pre-enrichment and acclimation of culture carbon dioxide was delivered
as sole carbon source for autotrophic growth.
In previous bio-electrochemical studies hydrogen was good approach for reduction
reaction during bio production, however hydrogen has shortcomings for microbial
metabolism due to its low solubility the microbial environment has to be pressurized to get
concentrations of the products. So cathodic bio production needs to circumvent hydrogen
(Rabaey et al., 2010). In present study specific implementations were developed for the

78
synthesis of bio-cathode where cathode served as the source of electrons to get desired
product.
The experiment was investigated for both experimental and control reactor in the presence
and absence of nitrogen supply in double chambered reactor partitioned by proton
exchange membrane. The isolated samples were screened for PHA synthesis and were
characterized by GC-MS method of identification and quantification.
Accumulation of PHAs inside the cell is the natural way to store carbon and energy. These
contents were practiced during the nitrogen limitation environment. Presence of nitrogen
leads the metabolic pathway to Krebs cycle for cell growth and energy synthesis. Under
nitrogen and phosphorus limitation and presence of excess carbon, acetyl-CoA pathway is
directed towards PHA accumulation. PHA monomer is represented in the formula with (R)
group. The mechanical properties of PHA depend upon monomer unit. Variation in the
functional group, chain length and unsaturated bonds in PHA structure tailored towards
larger number of application.
Poly-3-hydroxyalkanoates.
The cultivation method for cell mass growth and PHA accumulation by utilizing carbon
dioxide as sole carbon source were according to the equations.
12CO2 + 29H2 2C6H11O3 + 18H2O…....Equation 4.1
2CO2 + 4H2 C2H4O2 + 2H2O………. Equation 4.2
8CO2 + 21H2 C8H16O3 + 13H2O……. Equation 4.3
18CO2 + 49H2 2C9H17O2 + 32H2O….. Equation 4.4
The stoichiometric electro-autotrophic growth of polymers were calculated from the
chemical equations and substrate mole concentration by utilizing ideal gas law.

79
The GC-MS results exhibited the synthesis of organic acids like acetic acid and butyric
acids. These acids were further utilized for the synthesis of PHA in the enriched culture of
Cupriavidus necator. This can be proved from the decrease in the concentration of acetic
acid as represented in the figure 4.3. The optimal experimental conditions employed in
whole experiment, enhanced the dry cell weight and PHA contents to a considerable extent
which was comparable to the PHA contents with pure glucose in fermentation reactors, as
conducted in earlier investigations (Grousseau et al., 2014 and Montaser et al., 2011).
Table 4.1 Synthesis of PHA from dry cell mass after 48 hours
Cell dry weight
mg /50 ml of sample
Extracted Dry
weight of PHA
mg
PHA
synthesis
(%)
342
240
70.17
4.2 Gas Chromatography Mass Spectrometry analysis
The structure and mole fractions of PHA and other compounds were determined by GC-
MS based on peak area of ions. Various identified compounds along with molecular
weight, retention time and displayed formula for both batch and continuous systems were
manifested in the table 4.2.

80
Table 4.2 GC-MS analysis of biodegradable polymer and their chemical composition
(RT; retention time in minutes, CN; compound name, MW; molecular weight, MF;
molecular formula).
RT
CN
MW
MF
8.58
Acetic acid
60
O
OH CH
3
C2H4O2
14.14
3-hydroxy2,2
dimethyl butyrate
131.18 O
O
CH3
CH3
CH3 OH
C6H11O3
14.55
Ethyl 3-hydroxy
hexanoate
160.21 O
O OH
CH3
CH3
C8H16O3
15.19
2, 4 dimethyl
heptanoate
157
C9H17O2
Results exhibited that higher the molecular weight higher the corresponding retention time
like 3-hydroxy 2, 2 dimethyl butyrate and 2, 4 dimethyl heptanoate and lower the molecular
weight and lower the retention time like acetic acid, but in actual the retention time is
independent of molecular mass (Ogunjobi et al., 2013). Peak intensity was related directly
to the concentration of the products.
4.3 Bio-electrochemical synthesis of PHA during batch system
The concentration of polymers during batch system was analyzed by GC-MS analysis.
Concentration of PHA were calculated from the calibration curve after time interval of 24
hours. Concentration was dependent on peak area for every product on gas chromatogram
and maximum concentration was observed at time interval of 120 hours. Figure 4.1
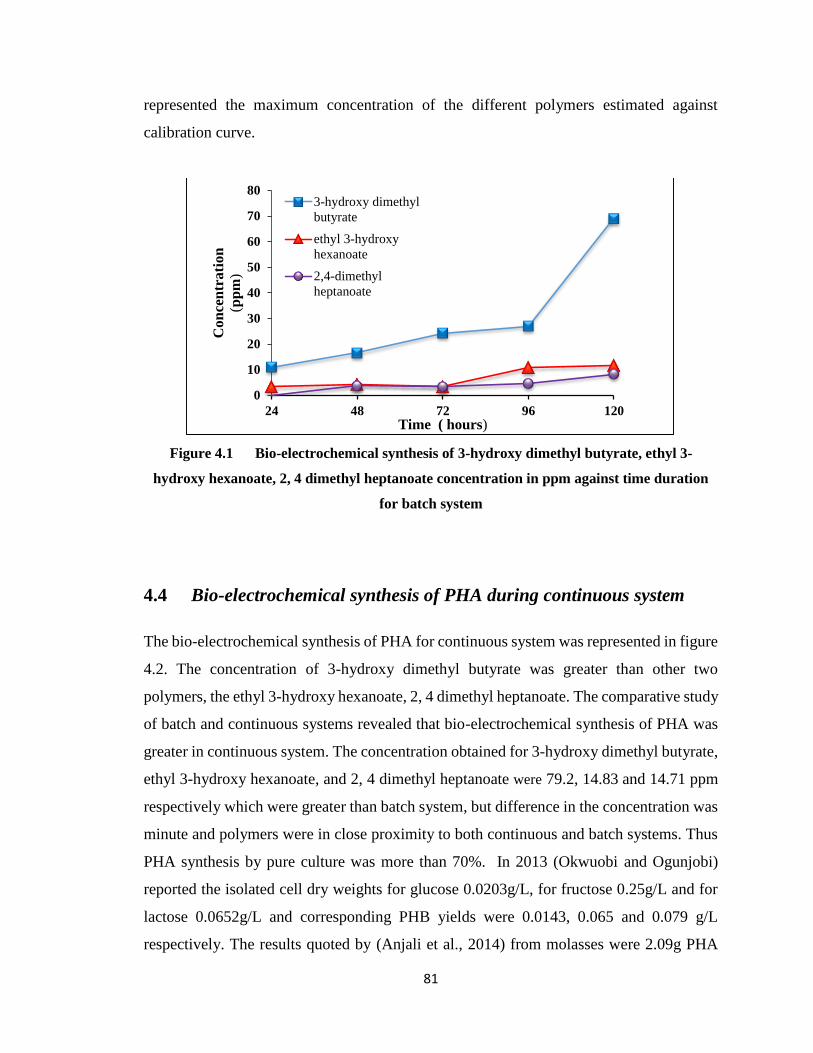
81
represented the maximum concentration of the different polymers estimated against
calibration curve.
Figure 4.1 Bio-electrochemical synthesis of 3-hydroxy dimethyl butyrate, ethyl 3-
hydroxy hexanoate, 2, 4 dimethyl heptanoate concentration in ppm against time duration
for batch system
4.4 Bio-electrochemical synthesis of PHA during continuous system
The bio-electrochemical synthesis of PHA for continuous system was represented in figure
4.2. The concentration of 3-hydroxy dimethyl butyrate was greater than other two
polymers, the ethyl 3-hydroxy hexanoate, 2, 4 dimethyl heptanoate. The comparative study
of batch and continuous systems revealed that bio-electrochemical synthesis of PHA was
greater in continuous system. The concentration obtained for 3-hydroxy dimethyl butyrate,
ethyl 3-hydroxy hexanoate, and 2, 4 dimethyl heptanoate were 79.2, 14.83 and 14.71 ppm
respectively which were greater than batch system, but difference in the concentration was
minute and polymers were in close proximity to both continuous and batch systems. Thus
PHA synthesis by pure culture was more than 70%. In 2013 (Okwuobi and Ogunjobi)
reported the isolated cell dry weights for glucose 0.0203g/L, for fructose 0.25g/L and for
lactose 0.0652g/L and corresponding PHB yields were 0.0143, 0.065 and 0.079 g/L
respectively. The results quoted by (Anjali et al., 2014) from molasses were 2.09g PHA
0
10
20
30
40
50
60
70
80
24 48 72 96 120
Co
nce
ntr
ati
on
(pp
m)
Time ( hours)
3-hydroxy dimethyl
butyrate
ethyl 3-hydroxy
hexanoate
2,4-dimethyl
heptanoate
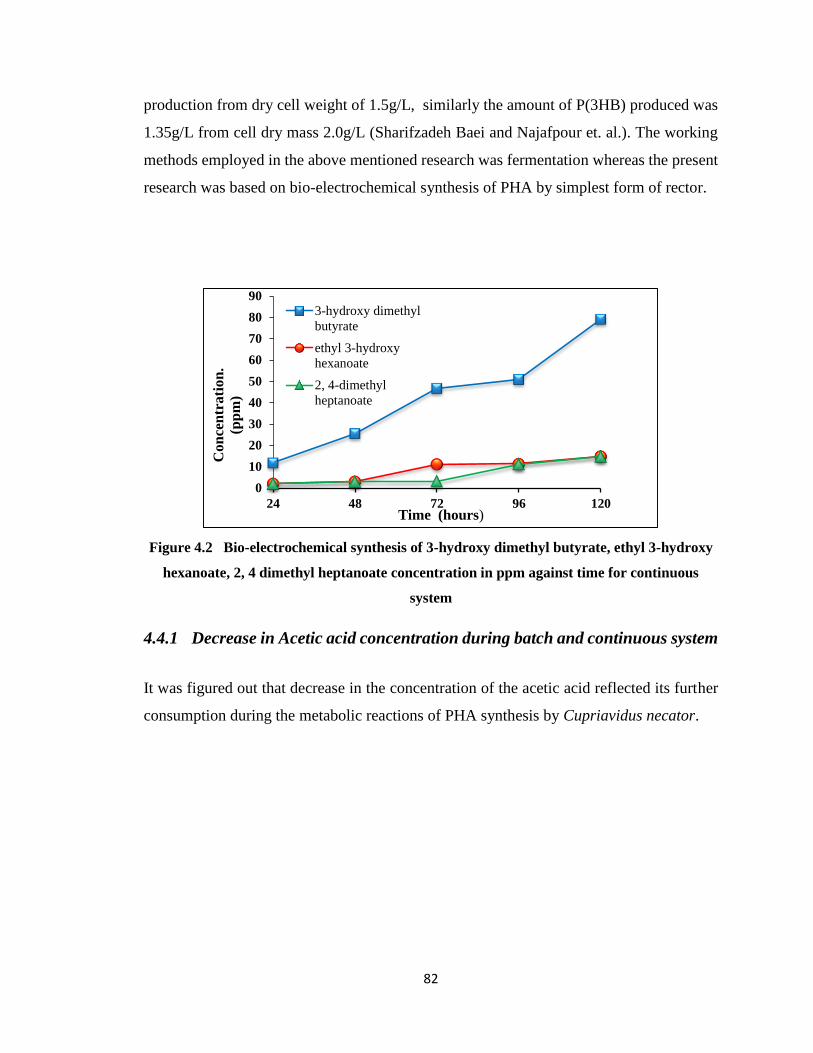
82
production from dry cell weight of 1.5g/L, similarly the amount of P(3HB) produced was
1.35g/L from cell dry mass 2.0g/L (Sharifzadeh Baei and Najafpour et. al.). The working
methods employed in the above mentioned research was fermentation whereas the present
research was based on bio-electrochemical synthesis of PHA by simplest form of rector.
Figure 4.2 Bio-electrochemical synthesis of 3-hydroxy dimethyl butyrate, ethyl 3-hydroxy
hexanoate, 2, 4 dimethyl heptanoate concentration in ppm against time for continuous
system
4.4.1 Decrease in Acetic acid concentration during batch and continuous system
It was figured out that decrease in the concentration of the acetic acid reflected its further
consumption during the metabolic reactions of PHA synthesis by Cupriavidus necator.
0
10
20
30
40
50
60
70
80
90
24 48 72 96 120
Con
cen
trati
on
.
(pp
m)
Time (hours)
3-hydroxy dimethyl
butyrate
ethyl 3-hydroxy
hexanoate
2, 4-dimethyl
heptanoate

83
Figure 4.3 Comparison in Acetic acid concentration in both batch and continuous system
Figure 4.3 exhibited that decrease in the concentration of acetic acid increased the density
of PHA granules inside the cells. Acetic acid was the dominant component during the 24
hours round at pH 7, but decrease in its concentration gradually enhance the PHB synthesis
effectively. Moreover butanoic and propanoic acid concentration were observed in minute
quantities at pH level 7which proved to be more beneficial for the synthesis of PHB and
PHH polymers. The volatile fatty acids (VFA) synthesized were consumed further to yield
PHA.
PHA plays a crucial role in priming electro autotrophs for stress survival. Under nutrients-
scarce conditions PHA promotes the long term survival of these PHA producing bacteria
like Cupriavidus necator the metabolic flux from Acetyl-CoA to PHA is nutrient
dependent. The synthesis of high amount of coenzyme A from Krebs cycle under nutrient
rich conditions blocks the PHA synthesis by inhibiting 3-ketothiolase. Actually the Acetyl-
CoA is channeled to the Krebs cycle for cell growth and energy synthesis. Under
unbalanced nutrients conditions like nitrogen, phosphorus limitation and excess of carbon
allows Acetyl-CoA to be directed toward PHA synthetic pathways for PHA accumulation
(Grousseau et al., 2014). When bacterial cells are supplied by inadequate nutrients a
-5
0
5
10
15
20
25
30
24 48 72 96 120
Co
nce
ntr
ati
on
(pp
m)
Time (hours)
Concentrationin
(ppm) batch system
Concentration (ppm)
continuous system

84
build-up of NADH is observed. NADH inhibits the synthesis of citrate resulting in Acetyl-
CoA not being oxidized at enough rate by Krebs cycle and subsequently accumulates. The
supply of -400mV corresponds to the reduction potential of NADH. High concentrations
of NADH and Acetyl-CoA shifted the equilibrium in favour of PHA synthesis. Coenzyme
A is carrier of acyl groups Acetyl-CoA is converted to PHA by three enzymes. Two
molecules of Acetyl-CoA condense to form dimer acetoacetyl-CoA which involves the
action of 3-Ketothiolase. The action of NADPH dependent enzyme acetoacetyl-CoA
reductase reduces the acetoacetyl-CoA to (R)-3-hydroxybutyryl-CoA (Estelle et al., 2014
and Razaad et al., 2014). By polymerization of (R)-3-hydroxybutyryl-CoA by enzyme
PHA synthase, PHA is formed. This metabolic strategy enables the PHA accumulating
electroactive catalysts in their adaptation to environmental stress conditions.

85
Figure 4.4 Acetyl Co-A pathway for Polyhydroxyalkanoates (Estelle et al., 2014 and
Razaad et al., 2014)
4.5 Coulombic Recovery
Electron distribution value and final products were calculated by converting each
compound to e- equivalent unit by multiplying e- equivalent number per mole by mole of
each compound. For polymers 3-hydroxy dimethyl butyrate, ethyl3-hydroxy hexanoate, 2,
4 dimethyl heptanoate the e- equivalent number per mole were 58, 42, and 98 respectively.
Electron recovered in polymer synthesis were calculated by following Equation 3.1
(Logan et al., 2008).
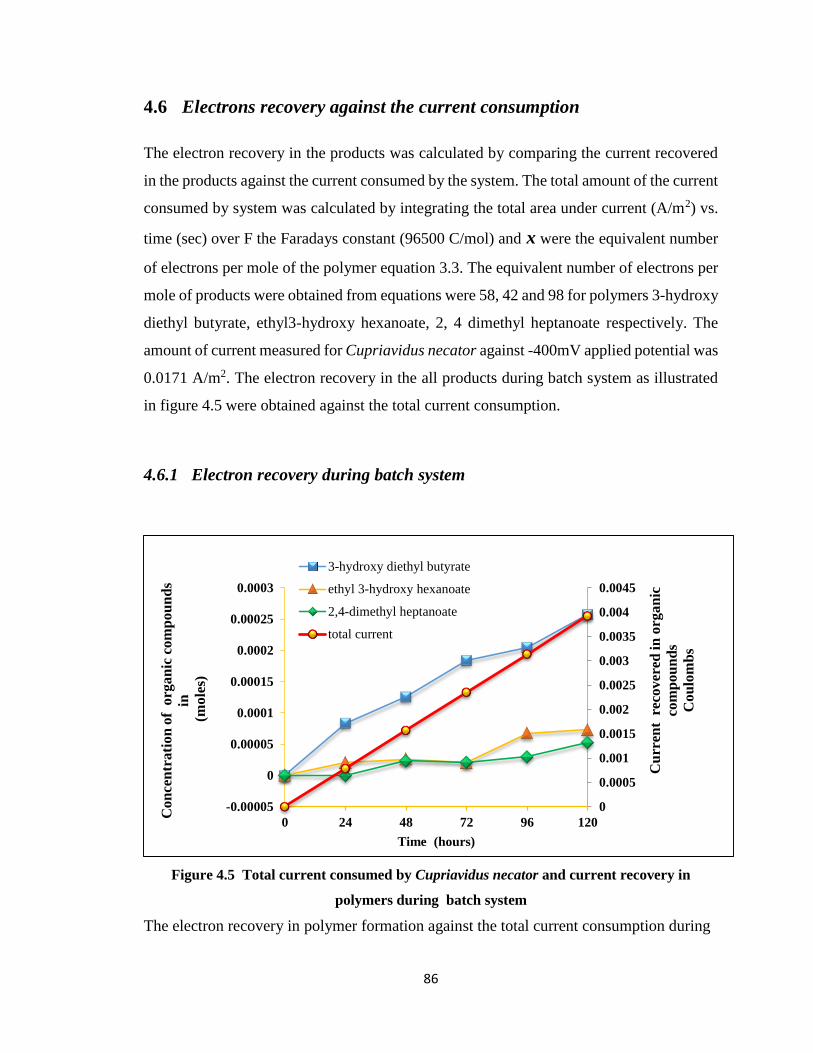
86
4.6 Electrons recovery against the current consumption
The electron recovery in the products was calculated by comparing the current recovered
in the products against the current consumed by the system. The total amount of the current
consumed by system was calculated by integrating the total area under current (A/m2) vs.
time (sec) over F the Faradays constant (96500 C/mol) and x were the equivalent number
of electrons per mole of the polymer equation 3.3. The equivalent number of electrons per
mole of products were obtained from equations were 58, 42 and 98 for polymers 3-hydroxy
diethyl butyrate, ethyl3-hydroxy hexanoate, 2, 4 dimethyl heptanoate respectively. The
amount of current measured for Cupriavidus necator against -400mV applied potential was
0.0171 A/m2. The electron recovery in the all products during batch system as illustrated
in figure 4.5 were obtained against the total current consumption.
4.6.1 Electron recovery during batch system
Figure 4.5 Total current consumed by Cupriavidus necator and current recovery in
polymers during batch system
The electron recovery in polymer formation against the total current consumption during
0
0.0005
0.001
0.0015
0.002
0.0025
0.003
0.0035
0.004
0.0045
-0.00005
0
0.00005
0.0001
0.00015
0.0002
0.00025
0.0003
0 24 48 72 96 120
Cu
rren
t r
ecover
ed in
org
an
ic
com
pou
nd
s
Cou
lom
bs
Co
nce
ntr
ati
on
of
org
an
ic c
om
pou
nd
s
in
(mole
s)
Time (hours)
3-hydroxy diethyl butyrate
ethyl 3-hydroxy hexanoate
2,4-dimethyl heptanoate
total current

87
batch system was maximum for 3-hydroxy diethyl butyrate and minimum for ethyl 3-
hydroxy hexanoate, 2, 4 dimethyl heptanoate respectively.
4.6.2 Percent cathode recovery during batch system
Percent cathode recovery of every PHA molecule was calculated by equation 3.2 and was
maximum for 3-hydroxy diethyl butyrate as compared to ethyl 3-hydroxy hexanoate, 2, 4
dimethyl heptanoate as in figure 4.6.
Figure 4.6 Percent cathode recovery for organic polymers by Cupriavidus necator during
batch system
4.6.3 Electron recovery during continuous system
Coulombic recovery of electrons in continuous system where influent flow rate was 0.3
ml/sec and change in substrate concentration was measured in g/L. The stoichiometric
calculations for the consumption of carbon dioxide were calculated from chemical
equations 4.1-4.4 mentioned above. Data exhibited in figure 4.7 represented the total
current consumed by bio-film and the moles of products recovered from the system.
Maximum recovery was observed at time 120 hours and percent cathode recovery was
obtained maximum for polymer 3-hydroxy dimethyl butyrate compared to other polymers.
0
20
40
60
80
100
120
24 48 72 96 120
Cath
od
e re
cover
y x
100
Time (hours)
3-hydroxy diethyl
butyrate
ethyl 3-hydroxy
hexanoate
2,4-dimethyl
heptanoate
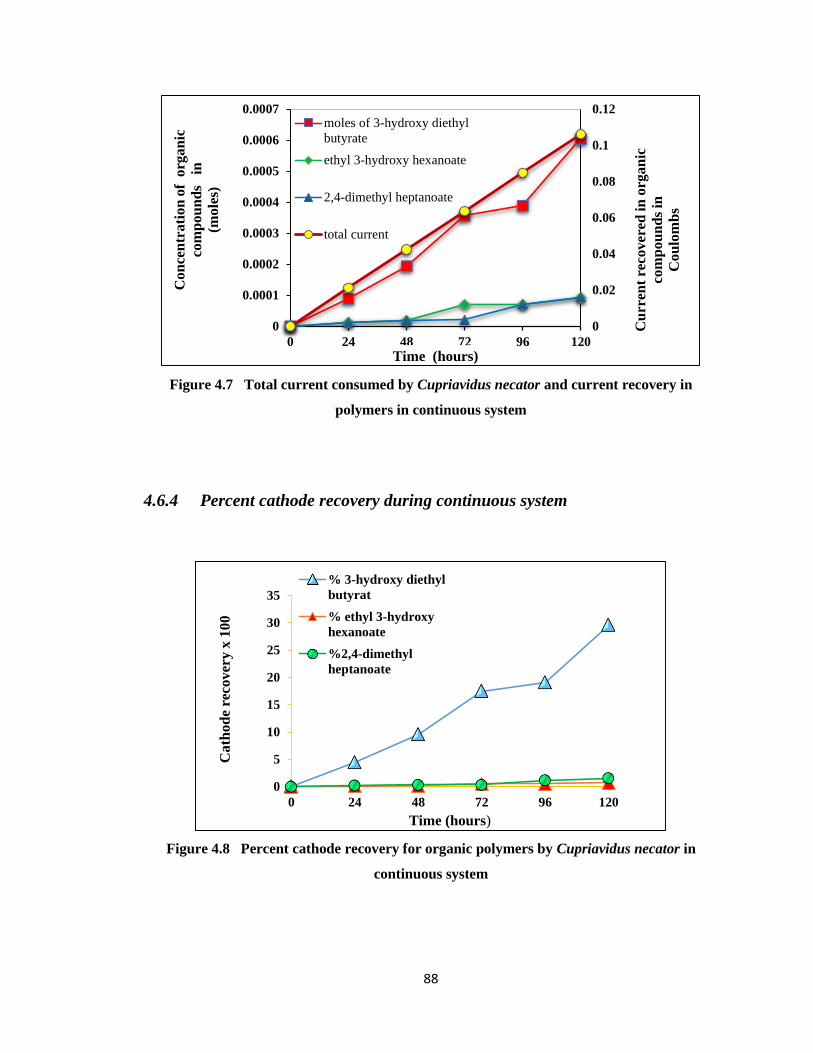
88
Figure 4.7 Total current consumed by Cupriavidus necator and current recovery in
polymers in continuous system
4.6.4 Percent cathode recovery during continuous system
Figure 4.8 Percent cathode recovery for organic polymers by Cupriavidus necator in
continuous system
0
0.02
0.04
0.06
0.08
0.1
0.12
0
0.0001
0.0002
0.0003
0.0004
0.0005
0.0006
0.0007
0 24 48 72 96 120
Cu
rren
t re
cov
ered
in
org
an
ic
com
po
un
ds
in
Co
ulo
mb
s
Co
nce
ntr
ati
on
of
org
an
ic
com
po
un
ds
in
(mo
les)
Time (hours)
moles of 3-hydroxy diethyl
butyrate
ethyl 3-hydroxy hexanoate
2,4-dimethyl heptanoate
total current
0
5
10
15
20
25
30
35
0 24 48 72 96 120
Ca
tho
de
reco
ver
y x
100
Time (hours)
% 3-hydroxy diethyl
butyrat
% ethyl 3-hydroxy
hexanoate
%2,4-dimethyl
heptanoate
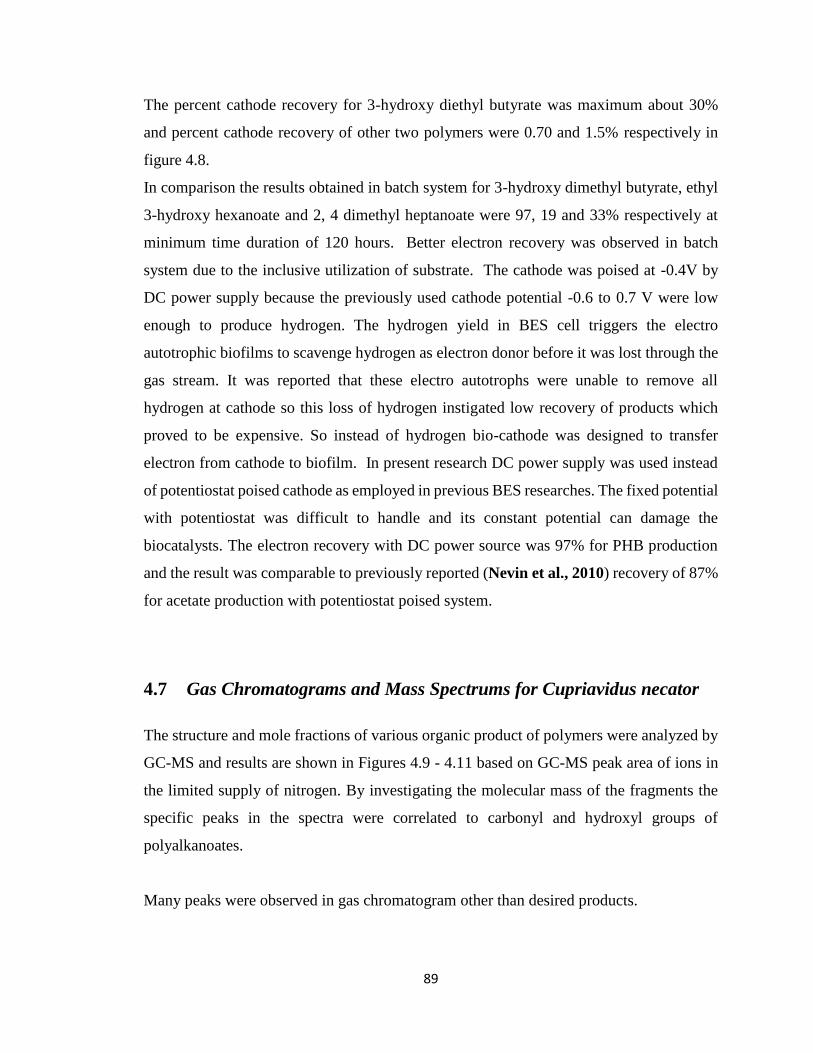
89
The percent cathode recovery for 3-hydroxy diethyl butyrate was maximum about 30%
and percent cathode recovery of other two polymers were 0.70 and 1.5% respectively in
figure 4.8.
In comparison the results obtained in batch system for 3-hydroxy dimethyl butyrate, ethyl
3-hydroxy hexanoate and 2, 4 dimethyl heptanoate were 97, 19 and 33% respectively at
minimum time duration of 120 hours. Better electron recovery was observed in batch
system due to the inclusive utilization of substrate. The cathode was poised at -0.4V by
DC power supply because the previously used cathode potential -0.6 to 0.7 V were low
enough to produce hydrogen. The hydrogen yield in BES cell triggers the electro
autotrophic biofilms to scavenge hydrogen as electron donor before it was lost through the
gas stream. It was reported that these electro autotrophs were unable to remove all
hydrogen at cathode so this loss of hydrogen instigated low recovery of products which
proved to be expensive. So instead of hydrogen bio-cathode was designed to transfer
electron from cathode to biofilm. In present research DC power supply was used instead
of potentiostat poised cathode as employed in previous BES researches. The fixed potential
with potentiostat was difficult to handle and its constant potential can damage the
biocatalysts. The electron recovery with DC power source was 97% for PHB production
and the result was comparable to previously reported (Nevin et al., 2010) recovery of 87%
for acetate production with potentiostat poised system.
4.7 Gas Chromatograms and Mass Spectrums for Cupriavidus necator
The structure and mole fractions of various organic product of polymers were analyzed by
GC-MS and results are shown in Figures 4.9 - 4.11 based on GC-MS peak area of ions in
the limited supply of nitrogen. By investigating the molecular mass of the fragments the
specific peaks in the spectra were correlated to carbonyl and hydroxyl groups of
polyalkanoates.
Many peaks were observed in gas chromatogram other than desired products.

90
Figure 4.9 Gas Chromatogram of PHA polymer
Figure 4.10 Mass spectrum of poly hydroxyalkanoates
Figure 4.11 Mass spectrum of acetic acid
In the GC-MS graphs the height of peaks represents the concentration of PHA. According
to the literature the molecular weight of polymers should not increase from120. If peaks
exceed from 120 m/z, it indicates the presence of other lipid contaminants. The mass
spectrum of Cupriavidus necator exhibited the peaks less than 120 m/z indicating no
contamination in products. In the gas chromatogram the methyl ester derivative of
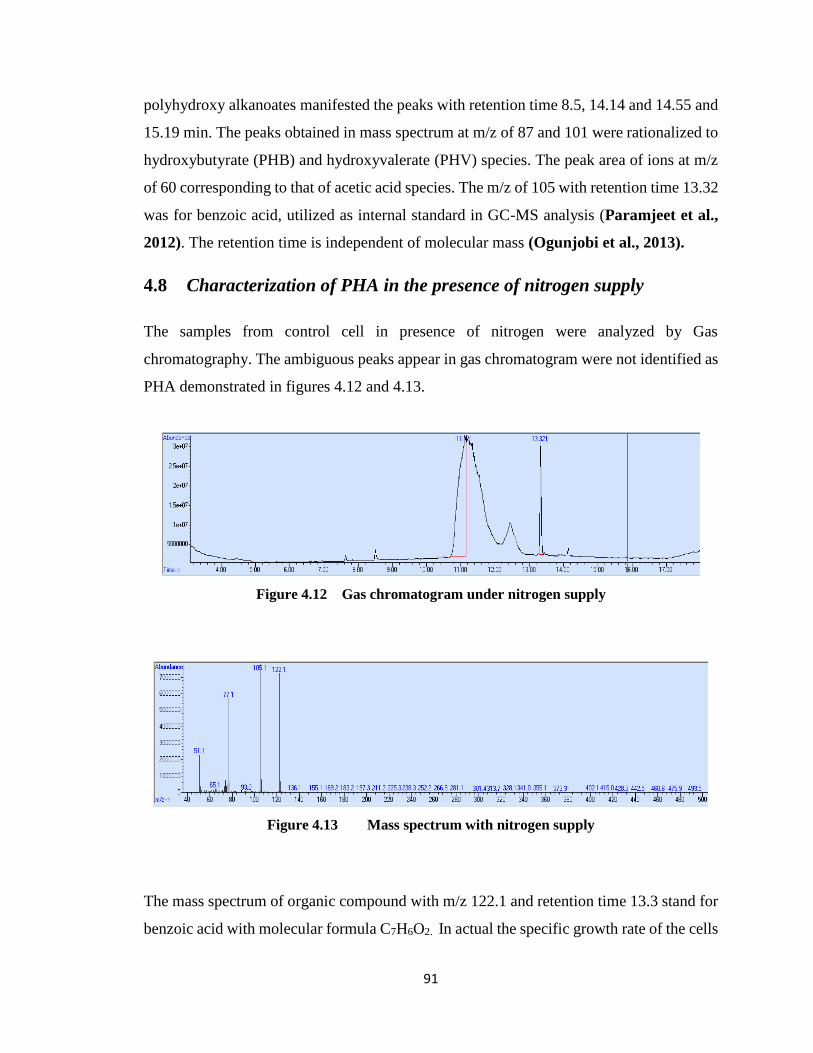
91
polyhydroxy alkanoates manifested the peaks with retention time 8.5, 14.14 and 14.55 and
15.19 min. The peaks obtained in mass spectrum at m/z of 87 and 101 were rationalized to
hydroxybutyrate (PHB) and hydroxyvalerate (PHV) species. The peak area of ions at m/z
of 60 corresponding to that of acetic acid species. The m/z of 105 with retention time 13.32
was for benzoic acid, utilized as internal standard in GC-MS analysis (Paramjeet et al.,
2012). The retention time is independent of molecular mass (Ogunjobi et al., 2013).
4.8 Characterization of PHA in the presence of nitrogen supply
The samples from control cell in presence of nitrogen were analyzed by Gas
chromatography. The ambiguous peaks appear in gas chromatogram were not identified as
PHA demonstrated in figures 4.12 and 4.13.
Figure 4.12 Gas chromatogram under nitrogen supply
Figure 4.13 Mass spectrum with nitrogen supply
The mass spectrum of organic compound with m/z 122.1 and retention time 13.3 stand for
benzoic acid with molecular formula C7H6O2. In actual the specific growth rate of the cells

92
decreased when limited by the deficiency of nitrogen. The experiment conducted under
nitrogen supply exhibited the suppression in the PHA synthesis. In the presence of nitrogen
TCA cycle was followed and synthesis of acids and bio-mass was observed. The m/z of
benzoic acid 105 represented the internal standard in the gas chromatogram. No sharp
peaks for PHA were observed, they were formed but not in significant quantity as
compared to the results obtained in limited supply of nitrogen. The highest PHA are
observed under nitrogen, sulfur and phosphorus deficiency while low PHA contents are
obtained under potassium or magnesium deficiency (Tatiana et al., 2013)
4.9 Cyclic voltammetry results for Cupriavidus necator
Cyclic voltammetry of Cupriavidus necator was employed with carbon electrode as
working electrode against Ag/AgCl reference electrode to investigate the electrochemical
activities of these facultative autotrophic catalysts. Voltammograms were recorded by
applying a potential ramp at a scan rate of 10mV/s over the range of +0.2 to -0.6 V to the
working electrode (Marshall et al., 2012). The selection of scan rate was 10 mv/sec
therefore the potential change was very slow, so at each applied potential all proteins
oxidized or reduced multiple time. The culture exhibited the current consumption after the
48 hours of cultivation. After inoculation the peak area was significantly increased revealed
Cupriavidus necator’s significant peak current with definite oxidation and reduction
activity.

93
Figure 4.14 Cyclic Voltammetry of Cupriavidus necator for biotic, abiotic cathode and
fresh medium against Ag/AgCl reference electrode at scan rate of 10mV/s
The shape of reduction peak was different from oxidation peak. The microbial strains
showed the redox peak at (-0.6022644mV~ -1.8921E-04mA/cm2) and oxidation peak at
(0.20397172mV~2.05389E-05mA/cm2) during 48 hours of cultivation.
4.9.1 Cyclic Voltammetry analysis for Control Cell without electroactive
catalysts
No redox reaction was found when cyclic voltammetry was analyzed by fresh medium as
represented in the figure 4.14 implying the absence of electroactive components in the
medium.
For further analysis after 48 hours cultivation and biofilm development the planktonic cells
were drained out and fresh medium was filled in the cathode compartment against Ag/AgCl
reference electrode. The current consumption was recovered again indicating the electron
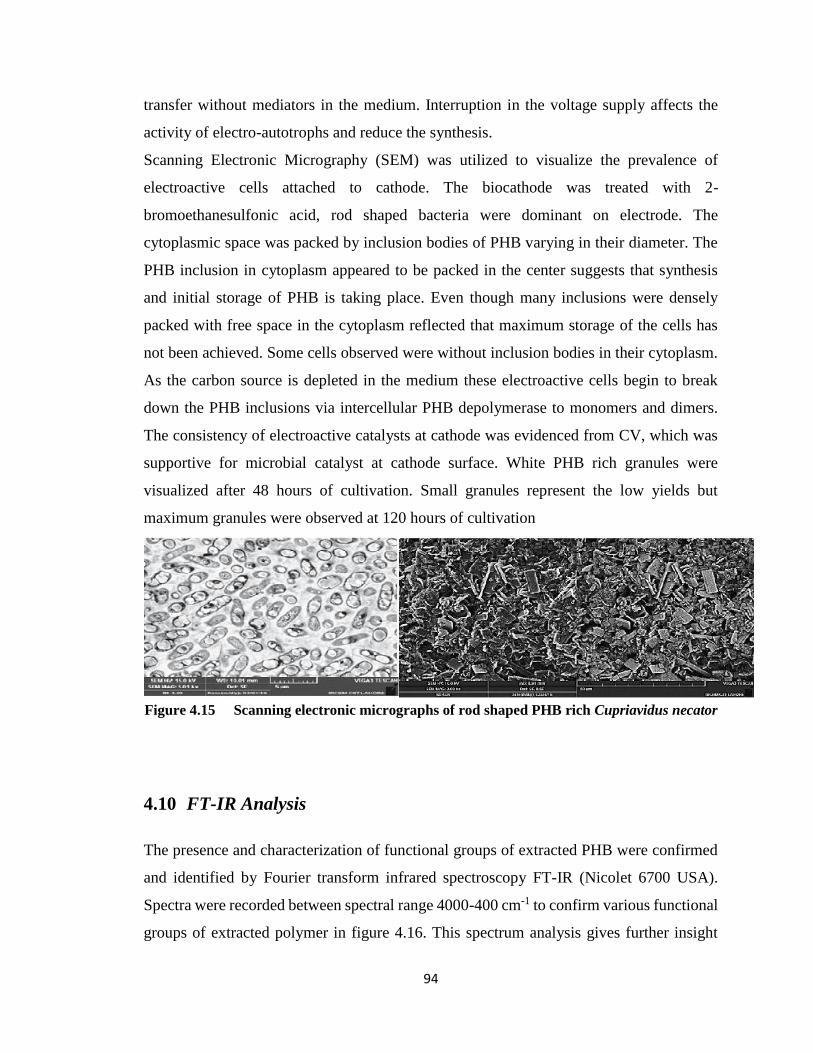
94
transfer without mediators in the medium. Interruption in the voltage supply affects the
activity of electro-autotrophs and reduce the synthesis.
Scanning Electronic Micrography (SEM) was utilized to visualize the prevalence of
electroactive cells attached to cathode. The biocathode was treated with 2-
bromoethanesulfonic acid, rod shaped bacteria were dominant on electrode. The
cytoplasmic space was packed by inclusion bodies of PHB varying in their diameter. The
PHB inclusion in cytoplasm appeared to be packed in the center suggests that synthesis
and initial storage of PHB is taking place. Even though many inclusions were densely
packed with free space in the cytoplasm reflected that maximum storage of the cells has
not been achieved. Some cells observed were without inclusion bodies in their cytoplasm.
As the carbon source is depleted in the medium these electroactive cells begin to break
down the PHB inclusions via intercellular PHB depolymerase to monomers and dimers.
The consistency of electroactive catalysts at cathode was evidenced from CV, which was
supportive for microbial catalyst at cathode surface. White PHB rich granules were
visualized after 48 hours of cultivation. Small granules represent the low yields but
maximum granules were observed at 120 hours of cultivation
Figure 4.15 Scanning electronic micrographs of rod shaped PHB rich Cupriavidus necator
4.10 FT-IR Analysis
The presence and characterization of functional groups of extracted PHB were confirmed
and identified by Fourier transform infrared spectroscopy FT-IR (Nicolet 6700 USA).
Spectra were recorded between spectral range 4000-400 cm-1 to confirm various functional
groups of extracted polymer in figure 4.16. This spectrum analysis gives further insight

95
into the structure of polymer. Absorption bands occurring at 2935 and 2874 cm-1indicated
the presence of aliphatic –CH3 and –CH2 groups. Absorption bands at 1739 and 1276 cm-1
were corresponding to C=O and C-O stretching groups and were identical to PHB from
Cupriavidus necator. The absorption bands at 3000 and 3400 cm-1 were for C-H and OH
groups. Results presented in figure were identical to the results in literature
Figure 4.16 FT-IR spectroscopy of PHB biopolymer by Cupriavidus necator
The absorption bands are in accordance with those stated in literature (Thawadi et al.,
2012). All absorption bands appeared in spectrum reflected the monomeric units of PHA.
The bio-electrochemical synthesis by Cupriavidus necator with industrial waste molasses
and greenhouse gas CO2 substantially reduced the substrate cost and downsize the cost of
production. The methodology utilized further to simplify the reactor with DC power source
enhanced the coulombic efficiency and electron recovery in products. The 75% PHB
production with recent new technique was equivalent to previous studies.
Statistical analyses were performed using the SPSS statistical package (version 23.0). Data
means were tested at significance levels of P < 0.05 using one way ANOVA.

96
Table 4.3 Comparison (ANOVA) of continuous and batch process for Cupriavidus necator
Source N Mean Std.
Deviation
Std.
Error
95% Confidence Interval
for Mean
Minimu
m
Maximu
m
Lower
Bound
Upper
Bound
Continuous
process (1.00) 15 11.0651 10.13270 2.61625 5.4537 16.6764 -0.05 33.91
Batch Process
(2.00) 15 19.3654 22.47475 5.80295 6.9193 31.8115 2.00 79.20
Total 30 15.2152 17.64176 3.22093 8.6277 21.8028 -0.05 79.20
Table 4.4 Determination of Sum of Squares, df, Mean Square, F and p values for
continuous and batch process for harvesting waste (molasses and carbon dioxide) to
biopolymer (PHB) using Cupriavidus necator
Sum of Squares Df Mean
Square
F value p-value
Between Groups 516.716 1 516.716 1.700 0.203
Within Groups 8509.003 28 303.893
Total 9025.718 29
One-Way ANOVA was performed for Cupriavidus necator manifested in the Table 4.3 &
Table 4.4. It was found that there is no significant difference (p=0.203) between both
processes (p>0.05). Hence, statistically it can be concluded that both batch and continuous
processes do not vary significantly in terms of concentration levels. However, during
performance, standard error for batch process is more than continuous one. It is concluded
that PHB can be synthesized using any process.

97
4.11 Sporomusa ovata
Bio-electrochemical synthesis of plethora of products were compared both in batch and
continuous system by Sporomusa ovata where CO2 was exploited to provide the desired
concentration of carbon contents. An external power supply at cathode as sole electrons
donor for reduction of CO2 to diversity of extracellular multicarbon products. S.ovata can
grow on cathode surface to derive electron for multicarbon compounds providing the proof
for the concept that the carbon dioxide can be converted to valuable products with supply
of electricity. S.ovata the Gram negative bacteria interacts with cathode by C-type
cytochromes and IV pili (Tremblay et al., 2015). It has been mentioned that C-type
cytochromes are responsible for extracellular electron transfer pathway in electrotrophic
bacteria (Nevin et al., 2011). Thus pure culture of acetogen has tendency to accept
electrons directly from cathode to commodities with high coulombic efficiencies. Further
these screened samples were characterized by GC-MS method of identification and
quantification of organic compounds.
Most of the previous research were based on fermentation process for the synthesis of
biofuels like ethanol, butanol and acetone with variety of substrates. Bio-electrochemical
synthesis was explored by (Nevin et al, 2010) who converted CO2 to acetate first time. To
this date BES has been exploited for acetate, butyrate, methane, hydrogen and ethanol
(Batlle et al, 2015) and (Marshall et al, 2012) and other high value added products (Rabaey
et al., 2010). The present research effort was currently focused to synthesize higher value
added compounds ethanol, butanoic acid, pentanol, hexanoic acid and hexanol with pure
culture of acetogens. The implementation of simplified reactor with two stage strategy of
heterotrophic and autotrophic development of biocathode revealed the recent advances
with concomitant production of acetate, ethanol, butanoic acid, pentanol and hexanol. In
recent study pure culture was preferred over mixed communities because according to
previous studies mixed cultures attributed complex metabolic reactions and utilization of
bioproducts by other strains.

98
4.12 Characterization of Bio electrochemically synthesized organic
compounds
The structure and mole fractions of organic acids and other compounds were determined
by GC-MS based on peak area of ions. Various identified compounds along with molecular
weight, retention time is represented in the table 4.5. The major compounds were volatile
fatty acids and alcohols. The highest molecular weight of 116.16 was observed for 2-ethyl
butyrate with corresponding retention time of 21.69. The lowest retention time of 11.2 was
observed for ethanoic acid of molecular weight 60.
Table 4.5 Chemical composition of volatile fatty acids and alcohols revealed by GC-MS
analysis
CN Acetic acid Ethanol Butanoic
acid
Pentanol
Hexanol 2-
ethylbutyr
ate
RT 11.2 16.04 16.9 17.3 20.9 21.69
MW 60 46.06 88.11 88.14 102.17 117.16
DF
MF C2H4O2 C2H6O C4H8O2
C5H12O C6H14O C6H12O2
(RT; retention time in minutes, CN; compound name, MW; molecular weight, MF;
molecular formula; DF displayed formula)

99
4.13 Characterization of organic products synthesized by Sporomusa ovata
The structure and mole fractions of various organic products were based on GC-MS peak
area of ions figures 4.17- 4.20.
Figure 4.17 Gas Chromatogram of various acids and alcohols from Sporomusa ovata
Figure 4.18 Mass spectrum of ethanoic acid
The gas chromatogram of Sporomusa ovata with numerous peaks characterize the presence
of various organic products. Peak with retention time 19.17 exhibited internal standard 2-
ethyl Butanoic acid. The integrated peaks on gas chromatogram exhibiting the various
organic products at m/z 60, 88 and 117 for ethanoic acid, butanoic acid and 2-ethyl butyrate
with retention time 11.2, 16.9 and 21.69 min respectively. Hexanol, ethanol and pentanol
with m/z 102.17, 46.06 and 88.14 with retention time 20.9, 16.04 and 17.3 were clearly
displayed in gas chromatogram figure 4.17. The peaks at retention time 19.01, 21.67, 21.9
indicating the presence of acetic acid diethyl, allyl 2-ethyl butyrate and propyl 2-ethyl
valerate most probably the complex metabolites. The table 4.3 displayed that less retention
time for molecules with low mass and greater the retention time for greater molecular mass,
but in actual the retention time is independent of molecular mass (Ogunjobi et al., 2013).
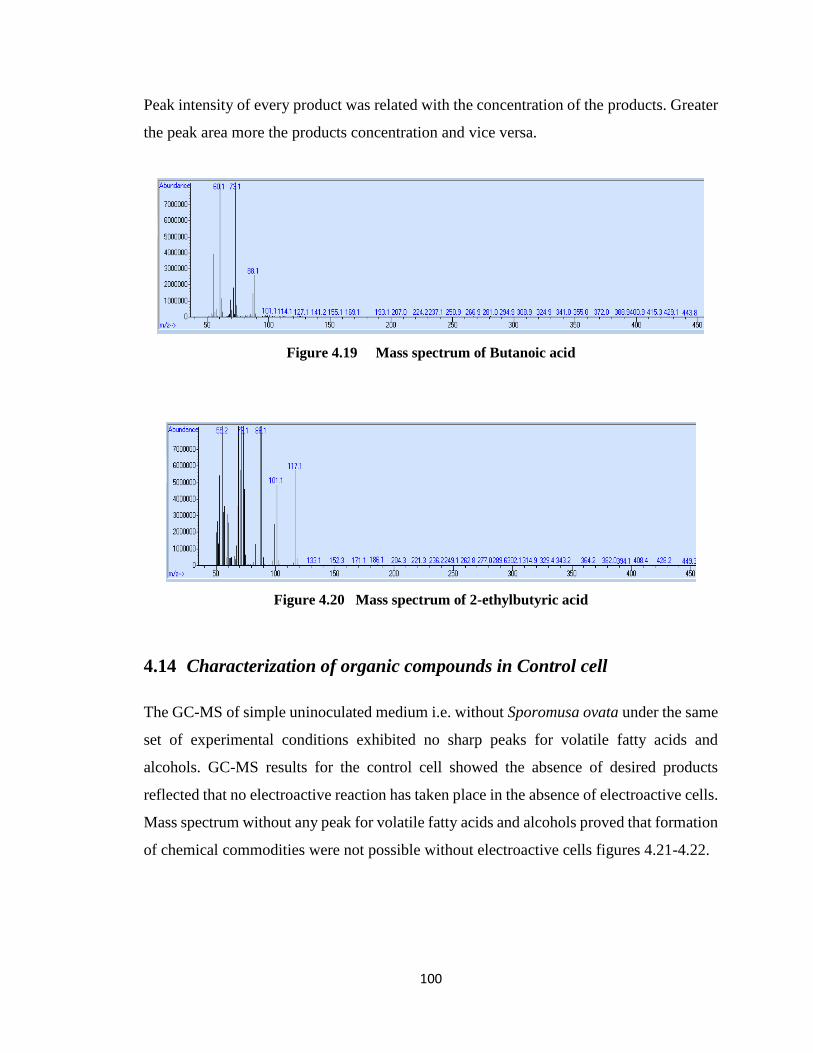
100
Peak intensity of every product was related with the concentration of the products. Greater
the peak area more the products concentration and vice versa.
Figure 4.19 Mass spectrum of Butanoic acid
Figure 4.20 Mass spectrum of 2-ethylbutyric acid
4.14 Characterization of organic compounds in Control cell
The GC-MS of simple uninoculated medium i.e. without Sporomusa ovata under the same
set of experimental conditions exhibited no sharp peaks for volatile fatty acids and
alcohols. GC-MS results for the control cell showed the absence of desired products
reflected that no electroactive reaction has taken place in the absence of electroactive cells.
Mass spectrum without any peak for volatile fatty acids and alcohols proved that formation
of chemical commodities were not possible without electroactive cells figures 4.21-4.22.

101
Figure 4.21 Gas Chromatogram without Sporomusa ovata
Figure 4.22 Mass spectrum of medium without Sporomusa ovata
The organic product with m/z 143 on mass spectrum represented the compound 5-
Formyltetrahydrofolic acid with molecular formula C20H23N7O7 irrelevant to the volatile
fatty acids and alcohols.
The quantification of each organic products were explored by comparing sample peak area
with the calibration curve after time interval of 24 hours. The peak area was dependent on
concentration from gas chromatogram and maximum products concentration were
observed at 120 hours of inoculation of cells The major products were volatile fatty acids
and alcohols and their concentration in mM are exhibited graphically for both batch and
continuous system.
4.14.1 Bio-electrochemical synthesis of organic acids during batch system
Products obtained after every 24 hours during batch system were analyzed by GC-MS.
The concentration of the VFA and alcohols were estimated by calibration curve.

102
Figure 4.23 Bio-electrochemical synthesis of ethanoic acid, butanoic acid and 2-ethyl
butyrate by Sporomusa ovata in batch system
The biotic synthesis of ethanoic acid, butanoic acid and ethyl butyrate were identified in
figure 4.23. The total ethanoic acid concentration was 0.739 mM produced with average
rate of 0.178mM/day. The butanoic acid concentration was 2.04 mM with average
concentration of 0.408 mM/day and ethyl butyrate 1.23 mM/day with average rate of 0.246
mM/day. Formation of acetate and other volatile fatty acids are followed during
exponential growth phase called Acidogenic phase (Ramio et al., 2015 and Mohammadi
et al., 2014).
0
0.5
1
1.5
2
2.5
24 48 72 96 120
Co
nce
ntr
ati
on
.
(mM
)
Time (hours)
ethanoic acid
butanoic acid
2-ethyl butyrate

103
4.14.2 Bio-electrochemical synthesis of alcohols during batch system
Formation of alcohols were observed in slow growth phase with no ATP formation called
solventogenic phase (LaBelle et al., 2014).
Figure 4.24 Bio-electrochemical synthesis of ethanol, Pentanol and hexanol concentration
in mM by Sporomusa ovata in batch system
The average rate of ethanol, pentanol and hexanol were 0.777, 0.23 and 0.371 mM/day
respectively. Ethanol synthesis was observed 3.526 and maximum 3.886 at 96 and 120
hours respectively. The equivalent number of electrons transfer per mole for ethanol was
12, as the number of electrons are less, it causes the bio-electrochemical conversion of
carbon dioxide to organics at higher rate (Choi et al., 2014).
0
0.5
1
1.5
2
2.5
3
3.5
4
4.5
Co
nce
ntr
ati
on
.
mM
Time (hours)
ethanol
pentanol
hexanol
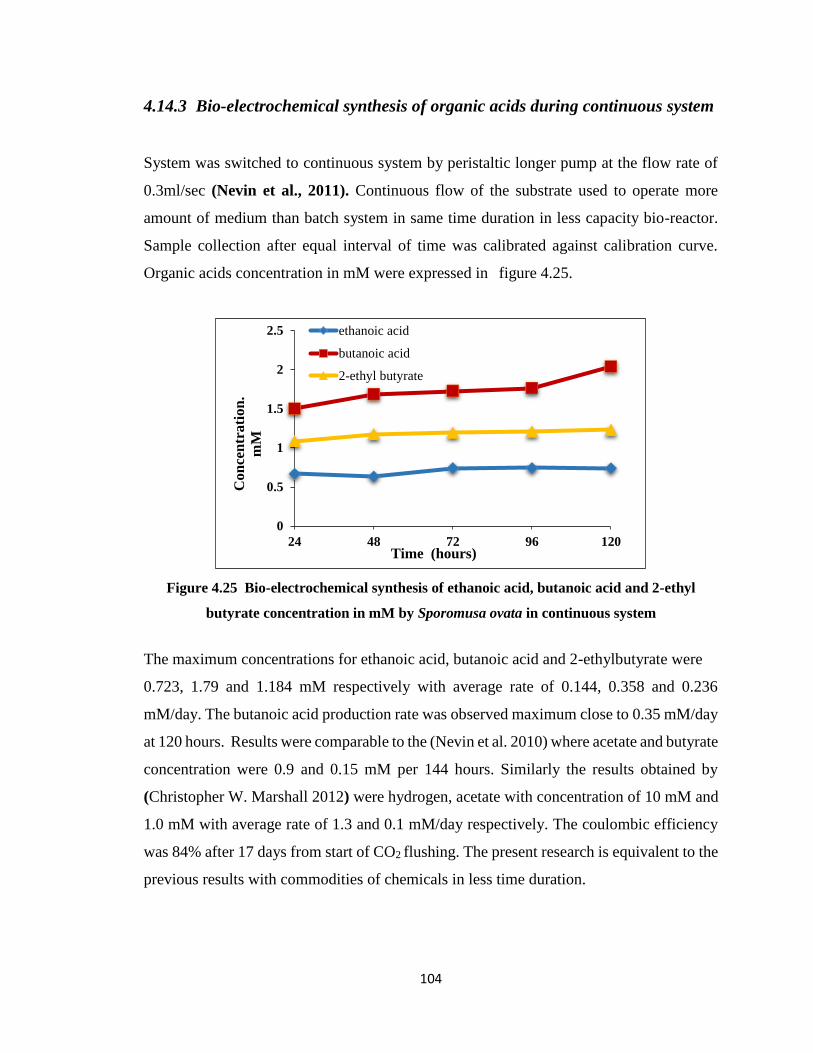
104
4.14.3 Bio-electrochemical synthesis of organic acids during continuous system
System was switched to continuous system by peristaltic longer pump at the flow rate of
0.3ml/sec (Nevin et al., 2011). Continuous flow of the substrate used to operate more
amount of medium than batch system in same time duration in less capacity bio-reactor.
Sample collection after equal interval of time was calibrated against calibration curve.
Organic acids concentration in mM were expressed in figure 4.25.
Figure 4.25 Bio-electrochemical synthesis of ethanoic acid, butanoic acid and 2-ethyl
butyrate concentration in mM by Sporomusa ovata in continuous system
The maximum concentrations for ethanoic acid, butanoic acid and 2-ethylbutyrate were
0.723, 1.79 and 1.184 mM respectively with average rate of 0.144, 0.358 and 0.236
mM/day. The butanoic acid production rate was observed maximum close to 0.35 mM/day
at 120 hours. Results were comparable to the (Nevin et al. 2010) where acetate and butyrate
concentration were 0.9 and 0.15 mM per 144 hours. Similarly the results obtained by
(Christopher W. Marshall 2012) were hydrogen, acetate with concentration of 10 mM and
1.0 mM with average rate of 1.3 and 0.1 mM/day respectively. The coulombic efficiency
was 84% after 17 days from start of CO2 flushing. The present research is equivalent to the
previous results with commodities of chemicals in less time duration.
0
0.5
1
1.5
2
2.5
24 48 72 96 120
Con
cen
trati
on
.
mM
Time (hours)
ethanoic acid
butanoic acid
2-ethyl butyrate

105
4.14.4 Bio-electrochemical synthesis of alcohols during continuous system
The bio-electrochemical synthesis of solventogenic phase was perceived under same set of
experimental conditions. The reactor generated the ethanol, pentanol and hexanol after
carbon dioxide reduction figure 4.26.
Figure 4.26 Bio-electrochemical synthesis of ethanol, pentanol and hexanol in
continuous system by Sporomusa ovata
The comparative study of batch and continuous bio-electrochemical synthesis was found
to be best in batch system. The concentration of ethanoic acid, 2-ethyl butyrate, and
butanoic acid were greater i.e. 0.739, 1.231 and 2.04 mM respectively in the 120 hour of
experiment. Similarly ethanol 3.88 and hexanol 1.85 mM concentrations were greater in
batch system in same time duration. Where as in continuous system ethanol, pentanol and
hexanol concentration was 3.144, 1.247 and 1.058 mM in 120 hours. Greater concentration
in batch system reveals the complete consumption of substrate than continuous system.
The simplified reactor designing along with specialized method to start up autotrophic bio-
cathode by heterotrophic pre-enrichment, where pure culture of acetogen S.ovata
synthesized the spectrum of chemicals by replacing hydrogen with bio-cathode. The
synthesis of hexanol was reported first time by BES system during 120 hours of minimum
0
0.5
1
1.5
2
2.5
3
3.5
24 48 72 96 120
Con
cen
tra
tio
n
mM
Time (hours)
ethanol
pentanol
hexanol

106
time duration. The previous research by Logan 2013 had reported ethanol, acetate,
propionate, butyrate and butanol after 54 days of mixed culture cultivation were 0.11 mg/L,
20.3 mg/L, 13.03 mg/L, 10.03mg/L and 0.09mg/L respectively. Keeping all these points in
consideration the present research proved the potential in synthesizing unique products.
During the synthesis of these organics, electrons requirement are fulfilled by extraction
from water at the anode and were delivered to cathode poised at -400mV. Though the
cathode and cell surface are negatively charged and there is electrostatic repulsive forces
but the interaction of cells with cathode for biofilm formation was evidenced by current
consumption which was greater after the biofilm development than the medium without
cells evidenced by cyclic voltammetry. The recovery of electrons in the synthesis of
various organic products were optimum at applied potential of -600 and -700 mV there is
remarkable synthesis of hydrogen (LaBelle et al., 2014). The synthesis of hydrogen
causes hindrance in coulombic recovery of other products. Therefore electroactive cells
can accept electrons directly from cathode in the absence of hydrogen. Higher voltage like
3.0 V are acceptable if there is an excess of electricity to be stored like intermittent
renewable energy source otherwise conservative voltage scheme is desirable. Acetogenic
bacteria utilize the reductive acetyl-CoA pathway to form organics. The supply of -400mV
was more favorable for the reduction potential of NADH. Sporomusa ovata has tendency
to accept electron directly from the cathode due to the presence of genes coding C-type
cytochromes and type 1V pili. Sporomusa ovata with well-characterized components of
extracellular transfer pathways indicates its similarity with electrogenic and electrotrophic
bacteria (Tremblay et al., 2015). During metabolic reactions these electrons are utilized
for the formation of volatile fatty acids and alcohols. These electro-autotrophs are able to
fix CO2 as sole carbon source by accomplishing Wood–Ljungdahl (WL) pathway. Wood-
Ljungdahl pathway is more efficient pathway requires only 8 enzymes, 4 moles of
hydrogen and less than one mole of ATP to convert electrons to electro fuels. In this
pathway two moles of CO2 are reduced to form one mole of acetyl-CoA. Acetyl-CoA goes
through the catabolic pathway to make ATP which provides the energy to bacteria. The
key enzymes in the acetyl-CoA pathway are carbon monoxide dehydrogenase/acetyl-CoA
synthase complex (CODH/ACS) and formate dehydrogenase (FDH), methyltransferase.

107
CODH/ACS complex contains nickel and iron and Formate dehydrogenases contain either
tungsten or molybdenum and has both CO oxidation and acetyl-CoA synthesis activities.
Certain metals play essential role in microbial growth and metabolism but abundance of
these elements are toxic for microbial life. The trace elements are the basic requirement for
their role in enzymes and cofactors in metabolic pathways. Cobalt, nickel, tungsten and
molybdenum are very important metals in homoacetogenic pathways. Most of these
elements are metal center in enzymes or as cofactors. Nickel has been found in many
enzymes like carbon monoxide dehydrogenase. Molybdenum and tungsten are important
trace elements for the growth of microorganisms, gram positive bacteria. Enzymes with
these elements catalyzes the oxidation reactions like formate dehydrogenase (FDH),
formylmethanofuran dehydrogenase (FMDH). FDH catalyzes the first reaction of CO2
reduction to formate in the acetyl-CoA pathway. Formation of acetate and other volatile
fatty acids are followed during exponential growth phase called Acidogenic phase while
alcohols are produced in slow growth phase with no ATP formation called solventogenic
phase.
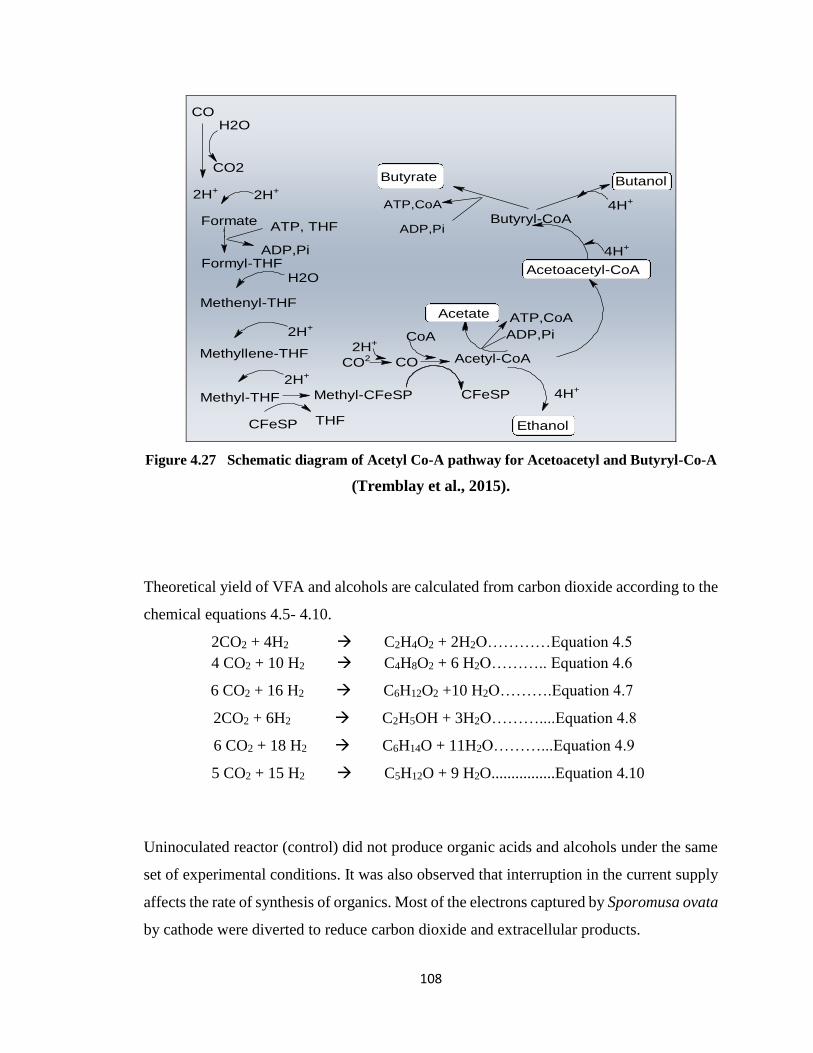
108
COH2O
CO2
2H+2H+
Formate
Formyl-THF
Methenyl-THF
Methyllene-THF
Methyl-THF Methyl-CFeSP
CFeSP THF
2H+
2H+
H2O
ATP, THF
ADP,Pi
CO2 CO
2H+
Acetyl-CoA
CoA
CFeSP
Acetate
4H+
ADP,Pi
ATP,CoA
Butyryl-CoA
ATP,CoA
ADP,Pi
4H+
4H+
ButanolButyrate
Acetoacetyl-CoA
Acetate
Ethanol
Figure 4.27 Schematic diagram of Acetyl Co-A pathway for Acetoacetyl and Butyryl-Co-A
(Tremblay et al., 2015).
Theoretical yield of VFA and alcohols are calculated from carbon dioxide according to the
chemical equations 4.5- 4.10.
2CO2 + 4H2 C2H4O2 + 2H2O…………Equation 4.5
4 CO2 + 10 H2 C4H8O2 + 6 H2O……….. Equation 4.6
6 CO2 + 16 H2 C6H12O2 +10 H2O……….Equation 4.7
2CO2 + 6H2 C2H5OH + 3H2O………....Equation 4.8
6 CO2 + 18 H2 C6H14O + 11H2O………...Equation 4.9
5 CO2 + 15 H2 C5H12O + 9 H2O................Equation 4.10
Uninoculated reactor (control) did not produce organic acids and alcohols under the same
set of experimental conditions. It was also observed that interruption in the current supply
affects the rate of synthesis of organics. Most of the electrons captured by Sporomusa ovata
by cathode were diverted to reduce carbon dioxide and extracellular products.
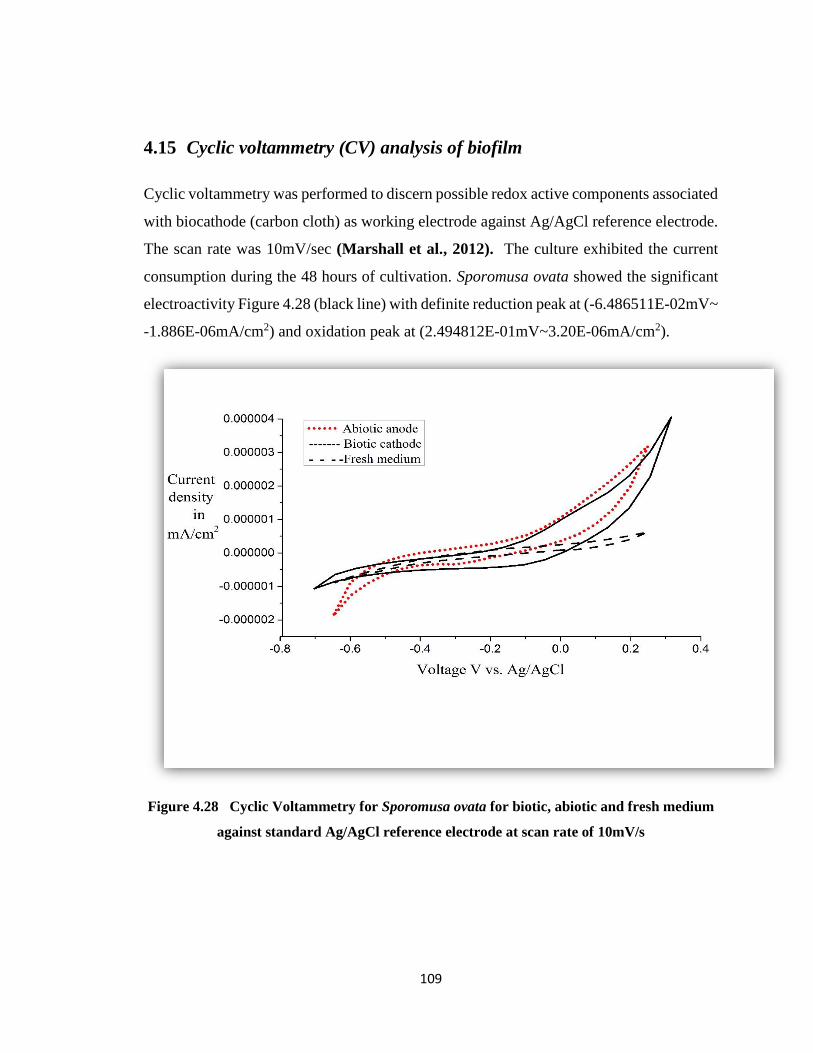
109
4.15 Cyclic voltammetry (CV) analysis of biofilm
Cyclic voltammetry was performed to discern possible redox active components associated
with biocathode (carbon cloth) as working electrode against Ag/AgCl reference electrode.
The scan rate was 10mV/sec (Marshall et al., 2012). The culture exhibited the current
consumption during the 48 hours of cultivation. Sporomusa ovata showed the significant
electroactivity Figure 4.28 (black line) with definite reduction peak at (-6.486511E-02mV~
-1.886E-06mA/cm2) and oxidation peak at (2.494812E-01mV~3.20E-06mA/cm2).
Figure 4.28 Cyclic Voltammetry for Sporomusa ovata for biotic, abiotic and fresh medium
against standard Ag/AgCl reference electrode at scan rate of 10mV/s

110
4.15.1 Cyclic voltammetry analysis for Control cell without electroactive catalysts
The cyclic voltammetry of control cell with fresh medium and supernatant with carbon
cloth as a working and Ag/AgCl as reference electrode was without definite redox peaks.
The medium where the bacteria were removed after centrifugation did not show the redox
potential but after two days cultivation the fresh medium was re-filled in the cathode and
it retained the electrochemical activities due to the development of electroactive
components. When the potential was applied the current consumption was recovered
indicated that electron transfer was without mediator between cathode and biofilm. Stirring
the solution did not substantially affect the current consumption and increase in products
provides the evidence for the direct electron transfer from the cathode to biofilm.
Interruption in the voltage supply affects the activity of electro-autotrophs and reduce the
synthesis.
Scanning electron micrography (SEM) was utilized to visualize the prevalence of
electroactive cells attached to cathode figure 4.29. The biocathode was treated with 2-
bromoethanesulfonic acid before scanning, biofilm formation was perceived. The
dominant morphology was rod shaped bacteria varying in size on electrode. The
consistency of electro-autotrophs at cathode was evidenced from CV, which was
supportive for microbial catalyst at cathode surface (Marshall et al., 2012). The
electroactive cells intimately associated with carbon electrode surface would be expected
for direct electron transfer from electrode to cell. No visible turbidity in the cathode
chamber was consistent with previous studies of direct electron driven respiration (Nevin
et al., 2010). The biofilm was responsible further for current consumption and carbon
dioxide reduction.
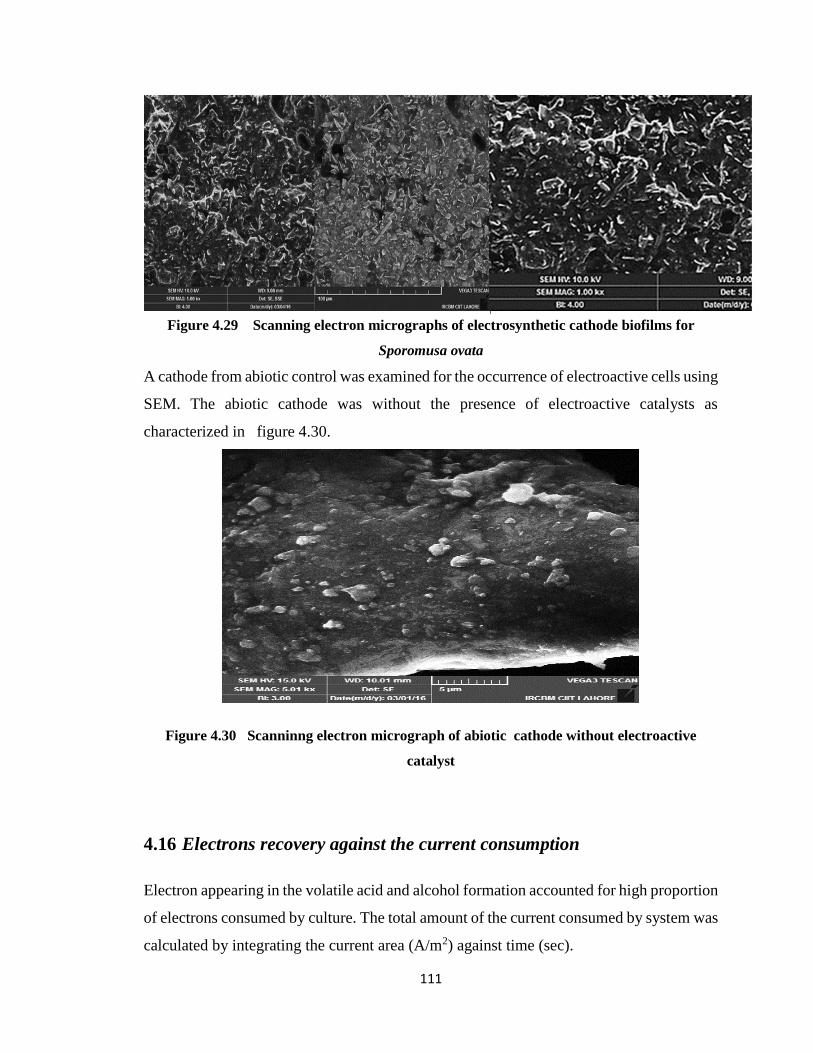
111
Figure 4.29 Scanning electron micrographs of electrosynthetic cathode biofilms for
Sporomusa ovata
A cathode from abiotic control was examined for the occurrence of electroactive cells using
SEM. The abiotic cathode was without the presence of electroactive catalysts as
characterized in figure 4.30.
Figure 4.30 Scanninng electron micrograph of abiotic cathode without electroactive
catalyst
4.16 Electrons recovery against the current consumption
Electron appearing in the volatile acid and alcohol formation accounted for high proportion
of electrons consumed by culture. The total amount of the current consumed by system was
calculated by integrating the current area (A/m2) against time (sec).
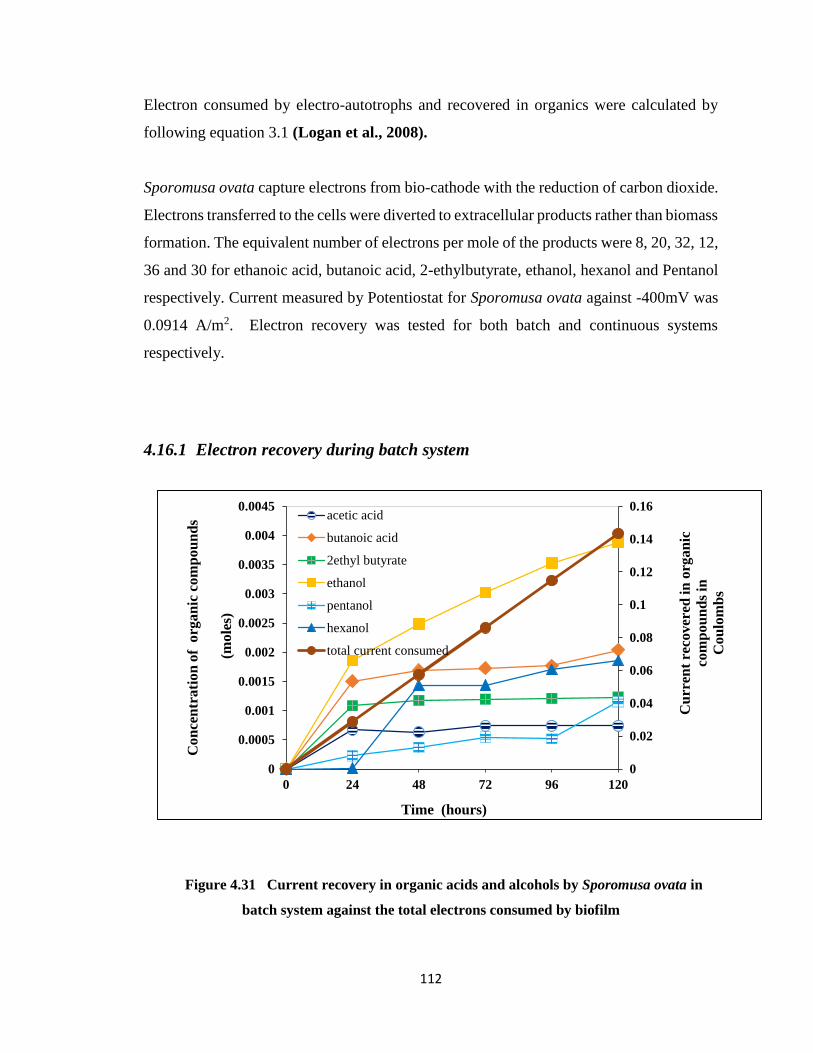
112
Electron consumed by electro-autotrophs and recovered in organics were calculated by
following equation 3.1 (Logan et al., 2008).
Sporomusa ovata capture electrons from bio-cathode with the reduction of carbon dioxide.
Electrons transferred to the cells were diverted to extracellular products rather than biomass
formation. The equivalent number of electrons per mole of the products were 8, 20, 32, 12,
36 and 30 for ethanoic acid, butanoic acid, 2-ethylbutyrate, ethanol, hexanol and Pentanol
respectively. Current measured by Potentiostat for Sporomusa ovata against -400mV was
0.0914 A/m2. Electron recovery was tested for both batch and continuous systems
respectively.
4.16.1 Electron recovery during batch system
Figure 4.31 Current recovery in organic acids and alcohols by Sporomusa ovata in
batch system against the total electrons consumed by biofilm
0
0.02
0.04
0.06
0.08
0.1
0.12
0.14
0.16
0
0.0005
0.001
0.0015
0.002
0.0025
0.003
0.0035
0.004
0.0045
0 24 48 72 96 120
Cu
rren
t re
cover
ed in
org
an
ic
com
pou
nd
s in
Cou
lom
bs
Co
nce
ntr
ati
on
of
org
an
ic c
om
pou
nd
s
(mole
s)
Time (hours)
acetic acid
butanoic acid
2ethyl butyrate
ethanol
pentanol
hexanol
total current consumed

113
Electron recovery of every product was obtained by the total current recovered in the
products to the total current consumed by products figure 4.31.
4.16.2 Percent cathode recovery during batch system
The percent cathode recovery was maximum in batch system like 81% for hexanol, 57%
for ethanol and 50% for butanoic acid as compared to continuous system. The electricity
efficiency to plethora of multicarbon compounds was 80-90% as revealed by (Nevin et al.,
2011 and Nevin et al., 2010) in their previous studies. The present research contributed
the results comparable to the results reported before because of the high electron recovery
during the minimum time duration of 120 hours.
Figure 4.32 Percent Cathode Recovery for organic acids and alcohols by Sporomusa ovata
in batch system
0
10
20
30
40
50
60
70
80
90
0 20 40 60 80 100 120 140
Cath
od
e re
cover
y x
100
Time (hours)
Ethanoic acid
Butanoic acid
2-ethyl butyrate
Ethanol
Pentanol
Hexanol

114
4.16.3 Electron recovery during continuous system
Coulombic recovery of electrons in continuous system where substrate flow rate was
0.3ml/sec and change in substrate concentration was measured in g/L. maximum
recovery was at 120 hours’ time interval figure 4.33.
Figure 4.33 Current recovery in organic acids and alcohols by Sporomusa ovata in
continuous system against total current consumed by biofilm
The equivalent number of electrons per mole of the products were 8, 20, 32, 12, 36 and 30
for ethanoic acid, butanoic acid, 2-ethylbutyrate, ethanol, hexanol and Pentanol
respectively. As these number of electrons goes up the transfer efficiency falls cause the
lowering of bio-electrochemical conversion of carbon dioxide to organics. The
concentration of ethanoic acid is decreased as two acetyl- CoA converted to Acetoacetyl-
CoA which is leading to butyrate and then to butanoic acid. As more H+ ions increase the
internal pH of electroactive cells, so electroactive catalysts trigger the solventogenesis for
the synthesis of alcohols. As the equivalent number of electrons per mole of ethanol is 12
than pentanol and hexanol so revealing the maximum concentration then pentanol and
hexanol. Pentanol and hexanol are in close proximity because of less difference in their
equivalent number of electrons per mole.
0
0.01
0.02
0.03
0.04
0.05
0.06
0.07
0.08
0
0.0005
0.001
0.0015
0.002
0.0025
0.003
0.0035
0 24 48 72 96 120
Cu
rren
t re
cover
ed in
org
an
ic
com
pou
nd
s
Cou
lom
bs
Con
cen
trati
on
of
org
an
ic c
om
po
un
ds
mole
s
Time (hours)
acetic acid
butanoic acid
2-ethyl butyrate
ethanol
pentanol
hexanol
total current
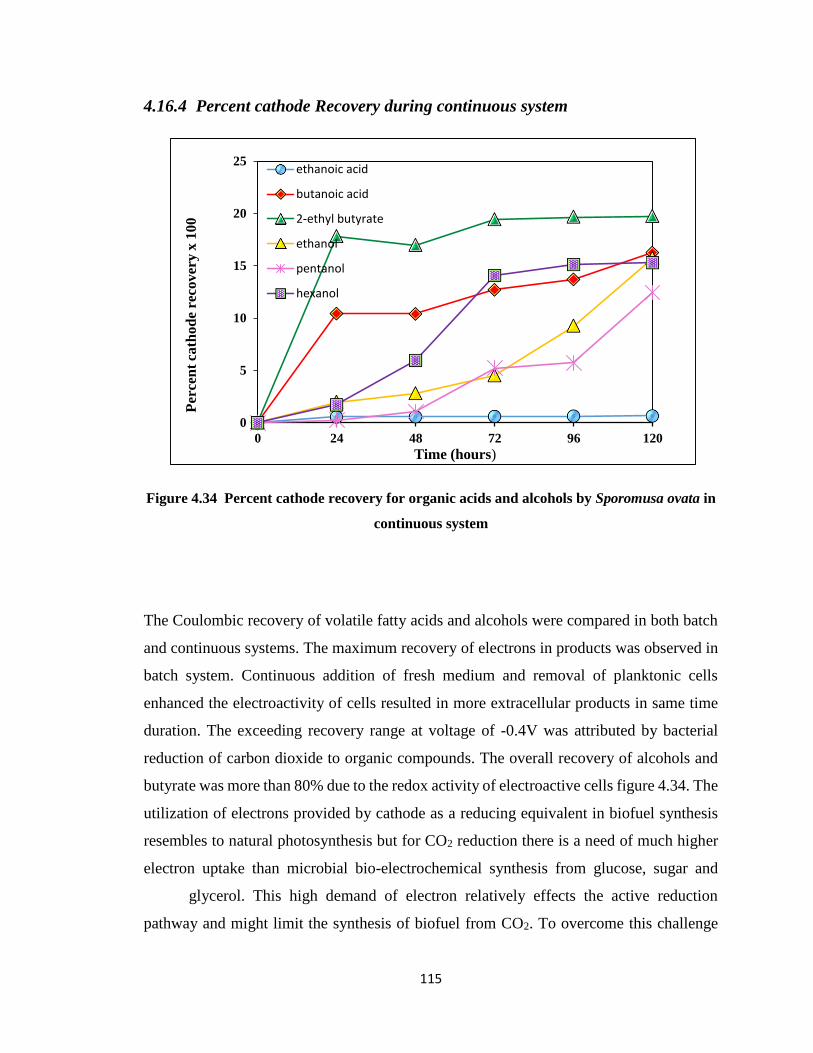
115
4.16.4 Percent cathode Recovery during continuous system
Figure 4.34 Percent cathode recovery for organic acids and alcohols by Sporomusa ovata in
continuous system
The Coulombic recovery of volatile fatty acids and alcohols were compared in both batch
and continuous systems. The maximum recovery of electrons in products was observed in
batch system. Continuous addition of fresh medium and removal of planktonic cells
enhanced the electroactivity of cells resulted in more extracellular products in same time
duration. The exceeding recovery range at voltage of -0.4V was attributed by bacterial
reduction of carbon dioxide to organic compounds. The overall recovery of alcohols and
butyrate was more than 80% due to the redox activity of electroactive cells figure 4.34. The
utilization of electrons provided by cathode as a reducing equivalent in biofuel synthesis
resembles to natural photosynthesis but for CO2 reduction there is a need of much higher
electron uptake than microbial bio-electrochemical synthesis from glucose, sugar and
glycerol. This high demand of electron relatively effects the active reduction
pathway and might limit the synthesis of biofuel from CO2. To overcome this challenge
0
5
10
15
20
25
0 24 48 72 96 120
Per
cen
t ca
tho
de
reco
ver
y x
10
0
Time (hours)
ethanoic acid
butanoic acid
2-ethyl butyrate
ethanol
pentanol
hexanol
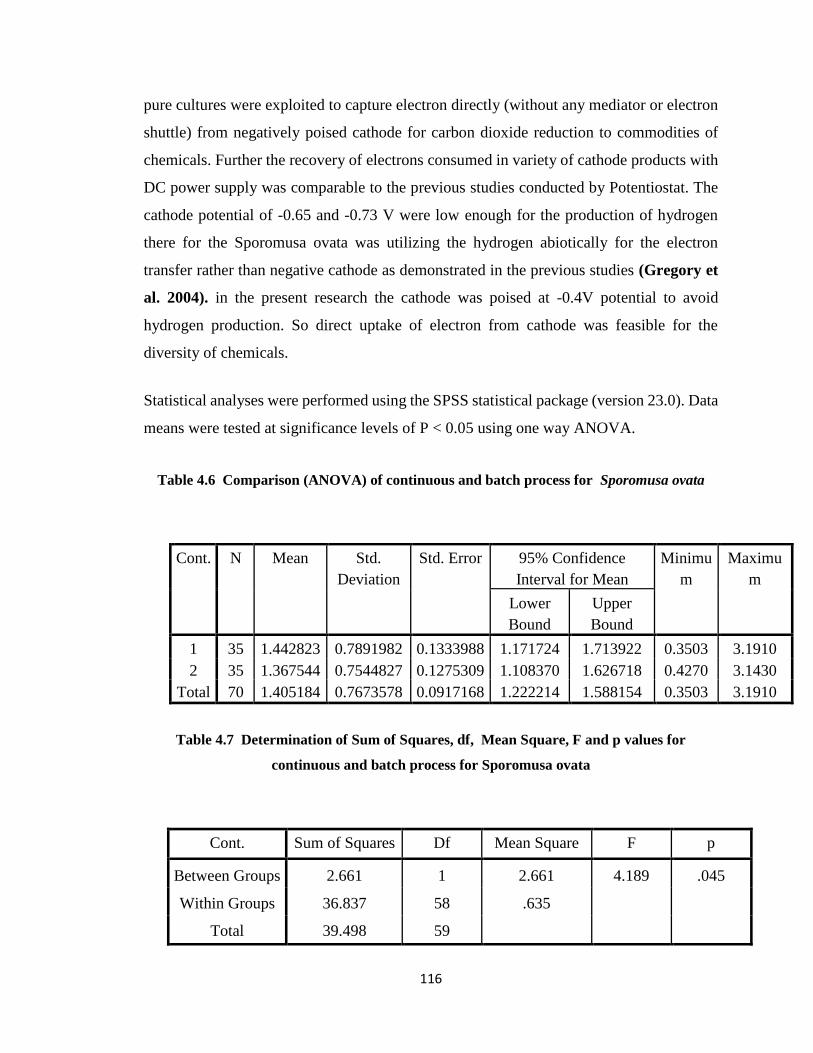
116
pure cultures were exploited to capture electron directly (without any mediator or electron
shuttle) from negatively poised cathode for carbon dioxide reduction to commodities of
chemicals. Further the recovery of electrons consumed in variety of cathode products with
DC power supply was comparable to the previous studies conducted by Potentiostat. The
cathode potential of -0.65 and -0.73 V were low enough for the production of hydrogen
there for the Sporomusa ovata was utilizing the hydrogen abiotically for the electron
transfer rather than negative cathode as demonstrated in the previous studies (Gregory et
al. 2004). in the present research the cathode was poised at -0.4V potential to avoid
hydrogen production. So direct uptake of electron from cathode was feasible for the
diversity of chemicals.
Statistical analyses were performed using the SPSS statistical package (version 23.0). Data
means were tested at significance levels of P < 0.05 using one way ANOVA.
Table 4.6 Comparison (ANOVA) of continuous and batch process for Sporomusa ovata
Cont. N Mean Std.
Deviation
Std. Error 95% Confidence
Interval for Mean
Minimu
m
Maximu
m
Lower
Bound
Upper
Bound
1 35 1.442823 0.7891982 0.1333988 1.171724 1.713922 0.3503 3.1910
2 35 1.367544 0.7544827 0.1275309 1.108370 1.626718 0.4270 3.1430
Total 70 1.405184 0.7673578 0.0917168 1.222214 1.588154 0.3503 3.1910
Table 4.7 Determination of Sum of Squares, df, Mean Square, F and p values for
continuous and batch process for Sporomusa ovata
Cont. Sum of Squares Df Mean Square F p
Between Groups 2.661 1 2.661 4.189 .045
Within Groups 36.837 58 .635 Total 39.498 59

117
One-Way ANOVA was performed for Sporomusa ovata manifested in the Table 4.6 &
Table 4.7. It was found that there was significant difference (p=0.045) between both batch
and continuous processes (p<0.05). Hence, statistically it can be concluded that batch
process vary significantly in terms of concentration level.
118
4.17 Clostridium ljungdahlii
Clostridium ljungdahlii is anaerobic gram positive bacteria. Gram positive bacteria can
establish the electrical link with negative cathode to capture electrons. Present research was
conducted to evaluate the efficiency of gram positive bacteria for their carbon dioxide
reduction with negatively poised cathode. Previous studies reported that Clostridium
ljungdahlii is devoid of genes responsible for synthesis of cytochromes. In Clostridium
ljungdahlii RnF is multidirectional device for proton translocation, nitrogen fixation and
electron transportation. RnF complexes are ion pumps with membrane bound electron
transfer system. RnF complex develops proton gradient over membrane in both
heterotrophic and autotrophic conditions. Autotrophic growth is completely inhibited
without RnF complex, designates that RnF complex is involved in electron transport as
well as in energy conservation (Pier et al., 2016).
Bio-electrochemical synthesis with mixed communities starting with autotrophic
biocathode was first reported by (LaBelle et al., 2014 and Zaybak et al., 2013), and
Pisciotta et al., 2012) registered six products ethanol, hydrogen, acetate, butyrate, butanol
and propionate in mixed community reactor. The acetate production at rate 1.3
mM/day/cm2 with mixed community was testified by (Jourdin et al., 2014) but
simultaneous production of methane were observed because of the coexistence of
methanogens unless methanogenic inhibitor was introduced to cathode reactor. Pure
culture acetogens were harvested in BES system first time by (Nevin et al., 2011) for the
synthesis of acetate and 2-oxobutyrate. The present research was directed to investigate the
spectrum of chemicals from C!-C7 platform with pure culture of Clostridium Ljungdahlii.
The concomitant production of seven valuable products along with heptanoic acid and
heptanol was a potential achievement in this research.
Bio-electrochemical system was operated by establishing autotrophic biocathode with
Clostridium ljungdahlii where waste greenhouse gas CO2 was sole carbon source
throughout the experiment. Batch and continuous systems were analyzed for coulombic
recovery of biofuels. Identification and quantification of samples were performed by GC-
MS.

119
4.18 Characterization of Bio-electrochemically synthesized organic
compounds
The structure and mole fractions of volatile fatty acids and alcohols determined by GC-MS
were based on peak area of ions. Greater the peak height more the concentration of
products. Various identified compounds along with molecular weight, retention time and
structural formula are listed in table 4.8.
Table 4.8 Chemical composition of volatile fatty acids and alcohols revealed by GCMS
analysis (RT; retention time in minutes, CN; compound name, MW; molecular weight, MF;
molecular formula, DF; displayed formula).
CN Heptanol Acetic
acid
Ethanol Ethyl
butyrate
Hexanol
Hexanoi
c acid
Heptanoi
c acid
RT 4.89 11.32 16.1 20.31 20.9 21.9 23.2
MW 116.20 60 46.06 117.1 102.17 116.16
130.18
MF C7H16O C2H4O2 C2H6O C6H12O2 C6H14O C6H12O2
C7H14O2
DF
Theoretical yields of organics were calculated with aid of following equations.
2CO2 + 4 H2 C2H4O2 + 2H2O.............. Equation 4.11
6 CO2 + 16 H2 C6H12O2 + 10 H2O…… Equation 4.12
7CO2 + 19 H2 C7H14O2 + 12H2O……..Equation 4.13
2CO2 + 6H2 C2H5OH + 3H2O………Equation 4.14
6 CO2 + 18 H2 C6H14O + 11 H2O…….. Equation 4.15
7 CO2 + 21H2 C7H16O + 13 H2O……..Equation 4.16

120
4.19 Gas Chromatogram and Mass Spectrum for Clostridium ljungdahlii
The integrated peaks on gas chromatogram exhibited the various organic products at m/z
ratio of 60, 117, 101 and 83 for ethanoic acid, ethyl butyrate, heptanoic acid and heptanol
with retention time 11.3, 20.31, 23.2 and 4.8 min respectively. The peaks with retention
time 16.1, 21.9 and 20.9 demonstrated ethanol, hexanoic acid and hexanol respectively. As
the m/z ratio was not exceeding from 120 reflected that there was no presence of other
lipids and the resulting products were pure. Peak with retention time 19.1 exhibited internal
standard 2-ethyl butanoic acid (Ogunjobi et al., 2013).
Figure 4.35 Gas chromatogram for Clostridium ljungdahlii
Figure 4.36 Mass spectrum for ethanoic acid

121
Figure 4.37 Mass spectrum for ethyl butyrate
Figure 4.38 Mass spectrum for heptanoic acid
Figure 4.39 Mass spectrum for heptanol

122
4.20 GC-MS Results for control cell without electro-autotrophs
Figure 4.40 Control cell without electro-autotrophs
Figure 4.41 Mass spectrum of Clostridium ljungdahlii without electro-autotrophs
The GC-MS results of uninoculated medium i.e. without cultivation of Clostridium
ljungdahlii with same set of experimental conditions has manifested clearly that no any
metabolic activities have taken place in the medium. Mass spectrum without any sharp
peaks for organic products revealed that without electroactive cells no desirable products
were formed. The peak with retention time 7.79 and m/z 174 was for Benzene sulfonic
acid, 4-hydroxy not of any volatile organic acids figure 4.40 and 4.41.
4.21 Bio-electrochemical synthesis of organic acids during batch system
The quantification of various organic products were analyzed by comparing sample peak
area with the calibration curve. The major products were volatile fatty acids and alcohols
and their concentration in mM were investigated after regular interval of time figure 4.42.

123
Figure 4.42 Bio-electrochemical synthesis of volatile fatty acids against time duration of
Clostridium ljungdahlii for batch system
Based on the information from GC-MS the maximum rate of ethanoic acid, ethyl butyrate,
and hexanoic acid and heptanoic acid synthesis was estimated 0.598, 0.453, 0.437 and
0.403 mM/day. The concentration of ethanoic acid was maximum 2.99 mM at 120 hour.
Concentrations of hexanoic acid and heptanoic acid were 2.187 and 2.0179 mM at 120
hour of medium cultivation. During first 48 hours concentration of each volatile product
enhanced smoothly but at 72 hours there was decline in the concentration of ethyl butyrate
and hexanoic acid, again followed by increase in concentration at 120 hours of incubation.
The sudden decline in concentration was due to flux in metabolic pathway.
The formation of secondary intermediates can also divert the direction toward other
products. At 72 hours of medium cultivation, suppress in ethyl butyrate and hexanoic acid
concentration was observed because of condensation of butyryl-CoA with acetyl-CoA to
hexanoyl-CoA and then to hexanoate and further to heptanoate (Mohammadi et al., 2014).
One product leading to the formation of second product was the basic reason for the sudden
decrease in concentration.
0
0.5
1
1.5
2
2.5
3
3.5
24 48 72 96 120
Co
nce
ntr
ati
on
(mM
)
Time (hours)
Ethanoic acid
Ethyl butyrate
Hexanoic acid
Heptanoic acid

124
4.22 Bio-electrochemical synthesis of alcohols during batch system
Alcohols concentration were observed maximum at 120 hours of experiment. Ethanol
concentration was 3.19 mM, at average rate of 0.638mM/day figure 4.43. Ethanol
concentration was greater than hexanol and heptanol. Hexanol and heptanol concentration
were observed 2.11 and 0.853 mM with average rate of 0.422mM/day and 0.170mM/day
respectively. The equivalent number of electrons transfer per mole for ethanol was 12, as
the number of electrons are greater, it lowers the bio-electrochemical conversion of carbon
dioxide to chemical products. The similar results were observed for hexanol and heptanol
as their equivalent number of electrons transfer per mole were 36 and 42 respectively.
Solventogenic phase was observed at slow growth phase with no ATP formation (LaBelle
et al., 2014).
Figure 4.43 Bio-electrochemical synthesis of alcohols against time duration of Clostridium
ljungdahlii for Batch system
4.23 Bio-electrochemical synthesis of organic acids in continuous system
After batch synthesis, system was switched to continuous system by peristaltic pump with
flow rate of 0.3 ml/sec (Nevin et al., 2011). After regular interval of time screened samples
0
0.5
1
1.5
2
2.5
3
3.5
24 48 72 96 120
Con
cen
trati
on
(mM
)
Time (hours)
Ethanol
Hexanol
Heptanol

125
in falcon tubes were characterized by GC-MS. Concentration of various organic products
were calculated against the standard curve.
There was spontaneous increase in the concentration of ethanoic acid. During the 72 hours
of incubation the concentration was 0.562mM but sudden rise in concentration was
observed at 120 hours i.e. 2.471mM. Other products ethyl butyrate, hexanoic acid and
heptanoic acid concentration were 1.269, 2.66 and 2.23 mM. The production rate was
reached to 0.254, 0.532 and 0.446 mM/day figure 4.44.
Figure 4.44 Bio-electrochemical synthesis of volatile fatty acids against time duration of
Clostridium ljungdahlii for continuous system
Results obtained from Clostridium ljungdahlii were equivalent to the previous research results of
(Nevin et al. 2010 and Marshall 2012) where acetate concentration was 1.0 mM. (Logan 2013)
reported the concentration of ethanoic acid and butyrate 20.3mg/L and 10.03mg/L respectively
after the 54 days of mixed culture cultivation. The present study of BES system synthesized the
ethanoic acid and butyrate 2.47 mM and 1.26 mM after 120 hours cultivation. Keeping all these
points under consideration it is clear that present research contributed potential results in the
research.
0
0.5
1
1.5
2
2.5
3
24 48 72 96 120
Con
cen
trati
on
.
(mM
)
Time (hours)
Ethanoic acid
Ethyl butyrate
Hexanoic acid
Heptanoic acid
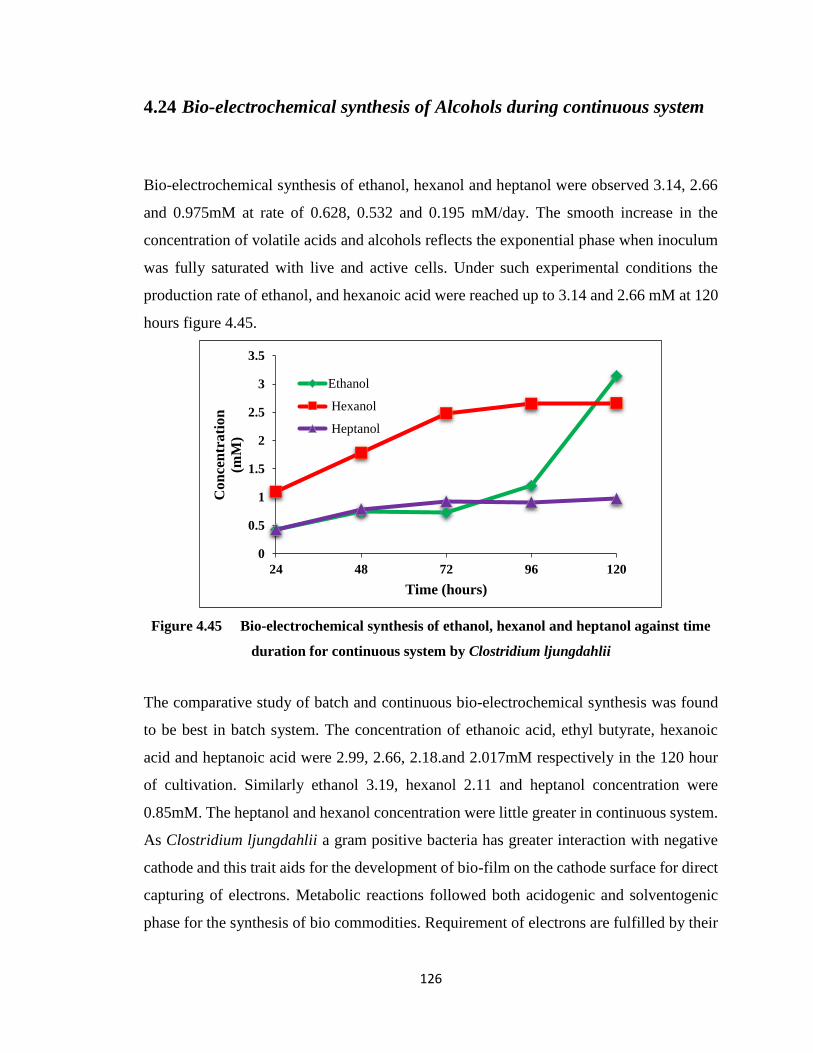
126
4.24 Bio-electrochemical synthesis of Alcohols during continuous system
Bio-electrochemical synthesis of ethanol, hexanol and heptanol were observed 3.14, 2.66
and 0.975mM at rate of 0.628, 0.532 and 0.195 mM/day. The smooth increase in the
concentration of volatile acids and alcohols reflects the exponential phase when inoculum
was fully saturated with live and active cells. Under such experimental conditions the
production rate of ethanol, and hexanoic acid were reached up to 3.14 and 2.66 mM at 120
hours figure 4.45.
Figure 4.45 Bio-electrochemical synthesis of ethanol, hexanol and heptanol against time
duration for continuous system by Clostridium ljungdahlii
The comparative study of batch and continuous bio-electrochemical synthesis was found
to be best in batch system. The concentration of ethanoic acid, ethyl butyrate, hexanoic
acid and heptanoic acid were 2.99, 2.66, 2.18.and 2.017mM respectively in the 120 hour
of cultivation. Similarly ethanol 3.19, hexanol 2.11 and heptanol concentration were
0.85mM. The heptanol and hexanol concentration were little greater in continuous system.
As Clostridium ljungdahlii a gram positive bacteria has greater interaction with negative
cathode and this trait aids for the development of bio-film on the cathode surface for direct
capturing of electrons. Metabolic reactions followed both acidogenic and solventogenic
phase for the synthesis of bio commodities. Requirement of electrons are fulfilled by their
0
0.5
1
1.5
2
2.5
3
3.5
24 48 72 96 120
Con
cen
trati
on
(mM
)
Time (hours)
Ethanol
Hexanol
Heptanol

127
extraction from water in the anode compartment and were delivered to cathode by external
circuit evidenced by cyclic voltammetry. These commodities were comparable with
products specified by (Zaybak et al., 2013 and Marshall et al., 2012) in their previous
studies. As Zaybak and LaBelle mentioned the bio-electrochemical synthesis of six
products butanol, ethanol, acetate, butyrate, hydrogen and propionate from mixed
community microbial catalysts in autotrophic BES synthesis. But the present research
provided the better approach for the synthesis of plethora of chemicals by pure culture of
acetogen in minimum time duration of only 120 hours whereas the previous researches
were conducted for more time duration like 256 hours or two months (Zaybak et al., 2013).
Microorganisms are able to fix CO2 as sole carbon source by accomplishing Wood–
Ljungdahl (WL) pathway, in which two moles of CO2 are reduced to form one mole of
acetyl-CoA. The carbonyl or Western branch of WL reduces one mole of CO2 to CO as a
part of bifunctional CO Dehydrogenase/ Acetyl-CoA Synthase complex (CODH/ ACS).
The methyl or Eastern branch utilizes formate dehydrogenase (FDH) for the reduction of
CO2to formate. FDH is subsequently attached to tetrahydrofolate and reduced to methyl-
group. The carbonyl and methyl groups are combined in Acetyl-CoA Synthase along with
a molecule of coenzyme-A to synthesize acetyl-CoA that can either be used for the
formation of acetate thereby regenerate ATP, or for the formation biomass via anabolism.
In substrate level phosphorylation no net ATP is formed in WL pathways figure 4.46. One
ATP is formed during the conversion of acetyl-CoA to acetate and one molecule is
consumed to form 10-formyltetrahydrofolate via the enzyme 10-formyl-H4folate
synthetase. Acetogens must couple reactions within the WL pathway to generate
transmembrane ion gradients, from which gradient-driven phosphorylation produces ATP.
Two mechanisms has been proposed for gradient driven phosphorylation. First, membrane
bound Rnf complexes generate proton-gradient as in the case of C. Ljungdahlii or
cytochromes generate proton-gradient in other acetogens. The reduction of 10-
methylenetetrahydrofolate to 5-methyltetrahydrofolateis coupled to proton gradient
formation to generate ATP. The second mechanism generates ATP through Na+dependent
gradient. However the ATP generated are small and limit the growth rate and these
consideration argue that microorganisms culturing should be heterotrophically on fructose

128
first to achieve high cell densities and then switched to gaseous substrate for autotrophic
growth (Tracy et al., 2012). The adjusted trace metals concentration in medium are helpful
for the accumulation of butanol and hexanol. As metal atoms are active sites for the electron
transfer and substrate binding in WL pathway. Nickel is active site for carbon monoxide
dehydrogenase (CODH) enzyme to receive electrons from CO in WL pathway. Formate
dehydrogenase and aldehyde oxidoreductase (AOR) enzymes are in alcohol synthesis and
critically tungsten dependent. Mo is equivalent to W to bind active sites in enzyme AOR
that are involved in reduction of organic acids to alcohols. Similarly Fe is the basic
requirement for electron transfer centers in enzymes and cofactors.
Acetyl-CoA undergoes sequential metabolic reactions for the synthesis of organic acids
and alcohols that are successively exported from the cell. Volatile fatty acids and alcohol
synthesis occur sequentially in acidogenesis and solventogenesis metabolic phases (Ramio
et al., 2015). Acids are produced during exponential growth phase and when growth rate
slows down and cells enter the stationary phase, alcohol synthesis starts. Clostridium
ljungdahlii produce alcohols at pH 4 to 4.5 under non growth condition and volatile fatty
acids at pH 6 to 7 (Mohammadi et al., 2014). The undissociated acetic acid penetrates
through the cell membrane resulting in a lower internal pH due to excess of H+ ions.
Electro-autotrophs overcome this physiological stress by producing solvents at low pH.
The dense bacterial culture was obtained with fructose due to the availability of intra
cellular enzymes and cofactors. The use of reducing agents trigger the slow growth of
bacteria because of reduced ATP formation. This non growth condition activates the
alcohol synthesis. The figure 4.46 reflects the trends in acidogenesis and solventogenesis
when medium switched from exponential growth phase to non-growth phase under lower
pH values.
In the recent study hexanoic acid, hexanol and heptanol are reported along with other
compatible liquid fuels. Hexanol synthesis is catalyzed by thiolase enzymes which
condense two molecule of acetyl-CoA to acetoacetyl-CoA and eventually forming butyryl-
CoA. For hexanoic acid and hexanol, thiolase condenses butyryl-CoA with acetyl-CoA to
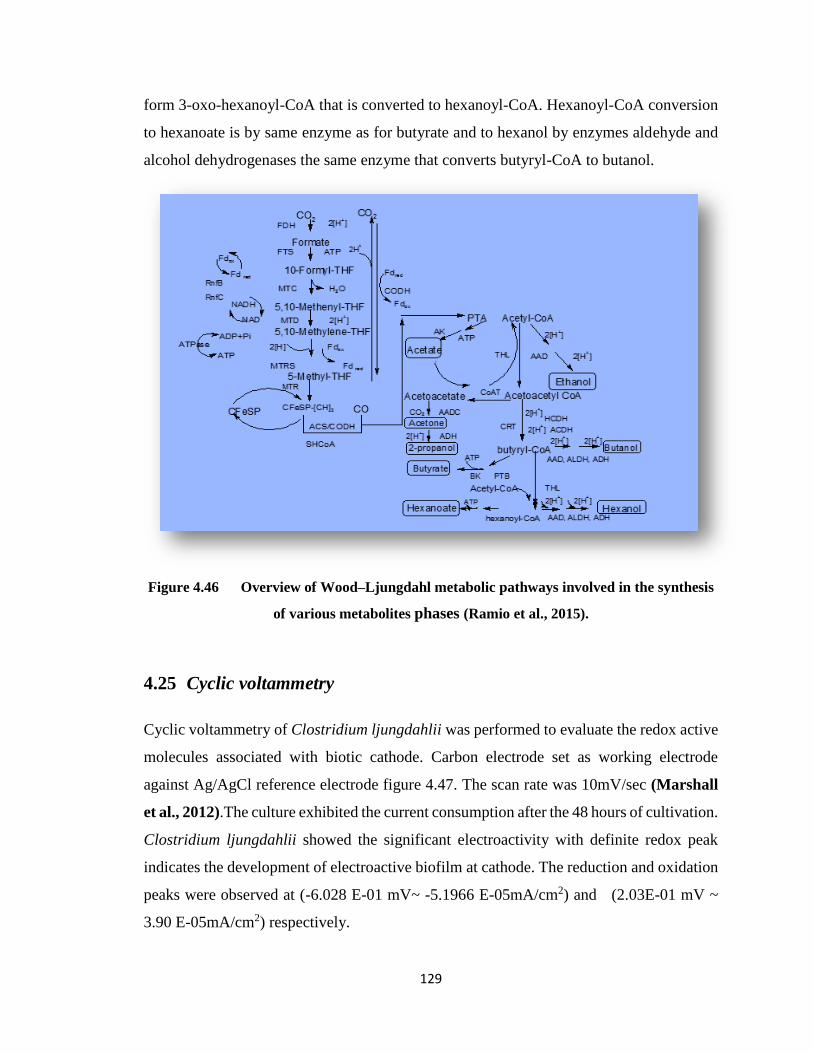
129
form 3-oxo-hexanoyl-CoA that is converted to hexanoyl-CoA. Hexanoyl-CoA conversion
to hexanoate is by same enzyme as for butyrate and to hexanol by enzymes aldehyde and
alcohol dehydrogenases the same enzyme that converts butyryl-CoA to butanol.
Figure 4.46 Overview of Wood–Ljungdahl metabolic pathways involved in the synthesis
of various metabolites phases (Ramio et al., 2015).
4.25 Cyclic voltammetry
Cyclic voltammetry of Clostridium ljungdahlii was performed to evaluate the redox active
molecules associated with biotic cathode. Carbon electrode set as working electrode
against Ag/AgCl reference electrode figure 4.47. The scan rate was 10mV/sec (Marshall
et al., 2012).The culture exhibited the current consumption after the 48 hours of cultivation.
Clostridium ljungdahlii showed the significant electroactivity with definite redox peak
indicates the development of electroactive biofilm at cathode. The reduction and oxidation
peaks were observed at (-6.028 E-01 mV~ -5.1966 E-05mA/cm2) and (2.03E-01 mV ~
3.90 E-05mA/cm2) respectively.

130
In the abiotic control cell of fresh medium without electro-autotrophs did not show the
preferred redox peaks. When CV scan was conducted against the reference electrode. Due
to the absence of electroactive cells i.e. electro-autotrophs, the current transferred through
the circuit was limited because the acceptance of electron at cathode was minimum. The
current density is increased only by increasing the formation of products which was
possible only in the presence of electroactive catalyst. The larger difference in the peak
current in biotic scan and abiotic scan are of note.
Figure 4.47 Cyclic Voltammetry of Clostridium ljungdahlii for biotic, abiotic cathode and
fresh medium against Ag/AgCl reference electrode at scan rate of 10mV/s
When the fresh medium was re-filled in the cathode compartment, it retained the
electrochemical activities due to the development of electroactive catalysts. The current
consumption was recovered again when potential was applied indicated the transfer of

131
current from cathode to electro-autotrophs without mediators. Stirring the solution did not
substantially affect the current consumption and increase in products provides the evidence
for the direct electron transfer from the cathode to biofilm. Interruption in the voltage
supply affects the activity of electro-autotrophs and reduce the synthesis.
Scanning electron microscopy (SEM) was utilized to visualize the prevalence of
electroactive cells attached to cathode figure 4.48. The biocathode was treated with 2-
bromoethanesulfonic acid and then coated with gold 100-Å. Rod shaped electro-autotrophs
were dominant on electrode. The consistency of electro-autotrophs at cathode was
evidenced from CV, which was supportive for microbial catalyst at cathode surface
(Marshall et al., 2012). The electroactive cells intimately associated with carbon electrode
surface would be expected for direct electron transfer from electrode to cell. No visible
turbidity in the cathode chamber was consistent with previous studies of direct electron
driven respiration (Nevin et al., 2010). The biofilm was responsible further for current
consumption and carbon dioxide reduction.
Figure 4.48 Scanning electron micrographs of electrosynthetic cathode biofilms after 24
and 72 hours
The abiotic cathode was examined under scanning electron micrograph for the comparative
studies of electroactive cells. The result signified the absence of electroactive catalyst and
no biofilm was developed as clearly manifested in the figure 4.49.

132
Figure 4.49 Scanning electron micrograph of abiotic cathode without electroactive cells
4.26 Electron recovery against the current consumption
The total amount of the current consumed by system was calculated by integrating the
current (A/m2) against time (sec). The amount of current measured by for Clostridium
ljungdahlii against -400mV applied potential was 0.0848 A/m2. The equivalent number of
electrons per mole of ethanoic acid, ethyl butyrate, hexanoic acid, heptanoic acid, ethanol,
hexanol and heptanol are 8, 32, 32, 38, 12, 36 and 42 respectively.
Clostridium ljungdahlii capture electrons from bio-cathode and reduce carbon dioxide to
extracellular volatile fatty acids and alcohols rather than biomass formation. Electron
recovery was tested for both batch and continuous systems and results were compared by
Coulombic recovery of organic products / total electrons consumption.
Electron recovery for both batch and continuous systems were compared after the biofilm
development at the cathode (Logan et al., 2008).

133
4.26.1 Electron recovery during batch system
Electron recovery of every product was obtained by the total current recovered in the
products to the total current consumed by products figure 4.50.
Figure 4.50 Current recovery in organic acids and alcohols by Clostridium ljungdahlii in
batch system against the total electrons consumed by biofilm
The maximum electron recovery was observed in ethanol and ethanoic acid. Minimum
electron recovery was in heptanol and heptanoic acid.
0
0.02
0.04
0.06
0.08
0.1
0.12
0.14
0.16
0
0.0005
0.001
0.0015
0.002
0.0025
0.003
0.0035
0 24 48 72 96 120
Cu
rren
t re
cover
ed in
org
an
ic c
om
pou
nd
s
Cou
lom
bs
Con
cen
trati
on
of
org
an
ic c
om
pou
nd
s
(mo
les)
Time (hours)
ethanoic acid
ethyl butyrate
hexanoic acid
heptanoic acid
ethanol
hexanol
heptanol
current consumed
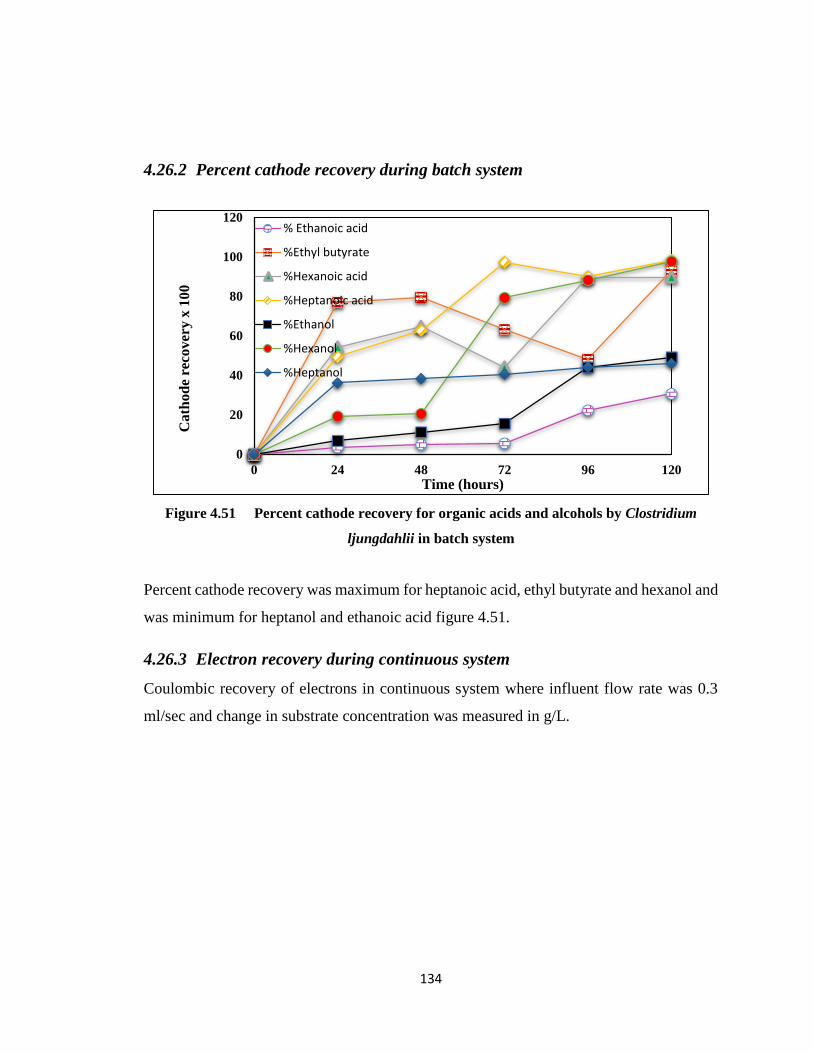
134
4.26.2 Percent cathode recovery during batch system
Figure 4.51 Percent cathode recovery for organic acids and alcohols by Clostridium
ljungdahlii in batch system
Percent cathode recovery was maximum for heptanoic acid, ethyl butyrate and hexanol and
was minimum for heptanol and ethanoic acid figure 4.51.
4.26.3 Electron recovery during continuous system
Coulombic recovery of electrons in continuous system where influent flow rate was 0.3
ml/sec and change in substrate concentration was measured in g/L.
0
20
40
60
80
100
120
0 24 48 72 96 120
Cath
od
e re
cov
ery
x 1
00
Time (hours)
% Ethanoic acid
%Ethyl butyrate
%Hexanoic acid
%Heptanoic acid
%Ethanol
%Hexanol
%Heptanol

135
Figure 4.52 Current recovery in organic acids and alcohols by Clostridium ljungdahlii in
continuous system against the total electrons consumed by biofilm
Numerous products formation causes the complexity and non-linearity in the end results.
In batch system ethanoic, butanoic, hexanoic and heptanoic acids were produced with
slight increase in concentrations till 48 hours, but at 72 hours there was slight decrease in
ethyl butyrate concentration, according to Wood Ljungdahl pathways two acetyl-CoA
converted to Acetoacetyl-CoA which further generating butyryl-CoA leading to butyrate.
But the concentration of butyrate was decreased as butyryl CoA with one more acetyl CoA
was converted to hexanoyl-CoA for the synthesis of hexanoate and then hexanol which in
turn reflected a slight decrease in hexanoic acid graphically. As more and more H+ ions
penetrated through cell membrane and increased the internal pH. To overcome this
physiological stress electroactive catalysts trigger the solventogenesis for the synthesis of
alcohols. This trend reflected in acidogenesis and solventogenesis when medium was
switched from exponential growth phase to non-growth phase under lower pH values.
During batch system ethanoic acid and ethanol were with maximum concentration while
heptanoic acid and heptanol were at low concentration than other products as the transfer
of electrons increased gradually, the reduction of carbon dioxide to organic value added
0
0.1
0.2
0.3
0.4
0.5
0.6
0.7
0.8
0
0.0005
0.001
0.0015
0.002
0.0025
0.003
0.0035
0 24 48 72 96 120
Cu
rren
t re
cov
ered
in
org
an
ic c
om
po
un
ds
in
Co
ulo
mb
s
Co
nce
ntr
ati
on
of
org
an
ic c
om
po
un
ds
(mo
les)
Time (hours)
Moles Ethanoic acid
Moles Ethyl butyrate
Moles Hexanoic acid
Moles Heptanoic acid
Moles Ethanol
Moles Hexanol
Moles Heptanol
Total current consumed
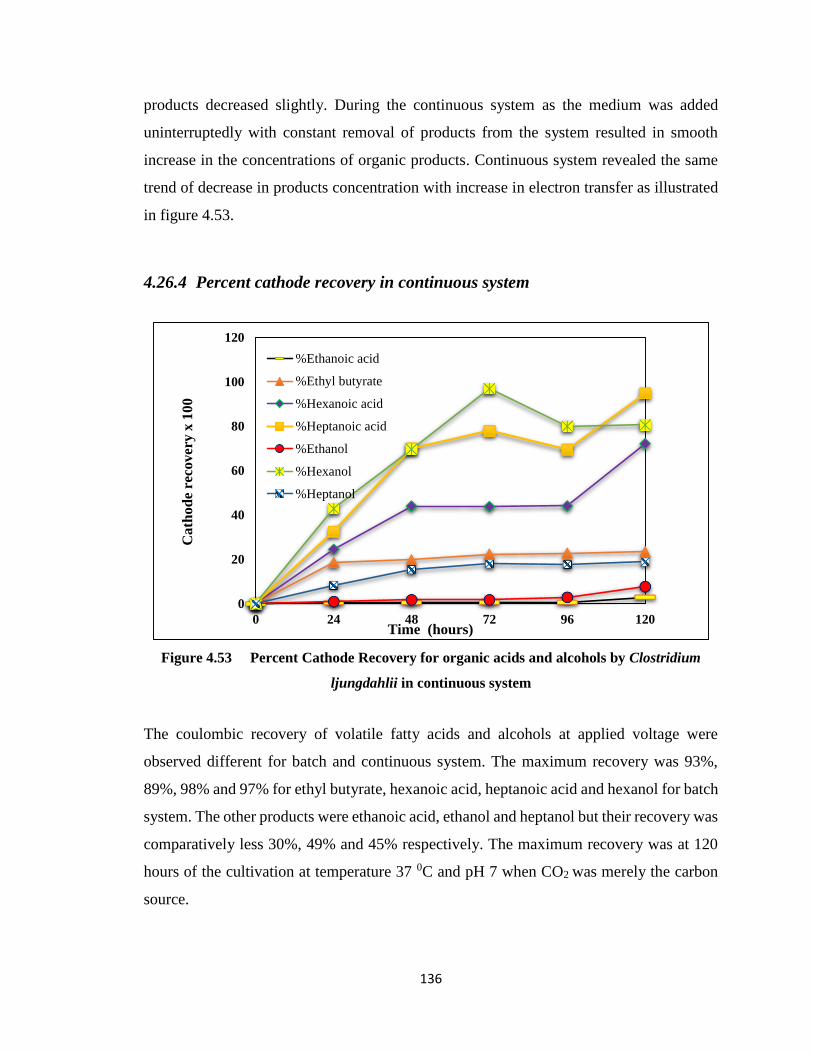
136
products decreased slightly. During the continuous system as the medium was added
uninterruptedly with constant removal of products from the system resulted in smooth
increase in the concentrations of organic products. Continuous system revealed the same
trend of decrease in products concentration with increase in electron transfer as illustrated
in figure 4.53.
4.26.4 Percent cathode recovery in continuous system
Figure 4.53 Percent Cathode Recovery for organic acids and alcohols by Clostridium
ljungdahlii in continuous system
The coulombic recovery of volatile fatty acids and alcohols at applied voltage were
observed different for batch and continuous system. The maximum recovery was 93%,
89%, 98% and 97% for ethyl butyrate, hexanoic acid, heptanoic acid and hexanol for batch
system. The other products were ethanoic acid, ethanol and heptanol but their recovery was
comparatively less 30%, 49% and 45% respectively. The maximum recovery was at 120
hours of the cultivation at temperature 37 0C and pH 7 when CO2 was merely the carbon
source.
0
20
40
60
80
100
120
0 24 48 72 96 120
Cath
od
e re
cover
y x
100
Time (hours)
%Ethanoic acid
%Ethyl butyrate
%Hexanoic acid
%Heptanoic acid
%Ethanol
%Hexanol
%Heptanol
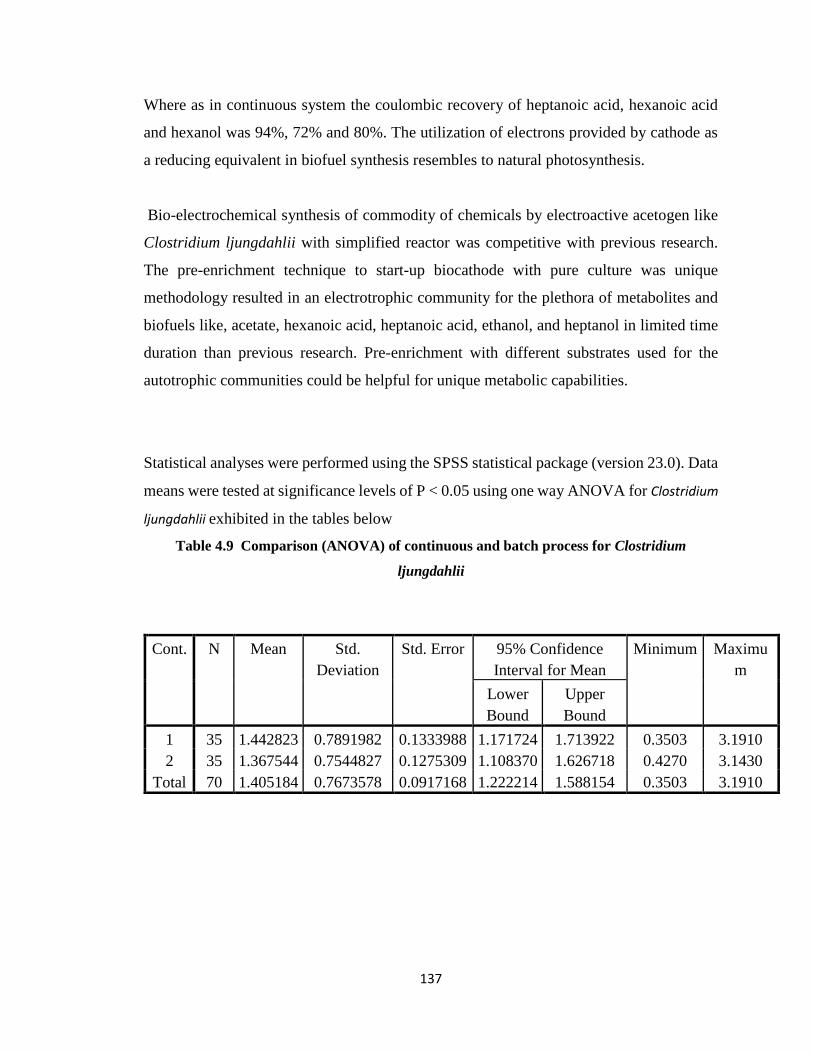
137
Where as in continuous system the coulombic recovery of heptanoic acid, hexanoic acid
and hexanol was 94%, 72% and 80%. The utilization of electrons provided by cathode as
a reducing equivalent in biofuel synthesis resembles to natural photosynthesis.
Bio-electrochemical synthesis of commodity of chemicals by electroactive acetogen like
Clostridium ljungdahlii with simplified reactor was competitive with previous research.
The pre-enrichment technique to start-up biocathode with pure culture was unique
methodology resulted in an electrotrophic community for the plethora of metabolites and
biofuels like, acetate, hexanoic acid, heptanoic acid, ethanol, and heptanol in limited time
duration than previous research. Pre-enrichment with different substrates used for the
autotrophic communities could be helpful for unique metabolic capabilities.
Statistical analyses were performed using the SPSS statistical package (version 23.0). Data
means were tested at significance levels of P < 0.05 using one way ANOVA for Clostridium
ljungdahlii exhibited in the tables below
Table 4.9 Comparison (ANOVA) of continuous and batch process for Clostridium
ljungdahlii
Cont. N Mean Std.
Deviation
Std. Error 95% Confidence
Interval for Mean
Minimum Maximu
m
Lower
Bound
Upper
Bound
1 35 1.442823 0.7891982 0.1333988 1.171724 1.713922 0.3503 3.1910
2 35 1.367544 0.7544827 0.1275309 1.108370 1.626718 0.4270 3.1430
Total 70 1.405184 0.7673578 0.0917168 1.222214 1.588154 0.3503 3.1910
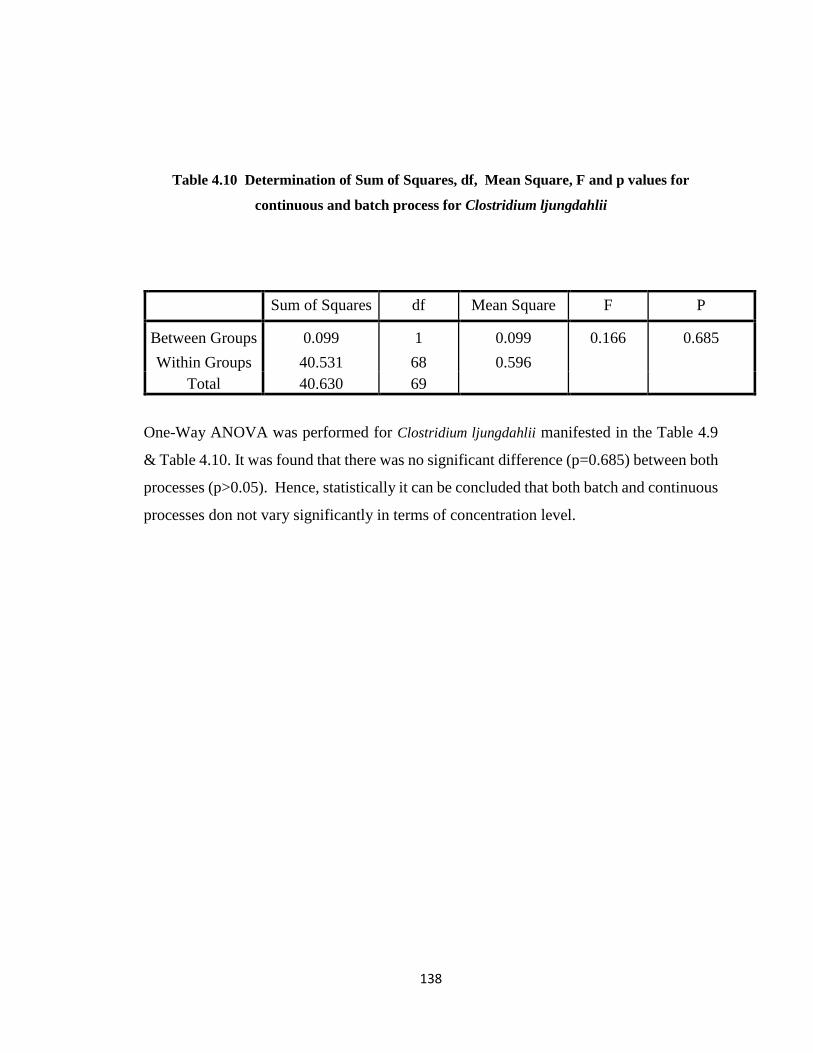
138
Table 4.10 Determination of Sum of Squares, df, Mean Square, F and p values for
continuous and batch process for Clostridium ljungdahlii
Sum of Squares df Mean Square F P
Between Groups 0.099 1 0.099 0.166 0.685
Within Groups 40.531 68 0.596
Total 40.630 69
One-Way ANOVA was performed for Clostridium ljungdahlii manifested in the Table 4.9
& Table 4.10. It was found that there was no significant difference (p=0.685) between both
processes (p>0.05). Hence, statistically it can be concluded that both batch and continuous
processes don not vary significantly in terms of concentration level.

139
4.27 Conclusions
The bio-electrochemical synthesis by autotrophic acetogens having tendency to accept
electrons from cathode has extended the horizon of research. The main aim of current
research was to setup simplified bioelectrochemical reactor to synthesize commodities of
chemicals from waste greenhouse gas carbon dioxide by electro autotrophic acetogens in
less time span. The most investigated configuration in BES reactor was the development
of renewable bio-cathode, more practicable than the precious electrodes of gold, platinum
and copper. Bio cathodes catalysis proved to be less expensive as compared to traditional
cathodes which were causing toxicity, corrosion and denaturation of material. Two stage
strategy employed for heterotrophic pre-enrichment to enhance the anaerobic bio-cathode
development followed by supply of CO2 the sole carbon source to switch microorganisms
from heterotrophic to autotrophic growth. The electroactive catalysts selected for the
current research were Sporomusa ovata, Clostridium ljungdahlii and Cupriavidus necator,
able to capture electrons directly without any mediator making it more operational
technique, was further proved by cyclic voltammetry of the medium inoculated in BES
reactor. The key advantages of direct electron capture from cathode is the direct catalysis
and retention of electroactive catalyst in the cathode chamber. Further the bio-cathode
development was evidenced by scanning electron micrography. The pre-enrichment
technique of bio-cathode development by pure culture rather than mixed community
proved better strategy to reduce waste greenhouse gas CO2 to extracellular carbon
compounds by following the Acetyl-CoA pathway. The acetogens selected for the recent
research were following the Wood-Ljungdahl pathway rather than other carbon fixation
pathways. Wood-Ljungdahl pathway is more efficient pathway requires only 8 enzymes, 4
moles of hydrogen and less than one mole of ATP to convert electrons to electro fuels.
Bio-cathode the electron donor in this research was poised at -0.4V to avoid the hydrogen
production which can causes the loss in coulombic recovery of biofuels. In previous studies
the cathode was poised at fixed potential by potentiostat which was difficult to handle and
fixed potential can damage the cells. Therefore another implementation to simplify the
reactor was DC power supply system which was comparable to the electron recovery of
84% as reported previously for potentiostat poised system. The solar powered UPS can also

140
be attached with BES for the conversion of carbon dioxide to multicarbon compounds. The
electricity driven microbial electrocatalysis of CO2 and water to extracellular multi-carbon
compounds offers the possibility to overcome the problems concerning to the difference
between energy demands and supply and storage difficulties of renewable electricity by
converting it to covalent carbon compounds.
The electroactive catalysts are capable of redox reactions at the electrode and synthesis
of short chain volatile fatty acids, alcohols and polyhydroxyalkanoates etc. The
uninoculated control cell proved that without electroactive cells the redox activity of the
BES reactor was not possible. No redox active cell no valuable products. Carbon dioxide
as substrate in BES reactor offers some advantages like unlimited availability, reduction of
global warming, limited toxicity to the environment and land independence. One
disadvantage associated with the use CO2 as final electron acceptor is the requirement of
large number of electrons. The formation of poly hydroxybutyrate (PHB) and
Polyhydroxyheptanoates (PHH) require 58 and 98 electrons, acetate and ethanol requires
8 and 12 electrons but hexanoic acid, heptanoic acid require 32 and 38 electrons. This large
requirement of electrons implies large current and equivalently high power demand. The
electron recovery in the product formation was compared in both batch and continuous
systems. The study of Clostridium ljungdahlii exhibited the ethanoic acid, hexanoic acid
and heptanoic acid concentrations 2.99 mM, 2.18 mM and 2.017 mM while ethanol yield
was 3.19 mM, hexanol and heptanol was 2.11, 0.853 mM respectively. These results were
observed at 120 hours of batch system at optimum conditions of pH 6.8 and temperature
37 0C. The results for continuous system under the same set of experimental conditions
showed greater concentration in case of heptanoic acid 2.23 mM, hexanoic acid 2.66 mM
hexanol 2.66 mM. The percent cathode recovery was maximum in heptanoic acid 98.39%,
hexanol 97% and in ethanol was 50%. The ANOVA test, a statistical analysis for
comparison between batch and continuous system was performed, from ANOVA table it
was found that F=1.70, with p-value= 0.203, as p-value >0.05. Hence, statistically it can
be concluded that both processes don not different significantly in terms of concentration
level.
Sporomusa ovata the second microbe revealed the products butanoic acid, 2-ethylbutyrate,
ethanol, Pentanol and hexanol with concentration of 2.04, 1.23, 3.88, 1.15 and 1.85 mM
141
were greater in the batch system at 120 hours of batch system. percent cathode recovery
was maximum in hexanol 81.6 %, in butanoic acid 50%, in ethanol 56% and in 2-
ethylbutyrate was 48.14% at optimal conditions of pH 7.0 and temperature 32 0C. The
ANOVA test revealed that value of F= 4.189 and p= 0.045. The p value was lesser than
0.05 which proved the significant difference between the concentration level of batch and
continuous system.
The third facultative bacteria Cupriavidus necator accumulated the 3-hydroxydimethyl
butyrate 33.90 ppm, ethyl-3-hydroxy hexanoate 11.6 ppm and 2, 4-dimethyl heptanoate
8.27 ppm in batch system with percent cathode recovery of 97%, 19.9% and 33.71% and
in continuous system the concentrations were 79.2, 14.8 and 14.7 ppm respectively. The
comparative studies of batch and continuous system exhibited the best results in batch
system with maximum electron recovery i.e., more than 90%. For comparison between the
concentrations level of both batch and continuous system ANOVA test was performed.
The result from ANOVA table represented the F= 0.166 and significant figure was 0.685.
The p value was greater than the set value of 0.05. Hence, statistically it can be concluded
that both processes don not different significantly in terms of concentration level.
The maximum yield in batch studies was due to the complete reduction of substrate to
organic products than in continuous system. Whereas continuous system has some
advantages over batch system for industrial point of view. Continuous system deals with
greater amount of substrate concentration than batch system, all stages of reactions are
carried out simultaneously so overall time required for the process is reduced. Secondly
the continuous system operated in small bio-reactor than batch reactor. On industrial scale
the continuous system is better due to the continuous synthesis in small volume reactor.
The bioplastic yield with electron recovery more than 90% has potential for industrial
implementation. Meanwhile the ethanol synthesis in both strains of Sporomusa ovata and
Clostridium ljungdahlii was 3.88 mM and 3.19 mM respectively with electron recovery of
57% and 49% could be recognized for industrial application. The best achievements were
observed with the microbial strains Clostridium ljungdahlii, the synthesis of heptanoic acid
and heptanol not reported before in the bio-electrochemical synthesis. The concentration
obtained was greater in continuous system 2.23 mM and 0.975 mM at 120 hours of its
cultivation time. Though the hexanol was observed in bio-electrochemical synthesis with

142
microbial strain Sporomusa ovata too but its concentration was 1.855 mM. The
concentration of hexanoic acid and hexanol observed with Clostridium ljungdahlii was
greater than Sporomusa ovata.
The use of fixed current indicates the high synthesis rates in short startup time. Interruption
in the current supply causes disruption in synthesis. Uninoculated cultures did not show
any consumption of the current due to lack of electroactive cells.
BES technology proved its worth not only for the synthesis of high grade multiple
compounds but also for its promising environmental and industrial concerns due to its
sustainability, renewability and environmental friendly traits. The synthesis of VFA, PHB
and alcohols with low cost substrates like molasses and waste gases has made it a novel
bio-synthetic strategy.

143
4.28 Highlights
The bio-electrochemical synthesis of renewable chemicals were investigated from
waste greenhouse gas carbon dioxide.
Nontoxic acetogens Sporomusa ovata, Cupriavidus necator and Clostridium
ljungdahlii were studied for cathode biofilm development and direct capturing of
electrons from cathode.
Specific selection of microorganisms which were able to switch from heterotrophic
to autotrophic metabolism.
Recent study investigated the bio-electrochemical synthesis of PHA by
Cupriavidus necator not reported before.
Cupriavidus necator were electrotrophs proved by 75% yield of PHB in bio-
electrochemical reactor.
The synthesis of hexanoic acid, heptanoic acid, hexanol and heptanol from
Clostridium ljungdahlii were not reported in previous studies.
The synthesis of 2-ethylbutyrate, Butanoic acid, Acetic acid, ethanol, pentanol and
hexanol were remarkable achievements from Sporomusa ovata, in bio-
electrochemical cell.

144
4.29 Future perspective and challenges
Bio-electrochemical synthesis (BES) utilizing CO2 as feedstock an electricity driven
product formation must be demonstrated at pilot scale. The lack of fundamental knowledge
about the electroactivity of bio-catalysts, the cathode materials, the reactor designing and
product recovery require multidisciplinary approaches for sustainable biochemical
synthesis. Optimization and scaling of process are strong requirement for
commercialization. For strong BES technology both operational and technical
considerations are key requirement. A key feature of BES system is the electron exchange
at cathode. The mechanisms of electron shift from cathode to cells are still poorly
understood. The lack of understanding of electron transfer (ET) process make it difficult
to optimize the cathode surface. Comprehension knowledge about microorganisms-
electrode interaction will open new horizons for BES process for effective bio-synthesis.
A major challenge is the need of material to interface with microbial community because
electrodes are not extracellular interfaces for microorganisms. Adaptive evolution can
prove an effective strategy for electron exchange between electro-autotrophs and external
electron acceptors. Material science can play a great role in providing cheap, durable and
highly conductive electrodes with appropriate surface properties. Good electron transport
properties, better attachment of electro-autotrophs, high surface area must be the qualities
of electrode material. The treatment of carbon cloth with gold, palladium or nickel
nanoparticles can promotes the bio-fuel electrosynthesis. These modification of cathode
surface could prove to be a promising approach for CO2 reduction acting as terminal
electron acceptors. Achieving high PHB density by autotrophic cultivation is not simple
process due to low solubility of gases to liquid phase which is a limiting factor for both
bio-mass as well as PHB synthesis. So to enhance the synthesis of biofuels and bio
commodities efficient electrode material, mechanism of electron transport needed because
BES is not only an environmental sustainable approach but also have great tendency to
reduce the fossil fuel dependence and diversity for biofuel synthesis.

145
Chapter 5
References

146
5 References
Abbad-A.S., Manginot-Durr C.L, Amine J, Petitdemange E, and Petitdemange H.
(1995). Isolation and characterization of Clostridium butyricum DSM 5431 mutants
with increased resistance to 1-,3 - Propanediol and altered production of acids.
Applied. Environmental. Microbiology, 61, : 4413-4417.
Abrini J. Naveau H. (1994). Clostridium autoethanogenum species. nov., an anaerobic
bacterium that produces ethanol from carbon monoxide. Archives of Microbiology,
161(4), 345-351.
Aguilera F, Peinado RA , Millán C., Ortega JM, Mauricio JC. (2006). Relationship
between ethanol tolerance, H+-ATPase activity and the lipid composition of the
plasma membrane in different wine yeast strains. International journal of food
microbiology, 110(1), 34-42.
Ahmed A. and Lewis R. S. (2007). Fermentation of biomass-generated synthesis gas
Effects of nitric oxide. Biotechnol Bioengineering, 97(5), 1080-1086.
Allen, T. D., Caldwell, ME. (2010). Alkalibaculum bacchi a CO-oxidizing,
ethanolproducing acetogen isolated from livestock-impacted soil. International
Journal of Systematic and Evolutionary Microbiology,, 60(10), 2483-2489.
Al-Shorgani, N. K., Kalil, M. S. and Yusoff, W. M. (2012). Biobutanol production from
rice bran and de-oiled rice bran by Clostridium saccharoperbutylacetonicum N1-4.
Bioprocess Biosyst Engineering, 35(5), 817-826.
Angenent, L. T., Karim, K., Al-Dahhan, M. H., Wrenn, B. A., Domiguez E., R. (2004).
Production of bioenergy and biochemicals from industrial and agricultural
wastewater. Trends in Biotechnology, 22(9), 477-485.
Angenent, L.T. (2002). Methanogenic population dynamics during startup of a full-scale
anaerobic sequencing batch reactor treating swine waste. Water Resources, 36,
4648–4654.
Appel, A. M., Bercaw, J. E., Bocarsly, A. B., Dobbek, H., DuBois, D. L., Dupuis, M.,
Waldrop, G. L. (2013). Frontiers, opportunities, and challenges in biochemical and

147
chemical catalysis of CO2 fixation. Chemical Reviewes, 113(8), 6621-6658.
doi:10.1021/cr300463y
Arne H., Alex T., Nielsen, M., Hentzer, C., Sternberg, M., Givskov, B., Kjær E., and
Søren Molin. (2000). Quantification of biofilm structures by the novel computer
programme. Molecular Microbiology, 146, 2395-2407.
Atsumi, S., Liao, J. C. (2008). Metabolic engineering for advanced biofuels production
from Escherichia coli. Current Opinion in Biotechnology, 19(5), 414-419.
Berezina, O. V., Sineoky, S. P., Velikodvorskaya, G. A., Schwarz, W., Zverlov, V. V.
(2011). Extracellular glycosyl hydrolase activity of the Clostridium strains
producing acetone, butanol, and ethanol. Applied Biochemistry and Microbiology,
44(1), 42-47.
Bermejo LL, Welker NE, Papoutsakis ET. (1998). Expression of Clostridium
acetobutylicum ATCC 824 genes in Escherichia coli for acetone production and
acetate detoxification. Applied Environmental Microbiology, 64(3), 1079-1085.
Biebl H, Menzel K, Zeng AP, Deckwer WD (1999). Microbial production of 1-,3 -
propanediol. Applied. Microbiology. Biotechnology, 52, 289-297.
Blomqvist, K. (1993). Characterization of the genes of the 2,3-butanediol operons from
Klebsiella terrigena and Enterobacter aerogenes. Journal of Bacteriology, 175,
1392–1404.
Braun, F. Mayer, G. Gottschlk. (1981). Clostridium aceticum (Wieringa), a
microorganism producing acetic acid from molecular hydrogen and carbon
dioxide,. Archives of . Microbiology, 123, 288–293.
Braunegg, G., Sonnleitner B., Lafferty M. (1987). A rapid gas chromatographic method
for the determination of poly-b-hydroxybutyric acid in microbial biomass.
European Journal Applied Microbiology and Biotechnol, 1(6), 22-37.
Byung H.K., Para Be., Rathin D., Zeikusi J. G. (1984). Control of carbon and electron
flow in clostridium acetobutylicum fermentations. utilization of carbon monoxide
to inhibit hydrogen production and to enhance butanol yields. American Society for
Microbiology, 48(4), 764-770.
Chandel A.K, Narasu M.L, Rudravaram R, Pogaku R, Rao LV. (2009). Bioconversion of
de-oiled rice bran (DORB) hemicellulosic hydrolysate into ethanol by Pichia
148
stipitis NCM3499 under optimized conditions. . International Journal of Food
Engineering, 5(1), 817-826.
Chang, I.S., Kim, B.H., Lovitt, R.W., Bang J.S. (2001). Effect of CO partial pressure on
cell-recycled continuous CO fermentation by Eubacterium limosum KIST612,.
Process Biochemistry., 37, 411–421.
Charles L. Meyer, Joseph, W., Eleftherios T., Papoutsakis. (1986). Carbon monoxide
gasing leads to alcohol production and butyrate uptake without acetone formation
in continuous cultures ofClostridium acetobutylicum. Applied Microbiology
Biotechnology, 24(2), 159-167.
Chen X, Zhang DJ, Gao SJ, Xiu ZL, Xu P. (2003). Microbial fedbatch production of 1-,3
-propanediol by Klebsiella pneumonia under micro-aerobic conditions. Applied.
Microbiol. Biotechnology, 63, 143-146.
Chirkov, A.M. (2013). Method of reutilization of carbon dioxide from emissions: Google
Patents.
Choi, O., and Sang, B. I. (2016). Extracellular electron transfer from cathode to microbes:
application for biofuel production. Biotechnol Biofuels, 9, 11. doi:10.1186/s13068-
016-0426-0
Choi, O., Kim, T., Woo, H. M., and Um, Y. (2014). Electricity-driven metabolic shift
through direct electron uptake by electroactive heterotroph Clostridium
pasteurianum. Scientific Reports, 4, 6961. doi:10.1038/srep06961
Claasen P, van L, Lopez C., van Niel, Sijtsma L, Stams AJM, Vries SS, and Weusthuis
RA. (1999). Utilisation of biomass for the supply of energy carriers. Applied
Microbiol Biotechnology, 52, 741-755.
Cotter, J.L., Chinn, M.S. (2009). Influence of process parameters on growth of
Clostridium ljungdahlii and Clostridium autoethanogenum on synthesis gas.
Enzyme and Microbial Technology, 44(5), 281-288.
coupled to caustic production using a lamellar bioelectrochemical system,
Environmental. Science. Technology., 44, 4315–4321.
Daniell, J., Kopke, M., and Simpson, S. (2012). Commercial Biomass Syngas
Fermentation. Energies, 5(12), 5372-5417.

149
Davis F, Higson SPJ. (2007). Biofuel cells recent advances and applications. Biosensors
Bioelectron, 22, 1224–1235.
Davison B, Thompson J. (1993). Continuous direct solvent extraction of butanol in a
fermenting Xuidized-bed bioreactor with immobilized Clostridium
acetobutylicum. Applied Biochemical Biotechnology, 30-40(1), 415–426.
Derk. W. (1995). The genetic engineering of microbial solvent production. . Trends in
Biotechnology, 13, 259-264.
Dharaiya, D., Marjadi and Nishith. (2014). Recovery and characterization of poly(3-
Hydroxybutyric acid) synthesized in Staphylococcus epidermidis. African. Journal.
Of Environmental. Science. Technology., 8(6), 319-329.
Dumas, C., Mollica, A., Féron, D., Basséguy, R., Etcheverry, L., and Bergel, A. (2007).
Marine microbial fuel cell: Use of stainless steel electrodes as anode and cathode
materials. Electrochimica Acta, 53(2), 468-473.
Durre P. (2007). Biobutanol: an attractive biofuel. Biotechnol Journal, 2(12), 1525–1534.
Durre Z., Li, H., and Gu, T. (2007). A state of the art review on microbial fuel cells: A
promising technology for wastewater treatment and bioenergy. Biotechnology
Advances, 25(5), 464-482.
Ennis, B.M., Maddox I.S. (1985). Use of Clostridium acetobutylicum P262 for production
of solvents from whey permeate. Biotechnology Letters, 7(8), 601-606.
Estelle, G., Elise B., Stéphane D., Maria G.E., Albuquerque and Etienne P., Jean-Louis
U. (2014). Phosphorus limitation strategy to increase propionic acid flux towards
3-hydroxyvaleric acid monomers in Cupriavidus necator. Bioresource Technology,
153, 206–215. doi:10.1016/j.biortech.2013.11.072
Evans, P.J, Wang H.Y. (1988). Enhancement of Butanol Formation by Clostridium
acetobutylicum in the Presence of Decanol-Oleyl Alcohol Mixed Extractants.
Applied Environmental Microbiology, 54(7), 1662-1667.
Ezeji, T., Milne, C., Price, N. D., Blaschek, H. P. (2010). Achievements and perspectives
to overcome the poor solvent resistance in acetone and butanol-producing
microorganisms. Applied Microbiol Biotechnology, 85(6), 1697-1712.
Fan Y., Han S.K., Liu H. (2012). Improved performance of CEA microbial fuel cells
withincreased reactor size. Energy and . Environmental Science. 5, 8273–8280.

150
Finch, A. S., Mackie, T. D., Sund, C. J., Sumner, J. J. (2011). Metabolite analysis of
Clostridium acetobutylicum: fermentation in a microbial fuel cell. Bioresource
Technology, 102(1), 312-315.
Forberg C, Haggstrom L. (1985). Control of cell adhesion and activity during continuous
production of acetone and butanol with adsorbed cells. Enzyme Microbiological
Technology, 7(5), 230-234.
Frick C, Schügerl K. (1986). Continuous acetone-butanol production with free and
immobilized Clostridium acetobutylicum. Applied Microbiol Biotechnology, 25(3),
186–193.
Friedl A, Maddox I.S. (1991). Continuous acetone-butanol-ethanol (ABE) fermentation
using immobilized cells of Clostridium acetobutylicum in a packed bed reactor and
integration with product removal by pervaporation. Biotechnol Bioengineering,
38(5), 518–527.
Giddings, C. G., Nevin, K. P., Woodward, T., Lovley, D. R., Butler, C. S. (2015).
Simplifying microbial electrosynthesis reactor design. Front Microbiol, 6, 468.
doi:10.3389/fmicb.2015.00468.
Giin-Yu M., Chia-Lung C., Ling L., Liya G., Lin W., Razaad, I., Mutiara N. (2014).
Start a Research on Biopolymer Polyhydroxyalkanoate (PHA): A Review.
Polymers, 6, 706-754. doi:10.3390/polym6030706
Gonzalez M, Andrade J.C.L, Vasconcelos I. (2004). Production of 1, 3-propanediol by
Clostridium butyricum VPI 3266 using a synthetic medium and raw glycerol.
Journal of Industrial. Microbiology and Biotechnology, 31, 442-446.
Gregory, K. B., and Lovley D. R. (2005). Remediation and recovery of uranium from
contaminated subsurface environments with electrodes. Environmental. Science.
Technology, 39, 8943– 8947.
Gregory, K. B., Bond, D. R., and Lovley, D. R. (2004). Graphite electrodes as electron
donors for anaerobic respiration. Environmental Microbiology, 6(6), 596-604.
Grethlein, A. J., Worden R. M. (1991). Evidence for production of n-butanol from carbon
monoxide by Butyribacterium methylotrophicum. Journal of Fermentation and
Bioengineering,, 721(1), 58-60.
151
Grousseau, E., Blanchet, E., Deleris, S., Albuquerque, M. G., Paul, E., and Uribelarrea, J.
L. (2014). Phosphorus limitation strategy to increase propionic acid flux towards
3-hydroxyvaleric acid monomers in Cupriavidus necator. Bioresource Technology,
153, 206-215. doi:10.1016/j.biortech.2013.11.072
Halan, B., Buehler, K., Schmid, A. (2012). Biofilms as living catalysts in continuous
chemical syntheses. Trends in Biotechnology, 30(9), 453-465.
Hernandez, M.E., Kappier, A. and Newman, D.K. (2004). Phenazines aqnd other redox-
active antibiotics promote microbial mneral reduction. Applied Environmental
Microbiology, 2(79), 92 91-928.
Himmi EL, Bories A., Barbirato F. (1999). Nutrient requirements for glycerol conversion
to 1-,3 -propanediol by Clostridium butyricum. Bioresource. Technology, 67, 123-
128.
Huang, L., Regan, J. M., and Quan, X. (2011). Electron transfer mechanisms, new
applications, and performance of biocathode microbial fuel cells. Bioresource
Technology, 102(1), 316-323.
Hubert B., Wolfram A., Konstantin B., and Gerhard G. (1982). Effect of pH and butyrate
concentration on the production of acetone and butanol by clostridium
acetobutylicum grown in continuous culture. European Journal of Applied
Microbiologyand Biotechnology, 14, 17-20.
Ingram L.O. (1990). Ethanol tolerance in bacteria. Critical review biotechnology, 9(4),
305-319.
Islam M., Salatul M.d., Garcia-Gonzalez L., Wever Heleen De., Volcke, Eveline I. P.
(2015). Poly(3-hydroxybutyrate) (PHB) production from CO2 Model development
and process optimization. Biochemical Engineering Journal, 98, 107-116.
doi:10.1016/j.bej.2015.02.031
Ismail, Z. Z., and Jaeel, A. J. (2013). Sustainable power generation in continuous flow
microbial fuel cell treating actual wastewater: influence of biocatalyst type on
electricity production. Scientific World Journal, 2013,713515.
doi:10.1155/2013/713515
Jeppsson M., Tra, K., Johansson B, Hahn-H., gerdal B., Gorwa, MF. (2003). Effect of
enhanced xylose reductase activity on xylose consumption and product distribution
152
in xylose-fermenting recombinant Saccharomyces cerevisiae. Federation of
European Microbiological society, Yeast Research, 3, 167-175.
Ji, X. Huang, J and Ouyang P. K. (2011). Microbial 2,3-butanediol production. a state-of-
the-art review. Biotechnology. Advances, 29, 351–364.
Kajan S. , Lamees A., Murray M., Young C. Perry C. (2012). Towards sustainable
production of clean energy carriers from biomass resources. Applied Energy, 100,
172–186. doi:10.1016/j.apenergy.2012.05.012
Kalogo, Y. and Verstraete, W. (1999). Development of anaerobic sludge bed (ASB) reactor
technologies for domestic wastewater treatment: motives and perspectives. World
Journal of Microbiol. Biotechnology, 15, 523–534.
Karim, K., Gupta, S.K. (2003). Continuous biotransformation and removal of nitrophenols
under denitrifying conditions. Water Resources, 37, 2953–2959.
Katarzyna L., Katarzyna C., Kamila M. (2011). Biotechnological synthesis of 1,3-
propanediol using clostridium species. African Journal of Biotechnology, 10(54),
11093-11101. doi:10.5897/AJB11.873
Kim, H. J. (2002). A mediator-less microbial fuel cell using a metal reducing bacterium,
Shewanella putrefaciens. Enzyme Microbiological Technology, 30, 145–152.
Klasson, K. T., Ackerson M. D. (1991). Bioreactors for synthesis gas fermentations.
Resources, Conservation and Recycling,, 5(2-3), 145-165.
Klasson, M.D., Ackerson, E.C., Clausen. (1992). Bioconversion of syngas into liquid or
gaseous fuels. Enzyme Microbialogy Technology, 14, 602–608.
Kosaka T, Nakayama S, Nakaya K, Yoshino S, Furukawa K. (2007). Characterization of
the sol operon in butanol-hyperproducing Clostridium saccharoperbutylacetonicum
strain N1-4 and its degeneration mechanism. Bioscience Biotechnology
Biochemistry, 71(1), 58-68.
Krouwel P.G, Van der Laan W.F.M, Kossen N.W.F. (1980). Continuous production of n-
butanol and isopropanol by immobilized, growing Clostridium butylicum cells.
Biotechnol Letters, 2(5), 253-258.
LaBelle, E. V., Marshall, C. W., Gilbert, J. A., and May, H. D. (2014). Influence of acidic
pH on hydrogen and acetate production by an electrosynthetic microbiome. PLOS
One, 9(10), e109935. doi:10.1371/journal.pone.0109935

153
Lakaniemi A.M., Olli H. Tuovinen, Jaakko A. Puhakkaa. (2013). Anaerobic conversion
of microalgal biomass to sustainable energy carriers Bioresour Technology, 135,
222–231. doi:10.1016/j.biortech.2012.08.096
Lee S.M, Cho M.O, Park C.H, Chung Y.C, Kim J.H, Sang B.I, Um Y. (2008). Continuous
butanol production using suspended and immobilized Clostridium beijerinckii
NCIMB 8052 with supplementary butyrate. Energy Fuels, 22(5), 3459–3464.
Lee S.Y, Park J.H, Jang S.H, Nielsen L.K, Kim J, Jung K.S (2008). Fermentative butanol
production by clostridia. Biotechnol Bioengineering, 101(2), 209-228.
Lin F., Yuming H., Hao W. (2008). Solid-Phase Microextraction in Combination with GC–
FID for Quantification of the Volatile Free Fatty Acids in Wastewater from
Constructed Wetlands. Journal of Chromatographic Science, 46, 577-584.
Logan, Shaoan C. and Bruce E. (2008). Sustainable and efficient biohydrogen production
via electrohydrogenesis. Proceedings of the National Academy of Sciences,
104(47), 18871-18873. doi:10.1073/pnas.0706379104
Lopez-Abelairas M., García-Torreiro M., Lú-Chau, T., Lema, J. M., and Steinbüchel, A.
(2015). Comparison of several methods for the separation of poly(3-
hydroxybutyrate) from Cupriavidus necator H16 cultures. Biochemical
Engineering Journal, 93, 250-259. doi:10.1016/j.bej.2014.10.018
Lovley, D. R. (2006). Bug juice: harvesting electricity with microorganisms. Nature
Review Microbiology, 4(7), 497-508.
Lovley, D. R. (2011). Powering microbes with electricity: direct electron transfer from
electrodes to microbes. Environmental Microbiology Reports, 3(1), 27-35.
Lovley, D. R. (2012). "Long-range electron transport to Fe (III) oxide via pili with metallic-
like conductivity. Biochemical Society Transactions, 6(40), 1186-1190.
Madihah M.S., Ariff A.B., Sahaid K.M., Suraini A.A., Karim M.A. (2001). Direct
fermentation of gelatinized sago starch to acetone– butanol–ethanol by Clostridium
acetobutylicum. World Journal of Microbiology and Biotechnology 17(6), 567–
576.
Mariano, A.P., and Filho, R. M. (2011). Improvements in Biobutanol Fermentation and
Their Impacts on Distillation Energy Consumption and Wastewater Generation.
BioEnergy Research, 5(2), 504-514.
154
Marshall, C. W., Ross, D. E., Fichot, E. B., Norman, R. S., and May, H. D. (2012).
Electrosynthesis of commodity chemicals by an autotrophic microbial community.
Applied Environmental Microbiology, 78(23), 8412-8420.
Mermelstein L.D., Welker N.E., Petersen D.J., Bennett G.N., Papoutsakis, E.T. (1994).
Genetic and metabolic engineering of Clostridium acetobutylicum ATCC 824.
Annals of the New York academy of science, 721, 54-68.
Michael K, Christophe M, FungMin L, Joseph H. Tizard, M. Joshua J. Conolly, Bakir Al-
Sinawi and Séan D. (2011). 2,3-Butanediol production by acetogenic bacteria, an
alternative route to chemical synthesis using industrial waste gas. Applied
Environmental Microbiology, 77(15), 5467-5475.
Mohammadi, M. (2014). Effect of Organic Substrate on Promoting Solventogenesis in
Ethanologenic Acetogene Clostridium Ljungdahlii ATCC 55383. International
Journal of Engineering,, 27((2 (B).).
Mona K. Gouda, A., Swellam, E. Sanaa H., Omar. (2001). Production of PHB by a Bacillus
megaterium strain using sugarcane molasses and corn steep liquor as sole carbon
and nitrogen sources. Microbiological. Resources, 156, 201-207.
Montaser N., Ardjmand, M., Heidari A., Safe K. (2011). Optimization of Microbial
Culture for Production of Poly Hydroxy Butyrate (PHB) by Azotobacter
Beijerinckii DSMZ-1041. World Applied Sciences Journal, 14, 72-82,.
Morinaga, T., Kawada K. (1990). The production of acetic acid from carbon monoxide
and hydrogen by an anaerobic bacterium. Journal. Biotechnology., 14, 187–194.
Mukhopadhyay A, Redding A.M, Becky J, Rutherford, Jay D. Keasling. (2008).
Importance of systems biology in engineering microbes for biofuel production.
Current. Opinion in Biotechnology, 19, 228-234.
Muller, V. (2003). Energy Conservation in Acetogenic Bacteria. Applied Environmental
Microbiology, 69(11), 6345-6353.
Munasinghe, P. C. and Khanal S. K. (2010). Biomassderived syngas fermentation into
biofuels: Opportunities and challenges. Bioresource Technology, 101(13), 5013-
5022.

155
Murphy D.J. (2012). Oil crops as potential sources of biofuels. In.Technological
innovations in major world oil crops. Gupta SK,editor New York Springer;, 269–
284.
Naggar, M.Y., Wanger, G., Leung, K.M., Thomas, D., Yuzvinsky.,, Southam, G., Yang,
J., Lau, W.M., Nealson, K.H., Gorby, Y.A. (2010). Electrical transport along
bacterial nanowires from Shewanella oneidensis MR-1. Proceedings of the
National Academy of Sciences., 107, 18127-18131.
Nair R.V., Green E.M, Watson D.E, Bennet G.N, Papoutsakis E.T. (1999). Regulation of
the sol locus genes for butanol and acetone formation in Clostridium
acetobutylicum ATCC by a putative transcriptional repressor. Journal of
Bacteriology, 181, 319-330.
Nakumura C.E, Whited G. (2003). Metabolic engineering for the microbial production of
1-,3 -propanediol. Current Opinion in Biotechnology, 14, 234-236.
Nevin, K. P., Hensley, S. A., Franks, A. E., Summers, Z. M., Ou, J., Woodard, T. L.,
Lovley, D. R. (2011). Electrosynthesis of organic compounds from carbon dioxide
is catalyzed by a diversity of acetogenic microorganisms. Applied and
environmental microbiology, 77(9), 2882-2886.
Nevin, K. P., Richter, H., Covalla, S. F., Johnson, J. P., Woodard, T. L., Orloff, A. L.,
Lovley, D. R. (2008). Power output and columbic efficiencies from biofilms of
Geobacter sulfurreducens comparable to mixed community microbial fuel cells.
Environmental Microbiology, 10(10), 2505-2514.
Nevin, K. P., Woodard, T. L., Franks, A. E., Summers, Z. M., and Lovley D. R. (2010).
Microbial electrosynthesis: feeding microbes electricity to convert carbon dioxide
and water to multicarbon extracellular organic compounds. mBio, 1(2), 4818-4827.
Nevin, K., Derek. R. Lovley and Kelly P. (2011). A shift in the current: New applications
and concepts for microbe-electrode electron exchange. Current Opinion in
Biotechnology, 22, 1-8. doi:10.1016/
Ni, Y., Sun, Z. (2009). Recent progress on industrial fermentative production of acetone-
butanol-ethanol by Clostridium acetobutylicum in China. Applied Microbiology
Biotechnology, 83(3), 415-423.

156
Nielsen, J. Villadsen J. (1994). , Bioreaction Engineering Principles. Plenum Press, New
York, 229–435.
Ogunjobi, P.N., Okwuobi A.A. (2013). Production and Analysis of Polyhydroxyalkanoate
(PHA) by Bacillus megaterium Using Pure Carbon Substrates. World Applied
Sciences Journal, 9(28), 1336-1340.
Palmqvist E, Hahn-Hagerdal B. (2000). Fermentation of lignocellulosic hydrolysates. II
inhibitors and mechanisms of inhibition. Bioresour Technology, 74, 25-33.
Paramjeet K., Jabeen E.T., Rohini, K.V.L., Varaprasad Y. and Laxminarayana B,. (2012).
Study on Production, Extraction and Analysis of Polyhydroxyalkanoate (PHA)
from Bacterial Isolates. IOSR Journal of Pharmacy and Biological Sciences, 1(1),
31-38.
Park, D. H. and Zeikus JGl. (1999). Utilization of Electrically Reduced Neutral Red by
Actinobacillus succinogenes: Physiological Function of Neutral Red in Membrane-
Driven Fumarate Reduction and Energy Conservation. Journal of Bacteriology,
8(181), 2403-2410.
Phillips, J., Klasson K. (1993). . Biological production of ethanol from coal synthesis gas.
Applied Biochemistry and Biotechnology, 39-40(1), 559-571.
Pier L., Tremblay, T., Zhang, Shabir A. Dar, CL, and Derek R. L. (2016). The Rnf Complex
of Clostridium ljungdahlii Is a Proton-Translocating Ferredoxin:NAD
Oxidoreductase Essential for Autotrophic Growth. MBio, 4(1),
doi:00410.01128/mBio.00406-00412
Pocaznoi, D., Calmet, A., Etcheverry, L., Erable, B., and Bergel, A. (2012). Stainless steel
is a promising electrode material for anodes of microbial fuel cells. Energy and
Environmental Science, 5(11), 9645-9652. doi:10.1039/C2EE22429A
Pohlmann, A., Fricke, W. F., Reinecke, F., Kusian, B., Liesegang, H., Cramm, R., Eitinger,
T. (2006). Genome sequence of the bioplastic-producing “Knallgas” bacterium
Ralstonia eutropha H16. Nature biotechnology, 24(10).
Qureshi N, Lolas A, Blaschek HP. (2001). Soy molasses as fermentation substrate for
production of butanol using Clostridium beijerinckii BA101. journal of Indian
Microbiology and Biotechnology, 26(5), 290-295.
157
Qureshi, N. (2011). Agricultural residues and energy crops as potentially economical and
novel substrates for microbial production of butanol (a biofuel). CAB Reviews:
Perspectives in Agriculture, Veterinary Science, Nutrition and Natural Resources,
5(059). doi:10.1079/pavsnnr20105059
Rabaey, K., and Rozendal, R. A. (2010). Microbial electrosynthesis, revisiting the
electrical route for microbial production. Nature Review Microbiology, 8(10), 706-
716.
Rabaey, K., Girguis P., and Nielsen, L. K. (2011). Metabolic and practical considerations
on microbial electrosynthesis. Current Opinion Biotechnology, 22(3), 371-377.
Ramio-P. (2015). Incubation at 25 0C prevents acid crash and enhances alcohol production
in Clostridium carboxidivorans P7. Bioresource Technology,, 192, 296-303.
Ramos J.L, Duque E, Gallegos M.T, Godoy P, Ramos-Gonzalez MI, Rojas A, Teran W.,
Segura, A. (2002). Annual review microbiol Mechanisms of solvent tolerance in
gram-negative bacteria. Annual review microbiology, 56, 743-768.
Ranjan, A., Khanna, S., and Moholkar, V. S. (2013). Feasibility of rice straw as alternate
substrate for biobutanol production. Applied Energy, 103, 32-38.
doi:10.1016/j.apenergy.2012.10.035
Reguera, G., McCarthy, K.D., Mehta, T., Nicoll, J.S., & Tuominen, M.T., Lovley, D.R.
(2005). Extracellular electron transfer via microbial nanowires. Nature, 435, 1098-
1101.
Reguera, G., Nevin, K. P., Nicoll, J. S., Covalla, S. F., Woodard, T. L., Lovley, D. R.
(2006). Biofilm and nanowire production leads to increased current in Geobacter
sulfurreducens fuel cells. Applied Environmental Microbiology, 72(11), 7345-
7348.
Sacchettini J.C, Poulter C.D. (1997). Creating isoprenoid diversity. Science (New York,N
.Y.). 277(5333), 1788-1789.
Sang Y. L., Jong-il C., Kyuboem H., and Yong S. (1999). Removal of Endotoxin during
Purification of Poly(3-Hydroxybutyrate) from Gram-Negative Bacteria. Applied
Environmental Microbiology, 65(6), 2762–2764.
158
Sergio L., Endang T., Wahyuni, W., Siti Syamsiah and Jamil I. (2007). Purification and
charaterization of Poly-Hydroxybutyrate(PHB) in Cupriavidus necator Indonesian.
Journal of Chemistry, 7(3), 243-248.
Sharifzadeh M. Baei, Najafpour, G.D., Younesi, H., Tabandeh F., Eisazadeh H. (2009).
Poly(3-hydroxybutyrate) Synthesis by Cupriavidus necator DSMZ 545 Utilizing
Various Carbon Sources. World Applied Sciences Journal, 2(7), 157-161.
Sharma, M., Bajracharya, S., Sylvia, P., Sunil A., Alvarez, G., Yolanda, P., Deepak, D.,
(2014). A critical revisit of the key parameters used to describe microbial
electrochemical systems. Electrochimica Acta, 140, 191-208.
doi:10.1016/j.electacta.2014.02.111
Shen, J., Kortlever, R., Recep, B., Yuvraj Y., Diaz-Morales, O., Kwon, Y., Koper, M.
(2015). Electrocatalytic reduction of carbon dioxide to carbon monoxide and
methane at an immobilized cobalt protoporphyrin. Nature Communication, 6.
doi:10.1038/ncomms9177
Shi, J., Jiang, Y., Jiang, Z., Wang, X., Wang, Xiaoli, Z., Shaohua, Y. (2015). Enzymatic
conversion of carbon dioxide. Chemical Society Reviews, 44(17), 5981-6000.
Shukla R, Kang W, Sirkar K. (1989). Novel hollow Wber immobilization techniques for
whole cells and advanced bioreactors. Applied Biochemical Biotechnology, 20,
571-586.
Sleutels, T. H., Darus, L., Hamelers, H. V., & Buisman, C. J. (2011). Effect of operational
parameters on Coulombic efficiency in bioelectrochemical systems. Bioresource
Technology, 102(24), 11172-11176.
Strycharz, S. M., Gannon, A. R. Boles, K. P. Nevin, A. E. Franks,, Lovley. D. R. (2010).
Anaeromyxobacter dehalogenans interacts with a poised graphite electrode for
reductive dechlorination of 2-chlorophenol. Environmental. Microbiology.
Reports, 2(289-294).
Strycharz, S. M., Glaven, R. H., Coppi, M. V., Gannon, S. M., Perpetua, L. A., Liu, A.,
.Lovley, D. R. (2011). Gene expression and deletion analysis of mechanisms for
electron transfer from electrodes to Geobacter sulfurreducens. Bioelectrochemistry,
80(2), 142-150.

159
Strycharz, S. M., Woodard, T. L., Johnson, J. P., Nevin, K. P., Sanford, R. A., Loffler, F.
E., Lovley, D. R. (2008). Graphite electrode as a sole electron donor for reductive
dechlorination of tetrachlorethene by Geobacter lovleyi. Appl Environ Microbiol,
74(19), 5943-5947.
Tanaka T, Hoshina M, Tanabe S, Sakai K, Ohtsubo S, Taniguchi,M. (2006). Production
of D-lactic acid from defatted rice bran by simultaneous saccharification and
fermentation. Bioresource Technology, 97(2), 211-217.
Tanner, R., Miller, M. and Yang D. (1993). Clostridium ljungdahlii, an acetogenic species
in clostridial rRNA homology group. International Journal of Systematic and
Bacteriology, 43, 232–236.
Tatiana G. Volova, Evgeniy G. Kiselev, Ekaterina I. Shishatskaya, Natalia O. (2013). Cell
growth and accumulation of polyhydroxyalkanoates from CO2 and H2 of a
hydrogen-oxidizing bacterium, Cupriavidus eutrophus B-10646. Bioresource
Technology, 146, 215–222. doi:10.1016/j.biortech.2013.07.070
Thawadi, Mahmoud, M. Berekaa and Ali M. (2012). Biosynthesis of polyhydroxybutyrate
(PHB) biopolymer by Bacillus megaterium SW1-2: Application of Box-Behnken
design for optimization of process parameters. African Journal of Microbiology,
4(6), 838-845. doi:10.5897
Thrash, J. Cameron, and John D. (2008). "Review: direct and indirect electrical stimulation
of microbial metabolism. Environmental Science & Technology, 11(42), 3921-
3931.
Tian, Z., Pier L., Tremblay . (2015). Electrifying microbes for the production of chemicals.
Frontiers Microbiology, doi:10.3389/fmicb.2015.00201
Tracy, B.P. (2012) Clostridia: the importance of their exceptional substrate and metabolite
diversity for biofuel and biorefinery applications. Current Opinion Biotechnolpgy,
3(23), 364-381.
Tremblay, P. L., and Zhang, T. (2015). Electrifying microbes for the production of
chemicals. Frontiers Microbiology, 6, 201. doi:10.3389/fmicb.2015.00201
Vargas, M., Malvankar, N. S., Tremblay, P. L., Leang, C., Smith, J. A., Patel, P., Lovley,
D. R. (2013). Aromatic amino acids required for pili conductivity and long-range

160
extracellular electron transport in Geobacter sulfurreducens. MBio, 4(2), e00105-
00113. doi:10.1128/mBio.00105-13
Vega, J.L., Clausen, E.C., Gaddy J.L. (1989). Study of gaseous substrate fermentation:
carbon monoxide conversion to acetate Batch culture. Biotechnology.
Bioengineering, 34, 774–784.
Venkata S., Mohan, G. Velvizhi, K. Vamshi Krishna, M. Lenin B. (2014). Microbial
catalyzed electrochemical systems: A bio-factory with multi-facet applications.
Bioresource Technology. doi:10.1016/j.biortech.2014.03.048
Venkata S., Mohan, M., Venkateswar R. (2015). Polyhydroxy alkanoates Production by
Newly Isolated Bacteria Serratia ureilytica Using Volatile Fatty Acids as Substrate:
Bio-Electro Kinetic Analysis. Journal of Microbial & Biochemical Technology,
07(01). doi:10.4172/1948-5948.1000177
Verlinden R., Hill, M.A. Kenward, C.D. and Radecka. 2007. "Bacterial synthesis of
biodegradable polyhydroxyalkanoates. Journal of Applied Microbiology. doi:
10.1111/j.1365-2672.2007.03335.x.
Verlinden, R.A.J. Hill, M.A. Kenward, C.D. Williams I. (2007). Bacterial synthesis of
biodegradable polyhydroxyalkanoates. Journal of Applied Microbiology.
doi:10.1111/j.1365-2672.2007.03335.x
Villano, M., F. Aulenta, C. Ciucci, T. Ferri, A. Giuliano, M. Majone. (2010).
Bioelectrochemical reduction of CO2 to CH4 via direct and indirect extracellular
electron transfer by a hydrogenophilic methanogenic culture. Bioresource
Technology, 101, 3085–3090.
Von C., Harald, et al. (2008). Secretion of flavins by Shewanella species and their role in
extracellular electron transfer. Applied Environmebtal Microbiology, 3(74), 615-
623.
Wang, L, Hong, Seong G. (2012). Influences of pH Conditions on Syngas Fermentation
using Clostridium ljungdahlii. Journal of Korean Society of Agricultural
Engineers, 54(6), 143-150. doi:10.5389/ksae.2012.54.6.143
Wejnerowska, G., and Gaca, J. (2008). Application of Headspace Solid-Phase
Microextraction for Determination of Chloro-Organic Compounds in Sewage

161
Samples. Toxicology Mechanism and Methods, 18(6), 543-550.
doi:10.1080/15376510701624084
Wood, Ewa P. (1984). Role of carbon monoxide dehydrogenase in the autotrophic
pathway used by acetogenic bacteria. Proceding of National Academic. Science,
81, 6261-6265.
Woods, D.T., Jones D. R. (1986). acetone butanol fermentation revisited. Microbiological
Reviews, 50(4), 484-524.
Xiao, Z., and Xu, P. (2007). Acetoin metabolism in bacteria. Critical review in Biochemical
Microbiology, 33, 127–140.
Younesi, H, Najafpour, G., and Mohamed, Abdul R. (2005). Ethanol and acetate
production from synthesis gas via fermentation processes using anaerobic
bacterium, Clostridium ljungdahlii. Biochemical Engineering Journal, 27(2), 110-
119. doi:10.1016/j.bej.2005.08.015
Yuedong Z., Yujiu M., Fangxiao Y., and Zhang, C. (2009). Continuous acetone–butanol–
ethanol production by corn stalk immobilized cells. journal India Microbiol
Biotechnology, 36, 1117-1121. doi:10.1007/s10295-009-0582-3
Zaybak, Z., Pisciotta, J. M., Tokash, J. C., and Logan, B. E. (2013). Enhanced start-up of
anaerobic facultatively autotrophic biocathodes in bioelectrochemical systems.
Journal Biotechnology, 168(4), 478-485. doi:10.1016/j.jbiotec.2013.10.001
Zhang, Y., Li, L., Xian, M., Ma, Y. J., Yang, J. M., Xu, X., and He, D. Z. (2009).
Problems with the microbial production of butanol. J pf Industrial and
Microbiology Biotechnology, 36(9), 1127-1138.

162
6 List of Publications
1. Robina Farooq, Gugan Jabeen, Maria Siddique, Saleem Farooq Shaukat, Saif Ur
Rehman. ‘Bioelectrochemical Reduction of Carbon Dioxide to Organic
Compounds’, International Journal of Scientific & Engineering Research, Vol. 7,
Issue 10, (2016), ISSN 2229-5518 (IF = 3.8).
2. Jabeen. G, R. Farooq, 2016. Bio-electrochemical synthesis of commodity
chemicals by autotrophic acetogens utilizing CO2 for environmental remediation,
Journal of Biosciences. 41(3), 367-380. (IF 2.06)
3. Jabeen. G, R. Farooq, et al., 2015. Acetyl-CoA Pathway for Biosynthesis of
Organics, Asian Journal of Chemistry. 27 (1), p 1-8. (IF 0.45)
4. Jabeen. G, R. Farooq, 2015. Microbial Fuel Cells and Their applications for Cost
Effective Water Pollution Remediation, Proceedings of National Academy of
Sciences, India, Section. B Biological Sciences. DOI 10.1007/s40011-015-0683-x.
(IF 0.4).
5. Jabeen. G, R. Farooq, 2016. Synthesis of bio-plastic an innovative technique for
biodegradable and biocompatible polymers. Paper Accepted by Asian Journal of
Chemistry. (IF 0.45).
6. Robina Farooq, Gugan Jabeen, ‘Bioelectro trophic synthesis of
polyhydroxyalkanoates from waste molasses and carbon dioxide’, Patent
application NO. 307/2016, dated 30/05/2016, Government of Pakistan, Intellectual
Property Organization, The Patent Office, Karachi.

163
7 Appendix I

164
Cell dry weight concentration and absorbance
Dry weight
concentration
ppm
Absorbance
0 0
2 1.139
4 1.185
6 2.51
8 3.02
10 3.9
Optical density between days and absorbance
Days Absorbance
1 0.4485
2 0.813
3 0.416
4 0.386
5 0.347
6 0.0994
7 0.0909
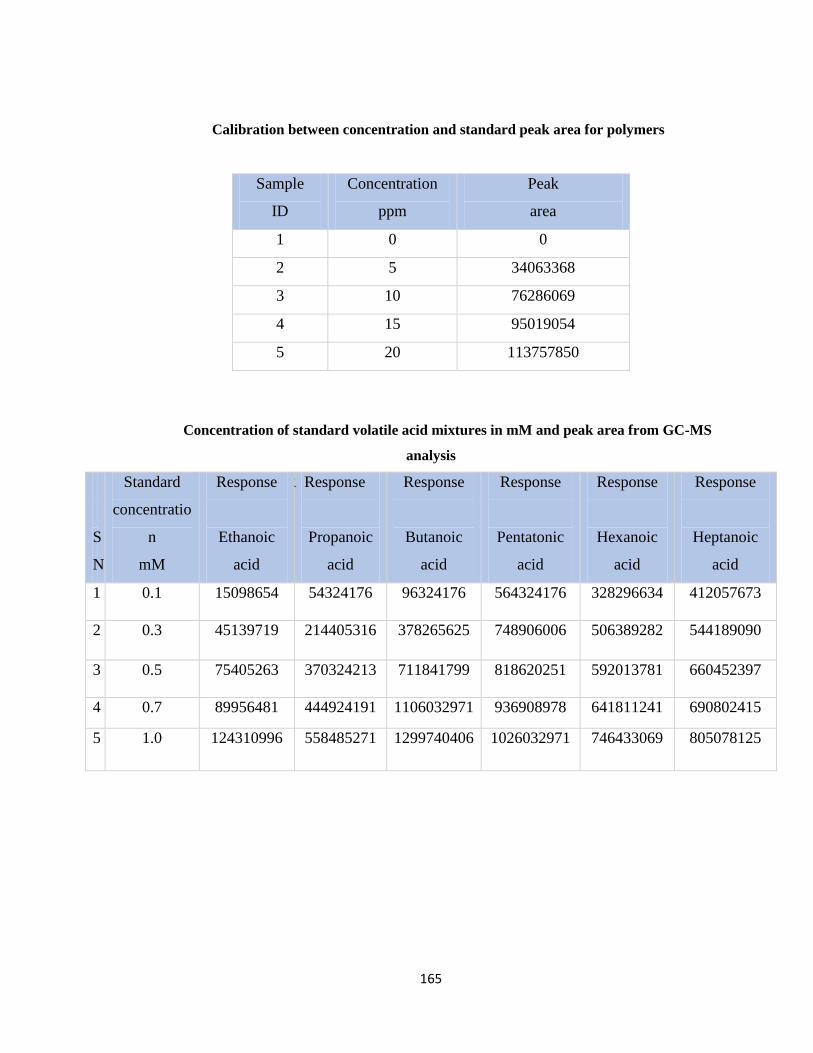
165
Calibration between concentration and standard peak area for polymers
Sample
ID
Concentration
ppm
Peak
area
1 0 0
2 5 34063368
3 10 76286069
4 15 95019054
5 20 113757850
Concentration of standard volatile acid mixtures in mM and peak area from GC-MS
analysis
S
N
Standard
concentratio
n
mM
Response
Ethanoic
acid
R Response
Propanoic
acid
Response
Butanoic
acid
Response
Pentatonic
acid
Response
Hexanoic
acid
Response
Heptanoic
acid
1 0.1 15098654 54324176 96324176 564324176 328296634 412057673
2 0.3 45139719 214405316 378265625 748906006 506389282 544189090
3 0.5 75405263 370324213 711841799 818620251 592013781 660452397
4 0.7 89956481 444924191 1106032971 936908978 641811241 690802415
5 1.0 124310996 558485271 1299740406 1026032971 746433069 805078125
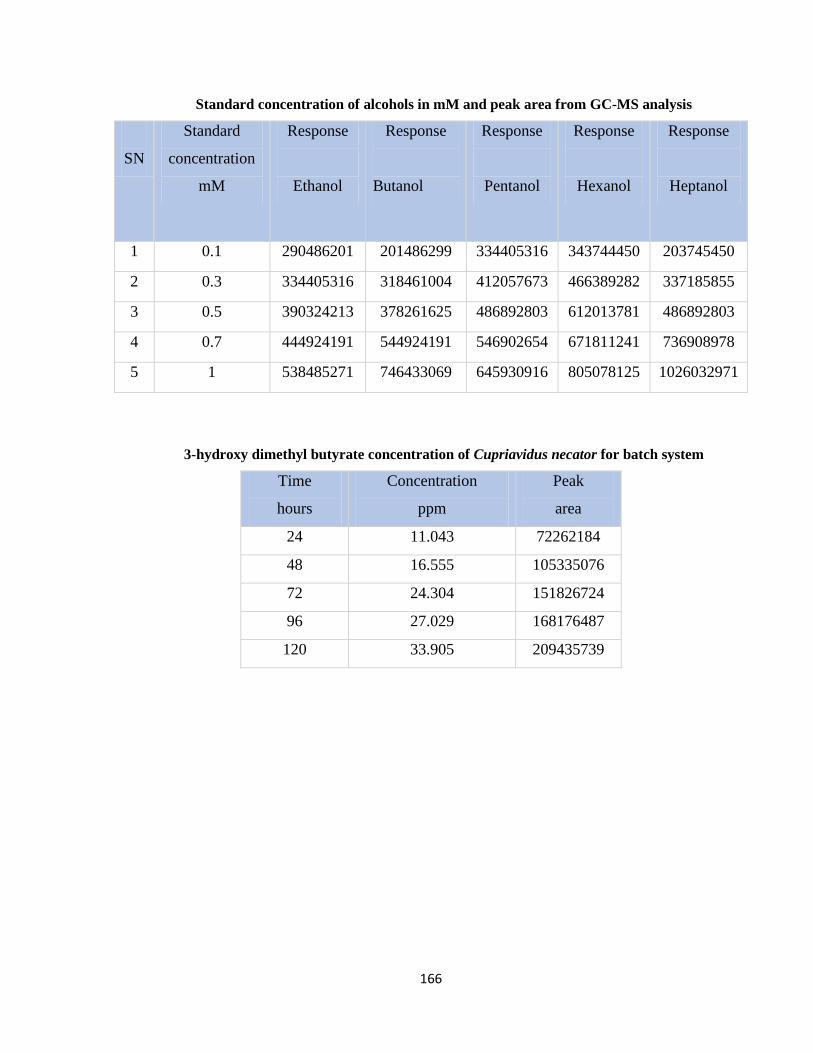
166
Standard concentration of alcohols in mM and peak area from GC-MS analysis
SN
Standard
concentration
mM
Response
Ethanol
Response
Butanol
Response
Pentanol
Response
Hexanol
Response
Heptanol
1 0.1 290486201 201486299 334405316 343744450 203745450
2 0.3 334405316 318461004 412057673 466389282 337185855
3 0.5 390324213 378261625 486892803 612013781 486892803
4 0.7 444924191 544924191 546902654 671811241 736908978
5 1 538485271 746433069 645930916 805078125 1026032971
3-hydroxy dimethyl butyrate concentration of Cupriavidus necator for batch system
Time
hours
Concentration
ppm
Peak
area
24 11.043 72262184
48 16.555 105335076
72 24.304 151826724
96 27.029 168176487
120 33.905 209435739

167
Ethyl 3-hydroxy hexanoate concentration of Cupriavidus necator for batch system
Time
hours
Concentration
ppm
Peak
area
24 3.29 25749567
48 4.23 31432830
72 3.29 25748897
96 10.84 71094079
120 11.65 75945173
Table 7.1 2, 4 dimethyl heptanoate concentration of Cupriavidus necator for batch system
Time
hours
Concentration
ppm
Peak
area
24 0.0472 5716340
48 3.66 28005709
72 3.307 25847587
96 4.65 33943107
120 8.27 55657301
3-hydroxy dimethyl butyrate concentration of Cupriavidus necator for continuous
system
Time
hours
Concentration
ppm
Peak
area
24 11.714 76286069
48 25.51 159062396
72 46.78 286681909
96 50.98 311890976
120 79.2 481235571
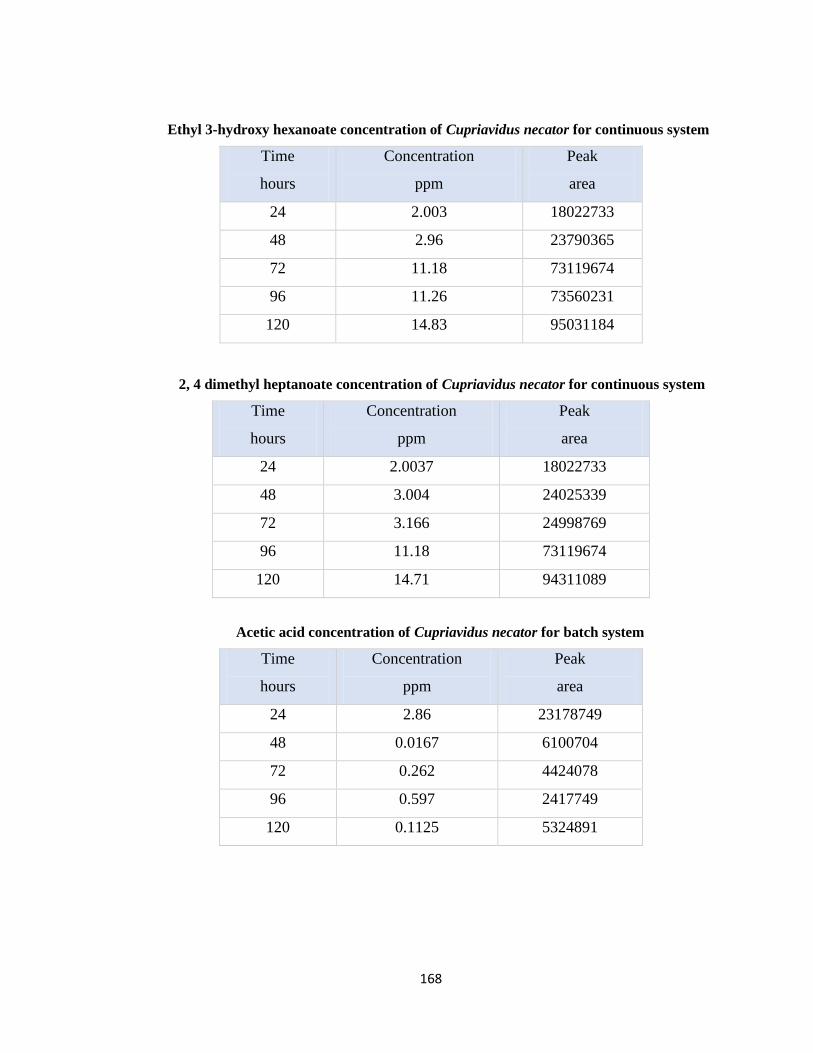
168
Ethyl 3-hydroxy hexanoate concentration of Cupriavidus necator for continuous system
Time
hours
Concentration
ppm
Peak
area
24 2.003 18022733
48 2.96 23790365
72 11.18 73119674
96 11.26 73560231
120 14.83 95031184
2, 4 dimethyl heptanoate concentration of Cupriavidus necator for continuous system
Time
hours
Concentration
ppm
Peak
area
24 2.0037 18022733
48 3.004 24025339
72 3.166 24998769
96 11.18 73119674
120 14.71 94311089
Acetic acid concentration of Cupriavidus necator for batch system
Time
hours
Concentration
ppm
Peak
area
24 2.86 23178749
48 0.0167 6100704
72 0.262 4424078
96 0.597 2417749
120 0.1125 5324891

169
Acetic acid concentration of Cupriavidus necator for continuous system
Time
hours
Concentration
ppm
Peak
area
24 25.83 160990349
48 6.21 43297154
72 1.807 16842264
96 3.11 24664501
120 2.606 21640611
Total current consumed by Cupriavidus necator and current recovery in polymers in
batch system
Time
hours
Total
Current
Coulombs
3-hydroxy diethyl
butyrate
moles
ethyl 3-hydroxy
hexanoate
moles
2,4-dimethyl
heptanoate
moles
0 0 0 0 0
24 0.000784727 8.3786E-05 2.05355E-05 -3.00637E-07
48 0.001569454 0.000125607 2.64028E-05 2.33121E-05
72 0.002354181 0.000184401 2.05355E-05 2.10637E-05
96 0.003138908 0.000205076 6.76612E-05 2.96178E-05
120 0.003923635 0.000257246 7.27171E-05 5.26752E-05
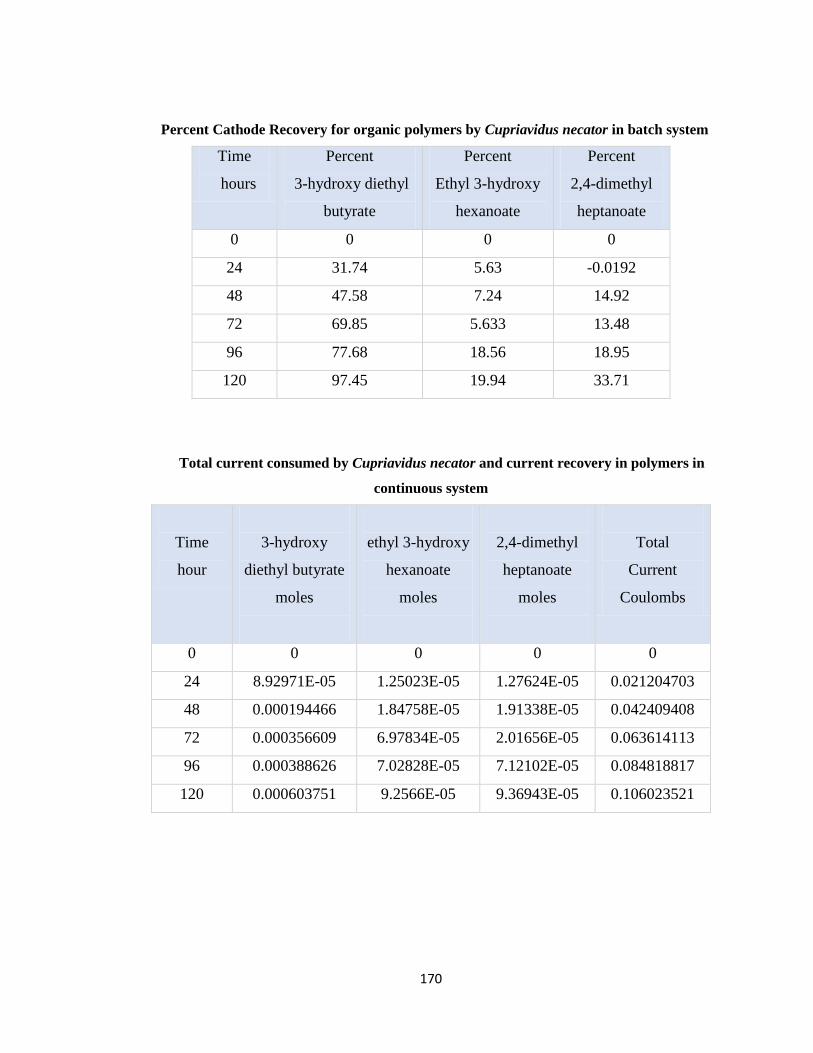
170
Percent Cathode Recovery for organic polymers by Cupriavidus necator in batch system
Time
hours
Percent
3-hydroxy diethyl
butyrate
Percent
Ethyl 3-hydroxy
hexanoate
Percent
2,4-dimethyl
heptanoate
0 0 0 0
24 31.74 5.63 -0.0192
48 47.58 7.24 14.92
72 69.85 5.633 13.48
96 77.68 18.56 18.95
120 97.45 19.94 33.71
Total current consumed by Cupriavidus necator and current recovery in polymers in
continuous system
Time
hour
3-hydroxy
diethyl butyrate
moles
ethyl 3-hydroxy
hexanoate
moles
2,4-dimethyl
heptanoate
moles
Total
Current
Coulombs
0 0 0 0 0
24 8.92971E-05 1.25023E-05 1.27624E-05 0.021204703
48 0.000194466 1.84758E-05 1.91338E-05 0.042409408
72 0.000356609 6.97834E-05 2.01656E-05 0.063614113
96 0.000388626 7.02828E-05 7.12102E-05 0.084818817
120 0.000603751 9.2566E-05 9.36943E-05 0.106023521
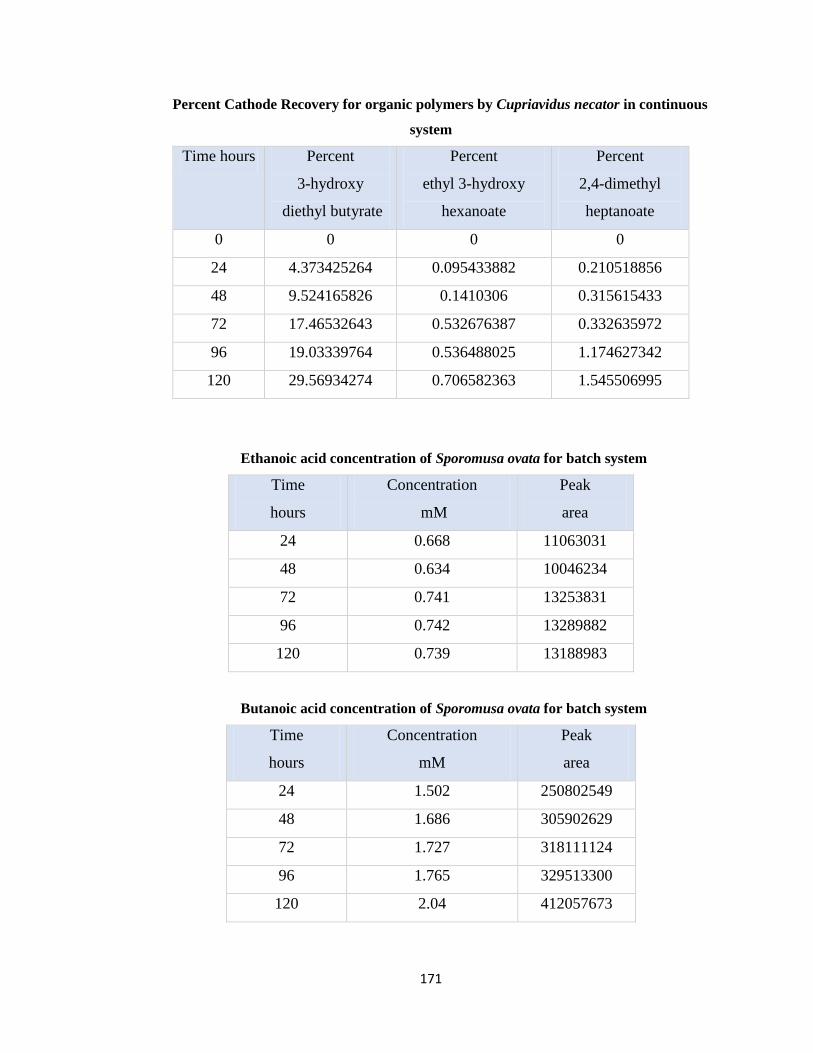
171
Percent Cathode Recovery for organic polymers by Cupriavidus necator in continuous
system
Time hours Percent
3-hydroxy
diethyl butyrate
Percent
ethyl 3-hydroxy
hexanoate
Percent
2,4-dimethyl
heptanoate
0 0 0 0
24 4.373425264 0.095433882 0.210518856
48 9.524165826 0.1410306 0.315615433
72 17.46532643 0.532676387 0.332635972
96 19.03339764 0.536488025 1.174627342
120 29.56934274 0.706582363 1.545506995
Ethanoic acid concentration of Sporomusa ovata for batch system
Time
hours
Concentration
mM
Peak
area
24 0.668 11063031
48 0.634 10046234
72 0.741 13253831
96 0.742 13289882
120 0.739 13188983
Butanoic acid concentration of Sporomusa ovata for batch system
Time
hours
Concentration
mM
Peak
area
24 1.502 250802549
48 1.686 305902629
72 1.727 318111124
96 1.765 329513300
120 2.04 412057673

172
2-ethyl butyrate concentration of Sporomusa ovata for batch system
Time
hours
Concentration
mM
Peak
area
24 1.086 125980229
48 1.176 152846493
72 1.195 158523097
96 1.209 162919910
120 1.231 169401115
Ethanol concentration of Sporomusa ovata for batch system
Time
hours
Concentration
mM
Peak
area
24 1.858 311486201
48 2.478 348694790
72 3.022 381369701
96 3.526 411600426
120 3.886 433197118
Pentanol concentration of Sporomusa ovata for batch system
Time
hours
Concentration
mM
Peak
area
24 0.227 318221124
48 0.367 329407531
72 0.545 343667282
96 0.521 341721515
120 1.15 392057673

173
Hexanol concentration of Sporomusa ovata for batch system
Time
hours
Concentration
mM
Peak
area
24 0.014 201462343
48 1.436 343667282
72 1.437 343744450
96 1.704 370467988
120 1.855 385512300
Ethanoic acid concentration of Sporomusa ovata for continuous system
Time
hours
Concentration
mM
Peak
area
24 0.627 9823031
48 0.639 10185289
72 0.672 11187987
96 0.711 12332876
120 0.723 12700923
Butanoic acid concentration of Sporomusa ovata for continuous system
Time
hours
Concentration
mM
Peak
area
24 1.169 150903539
48 1.165 149788668
72 1.352 205802639
96 1.431 229407531
120 1.79 337180788

174
2-ethyl butyrate concentration of Sporomusa ovata for continuous system
Time
hours
Concentration
mM
Peak
area
24 1.068 120480229
48 1.018 105480229
72 1.164 149320870
96 1.176 152813390
120 1.184 155302256
Ethanol concentration of Sporomusa ovata for continuous system
Time
hours
Concentration
mM
Peak
area
24 0.394 223645960
48 0.556 233386630
72 0.898 253899780
96 2.534 352099788
120 3.144 388640251
Pentanol concentration of Sporomusa ovata for continuous system
Time
hours
Concentration
mM
Peak
area
24 0.025 302057973
48 0.108 308668722
72 0.522 341822675
96 0.574 345940315
120 1.247 399832134

175
Hexanol concentration of Sporomusa ovata for continuous system
Time
hours
Concentration
mM
Peak
area
24 0.12 212057973
48 0.418 241822675
72 0.986 298668722
96 1.059 305940315
120 1.058 305832134
Total current consumed by Sporomusa ovata and current recovery in organic acids and
alcohols in batch system
Time
hours
Total
current
consumed
Coulombs
Ethanoic
acid
moles
Butanoic
acid
moles
2ethyl
butyrate
moles
Ethanol
moles
Pentanol
moles
Hexanol
moles
0 0 0 0 0 0 0 0
24 0.028698653
0.000668 0.001502 0.001086 0.001858 0.000227 0.000014
48 0.057397306 0.000634 0.001686 0.001176 0.002478 0.000367 0.001436
72 0.086095959 0.000741 0.001727 0.001195 0.003022 0.000545 0.001437
96 0.114794611 0.000742 0.001765 0.001209 0.003526 0.000521 0.001704
120 0.143493264 0.000739 0.00204 0.001231 0.003886 0.00115 0.001855
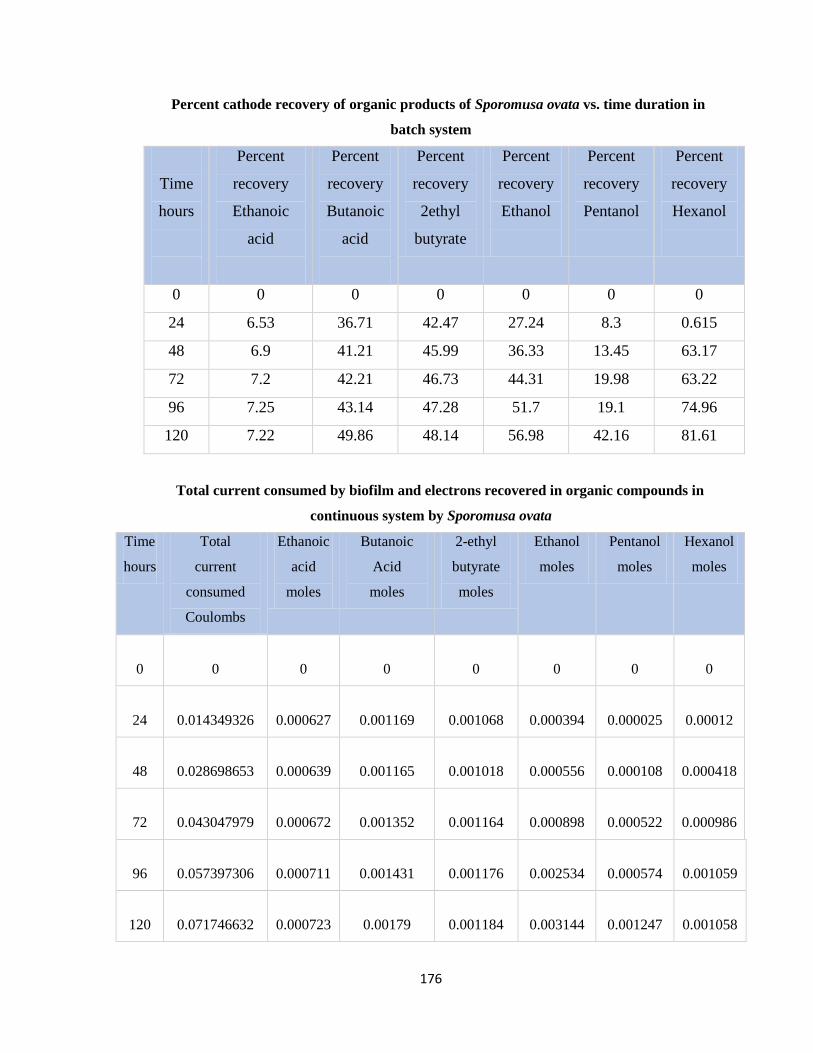
176
Percent cathode recovery of organic products of Sporomusa ovata vs. time duration in
batch system
Time
hours
Percent
recovery
Ethanoic
acid
Percent
recovery
Butanoic
acid
Percent
recovery
2ethyl
butyrate
Percent
recovery
Ethanol
Percent
recovery
Pentanol
Percent
recovery
Hexanol
0 0 0 0 0 0 0
24 6.53 36.71 42.47 27.24 8.3 0.615
48 6.9 41.21 45.99 36.33 13.45 63.17
72 7.2 42.21 46.73 44.31 19.98 63.22
96 7.25 43.14 47.28 51.7 19.1 74.96
120 7.22 49.86 48.14 56.98 42.16 81.61
Total current consumed by biofilm and electrons recovered in organic compounds in
continuous system by Sporomusa ovata
Time
hours
Total
current
consumed
Coulombs
Ethanoic
acid
moles
Butanoic
Acid
moles
2-ethyl
butyrate
moles
Ethanol
moles
Pentanol
moles
Hexanol
moles
0
0
0
0
0
0
0
0
24
0.014349326
0.000627
0.001169
0.001068
0.000394
0.000025
0.00012
48
0.028698653
0.000639
0.001165
0.001018
0.000556
0.000108
0.000418
72
0.043047979
0.000672
0.001352
0.001164
0.000898
0.000522
0.000986
96
0.057397306
0.000711
0.001431
0.001176
0.002534
0.000574
0.001059
120
0.071746632
0.000723
0.00179
0.001184
0.003144
0.001247
0.001058

177
Percent cathode recovery of organic products of Sporomusa ovata vs. time duration in
continuous system
Time
hours
Percent
Recovery
Ethanoic
acid
Percent
Recovery
Butanoic
acid
Percent
Recovery
2-ethyl
butyrate
Percent
Recovery
Ethanol
Percent
Recovery
Pentanol
Percent
Recovery
Hexanol
0 0 0 0 0 0 0
24 0.57 10.43 17.8 1.97 0.25 1.71
48 0.58 10.4 16.96 2.78 1.08 5.97
72 0.61 12.71 19.4 4.49 5.22 14.08
96 0.64 13.7 19.67 9.25 5.74 15.12
120 0.66 16.27 19.73 15.72 12.47 15.3
Ethanoic acid concentration for batch system by Clostridium ljungdahlii
Time
hours
Concentration
mM
Peak
area
24 0.35029 1508921
48 0.48941 5682310
72 0.55031 7509508
96 2.168 56045050
120 2.993 80816740

178
Ethyl butyrate concentration for batch system by Clostridium ljungdahlii
Time
hours
Concentration
mM
Peak
area
24 1.875 362501313
48 1.939 381862810
72 1.536 260897141
96 1.171 151571986
120 2.266 480032894
Hexanoic acid concentration for batch system by Clostridium ljungdahlii
Time
hours
Concentration
mM
Peak
area
24 1.3231 432314798
48 1.5772 457727616
72 1.0775 407751354
96 2.1833 518335535
120 2.187 518708486
Heptanoic acid concentration for batch system by Clostridium ljungdahlii
Time
hours
Concentration
mM
Peak
area
24 1.0123 391109100
48 1.2885 415968147
72 1.998 479858943
96 1.8429 465865059
120 2.0179 481549506

179
Ethanol concentration for batch system by Clostridium ljungdahlii
Time
hours
Concentration
mM
Peak
area
24 0.4475 173148317
48 0.7316 243899242
72 1.014 260897141
96 2.861 371717202
120 3.191 391500347
Hexanol concentration for batch system by Clostridium ljungdahlii
Time
hours
Concentration
mM
Peak
area
24 0.416 241628806
48 0.445 244597812
72 1.717 371717202
96 1.911 391109100
120 2.11 411865059
Heptanol concentration for batch system by Clostridium ljungdahlii
Time
hours
Concentration
mM
Peak
area
24 0.671 74373646
48 0.711 82216463
72 0.753 90608530
96 0.821 104373646
120 0.853 110609530

180
Ethanoic acid concentration for continuous system by Clostridium ljungdahlii
Time
hours
Concentration
mM
Peak
area
24 0.45297 4589202
48 0.50238 6071502
72 0.56323 7897181
96 0.56406 7921811
120 2.471 65139719
Ethyl butyrate concentration for continuous system by Clostridium ljungdahlii
Time
hours
Concentration
mM
Peak
area
24 1.01 103098791
48 1.074 122396863
72 1.2139 164172874
96 1.2377 171334995
120 1.2692 180785376
Hexanoic acid concentration for continuous system by Clostridium ljungdahlii
Time
hours
Concentration
mM
Peak
area
24 0.9069 390696796
48 1.6255 462550801
72 1.618 461807102
96 1.6273 462730436
120 2.6638 566389282
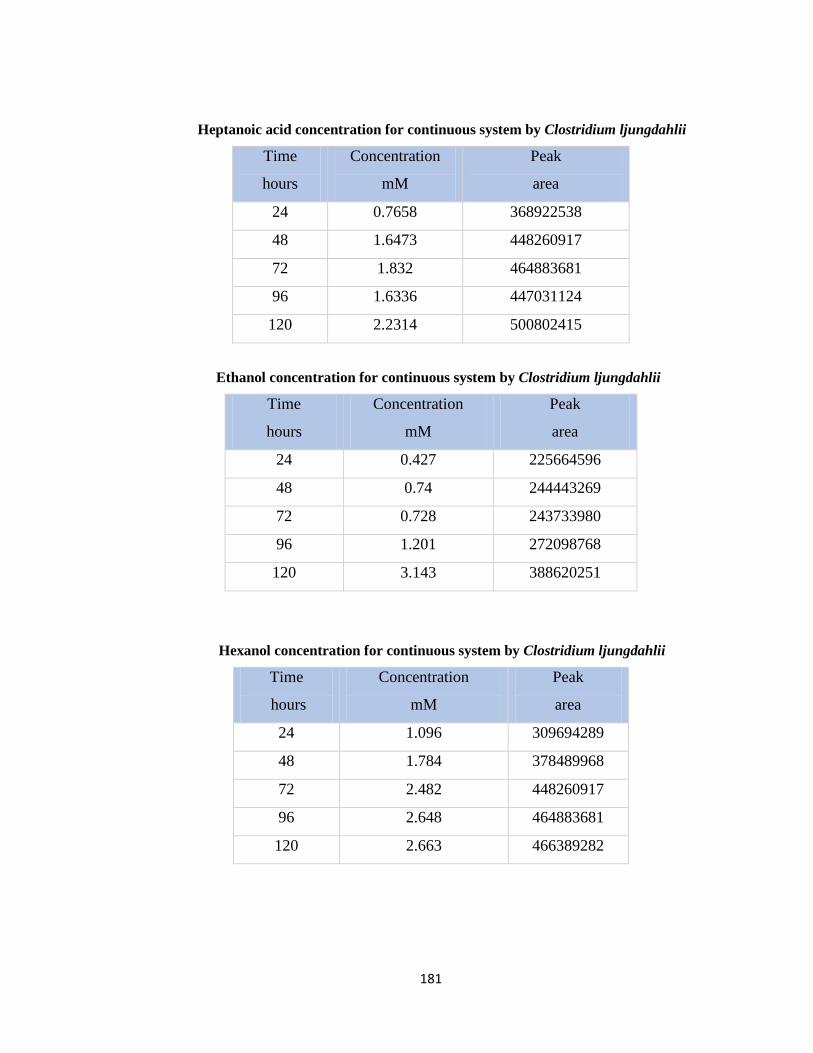
181
Heptanoic acid concentration for continuous system by Clostridium ljungdahlii
Time
hours
Concentration
mM
Peak
area
24 0.7658 368922538
48 1.6473 448260917
72 1.832 464883681
96 1.6336 447031124
120 2.2314 500802415
Ethanol concentration for continuous system by Clostridium ljungdahlii
Time
hours
Concentration
mM
Peak
area
24 0.427 225664596
48 0.74 244443269
72 0.728 243733980
96 1.201 272098768
120 3.143 388620251
Hexanol concentration for continuous system by Clostridium ljungdahlii
Time
hours
Concentration
mM
Peak
area
24 1.096 309694289
48 1.784 378489968
72 2.482 448260917
96 2.648 464883681
120 2.663 466389282
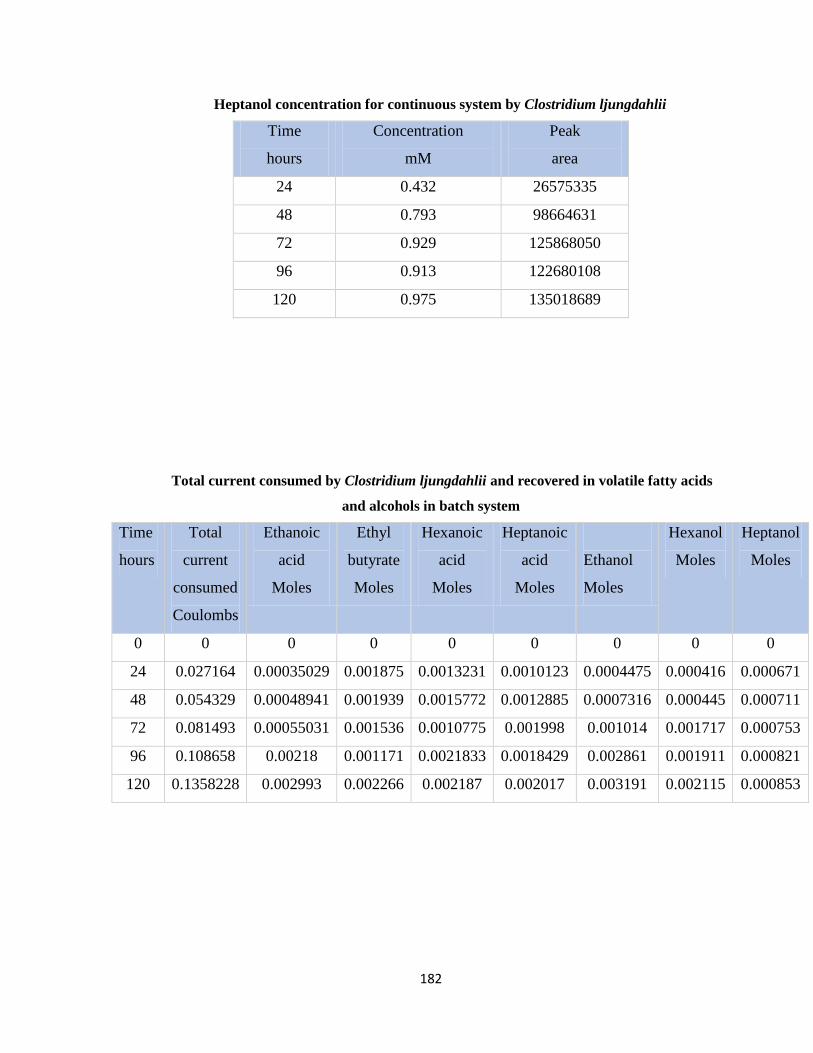
182
Heptanol concentration for continuous system by Clostridium ljungdahlii
Time
hours
Concentration
mM
Peak
area
24 0.432 26575335
48 0.793 98664631
72 0.929 125868050
96 0.913 122680108
120 0.975 135018689
Total current consumed by Clostridium ljungdahlii and recovered in volatile fatty acids
and alcohols in batch system
Time
hours
Total
current
consumed
Coulombs
Ethanoic
acid
Moles
Ethyl
butyrate
Moles
Hexanoic
acid
Moles
Heptanoic
acid
Moles
Ethanol
Moles
Hexanol
Moles
Heptanol
Moles
0 0 0 0 0 0 0 0 0
24 0.027164 0.00035029 0.001875 0.0013231 0.0010123 0.0004475 0.000416 0.000671
48 0.054329 0.00048941 0.001939 0.0015772 0.0012885 0.0007316 0.000445 0.000711
72 0.081493 0.00055031 0.001536 0.0010775 0.001998 0.001014 0.001717 0.000753
96 0.108658 0.00218 0.001171 0.0021833 0.0018429 0.002861 0.001911 0.000821
120 0.1358228 0.002993 0.002266 0.002187 0.002017 0.003191 0.002115 0.000853

183
Percent cathode recovery of organic products of Clostridium ljungdahlii vs. time
duration in batch system
Time
hours
Percent
Ethanoic
acid
Percent
Ethyl
butyrate
Percent
Hexanoic
acid
Percent
Heptanoic
acid
Percent
Ethanol
Percent
Hexanol
Percent
Heptanol
0 0 0 0 0 0 0 0
24 3.59 77.027 54.354 49.384 6.893 19.226 36.179
48 5.02 79.656 64.793 62.858 11.270 20.566 38.336
72 5.65 63.100 44.265 97.470 15.621 79.353 40.601
96 22.38 48.106 89.692 89.904 44.075 88.319 44.267
120 30.73 93.090 89.844 98.397 49.158 97.747 45.993
Total current consumed by biofilm and electrons recovered in organic compounds in
continuous system by Clostridium ljungdahlii
Time
hours
Total current
consumed
Coulomb
Ethanoic
acid
Moles
Ethyl
butyrate
Moles
Hexanoic
acid
Moles
Heptanoic
acid
Moles
Ethanol
Moles
Hexanol
Moles
Heptanol
Moles
0 0 0 0 0 0 0 0 0
24 0.141624982 0.00039025 0.00101 0.0009069 0.0007658 0.000427 0.001096 0.000432
48 0.282476948 0.00050238 0.001074 0.0016255 0.0016473 0.00074 0.001784 0.000793
72 0.423715421 0.00056323 0.0012139 0.001618 0.001832 0.000728 0.002482 0.000929
96 0.564953895 0.00056406 0.0012377 0.0016273 0.0016336 0.001201 0.002048 0.000913
120 0.706192369 0.002471 0.0012692 0.0026638 0.00223 0.003143 0.002063 0.000975

184
Percent cathode recovery of organic products of Clostridium ljungdahlii vs. time duration in
continuous system
Time
hours
Percent
Ethanoic
acid
Percent
Ethyl
butyrate
Percent
Hexanoic
acid
Percent
Heptanoic
acid
Percent
Ethanol
Percent
Hexanol
Percent
Heptanol
0 0 0 0 0 0 0 0
24 0.475 18.671 24.589 32.595 1.065 42.817 8.385
48 0.611 19.854 44.073 70.116 1.846 69.695 15.392
72 0.685 22.440 43.869 77.977 1.8168 96.963 18.032
96 0.686 22.880 44.122 69.533 2.997 80.0089 17.722
120 3.008 23.463 72.225 94.918 7.843 80.594 18.925

185