
Offender Risk Assessment in Virginia... the risk assessment ...

Norming the Proxy Risk Assessment
for Salt Lake County
Report
March 31, 2008


i
Table of Contents
Page
Table of Contents ............................................................................................................. i
Acknowledgments.......................................................................................................... ii
Executive Summary ...................................................................................................... iii
Background and Purpose ................................................................................................ 1
Methods........................................................................................................................... 1
Data Collection .................................................................................................. 1
Data Management .............................................................................................. 2
Data Analyses .................................................................................................... 2
Results ............................................................................................................................ 3
Distribution of Proxy Scores .............................................................................. 3
Relationship to Outcomes .................................................................................. 3
Variance Explained by Proxy ............................................................................ 3
Interaction of Proxy Items ................................................................................. 5
Low, Medium, & High Risk .............................................................................. 5
Proxy by Sub-Sample ........................................................................................ 6
Other Variables .................................................................................................. 8
Confirmation with Hold-Out Sample ............................................................... 12
Discussion and Conclusion ........................................................................................... 15
Bibliography ................................................................................................................ 17

ii
Acknowledgements
We would like to thank Gary K. Dalton, Division Director of Salt Lake County Criminal Justice
Services, for allowing us the opportunity to provide this examination of the proxy risk
assessment. We would also like to thank Criminal Justice Services staff and Salt Lake County
Adult Detention Center staff, especially Keith Thomas, for providing the data for these analyses.
Lastly, we extend our appreciation to William Woodward of the National Institute of Corrections
for his consultation on this project.

iii
Executive Summary
The Salt Lake County Adult Detention Center (ADC, jail) implemented a proxy risk assessment
following a site visit by William Woodward of the National Institute of Corrections and Center
for the Study and Prevention of Violence, University of Colorado, Boulder, Colorado.
A random sample of offenders who were given the proxy assessment during their booking
process were selected. This group was split into two random samples (Group 1 = 502, Group 2 =
505). Results of the proxy assessment were scored according to the procedures outlined by
Bogue, Woodward, and Joplin (2006). Proxy scores and official offender data from the jail
database (JEMS) were compared to recidivism (new charge bookings in the nine months
following the proxy booking).
Results from the norming and validation analyses suggest the following:
Total Score
• Higher proxy total scores are related to higher recidivism in Group 1. Only 10% of those
with a score of 2 recidivate, compared to 16% recidivism for those with a score of 4, and
23% for those with a score of 6.
• Higher proxy total scores are not related to higher recidivism in Group 2. About one-third
of offenders who have a score of 2 through 7 recidivate.
Individual Item Scores
• More self-reported prior arrests are related to higher recidivism in Group 1 and 2.
• Age at first arrest has an inconsistent relationship with recidivism.
• Current age is not related to recidivism in Group 1.
• Older current age is related to higher recidivism in Group 2. This is contrary to the
scoring of the proxy assessment that gives a higher risk score to younger offenders. The
proxy risk scoring is based on the theory that older offenders are less likely to recidivate.
Other Predictors of Recidivism
• Recidivism didn‟t vary by gender or minority status
• Having a commitment at the proxy booking decreased recidivism. This is not surprising
since those individuals spent an average of 70 days in jail on that booking, thus reducing
opportunity for reoffense.
• Having a new charge at the proxy booking was related to higher recidivism. Having drug
offenses at the proxy booking increased recidivism further (Group 1 and 2). Having a

iv
public order offense (disorderly conduct, criminal mischief, intoxication, false
information, and concealing identity) increased recidivism in Group 1 only.
• Two types of offenders had the highest recidivism: 1) Class C Misdemeanants with
several prior jail bookings who were older and generally had public order offenses, and
2) 1st Degree Felons with outstanding warrants who had some prior jail bookings and
generally had drug and person offenses.
• The most consistent predictors of recidivism (across Group 1 and 2) were total jail
bookings in the two years prior to the proxy booking and having a drug charge at the
proxy booking. Each additional booking was associated with a 20-34% increase in
likelihood of recidivism. Having a drug charge increased chance of recidivism by 2-2.5
times.
The study‟s conclusions are:
1. The proxy assessment is not a consistent predictor of recidivism for offenders booked
into the Salt Lake County ADC.
2. The proxy assessment may be less appropriate for certain offenders booked into the jail,
specifically older offenders who have a high frequency of bookings.
3. The proxy score does not differentiate well between frequent low-level offenders and less
frequent more severe offenders.
4. JEMS data available to CJS and ADC staff at the time of an offender‟s booking can be at
least equally helpful as the proxy assessment in making release and programming
decisions.

1
Proxy Risk Assessment
Salt Lake County Criminal Justice Services
March 31, 2008
Background and Purpose
In May 2006 William Woodward of the National Institute of Corrections and Center for the
Study and Prevention of Violence, University of Colorado, Boulder, Colorado, conducted a site
visit in Salt Lake County and provided recommendations to the Criminal Justice Advisory
Council (CJAC) and Mayor Peter Corroon. A major recommendation was the “immediate
adoption of a „proxy‟ instrument to determine risk of re-offending.” Similarly, Dr. Woodward
suggested that offender risk and needs information be available for appropriate matching to new
alternatives to incarceration.
In response to the recommendations, Criminal Justice Services (CJS) staff began implementing
the Proxy Score Risk Assessment (hereafter, proxy) at the Salt Lake County Adult Detention
Center (ADC, jail). The proxy assessment was based on the model developed by Dr. Woodward
and colleagues and has been used in Hawaii. The proxy consists of three items: 1) Current Age,
2) Age at First Arrest, and 3) Number of Prior Arrests. These items were asked of all offenders
during their booking process.
In May 2007 Gary K. Dalton, Division Director of CJS, asked the Utah Criminal Justice Center
(UCJC) to norm the proxy assessment for the Salt Lake County population. In addition, UCJC
agreed to validate the instrument by examining its relationship to future jail bookings and
recidivism.
Methods
Data Collection
As previously noted, the three proxy items were collected by CJS staff at the ADC during the
offender booking process. CJS staff already interview offenders during the booking process and
these items were folded into that process. Results of the three items were entered into a free-text
field in the jail management information system, JEMS.
For this study, a random sample of offenders who were booked into the ADC from 1/1/06
through 4/30/07 was selected by choosing 19 random dates over that time period. CJS staff
indicated that approximately 80 persons are booked into the ADC per day; therefore, 19 days
were selected to give a sample of 1,500 bookings. Special care was taken to select booking dates
that fell in different months and on different days of the week to account for variance in
offending by season and day of week. After the booking dates were selected, a separate group of
CJS staff pulled booking records from JEMS for those dates and transferred the three item
responses to a separate database.

2
Data Management
UCJC staff cleaned the proxy data, recoding vague responses (ex: “many” instead of a number of
prior offenses on the answer to the third item) as missing. Fewer bookings occurred per day than
first anticipated and after incomplete assessments were removed the resulting sample was
smaller than expected (N=1031). The three proxy items were re-linked with the JEMS booking
information for those assessments. Proxy booking data were further merged with offenders‟
JEMS records from July 1, 2000 through March 7, 2008 to examine offender history and future
bookings and recidivism. Lastly, the proxy booking sample of 1,031 was randomly split into two
groups: Group 1 (N=516) was the sample that the data were normed on and Group 2 (N=515)
was the hold-out confirmatory sample. Data were further reduced in each group based on
multiple proxy bookings per person. Final sample size was, Group 1 N=502 and Group 2 N=505.
Data Analyses
Data analyses were conducted to answer the following research questions outlined in the scope
of work. An additional research question (#8) was added.
1. What is the distribution of proxy scores?
2. What are the relationships between proxy items and outcomes of interest?
3. What percent of variance in outcomes is explained by each proxy item?
4. What interaction between proxy items affects outcomes?
5. What cut-points differentiate low, medium, and high risk on proxy assessment?
6. Do these cut-points correspond to low, medium, and high groupings on outcomes?
7. Does validity of proxy assessment vary by sub-sample characteristics (gender, ethnicity,
offender type (misdemeanant, felon))?
8. Are there other variables that are available in JEMS data that could be used in lieu of the
proxy assessment?
9. Are the cut-points and norming developed on one sample confirmed with the hold-out
sample?
The proxy score was calculated based on the procedures outlined by Bogue, Woodward, and
Joplin (2006), with the range of raw item scores being divided into thirds and given the
appropriate point value. Total proxy scores ranged from two to eight.
Construct validity is a way of assessing whether a tool is truly measuring the concept it is
intended to measure. Because the proxy risk assessment is supposed to measure risk of
recidivism, proxy risk scores were analyzed in relation to new jail bookings on new charges.
New charge bookings rather than a sum of new charges was selected as the primary outcome to
reduce the likelihood of measuring bootstrapping1 and also because discrete bookings into the
jail represent increased contact with the criminal justice system and the related costs. Recidivism
analyses were limited to a nine month follow-up period. This was the longest follow-up period
available for all persons in the sample.
1 The practice by law enforcement of adding charges in a single criminal episode

3
Several analyses were conducted to examine the relationship between proxy scores and
recidivism. Variables from JEMS, such as criminal history and charge types, were examined in
relation to recidivism as well. In this report recidivism refers to new charge bookings in the nine
months following the proxy assessment. Some analyses compare the presence of any new charge
bookings in the follow-up period to having zero. Other analyses examine the total number of new
charge bookings in the follow-up period (ranging from zero to 27). A detailed description of the
analyses and statistical significance of the results can be found in the technical report.
Results
1. What is the distribution of proxy scores?
The distribution of the proxy individual items, divided into the appropriate point values, is
presented in Table 1. As one can see in Table 1, an offender who is 25 years old, was 16 at his or
her first arrest, and has 9 priors would have a proxy score of 7. It should be noted that Bogue et
al. indicate that item #3, prior arrests, should include only adult arrests, although age at first
arrest, item #2, includes both juvenile and adult arrests. Discussions with CJS determined that
CJS staff sometimes recorded prior lifetime arrests in item #3, instead of only adult prior arrests.
Table 1 Group 1 Proxy Score Criteria
Proxy Score for Salt Lake County Group 1
Point Value 0 1 2 3
Current Age >=36 25-35 0-24
Age at First Arrest >=23 19-22 0-18
Priors 0-3 4-7 >=8
As shown in Figure 1, on the following page, the distribution of total proxy scores for Group 1 is
relatively “normal.” This means most offenders have a score in the middle of the distribution (4-
6), while fewest offenders have a score on the extremes (2 or 8). This shape of distribution is
consistent with total proxy scores calculated in other jurisdictions.
2. What are the relationships between proxy items and outcomes of interest? and
3. What percent of variance in outcomes is explained by each proxy item?
Higher proxy scores were significantly2 related to increased recidivism. As shown in Figure 2 on
the following page, this relationship was observed for those who had a score of two through
seven on the proxy, but did not hold true for the few offenders that had a proxy score of eight.
This is believed to be due to both 1) the small number of offenders who had a score of eight on
the proxy assessment, and, more importantly, 2) the likelihood that these most serious offenders
were already being limited in their opportunity for re-offense through either jail or prison
incarceration.
2 χ
2= 40.738, p < .01, Cramer‟s V = .285

4
Figure 1 Group 1 Total Proxy Score Distribution
9.8%
11.8%
15.9%
20.7%
22.7%
13.3%
5.8%
0.0%
5.0%
10.0%
15.0%
20.0%
25.0%
2 3 4 5 6 7 8
Total Proxy Score
Figure 2 Group 1 Recidivism by Proxy Score Distribution
New Charge Recidivism - 9 months
38%
57%
31%
8%
23%
29%
22%
0%
10%
20%
30%
40%
50%
60%
2 3 4 5 6 7 8
Proxy Score
Pe
rce
nt
of
Off
en
de
rs
Although the total proxy score was significantly related to recidivism, the relationship between
individual proxy items and recidivism was not as clear. As shown in Figure 3 on the following
page, higher scores on age at first arrest (younger age) and prior arrests (more priors) were
statistically significantly3 related to recidivism. For example, nearly half of those with a score of
3 on the priors item (had > 7 priors) recidivated, compared to one-third of those with a score of 2
(4-7 priors) and only 17.4% of those with a score of 1 (0-3 priors). There was not a statistically
3 Age at First χ
2= 23.299, p < .01, Cramer‟s V = .215; Priors χ
2= 37.062, p < .01, Cramer‟s V = .272

5
significant4 relationship between current age and recidivism. As shown in Figure 3, about one-
third of offenders, regardless of their score on the current age item, recidivated.
Figure 3 Group 1 Recidivism by Proxy Item Categories
New Charge Recidivism - 9 months
4 to 7
> 7
0.0%
5.0%
10.0%
15.0%
20.0%
25.0%
30.0%
35.0%
40.0%
45.0%
50.0%
Age at First Age at Current Priors
Proxy Item and Category
Pe
rce
nt
of
Off
en
de
rs
> 2219
to
22
0
to
18
> 35
25
to
350
to
24
0 to 3
Several follow-up analyses confirmed that more prior arrests were related to higher likelihood of
recidivism. In one test, the number of prior arrests reported at the proxy booking accounted for
42.4% of variance in recidivism. No consistent relationship between the age items (age at first
arrest and current age) and recidivism could be confirmed.
4. What interaction between proxy items affects outcomes?
An interaction between prior arrests and age affects likelihood of recidivism. A test that looked
at the interactions suggested that current age and age at first arrest are only important predictors
of recidivism for individuals who have a high number of prior arrests. In this test, older offenders
(current age) who started offending early (age at first) and frequently (priors) had the greatest
likelihood of recidivism. This finding is consistent with the life-course persistent theory of
offending. The life course persistent offenders are identified by an early age of first arrest and a
very high number of prior arrests. These offenders are most likely to continue offending at an
older age.
5. What cut-points differentiate low, medium, and high risk on proxy assessment? and
6. Do these cut-points correspond to low, medium, and high groupings on outcomes?
A visual examination of new charge bookings by proxy scores (see Figure 2), indicates that there
may be three natural cut-points in the proxy score distribution: low = 2, medium = 3-5, and high
= 6-7. Figure 4 on the following page displays recidivism for Group 1 by low, medium, and high
cut-point groupings. Group 1 offenders with a proxy score of eight (N=29, 5.8%) were excluded
4 χ
2= .993, p = .609

6
from the analysis for the previously mentioned reason that their likelihood of recidivism didn‟t
conform to the trend. Because these cut-points were selected based on the distribution of
recidivism by proxy score, they are statistically significantly5 related to recidivism.
These cut-points, however, may not be most advantageous for applying release and programming
criteria. For example, the low-risk group only comprises 9.8% of the sample (see Figure 1),
while the medium-risk group includes the bulk of offenders (48.4%). Furthermore, the high-risk
offenders include those with a proxy score of 6 and 7 (36% of the sample), who differ
substantially on risk of recidivism (38% vs. 57% recidivated, see Figure 2).
Other methods of determining cut-off scores include setting an arbitrary cut-point (e.g., based on
the percent of offenders the ADC wants to release, they can select the proxy score that
corresponds with that percent) and validating it with a more in-depth risk tool (e.g., the Level of
Service Inventory (LSI)) to set a cut-point (Bogue, et al., 2006). Both of these methods are
beyond the scope of this report.
Figure 4 Group 1 Recidivism by Low, Medium, and High Proxy Score
New Charge Recidivism - 9 months
24.7%
44.8%
8.2%
0.0%
5.0%
10.0%
15.0%
20.0%
25.0%
30.0%
35.0%
40.0%
45.0%
50.0%
LOW MED HIGH
Proxy Score
Perc
en
t o
f O
ffen
ders
7. Does validity of proxy assessment vary by sub-sample characteristics?
For the most part, the relationship between higher proxy scores and greater likelihood of
recidivism remained true for the following sub-groups: females vs. males, minorities vs. whites,
and low level offenders (those with Class B or less severe offenses at the time of their proxy
booking) vs. more severe offenders (Class A or higher as most severe charge at time of proxy
booking). As shown in Figures 5, 6, and 7, there is some variation by these subgroups. All three
figures compare the sub-groups against the entire Group 1 trend line that was first presented in
Figure 2. The only trend line that deviates a great degree is for female offenders (Figure 5). This
difference may be due to the small number of female offenders in the sample (N = 106, 21.1%).
� χ
2= 32.645, p < .01

7
It could also be due to an important relationship between gender and recidivism; therefore,
gender was included as an additional variable examined in research question #8 (see section
below). The close proximity of the lines on Figure 6 indicates that the relationship between
proxy score and recidivism does not vary much by minority status. Similarly, Figure 7 shows
that the relationship between proxy score and recidivism is similar for those who had less or
more severe charges at the time of their proxy booking. It should be noted that this comparison
excludes the group of offenders who did not have any new charges at the time of their proxy
booking (N = 208, 41.4%).
Figure 5 Recidivism by Proxy Score Distribution – Gender Comparison
New Charge Recidivism - 9 months
0%
20%
40%
60%
80%
100%
2 3 4 5 6 7 8
Proxy Score
Pe
rce
nt
of
Off
en
de
rs
All Female Male
Figure 6 Recidivism by Proxy Score Distribution – Minority Status Comparison
New Charge Recidivism - 9 months
0%
20%
40%
60%
80%
100%
2 3 4 5 6 7 8
Proxy Score
Pe
rce
nt
of
Off
en
de
rs
All Minority White

8
Figure 7 Recidivism by Proxy Score Distribution – Charge Severity Comparison
New Charge Recidivism - 9 months
0%
20%
40%
60%
80%
100%
2 3 4 5 6 7 8
Proxy Score
Pe
rce
nt
of
Off
en
de
rs
All Class B or below Class A or above
8. Are there other variables that are available in JEMS data that could be used in lieu of
the proxy assessment?
Yes, several variables drawn from the JEMS database were significantly related to recidivism.
These additional variables were examined because it was thought that they may help to
understand recidivism further. In addition, the new variable analyses highlighted two different
kinds of recidivism (frequent, low-level offending vs. less frequent but more serious offending)
that required further exploration.
At Proxy Booking Measures
Having a commitment at the time of the proxy booking was linked to a significant6 decrease in
recidivism (18.8% vs. 33.7%). This finding is not surprising, as those who are being booked on a
commitment spent an average of 70 days in jail for that booking, thus reducing the opportunity
for re-offense. In contrast, having a new charge at the time of the proxy booking was associated
with a significant7 increase in recidivism, with 36.0% of those with a new charge recidivating vs.
24.9% of those who didn‟t have new charges (these were individuals booked for other reasons,
including only warrants, commitments, or holds). Of those with new charges, specific types of
charges were also associated with increased likelihood of recidivism. As shown in Table 2 on the
following page, offenders who had person, drug, or public order8 charges were more likely to re-
offend.
6 χ
2= 8.371, p < .01
7 χ
2= 7.284, p < .01
8 Public order included disorderly conduct, criminal mischief, intoxication, false information, and concealing
identity, among others

9
There were no significant differences in recidivism by gender,9 minority status,
10 or having an
outstanding warrant at the proxy booking.11
Table 2 Recidivism by Charge Type at Proxy Booking
Recidivism by Charge Type at Proxy Booking
Has Charge Type at PB
Yes No
Property 39.5% 34.4%
Person* 44.9% 32.8%
Drug* 46.1% 31.9%
Public Order* 60.5% 31.2%
* Significant at .05 level
Recidivism varied significantly12
by charge severity at the proxy booking. As shown in Figure 8,
offenders whose most severe charge at the time of their proxy booking was a Class C
misdemeanor (7.8%) were most likely to recidivate in the nine months following the proxy
booking (65.2% had a new charge in the follow-up). Those who had first degree felonies (4.8%)
were second most likely to have a new charge in the follow-up period (50%). Excluding the high
recidivism rate for Class C offenders, the general trend is that having more serious charges at the
proxy booking is associated with higher recidivism in the follow-up period.
Figure 8 Recidivism by Charge Severity at Proxy Booking
New Charge Recidivism - 9 months
65.2%
29.0%32.7%
43.8%
50.0%
41.8%
18.7%16.3%
25.2%
4.8%
10.5%7.8%
0.0%
10.0%
20.0%
30.0%
40.0%
50.0%
60.0%
70.0%
Class C Class B Class A 3rd Degree
Felony
2nd Degree
Felony
1st Degree
Felony
Most Severe Degree at Proxy Booking
Perc
en
t o
f O
ffen
ders
% with New Charge % with Degree @ PB
9 χ
2= .696, p = .239
10 χ
2= 1.513, p = .130
11 χ
2= 1.230, p = .157
12 χ
2= 18.134, p < .01

10
The finding that Class C and First Degree Felony offenders were the most likely to recidivate,
although they comprise a small percent of offenders, led to additional descriptive analyses. As
shown in the following table (Table 3), there are several areas where these groups differ in
meaningful ways. Although both groups were young at the time of their first arrest (self-reported
median = 20), the Class C group was both older and had more priors at the time of the proxy
booking.
Table 3 Comparison of Class C Misdemeanants and First Degree Felons
Most Severe Degree at Proxy Booking
Class C Felony 1
N 23 14
2 Years Pre-Proxy Booking
Any Booking 78.3% 85.7%
Mn 8.7 2.9
Md 3 2.5
New Charge Booking 69.6% 78.6%
Mn 7.4 1.6
Md 2 1
Commitment Booking 69.6% 35.7%
Class A or more severe 17.4% 78.6%
At Proxy Booking
Person Offense 0.0% 57.1%
Property Offense 21.7% 14.3%
Drug Offense 0.0% 57.1%
Public Order Offense 87.0% 0.0%
Warrant 43.5% 85.7%
Age at First (Md) 20 20
Current Age (Md) 41 31
Priors (self-report, Md) 15 6
The descriptive statistics in Table 3 paint the picture of two types of offenders being booked into
the ADC that are at highest risk of short-term recidivism. The Class C group is older, has more
frequent contact with the ADC (average of approx 5 bookings per year), and has less severe
offenses. The Felony 1 group is younger, has a high recidivism rate, but less frequent contact
with the ADC, has more warrants, and commits more serious and dangerous (person) crimes. To
reiterate, these groups comprise a small percent of offenders (only 12.6% of new charge
bookings, only 7.4% of Group 1 overall). However, their high recidivism rate warranted this
additional description of their offense histories and presenting offenses at the time of the proxy
booking. Their unique profiles could help distinguish these groups so appropriate action could be
taken to reduce the risk for recidivism.

11
Pre-Proxy Booking Measures
All of the criminal history measures found in JEMS were significantly related to recidivism. As
shown in Table 4, below, having more jail bookings in the two years prior to the proxy was
associated with increased recidivism. This finding is not surprising, as past behavior is often the
best predictor of future behavior. It should be noted that official criminal history records (2-year
pre-proxy bookings) accounts for more variance in recidivism (57%), than self-reported lifetime
criminal history (prior arrests item on the proxy, 42.4%).
Table 4 Correlation between History of Jail Bookings and Recidivism
Correlation with Recidivism
Bookings 2 Years Pre-Proxy R2
New Charge* 0.58
Warrant* 0.38
Commitment* 0.18
Total Bookings* 0.57
*Significant at .05 level
Predictive Models
Proxy Model. A model predicting recidivism was developed using the three raw proxy items: 1)
Current Age, 2) Age at First Arrest, and 3) Number of Prior Arrests. Only self-reported priors
were significantly related to recidivism. For each additional prior arrest an offender reported on
the proxy measure his or her likelihood of recidivating in the following nine months increased by
6.7%.
JEMS Model. A model predicting recidivism was developed using five measures from JEMS:
total bookings in the two years prior to the proxy assessment, gender, minority status, presence
of drug offense at proxy booking, and presence of public order offense at proxy booking. Three
variables were significantly related to recidivism: bookings in the two years prior, having a drug
offense at the proxy booking, and having a public order offense at the proxy booking. Each new
booking in the two years prior increased the likelihood of recidivism by 36.5%, while having a
public order offense increased the likelihood 2.8 times and a drug offense increased it 2.5 times.
Combined Models. Next a combined model was run including all eight independent variables
from the proxy and JEMS models. A specific type of test was used to remove non-significant
variables step-by-step until the best predictors of recidivism remained. The final step included
the following five predictors that were all significantly related to recidivism: bookings in the two
years prior, having a drug offense at the proxy booking, having a public order offense at the
proxy booking, self-reported prior arrests, and self-reported age at first arrest. Younger age at
first arrest was associated with increased likelihood of recidivism. The other significant variables
had similar relationships with recidivism as they did in the previous proxy and JEMS models.
A final model was created with four independent variables from the combined stepwise model
(See Table 6). Self-reported prior arrests were not included in this model since they represented

12
essentially the same thing13
as prior official bookings, and the official criminal history record
was more strongly related to recidivism in the earlier tests. This final model correctly identified
31.2% of recidivists and 93.4% of those who didn‟t have a new charge booking. As with the
previous models, this one was not as good at predicting recidivists as it was at predicting non-
recidivists. As shown in the Odd‟s ratios displayed in Table 6, below, each additional booking in
the two years prior to the proxy is associated with a 34% increase in likelihood of recidivism,
while each year younger a person reports being at the age of their first arrest increases recidivism
likelihood by 3.5%. Having either a public order or drug offense at the proxy booking more than
doubles the likelihood of recidivism.
Table 6 Combined Model Predicting Recidivism
B Wald's Sig. Odd's Ratio
Total Bookings 2 Years Pre-Proxy 0.292 36.87 0.000 1.34
Drug Offense at Proxy 0.923 11.14 0.001 2.52
Public Order Offense at Proxy 0.985 6.85 0.009 2.68
Age at First Offense -0.036 6.60 0.010 0.96
9. Are the cut-points and norming developed on one sample confirmed with the hold-out
sample?
The relationship between total proxy score and recidivism found in Group 1 was not confirmed
in Group 2 (N=505). Furthermore, the cut-points based on Group 1 were not identical to new cut-
points calculated from the distribution of raw proxy items on Group 2 (see Table 7).
As shown in Table 7 below, based on the Group 2 cut-points, an offender who is 25 years old at
the time of their proxy booking would have a score on the current age item of two instead of one.
Based on Group 2 cut-points, having seven prior arrests would translate to a score of three on the
priors item instead of two, as based on Group 1 cut-points.
Table 7 Proxy Score Criteria by Group
Proxy Score Criteria by Group
Point Value 0 1 2 3
Current Age - Group 1 >=36 25-35 0-24
Current Age - Group 2 >=35 26-34 0-25
Age at First Arrest - Group 1 >=23 19-22 0-18
Age at First Arrest - Group 2 >=23 19-22 0-18
Priors - Group 1 0-3 4-7 >=8
Priors - Group 2 0-3 4-6 >=7
13
Pearson R = .625, p < .01

13
Figure 9 shows that the distribution of total proxy scores for Group 2 is similar, whether Group 1
or Group 2 criteria are used for cut-points. The distribution of proxy scores for Group 2 that are
presented in Figure 9 can be visually compared to the distribution of proxy scores for Group 1
that are presented in Figure 1. Again, the distribution is approaching a “normal” curve, with most
offenders having a score in the middle (proxy scores of 3-6) and fewest offenders having a score
at the extremes (2 or 8).
Figure 9 Group 2 Proxy Score Distribution by Group 1 and 2 Scoring Criteria
Group 2 Proxy Score Distribution
5.5%
15.6%14.9%
21.4%
25.1%
13.9%
3.6%5.0%
5.9%
13.9%15.6%
21.2%
26.3%
12.1%
0.0%
5.0%
10.0%
15.0%
20.0%
25.0%
30.0%
2 3 4 5 6 7 8
Total Proxy Score
Group 1 Cut-Points Group 2 Cut-Points
The remaining analyses on the Group 2 sample all used Group 1 scoring criteria and the resulting
proxy scores. If the proxy scores demonstrate a statistically significant relationship with
recidivism, then the use of these proxy scores will be confirmed with the hold-out sample.
As shown in Figure 10 on the following page, higher proxy scores were not significantly14
related to recidivism. In fact, offenders with proxy scores of two through seven had
approximately equal likelihood of recidivating, with approximately 30% of each group having a
new charge booking.
Follow-up examinations of individual proxy item scores, shown in Figure 11 on the following
page, demonstrate that older persons were actually more likely to recidivate15
. Offenders with a
score of 0 on the current age item (> 35 years old) had more recidivism (41.3%) than those with
a score of 1 (27.4%; 25-35 years old) or 2 (25.6%; 0-24 years old). This relationship contradicts
the proxy assessment theory that gives a higher risk score to younger persons. Having more prior
arrests was also statistically significantly16
related to a greater likelihood of recidivism. There
14
χ2= 4.34, p = .630
15 χ
2= 10.997, p < .01
16 χ
2= 20.329, p < .01

14
was not a significant17
relationship between age at first arrest and likelihood of recidivating.
Additional tests confirmed these findings. Recidivists were 34.6 years old on average compared
to 30.4 years old for non-recidivists18
. Recidivists reported 11.3 prior arrests on average
compared to 6.9 on average for non-recidivists19
.
Figure 10 Group 1 and 2 Recidivism by Proxy Score Distribution
New Charge Recidivism - 9 months
38%
57%
31%
50%
8%
23%29%22%
32%27%
31% 31%
29%
34%
0%
10%
20%
30%
40%
50%
60%
2 3 4 5 6 7 8
Proxy Score
Pe
rce
nt
of
Off
en
de
rs
Group 1 Group 2
Figure 11 Group 2 Recidivism by Proxy Item Category
Group 2 New Charge Recidivism - 9 months
4 to 7
> 7
0.0%
5.0%
10.0%
15.0%
20.0%
25.0%
30.0%
35.0%
40.0%
45.0%
50.0%
Age at First Age at Current Priors
Proxy Item and Category
Perc
en
t o
f O
ffen
ders
> 22
19
to
22
0
to
18
> 35
25
to
35
0
to
240 to 3
17
χ2= 3.21, p = .20
18 t= -4.103, df= 503, p < .01
19 t= -2.467, df= 503, p < .05
15
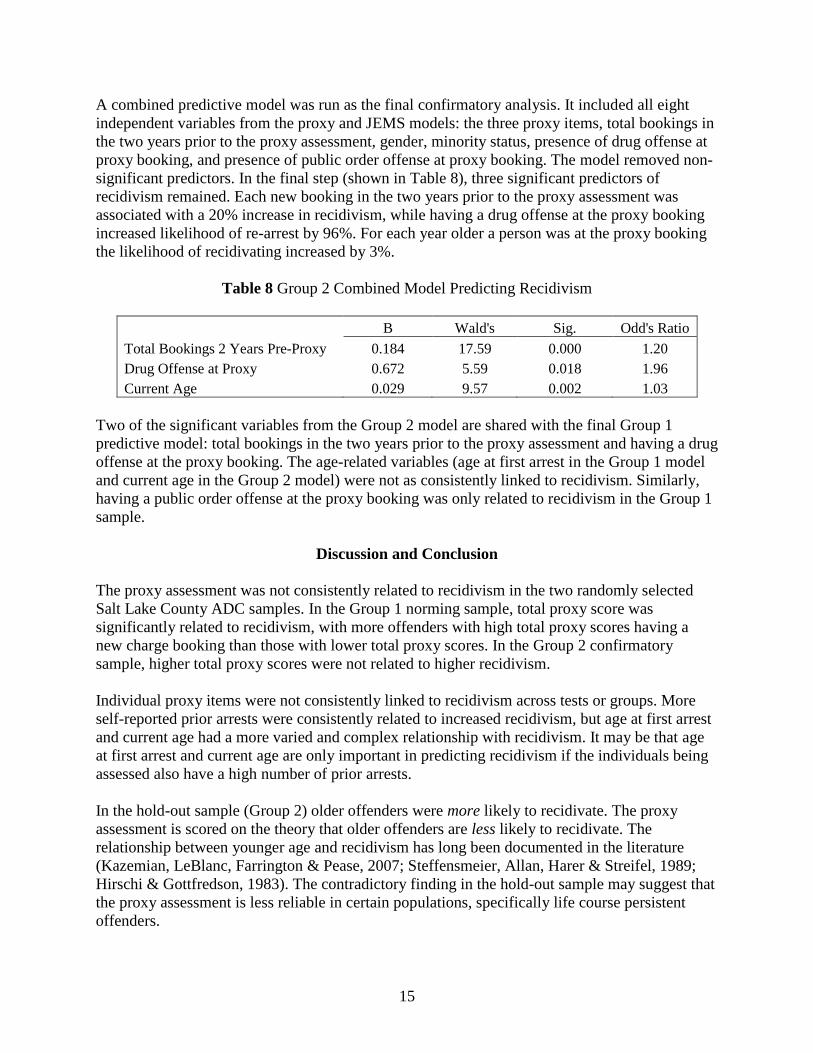
A combined predictive model was run as the final confirmatory analysis. It included all eight
independent variables from the proxy and JEMS models: the three proxy items, total bookings in
the two years prior to the proxy assessment, gender, minority status, presence of drug offense at
proxy booking, and presence of public order offense at proxy booking. The model removed non-
significant predictors. In the final step (shown in Table 8), three significant predictors of
recidivism remained. Each new booking in the two years prior to the proxy assessment was
associated with a 20% increase in recidivism, while having a drug offense at the proxy booking
increased likelihood of re-arrest by 96%. For each year older a person was at the proxy booking
the likelihood of recidivating increased by 3%.
Table 8 Group 2 Combined Model Predicting Recidivism
B Wald's Sig. Odd's Ratio
Total Bookings 2 Years Pre-Proxy 0.184 17.59 0.000 1.20
Drug Offense at Proxy 0.672 5.59 0.018 1.96
Current Age 0.029 9.57 0.002 1.03
Two of the significant variables from the Group 2 model are shared with the final Group 1
predictive model: total bookings in the two years prior to the proxy assessment and having a drug
offense at the proxy booking. The age-related variables (age at first arrest in the Group 1 model
and current age in the Group 2 model) were not as consistently linked to recidivism. Similarly,
having a public order offense at the proxy booking was only related to recidivism in the Group 1
sample.
Discussion and Conclusion
The proxy assessment was not consistently related to recidivism in the two randomly selected
Salt Lake County ADC samples. In the Group 1 norming sample, total proxy score was
significantly related to recidivism, with more offenders with high total proxy scores having a
new charge booking than those with lower total proxy scores. In the Group 2 confirmatory
sample, higher total proxy scores were not related to higher recidivism.
Individual proxy items were not consistently linked to recidivism across tests or groups. More
self-reported prior arrests were consistently related to increased recidivism, but age at first arrest
and current age had a more varied and complex relationship with recidivism. It may be that age
at first arrest and current age are only important in predicting recidivism if the individuals being
assessed also have a high number of prior arrests.
In the hold-out sample (Group 2) older offenders were more likely to recidivate. The proxy
assessment is scored on the theory that older offenders are less likely to recidivate. The
relationship between younger age and recidivism has long been documented in the literature
(Kazemian, LeBlanc, Farrington & Pease, 2007; Steffensmeier, Allan, Harer & Streifel, 1989;
Hirschi & Gottfredson, 1983). The contradictory finding in the hold-out sample may suggest that
the proxy assessment is less reliable in certain populations, specifically life course persistent
offenders.

16
Offender data from JEMS was consistently linked to recidivism. In both randomly selected
samples, each additional booking in the two years prior to the assessment increased the risk of
recidivism by approximately 20-34%. Having a new drug charge at the time of the proxy
booking increased the likelihood of recidivism by 2-2.5 times. Although self-reported prior
arrests from the proxy assessment were consistently related to recidivism, the official criminal
history measure was as consistently related to recidivism and may even have a stronger
association with recidivism (57% variance explained vs. 42%).
The following conclusions can be drawn from the proxy norming and validation analyses.
1. Total proxy score is not a consistent predictor of recidivism for offenders booked into the
Salt Lake County ADC.
2. The contrary to expected relationship between current age and recidivism in the
confirmatory sample (Group 2) suggests that the proxy assessment may be less
appropriate for certain offenders booked into the jail, specifically older offenders who
have a high frequency of bookings. As shown in the descriptive analyses on Group 1
Class C offenders, there is a small, but substantial group of offenders who are older and
booked into the jail quite frequently. They are often booked on public order offenses.
These offenders constitute a significant drain on the criminal justice system, but may not
comprise the same risk to public safety as other types of offenders.
3. The Salt Lake County ADC books several types of offenders including frequent low-level
criminals and more severe but less frequent offenders. The proxy score does not
differentiate between these groups, yet different release and programming criteria should
be applied to them, which suggests that additional information should be used for
decision-making.
4. Data available to CJS and ADC staff at the time of an offender‟s booking in the JEMS
database can be at least equally helpful as the proxy assessment in determining release
and programming. For example, jail bookings in the two years prior to the assessment
date explained more variance in recidivism than self-reported prior arrests. Furthermore,
type of new charges present at the proxy arrest (drug in both samples and public order in
Group 1) was significantly related to recidivism. This information can be used to
determine programming and services (treatment, housing, etc.), as well as gauge risk of
re-offense.
Support for the use of the proxy is mixed. Although higher proxy scores were generally related
to higher recidivism in the first randomly selected sample, this relationship did not remain true in
the second randomly selected sample. Furthermore, official records available to policy makers
and professionals working in the criminal justice system may be more appropriate to use when
making decisions about jail releases and offender programming. The use of a risk assessment or
official records for determining release and programming criteria requires further consideration.
17
Bibliography
Bogue, B., Woodward, W., & Joplin, L. (2006). Using a Proxy Score to Pre-screen Offenders for
Risk to Reoffend. Boulder, Co: Center for the Study and Prevention of Violence
Hirschi, T., & Gottfredson, M. (1983). Age and the Explanation of Crime. American Journal of
Sociology, 89, 552-84.
Kazemian, L., LeBlanc, M., Farrington, D., & Pease, K. (2007). Patterns of Residual Criminal
Careers among a Sample of Adjudicated French-Canadian Males. Canadian Journal of
Criminology and Criminal Justice, 49, 307-340.
Steffensmeier, D., Allan, E., Harer, M., & Streifel, C. (1989). Age and the Distribution of Crime.
American Journal of Sociology, 94, 803–831.