Proxy caching for peer-to-peer live streaming
13
Proxy caching for peer-to-peer live streaming q Ke Xu a , Ming Zhang b, * , Jiangchuan Liu c , Zhijing Qin d , Mingjiang Ye a a Department of Computer Science, Tsinghua University, Beijing 100084, PR China b School of Software, Tsinghua University, Beijing 100084, PR China c School of Computing Science, Simon Fraser University, Vancouver, BC, Canada d School of Software and Microelectronics, Peking University, Beijing 100871, PR China article info Article history: Received 6 May 2009 Received in revised form 25 September 2009 Accepted 29 November 2009 Available online 6 December 2009 Responsible Editor: I. Habib Keywords: P2P Live streaming Proxy caching abstract Peer-to-Peer (P2P) live streaming has become increasingly popular over the Internet. To alleviate the inter-ISP traffic load and to minimize the access latency, proxy caching has been widely suggested for P2P applications. In this paper, we carry out an extensive measurement study on the properties of P2P live streaming data requests. Our measure- ment demonstrates that the P2P living streaming traffic exhibits strong localities that could be explored by caching. This is particularly noticeable for the temporal locality, which is often much weaker in the conventional P2P file sharing applications. Our results further suggest that the request time of the same data piece from different peers exhibits a generalized extreme value distribution. We then propose a novel sliding win- dow (SLW)-based caching algorithm, which predicts and caches popular data pieces according to the measured distribution. Our experimental results suggest that the P2P live streaming can greatly benefit from the proxy caching. And, with much lower over- head, our SLW algorithm works closer to an off-line optimal algorithm that holds the complete knowledge of future requests. Ó 2009 Elsevier B.V. All rights reserved. 1. Introduction Recent years have witnessed the tremendous success of the peer-to-peer (P2P) communication paradigm. With each participating node contributing its own resources, the P2P communication architecture scales extremely well with user population. It has been widely used in such applications as file sharing [1,2], voice over IP (VoIP) [3], live streaming and video-on-demand (VOD) [4]. They to- gether have contributed to a great portion of the overall Internet traffic [5], and its ever growing trend has posed a significant threat to sustainable operations of Internet Service Providers (ISP) [6]. To mitigate the traffic load, particularly the costly inter- ISP traffic, caching data of interest closer to end-users has been frequently suggested in the literature. There have been extensive studies on caching the traffic of web [7,8] or streaming video in the client/server architecture (video streaming for short) [9]. Recent works have also examined caching for P2P file sharing [6,10]. The caches are generally deployed at gateways of institutions, referred to as proxy caching. Through satisfying requests from the local storage, they not only reduces the bandwidth consumption, but also minimizes the access latency [11]. The latest experi- ments further suggests that caching is very effective for P2P file sharing, too (with a bandwidth reduction of over 60% [12]). There are however important differences between liv- ing streaming and the conventional web and file sharing applications. For the latter two, the data pieces exhibit a skewed distribution, and the pieces frequently requested 1389-1286/$ - see front matter Ó 2009 Elsevier B.V. All rights reserved. doi:10.1016/j.comnet.2009.11.013 q This work has been supported in part by NSFC Project (60970104, 60873253), NSFC-RGC Joint Research Project (20731160014), 973 Project of China (2009CB320501), 863 Project of China (2008AA01A326) and Program for New Century Excellent Talents in University. * Corresponding author. Tel.: +86 6 260 3064; fax: +86 6 277 0753. E-mail addresses: [email protected] (K. Xu), [email protected] (M. Zhang), [email protected] (J. Liu), [email protected] (Z. Qin), [email protected] (M. Ye). Computer Networks 54 (2010) 1229–1241 Contents lists available at ScienceDirect Computer Networks journal homepage: www.elsevier.com/locate/comnet
Transcript of Proxy caching for peer-to-peer live streaming

Computer Networks 54 (2010) 1229–1241
Contents lists available at ScienceDirect
Computer Networks
journal homepage: www.elsevier .com/ locate/comnet
Proxy caching for peer-to-peer live streaming q
Ke Xu a, Ming Zhang b,*, Jiangchuan Liu c, Zhijing Qin d, Mingjiang Ye a
a Department of Computer Science, Tsinghua University, Beijing 100084, PR Chinab School of Software, Tsinghua University, Beijing 100084, PR Chinac School of Computing Science, Simon Fraser University, Vancouver, BC, Canadad School of Software and Microelectronics, Peking University, Beijing 100871, PR China
a r t i c l e i n f o a b s t r a c t
Article history:Received 6 May 2009Received in revised form 25 September2009Accepted 29 November 2009Available online 6 December 2009Responsible Editor: I. Habib
Keywords:P2PLive streamingProxy caching
1389-1286/$ - see front matter � 2009 Elsevier B.Vdoi:10.1016/j.comnet.2009.11.013
q This work has been supported in part by NSFC60873253), NSFC-RGC Joint Research Project (20731of China (2009CB320501), 863 Project of China (Program for New Century Excellent Talents in Univ
* Corresponding author. Tel.: +86 6 260 3064; faxE-mail addresses: [email protected] (K. Xu),
(M. Zhang), [email protected] (J. Liu), [email protected]@csnet1.cs.tsinghua.edu.cn (M. Ye).
Peer-to-Peer (P2P) live streaming has become increasingly popular over the Internet. Toalleviate the inter-ISP traffic load and to minimize the access latency, proxy caching hasbeen widely suggested for P2P applications. In this paper, we carry out an extensivemeasurement study on the properties of P2P live streaming data requests. Our measure-ment demonstrates that the P2P living streaming traffic exhibits strong localities thatcould be explored by caching. This is particularly noticeable for the temporal locality,which is often much weaker in the conventional P2P file sharing applications. Ourresults further suggest that the request time of the same data piece from different peersexhibits a generalized extreme value distribution. We then propose a novel sliding win-dow (SLW)-based caching algorithm, which predicts and caches popular data piecesaccording to the measured distribution. Our experimental results suggest that the P2Plive streaming can greatly benefit from the proxy caching. And, with much lower over-head, our SLW algorithm works closer to an off-line optimal algorithm that holds thecomplete knowledge of future requests.
� 2009 Elsevier B.V. All rights reserved.
1. Introduction
Recent years have witnessed the tremendous success ofthe peer-to-peer (P2P) communication paradigm. Witheach participating node contributing its own resources,the P2P communication architecture scales extremely wellwith user population. It has been widely used in suchapplications as file sharing [1,2], voice over IP (VoIP) [3],live streaming and video-on-demand (VOD) [4]. They to-gether have contributed to a great portion of the overallInternet traffic [5], and its ever growing trend has posed
. All rights reserved.
Project (60970104,160014), 973 Project2008AA01A326) andersity.: +86 6 277 [email protected] (Z. Qin),
a significant threat to sustainable operations of InternetService Providers (ISP) [6].
To mitigate the traffic load, particularly the costly inter-ISP traffic, caching data of interest closer to end-users hasbeen frequently suggested in the literature. There havebeen extensive studies on caching the traffic of web [7,8]or streaming video in the client/server architecture (videostreaming for short) [9]. Recent works have also examinedcaching for P2P file sharing [6,10]. The caches are generallydeployed at gateways of institutions, referred to as proxycaching. Through satisfying requests from the local storage,they not only reduces the bandwidth consumption, butalso minimizes the access latency [11]. The latest experi-ments further suggests that caching is very effective forP2P file sharing, too (with a bandwidth reduction of over60% [12]).
There are however important differences between liv-ing streaming and the conventional web and file sharingapplications. For the latter two, the data pieces exhibit askewed distribution, and the pieces frequently requested

1230 K. Xu et al. / Computer Networks 54 (2010) 1229–1241
in the past tend to be frequently requested in the future.This is not the case in living streaming that demandssequential playback. The data pieces in living streamingon the other hand has strong temporal correlations, sincethey are exchanged in a small playback window. Withthe playback window moves over time, the popularityand even usefulness of the data pieces change as well. Tothe best of our knowledge, proxy caching for P2P livestreaming traffic has yet to be examined, despite severalpioneer studies on collaborative caching on the peer side[13,14].
In this paper, we present a systematic study on the proxycaching for P2P live streaming. We first analyze the real datarequest of a popular P2P live streaming application, PPLive[4], and identify its key characteristics. In particular, we findthat the request time of the same data piece from differentpeers exhibits a generalized extreme value distribution.We then develop a data request generator that can closelysynthesize P2P live streaming traffic. We further propose anovel sliding window (SLW) caching algorithm that exploresthe unique distribution of the live streaming requests.
We evaluated the performance of our algorithm andcompare it with typical caching strategies. Our experi-ments show that our algorithm well suites the P2P livestreaming traffic, and its cache hit rate is very close to thatof an off-line optimal algorithm. We further model the the-oretical performance of the new algorithm, and providesgeneral guidelines for the configuration and optimizationof the algorithm.
The rest of the paper is organized as follows. In Section 2,we survey the related work. In Section 3, we compare thetraffic characteristics of P2P live streaming and P2P file shar-ing, followed by a measurement study on the data requestdistribution of PPLive in Section 4. We then present ourcaching algorithm in Section 5, and evaluate its performancein Section 6. Section 6 further models the performance of ourcaching algorithm. Finally, Section 7 concludes the paper.
2. Related work
There have been a series of measurement studies onP2P live streaming systems, particularly PPLive [15,16].Hei et al. [15] carry out an in-depth analysis of PPLive,and find that PPLive users experience large start-up delayand playback lags. They conclude that dedicated proxynodes are necessary to help with delivering videos at high-er playback rate. According to Ali et al. [16], P2P livestreaming has a greater impact on network bandwidththan P2P file sharing, because the upload bandwidth is un-fairly exhausted by some peers. These studies reveal a lotof statistical information about PPLive, but the request dis-tribution, which is of critical importance to cache design,has yet to be identified.
In the past, web caching has been extensively studied[8]. The importance and feasibility of caching P2P traffichave been demonstrated in [17,12] and [18]. Studies [17]and [12] show that P2P traffic is highly redundant andcaching can reduce as much as 50–60% of the traffic. Thework in [18] further suggests deploying proxy caches andmaking P2P protocols locality-aware, so as to reduce in-ter-ISP traffic. Other studies on proxy caching for P2P file
sharing include [6] and [10]. We summary the key issuesaddressed in these studies as follows:
� Object popularity. Incorporating object popularity intocaching algorithms can help with improving the cachehit rate. The pattern of object popularity is usually stud-ied as part of the caching algorithm design process [6].Typical object popularity patterns can be found in [7]and [19]. These studies all prove the effectiveness ofthe Pareto principle (or 80–20 rule). The channel popu-larity in P2P live streaming also satisfies the 80–20 rulewhich is an important consideration for caching algo-rithm design in our work.
� Temporal and spatial locality. Locality of reference char-acterizes the ability to predict future accesses to objectsfrom the history information [8]. There are two impor-tant types of locality: temporal and spatial. Temporallocality refers to the repeated accesses to the sameobject within short time periods. It implies that recentlyaccessed objects are likely to be accessed again in thefuture. Spatial locality refers to the patterns that acces-ses to some objects imply accesses to certain otherobjects. That said, the references to some objects canbe a predictor of future references to other objects. LeastRecently Used (LRU) is a classic algorithm utilizing tem-poral locality. The SLW algorithm proposed in our workexploits both the temporal and spatial locality of datarequests.
Despite the common issues, existing studies have sug-gested that web, video streaming and P2P file sharing traf-fic all have their distinct features, and specialized policiesare preferred to cache their respective traffic [10]. Alsonote that the popular pre-fetching policies to minimizethe startup latency or to meet certain time constraints[9,20–23] are not necessarily useful for living streaming.This is because the data pieces are released gradually overtime. In this work, we concentrate on achieving best cachehit rate without considering time constraint explicitly. Wewill see later that these two goals actually do not conflict.
3. Proxy caching for P2P live streaming: a general view
In this section, we first give a generic architectural viewof caching for P2P live streaming, in particular, where andhow the caches are deployed. We then analyze the differ-ences between live streaming and file sharing in terms ofcache design, which motivates our study.
3.1. Generic cache architecture for P2P traffic
In the P2P communication paradigm, each node (peer)has dual roles: downloading from other peers as a client,and uploading to other peers as a server. To avoid long-dis-tance sessions, particularly those between peers of differ-ent institutions such as Autonomous Systems (ASes), thecache servers can be deployed at the access points of regio-nal networks (as in [24]), as shown in Fig. 1a.
Once operated, the gateway intercepts the P2P down-loading requests originated from its associated regionalnetwork and redirects them to the P2P cache server
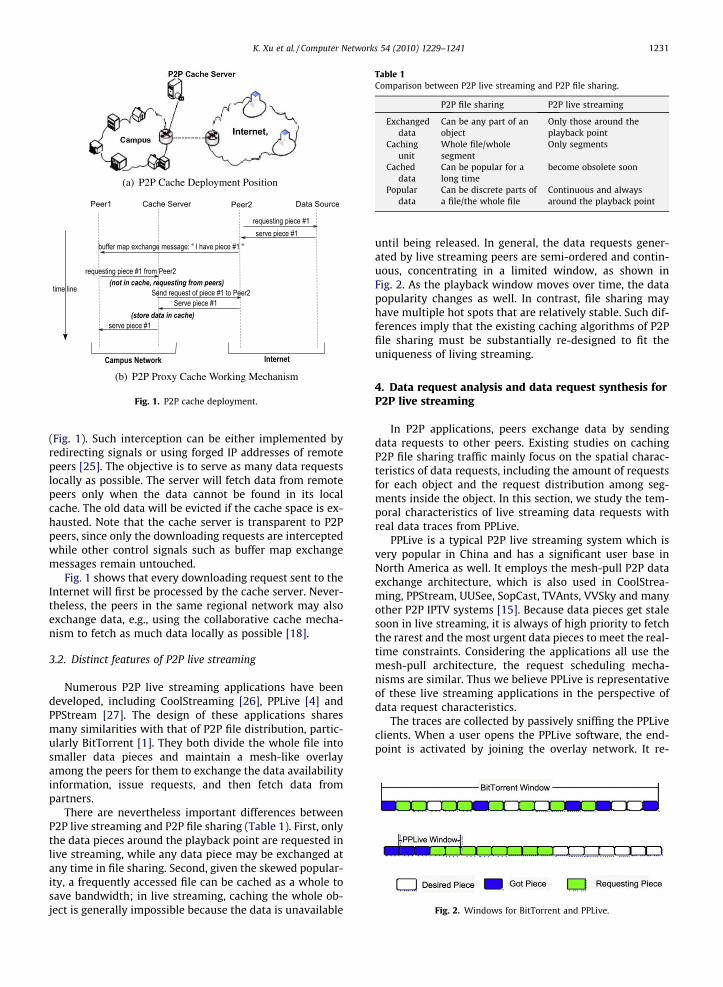
(a) P2P Cache Deployment Position
(b) P2P Proxy Cache Working Mechanism
Fig. 1. P2P cache deployment.
Table 1Comparison between P2P live streaming and P2P file sharing.
P2P file sharing P2P live streaming
Exchangeddata
Can be any part of anobject
Only those around theplayback point
Cachingunit
Whole file/wholesegment
Only segments
Cacheddata
Can be popular for along time
become obsolete soon
Populardata
Can be discrete parts ofa file/the whole file
Continuous and alwaysaround the playback point
Fig. 2. Windows for BitTorrent and PPLive.
K. Xu et al. / Computer Networks 54 (2010) 1229–1241 1231
(Fig. 1). Such interception can be either implemented byredirecting signals or using forged IP addresses of remotepeers [25]. The objective is to serve as many data requestslocally as possible. The server will fetch data from remotepeers only when the data cannot be found in its localcache. The old data will be evicted if the cache space is ex-hausted. Note that the cache server is transparent to P2Ppeers, since only the downloading requests are interceptedwhile other control signals such as buffer map exchangemessages remain untouched.
Fig. 1 shows that every downloading request sent to theInternet will first be processed by the cache server. Never-theless, the peers in the same regional network may alsoexchange data, e.g., using the collaborative cache mecha-nism to fetch as much data locally as possible [18].
3.2. Distinct features of P2P live streaming
Numerous P2P live streaming applications have beendeveloped, including CoolStreaming [26], PPLive [4] andPPStream [27]. The design of these applications sharesmany similarities with that of P2P file distribution, partic-ularly BitTorrent [1]. They both divide the whole file intosmaller data pieces and maintain a mesh-like overlayamong the peers for them to exchange the data availabilityinformation, issue requests, and then fetch data frompartners.
There are nevertheless important differences betweenP2P live streaming and P2P file sharing (Table 1). First, onlythe data pieces around the playback point are requested inlive streaming, while any data piece may be exchanged atany time in file sharing. Second, given the skewed popular-ity, a frequently accessed file can be cached as a whole tosave bandwidth; in live streaming, caching the whole ob-ject is generally impossible because the data is unavailable
until being released. In general, the data requests gener-ated by live streaming peers are semi-ordered and contin-uous, concentrating in a limited window, as shown inFig. 2. As the playback window moves over time, the datapopularity changes as well. In contrast, file sharing mayhave multiple hot spots that are relatively stable. Such dif-ferences imply that the existing caching algorithms of P2Pfile sharing must be substantially re-designed to fit theuniqueness of living streaming.
4. Data request analysis and data request synthesis forP2P live streaming
In P2P applications, peers exchange data by sendingdata requests to other peers. Existing studies on cachingP2P file sharing traffic mainly focus on the spatial charac-teristics of data requests, including the amount of requestsfor each object and the request distribution among seg-ments inside the object. In this section, we study the tem-poral characteristics of live streaming data requests withreal data traces from PPLive.
PPLive is a typical P2P live streaming system which isvery popular in China and has a significant user base inNorth America as well. It employs the mesh-pull P2P dataexchange architecture, which is also used in CoolStrea-ming, PPStream, UUSee, SopCast, TVAnts, VVSky and manyother P2P IPTV systems [15]. Because data pieces get stalesoon in live streaming, it is always of high priority to fetchthe rarest and the most urgent data pieces to meet the real-time constraints. Considering the applications all use themesh-pull architecture, the request scheduling mecha-nisms are similar. Thus we believe PPLive is representativeof these live streaming applications in the perspective ofdata request characteristics.
The traces are collected by passively sniffing the PPLiveclients. When a user opens the PPLive software, the end-point is activated by joining the overlay network. It re-

1232 K. Xu et al. / Computer Networks 54 (2010) 1229–1241
trieves channel list and peer list from root servers and ex-changes buffer map with partners. Finally, it sends data re-quests to other peers for video data. These requests arecollected with a proprietary tool provided by PPLive com-pany (we have cooperation with PPLive) and stored foroff-line analysis.
Typically the whole movie file is divided into data seg-ments each containing sixteen data pieces. The informationstored for a data request includes request sending time(also known as time stamp), request segment sequenceand data piece sequence (Fig. 3). The data requests are sentbased on data piece to different peers. The collected re-quests for each host are then preprocessed by filteringduplicate requests, removing segment sequence numberand translating the relative data piece sequence numberinto absolute one. We have collected traces generated byfive PPLive clients on different hosts in our campus watch-ing the same program for 2 h.
4.1. Characteristics of data requests for individual users
In this section, we study the characteristics of data re-quests for single users.
4.1.1. Stable requesting rateWe plot the data requests as points (Fig. 4a) and find the
linear relationship between the data piece sequence num-ber and time stamp. It indicates that the requesting rate (re-quests sent per second) represented by the slope is stable.We have also studied requests for other channels and ondifferent platforms. The linear relationship is also observedthough the slope may be different.
4.1.2. Request groups and subgroupsWe have found grouping features of data requests. In
Fig. 4a, the requests in the box are sent in 1 s (e.g., from101.5 s to 102.5 s). We call these requests a request group.Requests in a request group can be further divided intotwo subgroups, request subgroup1 and request subgroup2,according to the thickness of request time stamp. Theinterval between the centers of the two subgroups is about0.5 s. We define the group/subgroup size as the number ofrequests in a group/subgroup. From Fig. 4b and c, we learnthat most groups are of size 32 or 48. And the later ac-counts for about 75% of all the groups. This implies thatPPLive client is designed to send 32 or 48 data requestsper second. To learn the proportion of requests sent in sub-group1 to those sent in the whole group, we plot thesubgroup1 size
group size distribution for group size 32 and 48, respec-tively (Fig. 4e and f). Both figures show that most of the re-
Fig. 3. Data request information.
quests are sent in subgroup1, and relatively more requestsare sent in subgroup 2 for group size 48. We have alsostudied the interval between adjacent requests of the samesubgroup. Fig. 4d shows that more than 97% is between 0and 0.0005 s.
These study results reveal the data request generationmechanisms for single users, which are the basis of thedata request generator algorithm in Section 4.4.
4.2. Request lag distribution among peers
Playback lag refers to the phenomenon that some peerswatch frames in a channel minutes behind other peers[15]. Here, by request lag, we mean the phenomenon thatsome peers fetch a data piece in a channel seconds behindother peers in the same network. Request lag is veryimportant because it indicates the lifetime of a data piecein live streaming. The interval between the first and last re-quests of a data piece is the lag length. If a data piece is al-ready released and not yet obsolete (still being requested),we say it is active. The number of active data pieces in achannel at any given time is limited. These active datapieces are continuous, which are called the requesting win-dow of a channel.
To study the request lag characteristics, we divide thedata requests from five hosts into smaller segments eachwith 500 data requests, and 4140 request segments are ac-quired. These request segments are all normalized to startfrom request sequence number 0 and time stamp 0.0. Eachrequest segment represents the requests of a single user.So we obtained requests of 4140 peers from the data cap-tured in five clients. Then the lags among peers fetchingthe same data piece are analyzed. We retrieve the timestamp (logged in each request record) of data requestnumber 300 (the 300th of 500 requests, which is aroundthe middle) from each group, calculate the lag to the earli-est request of the group and plot its probability distribu-tion in Fig. 5. By fitting the distribution of request lags inmatlab with distribution models including exponential, ex-treme value, generalized extreme value, generalized pare-to, logistic, normal and t location-scale, we find that itfollows the generalized extreme value (GEV) distributionwith parameters j ¼ 0:214242; l ¼ 2:46523; r ¼ 1:99242 (Fig. 5) and the log likelihood is �25582.2. The GEV dis-tribution fits the data well in the view of both probabilitydensity and cumulative probability. Another way to mea-sure the distribution of a pile of data is empirical distribu-tion. It usually can fit the real data better. But thedistribution function of empirical distribution can becomplicated and not typical. We tend to fit the data witha well studied distribution and the benefits will be foundwhen analyzing the performance of our new cachingalgorithm.
The GEV distribution is widely used in risk manage-ment, finance, insurance, economics, hydrology, materialsciences, telecommunications, and many other industriesdealing with extreme events [28]. Its probability densityfunction (PDF) can be expressed as (j – 0)
f ðxÞ ¼ 1r
k�1�1je�k�
1;j ð1Þ

101 102 103 104 1055250
5300
5350
5400
5450
5500Request Characteristics
Time (sec.)
Dat
a Pi
ece
Sequ
ence
2000 4000 60000
1
2
3x 10⁵macro view
Time (sec.)
Dat
a Pi
ece
Sequ
ence
First Request
Subgroup1
(a) Request Characteristics View
0 1000 2000 3000 4000 5000 60000
10
20
30
40
50
60
70
80
Request Group Size Characteristics(1 sec. period for each group)
Request Group Sequence
Req
uest
Gro
up S
ize
Request Group
(b) Request Group Size Variation
10 20 30 40 50 60 70 800
0.05
0.1
0.15
0.2
0.25
0.3
Request Group Size (# of Requests)
Den
sity
Request Group Size Distribution(1 sec. period for each group)
request group size distribution
(c) Request Group Size(Probability View)
0 0.02 0.04 0.06 0.08 0.10
500
1000
1500
2000
Short Interval Length (sec.)
Den
sity
Small Interval(request interval in subgroup) Length Distribution
Small Interval Length Distribution
Interval [0, 0.0005]Probability = 0.974331
(d) Request Interval Distribution Inside Subgroup
0 0.2 0.4 0.6 0.8 10
5
10
15
20
25
30
Ratio (Subgroup Size/Group size)
Den
sity
(Subgroup1 Size/Group Size) Distribution
(Subgroup1 Size/Group Size) Distribution
(e) Subgroup1 Size Over Group Size(Size 32)
0 0.2 0.4 0.6 0.8 10
2
4
6
8
10
12
14
16
Ratio (Subgroup Size/Group size)
Den
sity
(Subgroup1 Size/Group Size) Distribution
(Subgroup1 Size/Group Size) distribution
(f) Subgroup1 Size Over Group Size(Size 48)
Fig. 4. Characteristics of live streaming data requests.
K. Xu et al. / Computer Networks 54 (2010) 1229–1241 1233
where k ¼ 1þ j x�lr , k > 0 and j;r;l are the shape, scale,
and location parameters, respectively.Fig. 5 shows that the lag length is about 15 s, which cov-
er more than 95% of the overall data requests. The lag dis-tribution describes the lifetime of a data piece. When adata piece is first released, it is requested by only a fewpeers. Then it becomes very hot because more and moredata copies are available in the P2P network and the play-
back position of most users moves to this data piece. How-ever, as the playback window forwards, the data piecebecomes unpopular again, and is obsolete after about15 s. The findings are inspiring in caching algorithm de-sign. For a channel with average group size of32 * 0.25 + 48 * 0.75 = 44 (refer to Section 4.1) data pieces,the playback rate is about 44 * 1 KBytes * 8 bits/Byte * 1 s = 352 kbps since the typical data piece size is

0 5 10 15 200
0.05
0.1
0.15
0.2
Lag Data(sec.)
Den
sity
Lag Distribution Fit(Density)
Lag DataGeneralized Extreme Value Distribution Fit
parameters:k = 0.214242mu = 2.46523sigma = 1.99242
(a) Probability Density View
0 5 10 15 200
0.2
0.4
0.6
0.8
1
Lag Data(sec.)
Lag Distribution Fit(Cumulative Probability)
Cum
ulat
ive
prob
abilit
y
Lag DataGeneralized Extreme Value Distribution Fit
parameters:k = 0.214242mu = 2.46523sigma = 1.99242
(b) Cumulative Probability View
Fig. 5. Lag distribution fit.
100 101 102 103 104100
101
102
103
104
Channel Rank
Onl
ine
Use
rs
Fig. 6. Channel popularity modeling.
1234 K. Xu et al. / Computer Networks 54 (2010) 1229–1241
1 KBytes. So the cache needed for a channel with 352 kbpsplayback rate is about 44 * 1 KBytes * 15 = 660 KBytes. Ifcached data is carefully updated and all the current activedata pieces are cached, a small cache can achieve nearly100% hit rate.
So far, we have investigated the request characteristicsof P2P live streaming, assuming all the requested data isfetched from the Internet rather than the local regionalnetwork. Because of the poor locality discovery mecha-nism, the assumption is reasonable and also proved byour inspection on real traces. But there’s still possibilitythat data is fetched from the local regional network espe-cially if the streaming content is static and data source lo-cates in the same regional network. We argue thatdifferent data pieces have the same probability to befetched locally, so the request characteristics observed inthe gateway won’t change dramatically, although muchless data requests can be seen.
4.3. Channel popularity
Similar to the role of object popularity in P2P file shar-ing caching, channel popularity (i.e. the online user numberof a channel) is important for live streaming in cachingalgorithm design. Channel popularity varies when userjoins the overlay network or aborts connection. Whendesigning caching algorithms for P2P live streaming, cacheshould be allocated according to channel popularity.
To study channel popularity, we measure the onlineuser number of totally 4403 channels at 21:30 pm on2008-11-07 with the help of PPLive. The online user num-ber versus channel rank distribution is plotted in the log–log scale in Fig. 6. The distribution can be modeled as a linewith slope of about 0.53. The relationship is expressed as
log y ¼ a log xþ b; ð2Þ
where 0 6 log x 6 c; a ¼ �0:53; b ¼ 3:73; c ¼ 3:0, y is theonline user number and x is the channel rank.
We have also modeled the distribution with stretchedexponential distribution [19], but found that although thedistribution fits the unpopular channels well, it is not sogood for the top 20 channels. Because popular channels ac-count for larger fraction of network traffic, we prefer to
model the top 100 channels with a more accurate linearrelationship.
Eq. (2) can be used as a guideline in deciding channeluser number for generating synthetic data requests. Giventhe channel number, we can pick points evenly on the lineso that both popular and unpopular channels are generatedproportionally.
4.4. Data request synthesis
We have studied request characteristics for single users,the lag distribution among peers in a channel and channelpopularity. Now we show how to utilize the findings togenerate synthetic data requests for caching algorithmevaluation. There are two objectives when generating syn-thetic requests. One is to match real traces as well as pos-sible. The other is to follow the typical patterns. Weachieve these goals by strictly following the models in pre-vious sections and adding randomness if necessary. Thesynthetic data request generator algorithm is describedin Fig. 7.
The procedure involves six steps:
1. Determine online user number for each channel (Fig. 7,Line 1,2). Given the channel number chN, first we deter-mine the online user number for each channel. Accord-

Fig. 7. Data request generator.
K. Xu et al. / Computer Networks 54 (2010) 1229–1241 1235
ing to the channel popularity relationship in Eq. (2), wegenerate a series of online user numbers (y) by pickingrank values (log x) evenly on the x-axis.
2. Generate lag data (Fig. 7, Line 3,4,5). As discussed in Sec-tion 4.2, peers of the same channel have a certain lagbetween each other. The request lags obey the GEV dis-tribution (Fig. 5), so we use matlab to generate requestlags for each channel and assign a lag to each user as theinitial request time stamp. The distribution parametersare marked in Fig. 5.So far, the online user number ineach channel and the initial request time stamp for eachuser have been determined. The following two steps arefor generating requests for each user in step 5.
3. Determine request interval. As shown in Section 4.1,request intervals are classified into two types: requestinterval between groups/subgroups and request inter-val inside subgroups. We use 1 s as request intervalbetween groups and 0.5 s between subgroups(Fig. 4a). To match real traces better, some randomnessis added(e.g., add �0:05 � þ0:05 for the group/sub-group interval). Request interval inside subgroups is0–0.0005 as shown in Fig. 4d. Note that the requestinterval is calculated when generating every newrequest.
4. Determine subgroup size. Group size reflects the request-ing rate. Higher requesting rate means more requestsare sent in each group, thus larger group size. In ourcase, groups of size 32 and 48 dominate (Fig. 4b andc). So only these two sizes are used. The probabilityfor group size of 32 is 0.25 and 0.75 for 48 (Fig. 4c).Whether requests of the same group are sent in sub-group1 or subgroup 2 is determined according toFig. 4e and f in a probabilistic fashion.
5. Generate request data for each user (Fig. 7, Line 6,7,8). Weassign a lag generated in step 2 as the initial time tampto each user and generate requests ([time stamp, chan-nel ID, sequence number] entry) using steps 3,4. The
sequence number starts from 1, monotonically increas-ing. Steps 3,4 are executed iteratively until time stampexceeds duration seconds.
6. Merge all the requests and get output (Fig. 7, Line 9). Everyrequest has its time stamp, which indicates its sendingtime. We merge all the requests by sorting them withthe key of time stamp. The output data contains the(time stamp, channel ID, sequence number) entry foreach request, which is the final synthetic data.
The synthetic data generation process is almost onlineexcept that the lag between requests must be generatedwith matlab. Since it’s very convenient to generate data gi-ven a distribution with matlab, we decide to do it off-lineafter balancing the efforts and gains of implementing anew distribution data generating algorithm. Also generat-ing data with matlab makes the process easier-to-under-stand. But we can also do it online, which is actually animplementation issue.
5. Sliding window (SLW) caching algorithm
Based on the observations in previous sections, we pro-pose a novel caching algorithm for P2P live streamingcalled sliding window (SLW) algorithm. SLW caches thehottest data pieces in the requesting window and distrib-utes cache among channels according to their popularity.Although P2P live streaming traffic is very favorable forcaching (see Section 4.2), it’s unnecessary and wasteful tocache all the active data pieces of all channels becausemost of the channels are not popular. Our caching objec-tive is to reduce the traffic on the link. So a well-designedcaching algorithm should cache data pieces of popularchannels preferentially.
The caching unit of SLW is data piece since it’s the datatransmission unit in P2P live streaming. Different datapieces are usually fetched from different peers. The datapiece size is fixed (1KB) in PPLive [29].
The basic idea of SLW is to maintain a caching windowstoring the most popular data pieces in the requesting win-dow for each channel. At any given time, all the data piecesin the requesting window are active, but some are re-quested more frequently. As data pieces are released grad-ually and data piece sequence number increasesmonotonically, these popular data pieces are continuousin the requesting window according to the lag distributionin Section 4.2. SLW stores these data pieces in cache whichare called the caching window of a channel. The cachingwindow size should not be larger than the requesting win-dow size, or it is a waste of cache. We denote the request-ing window size as X, and it can be calculated by
X ¼ R � L: ð3Þ
where R is the requesting rate and L is the lag length. Datapiece is the unit of the cache size, the caching window sizeand the requesting window size.
The requesting window is sliding forward, so the cach-ing window should also slide forward to accommodate thepopularity change of data pieces. That’s why we call our

1236 K. Xu et al. / Computer Networks 54 (2010) 1229–1241
new algorithm the sliding window algorithm. To decidewhether the caching window should be moved forward,we sample the request count of the head and tail parts ofthe caching window. If the data pieces at the head are morepopular than those at the tail, we know it’s time to admitnew data pieces into cache and evict those at the tail. Inthis way, it’s guaranteed that the most popular data piecesare always cached. The pseudo-code of the SLW algorithmis shown in Fig. 8.
The algorithm ‘‘Cache Replacement” in Fig. 8 describesthe process of sliding the caching window, while the algo-rithm ‘‘Channel Cache Size Adjustment” updates the cacheallocation among channels periodically according to thetrend of channel popularity. The channel popularity statis-tics are maintained in line 2 and reset after each adjust-ment. They reflect not only the number of online usersbut also the channel requesting rate. Cache is allocatedproportionally among channels according to their popular-ity statistics. The upper limit of the allocated cache for eachchannel is its requesting window size X. We distributecache among the channels according to the data requestnumber instead of online user number of each channel be-cause the data request number is more accurate with re-gard to the different requesting window sizes fordifferent channels.
Compared with the typical LRU (Least Recently Used)algorithm, which utilizes temporal popularity by cachingthe most popular data pieces, SLW also exploits spatiallocality by maintaining a continuous caching window.Although the popularity of the data pieces in the cachingwindow may vary temporarily, which can be reflected byLRU immediately, the caching window does not move for-ward until the data pieces at the head are more popularthan those at the tail. So the employment of spatial localityhelps resist temporary popularity fluctuations.
The SLW algorithm has several advantages.
Fig. 8. The SLW caching algorithm.
� Flexible. Section 4.2 shows that the request lag followsthe GEV distribution, but the parameters may vary indifferent network environments or time periods. SLWemploys the distribution indirectly by sampling the datapopularity in the head and tail parts, irrelevant to thespecific parameters of the GEV distribution. Besides,it’s common in a P2P network that peers join the net-work or abort connections frequently. SLW accommo-dates channel popularity variation by maintainingchannel popularity statistics and adjusting cache sizeaccordingly.
� Skillfully using the characteristics of P2P live streamingtraffic. SLW integrates information regarding all aspectsincluding channel popularity, temporal and spatiallocality. SLW always caches the most popular datapieces in the playback window and slides ahead whendata pieces at the head become more popular. Thesecached data pieces are always continuous and accessesto the most popular data pieces indicate the increaseof accesses to the data pieces of the head part. Moreover,as new data pieces get popular very quickly (Fig. 5), theyare cached very soon once appear, which speeds up datadelivery.
� Computationally-efficient. As Fig. 8 shows, the overheadof cache management is low. The time complexity forcache replacement is Oð1Þ, and the space complexity isOðchNÞ. The periodic adjustment of channel cache sizehas OðchNÞ both as the time and space complexity.
6. Evaluation and discussion
In this section, we use synthetic data requests to evalu-ate the performance of our SLW algorithm, and compare itwith three typical web caching algorithms (LRU, LFU, GDS)and two caching algorithms (LSB, P2P) proposed for P2Pfile sharing. The usual FIFO and OPT algorithms are alsoimplemented for comparison. Then we show how to calcu-late the theoretical performance curve of the SLW algo-rithm and standardize it as guidelines for estimating SLWperformance.
6.1. Experimental setup
The main objective of caching P2P live streaming trafficis to reduce extra traffic on the network link. So the mostimportant metric of the caching algorithms is the cachehit rate, i.e. the percentage of data requests served locally.Usually the cache size is based on the unit of bytes. As thecache eviction and admission are based on data piece forlive streaming, we employ the data piece number to de-note cache size.
We use synthetic data requests generated in Section 4.4to evaluate caching algorithms. Some typical parameters ofthe data set are listed in Table 2. Note that all the ten chan-nels have the same lag length, group size and durationvalues.
We compare the performance of SLW with that of fiveother algorithms. Implementation details of some cachingalgorithms are modified to accommodate the P2P live

0 2000 4000 6000 80000
10
20
30
40
50
60
70
80
90
100
Cache Size (# of Data Pieces Cached)
Cac
he H
it R
atio
(%)
FIFOGDLFUOPTP2PSLWLRU
(a) Performance Results
0 1000 2000 3000 4000 5000 6000 70000
10
20
30
40
50
60
Cache Size (# of Data Pieces Cached)
Impr
ovem
ent (
%)
(b) Performance Gain of SLW over LRU
Fig. 9. Algorithms comparison.
Table 2Synthetic data requests parameters.
Channel number (chN) 10Lag length (L) 15 sGroup size (groupSize) 32 for probability 0.25
48 for probability 0.7544 data pieces per second on average
Duration (duration) 3000 s
K. Xu et al. / Computer Networks 54 (2010) 1229–1241 1237
streaming traffic. The algorithms are implemented asfollows:
� OPT: The OPT (Optimal) algorithm eliminates the datapieces that will be latest used. It serves as a benchmarkfor the performance of other algorithms. The result ofOPT is the upper bound which can hardly be achievedby other algorithms since OPT uses future informationwhich is not known a priori in practice.
� FIFO: The FIFO (First In First Out) algorithm evicts datapieces in the first-in-first-out fashion. It’s the first algo-rithm that comes to mind when we find the sliding win-dow characteristics of the traffic.
� LRU: The LRU (Least Recently Used) algorithm evicts theleast recently used data pieces. It explores the temporallocality of data and is widely used.
� LFU-LSB: The LSB (Least Sent Bytes) algorithm uses thetransmitted bytes of an object as eviction criteria [10].The LFU (Least Frequently Used) algorithm evicts theobject with the least access frequency. As the requestfrequency and served bytes correlate with each otherin live streaming, these two algorithms are imple-mented as the same: first look for a channel least fre-quently accessed, and then eliminate the data pieceleast requested.
� GD: As the GDS (GreedyDual-Size) algorithm [30] takesobject size into consideration, which cannot be directlyapplied for live streaming, we implement the more basicGD algorithm [31]. The GD algorithm assigns a weight toeach newly cached data piece. When cache miss occurs,the data piece with the least weight is removed, and theweights of the other pieces in cache are reduced by theleast weight. If a data piece is hit, its weight restores tothe original value. The mechanism of the GD algorithmis very similar to that of LRU.
� P2P: The P2P algorithm [6] is proposed for P2P file shar-ing. It evicts the object with the lowest ci, where ci isupdated by ‘‘ciþ ¼ hit=cached size of object i”. For P2Plive streaming, the algorithm is implemented toeliminate the least frequently requested data piece fromthe channel with the lowest ci, and ci is updated with‘‘ciþ ¼ hit=cached size of channel i”. So cache evictionalways occurs in the channel with least requests, likeLFU.
6.2. Performance results
The examined algorithms fall into five categories aspreviously illustrated: OPT, SLW, LRU, FIFO and LFU. We
can also see the grouping in their performance results(Fig. 9). LFU is not suitable for live streaming becausedata piece popularity is changing all the time. The fre-quent access of some data pieces especially those at thetail of the requesting window does not indicate that theywill be requested again. Temporal locality is observedfrom the good performance of LRU. But it does not utilizethe continuity of popular data pieces (i.e., spatial local-ity), so its performance is not so good as SLW. SLWworks best among the online algorithms since it exploresboth temporal and spatial locality. The performance ofSLW is the closest to that of the off-line OPT algorithm,gaining nearly 50% improvement over the performancegap between LRU and OPT (Fig. 9). The poor performanceof FIFO implies that simply applying the FIFO policy can-not achieve very good results.
Fig. 9 verifies that P2P live streaming traffic is veryfavorable for caching. In our case, the requesting windowsize (X) of a single channel is 660. When cache size is about6600 (chN �X), the cache hit rate of SLW nearly reaches100%. So it is with the OPT, GD, LRU and FIFO algorithms.The sharp increase of cache hit rate with the increase ofcache size is considerable when cache size is small. Onlyabout 2000 data pieces need to be cached to serve 80% ofthe data requests. That’s to say, deploying a small cachein the network can significantly reduce the traffic imposedby P2P live streaming systems.

0 200 400 600 800 10000
20
40
60
80
100
Cache Size(# of Data Pieces Cached)
Cac
he H
it R
atio
(%)
3724258217911242861597414287199138average
Fig. 10. Online user number affecting SLW performance.
1238 K. Xu et al. / Computer Networks 54 (2010) 1229–1241
To examine the effect of online users on the SLW perfor-mance, we run SLW through the synthetic data in eachchannel with different online user numbers ranging from138 to 3724. The experimental results (Fig. 10) show thatthe SLW performance on a single channel is irrelevant tothe online user number and the cache hit rate is nearly100% when cache size is as large as X ¼ 44 � 15 ¼ 660.It’s because the cache size determines the fraction of re-quests that can be cached in the requesting window. Ifthe requesting window size is the same, the cache hit ratedepends on the cache size only.
It’s common that different channels may have differentrequesting rates. We run SLW on a data set with averagerequesting rate of 76 data pieces per second to study therequesting rate impact on its performance. The new dataset has the requesting window size X ¼ 76 � 15 ¼ 1140.Fig. 11 shows the SLW performance on this data set. Wenormalize the performance curve linearly to that of thedata set with group size 44 and find that the two curvesmatch very well (Fig. 11). The experimental results verifythat the requesting rate correlates linearly with the perfor-mance of SLW. It implies that the same cache performancecan be maintained by linearly increasing requesting win-dow size while requesting rate increases.
6.3. Modeling the SLW algorithm performance
In this section, we try to answer the question: how toestimate the SLW algorithm performance on a specific data
0 500 1000 15000
20
40
60
80
100
Cache Size(# of Data Pieces Cached)
Cac
he H
it R
atio
(%)
groupSize 76, normalizedgroupSize 76, 3724 peersgroupSize 44, average
Fig. 11. Group size affecting SLW performance.
set given a cache size? We calculate the cache hit rate the-oretically with the GEV distribution and then compare itwith the experimental SLW performance. Results showthat the theoretical performance and the experimentalone matches perfectly. Consequently the performance pro-files by theoretical computation can be employed to esti-mate the SLW performance, which is shown at the end ofthis section.
We have obtained the experimental performance ofSLW. Now we try to calculate its performance theoreti-cally. The point-in-time data requests of one channel arestudied. Ideally the cache hit rate for any given time isthe same since the data requesting rate is stable. So thecache hit rate calculated with a snapshot can representthe overall algorithm performance. The GEV distributiondescribes the data piece popularity during its lifetime.We assume the first data requests for every two adjacentdata pieces are released with the same interval length,which is reasonable with stable requesting rate. Conse-quently all the data pieces in the requesting window corre-spond to the points (i.e. the age of each data piece) evenlydistributed in the x-axis span (Fig. 12) and their currentpopularity can be reflected by the corresponding y valuesof the points on the distribution curve. Popular data pieceshave more requests while unpopular ones have less. Inother words, the discrete x value can be viewed as a datapiece in the requesting window, and the corresponding yvalue reflects the proportional population requesting thedata piece. As SLW always caches the most popular datapieces, we can calculate the shadowed area in Fig. 12 asthe cache hit rate and formulate it (h) as
h ¼ Fðx2Þ � Fðx1Þ; ð4Þ
with the constraints
f ðx2Þ ¼ f ðx1Þ; x1 þ t ¼ x2; x1 6 l0 6 x2;
where FðxÞ and f ðxÞ are the cumulative distribution func-tion and probability density function respectively. Thefunction value f ðxÞ reaches its maximum when x ¼ l0. Var-iable t is the cache size. We need to obtain the relationshipbetween h and t.
For each x1, we can calculate x2 (thus t) with binarysearch in x (x > l0) on the GEV distribution curve in
0 5 10 15 200
0.05
0.1
0.15
0.2
Lag Data(sec.)
Den
sity
GEV distribution (Density)
y0
y=f(x)
x2x1
Fig. 12. Cache hit ratio calculation.

0 20 40 60 80 1000
20
40
60
80
100
Cache Size(# of Data Pieces Cached)
Cac
he H
it R
atio
(%)
Curve 1: theoretical resultsCurve 2: experimental results
Fig. 13. Theoretical vs. experimental results.
Table 3Different distribution parameters.
Distribution Parameters Lag length
GEV 1 GEV j ¼ 0:214242 15 sl ¼ 2:46523r ¼ 1:99242
GEV 2 GEV j ¼ 0:1;l ¼ 10;r ¼ 14 85 sNORM normal l ¼ 7:5;r ¼ 3:2 15 s
K. Xu et al. / Computer Networks 54 (2010) 1229–1241 1239
Fig. 12. Then h can be calculated with Eq. (4). By enu-merating x1, we can obtain a list of ðh; tÞ pairs. We mul-tiply 100=L to every t to normalize the results fromrequesting window size X ¼ L (L ¼ 15 here) to X ¼ 100(100 is chosen just for convenience), and plot the newðh; tÞ pairs in Fig. 13(Curve 1), which is the theoreticalSLW performance. The x-axis indicates the percentageof data pieces cached over the requesting window, andthe y-axis indicates the percentage of data requestsserved from cache. To compare the theoretical perfor-mance with the experimental one, we also normalizethe experimental performance curve to X ¼ 100 (Curve2 in Fig. 13) and find that these two curves almost coin-cide with each other.
The theoretical performance curve, only relevant to therequesting window property decided by the GEV distribu-tion parameters, matches the experimental results verywell. We call it a standard profile. By theoretically calculat-ing the cache hit rate for some specific distributions, weobtain some standard profiles shown in Fig. 14. Table 3lists the distribution parameters. The different perfor-mance curves reflect the different properties of differentdistributions.
Now we can use these standard profiles as guidelines toestimate the SLW performance given a cache size. First dis-
0 20 40 60 80 1000
20
40
60
80
100
Cache Size(# of Data Pieces Cached)
Cac
he H
it R
atio
(%)
GEV 1GEV 2NORM
Fig. 14. Comparison of different distributions.
tribute cache size among the channels according to theirchannel popularity and data requesting rates (refer to the‘‘Channel Cache Size Adjustment” routine in Fig. 8). Andthen use the requesting rate and the standard profiles tocompute cache hit rate of each channel. At last, the overallcache hit rate can be calculated by adding the cache hitrate of single channels weighted by its proportionalpopularity.
6.4. Cache size optimization
We can also estimate the required cache size to achievecertain cache hit rate. Since the cache hit rate of SLW in-creases with the increase of cache size, we can use binarysearch to estimate the required cache size with a givencache hit rate. The estimation can help avoid unnecessarycache usage and optimize cache size.
For example, the cache hit rate of SLW nearly reaches100% when cache size is about 6600 in Fig. 9. Actuallywe can calculate the required cache size with any givencache hit rate. The calculated cache size is also the mini-mum one to reach certain cache performance. Extra cachecan be spared if the performance already meets realrequirements.
7. Conclusion
In this paper, we studied the characteristics of data re-quests in P2P live streaming and modeled the lag distribu-tion with the generalized extreme value distribution. Withthe help of the findings, we designed a data request gener-ator to generate synthetic traffic for P2P live streamingapplications. Furthermore, we proposed a novel cachingalgorithm for P2P live streaming applications-SLW. TheSLW algorithm explores both temporal and spatial localityof data requests and gets the best performance among theonline caching policies including LRU, LFU and FIFO. Exper-iments prove that the P2P live streaming traffic is veryfavorable for caching. Deploying a small cache in the net-work can significantly reduce the traffic imposed by theP2P live streaming systems. By studying the factors affect-ing SLW performance, we calculated standard performanceprofiles with the lag distributions and illustrated theirpractical usage in estimating algorithm performance. Inthe future, we plan to make a similar study on the cachingstrategies for P2P video-on-demand traffic. Since P2P VoDtraffic does not have obvious synchronization characteris-tics as P2P live streaming, caching strategies for P2P VoDtraffic may share more similarities with those for P2P file

1240 K. Xu et al. / Computer Networks 54 (2010) 1229–1241
sharing traffic. The effectiveness and benefits of the SLWalgorithm in real environments need further investigationas well.
References
[1] <http://www.bittorrent.com>.[2] <http://www.emule.org>.[3] <http://www.skype.com>.[4] <http://www.pplive.com>.[5] T. Karagiannis, A. Broido, N. Brownlee, K.C. Claffy, M. Faloutsos, Is P2P
dying or just hiding? in: Proceedings of the GLOBECOM 2004Conference, IEEE Computer Society Press, Dallas, Texas, 2004.
[6] O. Saleh, M. Hefeeda, Modeling and caching of peer-to-peer traffic, in:ICNP ’06: Proceedings of the 2006 IEEE International Conference onNetwork Protocols, IEEE Computer Society, Washington, DC, USA,2006, pp. 249–258. doi:http://dx.doi.org/10.1109/ICNP.2006.320218.
[7] L. Breslau, P. Cao, L. Fan, G. Phillips, S. Shenker, Web caching and zipf-like distributions: evidence and implications 1 (1999) 126–134,doi:10.1109/INFCOM.1999.749260.
[8] S. Podlipnig, L. Böszörmenyi, A survey of web cache replacementstrategies, ACM Comput. Surv. 35 (4) (2003) 374–398. doi:<http://doi.acm.org/10.1145/954339.954341>.
[9] J. Liu, J. Xu, Proxy caching for media streaming over the internetcommunications magazine, IEEE 42 (8) (2004) 88–94, doi:10.1109/MCOM.2004.1321397.
[10] A. Wierzbicki, N. Leibowitz, M. Ripeanu, R. Wozniak, Cachereplacement policies revisited: the case of P2P traffic, in:Proceedings of the 2004 IEEE International Symposium on ClusterComputing and the Grid, 2004, pp. 182–189. doi:10.1109/CCGrid.2004.1336565.
[11] J. Wang, A survey of web caching schemes for the internet,SIGCOMM Comput. Commun. Rev. 29 (5) (1999) 36–46.doi:<http://doi.acm.org/10.1145/505696.505701>.
[12] R.J. Dunn, Effectiveness of caching on a peer-to-peer workload,Master’s Thesis, University of Washington, Seattle, 2002.
[13] Y. Chen, C. Chen, C. Li, A measurement study of cache rejection inp2p live streaming system, in: ICDCSW ’08: Proceedings of the 2008the 28th International Conference on Distributed ComputingSystems Workshops, IEEE Computer Society, Washington, DC, USA,2008, pp. 12–17.
[14] S. Deshpande, J. Noh, P2P live streaming of video in peer-to-peersystems, in: ICME, IEEE, 2008, pp. 649–652. <http://dblp.uni-trier.de/db/conf/icmcs/icme2008.html#DeshpandeN08>.
[15] X. Hei, C. Liang, J. Liang, Y. Liu, K. Ross, A measurement study of alarge-scale P2P iptv system, IEEE Transactions on Multimedia 9 (8)(2007) 1672–1687, doi:10.1109/TMM.2007.907451.
[16] S. Ali, A. Mathur, H. Zhang, Measurement of commercial peer-to-peer live video streaming. <http://citeseerx.ist.psu.edu/viewdoc/summary?doi=10.1.1>.
[17] N. Leibowitz, A. Bergman, R. Ben-shaul, A. Shavit, Are file swappingnetworks cacheable? characterizing P2P traffic, in: Proceedings ofthe 7th International WWW Caching Workshop, 2002.
[18] T. Karagiannis, P. Rodriguez, K. Papagiannaki, Should internet serviceproviders fear peer-assisted content distribution? in: IMC ’05:Proceedings of the 5th ACM SIGCOMM conference on InternetMeasurement, USENIX Association, Berkeley, CA, USA, 2005,pp. 6–6.
[19] L. Guo, E. Tan, S. Chen, Z. Xiao, X. Zhang, Does internet media trafficreally follow zipf-like distribution? in: SIGMETRICS ’07: Proceedingsof the 2007 ACM SIGMETRICS International Conference onMeasurement and Modeling of Computer Systems, ACM, NewYork, NY, USA, 2007, pp. 359–360. doi:<http://doi.acm.org/10.1145/1254882.1254929>.
[20] S. Chen, H. Wang, X. Zhang, B. Shen, S. Wee, Segment-basedproxy caching for internet streaming media delivery, IEEEMultiMedia 12 (3) (2005) 59–67. doi:http://dx.doi.org/10.1109/MMUL.2005.56.
[21] S. Chen, B. Shen, S. Wee, X. Zhang, Designs of high quality streamingproxy systems, in: Proceedings of IEEE, 23th Annual Joint Conferenceof the IEEE Computer and Communications Societies, INFOCOM, vol.3, 2004, pp. 1512–1521. doi:10.1109/INFCOM.2004.1354565.
[22] S. Sen, J. Rexford, D. Towsley, Proxy prefix caching for multimediastreams, in: Proceedings of IEEE, 18th Annual Joint Conference of theIEEE Computer and Communications Societies, INFOCOM, vol. 3,1999, pp. 1310–1319. doi:10.1109/INFCOM.1999.752149.
[23] K.-L. Wu, P.S. Yu, J.L. Wolf, Segment-based proxy caching ofmultimedia streams, in: WWW ’01: Proceedings of the 10th
International Conference on World Wide Web, ACM, New York,NY, USA, 2001, pp. 36–44. doi:<http://doi.acm.org/10.1145/371920.371933>.
[24] M. Hefeeda, C. Hsu, K. Mokhtarian, Design and evaluation of a proxycache for peer-to-peer traffic, Tech. Rep., Simon Fraser University(Sep 2008).
[25] <http://www.cachelogic.com>.[26] X. Zhang, J. Liu, B. Li, Y.-S. Yum, Coolstreaming/donet: a data-driven
overlay network for peer-to-peer live media streaming, in:Proceedings of IEEE, 24th Annual Joint Conference of the IEEEComputer and Communications Societies, INFOCOM, vol. 3, 2005, pp.2102–2111. doi:doi:10.1109/INFCOM.2005.1498486.
[27] <http://www.ppstream.com>/.[28] Extreme value distribution. URL: <http://www.mathwave.com/
articles/extreme-value-distributions.html>.[29] Y. Huang, T.Z. Fu, D.-M. Chiu, J.C. Lui, C. Huang, Challenges, design
and analysis of a large-scale P2P-vod system, in: SIGCOMM ’08:Proceedings of the ACM SIGCOMM 2008 Conference on DataCommunication, ACM, New York, NY, USA, 2008, pp. 375–388.doi:<http://doi.acm.org/10.1145/1402958.1403001>.
[30] P. Cao, S. Irani, Cost-aware www proxy caching algorithms, in:USITS’97: Proceedings of the USENIX Symposium on InternetTechnologies and Systems on USENIX Symposium on InternetTechnologies and Systems, USENIX Association, Berkeley, CA, USA,1997, pp. 18–18.
[31] N. Young, The k-server dual and loose competitiveness for paging,Algorithmica 11 (1994) 525–541.
Ke Xu was born in Jiangsu, PR China, in 1974.He received the B.S., M.S. and Ph.D. degrees incomputer science from Tsinghua University,China in 1996, 1998 and 2001, respectively.Currently, he is an Associate Professor in thedepartment of computer science of TsinghuaUniversity. His research interests include nextgeneration Internet, switch and router archi-tecture, P2P and overlay network. He is amember of ACM SIGCOMM, member of IEEEand IEEE Communication Society.
Ming Zhang is currently a M.S. candidate ofSchool of Software, Tsinghua University. Hisresearch interests include network trafficclassification and applications, peer-to-peersystems and networking security.
Jiangchuan Liu received the BEng degree(cum laude) from Tsinghua University, Bei-jing, China, in 1999, and the Ph.D. degree fromThe Hong Kong University of Science andTechnology in 2003, both in computer sci-ence. He is currently an Associate Professor inthe School of Computing Science, Simon Fra-ser University, British Columbia, Canada, andwas an Assistant Professor in the Departmentof Computer Science and Engineering at TheChinese University of Hong Kong from 2003 to2004.
His research interests include multimedia systems and networks, wire-less ad hoc and sensor networks, and peer-to-peer and overlay networks.He is an Associate Editor of IEEE Transactions on Multimedia, and an
editor of IEEE Communications Surveys and Tutorials. He is a SeniorMember of IEEE and a member of Sigma Xi.
etworks 54 (2010) 1229–1241 1241
Zhijing Qin is currently a Master student ofSchool of Software and Microelectronics,
Peking University. His research interestsinclude traffic identification, P2P live stream-ing and network pricing.K. Xu et al. / Computer N
Mingjiang Ye received the B.Eng. degree incomputer science from Tsinghua University,China, in 2000. He is currently a Ph.D. candi-date in Department of Computer Science andTechnology, Tsinghua University, China. Hisresearch interests are in the filed of Internettechnologies and applications, including net-work traffic management, network trafficclassification and peer-to-peer systems andoverlay networks.


![CUBE Media Proxy - Cisco · media-recording proxy [dial-peer-tag1 dial-peer-tag2 dial-peer-tag3 dial-peer-tag4 dial-peer-tag5] Example: Step4 Note Youcanspecifymaximumoffivedial-peertags.](https://static.fdocuments.us/doc/165x107/600896c15662324ac908e474/cube-media-proxy-cisco-media-recording-proxy-dial-peer-tag1-dial-peer-tag2-dial-peer-tag3.jpg)