PROXIMATE, MINERALS, PHYTOCHEMICALS, …fruit), Elaeis guineensis and Daniella oliveritree (Olukoya...
32
2017 May Edition |www.jbino.com | Innovative Association J.Bio.Innov6 (3), pp: 399-430, 2017 |ISSN 2277-8330 (Electronic) Adeyeye PROXIMATE, MINERALS, PHYTOCHEMICALS, AMINO ACIDS, LIPIDS COMPOSITION AND SOME FOOD PROPERTIES OF THE SCLEROTIUM OF PLEUROTUS TUBER-REGIUM (RUMPH.EX FR.) SINGER1951) Emmanuel Ilesanmi Adeyeye Chemistry Department (Analytical Unit), Ekiti State University, PMB 5363, Ado Ekiti, Nigeria ABSTRACT Proximate, minerals, phytochemicals, amino acids, lipidscomposition and some food properties were determined in the edible part of Pleurotus tuber- regium. In the proximate composition: protein,ash and carbohydrate were high. Energy due to proteinand utilizable energy due to protein were high.High levels wereobserved in Ca, Mg, K, Na and P; the Ca/P ratio was excellent. In the mineral safety index, P, Na and Ca were above the MSI by values of 79.0-94.0%.Total amino acid value was 93.6 g/100 g. On amino acid scores, P. tuber-regium was better than Gly, Ala, Pro, Val, Thr, Glu, Tyr and His under whole hen's egg comparison; under provisional amino acid scoring pattern, the sample was better than Val, Thr, Phe + Tyr and total amino acid (AA) concentration; under pre-school child comparison, sample was better concentrated in Val, Thr, Met +Cys, Phe +Tyr, His and total AA.Essential amino acid index was high at 90.3 and biological value was 86.7. The trend in the fatty acid composition was (% total FA): ƩMUFA > ƩPUFA > ƩSFA and< ƩUFA. MUFA/SFA (=1.93), PUFA/SFA (=1.83) and n-6/n-3 (=1.37). Phospholipids level was low;in sterols, only cholesterol was significant at 44.8 mg/100 g (about 100 %). These functional property values were high: water absorption capacity, oil absorption capacity, emulsion capacityand the lowest gelation concentration was 6.00 ±0.00 %. Protein solubility was high at both acid and base sides of the pH with pI value of pH 5. Keywords: Chemical composition, functional properties, Pleurotus tuber-regium No of Tables: 12 No of Figures: 1 No of Plate: 1 References: 92
Transcript of PROXIMATE, MINERALS, PHYTOCHEMICALS, …fruit), Elaeis guineensis and Daniella oliveritree (Olukoya...
2017 May Edition |www.jbino.com | Innovative Association
J.Bio.Innov6 (3), pp: 399-430, 2017 |ISSN 2277-8330 (Electronic)
Adeyeye
PROXIMATE, MINERALS, PHYTOCHEMICALS, AMINO ACIDS, LIPIDS COMPOSITION AND
SOME FOOD PROPERTIES OF THE SCLEROTIUM OF PLEUROTUS TUBER-REGIUM (RUMPH.EX FR.)
SINGER1951)
Emmanuel Ilesanmi Adeyeye
Chemistry Department (Analytical Unit), Ekiti State University, PMB 5363, Ado Ekiti, Nigeria
ABSTRACT
Proximate, minerals, phytochemicals, amino acids, lipidscomposition and some food
properties were determined in the edible part of Pleurotus tuber- regium. In the proximate
composition: protein,ash and carbohydrate were high. Energy due to proteinand
utilizable energy due to protein were high.High levels wereobserved in Ca, Mg, K, Na and
P; the Ca/P ratio was excellent. In the mineral safety index, P, Na and Ca were above the
MSI by values of 79.0-94.0%.Total amino acid value was 93.6 g/100 g. On amino acid
scores, P. tuber-regium was better than Gly, Ala, Pro, Val, Thr, Glu, Tyr and His under whole
hen's egg comparison; under provisional amino acid scoring pattern, the sample was
better than Val, Thr, Phe + Tyr and total amino acid (AA) concentration; under pre-school
child comparison, sample was better concentrated in Val, Thr, Met +Cys, Phe +Tyr, His and
total AA.Essential amino acid index was high at 90.3 and biological value was 86.7. The
trend in the fatty acid composition was (% total FA): ƩMUFA > ƩPUFA > ƩSFA and< ƩUFA.
MUFA/SFA (=1.93), PUFA/SFA (=1.83) and n-6/n-3 (=1.37). Phospholipids level was low;in
sterols, only cholesterol was significant at 44.8 mg/100 g (about 100 %). These functional
property values were high: water absorption capacity, oil absorption capacity, emulsion
capacityand the lowest gelation concentration was 6.00 ±0.00 %. Protein solubility was
high at both acid and base sides of the pH with pI value of pH 5.
Keywords: Chemical composition, functional properties, Pleurotus tuber-regium
No of Tables: 12 No of Figures: 1 No of Plate: 1 References: 92
2017 May Edition |www.jbino.com | Innovative Association
J.Bio.Innov6 (3), pp: 399-430, 2017 |ISSN 2277-8330 (Electronic)
Adeyeye
INTRODUCTION
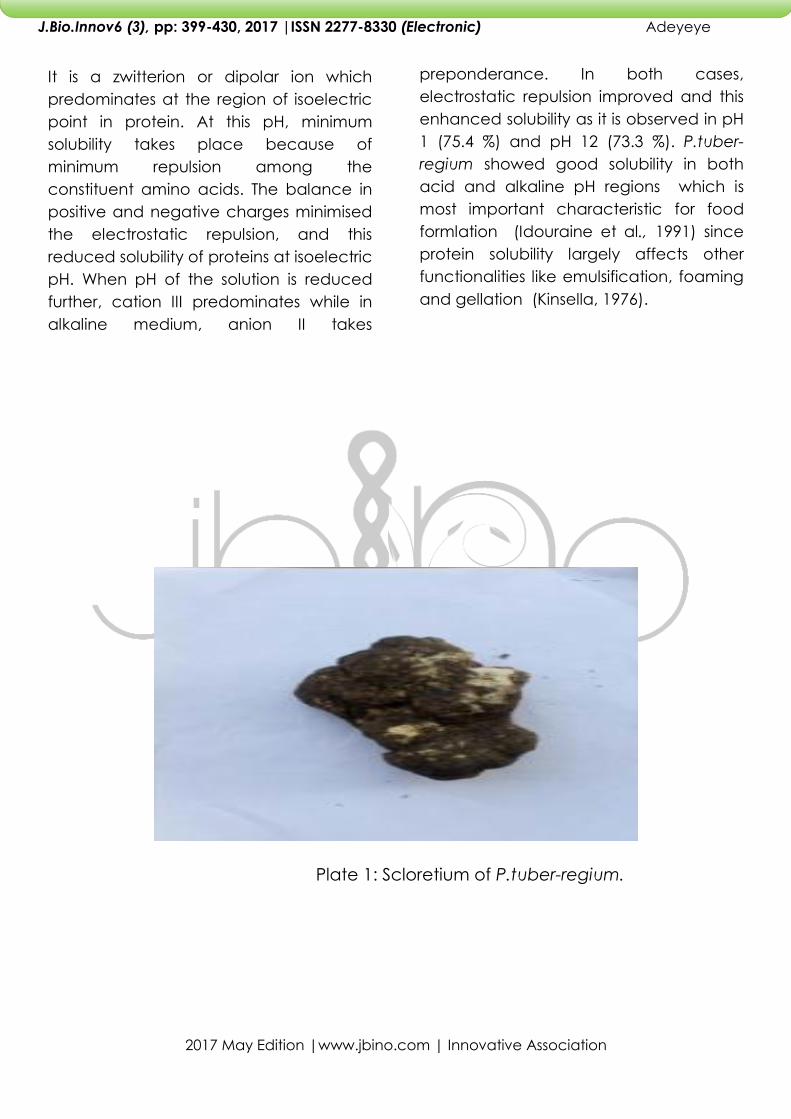
Pleurotus tuber-regium (Fr.) Sing. is a
basidiomycete found in the tropical
and subtropical regions of the world
(Zoberi, 1993). It forms a large,
spherical to ovoid, subterranean
sclerotium, composed of fungus tissue,
sometimes up to 30 cm (11.8 inches)
or more diam. The sclerotium is dark
brown on the outside and white inside
(Plate 1).
P.tuber-regium initially infects dry
wood where it produces the
sclerotium which may become buried
in the soil. The fungus is common in
Nigeria where farmers usually lift the
sclerotium out of soil or wood while
cultivating their farm. The fungus is
consumed popularly in Nigeria (Oso,
1977). P. tuber-regium as a fungus is
found to grow on the drill dust of the
wood of Treculia africana (bread
fruit), Elaeis guineensis and Daniella
oliveritree (Olukoya and Okogbo,
1990).
Olukoya and Okogbo (1990) reported
that when the sclerotium was grown
on drill dust of Eleais guineensis and
Daniella oliveri tree, the fungus
produced sclerotia but on other
substrates it produces fruit bodies with
sclerotis. In nature, sclerotia typically
form in response to adverse growing
conditions as a methodof carrying the
life of the fungus through difficult
conditions. When the growth medium
dries out or available nutrients are
used up, the fungus responds by
forming a scloretium (Olukoya and
Okogbo, 1990).
The scientific classification of P. tuber-
regium is as follows: Kingdom (Fungi),
Phylum (Basidiomycota), Class
(Agaricomycetes), Order (Agaricales),
Family (Pleutotaceae), Genus
(Pleurotus), Species (P.tuber-regium),
Binomial name (Pleurotus tuber-
regium) (Rumph.ex Fr.)Singer 1951.
Synonyms are Pachyma tuber-regium
Fr. 1822 and Lentinus tuber-regium (Fr.)
Fr. 1836 (Wikipedia).
Agomuo (2011) had reported the
proximate, phytochemical and
mineral element analysis of the
sclerotium of Pleurotus tuber-regium.
This mushroom is used as a food
source by many Nigerians but
chemical composition information on
it is scanty. In trying to bridge this gap
of paucity of information, this research
reports on the analytical
determination of the proximate,
minerals, phytochemicals, amino
acids, lipids (fatty acids, phospholipids,
sterols) composition and food
properties of Pleurotus tuber-regium
Sing.
MATERIALS AND METHODS
Collection and treatment of sample
The balls of the sclerotium of Pleurotus
tuber-regium were purchased from
Oba market in Akure and identified at
the Taxonomy Unit of the Department
of Plant Science, Ekiti State University,
2017 May Edition |www.jbino.com | Innovative Association
J.Bio.Innov6 (3), pp: 399-430, 2017 |ISSN 2277-8330 (Electronic)
Adeyeye
Ado-Ekiti. The mushroom was washed,
dried and milled into powder.
Proximate analysis
The proximate analysis of the
powdered sample for crude fat, total
ash, crude fibre and moisture was
determined using the methods
described by AOAC [2006]. Crude
protein was determined by the
method described by Pearson [1976]
while carbohydrate was determined
by difference. The calorific value in
kilojoule (kJ) was calculated by
multiplying the crude fat, crude
protein and carbohydrate by Atwater
factor of 37, 17 and 17 respectively or
in Calories by multiplication with 9, 4
and 4 respectively. Determinations
were in duplicate.
Mineral analysis
The mineralswere analysed from the
solution obtained by first dry ashing
the sample at 5500 C. The mineral
analysis was performed using atomic
absorption spectrophotometer (Buck
Scientific Model-200 A/210, Norwalk,
Connecticut 06855) and phosphorus
was determined colorimetrically by
Spectronic 20 (Gallenkam, UK) using
phosphovanado molybdate method
(AOAC, 2006). Ca/P, Na/K, Ca/Mg
and the milliequivalent ratio [K/(Ca
+Mg)] (Hathcock, 1985); the mineral
safety index (MSI) (Hathcock, 1985) of
Ca, P, Na, Fe, Cu, Zn, Mg and Se were
also calculated.
Phytochemical analysis
The phytochemical analysis
(tannins,total phenol, phytic acid,
oxalate, alkaloids, flavonoid and
saponins) was carried out using the
methods described by (AOAC, 2006).
All determinations were in duplicate.
All chemicals used were of analytical
grade obtained from British Drug
House (BDH, London, UK).
Amino acid analysis
Amino acid analysis was done by ion-
exchange chromatography
(FAO/WHO, 1991) using the Technicon
Sequential Multisample Amino Acid
Analyzer (TSM) (Technicon Instruments
Corporation, New York). The dried
sample was defatted, hydrolysed,
filtered to remove humins and
evaporated to dryness at 40oC under
vacuum in a rotary evaporator. The
residue was dissolved with 5 mL of
acetate buffer (pH 2.0) and stored in
a plastic specimen bottle kept inside
the deep freezer pending subsequent
analysis. The TSM is designed to
separate free acidic, neutral and
basic acids of the hydrolysate. The
amount loaded for the sample was 5-
10 µL and about 76 min elapsed for
the analysis. The column flow rate was
0.50 mL/min at 60 oC with
reproducibility consistent within ± 3 %.
The net height of each peak
produced by the chart of the TSM was
measured and calculated for the
amino acid it represented. All
chemicals were of analytical grade.
2017 May Edition |www.jbino.com | Innovative Association
J.Bio.Innov6 (3), pp: 399-430, 2017 |ISSN 2277-8330 (Electronic)
Adeyeye
Norleucine was used as internal
standard.
From the amino acid data, other
calculations were made.
The isoelectric point (pI) was
calculated (Olaofe and Akintayo,
2000); calculation of predicted protein
efficiency ratio (C-PER or P-PER)
(Alsmeyer et al., 1974);
leucine/isoleucine ratio, their
differences and their percentage
differences were calculated;
estimation of essential amino acid
index (EAAI) (Oser, 1959) using the
egg protein amino acids as the
standard; estimation of biological
value (BV) following the equation of
Oser (1959):
Biological value = 1.09 (EAAI) -
11.73
computation of Lys/Trp and Met/Trp
ratios; computation of amino acid
scores using three different
procedures: scores based on amino
acid values compared with whole
hen's egg amino acid profile (Paul
and Southgate, 1978), scores based
on essential amino acid scoring
pattern (FAO/WHO, 1973) and scores
based on essential amino acid
suggested pattern of requirements for
pre-school child (FAO/WHO/UNU,
1985); distribution of amino acids into
groups (Nieman et al., 1992).
Preparation of methyl ester and
analysis
The extracted fat (50 mg) was
saponified for 5 min at 95 oC with 3.4
ml of 0.5 M KOH in dry methanol. The
mixture was neutralised by 0.7 M HCl.
A volume of 3 mL of 14 % BF3 in
methanol (Supelco Inc., Bellefonte,
PA, USA) was added (AOAC, 2006).
The mixture was heated for 5 min at 90 oC to achieve complete methylation.
All the fatty acid methyl esters (FAME)
were extracted into redistilled n-
hexane (2x3 mL). The content was
concentrated to 1mL for analysis and
1 µL was injected into the injection pot
of the GC. The FAME was analysed
using these GC conditions: (GC; HP
5890 Series II, autosampler 7673,
powered with HP 3365
ChemStationrev. A09.01[1206]
software; Hewlett-Packard Co.,
Avondale, PA, USA) fitted with a flame
ionization detector. Split injection type
used, split ratio was 20:1 and carrier
gas was nitrogen. Inlet temperature
was 250 oC, column type was HP
INNOWAX capillary column (30 m, 0.25
mmid, 0.25 µm film thickness)
(Supelco, Inc. Bellefonte, PA, USA). The
oven programme was: initial
temperature at 60 oC, first ramping at
10 oC/min for 20 min (260 oC),
maintained for 4 min; second ramping
at 15 oC/min for 4 min (320 oC),
maintained for 10 min. Flame
ionization detector temperature was
320 oC. Hydrogen pressure was 22 psi
and compressed air was 35 psi. The
peaks were identified by comparison
2017 May Edition |www.jbino.com | Innovative Association
J.Bio.Innov6 (3), pp: 399-430, 2017 |ISSN 2277-8330 (Electronic)
Adeyeye
of their retention times with authentic
standards of FAME.
Sterol analysis
For the analysis of sterols, the gas
chromatographic conditions of
analysis were similar to the GC
conditions for the methyl esters
analysis.
Phospholipids analyses
Modified method of Raheja et al.
(1973) was employed in the analysis of
phospholipids. A weight of 0.01 g of
the extracted fat was added to the
test tube. To ensure complete dryness
of the oil for phospholipids analyses,
the solvent was completely removed
by passing a stream of nitrogen gas
on the oil. A volume of 0.40 mL of
chloroform was added to the tube
followed by the addition of 0.10 mL of
chromogenic solution. The tube was
heated at 100 oC in water bath for
about 1 min and 20 sec. The content
was allowed to cool to the laboratory
temperature and 5 mL of hexane was
added and the tube shaken gently
several times. The solvent and the
aqueous layer were allowed to
separate. The hexane layer was
recovered and concentrated to 1.0
mL for analysis. The phospholipids
were analysed using an HP 5890
powered with HP gas chromatograph
(HP 5890 powered with HP
ChemStation rev. A09.01 [1206]
software [GMI, Inc., Minnesota, USA]
fitted with a pulse flame photometric
detector (PFPD). Nitrogen was used as
the carrier gas with a flow rate of 20-
60 mL/min. The oven programme was:
initial temperature at 50 oC, first
ramping at 10 oC/min for 20 min (250 oC), maintianed for 4 min, second
ramping at 15 oC/min for 4 min (310 oC) and maintained for 5 min. The
injection temperature was 250 oC
whilst the detector temperature was
320 oC. A polar (HP5) capillary column
(30 m, 0.25 mm id, 0.25 µm film
thickness) was used to separate the
phospholipids. The split injection type
used had a split ratio of 20:1.
Hydrogen pressure was 20 psi and
compressed air was 30 psi. The peaks
were identified by comparison with
standard phospholipids.
Quality assurance
For the purpose of ensuring the
accuracy of the results obtained for
the various lipid parameters, the
followings were carried out: standard
chromotographs were prepared for
sterols, phospholipids and fatty acids
methyl esters which were then
compared with respective analytical
results; calibration curves were
prepared for all the standard mixtures
and correlation coefficient
determination for each fatty acid
parameter (32), same for sterols (7)
and phospholipids (5). Correlation
coefficient should be ≥ 0.95 for the
result to be acceptable. It is a
statistical index that shows the quality
assurance of the calibration curve
2017 May Edition |www.jbino.com | Innovative Association
J.Bio.Innov6 (3), pp: 399-430, 2017 |ISSN 2277-8330 (Electronic)
Adeyeye
performed. It was performed with the
Hewlett-Packard Chemistry (HPCHEM)
software. Fatty acids were listed with
the chain length and double bond
members.
Functional properties
Protein solubility
The solubility of the sample as a
function of pH was determined using
the method described by Sathe et al.
(1982). The pH was checked and
adjusted then centrifuged at 4000 rpm
for 20 min at room temperature and
the nitrogen in the supernatant or in
aliquot (2.0 mL) of the clear
supernatant was estimated by the
micro Kjeldahl method (AACC, 1983).
Water and oil absorption capacity
Water and oil absorption capacity of
the sample was determined
according to the method described
by Beuchat (1977).
Emulsifying capacity
Emulsifying capacity was determined
according to the procedure of
Beuchat et al. (1975). Emulsifying
capacity was calculated as follows:
Emulsifying capacity =
where weight of oil emulsified = Total
volume of oil emulsified x Specific
gravity of oil used.
Gelation capacity
Least gelation concentration was
determined using the method of
Coffmann and Garcia (1977).
RESULTS AND DISCUSSION
Proximate composition
Table 1 presents the proximate
composition of the sample. These
parameters were on the high side in
the sample: crude protein,
carbohydrate, total ash and
metabolizable energy. Not shown in
Table 1 was the organic matter which
was high at 70.8 g/100 g. The crude
protein of 19.2 g/100 g was close to
the value of 19.6 g/100 g (dry weight)
in the cotyledon of Irvingia
gabonensis(Adeyeye, 2013); same
could be said for I. gabonensis in the
moisture content since this sample
had a value of4.39 g/100 g. The value
of moisture content of 41.6 % for
sclerotium of P. tuber-regium obtained
by Agomuo (2011) might be because
his sample was not fully ripe by the
time of collection. P. tuber-regium
normally contains low level of moisture
when fully ripe. The high total ash
would ensure high mineral content in
the sample. The energy content of
1148 kJ/100 g (270 kcal/100 g) showed
the sample to be a good source of
concentrated energy due to its high
protein and carbohydrate contents.
Energy from cereals range from 1.3-1.6
MJ/100 g (Paul and Southgate, 1978).
Table 1 also shows the various energy
values as contributed by protein, fat
and carbohydrate. Whilst the fat had
2017 May Edition |www.jbino.com | Innovative Association
J.Bio.Innov6 (3), pp: 399-430, 2017 |ISSN 2277-8330 (Electronic)
Adeyeye
the least contribution (2.68 %),
carbohydrate contributed the highest
level of 68.9 %. The fat contribution of
2.68 % fell far short of the 30 %
recommended energy from fat
particularly for adults (Davies and
Dickerson, 1991); this makes the
sample good for heart problem
patients. The utilizable energy due to
protein (UEDP %) for the sample
(assuming 60 % utilization)was 17.0. This
value is higher than the
recommended safe level of 8 % for an
adult man who requires about 55 g
protein per day with 60 % utilization.
However, 19.2 g/100 g would just be
34.9 % of 55 g adult requirement per
day.
It is well known that water is
indispensable for the efficient
utilization and conservations of food
within the body (Snively and Wessner,
1954). The most important connection
of water with other food substances is
the fact that the water content of the
body changes with the type of diet
(White House Conferences, 1932). The
biochemical basis for this relationship
arises from the fact that the water
deficit created by protein metabolism
is about seven times that for
equivalent calories of carbohydrate or
fat. Hence, it is not surprising to find in
studies with experimental animals and
young children that an increase in
calories from carbohydrate causes
hydration; whereas an increase in
calories from proteins causes
dehydration (Pratt andSnyderman,
1953). Albanese (1959) had given
values of grams of water needed for
complete metabolism of 100 calories
of some food substances: food
material: protein, starch and fat
(preformed water = 0.00); gained by
oxidation: protein (10.3), starch
(13.9)and fat (11.9); lost in dissipating
heat: 60 for all (protein, fat and
starch); lost in excreting end products:
protein (300), both starch and fat
(0.00); deficit, protein (350), starch (46)
and fat (48). One calorie of protein
requires 3.0 mL of water for the
excretion of the urea and sulphate
formed from it; 1 g of ash requires 65
mL of water for its excretion(Albanese,
1959). Assuming complete metabolism
of 76.8 Calories (kcalories) of protein,
230 mLof water would be required for
the samples. This water loss can be
offset by the high carbohydrate
content of the samples or from water
intake.
Mineral composition and mineral
safety index (MSI)
The mineral levels of the sample are all
shown in Table 2. The sample
contained sufficient quantities of these
minerals to meet nutritional
requirement of man and
animals(mg/100 g): Ca (12445), Mg
(685), K (211), Na(987), P(2146). The
values of Mn, Cu, Ni and Fe were
lower than in the report of Agomuo
(2011)in sclerotium of P. tuber-regium.
The lower level of K compared to Na
was not in agreement with what is
2017 May Edition |www.jbino.com | Innovative Association
J.Bio.Innov6 (3), pp: 399-430, 2017 |ISSN 2277-8330 (Electronic)
Adeyeye
required in plants (Sutcliffe and Baker,
1974). Fe, Cu, Zn were all lower than
the RDA levels (NRC, 1989). Pb (0.002),
Cd (< 0.001) were low, this is good for
a food source and their presence
could be due to onset of pollution of
the environment. Both Na and K are
involved in many biochemical
activities in the body but the Na/K
value of 4.68 was much higher than
0.60 required to avoiding high blood
pressure (Nieman et al.,1992). The
value of Ca/P (5.80) showed that the
sample had an excellent combination
of Ca and P since the value of Ca/P
(7.79-2.42) falls within the excellent
group (Hathcock, 1985). The value of
18.2 for Ca/Mg is above the minimum
level of 1.0 (NRC, 1989). The value of
0.032 for [K/(Ca +Mg)] milliequivalent
was far less than 2.2. To prevent
hypomagnesemia, Marten and
Andersen (1975) reported that the
milliequivalent of [K/(Ca +Mg)] must
be < 2.2; this is the case in this report.
Mn was low as it obtains in some
animal sources (Adeyeye, 1996).
In Table 3, values of mineral safety
index (MSI) showed the values of Ca,
P and Na to be higher than their
corresponding standard values. Those
MSI levels less than the standards
came from Fe, Cu, Zn, Mg and Se. The
standard MSI for the elements are Na
(4.8), Mg (15), P(10), Ca (10), Fe (6.7),
Zn (33) and Se (14). The explanation of
the MSI can be understood as follows
taking Ca as example: the
recommended adult intake (RAI) of
Ca is1200 mg, its minimum toxic dose
(MTD) is 12000 mg or 10 times the
recommended daily average (RDA)
which is equivalent to MSI of Ca. This
reasoning goes for the other minerals
whose MSI was determined. Minerals
whose MSI values were higher than
the Table MSI (TV) had calculated
values (CV) of Ca (104 >10 TV), P (17.9
>10 TV) and Na (9.47 >4.80). The Ca
CV > TV by a value of 10-104 or -94
(940 % difference), etc. For Na where
CV>TV by a value of 4.80-9.47 or -4.67
(97.3 % difference), this meant that
9.47 times the RDA, hence more K
would have to be consumed to
compensate for the high Na intake
from the sample. It is interesting to
note similar values of 9.47 (CV)
obtained in this result was also noticed
in Callinectes latimanus (a
commercially important crab
occurring along the East and Gulf
coasts of the USA) (Adeyeye et
al.,2014). The following minerals have
their TV > CV: Fe, Cu, Zn, Mg, Se giving
positive differences with
corresponding lower percentage
difference having range values of
61.0-90.3. High levels of Ca and P
might not cause deleterious diseases
unlike Na. The general trends in MSI
values of P. tuber-regium followed
similar trend as seen in Callinectes
latimanus (Adeyeye et al.,2014).
Antinutrient factors
Some anti-nutrient factors are shown
in Table 4. All the anti-nutrient values
2017 May Edition |www.jbino.com | Innovative Association
J.Bio.Innov6 (3), pp: 399-430, 2017 |ISSN 2277-8330 (Electronic)
Adeyeye
were very low and ND was even
reported in saponin. In sclerotium of
P.tuber-regium, Agomuo (2011)
reported the following phytochemical
levels (mg/100 g): saponins (0.14
±0.05), tannins (1.75±0.01) and
alkaloids (1.25±0.02). Tannins may
decrease protein quality by
decreasing digestibility and
palatability (Butter, 1989). The tannin
content of the sample was 0.060
mg/100 g (dw) and lower than other
foods like lima beans (Phaseolus
lunatus), 0.59 mg/100 g (Egbe and
Akinyede, 1990); black specie of
cowpea (Vigna unguiculata), 0.78
mg/100 g (Ologbobo and Fetuga,
1983). Saponins have been shown to
possess a hemolytic effect on red
blood cells. It also has cytotoxic
effects and beneficial in its cholesterol
lowering ability (Price et al., 1987). The
alkaloids value of 0.040 mg/100 g was
also lower than those of the species of
I. tetraptera (0.70 mg/100 g), M.
myristica(0.50 mg/100 g) and Piper
guineensis (0.55 mg/100g
(dw)(Agomuo, 2008). The oxalate
result of 1.01 mg/100 g in P. tuber-
regium was lower than (mg/100 g) in
hull (1.98) and cotyledon (1.56) in I.
gabonensis(Adeyeye, 2013). The
presence of oxalate has undersirable
effect on Ca absorption and
utilization, its acid combines with Ca
to form calcium oxalate, which passes
through the intestineunabsorbed. The
amount of oxalate formed depends
on the amount of oxalic acid in the
food (Fleck, 1976); the oxalate level in
this sample was low. The flavonoid
pigments are water-soluble, they are
found dissolved in the cell-sap water.
A subgroup called anthocyanins is
responsible for reds, blues and
violetsfound in a wide variety of fruits
(Ihekoronye and Ngoddy, 1985).
Flavonoids had a low value of 0.010
g/100 g in the sample. Total phenol in
the sample was 0.030 mg/100 g; this is
a heat-stable anti-nutritional factor
which is not eliminated by simple
soaking and heating but through
germination or fermentation. The
phytic acid level was 0.295 ±0.021
mg/100 g in the sample. The
phytochemicals analysed for in P.
tuber-regium had values below the
established toxic levels(Nkafamiya et
al., 2010).
Amino acids profile
The amino acids profile of P. tuber-
regium are shown in Table 5. High
levels of amino acid (AA) are seen in
Gly, Ala, Ser, Pro, Val, Thr, Asp, Glu, Tyr
and Arg. The total AA in P. tuber-
regium was 93.6 g/100 g being greater
than in Pandalus borealis: whole
organism (92.7 g/100 g), endoskeleton
(86.6 g/100 g) and exoskeleton (93.0
g/100 g) (Adeyeye, 2015) and
Callinectes latimanus (94.5 g/100 g)
(Adeyeye et al., 2014); both P. borealis
and C. latimanus are shell fishes. The
Lys content in this sample was 3.72
g/100 g being greater than 2.55 g/100
g in C.latimanus and 2.46-3.34 g/100 g
2017 May Edition |www.jbino.com | Innovative Association
J.Bio.Innov6 (3), pp: 399-430, 2017 |ISSN 2277-8330 (Electronic)
Adeyeye
in P. borealis. Also the protein of P.
tuber-regium (19.2 g/100 g) was higher
than in C. latimanus (19.1 g/100 g)
and P. borealis (17.2-19.1 g/100 g). Lys,
Arg, Val, Met were higher in P. tuber-
regium than in C. latimanus whereas
Val, Lys, Met and Arg were more
concentrated in P. tuber-regium than
in P. borealis. In the scores determined
with comparison to the whole hen's
egg AA values, score values > 1.0
were in Gly, Ala, Pro, Val, Thr, Glu, Tyr
and His; Cys being the limiting AA
(0.25). In FAO/WHO (1973)comparison,
Val, Thr, Phe+Tyr and total essential AA
(EAA) had score values > 1.0 in each
case. In comparison with pre-school
child (2-5 years), these EAA had score
values > 1.0: Val, Thr, Met + Cys, Phe
+Tyr, His and total EAA. Whilst Ile (0.55)
was limiting in the provisional amino
acid scoring pattern, it was Trp (0.54)
in pre-school child comparison. Gly
recorded the highest score (1.93) in
the egg comparison, Phe +Tyr
recorded the highest score (1.78) in
the provisional EAA score whereas Val
recorded the highest score (2.26) in
the pre-school comparison. To make
corrections for the limiting amino acid
(LAA) in the sample if it serves as sole
source of protein food therefore, it
would be 100/25.0 (or 4.0) x protein of
sample (in hen's egg comparison),
100/55 (or 1.82) x protein of sample
(provisional essential amino acid
comparison) and 100/54 (or 1.85) x
protein of sample (pre-school essential
amino acid comparison).
Some amino acid quality parameters
are shown in Table 6. The following
values would show the position of the
quality of the fungus sample: the EAA
requirements across board are (values
with His) (g/100 g crude protein cp):
infant (46.0), pre-school (2-5 y) (33.9),
school child (10-12 y) (24.1) and adult
(12.7) and without His: infant (43.4),
pre-school (32.0), school child (22.2)
and adult (11.1) (FAO/WHO/UNU,
1985). From the present result based
on these standards, we have EAA of
41.6 g/100 g (with His) and 38.0 g/100
g cp (no His). These results are not too
far from the following literature values
of the total EAA: egg, 51.2 (with His)
and 49.0 (no His); cow's milk, 50.4 (with
His) and 47.7 (no His); beef, 47.9 (with
His) and 44.5 (no His) (FAO/WHO/UNU,
1985). The total sulphur AA (TSAA) of
the sample was 2.66 g/100 g cp which
is about one-half of the 5.8 g/100 g cp
recommended for infants
(FAO/WHO/UNU, 1985). The aromatic
AA (ArAA) range suggested for infant
protein (6.8-11.8 g/100 g cp) has the
present value of 8.57 g/100 g cp being
within the range. The percentage ratio
of EAA to the total AA (TAA) in the
sample was 44.4. This value is well
above the 39 % considered adequate
for ideal protein food for infants, 26 %
for children and 11 % for adults
(FAO/WHO/UNU, 1985). The EAA/TAA
of 44.4 % was close to the value of
42.9-44.0 reported for the whole
organism, flesh and shell of Pandalus
borealis(Adeyeye, 2015) and 45.1 % in
2017 May Edition |www.jbino.com | Innovative Association
J.Bio.Innov6 (3), pp: 399-430, 2017 |ISSN 2277-8330 (Electronic)
Adeyeye
Callinectes latimanus(Adeyeye et
al.,2014). The percentage of total
neutral AA (TNAA) result was 57.5
g/100 g indicating that it formed the
bulk of the AA.
The other calculated parameters from
the AA profile are further shown in
Table 6. The predicted protein
efficiency ratio (P-PER) were: P-PER1
(1.10) and P-PER2 (1.31). This may lead
to low level of physiological utilization
of the protein. In general, it has been
found that the better the protein, the
lower the level in the diet required to
produce the highest P-PER. This is clear
reflection of the importance of the
proper nutritive balance of all of the
amino acids to produce optimum
metabolic efficiency. The Leu/Ile ratio
was low at 2.23, hence no
concentration antagonism might be
experienced in the sample when
consumed as protein source in food
because 2.36 is the most ideal Leu/Ile
(FAO/WHO, 1991). The essential amino
acid index (EAAI) of 90.3 and its
corresponding biological value (BV) of
86.7 depicted the high quality of the
protein of P.tuber-regium. This is shown
in the literature comparison: milk, cow
(whole, non fat, evaporated, or dry),
EAAI (88) and BV (84, predicted; 90,
observed); human, EAAI (87) and BV
(83); eggs, chicken (whole, raw or
dried),EAAI (100), BV (97, predicted;
96, observed); whites (raw or dried),
EAAI (95), BV (92, predicted; 93,
observed); yolks (raw or dried), EAAI
(93), BV (89, predicted); shellfish
(shrimp, including prawns, raw or
canned), EAAI (67), BV (61, predicted)
(Oser, 1959). These literature results
show the quality position of P. tuber-
regium under discussion. The
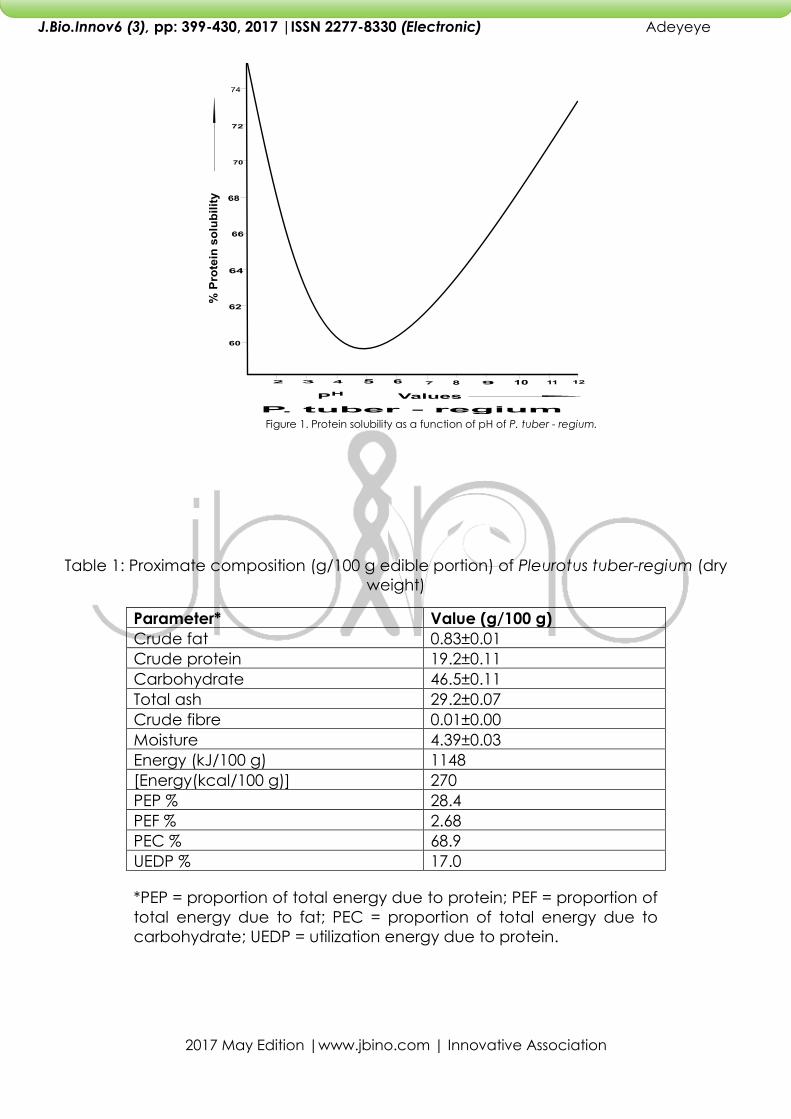
isoelectric point, pI was 5.40 showing
the sample to be in the acidic
medium of the pH range. Actually the
minimum protein solubility of the
sample was at a pH of 5.0 (Fig. I)
showing a very close relationship with
the pI of 5.40 between the observed
and the predicted.
The work of Mitchell (1959) showed
that there exists good agreements of
growth needs and tissue AA patterns.
This agreement is particularly good for
the Lys/Trp (L/T) and Met/Trp (M/T)
ratios of muscle proteins which
constitute approximately 75 % of the
infant body proteins. This present result
had L/T of 6.35 and M/T of 3.77.
Mammalian tissue patterns have the
following values: L/T, muscle (6.3),
viscera (5.3), plasma proteins (6.2);
M/T, muscle (2.5), viscera (2.0), plasma
proteins (1.1) (Mitchell, 1959). The
available evidence indicates that the
utilization of dietary proteins increases
as their Lys and Trp content
approaches that of muscle tissues. This
concept gains further validity from the
fact that the nutritional value of some
protein products with low Lys/Trp
values can be enhanced by small
additions of Lys. In the present study,
the Lys/Trp of 6.35 was about of similar
value with that of the muscle (6.3)
whereas the Met/Trp of 3.77 was far
2017 May Edition |www.jbino.com | Innovative Association
J.Bio.Innov6 (3), pp: 399-430, 2017 |ISSN 2277-8330 (Electronic)
Adeyeye
more than 2.5 in the muscle. It has also
been suggested that for optimal
protein synthesis, the optimal dietary
ratio of Phe and Tyr in mass units is
60:40 (Pencharz et al., 2007). A reverse
order was observed in this report with
Phe: Tyr ratio being 40.8: 59.2. Most
animal proteins are low in Cys, for
example, we have literature values of
Cys/TSAA % as: three different Nigeria
fishes (23.8-30.1) (Adeyeye, 2009a);
male fresh water crab body parts
(13.3-15.9) (Adeyeye and Kenni, 2008);
female fresh water crab body parts
(27.3-32.8) (Adeyeye, 2008a). The
present Cys/TSAA % was 16.9 showing
the sample behaving like an animal
protein. In contrast, many vegetable
proteins contain substantially more
Cys than Met, examples (Cys/TSAA) %:
62.9 in coconut endosperm (Adeyeye,
2004); Anacardium occidentale, 50.5
(Adeyeye et al., 2007), 58.9 -72.0 (raw,
steeped, germinated sorghum)
(Adeyeye, 2008b); 51.2-53.1 (raw,
steeped, germinated millet)
(Adeyeye, 2009b).
The various amino acid class groups
are shown in Table 7. The
concentration trend of the classes
could be seen to follow as shown in
g/100 g cp: class I (27.8) > class IV
(22.5)> class VI (14.9) > class II (11.1) >
class VII (5.28) > class III (2.66). It could
also be seen that the percentage
values were close to their individual
principal values, e.g. value
(percentage): class I, 27.8 (29.7); class
II, 11.1 (11.9); class III, 2.66 (2.84);class
IV, 22.5 (24.0); class V, 13.0 (13.9); class
VI, 14.9 (15.9) and class VII, 5.28 (5.64).
The percentage levels were close,
ranging from 2.84-29.7. Literature
values of this nature had been found
in Callinectes latimanus (a lagoon
crab) (Adeyeye et al.,2014) and
Pandalus borealis (a lagoon shrimp)
(Adeyeye, 2015).
Fatty acids profile
In Table 8 we have the fatty acids
(FAs) profile of P. tuber-regium (in % of
total fatty acids). In the saturated FAs,
only C16:0 and C18:0 were of
significant values in the sample: %
total fatty acids, C16:0 (12.6) and
C18:0 (8.17). The total saturated fatty
acid(SFA) value was 21.0 %. Both 16:0
and 18:0 belong to the long-chain
fatty acids group of 14-18 carbon
atoms per molecule. Palmitic acid is
usually considered the most abundant
SFA in nature. It varies from 10-40 % in
seed oils; however, the bull's head and
hen's head brains contain no
detectable level of 16:0 (Adeyeye,
2012). Stearic acid was also found as
the second highest SFA in the sample,
this is the usual trend in FAs.
Considering the influence of 16:0 and
18:0 on the lipoprotein profile, 18:0 is
said to be neutral in its effect on blood
cholesterol when consumed in natural
fats; 16:0 is intermediate, that is, it can
be neutral when placed on a
triglyceride molecule with
monounsaturated fatty acid (MUFA),
polyunsaturated fatty acid (PUFA) or
2017 May Edition |www.jbino.com | Innovative Association
J.Bio.Innov6 (3), pp: 399-430, 2017 |ISSN 2277-8330 (Electronic)
Adeyeye
18:0, or cholesterol-raising when
attached along with 12:0 +14:0. In
high amounts, 16:0 can even raise
total cholestrol (TC) and low density
lipoprotein (LDL) when substituted for
18:0, MUFA or PUFA in people who
already have elevated TC or who eat
large amounts of cholesterol (Hayes,
2002). The SFA in the present sample
was of low level (21.0 % total FAs). The
total monounsaturated fatty acids
(MUFAs) was 40.6 % made up mainly
by C16:1cis-9 (6.99 %), C18:1 cis-6 (4.45
%), C18:1 cis-9 (13.6) and C20:1 cis-11
(15.6). The gadoleic acid-trivial name
for cis-9-enoic acid (20:1 n-11) is
known to be present in marine oils
(from fish or sea mammals) (Beare-
Roger et al., 2001), it was the most
concentrated of the MUFAs, although
C16:1 cis-9 and C18:1 cis-9 used to be
the most common MUFAs. Minus
MUFAs being obtained from the diet,
MUFA can also be synthesized by
elongase and desaturase enzymes
from SFAs primarily derived from de
novo lipogenesis (Mashek and Wu,
2015). 18:1 cis-9 is present in olive oil
(about 78 %) and it is believed to have
especially valuable nutritional
properties as part of the
Mediterranean diet; it is the
biosynthetic precursor of a family of
FA with the (n-9) terminal structure
and with chain- lengths of 20-24 or
more. Petoselinic acid (18:1 cis-6)
occurs up to the level of 50 % or more
in the seeds of Umbelliferae family
(carrot, parsely and coriander).
Palmitoleic acid (16:1 cis-9)has strong
antimicrobial properties (Enig and
Fallon, 2000); beneficial in reducing
bad cholesterol (LDL) (Nestle et al.,
1994); reduces fat deposition in blood
vessels and reduces blood clot
formation (Grundy, 1994).
The C18 FAs may be elongated and
desaturated in adipose tissue to
produce long chain FAs (C22 and
C20), which are beneficial for human
health (Burge, 2002) using molecular
oxygen and a reduced pyridine
nucleotide (NADH or NADPH) as
cofactors.
9-18:1 → 11-20:1 → 13-22:1 →
15-24:1 → etc
18:1(n-9) 20:1(n-9) 22:1(n-9)
24:1(n-9)
9-16:1 → 11-18:1 → 13-20:1 → 15-
22:1 → etc
16:1(n-7) 18:1(n-7) 20:1(n-7)
22:1(n-7)
18:1 cis-6 can also be synthesised from
16:0 in the seeds of Umbelliferae:
16:0 desaturation 4-16:1 elongation
6-18:1(petroselinic acid)
In the n-6 PUFA FAs, linoleic acid (16.2
%), arachidonic acid (5.53 %) and
docosadienoic acid (0.344 %) were of
significant levels making the Ʃ n-6
PUFA of 22.2 %. Linoleic acid is
required for the biosynthesis of
2017 May Edition |www.jbino.com | Innovative Association
J.Bio.Innov6 (3), pp: 399-430, 2017 |ISSN 2277-8330 (Electronic)
Adeyeye
arachidonic acid, the precursor of the
eicosanoids:
Linoleic → Arachidonic
→Eicosanoids[prostaglandins,
leukotrienes,
(from diet) acid
thromboxanes]
The eicosanoids regulate blood
clotting, the inflammatory response,
the reproductive system, the
gastrointestinal tract, the kidneys and
the respiratory tract (Candela Gómez
et al., 2011).
The significant levels of n-3 PUFA were
observed in timnodonic acid, EPA
(5.31 %) and cervonic acid, DHA (10.9
%) having Ʃ n-3 PUFA of 16.2 %. These
FAs belong to the very-long-chain FAs
and both are essential. Some people
can make these FAs from EFAs
(particularly from α-LA or C18:3 n-3),
but others, particularly those whose
ancestors ate a lot of fish, lack
enzymes to produce them (Enig and
Fallon, 2000). This sample contained a
non important value of 0.000051 % for
α-linolenic acid making the formation
of EPA and DHA difficult from it. The
"obligate carnivores" must obtain EPA
and DHA from food sources and P.
tuber-regium could be part of such
food sources. The nutritional
importance of EPA and DHA had
earlier been highlighted (Laugharne,
1996).
The highlights of calculated quality
parameters of the FAs composition
can be seen in Table 9. The PUFA/SFA
(P/S) was good at 1.83. The P/S is
important in determining the
detrimental effects of dietary fats. The
higher the P/S ratio the more
nutritionally useful is the dietary oil
because the severity of atherosclerosis
is closely associated with the
proportion of the total energy supplied
by SFA and PUFA fats (Honatra, 1974).
The MUFA/SFA level was 1.93 which
was more in favour of MUFA than SFA;
it had a good comparison with P/S.
cis-Monoenoic acids have desirable
physical properties for membrane
lipids in that they are liquid at body
temperature, yet are relatively
resistant to oxidation. Metabolites of n-
6 are significantly more inflammatory
[especially arachidonic acid(AA)]
than those of n-3. This necessitates
that n-3 and n-6 are consumed in
balanced proportion, healthy ratios of
n-6:n-3 range from 1:1 to 4:1 (Tribole,
2007). The n-6/n-3 value in the sample
fell within the above range, it had a
value of 1.37. The essential PUFA status
index (EPSI) was 0.946 which was
above average; the higher the EPSI,
the better is the PUFA status (Benatti et
al.,2004).The EPA/DHA was almost at
about 50 % having a value of 0.487.
No mead acid [20:3 n-9, cis-5, 8, 11]
was detected in the sample
implicating no general shortage of
essential PUFA in the sample.
Phospholipidscomposition
2017 May Edition |www.jbino.com | Innovative Association
J.Bio.Innov6 (3), pp: 399-430, 2017 |ISSN 2277-8330 (Electronic)
Adeyeye
The various phospholipids levels of the
sample are shown in Table 10. The
various phospholipids were generally
low in value with a range of3.82 e-2 to
45.0 mg/100 g or 93.5 mg/100 g total
weight value. As a constituent of all
cells, phospholipids are also present at
different concentrations in various
foods. Phospholipids are used in the
food industry as emulsifier or emulsion
stabilizer; have positive effects on
human health. Diverse beneficial
health effects have been ascribed to
the whole phospholipid mixture as well
as to individual phospholipids. Gurr
(1999) and Schneider (2001) had
insisted that phospholipids exhibit well-
documented nutritional and/or
therapeutic benefits. Phospholipids
account for approximately 20-25 % of
the dry weight of an adult brain.
Besides forming the backbone of the
biomembrane, they also provide the
dynamic membrane with a suitable
environment, fluidity and ion
permeability that affect cognition
positively (Farooqui et al.,1988). The
low value of total phospholipids in the
sample (93.5 mg/100 g) was much
higher than in the fast-food samples
consumed in Nigeria with values of
meat pie (22.9 mg/100 g), doughnut
(27.1 mg/100 g) and cake (16.6
mg/100 g) (Adeyeye and Agesin,
2015).
The amounts of the various
phospholipids in a membrane define
the fluidity of the membrane and,
consequently, the functions of the
embedded proteins (Vance, 2008).
Phosphatidylcholine (PC) is the most
abundant phospholipid in mammalian
cell membranes, comprising 40-50 %
of total phospholipids; it was highest in
the present sample 48.1%. The second
most abundant mammalian
membranephospholipid is
phosphatidylethanolamine, which
comprises 20-50 % of total
phospholipids; this is not the same in
the present sample as PE (cephalin)
formed the third position at 20.3
mg/100 g (21.7 %) unlike in meat pie
and doughnut that had PE in the
second position in the phospholipid
(Adeyeye and Agesin, 2015). In the
brain, ~45 % of total phospholipids are
PE whereas PE is only ~20 % in the liver
(Vance, 2008). Phosphatidylserine (PS)
was second (26.7 mg/100 g, 28.8 %) in
the sample. There is a strong
metabolic inter-relationships among
PS, PE and PC (Vance, 2008). The
relatively minor mammalian
membrane phospholipids include
phosphatidylinositol (PI) and
lysophosphatidylcholine (LPC), as also
demonstrated in Pleurotus tuber-
regium with values of PI as 1.22
mg/100 g (1.31 %) and LPC as 3.82 e-2
mg/100 g (4.08e-2 %).
Sterol composition
In the sterol analysis results as shown in
Table 11, only cholesterol was
detected to a reasonable level of 44.8
mg/100 g (about 100 %). Other sterol
values ranged from 0.00-9.21 e-3
2017 May Edition |www.jbino.com | Innovative Association
J.Bio.Innov6 (3), pp: 399-430, 2017 |ISSN 2277-8330 (Electronic)
Adeyeye
mg/100 g. There are individuals who
are sensitive to dietary cholesterol
(Reiser and Shorland, 1990) and most
authorities advise a general reduction
in cholesterol intake for everyone.
Bender (1992) had reported that
dietary cholesterol should be reduced
to around 300 mg or less per day; this
is much higher than the sample
cholesterol level (44.8 mg/100 g or
14.8 % of 300 mg/100 g).
Functional properties
Table 12 contains some functional
properties of Pleurotus tuber-regium.
The water absorption capacity (WAC)
was high at 136 %. WAC is a critical
function of protein of various food
products like soups, gravies, doughs
and baked products(Sosulski et al.,
1976). P. tuber-regiumflour could be
useful in these functions. The WAC
value in the sample was highly
comparable to WAC in African yam
bean (AYB) seed flours having 119-135
% in whole seed flours and 131-179 %
in dehulled seed flours respectively
(Oshodi et al., 1997]. The present value
compared favourably with WAC
reported for some seeds by Lin et al.
(1974) and Adeyeye et al.(1994), but
lower than the values reported for
three varieties of melon (Ige et al.,
1984). The oil absorption capacity
(OAC) value was 97.8 %; this was
comparable to 101-132 % for whole
seed flours and 93.3-146 % for dehulled
seed flours of AYB. The value of 97.8 %
was higher than the values for pigeon
pea flour (89.7 %) (Oshodi and
Ekperigin, 1989), wheat flour and soy
flour (84.2 %) and 84.4 % respectively
(Lin et al., 1974), 82.3-91.5 % for three
varieties of lima bean flours (Oshodi
and Adeladun, 1993). The present
result was lower than in the values of
OAC in mucuna bean flours with value
of 2.00-2.40 g/g for full fat and 2.10-
2.60 g/g in defatted samples
(Adebowale et al., 2005). Liquid
retention is an index of the ability of
proteins to absorb and retain oil/water
which inturn influences the texture
and mouth feel characteristics of
foods and food products like
comminuted meats, extenders or
analogues and baked dough (Okezie
and Bello, 1988). Pletorus tuber-regium
would therefore be useful as a flavour
retainer in some food products. The
high values of WAC and OAC in P.
tuber-regium could be attributed to
the high value of crude protein (19.2
g/100 g). The extent of protein
hydration correlates strongly with the
content of polar residues and charge
residues. Interaction between water
molecules and hydrophilic groups
occurs via hydrogen bonding (Chou
and Morr, 1979). The high value of
protein in the sample might be
responsible for high hydrogen bonding
and high electrostatic repulsion, both
conditions facilitating binding and
entrapment of water (Altschul and
Wilcke, 1985). The high fat absorption
in the sample flour is also closely
related to protein content (Wolf and
Cowan, 1977), the binding capacity
2017 May Edition |www.jbino.com | Innovative Association
J.Bio.Innov6 (3), pp: 399-430, 2017 |ISSN 2277-8330 (Electronic)
Adeyeye
could have been enhanced by
protein denaturation.
The oil emulsion capacity (OEC) value
was 35.5 %. This is lower to the value of
40.0-90.0 % in whole seed flours of AYB
but better than 10.0-20.0 % for
dehulled seed flours of AYB (Oshodi et
al., 1997). The present OEC (35.5 %)
was also lower than 95.1 % in sunflower
flour (Lin et al., 1974), 49.4 % for pigeon
pea (Oshodi and Ekperigin, 1989) but
higher than 7.00-11.0 % for wheat flour,
18.0 % for soy flour (Lin et al., 1974) and
within 20-70 % reported by Adeyeye et
al. (1994) for three other AYB whole
seeds flours. Pleurotus tuber-regium,
would be a useful additive for the
stabilisation of fat emulsions in the
production of sausage, soup and
cake (Altschul and Wilcke, 1985). The
capacity of protein to aid the
formation and stabilisation of
emulsions is important for many
applications in cake batters, coffee
whiteners, milks, mayonnaise, salad
dressings, comminuted meats and
frozen desserts (Kinsella et al., 1985).
The flour formed a stable emulsion of
54.0 % for a reasonable period of time.
Both the foaming capacity (FC) (8.25
%) and foaming stability (FS) (1.50 %)
were low. This is close to the value of
FC in full fat Macuna veracruz white
having a value of 9.60 % (Adebowale
et al., 2005). It has been reported that
foamability is related to the rate of
decrease of the surface tension of the
air/water interface caused by
absorption of protein molecules
(Sathe et al., 1982). Graham and
Phillips (1976) linked good foamability
with flexible protein molecules, which
reduces surface tension. Low
foamability on the otherhand can be
related to highly ordered globular
proteins, which resists surface
denaturation. The basic requirements
of proteins as good foaming agents
are the ability to (i) absorb rapidly at
air-water interface during bubbling, (ii)
undergo rapid conformational
change and rearrangement at the
interface, and (iii) form a cohesive
viscoelastic film via intermolecular
interactions. The first two factors are
essential for better foamability
whereas the third is important for the
stability of the foam (Adebowale et
al., 2005). The success of whipping
agents largely depends on how long
the whip can be maintained.
Pleurotus tuber-regium would be a
poor aerating agent in whipped
toppings, frozen desserts and angel
food and sponge cakes (Adebowale
et al., 2005).
The lowest gelation concentration
(LGC) of P. tuber-regium was low at
6.00 % (w/v). This value is lower than
8.00-10.00 % (w/v) reported in AYB by
Oshodi et al. (1997) and Adeyeye et
al. (1994). This value of 6.00 % (w/v) is
lower than the value obtained for
other seeds reported earlier by Sathe
and Salunkhe (1981), Sathe et al.
(1982), Oshodi and Ekperigin (1989)
and Oshodi and Adeladun (1993),
2017 May Edition |www.jbino.com | Innovative Association
J.Bio.Innov6 (3), pp: 399-430, 2017 |ISSN 2277-8330 (Electronic)
Adeyeye
Adebowale et al. (2005). The ability of
protein to form gels and provide a
structural matrix for holding water,
flavours, sugars and food ingredients is
useful in food applications, and in new
product developments, thereby
providing an added dimension to
protein functionality. The observed
low-value of LGC of P. tuber-regium
flour would lead to good setting of
stews prepared from the sample. This
property may also be useful in the
production of curd or as an additive
to other materials for gel forming in
food products. Sathe et al. (1982)
have associated the variation in
gelling properties to the ratio of
different constituents such as protein,
lipids and carbohydrates present in a
sample. Flemming et al.(1975)
suggested a direct correlation
between LGC and the level of
globulin in legume seeds. Gelation
properties are said to be related to
WAC hence the high WAC recorded
by the flour could explain the efficient
gel formation capacity. Gelation
takes place more readily at higher
protein concentration because of
greater intermolecular contact during
heating (Adebowale et al., 2005). High
protein solubility is always necessary
for gelation as observed by Wilton et
al. (1997). Low LGC in P. tuber-regium
might be an advantage for its use in
the production of curd and cheese
(Altschul and Wilcke, 1985).
The pH dependent protein
solubility profile of P.tuber-regium flour
is presented in Figure 1. The flour
showed high solubility in both the acid
and alkali media. Minimum solubility
was at pH 5.00. This result
corroborated those of Ige et al. (1984).
The high solubility of the sample in the
acid medium of pH indicates that the
flour may be useful in the formulation
of acid food, for example, protein-rich
carbonated beverages (Kinsella,
1979). The protein had a U-shaped pH-
solubility curve. The protein solubility
profile of dehulled defatted cowpea
flour (DDCF) and cowpea protein
isolate (CPIA) and micellization
precipitation (CPIB) at pH value
ranging from 2-9 were least soluble at
pH 4-5 (their isoelectric point) (Khalid
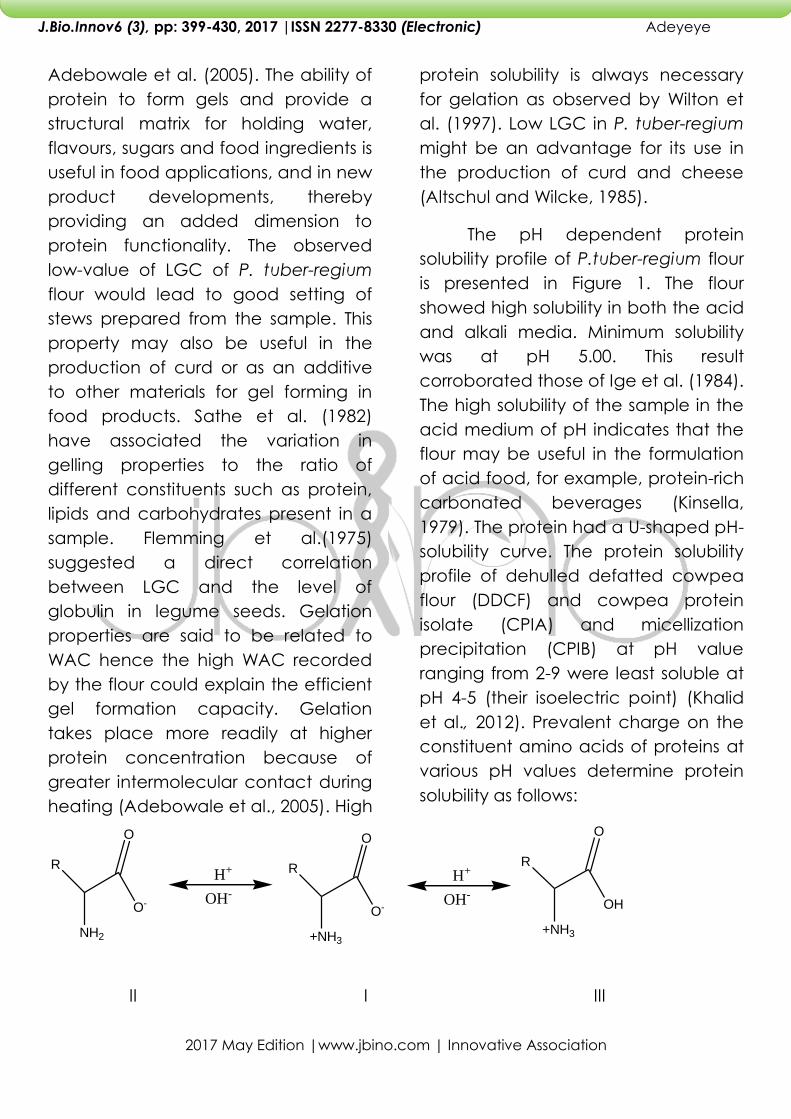
et al., 2012). Prevalent charge on the
constituent amino acids of proteins at
various pH values determine protein
solubility as follows:
R
O-
NH2
O
H+
OH-
R
O-
O
+NH3
H+
OH-
R
OH
O
+NH3
II I III
2017 May Edition |www.jbino.com | Innovative Association
J.Bio.Innov6 (3), pp: 399-430, 2017 |ISSN 2277-8330 (Electronic)
Adeyeye
It is a zwitterion or dipolar ion which
predominates at the region of isoelectric
point in protein. At this pH, minimum
solubility takes place because of
minimum repulsion among the
constituent amino acids. The balance in
positive and negative charges minimised
the electrostatic repulsion, and this
reduced solubility of proteins at isoelectric
pH. When pH of the solution is reduced
further, cation III predominates while in
alkaline medium, anion II takes
preponderance. In both cases,
electrostatic repulsion improved and this
enhanced solubility as it is observed in pH
1 (75.4 %) and pH 12 (73.3 %). P.tuber-
regium showed good solubility in both
acid and alkaline pH regions which is
most important characteristic for food
formlation (Idouraine et al., 1991) since
protein solubility largely affects other
functionalities like emulsification, foaming
and gellation (Kinsella, 1976).
Plate 1: Scloretium of P.tuber-regium.
2017 May Edition |www.jbino.com | Innovative Association
J.Bio.Innov6 (3), pp: 399-430, 2017 |ISSN 2277-8330 (Electronic)
Adeyeye
Figure 1. Protein solubility as a function of pH of P. tuber - regium.
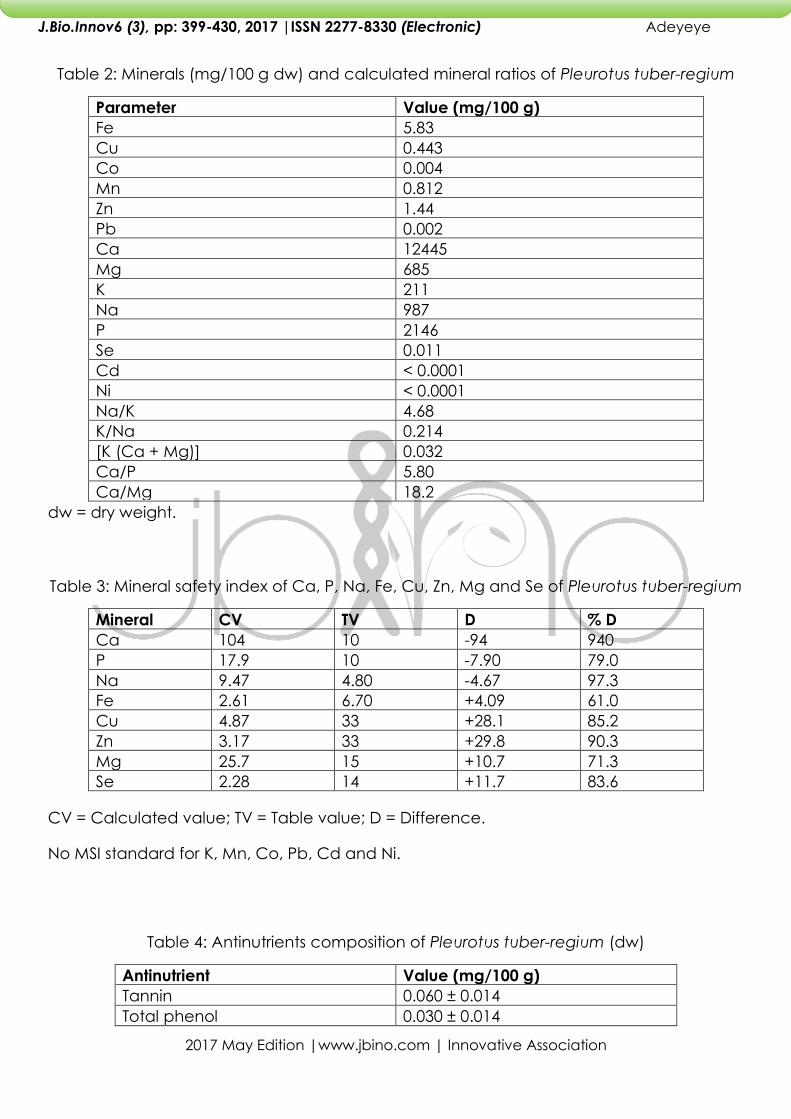
Table 1: Proximate composition (g/100 g edible portion) of Pleurotus tuber-regium (dry
weight)
Parameter* Value (g/100 g)
Crude fat 0.83±0.01
Crude protein 19.2±0.11
Carbohydrate 46.5±0.11
Total ash 29.2±0.07
Crude fibre 0.01±0.00
Moisture 4.39±0.03
Energy (kJ/100 g) 1148
[Energy(kcal/100 g)] 270
PEP % 28.4
PEF % 2.68
PEC % 68.9
UEDP % 17.0
*PEP = proportion of total energy due to protein; PEF = proportion of
total energy due to fat; PEC = proportion of total energy due to
carbohydrate; UEDP = utilization energy due to protein.
2017 May Edition |www.jbino.com | Innovative Association
J.Bio.Innov6 (3), pp: 399-430, 2017 |ISSN 2277-8330 (Electronic)
Adeyeye
Table 2: Minerals (mg/100 g dw) and calculated mineral ratios of Pleurotus tuber-regium
Parameter Value (mg/100 g)
Fe 5.83
Cu 0.443
Co 0.004
Mn 0.812
Zn 1.44
Pb 0.002
Ca 12445
Mg 685
K 211
Na 987
P 2146
Se 0.011
Cd < 0.0001
Ni < 0.0001
Na/K 4.68
K/Na 0.214
[K (Ca + Mg)] 0.032
Ca/P 5.80
Ca/Mg 18.2
dw = dry weight.
Table 3: Mineral safety index of Ca, P, Na, Fe, Cu, Zn, Mg and Se of Pleurotus tuber-regium
Mineral CV TV D % D
Ca 104 10 -94 940
P 17.9 10 -7.90 79.0
Na 9.47 4.80 -4.67 97.3
Fe 2.61 6.70 +4.09 61.0
Cu 4.87 33 +28.1 85.2
Zn 3.17 33 +29.8 90.3
Mg 25.7 15 +10.7 71.3
Se 2.28 14 +11.7 83.6
CV = Calculated value; TV = Table value; D = Difference.
No MSI standard for K, Mn, Co, Pb, Cd and Ni.
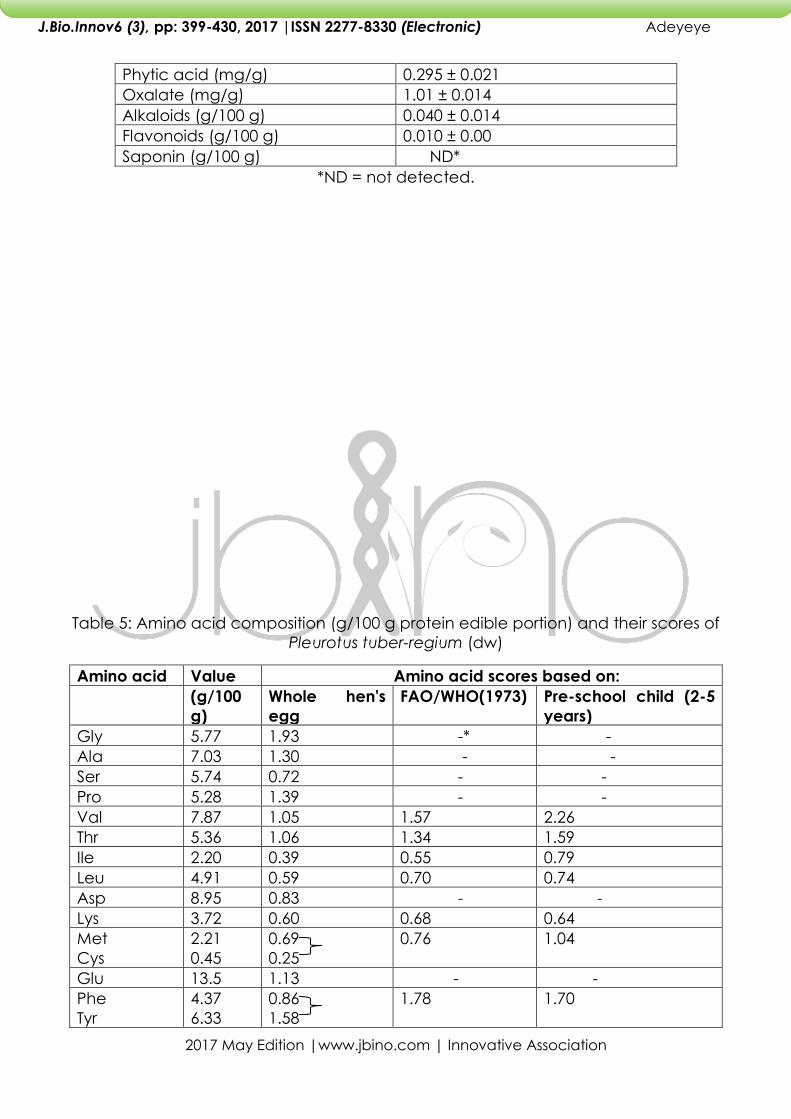
Table 4: Antinutrients composition of Pleurotus tuber-regium (dw)
Antinutrient Value (mg/100 g)
Tannin 0.060 ± 0.014
Total phenol 0.030 ± 0.014
2017 May Edition |www.jbino.com | Innovative Association
J.Bio.Innov6 (3), pp: 399-430, 2017 |ISSN 2277-8330 (Electronic)
Adeyeye
Phytic acid (mg/g) 0.295 ± 0.021
Oxalate (mg/g) 1.01 ± 0.014
Alkaloids (g/100 g) 0.040 ± 0.014
Flavonoids (g/100 g) 0.010 ± 0.00
Saponin (g/100 g) ND*
*ND = not detected.
Table 5: Amino acid composition (g/100 g protein edible portion) and their scores of
Pleurotus tuber-regium (dw)
Amino acid Value Amino acid scores based on:
(g/100
g)
Whole hen's
egg
FAO/WHO(1973) Pre-school child (2-5
years)
Gly 5.77 1.93 -* -
Ala 7.03 1.30 - -
Ser 5.74 0.72 - -
Pro 5.28 1.39 - -
Val 7.87 1.05 1.57 2.26
Thr 5.36 1.06 1.34 1.59
Ile 2.20 0.39 0.55 0.79
Leu 4.91 0.59 0.70 0.74
Asp 8.95 0.83 - -
Lys 3.72 0.60 0.68 0.64
Met
Cys
2.21
0.45
0.69
0.25
0.76
1.04
Glu 13.5 1.13 - -
Phe
Tyr
4.37
6.33
0.86
1.58
1.78 1.70
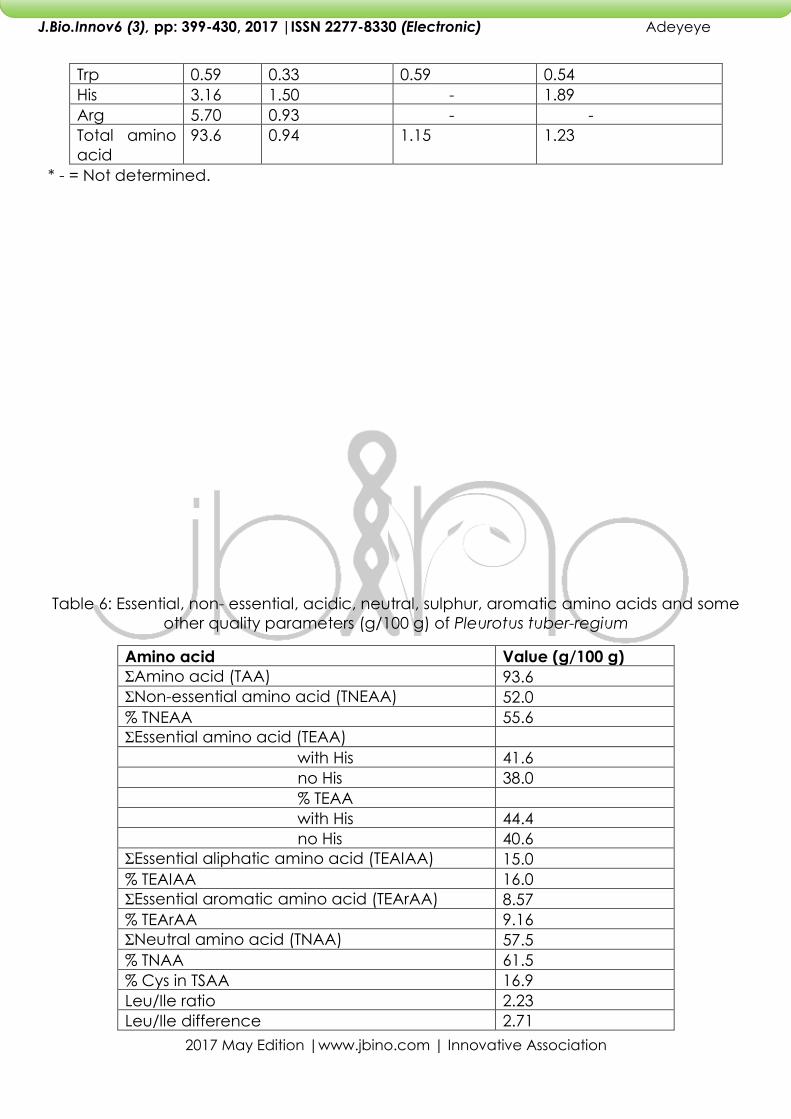
2017 May Edition |www.jbino.com | Innovative Association
J.Bio.Innov6 (3), pp: 399-430, 2017 |ISSN 2277-8330 (Electronic)
Adeyeye
Trp 0.59 0.33 0.59 0.54
His 3.16 1.50 - 1.89
Arg 5.70 0.93 - -
Total amino
acid
93.6 0.94 1.15 1.23
* - = Not determined.
Table 6: Essential, non- essential, acidic, neutral, sulphur, aromatic amino acids and some
other quality parameters (g/100 g) of Pleurotus tuber-regium
Amino acid Value (g/100 g)
ƩAmino acid (TAA) 93.6
ƩNon-essential amino acid (TNEAA) 52.0
% TNEAA 55.6
ƩEssential amino acid (TEAA)
with His 41.6
no His 38.0
% TEAA
with His 44.4
no His 40.6
ƩEssential aliphatic amino acid (TEAIAA) 15.0
% TEAIAA 16.0
ƩEssential aromatic amino acid (TEArAA) 8.57
% TEArAA 9.16
ƩNeutral amino acid (TNAA) 57.5
% TNAA 61.5
% Cys in TSAA 16.9
Leu/Ile ratio 2.23
Leu/Ile difference 2.71
2017 May Edition |www.jbino.com | Innovative Association
J.Bio.Innov6 (3), pp: 399-430, 2017 |ISSN 2277-8330 (Electronic)
Adeyeye
% (Leu-Ile)/TAA 2.90
% (Leu/Ile)/Leu 55.2
pI# 5.40
P-PER1* 1.10
P-PER2* 1.31
EAAI† 90.3
Biological value (BV) 86.7
Lys/Trp or L/T 6.35
Met/Trp or M/T 3.77
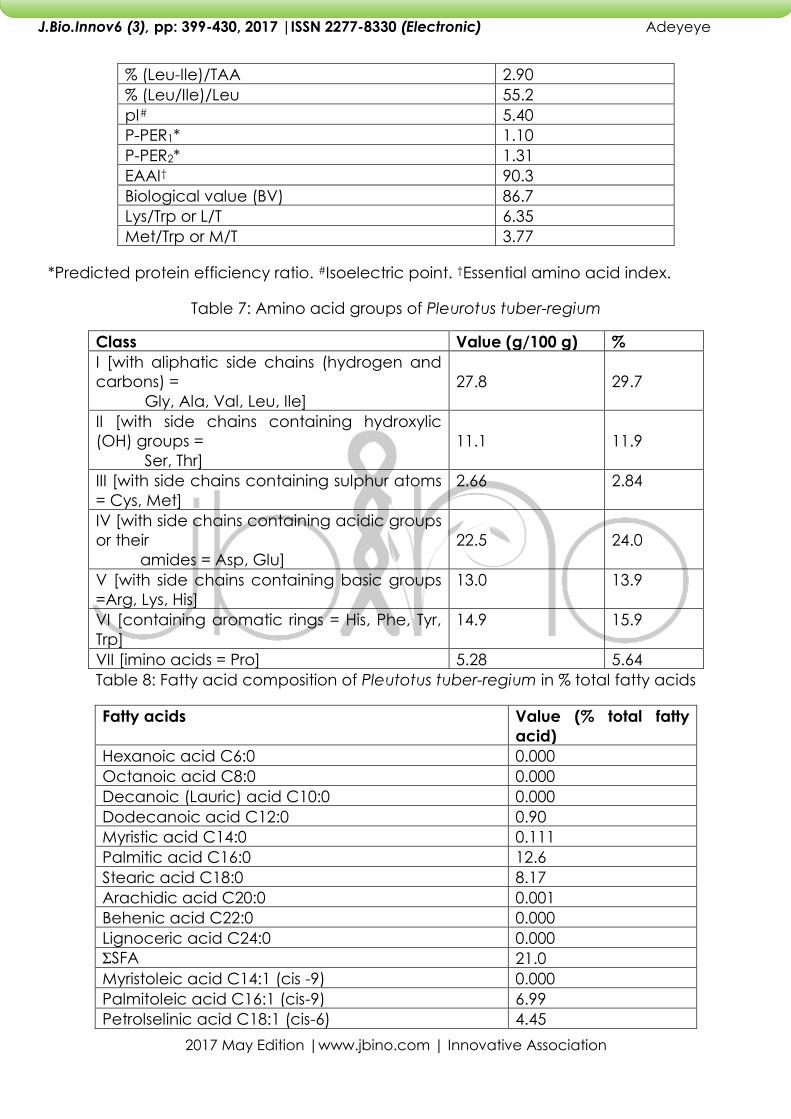
*Predicted protein efficiency ratio. #Isoelectric point. †Essential amino acid index.
Table 7: Amino acid groups of Pleurotus tuber-regium
Class Value (g/100 g) %
I [with aliphatic side chains (hydrogen and
carbons) =
Gly, Ala, Val, Leu, Ile]
27.8
29.7
II [with side chains containing hydroxylic
(OH) groups =
Ser, Thr]
11.1
11.9
III [with side chains containing sulphur atoms
= Cys, Met]
2.66 2.84
IV [with side chains containing acidic groups
or their
amides = Asp, Glu]
22.5
24.0
V [with side chains containing basic groups
=Arg, Lys, His]
13.0 13.9
VI [containing aromatic rings = His, Phe, Tyr,
Trp]
14.9 15.9
VII [imino acids = Pro] 5.28 5.64
Table 8: Fatty acid composition of Pleutotus tuber-regium in % total fatty acids
Fatty acids Value (% total fatty
acid)
Hexanoic acid C6:0 0.000
Octanoic acid C8:0 0.000
Decanoic (Lauric) acid C10:0 0.000
Dodecanoic acid C12:0 0.90
Myristic acid C14:0 0.111
Palmitic acid C16:0 12.6
Stearic acid C18:0 8.17
Arachidic acid C20:0 0.001
Behenic acid C22:0 0.000
Lignoceric acid C24:0 0.000
ƩSFA 21.0
Myristoleic acid C14:1 (cis -9) 0.000
Palmitoleic acid C16:1 (cis-9) 6.99
Petrolselinic acid C18:1 (cis-6) 4.45
2017 May Edition |www.jbino.com | Innovative Association
J.Bio.Innov6 (3), pp: 399-430, 2017 |ISSN 2277-8330 (Electronic)
Adeyeye
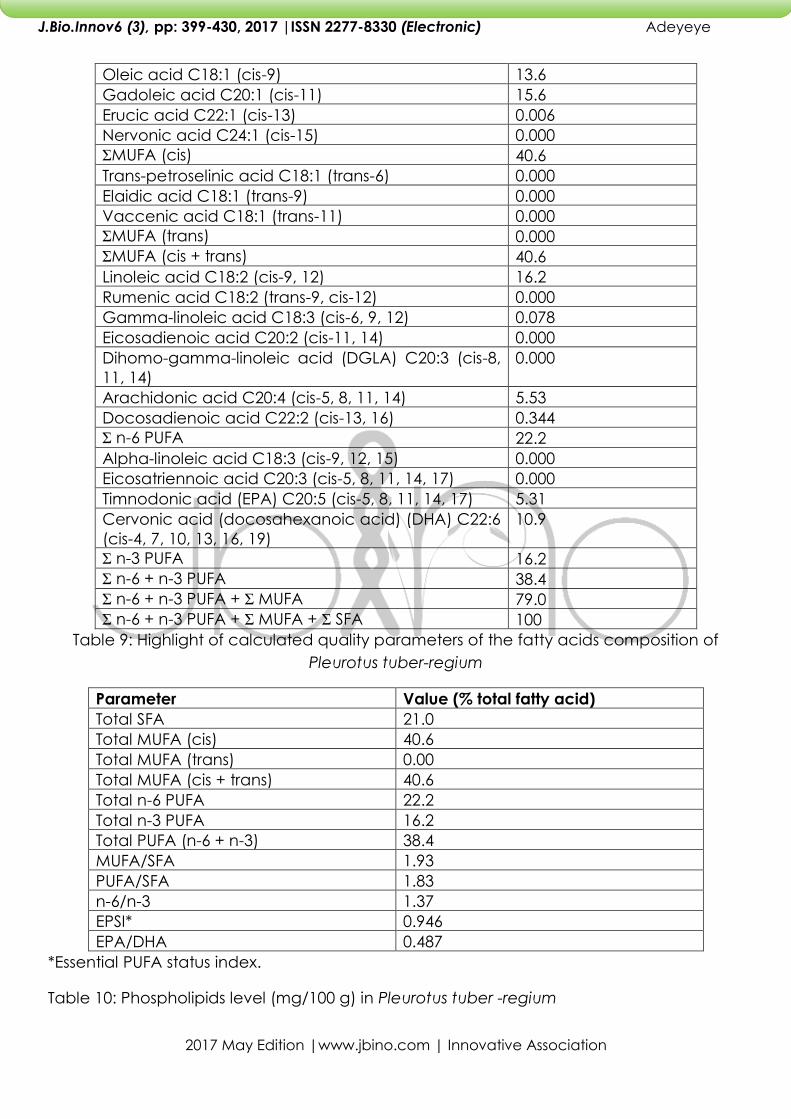
Oleic acid C18:1 (cis-9) 13.6
Gadoleic acid C20:1 (cis-11) 15.6
Erucic acid C22:1 (cis-13) 0.006
Nervonic acid C24:1 (cis-15) 0.000
ƩMUFA (cis) 40.6
Trans-petroselinic acid C18:1 (trans-6) 0.000
Elaidic acid C18:1 (trans-9) 0.000
Vaccenic acid C18:1 (trans-11) 0.000
ƩMUFA (trans) 0.000
ƩMUFA (cis + trans) 40.6
Linoleic acid C18:2 (cis-9, 12) 16.2
Rumenic acid C18:2 (trans-9, cis-12) 0.000
Gamma-linoleic acid C18:3 (cis-6, 9, 12) 0.078
Eicosadienoic acid C20:2 (cis-11, 14) 0.000
Dihomo-gamma-linoleic acid (DGLA) C20:3 (cis-8,
11, 14)
0.000
Arachidonic acid C20:4 (cis-5, 8, 11, 14) 5.53
Docosadienoic acid C22:2 (cis-13, 16) 0.344
Ʃ n-6 PUFA 22.2
Alpha-linoleic acid C18:3 (cis-9, 12, 15) 0.000
Eicosatriennoic acid C20:3 (cis-5, 8, 11, 14, 17) 0.000
Timnodonic acid (EPA) C20:5 (cis-5, 8, 11, 14, 17) 5.31
Cervonic acid (docosahexanoic acid) (DHA) C22:6
(cis-4, 7, 10, 13, 16, 19)
10.9
Ʃ n-3 PUFA 16.2
Ʃ n-6 + n-3 PUFA 38.4
Ʃ n-6 + n-3 PUFA + Ʃ MUFA 79.0
Ʃ n-6 + n-3 PUFA + Ʃ MUFA + Ʃ SFA 100
Table 9: Highlight of calculated quality parameters of the fatty acids composition of
Pleurotus tuber-regium
Parameter Value (% total fatty acid)
Total SFA 21.0
Total MUFA (cis) 40.6
Total MUFA (trans) 0.00
Total MUFA (cis + trans) 40.6
Total n-6 PUFA 22.2
Total n-3 PUFA 16.2
Total PUFA (n-6 + n-3) 38.4
MUFA/SFA 1.93
PUFA/SFA 1.83
n-6/n-3 1.37
EPSI* 0.946
EPA/DHA 0.487
*Essential PUFA status index.
Table 10: Phospholipids level (mg/100 g) in Pleurotus tuber -regium
2017 May Edition |www.jbino.com | Innovative Association
J.Bio.Innov6 (3), pp: 399-430, 2017 |ISSN 2277-8330 (Electronic)
Adeyeye
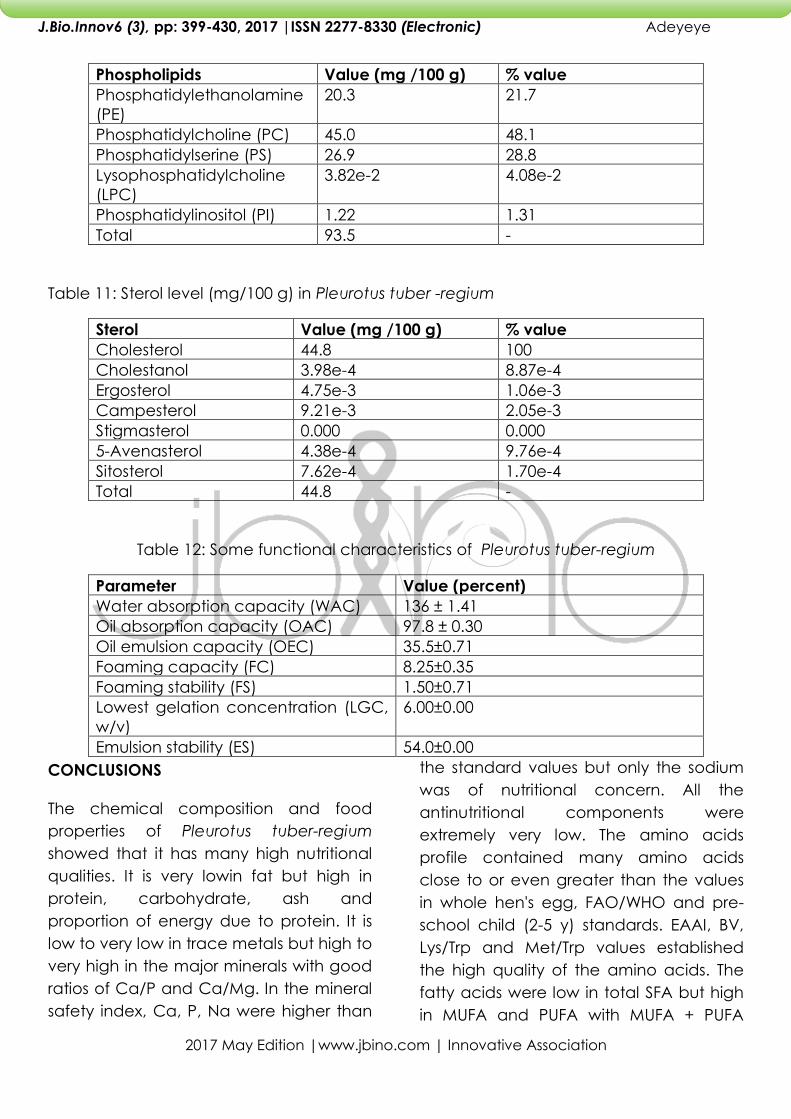
Phospholipids Value (mg /100 g) % value
Phosphatidylethanolamine
(PE)
20.3 21.7
Phosphatidylcholine (PC) 45.0 48.1
Phosphatidylserine (PS) 26.9 28.8
Lysophosphatidylcholine
(LPC)
3.82e-2 4.08e-2
Phosphatidylinositol (PI) 1.22 1.31
Total 93.5 -
Table 11: Sterol level (mg/100 g) in Pleurotus tuber -regium
Sterol Value (mg /100 g) % value
Cholesterol 44.8 100
Cholestanol 3.98e-4 8.87e-4
Ergosterol 4.75e-3 1.06e-3
Campesterol 9.21e-3 2.05e-3
Stigmasterol 0.000 0.000
5-Avenasterol 4.38e-4 9.76e-4
Sitosterol 7.62e-4 1.70e-4
Total 44.8 -
Table 12: Some functional characteristics of Pleurotus tuber-regium
Parameter Value (percent)
Water absorption capacity (WAC) 136 ± 1.41
Oil absorption capacity (OAC) 97.8 ± 0.30
Oil emulsion capacity (OEC) 35.5±0.71
Foaming capacity (FC) 8.25±0.35
Foaming stability (FS) 1.50±0.71
Lowest gelation concentration (LGC,
w/v)
6.00±0.00
Emulsion stability (ES) 54.0±0.00
CONCLUSIONS
The chemical composition and food
properties of Pleurotus tuber-regium
showed that it has many high nutritional
qualities. It is very lowin fat but high in
protein, carbohydrate, ash and
proportion of energy due to protein. It is
low to very low in trace metals but high to
very high in the major minerals with good
ratios of Ca/P and Ca/Mg. In the mineral
safety index, Ca, P, Na were higher than
the standard values but only the sodium
was of nutritional concern. All the
antinutritional components were
extremely very low. The amino acids
profile contained many amino acids
close to or even greater than the values
in whole hen's egg, FAO/WHO and pre-
school child (2-5 y) standards. EAAI, BV,
Lys/Trp and Met/Trp values established
the high quality of the amino acids. The
fatty acids were low in total SFA but high
in MUFA and PUFA with MUFA + PUFA
2017 May Edition |www.jbino.com | Innovative Association
J.Bio.Innov6 (3), pp: 399-430, 2017 |ISSN 2277-8330 (Electronic)
Adeyeye
being 79.0 % of total fatty acids; with
good values for MUFA/SFA, PUFA/SFA, n-
6/n-3, EPSI and EPA/DHA. The sample is
low in cholesterol and total phospholipids.
The functional properties showed the
sample to be good in WAC, OAC, EC, ES
and LGC with high protein solubility at
both sides of pH regions which is most
important characteristic for food product
formulation. Pleurotus tuber-regium would
be a friend of the heart with its low fat
which is highly unsaturated.
REFERENCES
AACC;Approved Methods of the
American Association of Cereal Chemists.
8th edn. American Association of Cereal
Chemists Inc., USA, 1983
Adebowale, Y. A., Adeyemi, I. A. and
Oshodi A. A.; Functional and
physicochemical properties of flours of six
Mucuna species. Afr. J. Biotechnol., 4
(12): 1461-1468, December 2005
Adeyeye, E. I.; Waste yield, proximate
and mineral composition of three
different types of land snails found in
Nigeria. Int. J. Food Sci. Nutr., 47: 111-116,
1996
Adeyeye, E. I.; The chemical composition
of liquid and solid endosperm of ripe
coconut. Orient. J. Chem., 20: 471 – 476,
2004
Adeyeye, E. I.; Amino acid composition
of whole body, flesh and exoskeleton of
female common West African fresh water
crab Sudanautes africanus africanus.
Inter. J. Food Sci. Nutr. 59(7-8): 699-705,
2008 (a)
Adeyeye, E. I.; The intercorrelation of the
amino acid quality between raw,
steeped and germinated guinea corn
(Sorghum bicolor) grains. Bull. Chem.
Soc. Ethiop., 22: 1-7, 2008 (b)
Adeyeye, E. I.;Amino acid composition of
three species of Nigerian fish: Clarias
anguillaris, Oreochromis niloticus and
Cynoglossus senegalensis. Food Chem.,
113: 43-46, 2009 (a)
Adeyeye, E. I.; The intercorrelation of the
amino acid quality between raw,
steeped and germinated pearl millet
(Pennisetum typhoides) grains. Pak. J. Sci.
Ind. Res., 52(3): 122-129, 2009 (b)
Adeyeye, E. I.; Study of long-chain n-6
and n-3 polyunsaturated fatty acids and
other lipids in brains of bull and hen. Elixir
Food Science, 47: 8599-8606, 2012
Adeyeye, E. I.; Proximate, mineral and
antinutrient composition of dika nut
(Irvingia gabonensis) kernel. Elixir Food
Science, 58: 14902-14906, 2013
Adeyeye, E. I.; Amino acid profiles of
whole organism, flesh and shell of
Pandalusborealis (Krøyer 1838). Am. J.
Food Sci. Nutr., 2(3): 31-41, 2015
Adeyeye, E. I. and Agesin M. O.; Lipid
composition of three-foods (meat pie,
doughnut, cake) consumed in Nigeria.
Open J. Analytical Res., 3(1): 6-19, 2015
Adeyeye, E. I. and Kenni, A. M.; The
relationship in the amino acid of the
whole body, flesh and exoskeleton of
common West African fresh water male
2017 May Edition |www.jbino.com | Innovative Association
J.Bio.Innov6 (3), pp: 399-430, 2017 |ISSN 2277-8330 (Electronic)
Adeyeye
crab Sudananautes africanus africanus.
Pak. J. Nutr., 7(6), 748-752, 2008
Adeyeye, E. I., Asaolu, S. S. and Aluko, A.
O.; Amino acid composition of two
masticatory nuts (Cola acuminata and
Garcinia kola) and snack nut
(Anacardium occidentale). Int. J. Food.
Sci. Nutr., 58 (4), 241 – 249, 2007
Adeyeye, E. I., Oshodi, A. A. and
Ipinmoroti, K. O.; Functional properties of
some varieties of African yam bean. Int. J.
Food Sci. Nutr., 45: 115 – 126, 1994
Adeyeye, E. I., Oyarekua, M. A. and
Adesina, A. J.; Proximate, mineral, amino
acid composition and mineral safety
index of Callinectes latmanus. Int. J. Dev.
Res., 4(12): 2641-2649, 2014
Agomuo, E. N.; Effects of some Nigerian
spices on some biochemical and
hematological parameters of wista albino
rats. Ph. D dissertation, University of Port
Harcourt, Nigeria, 2008
Agomuo, E. N.; Proximate, phytochemical
and mineral element analysis of the
sclerotium of Pleurotus tuber-regium. Int.
Sci. Res. J., 3: 104 – 107, 2011
Albanese, A. A.; Protein and amino acid
nutrition. New York and London,
Academic Press, p. 301, 1959
Alsmeyer, R. H. and Cunningham, A. E.
and Happich, M. L.; Equations to predict
PER from amino acid analysis. Food
Technol., 28: 24 – 38, 1974
Altschul, H. M, and Wilcke, H. L.; New
protein Foods. Vol 5. Seed storage
proteins. London, Academic Press, p. 107,
1985
AOAC; Official methods of analysis, 18th
edn. Washington DC, USA, Association of
Official Analytical Chemists, 2006
Beare-Rogers, J., Dieffenbacher, A. and
Holm, J. V.; Joint committee of
International Union of Nutritional Sciences
and IUPAC commission. Lexicon of Lipid
Nutrition (IUPAC Technical Report), Pure
Appl. Chem., 73(4): 685 – 744, 2001
Benatti, P., Peluso, G., Nicolai, R. and
Calvani, M.; Polyunsaturated fatty acids:
biochemical, nutritional and epigenetic
properties, J. Am. Coll. Nutr., 33(4): 281 –
302, 2004
Bender, A.; Meat and meat products in
human nutrition in developing countries.
FAO Food and Nutrition Paper 53. Rome,
FAO, p. 3 1992
Beuchat, L. R., Cherry, J. B. and Quinn, M.
R.;Physicochemical properties of peanut
flour as affected by proteolysis. J. Agric.
Food Chem., 23: 616 – 620, 1975
Beuchat, L. R.;Functional and
electrophoretic characteristics of
succinylated peanut flour proteins. J.
Agric. Food Chem., 25: 258 – 261, 1977
Burdge, G. C. and Wootton, S. A.;
Conversion of alpha-linolenic and
eicosapentaenoic, docosapentaenoic
and docosahexanoic acids in young
women. Br. J. Nutr., 88: 411 – 420, 2002
Butter, N. L.; Effects of condensed tannins
on animal nutrition. In: Hemingway, R.W.,
Karchesy, J. J., eds., Chemistry and
significance of condensed tannins. New
York, Plenum Press, p. 391, 1989
Candella, Gómez C., López Bermejo, L.
M. and Kohen Loria, V.;Importance of a
balanced omega 6 / omega 3 ratio for
the maintenance of health: nutritional
recommendations, Nutr. Hosp., 26 (2): 323
– 339, 2011.
2017 May Edition |www.jbino.com | Innovative Association
J.Bio.Innov6 (3), pp: 399-430, 2017 |ISSN 2277-8330 (Electronic)
Adeyeye
Chou, D. and Morr, C. V.;Protein-water
interactions and functional properties. J.
Am. Oil Chem. Soc., 56: 53A, 1979
Coffmann, C. W. and Garcia, V.
V.;Functional properties and amino acid
content of a protein isolate from mug
bean flour. Int. J. Food Sci. Technol., 12:
473 - 484
Davies, J. and Dickerson, J.; Nutrient
content of food portions. Cambridge, UK,
The Royal Society of Chemistry, p. 11,
1991
Egbe, A. A. and Akinyede, I. O.;Effect of
cooking on the anti nutritional factors of
lima beans (Phaseolus lunatus). Food
Chem., 35: 81 – 87, 1990
Enig, M. G. and Fallon, S.;The truth about
saturated fats. (Proven health benefits of
saturated fats.)In: Enig, M. G. and Fallon,
S. eds. Nourishing traditions: The
cookbook that challenges politically
correct nutrition and the diet dictocrats.
(New Trends Publishing 2000,
www.newtrendspublishing.com877-707-
1776 ), 1- 39, 2000
FAO/WHO/UNU; Energy and protein
requirements, WHO Technical Report
Series No. 724, Geneva, WHO, p 121, 1985
FAO/WHO; Energy and protein
requirements, Technical Report Series No.
522, Geneva, FAO/WHO, p. 1, 1973
FAO/WHO; Protein quality evaluation,
Report of Joint FAO/WHO Expert
Consultation, FAO Food and Nutrition
Paper 51. Rome, FAO/WHO, p. 4, 1991
Farooqui, A. A.; Liss, L. and Horrocks, L. A.;
Neorochemical aspects of Alzeheimers-
Disease: Involvement of Membrane
Phospholipids. Metab. Brain Dis., 3: 19 –
35, 1988
Fleck, H.; Introduction to nutrition, 3rd
edn. New York, Macmillan, p. 209, 1976
Flemming, S. E., Sosulski, F. W, and
Hamon, N. W.; Gelation and thickening
phenomenon of vegetable protein
products. J. Food Sci., 40: 805 – 807, 1975
Graham, D. E. and Phillips, M. C.; Foams.
London, Academic Press, p. 237, 1976
Grundy, S. M.; Influence of stearic acid on
cholesterol metabolism relative to other
long-chain fatty acids. Am. J. Clin. Nutr.
60(Suppl.): 986S – 990S, 1994
Gurr, M.I.; The role of fats in food and
nutrition. London, New York, Elsevier
Applied Science, 1999. In: Karin
Wehrmüller; Impact of dietary
phospholipids on human health, ALP
Science, p. 3, 2008
Hathcock, J. N.; (1985). Quantitative
evaluation of vitamin safety. Pharmacy
Times: 104-113, 1985
Hayes, K. C.; Dietary fat and heart health:
in search of the ideal fat. Asia Pacific J.
Clin. Nutr., 11 (Suppl.): S394– S400, 2002
Honatra J. E.; Dietary fats and arterial
thrombosis, Haemostasis. 2: 21–52, 1974
Idouraine, A.; Yensen, S. B. and Weber, C.
W.; Tepary bean flour, albumin and
globulin fractions functional properties
compared with soy protein isolate. J.
Food Sci., 56: 1316 – 1318, 1991
Ige, M. M., Ogunsua, A. O. and Oke, O. L.;
Functional properties of proteins of some
Nigeria oil seeds, conophor seed and
three varieties of melon seeds. J. Agric.
Food Chem., 32: 822-825, 1984
Ihekoronye, A. I. and Ngoddy, P. O.;
Integrated food science and technology
2017 May Edition |www.jbino.com | Innovative Association
J.Bio.Innov6 (3), pp: 399-430, 2017 |ISSN 2277-8330 (Electronic)
Adeyeye
for the tropics. London and Basingstoke,
Macmillan Publishers, p. 360, 1985
Khalid, H., Elhardallou, S. B. and Elkhalifa,
E. A.; Composition and functional
properties of cowpea (Vigna unguiculata
L. Walp) flour and protein isolates. Am. J.
Food Technol. 7(3): 113 – 122, 2012
Kinsella, J. E., Damodaran, S. and
German, B.; Physicochemical and
functional properties of oil seed proteins
with emphasis on soy proteins. In: Altschul,
A.M., Wilcke, H. L. eds.; New protein
foods, vol. 5. New York, Academic Press,
p. 107, 1985
Kinsella, J. E.; Functional properties of
proteins in foods: a survey. Critical Rev.
Food Sci. Nutr., 7: 219 – 280, 1976
Kinsella, J. E.; Functional properties of soy
protein. J. Am. Oil Chemists’ Soc., 56: 242
– 257,1979
Laugharne, J. D. E.; Fatty acids and
schizophrenia. Lipids, 31 (Suppl.): S163-
S165, 1996
Lin, M. J. Y., Humbert, E. S. and Sosulski, F.
W.; Certain functional properties of
sunflower meat products. J. Food Sci.
39(2): 368 -370, 1974
Marten, G. C. and Andersen, R. N.;
Forage, nutritive value and palatability of
12 common annual weeds. CropSci.,
111:829–837, 1975
Mashek, D.G. and Wu, C.; MUFAs. Adv.
Nutr.- Am. Soc. Nutr., 6: 276 – 277,
2015
Mitchell, H. H.; Some species and age
differences in amino acid requirements.
In: Albanese, A. A. ed., Protein and amino
acid requirements of mammals. New
York, Academic Press, p. 11, 1959
Nestel, P., Clifton, P. and Noakes, M.;
Effects of increasing dietary palmitoleic
acid compared with palmitic and oleic
acids on plasma lipids of
hypercholesterolemic men.J. Lipid Res.,
35: 656 – 626, 1994
Nieman, D. C., Butterwworth, D. E. and
Nieman, C N.; Nutrition. Dubuque, USA,
Wm C.; Brown Publishers, p. 510, 1992
Nkafamiya, I. I., Osemeahon, S. A.,
Modibbo, U.U. and Aminu, A.; Nutritional
status of non-conventional leafy
vegetables, Ficus asperifolia and Ficus
sycomorus. Afr. J. Food Sci., 4(3): 104 –
108, 2010
NRC (National Research
Council);Recommended dietary
allowances, 10th edn., Washington DC,
USA, National Academics Press, 302 pp.,
1989
Okezie, B. O. and Bello, A. B.;
Physicochemical and functional
properties of winged bean flour and
isolate compared with soy Isolate. J. Food
Sci. 53: 450-454, 1988
Olaofe, O. and Akintayo, E.T.; Prediction
of isoelectric point of legume and oil
seed proteins from their amino acid
compositions. The J. Technosci, 4: 49-53,
2000
Ologbobo, A. D. and Fetuga, B. L.;
Investigation on the trypsin inhibitor,
hemagglutinin, phytic and tannic acid
contents of cowpea (Vigna unguiculata).
Food Chem., 12: 249 – 254, 1983
Olukoya, J. A.; Okogbo, F. O.;Introduction
of edible sclerotia of Pleurotus tuber-
2017 May Edition |www.jbino.com | Innovative Association
J.Bio.Innov6 (3), pp: 399-430, 2017 |ISSN 2277-8330 (Electronic)
Adeyeye
reguim. Annals Appl. Bio., 117: 295 – 298,
1990
Oser, B.L.; An integrated essential amino
acid index for predicting the biological
value of proteins. In: Albanese, A. A. ed.
Protein and amino acid nutrition, New
York, Academic Press, p. 281, 1959
Oshodi, A. A. and Adeladun, M.O.A.;
Proximate composition, some valuable
minerals and functional properties of
three varieties of lima bean (Phaseolus
lunatus Linn.) flour. Int. J. Food Sci. Nutr.,
43: 181-185, 1993
Oshodi, A. A. and Ekperigin, M. M.;
Functional properties of pigeon pea
(Cajanus cajan) flour. Food Chem., 34:
187 –191, 1989
Oshodi, A. A., Ipinmoroti, K. O. and
Adeyeye, E. I.; Functional properties of
some varieties of African yam bean
(Sphenostylis sternocarpa) Int. J. Food Sci.
Nutr. 48: 243-250, 1997
Oso, B. A.; Pleurotus tuber-regium from
Nigeria. Mycology, 69: 271 – 279, 1977
Paul, A. A. and Southgate, D. A. T.;
McCance and Widdowson’s The
Composition of Foods, 4th revised edn.
London, HMSO, p. 38, 1978
Pearson, D.; Chemical analysis of foods,
7th edn. London, Churchill Livingstone, p.
7, 1976
Pencharz, P. B.; Hsu, J. W-C. and Ball,
R.O.;Aromatic amino acid requirements in
healthy human subjects. J. Nutr. - Am.
Soc. Nutr., 1576S – 1578S, 2007
Pleurotus – regium - Wikipedia, the free
encyclopedia
http://en.wikipedia.org/wiki/Pleurotus_tub
erregium
Pratt, E.L. and Snyderman, S. E.;
Recommended dietary allowances
publication 302. Pediatrics,12, 65, 1953
Price, K. R., Johnson, I. T. and Fenwick, G.
R.; The chemical and biological
significance of saponins in foods and
feeding stuffs. CRC Critical Reviews in
Food Science and Nutrition, 26: 130 – 135,
1987
Raheja, R. K., Kaur, C., Singh, A. and
Bhatia, I. S.; New colorimetric method for
the quantitative estimation of
phospholipids without acid digestion. J.
Lipid Res., 14:695 – 697, 1973
Reiser, R. and Shorland, F. B.; Meat fats
and fatty acids. In: Pearson, L. J. and
Dutson, T. R. eds., Meat and health.
Advances in Meat Research, Vol. 6,
London, New York, Elsevier Applied
Science, p 21, 1990
Sathe, S. K. and Salunkhe, D. K.;
Functional properties of great northern
bean (Phaseolus vulgaris) proteins:
Emulsion, foaming, viscosity and gelation
properties. J. Food Sci. 46: 71-75, 1981
Sathe, S. K., Deshpande, S. S. and
Salunkhe, D. K.; Functional properties of
winged bean (Psophocarpus
tetragonolobus, L) proteins. J. Food Sci.,
47: 503-506, 1982
Schneider, M.;Phospholipids for functional
food. Eur. J. Lipid Sci. Technol. 103 (2): 98 –
101, 2001
Snively, W. D. Jr. and Wessner, M.; The
ABC’s of fluid balance. J. Indiana State
Med. Assoc., 47 (9): 957 – 972, 1954
Sosulski, F. W., Humbert, E. S., Bui, E. S. and
Jones, J. I.; Functional properties of
2017 May Edition |www.jbino.com | Innovative Association
J.Bio.Innov6 (3), pp: 399-430, 2017 |ISSN 2277-8330 (Electronic)
Adeyeye
rapeseed flours, concentrates and
isolates. J. Food Sci., 41: 1349 – 1351, 1976
Sutcliffe, J. F. and Baker, D. A.; Studies in
Biology, number 48 - Plants and mineral
salts. London, Edward Arnold Publishers
Ltd. p. 1, 1974
Tribole, E.; The ultimate omega -3 diet:
Maximise the power of omega - 3s to
supercharge your health, battle
inflammation and keep your mind sharp.
New York, The McGraw-Hill, p. 3, 2007
Vance, J. E.; Phosphatidylserine and
phosphatidylethanolamine in
mammalian cells: two metabolically
related amino phospholipids. J. Lipid Res.,
49(7): 1377 – 1387,2008
White House Conferences; Growth and
development of the child, III. Nutrition.
New York, Appleton-Century-Crofts. In:
Albanese, A. A. ed., Protein and amino
acid nutrition. New York, Academic Press,
p. 297, 1959
Wiltoon, P., Larry, R., Beuchat, K. and
Dixon, P.; (1997). Functional properties of
cowpea (Vigna unguiculata) flour as
affected by soaking, boiling and fungal
fermentation. J. Food Sci., 45: 480-486,
1997
Wolf, J. W. and Cowan, J. C.; Soybeans as
a food source, 2nd edn. Cleveland, OH,
CRC Press, p. 25, 1977
Zoberi, M. H.; Some edible mushrooms
from Nigeria. Nigerian Field, 38: 81 – 90,
1973