Proximate Composition Of Seed And Biomass From Soybean Plants
32
NASA Technical Memorandum 103496 Proximate Composition Of Seed And Biomass From Soybean Plants Grown At Different Carbon Dioxide (CO2) Concentrations R. M. Wheeler, C. L. Mackowiak, and J. C. Sager The Bionetics Corp. Kennedy Space Center, Florida May 1990 National Aeronautics and Space Administration John F. Kennedy Space Center https://ntrs.nasa.gov/search.jsp?R=19900017164 2018-12-24T14:45:39+00:00Z
Transcript of Proximate Composition Of Seed And Biomass From Soybean Plants

NASA Technical Memorandum 103496
Proximate Composition Of Seed AndBiomass From Soybean Plants Grown AtDifferent Carbon Dioxide (CO2)Concentrations
R. M. Wheeler, C. L. Mackowiak, and J. C. SagerThe Bionetics Corp.Kennedy Space Center, Florida
May 1990
National Aeronautics and
Space Administration
John F. Kennedy Space Center
https://ntrs.nasa.gov/search.jsp?R=19900017164 2018-12-24T14:45:39+00:00Z


TABLE OF CONTENTS
SECTION PAGE
TABLE OF CONTENTS ...................................... i
LIST OF TABLES AND FIGURES ............................. ii
ABSTRACT ............................................... iii
INTRODUCTION ........................................... 1
MATERIALS AND METHODS .................................. 2
RESULTS AND DISCUSSION ................................. 5
Proximate Analyses ................................ 6
Protein ...................................... 6
Fat .......................................... 7
Carbohydrate ................................. 8
Crude Fiber .................................. 9
Ash .......................................... i0
Calories ..................................... 10
Applications for Human Life Support ............... 11
LITERATURE CITED ....................................... 13
i

LIST OF TABLES AND FIGURES
TABLE PAGE
1
2
3
4
5
6
7
Dry weight yields ...............................
Proximate analysis of seed ......................
Proximate analysis of seed pods .................
Proximate analysis
Proximate analysis
Proximate analysis
Protein,
of leaves ....................
of stems .....................
of roots .....................
fat, and carbohydrate yield ............
15
16
17
18
19
20
21
FIGURE PAGE
1
2
3
Protein content of soybean plants ...............
Fat content of soybean plants ...................
Carbohydrate content of soybean plants ..........
22
23
24
i±

ABSTRACT
Soybean plants [Glvcine max (L.) Merr. cvs. McCall (MC) and
Pixie (PX)] were grown for 90 days in controlled environment
chambers at 500, i000, 2000, and 5000 ubar (ppm) atmospheric car-
bon dioxide (C02) and compared for proximate nutritional value.
The highest seed and total plant biomass yields were obtained
from cv. McCall plants grown at i000 ubar. For both cultivars,
seed protein levels were highest at i000 ubar (39.3% and 41.9%
for MC and PX) and lowest at 2000 ubar (34.7% and 38.9 % for MC
and PX). Seed fat (oil) levels were highest at 2000 ubar (21.2%
and 20.9% for MC and PX) and lowest at 5000 ubar (13.6% and 16.6%
for MC and PX). Seed carbohydrate levels were highest at 500
ubar (31.5% and 28.4% for MC and PX) and lowest at 2000 ubar
(20.9% and 20.8% for MC and PX). When adjusted for total seed
yield per unit growing area, the highest production of protein
and carbohydrate occurred with cv. McCall at i000 ubar CO2, while
equally high amounts of fat were produced with cv. McCall at i000
and 2000 ubar. Aside from the proportionately higher fat levels
from seed produced at 2000 ubar, no major effects of CO 2 on
proximate composition of soybean seed were observed. This sug-
gests that atmospheric CO 2 concentration can be used in space
life support systems to maximize soybean seed yield with minimal
effect of seed composition.
ii±


INTRODUCTION
In preparation for long-term space habitation by humans,
NASA has begun studies of plant (crop) production in controlled
environments. The plants would provide on-site production of
food, oxygen, and pure water for human life support, thereby
reducing resupply costs. These studies have been conducted under
NASA's Controlled Ecological Life Support Systems, or CELSS
program (MacElroy and Bredt, 1985).
Soybeans are one of several candidate crops recommended for
study for CELSS because of the high protein and oil content of
their seed (Tibbitts and Afford, 1982; Hoff et al., 1982). To
date, CELSS studies with soybeans have focused on the nitrogen
nutrition in hydroponic systems and controlled environments (see
Tolley-Henry and Raper, 1986a, 1986b). In addition to the
mineral nutrition, however, many other factors in the environment
will affect soybean growth, including irradiance, temperature,
humidity, and carbon dioxide (C02) concentration (Thomas and
Raper, 1976; Raper and Thomas, 1978). Because the atmospheric
systems within a CELSS will be tightly closed, knowing the ef-
fects of CO 2 will be particularly important. Numerous CO 2
studies with soybean have been reported, but most of these
studies have focused on whole plant development and yield, with
little emphasis being placed on the nutritional qualilty of the
crop (see Rogers et al., 1984; Jones et al., 1985; Allen et al.,
1988; Baker et al., 1989). In addition, many of these CO 2
studies have been conducted under field settings and only com-
pared the effect of a doubling of the normal ambient concentra-
tion in the atmosphere (350 ubar versus 700 ubar). In sealed
1

human life support systems, however, CO 2 could reach levels much
higher than either one or two times Earth-ambient, e.g. up to
6000 ubar in Skylab (Ross, 1973). Preliminary tests conducted
under tight atmospheric closure in NASA's Biomass Production
Chamber (see Prince et al., 1987) have shown that CO 2 levels may
change as much as 1500 ubar each day from the accumulation of
respired CO 2 during a daily dark period (Wheeler et al., 1990).
In this report we present proximate and caloric analysis
data from soybean seed, pod, leaf, stem and root tissue taken
from plants grown at four different CO 2 concentrations. Such in-
formation may prove useful to the overall management of crop
production systems used for human life support in space.
MATERIALS AND METHODS
A series of four 90-day studies was carried out in walk-in
plant growth chambers at the NASA Life Sciences Support Facility
(Hangar L) at Kennedy Space Center. Carbon dioxide (C02) levels
for the four studies were controlled to near 500, I000, 2000 and
5000 ubar (ppm) (assuming 1.013 bar total atmospheric pressure),
with final averages equally 506, 979, 1984, and 4986 ubar ± ap-
proximately 8% (CV) of the set point. A "low" treatment of 500
was selected instead of the normal ambient (340-350) to avoid
periodic increases resulting from human activity around the cham-
bers during the workday. For all treatments, CO 2 enrichment was
provided by continuously adding a small amount of pure CO 2 to the
chamber to maintain a set point. Chamber CO 2 levels were
monitored with an infrared gas analyzer (ANARAD Inc., Santa Bar-
bara, CA) and controlled with a dedicated computer system.
2

Calibrations and updates of the computer conversions of analyzer
signals were performed automatically each day using a zero-gas
(nitrogen) and span-gas near the working range for the particular
CO 2 treatment.
Irradiance within the chambers was provided with 30 96-inch
VHO Vita-Lite fluorescent lamps (Duro-Test Inc, North Bergen, NJ)
separated from the growing area by a clear acrylic barrier.
Photosynthetic photon flux (PPF) levels for all the tests
averaged 294 umol m -2 s-I ± 38 umol m -2 s-I (s.d. between in-
dividual tests) using a 12-h light/12-h dark photoperiod. Tem-
peratures for all the tests averaged 25.7°C ± 0.3°C in the light
and 20.0°C + 0.2°C in the dark. Relative humidities were held
constant during the light and dark and averaged 63% _ 3%.
Soybean [Glvcine max (L.) Merr. cvs McCall and Pixie] seeds
were soaked in deionized water for 24 h prior to planting to
hydronponic growing trays as described by Mackowiak et al.
(1989). Eight trays, four of each cultivar, were placed in the
chamber for each 90-day study. At about 12 days after planting
(DAP), plants were thinned to either three or six plants per
tray. At about 30 DAP, each tray was enclosed with a 60-cm high
white, vinyl-coated fencing (5 cm x 6.2 cm holes) to confine
shoot growth to the 0.25 m 2 area.
A complete nutrient solution using only nitrate-nitrogen was
recirculated continuously from a common reservoir to each of the
trays (Mackowiak et al., 1989). Solution pH was controlled
automatically to 5.8 using dilute (0.39 M) nitric acid. Water
was manually added to the reservoir each day to maintain a con-
stant volume, and solution nutrients were replenished twice each

week to maintain solution electrical conductivity. Solution
nutrient levels were monitored weekly using an atomic absorption
or ICP spectroscopic techniques.
At 90 DAP all plants were harvested, seeds were removed from
the pods, and all materials were oven-dried for a least 48 h at
70°C to determine dry weights. Following weighing, plant
materials were separated by cultivar and plant part, i.e., seeds,
pods, leaves, stems, and roots and ground through a 2-mm mesh
(Thomas-Wiley mill #4). The ground tissue samples (approximately
i00 g each) were sealed in plastic bags and shipped for total
proximate nutritional analysis (Nutrition International Inc.,
East Brunswick, NJ). Proximate analyses followed standard AOAC
procedures (1984). Analyses included the following: moisture by
vacuum oven (AOAC paragraph 7.003); ash by muffle furnace (AOAC
paragraph 7.009), protein by Kjeldahl nitrogen (AOAC paragraphs
2.056-2.058); fiber by digestion and gravimetric technique (AOAC
paragraphs 7.061-7.065); fat by ether extraction or acid
hydrolysis (AOAC paragraphs 7.055-7.060); and carbohydrate by
difference. Dietary energy equivalents were calculated by as-
signing 4 kcal per g carbohydrate, 4 kcal per g protein, and 9
kcal per g fat. Total energy values were determined by bomb
calorimetry. All data presented have been normalized for zero
moisture content.
Because most of the available tissue was required for the
complete set of analyses, no replicate samples could be taken and
no statistic comparisons between treatments were made. Although
apparent differences are discussed below, the reader is cautioned
that these differences are not necessarily statistically signifi-

cant. On one occasion, sufficient seed tissue was available from
a previous treatment and was analyzed along with another
treatment's samples. Results showed that protein levels were
within 1% of the previous sample, carbohydrate within 7%, and fat
levels within about 15%. The discrepancies could have been
caused by several factors, including analysis repeatability, dif-
ferences in sample homogeneity, or changes in composition of the
samples over time.
RESULTS AND DISCUSSION
Yield data (expressed as grams dry weight per unit area)
for the four trays of each cultivar at the different CO 2 levels
are shown in Table I. The highest yield of seeds for cv. McCall
plants occurred at I000 ubar, while the highest yield for cv.
Pixie occurred at 500 ubar. The lowest seed yield for both cul-
tivars occurred at 2000 ubar. Regardless of CO 2 level, McCall
plants always produced more seed than Pixie. With the exception
of cv. Pixie at 5000 ubar, harvest index (ratio of seed to total
biomass) decreased with increasing CO 2 (Table I).
The increase in seed yield and total growth by increasing
the CO 2 from 500 to i000 ubar is not surprising for a C 3 species
as soybean, where CO 2 enrichment typically results in increased
photosynthetic rates and increased total plant growth (Acock and
Allen, 1985). The slight decrease in yield as CO 2 was increased
above I000 ubar suggests that the higher levels (i.e., 2000 and
5000 ubar) were supraoptimal, but not particularly toxic or in-
jurious to the plants (Kramer, 1981).
PEQximate Analyses
Proximate analysis data are presented according to the dif-
ferent parts of the plant in Tables 2 - 6. The same data are
shown again in Figs. 1 - 3, but broken out by protein, fat, and
carbohydrate for ease of comparison. It is important to note
that the most of the leaves, stems, and pods were senescent by 90
days and thus will likely differ significantly from healthy, ac-
tively growing tissue. However, for the purpose of CELSS, these
analyses should provide an indication of what constituents can be
recovered from inedible plant structures when soybeans are grown
to a mature stage for seed production.
Protein. Because protein levels were determined from
elemental nitrogen concentration (N x 6.25), any residual nitrate
in tissues (e.g. leaves) or clinging to the surface (e.g. roots)
would subsequently be interpreted as protein and could have in-
troduced some error (Krober and Gibbons, 1962; Pace et al.,
1982). This may be particularly important with plants grown in
hydroponic culture with high nutrient availability. However,
with the exception of some leafy vegetables, e.g. lettuce and
spinach, leaf nitrate levels of most plants are commonly assumed
to be low (C.A. Mitchell, personal communication). In addition,
Krober and Gibbons (1962) have shown that protein accounts for
95% to 96% of the total protein in mature soybean seed.
Seeds from the various treatments ranged from about 35 to
42% protein, with the highest levels occurring at 1000 ubar CO 2
and the lowest at 2000 ubar for both cultivars (Table 2 and Fig.
1). Seed from cv. Pixie plants consistently had higher protein
levels (39% to 42%) than seed from cv. McCall (35% to 39%).
6

Regardless of the CO 2 concentration, seed protein levels from
these studies conducted in controlled environments were higher
than typical values reported for field-grown seed (33% to 34%;
Duke and Atchley, 1986).
Protein levels of pods from both cultivars were low (3% to
5%) and tended to increase as CO 2 was increased (Table 3 and Fig.
i). Leaf protein levels ranged from 11% to 21% and were dis-
tinctly highest at the 5000 ubar concentration (Table 4 and Fig.
i). Stem protein levels ranged from 7% to 23% and in contrast to
leaves were highest at I000 ubar and lowest at 5000 ubar (Table 5
and Fig. i). Other than seed, roots showed the highest protein
levels, ranging from 20% to 25% for both cultivars (Table 6 and
Fig. I), but no consistent trends were apparent regarding root
protein and CO 2 concentration.
Fat. Seed fat levels ranged from about 14% to 21%, with the
highest levels clearly occurring at 2000 ubar CO 2 (Table 2 and
Fig. 2). With exception of the I000 ubar treatment, Pixie seeds
tended to have slightly higher fat levels than cv. McCall. The
fat levels of the seed from these tests ranged from 16% to 21%
and were slightly greater than fat levels reported for field-
grown seed (15% to 18%; Duke and Atchley, 1986).
The high fat content of the 2000 ubar seed seems anomalous
in comparison to the other treatments. For the sake of ex-
perimental uniformity, all plants in these studies were harvested
at 90 days after planting, but plants grown at 2000 ubar CO 2 had
a greater proportion of green and immature pods at this stage
than the other treatments. Although fat (oil) and protein can
accumulate at similar rates during seed development (Yazdi-Samadi
7

et al., 1977), generally fat accumulation is relatively early in
soybean seed development, while protein accumulation is rela-
tively late (Wilson, 1987). Thus the proportionately high fat
and low protein of the 2000 ubar seed may be a result of a
greater quantity of immature pods and seeds at harvest, rather
than a true CO 2 concentration effect.
Fat levels in other plant parts were very low (typically
below 4%), and tended to decrease with increased CO 2 concentra-
tion (Tables 3-6 and Fig. 2).
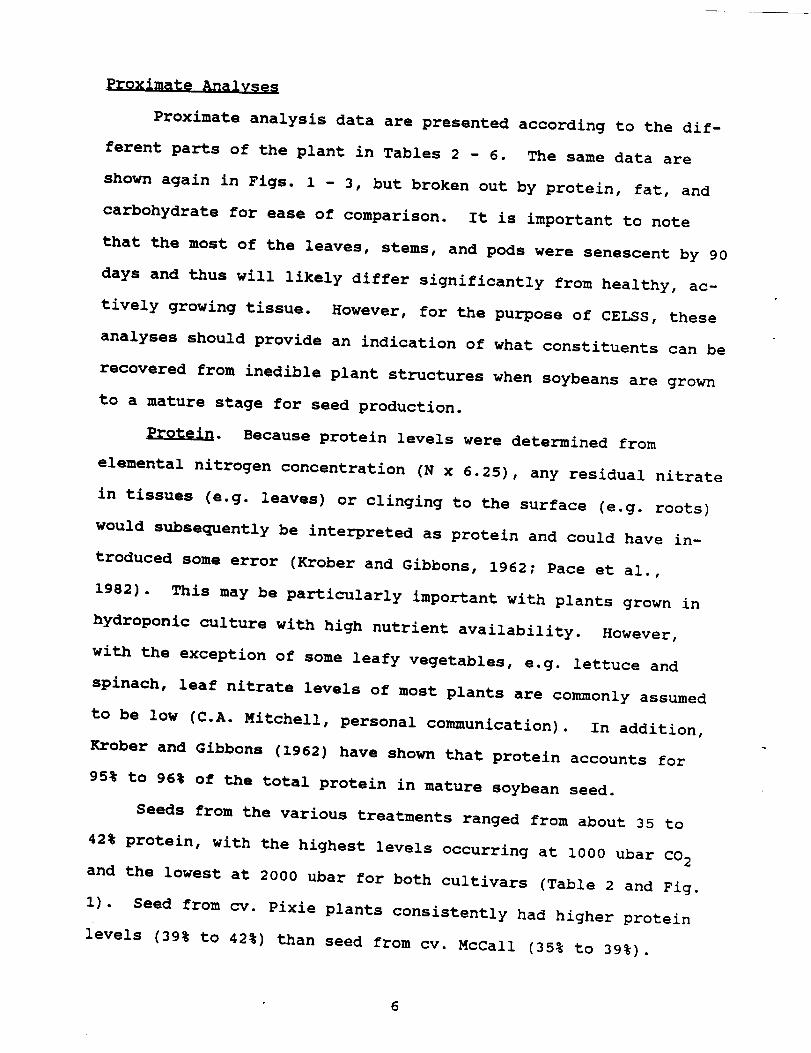
Carbohydrate. Seed carbohydrate levels ranged from 21% to
31% and tended to decrease as CO 2 was increased (Table 2). The
highest seed carbohydrate levels occurred at 500 ubar CO 2 and
lowest at 2000 ubar (Table 2 and Fig. 3). McCall seeds consis-
tently showed higher carbohydrate level than Pixie seeds (27% to
31% vs 21% to 28%). Carbohydrate levels for both cultivars were
lower than levels for typical field-grown seed (34% to 35%; Duke
and Atchley, 1986).
Carbohydrate levels in seed pods ranged from 42% to 60% with
the highest concentration occurring at 2000 ubar and the lowest
at 5000 ubar (Table 3 and Fig. 3). The high carbohydrate levels
at 2000 also may be related to the delay in seed and pod maturity
of the plants in this treatment. Leaf carbohydrate levels ranged
from approximately 39% to 59%, with the highest level for both
cultivars occurring at i000 ubar and the lowest at 5000 ubar
(Table 4 and Fig. 3). Carbohydrate in stems ranged from ap-
proximately 29% to 46% and tended to decrease in response to in-
8

creased CO 2 (Table 5 and Fig. 3). Root carbohydrate levels
ranged from approximatley 26% to 38% and showed no clear trends
in response to CO 2 concentration (Table 6 and Fig. 3).
In all the assays, it is important to note that carbohydrate
levels were determined by a difference method; hence it is pos-
sible that levels may be slightly overestimated if some cellulose
or other insoluble, structural compounds were partially broken
down and not reported as a portion of crude fiber. This is sup-
ported by evidence from other studies which have shown that
specific carbohydrates in soybean seed (i.e., starch, raffinose,
stachyose, and sucrose) have totaled only 10-15% of the seed dry
weight (Yazdi-Samadi et al., 1977; Brown and Huber, 1987) com-
pared to 30-35% reported from analyses using standard proximate
procedures (Duke and Atchley, 1986).
_rude fiber. Seed crude fiber levels were lowest for both
cultivars at i000 ubar CO 2 (approximately 6%) and increased to
approximately 13% for cv. Pixie at 2000 ubar and 12% for cv.
McCall at 5000 ubar (Table 2). Except for seed from 1000 ubar
CO2, crude fiber levels were higher than levels reported for
field-grown seed (4% to 6%; Duke and Atchley, 1986).
Pod crude fiber levels were typically near 30% with the ex-
ception of cv. Pixie at 2000 ubar, which dropped to 19.5% (Table
3). This low crude fiber level for 2000-Pixie occurred in con-
junction with high a carbohydrate level, which again may be re-
lated to the immature stage of pods at harvest. With the excep-
tion of cv. Pixie at I000 ubar, leaf crude fiber levels increased
with increased C02, with both cultivars ranging from ap-
proximately 10% to 15% (Table 4). Stem crude fiber levels also
9

showed a distinctive increase in response to increased CO2, with
cv. McCall increasing from approximately 44% to 56% and cv. Pixie
from 26% to 47% (Table 5). Crude fiber levels of cv. McCall
roots tended to increase with increased CO 2 (31% to 41%) but cv.
Pixie roots showed no clear trend in response to CO 2 and ranged
from approximately 27% to 35% (Table 6).
Ash. Ash levels from seed were highest at 1000 ubar and
lowest at 2000 ubar and ranged from approximately 6% to 8% for
both cultivars over all CO 2 treatments. This is higher than the
4% to 6% levels of ash reported for field-grown seed (Duke and
Atchley, 1986). Pod ash levels also were lowest at 2000 ubar but
highest at 5000 ubar and ranged from approximately 13% to 19% for
both cultivars over all the treatments (Table 3). Leaf ash
levels were highest at 5000 ubar and lowest at i000 ubar and
ranged from approximately 16% to 23% for both cultivars over all
treatments (Table 4). Stem ash levels were highest at 500 ubar
and lowest at 2000 ubar and ranged from approximately 6% to 11%
for both cultivars over all treatments (Table 5). Root ash
levels were highest for both cultivars at 1000 ubar
(approximately 15%) and lowest for cv. McCall at 5000 ubar (10%)
and lowest for cv. Pixie at 2000 ubar (12%) (Table 6).
Calories. Of all the plant components, seeds showed the
highest calorie (energy) values, both in terms of calculated
dietary energy and from bomb calorimeter measurements (Tables 2-
6). This is likely a result of the much higher fat content of
the seeds in comparison to other plant parts. Estimates of
dietary calorie content of leaves, stems, and roots tended to
I0

decrease with increasing CO 2, while bomb calorimeter measurements
of total energy content showed no clear trends regarding CO 2 con-
centration.
ADDlications for Human Life SuDport
Seed represented over 45% of the total biomass in several
treatments in this study (Table I), and clearly the main reason
for growing soybeans in a life support system would be for seed
production (Tibbitts and Alford, 1982; Hoff et al., 1982). By
combining the yield data from Table i and the composition of the
seed from the different environments (Table 2), it is apparent
that the best yield for total seed protein and carbohydrate per
unit area was obtained from cv. McCall plants grown at i000 ubar
CO 2 (Table 7). Total fat (oil) production from seeds was equally
high from McCall plants grown at 1000 or 2000 ubar CO 2 (Table 7).
Thus the changes in total seed yield resulting from CO 2 con-
centration outweighed any potential advantages from changes in
seed composition associated with CO 2 concentration. This sug-
gests that soybean crops used for space life support should be
managed foremost to maximize seed yield, which in turn should
maximize returns of protein, fat, and carbohydrate.
The "vegetative" response with lower seed set (i.e. low har-
vest index) at 2000 and 5000 ubar suggests that very high CO 2
concentrations may be unfavorable for maximum seed yield from
soybeans in a life support farm. Despite the importance of seed
production, if food can be recovered effectively from inedible
plant parts, the high total biomass yield from the high CO 2 con-
centrations may be important. Analyses of young soybean leaves
have shown that CO 2 enrichment can double starch levels (Hrubec
II

et al., 1985; Allen et al., 1988), thus there may be potential
for recovering useful carbohydrate from the inedible parts. In
addition, structural carbohydrates in leaves and stems could be
broken down enzymatically to yield simple sugars (Wilke et al.,
1983), or the inedible biomass might be used to culture edible
organisms such as _ ostreatus (oyster mushroom) (Calzada
et al., 1987). In either case, the effective harvest index
(i.e., percent edible yield) would be increased beyond the seed
harvest alone.
Although certain trends were apparent with regard to CO 2
effects on tissue composition, a strong case can be made for the
absence of any major changes. Aside from higher seed fat levels
at 2000 ubar (Table 2, Fig. 2), the results indicate that varying
CO 2 concentrations between 500 and 5000 ubar should not have any
major influence on seed composition. This may be an important
characteristic for crops used in tightly closed systems (e.g. a
CELSS), where CO 2 concentrations may vary depending on the ratio
of humans to plants, capacity of system gas reservoirs, or even
diurnal light/dark cycles. The apparent resilience of soybeans
with regard to total plant growth and seed composition over a
wide range of CO 2 concentrations may be an important considera-
tion for their inclusion in a CELSS.
12
LITERATURE CITED
i. Acock, B. and L.H. Allen. 1985. Crop responses to elevated
carbon dioxide concentrations. In: B.R. Strain and J.D. Cure
(eds.), Direct effects of increasing carbon dioxide on vegeta-
tion. DOE/ER-0238, U.S. Dept. of Energy, Washington, D.C.
2. Allen, L.H., J.C.V. Vu, R.R. Valle, K.J. Boote, and P.H.
Jones. 1988. Nonstznlctural carbohydrates and nitrogen of soybean
grown under carbon dioxide enrichment. Crop Sci. 28:84-94.
3. AOAC. 1984. Official methods of analysis (14th edn). Associa-
tion of Official Analytical Chemists, Washington, DC.
4. Baker, J.T., L.H. Allen, K.J. Boote, P. Jones, and J.W. Jones.
1989. Response of soybean to air temperature and carbon dioxide
concentration. Crop Sci. 29:98-105.
5. Brown, C.S. and S.C. Huber. 1987. Photosynthesis, reserve mo-
bilization and enzymes of sucrose metabolism in soybean (Glycine
max) cotyledons. Physiol. Plant. 70:537-543.
6.Calzada, S.W., A.G. de Leon, M.L. de Arriloa, and C. Rolz.
1987. Growth of mushrooms on wheat straw and coffee pulp: strain
selection. Biological Wastes, 20:217-226.
7. Duke, J.A. and A.A. Atchley. 1986. Handbook of proximate
analysis tables of higher plants. CRC Press, Inc. Boca Raton, FL.
8. Hoff, J.E., J.M. Howe, and C.A. Mitchell. 1982. Nutritional
and cultural aspects of plant species selection for a regenera-
tive life support system. Contract report to NASA Ames Research
Center, Grants 2401 and 2404.
9. Hrubec, T.C., J.M. Robinson, and R.P. Donaldson. 1985. Effects
of CO 2 enrichment and carbohydrate content on the dark respira-
tion of soybeans. Plant Physiol. 79:684-689.
I0. Jones, P, L.H. Allen, J.W. Jones, and R. Valle. 1985.
Photosynthesis and transpiration responses of soybean canopies to
short- and long-term CO 2 treatments. Agron. J. 119-126.
ii. Kramer, P.J. 1981. Carbon dioxide concentration, photosyn-
thesis, and dry matter production. BioScience 31:29-33.
12. Krober, O.A. and S.J. Gibbons. 1962.
soybeans. Agricul. Food Chem. 10:57-59.
Nonprotein nitrogen in
13. MacElroy, R.D., and J. Bredt. 1985. Controlled ecological
life support system. Current concepts and future directions of
CELSS. NASA Conf. Pub. 2378 from XXV COSPAR mtg. Graz, Austria.
14. Mackowiak, C.L., L.P. Owens, C.R. Hinkle, and R.P. Prince.
1989. Continuous hydroponic wheat production using a recirculat-
ing system. NASA Tech. Memorandum 102784, Kennedy Space Center,FL.
13

15. Pace, G.M., C.T. MacKown, and R.J. Volk. 1982. Minimizing
nitrate reduction during Kjeldahl digestion of plant tissue ex-tracts and stem exudates. Plant Physiol. 69:32-36.
16. Prince, R.P., W.M. Knott, J.C. Sager, and S.E. Hilding. 1987.
Design and performance of the KSC biomass production chamber.
SAE Tech. Paper 871437, Soc. Sutomotive Eng. Conf., Seattle, WA,
July 1987.
17. Raper, C.D. and J.F. Thomas. 1978. Photoperiodic alteration
of dry matter partitioning and seed yield in soybeans. Crop Sci.18:654-656.
18. Rogers, H.H., N Sionit, J.D. Cure, J.M. Smith, G. E. Bingham.1984. Influence of elevated carbon dioxide on water relations of
soybeans. Plant Physiol. 74:233-238.
19. Ross, C.E. 1973. Skylab 1/2 preliminary biomedical report.
JSC Internal Note 08439, Johnson Space Center, Houston, TX.
20. Thomas, J.F. and C.D. Raper. 1976. Photoperiodic control ofseed filling for soybeans. Crop Sci. 16:667-672.
21. Tibbitts, T.W. and D.K. Alford. 1982. Controlled ecological
life support system. Use of higher plants. NASA Conf. Pub. 2231
22. Tolley-Henry, L. and C.D. Raper. 1986a. Utilization of am-
monium as a nitrogen source. Effects of ambient acidity on growth
and nitrogen accumulation by soybean. Plant Physiol. 82:54-60.
23. Tolley-Henry, L. and C.D. Raper. 1986b. Nitrogen and dry-matter partitioning in soybean plants during onset of and
recovery from nitrogen stress. Bot. Gaz. 147:392-399.
24. Wheeler, R.M., K.A. Corey, J.C. Sager, C.L. Mackowiak, and
W.M. Knott. 1990. Gas excahnge rates by a stand of soybeansgrown in a tightly sealed chamber. HortScience Abstracts.
25. Wilke, C.R., B. Maiorella, A. Sciamanna, K. Tangnu, D. Wiley,
and H. Wong. 1983. Enzymatic hydrolysis of cellulose. Theory andapplication. Noyes Data Corp. Park Ridge, NJ, USA.
26. Wilson, R.F. 1987. Seed metabolism. In: J.R. Wilcox (ed.),Soybeans: Improvement, Production, and Uses. Amer. Soc. of
Agron. Publishers, Madison, WI, USA.
27. Yazdi-Samadi, B., R.W. Rinne, and R.D. Seif. 1977. Componentsof developing soybean seeds: Oil, protein, sugars, starch, or-
ganic acids, and amino acids. Agron. J. 69:481-486.
14
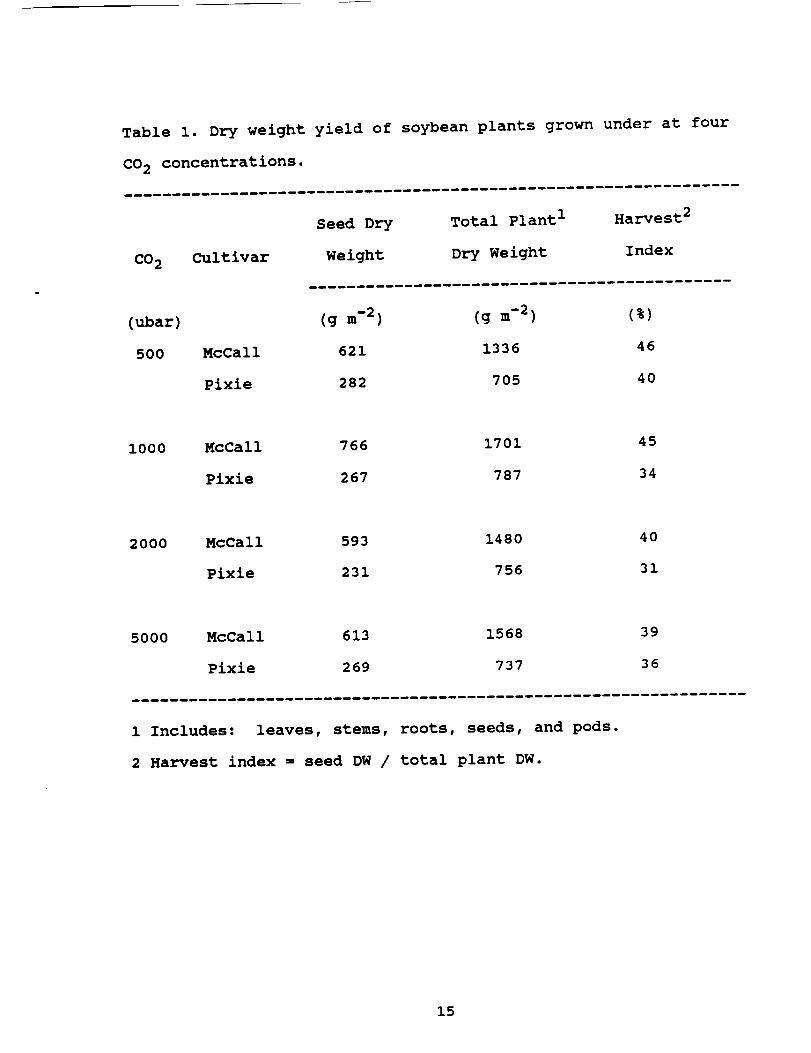
Table i. Dry weight yield of soybean plants grown under at four
CO 2 concentrations.
CO 2 Cultivar
Seed Dry Total Plant I H arvest2
Weight Dry Weight Index
(ubar) (g m-2) (g m-2) (%)
500 McCall 621 1336 46
Pixie 282 705 40
I000 McCall 766 1701 45
Pixie 267 787 34
200O McCall 593 1480 40
Pixie 231 756 31
5OOO McCall 613 1568 39
Pixie 269 737 36
i Includes: leaves, stems, roots, seeds, and pods.
2 Harvest index s seed DW / total plant DW.
15

Table 2. Proximate analysis of seed from soybean plants grown at
four CO 2 concentrations. Data are expressed as a percent of to-
tal dry weight.
CO 2 cv Protein Fat Carbo- Crude Ash Calories I Bomb
hydrate Fiber Cal.
(ubar) (%) (%) (%) (%) (%) (kcal/g) (kcal/g)
500 McCall 37.7 16.1 31.5 7.7 6.9 4.2 5.4
Pixie 38.9 17.3 28.4 8.6 6.7 4.3 5.5
i000 McCall 39.3 16.5 30.4 5.9 7.1 4.3 5.5
Pixie 41.9 16.8 27.1 5.7 8.1 4.3 5.5
2000 McCall 34.7 21.2 26.9 10.7 6.3 4.4 5.3
Pixie 38.9 20.9 20.8 13.1 6.1 4.3 5.4
5000 McCall 38.1 13.6 29.0 12.0 6.8 3.9 5.4
Pixie 40.0 16.6 23.8 12.0 7.1 4.0 5.5
1 Calculated by assuming 4 kcal g-I carbohydrate, 4 kcal g-i pro-
tein, and 9 kcal g-I fat.
16

Table 3. Proximate analysis of seed pods from soybean plants
grown at four CO 2 concentrations. Data are expressed as a per-
cent of total dry weight.
CO 2 cv Protein Fat Carbo- Crude Ash Calories I Bomb
hydrate Fiber Cal.
(ubar) (%) (%) (%) (%) (%) (kcal/g)(kcal/g)
500 McCall 3.6 2.2 46.1 32.8 14.7 2.2 3.7
Pixie 4.7 1.8 48.3 29.6 15.4 2.3 3.6
I000 McCall 3.3 0.8 45.6 33.9 15.8 2.0 3.6
Pixie 4.7 0.6 45.0 32.7 16.3 2.0 3.5
2000 McCall 3.9 1.2 50.1 31.3 13.2 2.3 3.5
Pixie 5.1 0.7 60.2 19.5 14.2 2.7 3.5
5000 McCall 4.8 0.6 42.9 33.6 17.3 2.0 3.7
Pixie 5.1 0.6 42.0 32.1 19.0 1.9 3.6
b_Qmmmm_
1 Calculated by assuming 4 kcal g-i
tein, and 9 kcal g-1 fat.
carbohydrate, 4 kcal g-i pro-
17

Table 4. Proximate analysis of leaves from soybean plants grown
at four CO 2 concentrations. Data are expressed as a percent of
total dry weight.
CO 2 cv Protein Fat Carbo- Crude Ash Calories I Bomb
hydrate Fiber Cal.
(ubar) (%) (%) (%) (%) (%) (kcal/g) (kcal/g)
500 McCall 12.7 4.3 51.4 11.2 19.9 3.0 3.5
Pixie 13.2 3.9 51.8 12.1 18.4 3.2 3.7
i000 McCall 11.2 3.0 54.8 12.2 18.3 2.9 3.6
Pixie 12.0 2.5 58.8 9.9 16.4 3.1 3.7
2000 McCall 13.3 2.8 49.9 14.2 19.4 2.8 3.4
Pixie 15.5 2.5 51.3 13.1 17.1 2.9 3.6
5000 McCall 18.8 2.1 40.1 15.3 22.6 2.6 3.6
Pixie 21.1 1.8 38.8 15.0 22.4 2.6 3.7
.- w
1 Calculated by assuming 4 kcal g-I carbohydrate, 4 kcal g-i pro-
tein, and 9 kcal g-I fat.
18

Table 5. Proximate analysis of stems from soybean plants grown at
four CO 2 concentrations. Data are expressed as a percent of total
dry weight.
CO 2 cv Protein Fat Carbo- Crude Ash Calories I Bomb
hydrate Fiber Cal.
(ubar) (%) (%) (%) (%) (%) (kcal/g) (kcal/g)
500 McCall 9.8 2.2 36.3 43.6 7.7 2.1 4.1
Pixie 13.3 2.4 46.2 26.4 11.3 2.6 3.9
I000 McCall 13.3 1.4 30.3 47.0 7.5 1.9 4.1
Pixie 22.7 1.0 36.6 31.4 8.1 2.5 3.9
2000 McCall 11.7 0.9 30.6 50.3 6.1 1.8 4.0
Pixie 18.5 1.0 36.0 36.4 7.8 2.3 3.9
5000 McCall 7.4 0.7 28.9 55.6 6.7 1.5 4.4
Pixie 8.8 0.7 31.8 47.5 10.7 1.7 4.2
1 Calculated by assuming 4 kcal g-I carbohydrate, 4 kcal g-I pro-
tein, and 9 kcal g-i fat.
19

Table 6. Proximate analysis of roots from soybeans grown at four
CO 2 concentrations. Data are expressed as a percent of total dry
weight.
CO 2 cv Protein Fat Carbo- Crude Ash Calories I Bomb
hydrat Fiber Cal.
(ubar) (%) (%) (%) (%) (%) (kcal/g) (kcal)
500 McCall 20.9 3.7 29.1 31.2 14.7 2.3 3.8
Pixie 20.8 2.6 32.8 29.9 13.6 2.4 3.8
1000 McCall 21.9 1.7 27.9 33.3 14.8 2.2 3.9
Pixie 25.3 1.6 30.3 26.7 15.2 2.4 3.9
2000 McCall 23.2 1.5 31.0 33.3 10.6 2.3 3.8
Pixie 22.0 1.2 38.0 26.7 11.7 2.5 3.7
5000 McCall 20.4 1.6 26.2 40.7 9.9 2.0 4.0
Pixie 23.2 1.0 27.2 35.0 12.3 2.1 4.1
1 Calculated by assuming 4 kcal g-1 carbohydrate,
tein, and 9 kcal g-I fat.
4 kcal g-i pro-
20

Table 7. Protein, fat, and carbohydrate yields per unit area
from soybean seed grown at four different CO 2 concentrations.
CO 2 Cultivar Total Protein Total Fat
Yield Yield
Total Carbo-
hydrate Yield
(ubar) (g m -2) (g m -2) (g m -2)
5OO McCall 234 i00 196
Pixie ii0 49 80
I000 McCall 301 126 233
Pixie 112 45 72
2OOO McCall 206 126 159
Pixie 90 48 48
5000 McCall 234 84 178
Pixie 108 45 64
21

40
30z
_ 2o
10
o •SEEDS PODS LEAVES STEMS ROOTS . []
50 []
t cv. Pixie I! R
4O
gz 30
_ 2oD.
10
0
SEEDS PODS LEAVES STEMS ROOTS
500 IJbar
1000 IJbar
2000 lzbar
5000 lzbar
Figure 1. Protein content of soybean plants grown atfour different carbon dioxide concentrations.
22

2+:F cv. McCall
2O
5
o []
SEEDS PODS LEAVES STEMS ROOTS []
25 []
t cv. Pixie I _
20
15
I,L
0
SEEDS PODS LEAVES STEMS ROOTS
500 pbar
1000 llbar
2000 lzbar
5000 I_bar
Figure 2. Fat content of soybean plants grown at fourdifferent carbon dloxide concentrations.
23

A
IllI"
a>.
0m
o
A
ILlI--
rrr_
3_0m
80
,ot cv. McCall
40
20
o •
SEEDS PODS LEAVES STEMS ROOTS []
80
t CV. Pixie60
40
20
0
SEEDS PODS LEAVES STEMS ROOTS
[]
[]
500 pbar
1000 lzbar
2000 pbar
5000 pbar
Figure 3. Carbohydrate content of soybean plants grown atfour different carbon dioxide concentrations.
24

i
Report Documentation PageSoace _,_,_n
I. Report No.
NASA TM 103496
2. Government Accession No.
4._eandSubtitle
Proximate composition of Seed and Biomass from Soybean
Plants Grown at Different Carbon Dioxide (CO 2)
Concentrations
7. Author(a}
Wheeler, R.M., C,L. Mackowiak, and J.C. Sager
9. Performing Organization Name and Addm_
The Bionetics Corporation (RMW, CLM)
NASA Biomedical Operations and Research (JCS)
Kennedy Space Center, FL 32899
12. Sponsoring Agency Name and Address
3, Recioient's Catalog No,
5. Report Date
May 1990
6. Performing Organization Code
BIO-3
8. Performing Organization Report No.
10. Work Unit No.
11. Contract or Grant No.
13. Type of Report and Period Covered
14. Soonsoring Agency Code
HD/PJ_S
15. Supplementary Notes
16. Ab=_ Soybean plants (Glycine max cvs. McCall and Pixie) were grown for 90 days at
500, I000, 2000, and 5000 ubar (ppm) carbon dioxide (CO 2) and compared for proximate
nutritional value. For both cultivars (MC and PX), seed protein levels were highest
at I000 (39.3% and 41.9% for MC and PX) and lowest at 2000 (34.7% and 38.9% for MC
and PX). Seed fat (oil) levels were highest at 2000 (21.2% and 20.9% for MC and PX)
and lowest at 5000 (13.6% and 16.6% for MC and PX). Seed carbohydrate levels were
highest at 500 (31.5% and 28.4% for MC and PX) and lowest at 2000 (20.9% and 20.8%
for MC and PX). When adjusted for total seed yield per unit growing area, the high-
est production of protein and carbohydrate occurred with MC at i000, while equally
high amounts of fat were produced with MC at i000 and 2000. Seed set and pod devel-
opment at 2000 were delayed incomparison to other CO 2 treatments; thus the propor-
tionately high fat and low protein at 2000 may have been a result of the delay in
plant maturity rather than CO 2 concentration. Stem crude fiber and carbohydrate
levels for both cultivars increased with increased COp. Leaf protein and crude fibez
levels also tended to rise with increased CO 2 but lea_ carbohydrate levels decreased
as CO 2 was increased. The results suggest that CO 2 effects on total seed yield out-
weighed any potential advantages to changes in seed composition.
17. Kw Words(Suggest_ byAuthor(s))
Carbon Dioxide, C02, Protein, Fat, Carbo-
hydrate, Proximate Analysis, Controlled
Ecological Life Support Systems, CELSS,
Bioregenerative Life Support Systems
18, Distribution Statement
19. Security Clessif. (of this report) 20. Security Clessif, (of this page)
Unclassified Unclassified
i i
NASA FORM 1828 OCT 86
21. No. of pages
28
22. Price