PROXIMATE ANALYSIS OF THE SELECTED...
111
131 PROXIMATE ANALYSIS OF THE SELECTED FOODS The present study emphasizes the importance of the glycemic response to whole foods which may be affected by the presence of other co-nutrients in addition to carbohydrate. Macronutrients like protein and fat, along with moisture and dietary fiber also influence the postprandial blood sugar levels as well as insulin secretion. Therefore, selected carbohydrate rich foods were analyzed for their moisture, protein, fat, carbohydrate and fiber content. The overall nutrient composition of the selected test foods is presented in table below.
Transcript of PROXIMATE ANALYSIS OF THE SELECTED...
131
PROXIMATE ANALYSIS OF THE SELECTED FOODS
The present study emphasizes the importance of the glycemic response to whole foods which
may be affected by the presence of other co-nutrients in addition to carbohydrate.
Macronutrients like protein and fat, along with moisture and dietary fiber also influence the
postprandial blood sugar levels as well as insulin secretion. Therefore, selected carbohydrate
rich foods were analyzed for their moisture, protein, fat, carbohydrate and fiber content. The
overall nutrient composition of the selected test foods is presented in table below.
132
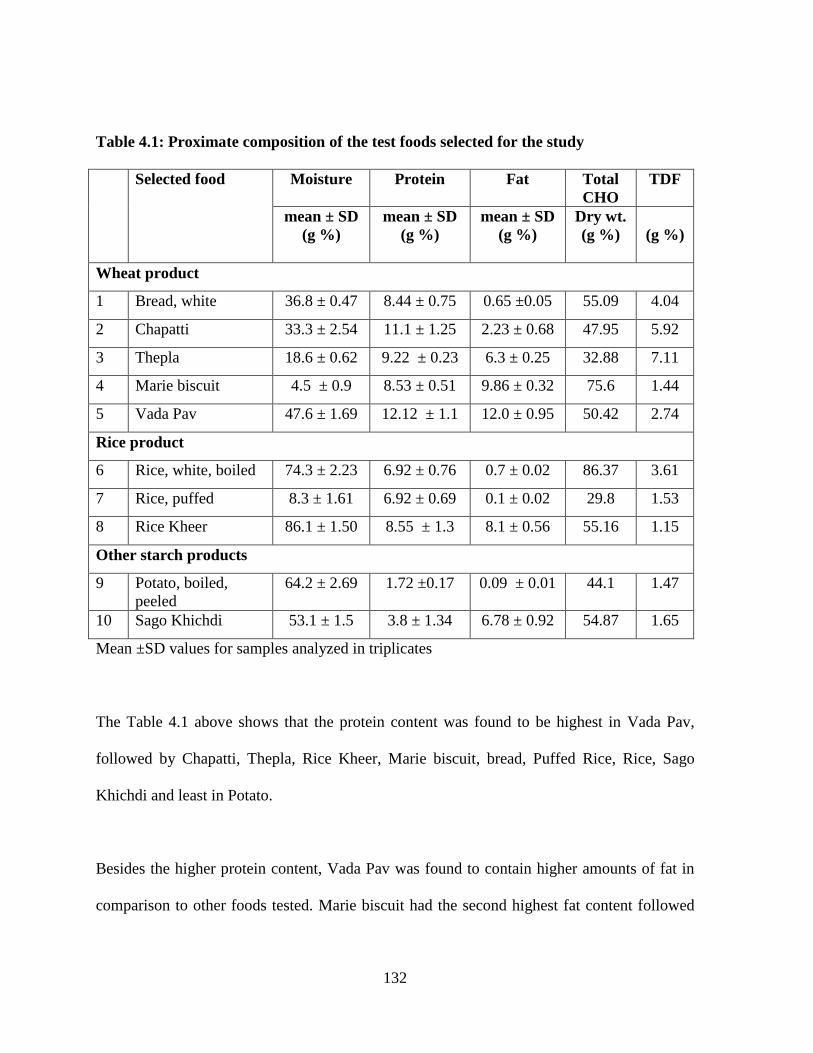
Table 4.1: Proximate composition of the test foods selected for the study
Selected food Moisture Protein Fat Total
CHO
TDF
mean ± SD
(g %)
mean ± SD
(g %)
mean ± SD
(g %)
Dry wt.
(g %)
(g %)
Wheat product
1 Bread, white 36.8 ± 0.47 8.44 ± 0.75 0.65 ±0.05 55.09 4.04
2 Chapatti 33.3 ± 2.54 11.1 ± 1.25 2.23 ± 0.68 47.95 5.92
3 Thepla 18.6 ± 0.62 9.22 ± 0.23 6.3 ± 0.25 32.88 7.11
4 Marie biscuit 4.5 ± 0.9 8.53 ± 0.51 9.86 ± 0.32 75.6 1.44
5 Vada Pav 47.6 ± 1.69 12.12 ± 1.1 12.0 ± 0.95 50.42 2.74
Rice product
6 Rice, white, boiled 74.3 ± 2.23 6.92 ± 0.76 0.7 ± 0.02 86.37 3.61
7 Rice, puffed 8.3 ± 1.61 6.92 ± 0.69 0.1 ± 0.02 29.8 1.53
8 Rice Kheer 86.1 ± 1.50 8.55 ± 1.3 8.1 ± 0.56 55.16 1.15
Other starch products
9 Potato, boiled,
peeled
64.2 ± 2.69 1.72 ±0.17 0.09 ± 0.01 44.1 1.47
10 Sago Khichdi 53.1 ± 1.5 3.8 ± 1.34 6.78 ± 0.92 54.87 1.65
Mean ±SD values for samples analyzed in triplicates
The Table 4.1 above shows that the protein content was found to be highest in Vada Pav,
followed by Chapatti, Thepla, Rice Kheer, Marie biscuit, bread, Puffed Rice, Rice, Sago
Khichdi and least in Potato.
Besides the higher protein content, Vada Pav was found to contain higher amounts of fat in
comparison to other foods tested. Marie biscuit had the second highest fat content followed
133
by Rice Kheer, Sago Khichdi and Thepla. Chapatti had upto 2% fat and rest of the products
had negligible amounts of fat.
It was observed that Rice and Marie biscuit seemed to have the highest total carbohydrate
content on dry weight basis, whereas bread, Rice Kheer, Vada Pav, Chapatti and Sago
Khichdi contain almost 50-55% carbohydrate. Boiled Potato, Thepla and Puffed Rice had
lower total carbohydrate content in the range of 30-45%.
Products made from wheat flour have shown to contain relatively larger amounts of fiber
with highest for Thepla, followed by Chapatti, bread, Rice and Vada Pav. All other test foods
contained less than 2% dietary fiber
The results indicate that Rice seems to contain moderate protein and fiber, very little fat, but
high moisture and total carbohydrate on dry weight basis. Same Rice kernel when puffed
using dry heat to prepare Puffed Rice contains <10% moisture and lower amounts of fiber
compared to cooked Rice. Another product of Rice, i.e. Rice Kheer, on the other hand, has
concentrated milk and very little rice (7%) in it. With the co-ingredients added, this Rice
product becomes rich in protein, fiber and fat compared to plain cooked Rice.
Chapatti prepared from whole wheat flour contains high amounts of fiber, moderate
carbohydrate and protein and low fat (Table 4.1). Thepla, which is also made from wheat
flour with chana flour added in 4:1 proportion and a little fenugreek leaves, has similar
protein but higher fat and fiber content. The higher fiber content resulting from addition of
chana flour and fenugreek may be considered more beneficial for health although the overall
134
fat content increases during cooking process. As compared to Chapatti and Thepla, another
processed wheat product, Marie biscuit seemed to have the highest fat content and lowest
fiber content. Marie biscuit is known to weight watchers and diabetics as a light snack with
tea, but it cannot be ignored that the basic ingredients for biscuit are refined wheat flour,
vanaspati and sugar. The results of our analysis show that Marie biscuit forms a snack which
may be low in sweetness as far as taste is concerned but high in both, total carbohydrates and
fat (Table 4.1).
Among tubers, Potato and sago constitute the popular foods consumed in Maharashtra, India.
The protein, fat and fiber content of these are negligible. The starch present in tubers
undergoes gelatinization upon cooking causing it to swell and thereby larger volume of
cooked portion is obtained. Sago is more commonly consumed in the form of Sago Khichdi
which contains Potato, peanuts and oil. However, despite addition of these ingredients, the
overall nutrient density of Sago Khichdi is not enhanced substantially rendering it a relatively
starch dense food.
Vada Pav, which contains both Potato and bread, is eaten as a mini-meal by most Mumbai
residents. It forms a cost-effective and satisfying snack option. The use of fat is inevitable for
frying the Potato vadas and Bengal gram flour is used for coating the vadas. This makes
Vada Pav rich in fat as well as protein. Nutritionally, major fallout for Vada Pav can be the
unhygienic conditions for preparing it and use of poor quality oil because it is a street food,
however, its satiating effect as mini-meal needs to be acknowledged.
135
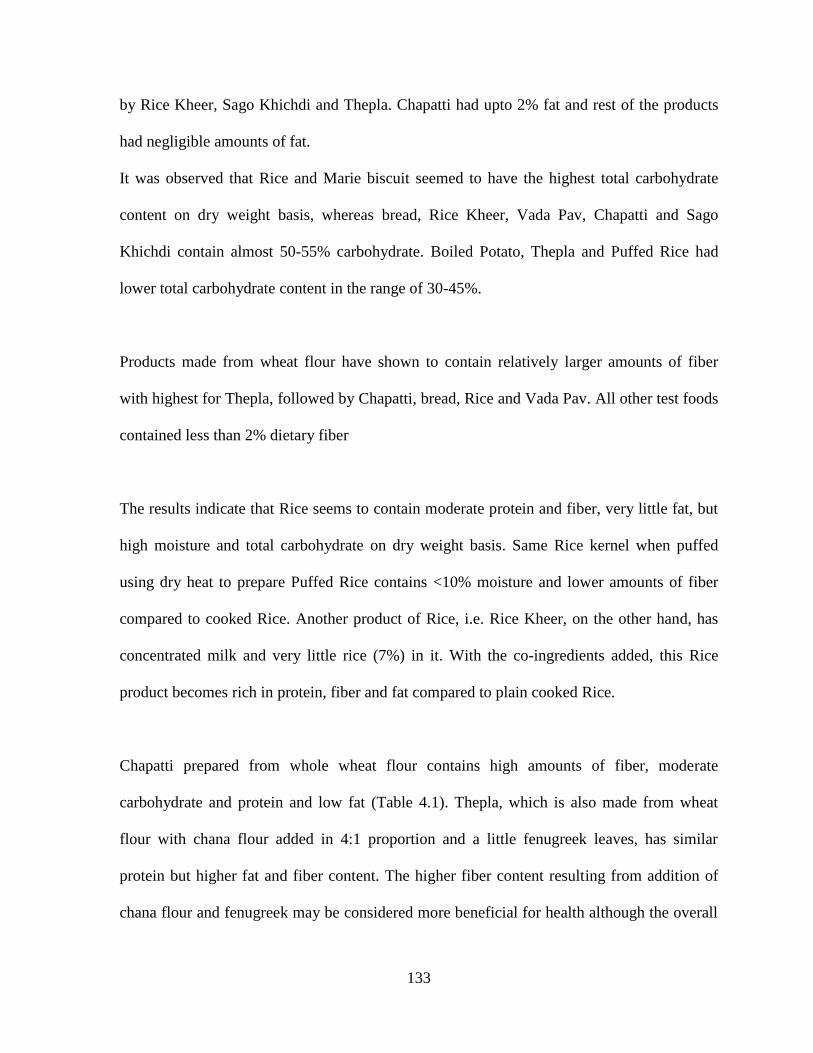
Table 4.2: Moisture, protein and fat content of raw and cooked foods
Selected food Weight Moisture Protein Fat
Obser-
ved
data
Publi-
shed
data
Obser-
ved
data
Publi-
shed
data
Obser
-ved
data
Publi-
shed
data
(g %) (g %) (g %) (g %) (g %) (g %)
Bread, white Dry wt. - 39 13.35 7.8 1.0 0.7
Wet wt. 36.8 31.2 8.44 8.8 0.65 1.2
Rice, white,
cooked
Dry wt. - 13.7 26.8 6.8 2.7 0.5
Wet wt. 74.3 62.6 6.92 - 0.7 0.4
Potato, boiled,
peeled
Dry wt. - 74.7 4.8 1.6 0.25 0.1
Wet wt. 64.2 81 1.72 1.9 0.09 0.1
Rice, puffed Dry wt. - 14.7 7.5 7.5 0.11 0.1
Wet wt. 8.3 - 6.9 - 0.1 -
Source: Published values for raw foods (dry weight) - NIN 2002,
Values for cooked portions (wet weight) - FAO 1972
The Table 4.2 shows the comparison of data obtained in the present study and published data
available from different sources. The data on proximate composition of cooked food portions
is limited. In practical situation, foods are consumed in their cooked form and hence wet
weight values should be considered instead of values for dry weight/ raw foods.
In the Table 4.3 below, carbohydrate and fiber content of the foods has been reported.
136
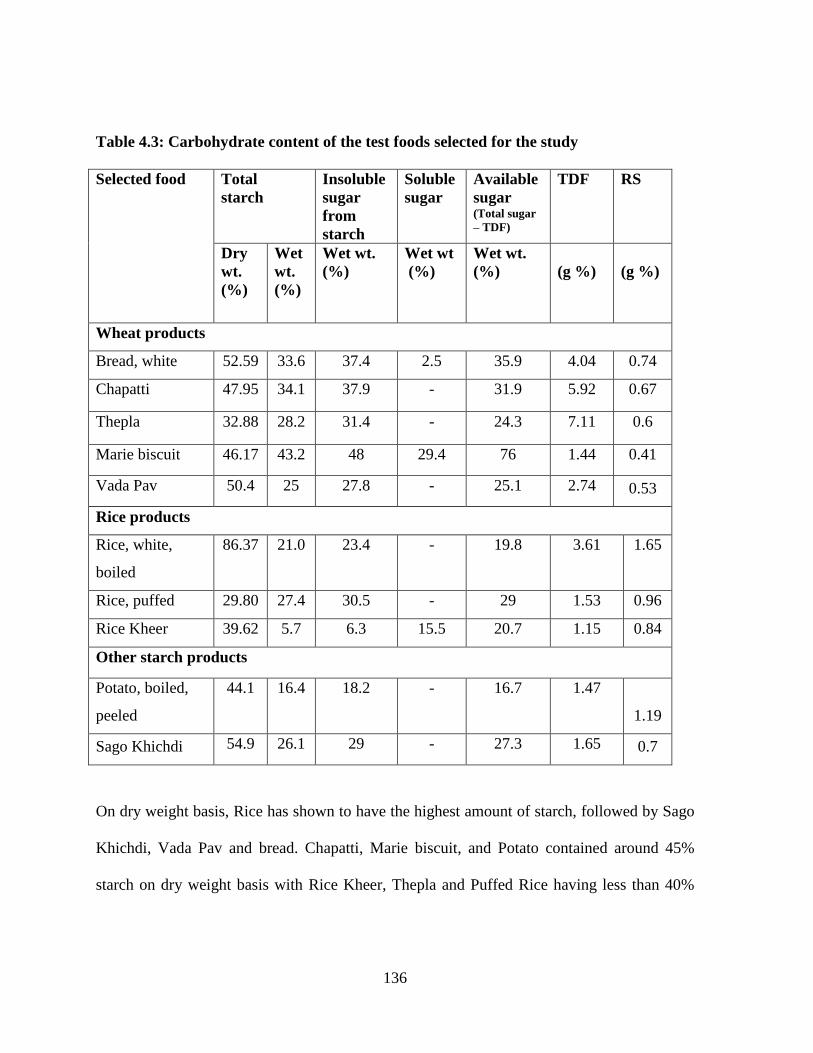
Table 4.3: Carbohydrate content of the test foods selected for the study
Selected food
Total
starch
Insoluble
sugar
from
starch
Soluble
sugar
Available
sugar (Total sugar
– TDF)
TDF RS
Dry
wt.
(%)
Wet
wt.
(%)
Wet wt.
(%)
Wet wt
(%)
Wet wt.
(%)
(g %)
(g %)
Wheat products
Bread, white 52.59 33.6 37.4 2.5 35.9 4.04 0.74
Chapatti 47.95 34.1 37.9 - 31.9 5.92 0.67
Thepla 32.88 28.2 31.4 - 24.3 7.11 0.6
Marie biscuit 46.17 43.2 48 29.4 76 1.44 0.41
Vada Pav 50.4 25 27.8 - 25.1 2.74 0.53
Rice products
Rice, white,
boiled
86.37 21.0 23.4 - 19.8 3.61 1.65
Rice, puffed 29.80 27.4 30.5 - 29 1.53 0.96
Rice Kheer 39.62 5.7 6.3 15.5 20.7 1.15 0.84
Other starch products
Potato, boiled,
peeled
44.1 16.4 18.2 - 16.7 1.47
1.19
Sago Khichdi 54.9 26.1 29 - 27.3 1.65 0.7
On dry weight basis, Rice has shown to have the highest amount of starch, followed by Sago
Khichdi, Vada Pav and bread. Chapatti, Marie biscuit, and Potato contained around 45%
starch on dry weight basis with Rice Kheer, Thepla and Puffed Rice having less than 40%
137
(Table 4.3). In fresh foods, moisture acts as an energy diluent thereby reducing starch as well
as energy density of the food consumed.
When starch content was compared on wet weight basis, the hierarchy of foods seemed to
change drastically. It was noted that Rice Kheer has lowest starch content on wet weight
basis followed by Potato and highest for Marie biscuit. Out of these, Rice Kheer and Marie
biscuit both have different amount of added free sugar which may affect the postprandial
glycemic and insulinemic response besides the processing techniques used.
All the other test foods were shown to contain 20-35% starch on wet weight basis (Table
4.3). The starch content on wet weight basis represents the actual starch available in the food
as it is consumed, taking into account the moisture content of cooked food portions. When
we eat a cup of cooked Rice, we will consume that much starch only which is present in that
cooked Rice along with its moisture to give the total volume and weight of the cooked Rice.
In the present study, the starch content on wet weight basis has been considered in correlating
the glycemic response to foods with available carbohydrate. Instead of using values for
raw/dry weight of food products, which has been used in the classification of carbohydrate
food on the basis of GI, this enables more relevant comparisons of foods in the form in which
they are finally consumed.
Among the Rice products, Rice Kheer has lowest starch content on wet weight basis since
milk is the predominant ingredient present. Although Rice and Puffed Rice were shown to
138
have similar starch content on wet weight basis (Table 4.3), the higher moisture content of
boiled Rice acts as an energy diluent.
Out of the four wheat products, Marie biscuit has the highest and Thepla had lowest starch
content on wet weight basis. Marie biscuit contains high amounts of total sugars also, which
may represent the added sugar in the form of sucrose and some hydrolyzed free sugars. In
comparison to Chapatti, Vada Pav and Marie biscuit, Thepla may be considered as a healthier
alternative with lower starch and higher fiber content.
With around 65-70% moisture, boiled Potato contains very little available starch (Table 4.3).
Sago Khichdi and Vada Pav having lesser moisture contained relatively more starch on wet
weight basis compared to Potato.
KEY OBSERVATIONS:
The starch and total available sugar content of the cooked carbohydrate foods are
affected by cooking or processing techniques.
All starch containing foods are not interchangeable
The overall glycemic and insulin response to foods in the postprandial period will
depend on the above factors.
139
RELATIVE GLYCEMIC AND INSULIN RESPONSE
The present study attempts to redefine the Glycemic Index to include responses to whole
foods instead of available carbohydrates alone. It is therefore necessary to understand the
basic concepts of GIfood and Glycemic Bread Equivalents (GBE).
When GIfood is expressed as the postprandial glycemic response of given food
quantity in a single intake compared to standard, it is termed as Relative Glycemic
Impact (here, 50g) thereby giving the GBE/50g of food value
When GIfood is expressed as postprandial glycemic response to 100g of test food as a
percentage of the effect of equal amount of standard, it is termed as Relative
Glycemic Potency (100g), thereby giving the GBE/100g of food value.
The utility and application of these concepts and terminologies will be elucidated though this
chapter.
140
GIfood value for 50g food: Relative Glycemic Impact (RGI)
The postprandial glycemic responses to foods depend upon rate of digestion, release and
utilization of carbohydrates which in turn are further affected by several other factors.
Besides just carbohydrate content, type of sugar (sucrose, fructose, glucose, etc), starch
characteristics (amylose: amylopectin ratio, granule size etc), presence of protein, fat, fiber
and moisture content as well as processing method may affect the glycemic response to the
food.
Relative glycemic impact of foods is the 2 h postprandial response to a given amount of food
compared to the response produced by same quantity of bread (standard food) expressed as
the Glycemic Bread Equivalent (GBE).
IAUC blood glucose response to a specified food
IAUC response to glucose equal in weight to the food
IAUC- Incremental Area Under the Curve
RGI= GBE/amount of food, here GBE/50g of food
GIfood /RGI= x Amt. of food
(e.g. 50g)
141
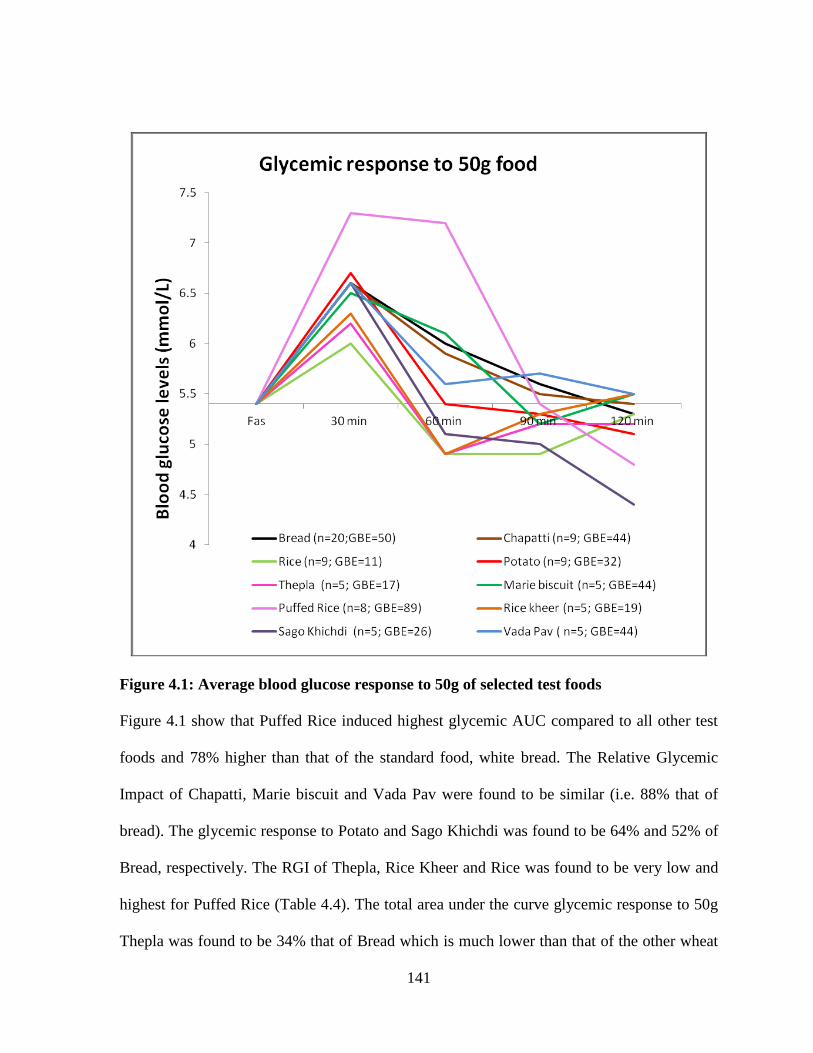
Figure 4.1: Average blood glucose response to 50g of selected test foods
Figure 4.1 show that Puffed Rice induced highest glycemic AUC compared to all other test
foods and 78% higher than that of the standard food, white bread. The Relative Glycemic
Impact of Chapatti, Marie biscuit and Vada Pav were found to be similar (i.e. 88% that of
bread). The glycemic response to Potato and Sago Khichdi was found to be 64% and 52% of
Bread, respectively. The RGI of Thepla, Rice Kheer and Rice was found to be very low and
highest for Puffed Rice (Table 4.4). The total area under the curve glycemic response to 50g
Thepla was found to be 34% that of Bread which is much lower than that of the other wheat
142
products. This showed that the overall glycemic response to foods varied to a large extent
despite belonging to the same food groups or being prepared from same raw ingredients.
GIfood value for 100g food: Relative Glycemic Potency (RGP)
GIfood value, in terms of RGI, is used to represent acute effects of single intake (Monro
2002), but in general, when describing the nature of foods at multiple intake levels we may
use the term ‗Relative glycemic potency (RGP). GIfood when expressed as the glycemic
response to test food as a percentage of the effect of equal amount of reference food is termed
as Relative Glycemic Potency wherein the amount of bread (reference food) that gives
similar response as that of 100gm of test food is expressed as GBE/100g.
IAUC blood glucose response to a specified food
IAUC response to glucose equal in weight to the food
RGP= GBE/100g of food
GIfood /RGP= x 100
143
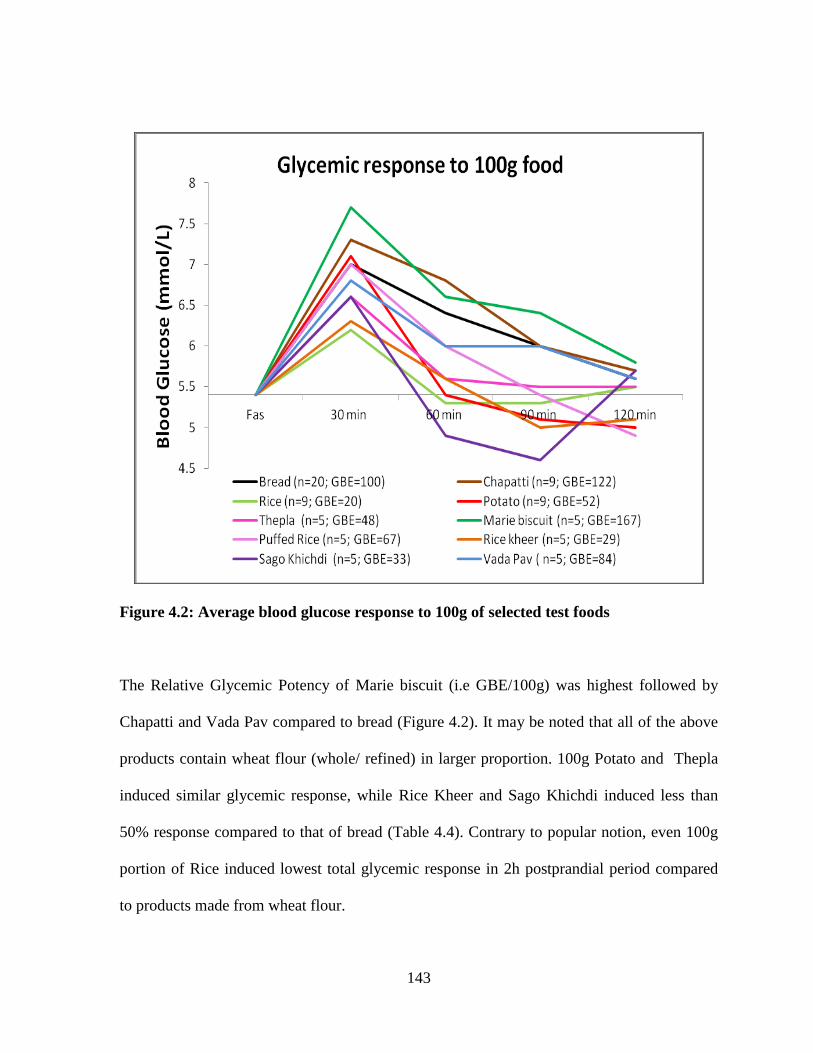
Figure 4.2: Average blood glucose response to 100g of selected test foods
The Relative Glycemic Potency of Marie biscuit (i.e GBE/100g) was highest followed by
Chapatti and Vada Pav compared to bread (Figure 4.2). It may be noted that all of the above
products contain wheat flour (whole/ refined) in larger proportion. 100g Potato and Thepla
induced similar glycemic response, while Rice Kheer and Sago Khichdi induced less than
50% response compared to that of bread (Table 4.4). Contrary to popular notion, even 100g
portion of Rice induced lowest total glycemic response in 2h postprandial period compared
to products made from wheat flour.
144
Rice Kheer, which has sugar added, would be expected to induce a higher glycemic response
but its response is equivalent to that induced by 29g bread only; significantly lower than that
of Puffed Rice (p<0.05). This may be due to the high water content of the product and type of
sugar present. It shows that even foods containing sucrose may not always induce a high
glycemic response and likewise not all the non-sweet tasting foods produce a lower glycemic
response. This result is supported by study of Miller & Lobbezoo (1994) where they noted
that sucrose-free Puffed Rice cereal demonstrated the highest plasma glucose and insulin
response compared to cereal samples containing added sucrose (21g and 43g) despite
keeping the available carbohydrate constant.
The glycemic response induced by Sago Khichdi is much lower (Figure 4.2) which may be
attributed to its higher amylopectin starch which breaks down faster and is utilized rapidly
(Singhania & SenRay 2012b). The starch granules of sago also absorb water almost twice the
amount of its dry weight and swell thereby increasing surface area for enzyme action.
145
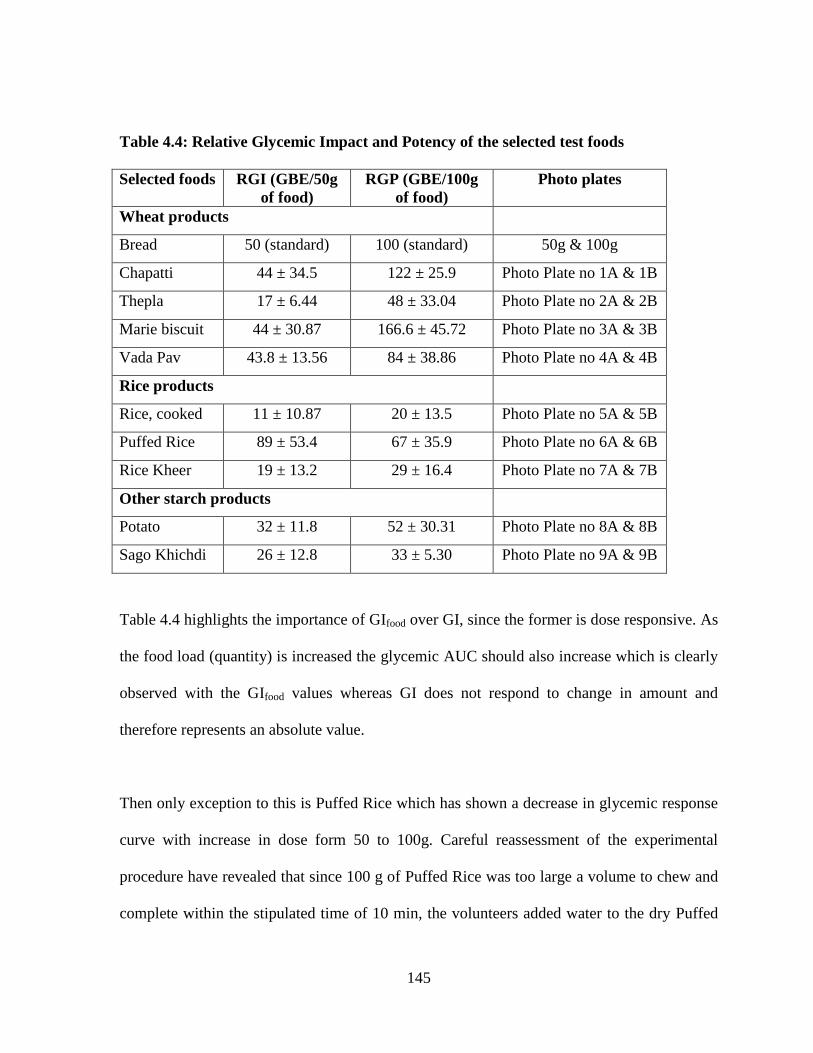
Table 4.4: Relative Glycemic Impact and Potency of the selected test foods
Selected foods RGI (GBE/50g
of food)
RGP (GBE/100g
of food)
Photo plates
Wheat products
Bread 50 (standard) 100 (standard) 50g & 100g
Chapatti 44 ± 34.5 122 ± 25.9 Photo Plate no 1A & 1B
Thepla 17 ± 6.44 48 ± 33.04 Photo Plate no 2A & 2B
Marie biscuit 44 ± 30.87 166.6 ± 45.72 Photo Plate no 3A & 3B
Vada Pav 43.8 ± 13.56 84 ± 38.86 Photo Plate no 4A & 4B
Rice products
Rice, cooked 11 ± 10.87 20 ± 13.5 Photo Plate no 5A & 5B
Puffed Rice 89 ± 53.4 67 ± 35.9 Photo Plate no 6A & 6B
Rice Kheer 19 ± 13.2 29 ± 16.4 Photo Plate no 7A & 7B
Other starch products
Potato 32 ± 11.8 52 ± 30.31 Photo Plate no 8A & 8B
Sago Khichdi 26 ± 12.8 33 ± 5.30 Photo Plate no 9A & 9B
Table 4.4 highlights the importance of GIfood over GI, since the former is dose responsive. As
the food load (quantity) is increased the glycemic AUC should also increase which is clearly
observed with the GIfood values whereas GI does not respond to change in amount and
therefore represents an absolute value.
Then only exception to this is Puffed Rice which has shown a decrease in glycemic response
curve with increase in dose form 50 to 100g. Careful reassessment of the experimental
procedure have revealed that since 100 g of Puffed Rice was too large a volume to chew and
complete within the stipulated time of 10 min, the volunteers added water to the dry Puffed
146
Rice to allow it to soak and decrease in volume. They then consumed soaked Puffed Rice
leaving behind the soaking water. This has initiated a few more experiments to conclude the
specific dose response of Puffed Rice (Page No 201)
IIfood value for 50g food: RELATIVE INSULINEMIC IMPACT (RII)
Insulin is the predominant hormone that regulates blood sugar levels in the postprandial
period. Along with glycemic impact, the insulin responses can help to guide food choices in
individuals with compromised glucose tolerance, defects in insulin secretion or insulin
resistance. Holt et al (1997) demonstrated that insulin responses are usually proportional to
the glycemic response except for protein rich foods or bakery products, rich in fat and refined
carbohydrate.
In the present study, for the first time, an Insulin Indexfood (IIfood) value was determined for
all the test foods. IIfood value for a specified amount of food (e.g. 50g) obtained by comparing
the 2 h postprandial insulin response to given quantity of test food compared to that of same
quantity of bread is termed as the Relative Insulin Impact (RII). The amount of bread that
that gives similar response as that of the 50g of test food is expressed as Insulinemic Bread
Equivalent (IBE/50g of food).
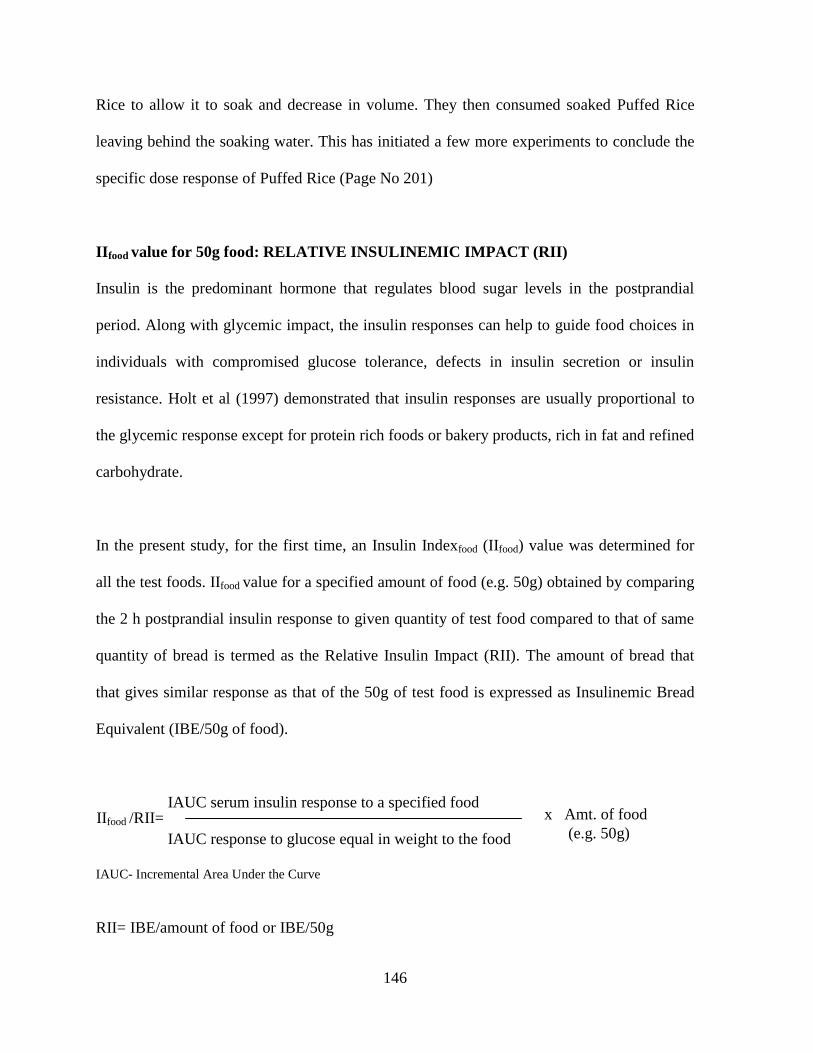
IAUC serum insulin response to a specified food
IAUC response to glucose equal in weight to the food
IAUC- Incremental Area Under the Curve
RII= IBE/amount of food or IBE/50g
IIfood /RII= x Amt. of food
(e.g. 50g)
147
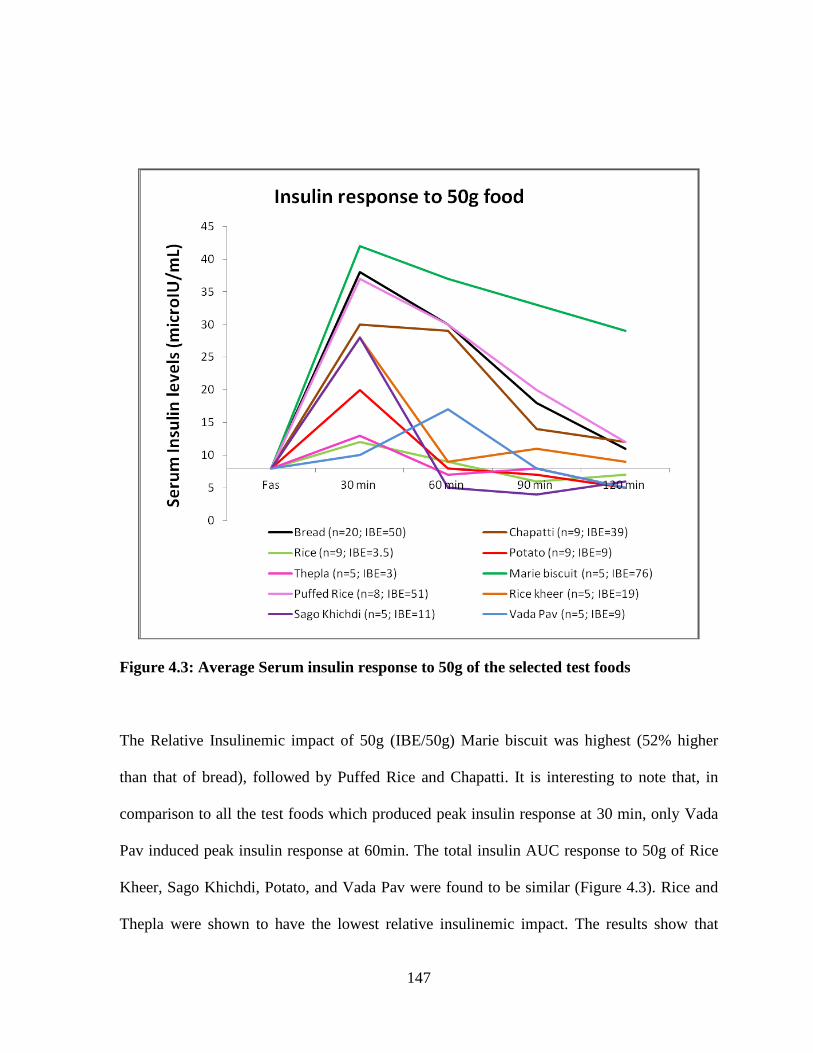
Figure 4.3: Average Serum insulin response to 50g of the selected test foods
The Relative Insulinemic impact of 50g (IBE/50g) Marie biscuit was highest (52% higher
than that of bread), followed by Puffed Rice and Chapatti. It is interesting to note that, in
comparison to all the test foods which produced peak insulin response at 30 min, only Vada
Pav induced peak insulin response at 60min. The total insulin AUC response to 50g of Rice
Kheer, Sago Khichdi, Potato, and Vada Pav were found to be similar (Figure 4.3). Rice and
Thepla were shown to have the lowest relative insulinemic impact. The results show that
148
insulin responses are not always parallel to the glycemic response and differ from one food to
another depending on their overall nutritional composition including simple sugar, protein
and fat content.
IIfood value for 100g food: RELATIVE INSULINEMIC POTENCY (RIP)
The Relative Insulinemic Potency (RIP) is the insulinemic response to test food as a
percentage of the effect of equal amount of reference food, bread wherein the amount of
bread that gives similar response as that of 100gm of test food is expressed as IBE/100g
IAUC serum insulin response to a specified food
IAUC response to glucose equal in weight to the food
RIP= IBE/100g of food
IIfood /RIP= x 100
149
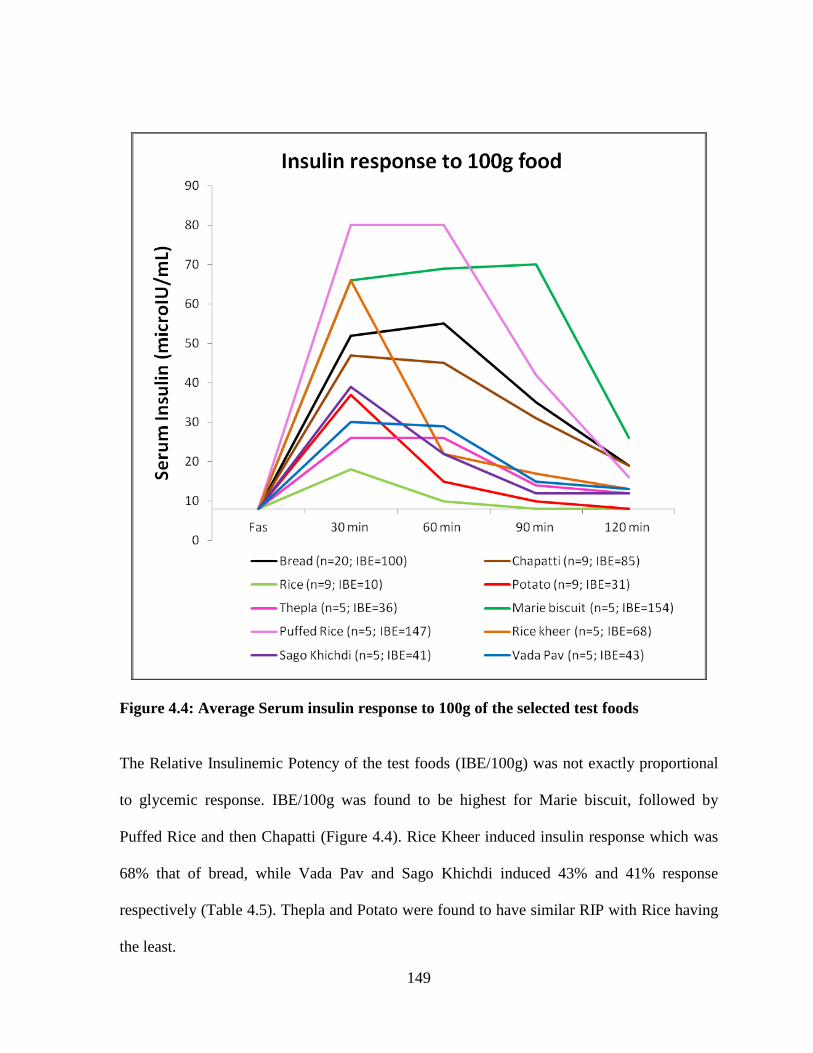
Figure 4.4: Average Serum insulin response to 100g of the selected test foods
The Relative Insulinemic Potency of the test foods (IBE/100g) was not exactly proportional
to glycemic response. IBE/100g was found to be highest for Marie biscuit, followed by
Puffed Rice and then Chapatti (Figure 4.4). Rice Kheer induced insulin response which was
68% that of bread, while Vada Pav and Sago Khichdi induced 43% and 41% response
respectively (Table 4.5). Thepla and Potato were found to have similar RIP with Rice having
the least.
150
Insulin at physiological levels has shown to reduce food intake (Schwartz 2000) but it is
largely unclear that what should be considered as normal or physiological insulin response
due to the wide range for normal insulin levels in fasting and postprandial state. Pi-Sunyer
(2002) noted that a lower incidence of diabetes has been reported amongst high carbohydrate
consuming population in certain countries despite increased insulin demand.
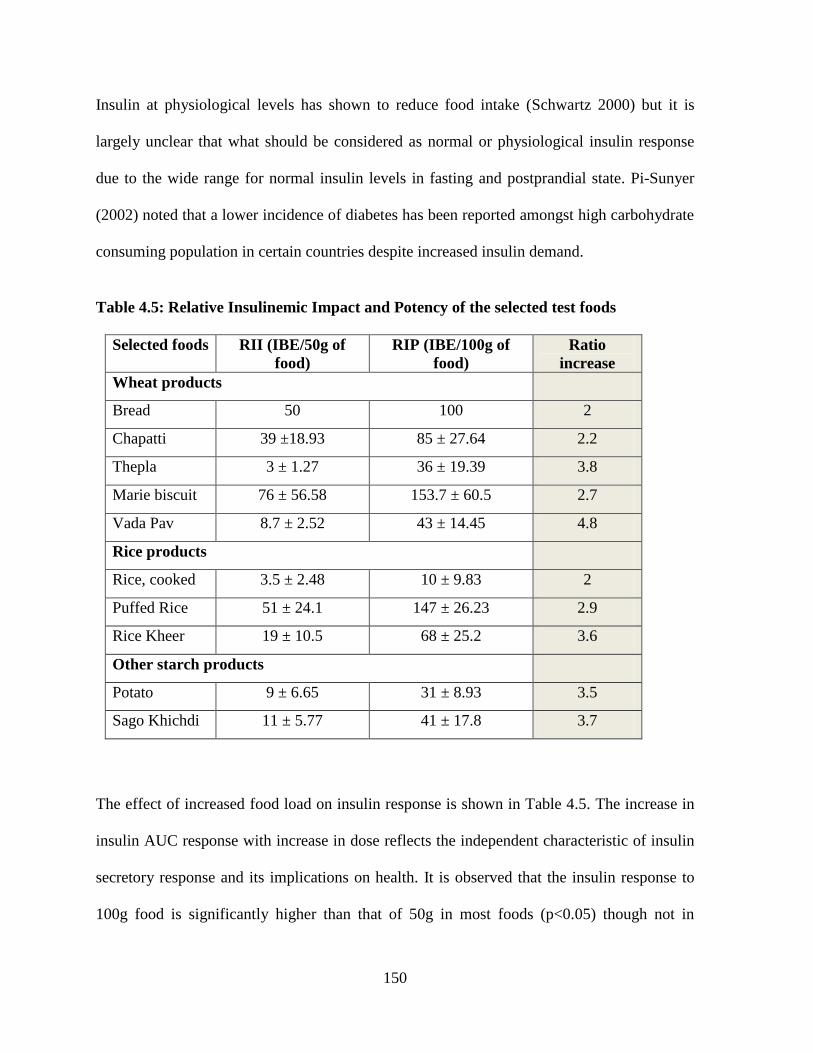
Table 4.5: Relative Insulinemic Impact and Potency of the selected test foods
Selected foods RII (IBE/50g of
food)
RIP (IBE/100g of
food)
Ratio
increase
Wheat products
Bread 50 100 2
Chapatti 39 ±18.93 85 ± 27.64 2.2
Thepla 3 ± 1.27 36 ± 19.39 3.8
Marie biscuit 76 ± 56.58 153.7 ± 60.5 2.7
Vada Pav 8.7 ± 2.52 43 ± 14.45 4.8
Rice products
Rice, cooked 3.5 ± 2.48 10 ± 9.83 2
Puffed Rice 51 ± 24.1 147 ± 26.23 2.9
Rice Kheer 19 ± 10.5 68 ± 25.2 3.6
Other starch products
Potato 9 ± 6.65 31 ± 8.93 3.5
Sago Khichdi 11 ± 5.77 41 ± 17.8 3.7
The effect of increased food load on insulin response is shown in Table 4.5. The increase in
insulin AUC response with increase in dose reflects the independent characteristic of insulin
secretory response and its implications on health. It is observed that the insulin response to
100g food is significantly higher than that of 50g in most foods (p<0.05) though not in
151
mathematically proportional rate. Lee & Wolever (1998) showed that with an increase in
amount of carbohydrate consumed from 0 to 100g, the insulin responses increase at a faster
rate than plasma glucose response indicating that insulin response is more sensitive to
changing doses. It cannot be predicted that the insulin effect expected from a 50g portion of a
particular food would be doubled by ingesting a 100g portion (Pi-Sunyer 2002). This variable
nature of insulin response can be attributed to the different nutritional composition of foods.
100g Rice Kheer, Vada Pav and Thepla produced 3–5 times higher response than that
induced by 50g dose indicating towards a possible role of proteins (i.e. milk proteins in Rice
Kheer, legume proteins in Thepla and Vada Pav) in increasing the postprandial insulin AUC.
Even 100g Potato and Sago Khichdi induced 3 times higher insulin response compared to
50g portion which may be attributed to very low fiber content that may have otherwise
attenuated the insulin response to higher food load. These findings need further investigation.
Researchers suggest that while glycemic response is responsible for only 23% variability in
insulin response other factors such as osmolality, gastric emptying, gut hormone release, and
viscosity of gut contents (Holt, Miller & Petocz 1997); antecedent diet and degree of obesity
(Bagdade, Bierman & Porte 1967); age (Barrett-Connor et al. 1996); and even sex (Nuttall et
al 1985) also play an important role in influencing insulin secretion in the body.
Protein, taken in conjunction with carbohydrate, causes an increase in insulin response while
postprandial glucose does not change much. Several studies have found that adding fat to a
carbohydrate meal also enhances insulin secretion even though the plasma glucose response
actually decreases (Nuttall et al1985, Collier, McLean & O'Dea 1984, Gannon et al 1993).
152
KEY OBSERVATIONS:
Glycemic response to foods is affected by several factors such as the starch
composition (amylose: amylopectin ratio, arrangement of starch granules), presence
of co-nutrients (moisture, protein, fat, fiber, etc), co-ingredients (e.g. legume flour,
milk, ghee, etc) and processing techniques (e.g refining of flour, cooking, roasting,
etc). This emphasizes the importance of postprandial response to whole cooked food
portions.
Besides the glycemic response, the presence of simple sugar, protein, or fat in food
also affect the insulin secretory response.
Hence, insulin response, independent of glycemic response, needs to be recorded for
insulin resistant or insulin deficient group.
GBE and IBE values are sensitive to changing doses (50g and 100g) and can be used
to predict responses to specific serving size of food.
153
CHAPATTI AND RICE
Wheat and Rice constitute the staple foods consumed in India used as raw materials for
several Indian food preparations. India is second largest consumer of wheat in the world,
averaging an annual consumption of 65,283 TMT of wheat. Rice (oryza sativa) is commonly
consumed staple cereals in India where it constitutes 60% of the total calories consumed by
the population (Mahadevamma & Tharanathan 2007) with consumption of 208g/day
(Kennedy & Burlingame 2001). Wheat and Rice are usually eaten as a part of mixed meals
and never alone.
In the present study, the GIfood value and IIfood value which is defined as blood glucose and
insulin response to test food (e.g. Chapatti and Rice) respectively, compared with equal
quantity of standard food (White bread) was determined to understand their specific
metabolic effects in the body.
The GIfood values for specific quantity (e.g. 50g) of test foods depict the Relative Glycemic
Impact (i.e. GBE/50g of food) and GIfood values for 100g food portions represent the Relative
Glycemic Potency (i.e. GBE/100g of food)
The IIfood values for specific quantity (e.g. 50g) of test foods depict the Relative Insulinemic
Impact (i.e. IBE/50g of food) and IIfood values for 100g food portions represent the Relative
Insulinemic Potency (i.e. IBE/100g of food)
154
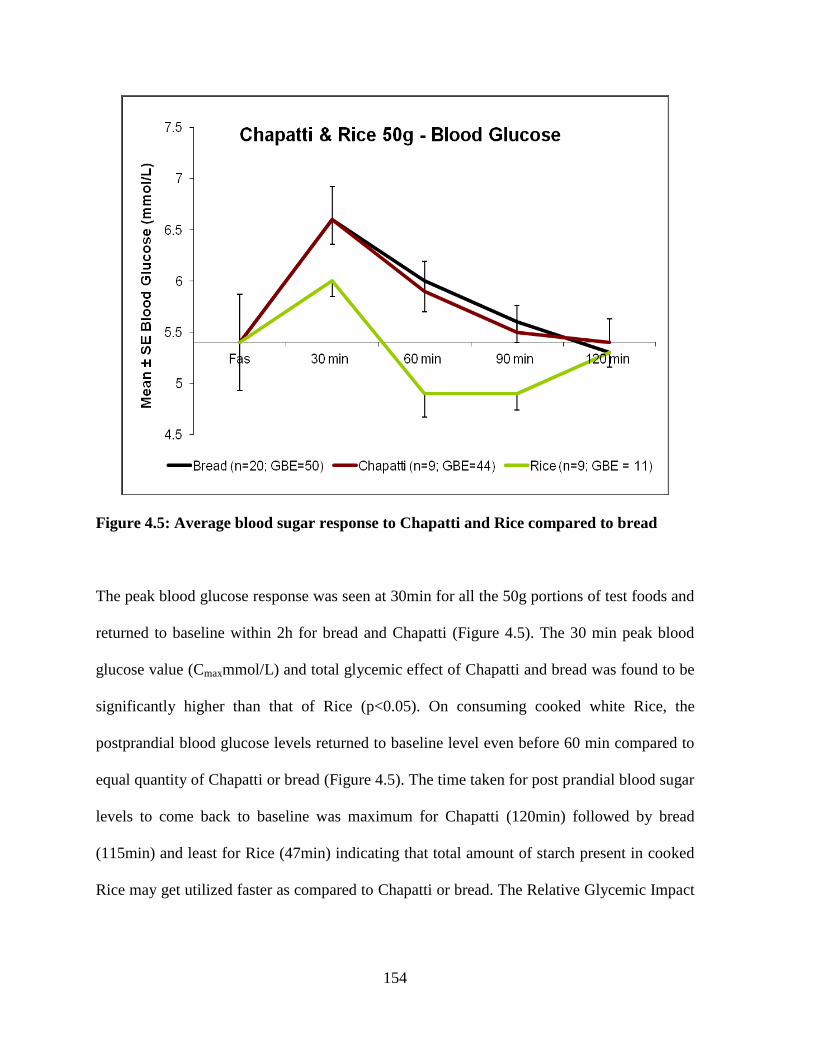
Figure 4.5: Average blood sugar response to Chapatti and Rice compared to bread
The peak blood glucose response was seen at 30min for all the 50g portions of test foods and
returned to baseline within 2h for bread and Chapatti (Figure 4.5). The 30 min peak blood
glucose value (Cmaxmmol/L) and total glycemic effect of Chapatti and bread was found to be
significantly higher than that of Rice (p<0.05). On consuming cooked white Rice, the
postprandial blood glucose levels returned to baseline level even before 60 min compared to
equal quantity of Chapatti or bread (Figure 4.5). The time taken for post prandial blood sugar
levels to come back to baseline was maximum for Chapatti (120min) followed by bread
(115min) and least for Rice (47min) indicating that total amount of starch present in cooked
Rice may get utilized faster as compared to Chapatti or bread. The Relative Glycemic Impact
155
(GBE/50g value) of Rice was significantly lower than that of same quantity of Chapatti
(p<0.01) (Figure 4.5).
Several factors may contribute to the overall blood sugar response to food, such as moisture
content, percentage of total solids, amylose to amylopectin ratios, the extent of processing,
influence of other components of the food matrix or individual gastric emptying time, etc (Pi-
Sunyer 2002).
In the present study, it was seen that the postprandial glycemic response to food increases
with an increase in the starch content of food as consumed on wet weight basis (Table 4.6),
which is similar for bread and Chapatti and much lower for cooked Rice.
Chapatti and Bread have less moisture and more concentrated starch molecules which results
in a greater total glycemic response whereas Rice with very high moisture content has lesser
amounts of total starch density (Table 4.6) and hence a lower total glycemic response as
observed in the study (Figure 4.5). In a specific amount of food when water content
increases, the total solid along with carbohydrate concentration decreases. Therefore high
water content of the food acts as energy diluent and reduces the glycemic load thereby
lowering the postprandial glycemic effect.
156
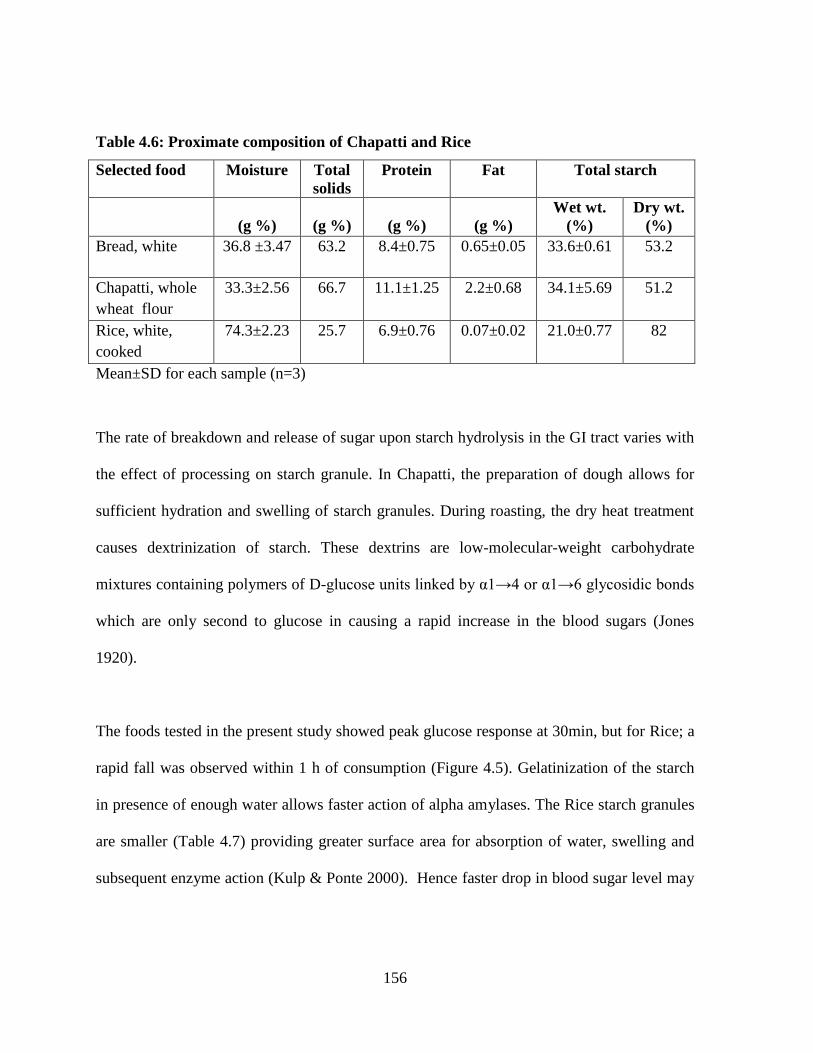
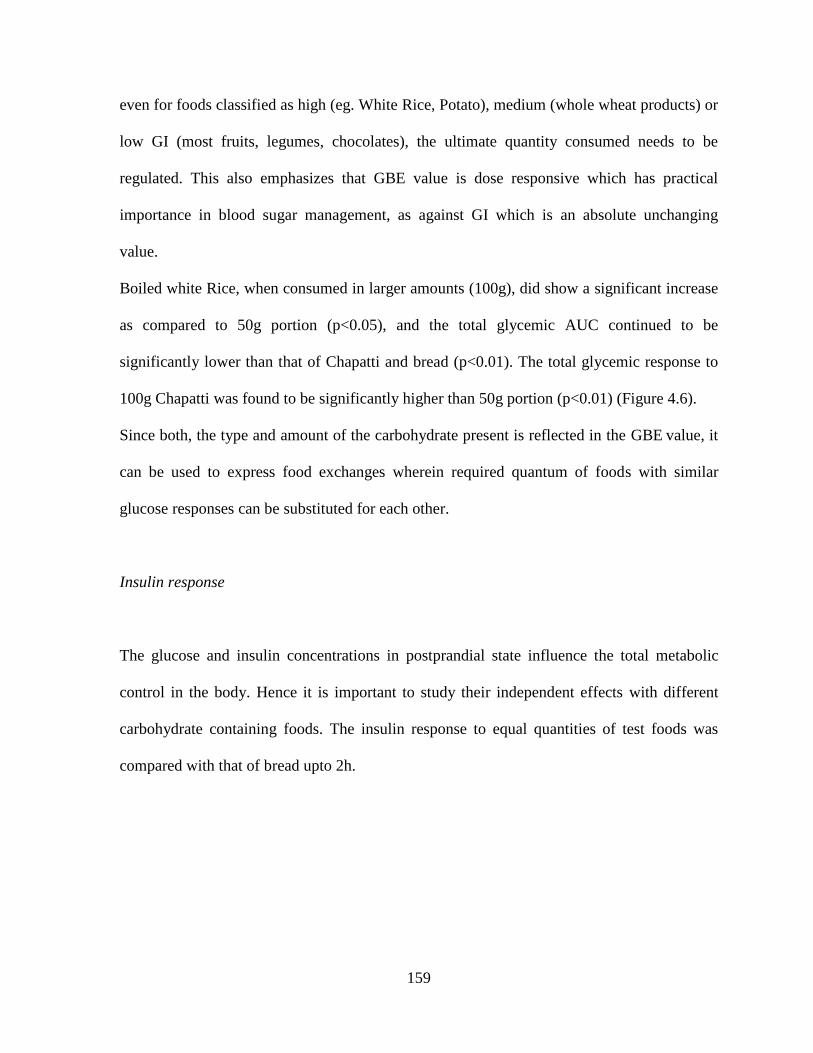
Table 4.6: Proximate composition of Chapatti and Rice
Selected food Moisture Total
solids
Protein Fat Total starch
(g %)
(g %)
(g %)
(g %)
Wet wt.
(%)
Dry wt.
(%)
Bread, white 36.8 ±3.47 63.2 8.4±0.75 0.65±0.05 33.6±0.61 53.2
Chapatti, whole
wheat flour
33.3±2.56 66.7 11.1±1.25 2.2±0.68 34.1±5.69 51.2
Rice, white,
cooked
74.3±2.23 25.7 6.9±0.76 0.07±0.02 21.0±0.77 82
Mean±SD for each sample (n=3)
The rate of breakdown and release of sugar upon starch hydrolysis in the GI tract varies with
the effect of processing on starch granule. In Chapatti, the preparation of dough allows for
sufficient hydration and swelling of starch granules. During roasting, the dry heat treatment
causes dextrinization of starch. These dextrins are low-molecular-weight carbohydrate
mixtures containing polymers of D-glucose units linked by α1→4 or α1→6 glycosidic bonds
which are only second to glucose in causing a rapid increase in the blood sugars (Jones
1920).
The foods tested in the present study showed peak glucose response at 30min, but for Rice; a
rapid fall was observed within 1 h of consumption (Figure 4.5). Gelatinization of the starch
in presence of enough water allows faster action of alpha amylases. The Rice starch granules
are smaller (Table 4.7) providing greater surface area for absorption of water, swelling and
subsequent enzyme action (Kulp & Ponte 2000). Hence faster drop in blood sugar level may
157
take place due to possible rapid absorption and utilization of smaller amount of starch present
in cooked Rice.
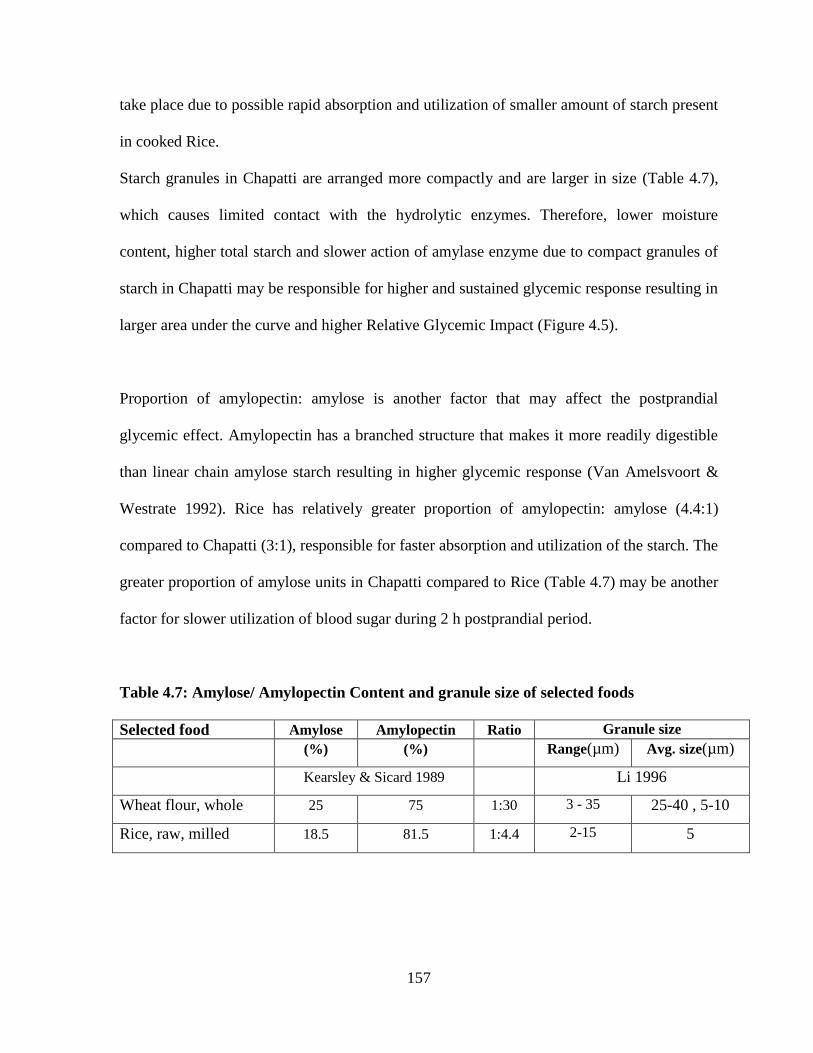
Starch granules in Chapatti are arranged more compactly and are larger in size (Table 4.7),
which causes limited contact with the hydrolytic enzymes. Therefore, lower moisture
content, higher total starch and slower action of amylase enzyme due to compact granules of
starch in Chapatti may be responsible for higher and sustained glycemic response resulting in
larger area under the curve and higher Relative Glycemic Impact (Figure 4.5).
Proportion of amylopectin: amylose is another factor that may affect the postprandial
glycemic effect. Amylopectin has a branched structure that makes it more readily digestible
than linear chain amylose starch resulting in higher glycemic response (Van Amelsvoort &
Westrate 1992). Rice has relatively greater proportion of amylopectin: amylose (4.4:1)
compared to Chapatti (3:1), responsible for faster absorption and utilization of the starch. The
greater proportion of amylose units in Chapatti compared to Rice (Table 4.7) may be another
factor for slower utilization of blood sugar during 2 h postprandial period.
Table 4.7: Amylose/ Amylopectin Content and granule size of selected foods
Selected food Amylose Amylopectin Ratio Granule size
(%) (%) Range(µm) Avg. size(µm)
Kearsley & Sicard 1989 Li 1996
Wheat flour, whole 25 75 1:30 3 - 35 25-40 , 5-10
Rice, raw, milled 18.5 81.5 1:4.4 2-15 5
158
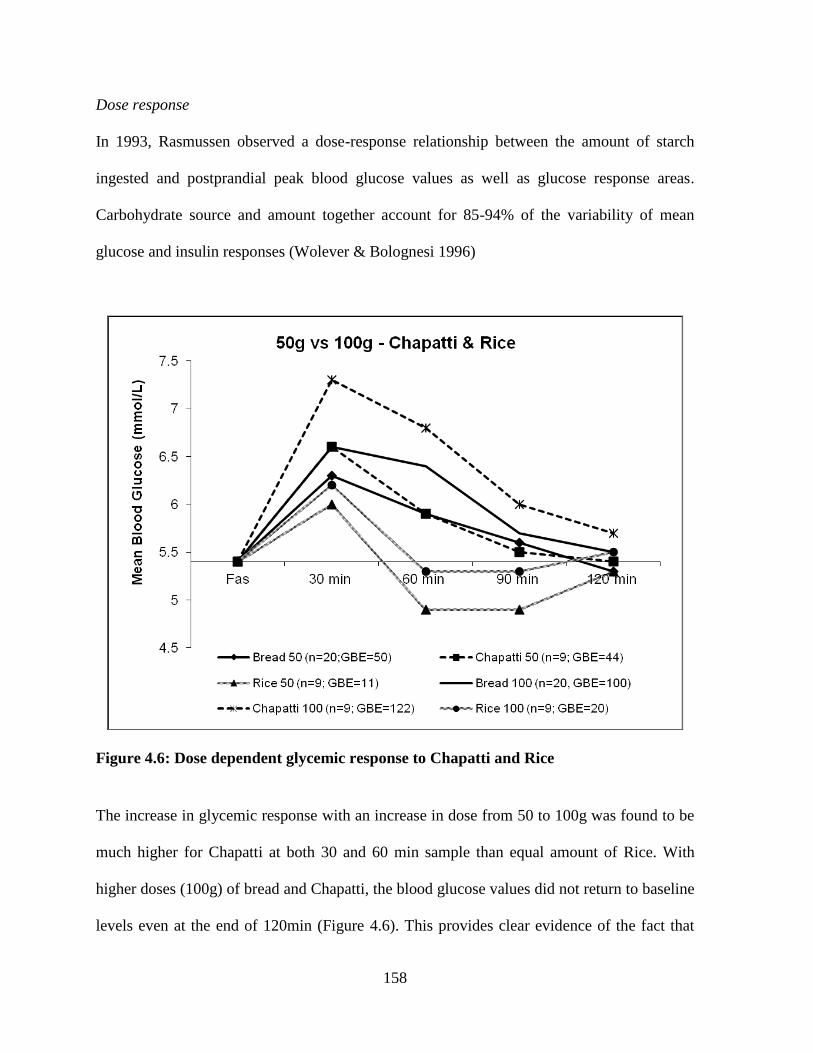
Dose response
In 1993, Rasmussen observed a dose-response relationship between the amount of starch
ingested and postprandial peak blood glucose values as well as glucose response areas.
Carbohydrate source and amount together account for 85-94% of the variability of mean
glucose and insulin responses (Wolever & Bolognesi 1996)
Figure 4.6: Dose dependent glycemic response to Chapatti and Rice
The increase in glycemic response with an increase in dose from 50 to 100g was found to be
much higher for Chapatti at both 30 and 60 min sample than equal amount of Rice. With
higher doses (100g) of bread and Chapatti, the blood glucose values did not return to baseline
levels even at the end of 120min (Figure 4.6). This provides clear evidence of the fact that
159
even for foods classified as high (eg. White Rice, Potato), medium (whole wheat products) or
low GI (most fruits, legumes, chocolates), the ultimate quantity consumed needs to be
regulated. This also emphasizes that GBE value is dose responsive which has practical
importance in blood sugar management, as against GI which is an absolute unchanging
value.
Boiled white Rice, when consumed in larger amounts (100g), did show a significant increase
as compared to 50g portion (p<0.05), and the total glycemic AUC continued to be
significantly lower than that of Chapatti and bread (p<0.01). The total glycemic response to
100g Chapatti was found to be significantly higher than 50g portion (p<0.01) (Figure 4.6).
Since both, the type and amount of the carbohydrate present is reflected in the GBE value, it
can be used to express food exchanges wherein required quantum of foods with similar
glucose responses can be substituted for each other.
Insulin response
The glucose and insulin concentrations in postprandial state influence the total metabolic
control in the body. Hence it is important to study their independent effects with different
carbohydrate containing foods. The insulin response to equal quantities of test foods was
compared with that of bread upto 2h.
160
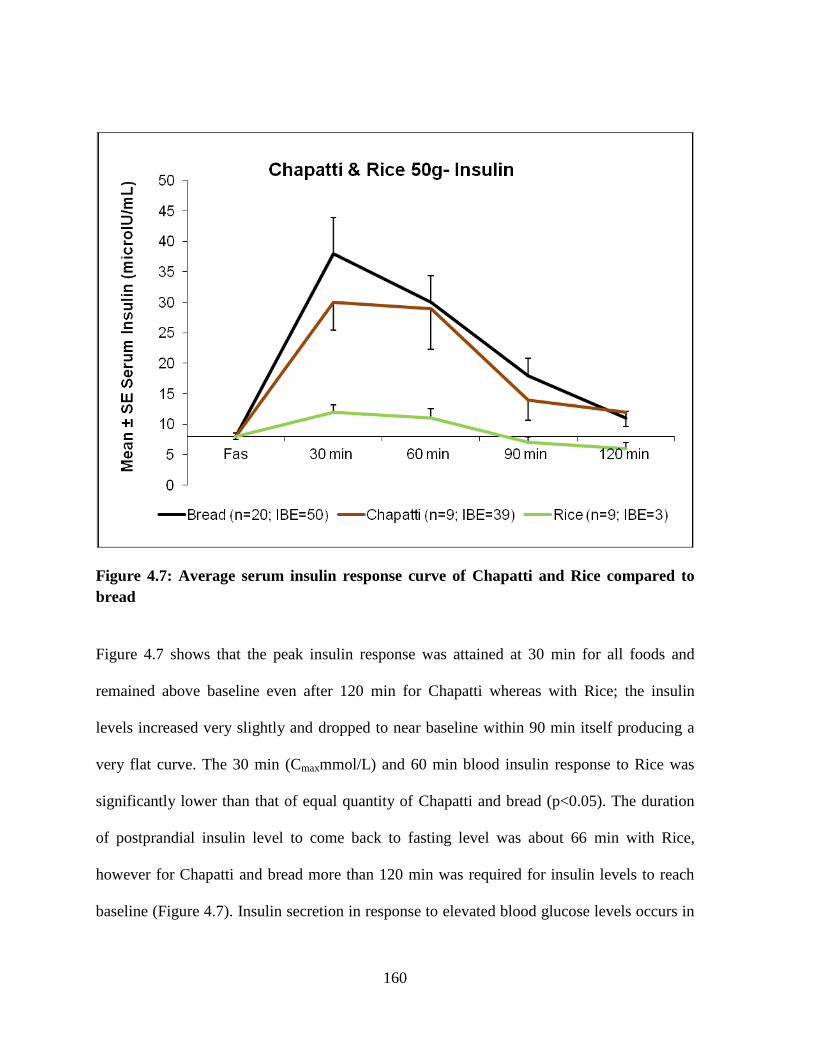
Figure 4.7: Average serum insulin response curve of Chapatti and Rice compared to
bread
Figure 4.7 shows that the peak insulin response was attained at 30 min for all foods and
remained above baseline even after 120 min for Chapatti whereas with Rice; the insulin
levels increased very slightly and dropped to near baseline within 90 min itself producing a
very flat curve. The 30 min (Cmaxmmol/L) and 60 min blood insulin response to Rice was
significantly lower than that of equal quantity of Chapatti and bread (p<0.05). The duration
of postprandial insulin level to come back to fasting level was about 66 min with Rice,
however for Chapatti and bread more than 120 min was required for insulin levels to reach
baseline (Figure 4.7). Insulin secretion in response to elevated blood glucose levels occurs in
161
larger quantities (to initiate negative feedback mechanism) and requires longer time to return
to fasting levels.
The results show that starch in Chapatti requires higher amounts of insulin to get metabolized
than same amount of cooked Rice resulting in significantly higher Relative Insulinemic
impact (IBE/50g) of Chapatti compared to Rice (p<0.01) (Figure 4.7). Generally, we
recommend Chapatti instead of Rice, which requires consideration for individuals who do
not produce sufficient insulin.
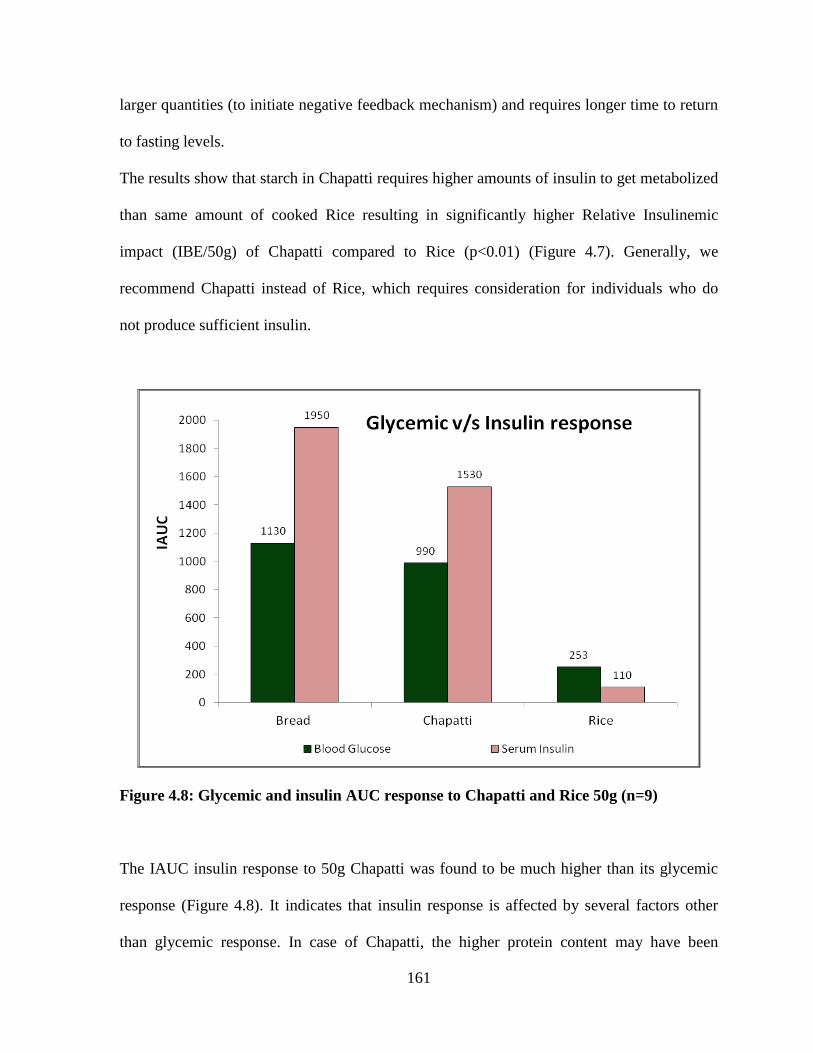
Figure 4.8: Glycemic and insulin AUC response to Chapatti and Rice 50g (n=9)
The IAUC insulin response to 50g Chapatti was found to be much higher than its glycemic
response (Figure 4.8). It indicates that insulin response is affected by several factors other
than glycemic response. In case of Chapatti, the higher protein content may have been
162
responsible for the higher insulinergic effect. Pi-Sunyer (2002) reported that protein, taken in
conjunction with carbohydrate, causes an increase in insulin response whereas postprandial
glucose does not change much.
With Rice, the glycemic AUC response was found to be higher than its insulinemic effect
(Figure 4.8) which indicates a lower stimulation for insulin secretion upon consuming Rice
and may be attributed to its very low protein and negligible fat content. The total AUC
insulin response to 50g Rice was found to be significantly lower than that of bread (p<0.01).
Dose response for insulin
The insulin area under the curve was calculated with both 50 & 100g doses to determine the
postprandial responses to varying doses. The IIfood values for specific quantity (e.g. 50g) of
test foods depict the Relative Insulinemic Impact (i.e. IBE/50g of food) and IIfood values for
100g food portions represent the Relative Insulinemic Potency (i.e. IBE/100g of food)
163
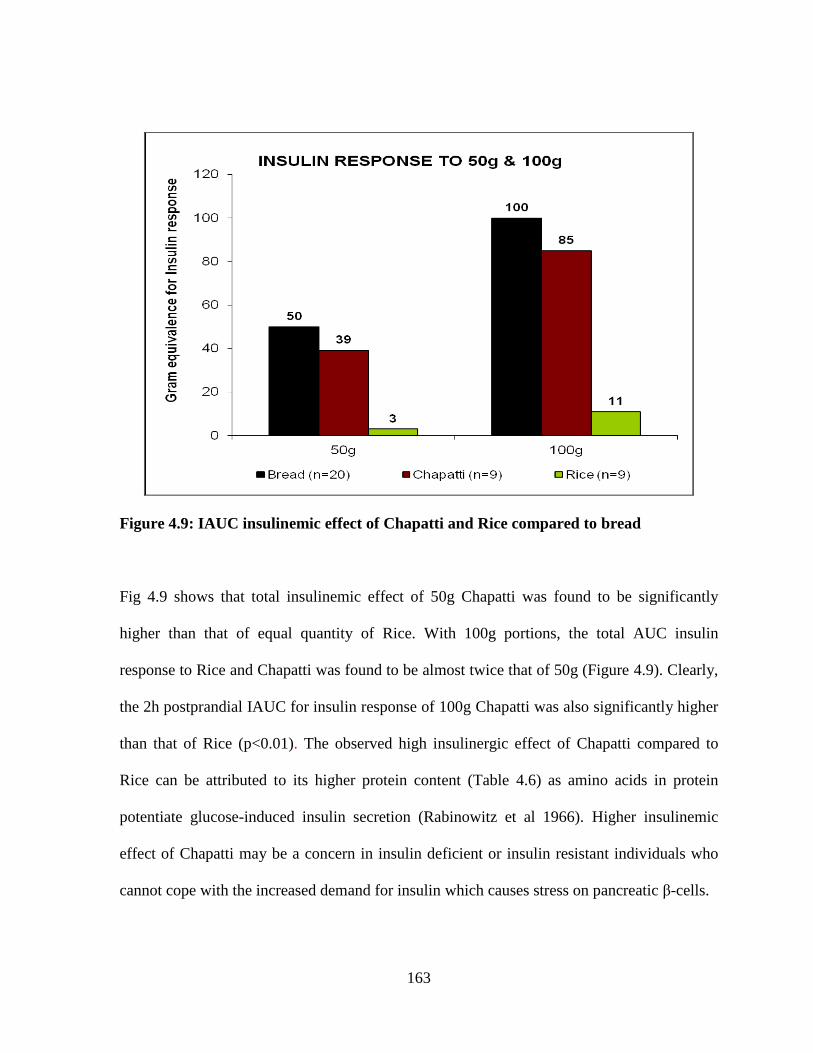
Figure 4.9: IAUC insulinemic effect of Chapatti and Rice compared to bread
Fig 4.9 shows that total insulinemic effect of 50g Chapatti was found to be significantly
higher than that of equal quantity of Rice. With 100g portions, the total AUC insulin
response to Rice and Chapatti was found to be almost twice that of 50g (Figure 4.9). Clearly,
the 2h postprandial IAUC for insulin response of 100g Chapatti was also significantly higher
than that of Rice (p<0.01). The observed high insulinergic effect of Chapatti compared to
Rice can be attributed to its higher protein content (Table 4.6) as amino acids in protein
potentiate glucose-induced insulin secretion (Rabinowitz et al 1966). Higher insulinemic
effect of Chapatti may be a concern in insulin deficient or insulin resistant individuals who
cannot cope with the increased demand for insulin which causes stress on pancreatic β-cells.
164
This stark difference observed between insulin responses of Rice and Chapatti indicates that
Rice may be a better food for insulin resistant or insulin deficient patients or addition of fiber
to Chapatti (e.g mixed flour) can help to lower the glycemic as well as insulin response.
Though it is unclear as to what can be considered as physiologically normal insulin response,
foods that increase insulin demand have detrimental effect in insulin resistant group. The
experiments done in the present study may be replicated on the glucose intolerant group as
well to understand whether their metabolic response differs greatly in this aspect.
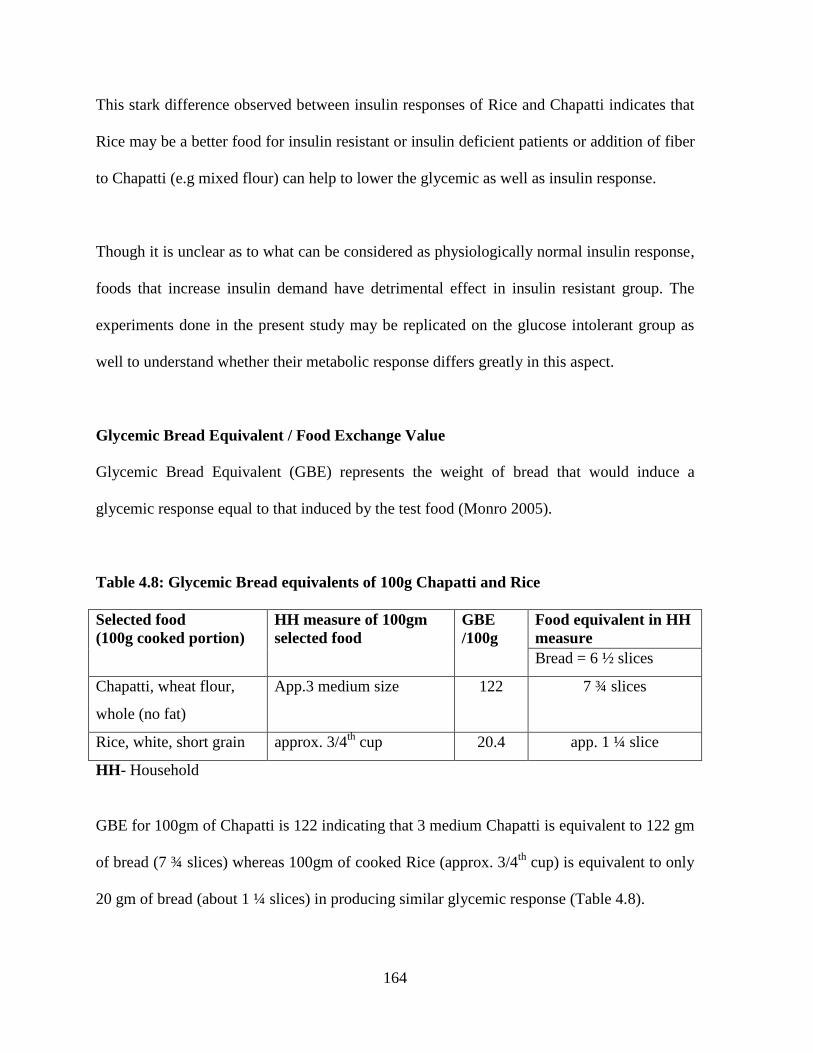
Glycemic Bread Equivalent / Food Exchange Value
Glycemic Bread Equivalent (GBE) represents the weight of bread that would induce a
glycemic response equal to that induced by the test food (Monro 2005).
Table 4.8: Glycemic Bread equivalents of 100g Chapatti and Rice
Selected food
(100g cooked portion)
HH measure of 100gm
selected food
GBE
/100g
Food equivalent in HH
measure
Bread = 6 ½ slices
Chapatti, wheat flour,
whole (no fat)
App.3 medium size 122 7 ¾ slices
Rice, white, short grain approx. 3/4th
cup 20.4 app. 1 ¼ slice
HH- Household
GBE for 100gm of Chapatti is 122 indicating that 3 medium Chapatti is equivalent to 122 gm
of bread (7 ¾ slices) whereas 100gm of cooked Rice (approx. 3/4th
cup) is equivalent to only
20 gm of bread (about 1 ¼ slices) in producing similar glycemic response (Table 4.8).

165
In terms of food exchanges, 100g of Rice has shown to produce same glycemic response as
20g of bread while same amount of Chapatti induced glycemic response similar to 122g
bread. This indicates that Chapatti produces a higher and prolonged hyperglycemia.
Using the above values for GBE/100g we can roughly estimate food exchange of the test
foods with bread. In terms of household measures,
6 ½ slices bread ≡ 2 ½ medium Chapattis ≡ 4 cups of cooked Rice
In terms of cooked food weights,
100gm bread ≡ 80gm Chapatti ≡ app. 530gms of cooked Rice
GBE for common serving measure (CSM)
The common serving sizes used differ for each food item based on its structure, size, density,
volume, etc. Hence, it is more relevant to express glycemic response in terms of food
portions practically consumed by individuals. Since GBE values are expressed in gram units
they can be used to predict responses to common serving sizes.
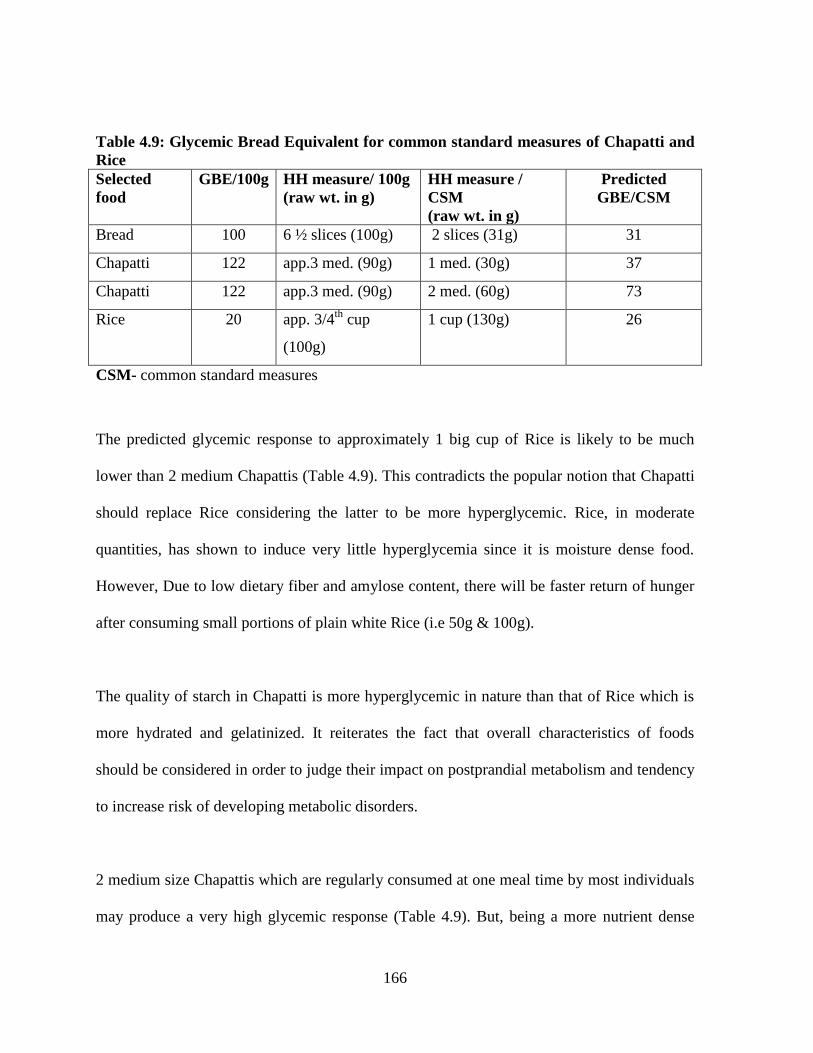
166
Table 4.9: Glycemic Bread Equivalent for common standard measures of Chapatti and
Rice
Selected
food
GBE/100g HH measure/ 100g
(raw wt. in g)
HH measure /
CSM
(raw wt. in g)
Predicted
GBE/CSM
Bread 100 6 ½ slices (100g) 2 slices (31g) 31
Chapatti 122 app.3 med. (90g) 1 med. (30g) 37
Chapatti 122 app.3 med. (90g) 2 med. (60g) 73
Rice 20 app. 3/4th
cup
(100g)
1 cup (130g) 26
CSM- common standard measures
The predicted glycemic response to approximately 1 big cup of Rice is likely to be much
lower than 2 medium Chapattis (Table 4.9). This contradicts the popular notion that Chapatti
should replace Rice considering the latter to be more hyperglycemic. Rice, in moderate
quantities, has shown to induce very little hyperglycemia since it is moisture dense food.
However, Due to low dietary fiber and amylose content, there will be faster return of hunger
after consuming small portions of plain white Rice (i.e 50g & 100g).
The quality of starch in Chapatti is more hyperglycemic in nature than that of Rice which is
more hydrated and gelatinized. It reiterates the fact that overall characteristics of foods
should be considered in order to judge their impact on postprandial metabolism and tendency
to increase risk of developing metabolic disorders.
2 medium size Chapattis which are regularly consumed at one meal time by most individuals
may produce a very high glycemic response (Table 4.9). But, being a more nutrient dense
167
food containing fiber and protein, Chapatti is favoured as more nutritious choice. Therefore,
the quantity that is consumed at one time needs to be lowered or its fiber content may be
increased by addition of other flours. This may help to taper/ flatten the postprandial
glycemia and provide greater satiety with lesser quantity eaten at one time.
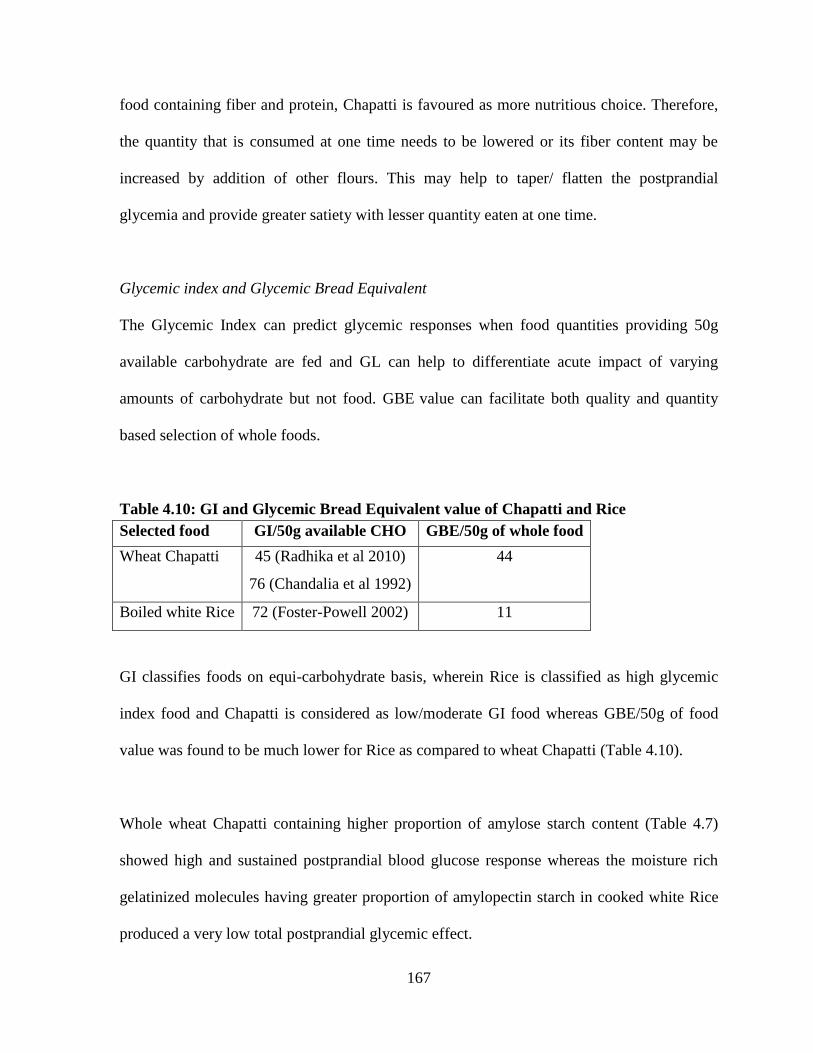
Glycemic index and Glycemic Bread Equivalent
The Glycemic Index can predict glycemic responses when food quantities providing 50g
available carbohydrate are fed and GL can help to differentiate acute impact of varying
amounts of carbohydrate but not food. GBE value can facilitate both quality and quantity
based selection of whole foods.
Table 4.10: GI and Glycemic Bread Equivalent value of Chapatti and Rice
Selected food GI/50g available CHO GBE/50g of whole food
Wheat Chapatti 45 (Radhika et al 2010)
76 (Chandalia et al 1992)
44
Boiled white Rice 72 (Foster-Powell 2002) 11
GI classifies foods on equi-carbohydrate basis, wherein Rice is classified as high glycemic
index food and Chapatti is considered as low/moderate GI food whereas GBE/50g of food
value was found to be much lower for Rice as compared to wheat Chapatti (Table 4.10).
Whole wheat Chapatti containing higher proportion of amylose starch content (Table 4.7)
showed high and sustained postprandial blood glucose response whereas the moisture rich
gelatinized molecules having greater proportion of amylopectin starch in cooked white Rice
produced a very low total postprandial glycemic effect.
168
The available sugar content of bread was found to be highest followed by Chapatti and least
for Rice (Table 4.11). According to these values, to obtain 50g available carbohydrate for GI
estimation, 157g of Chapatti (4 med.) would have to be fed to the subjects. Similarly, 252g
(about 2¼ big cups) of cooked Rice would have to be fed to obtain 50g available
carbohydrate. The present study involves direct analysis of starch, sugar and dietary fiber
content of the cooked food portions. The available carbohydrate has been calculated by
subtracting dietary fiber from total sugar values for each food. Some published data provide
carbohydrate values calculated by difference only and hence are not indicative of the
available carbohydrate content of the food. It should be noted that while calculating 50g
available carbohydrate for GI, we should be extremely careful in using values that are not
directly analytically determined.
169
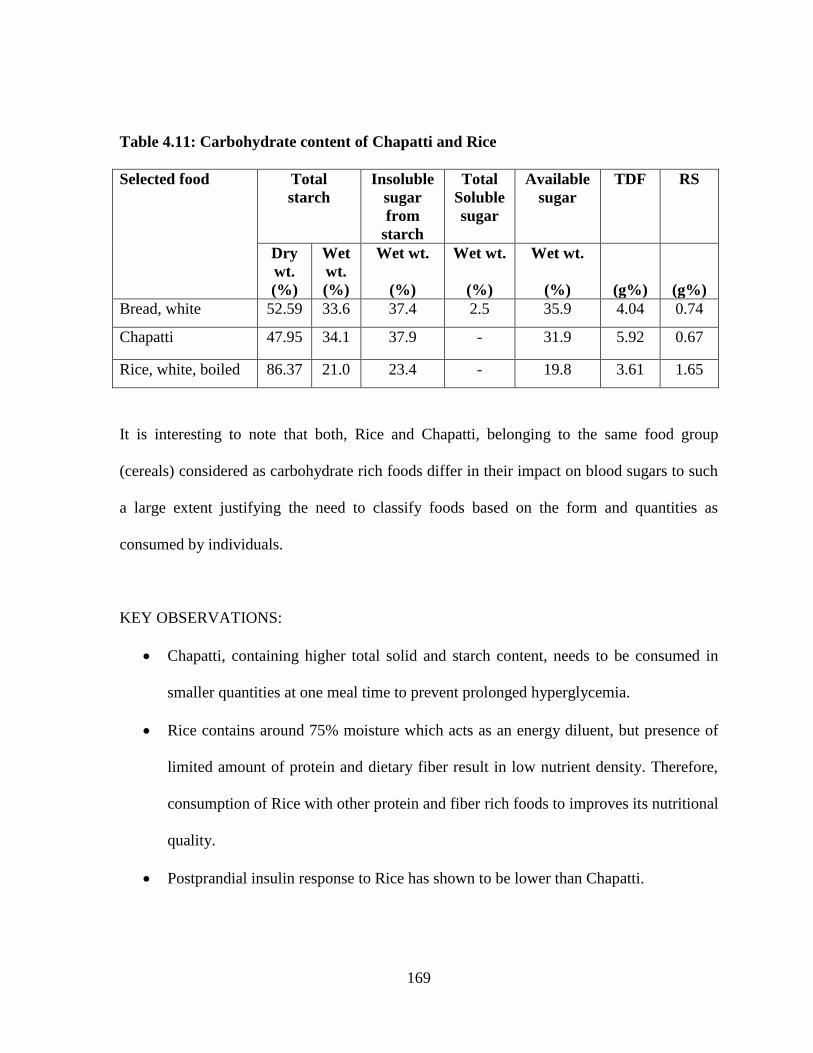
Table 4.11: Carbohydrate content of Chapatti and Rice
Selected food Total
starch
Insoluble
sugar
from
starch
Total
Soluble
sugar
Available
sugar
TDF RS
Dry
wt.
(%)
Wet
wt.
(%)
Wet wt.
(%)
Wet wt.
(%)
Wet wt.
(%)
(g%)
(g%)
Bread, white 52.59 33.6 37.4 2.5 35.9 4.04 0.74
Chapatti 47.95 34.1 37.9 - 31.9 5.92 0.67
Rice, white, boiled 86.37 21.0 23.4 - 19.8 3.61 1.65
It is interesting to note that both, Rice and Chapatti, belonging to the same food group
(cereals) considered as carbohydrate rich foods differ in their impact on blood sugars to such
a large extent justifying the need to classify foods based on the form and quantities as
consumed by individuals.
KEY OBSERVATIONS:
Chapatti, containing higher total solid and starch content, needs to be consumed in
smaller quantities at one meal time to prevent prolonged hyperglycemia.
Rice contains around 75% moisture which acts as an energy diluent, but presence of
limited amount of protein and dietary fiber result in low nutrient density. Therefore,
consumption of Rice with other protein and fiber rich foods to improves its nutritional
quality.
Postprandial insulin response to Rice has shown to be lower than Chapatti.
170
Low postprandial glycemic and insulinemic response of the whole Rice makes it a
better choice for diabetic, insulin deficient and insulin resistant group.
In order to prevent postprandial hyperglycemia, quantity is an important component
besides quality.
GBE value (expressed in gram units) can be useful for consumer friendly food
labeling and practical nutrition counseling.
GBE values are sensitive to changing doses and hence can be used to predict response
to given serving of food.
171
WHEAT PRODUCTS
India is second largest producer of wheat in the world, averaging an annual consumption of
65,283 thousand metric tons as reported by the USDA Economic and Statistics System and
the USDA/NOAA Joint Agricultural Weather Facility. Wheat kernels are ground to different
degrees yielding flour of varying thickness. Whole wheat flour retains more fiber than
refined flour.
Chapatti: Chapatti, made from whole wheat flour, has been studied to assess its postprandial
impact on glycemic and insulin response in normal healthy individuals.
Thepla: Thepla, a variant of the Chapatti, prepared from wheat flour, Bengal gram flour,
fenugreek leaves, and curds have a better nutritive value. The postprandial glycemic and
insulin responses to methi Thepla (Table 3.2) without any accompaniments have been
examined to understand its effect as compared to plain Chapatti on postprandial metabolism.
Marie biscuit: Marie biscuit, a commercially processed food, prepared from refined wheat
flour (maida), hydrogenated fat and sugar, is low in fiber and high in saturated fat. Due to its
low sweet-taste, Marie biscuit is commonly advised by Doctors and Nutritionists as light
snack for weight watchers and diabetic group.
Vada Pav: Vada Pav, one of the most popular snack or mini-meal from Maharashtra,
containing pav (burger buns), stuffed with Vada (boiled Potato coated with Bengal gram
172
flour). Vada Pav is not only a snack item but often it forms a meal for some lower middle
class group.
Vada Pav, used in the present study, was procured from a popular outlet in Mumbai selling
atleast 150,000 Vada Pav everyday (The Telegraph 30th
September 2008). This reflects the
popularity and acceptability of this snack and need to explore its nutrient composition with
respect to its satiating effect and impact on health.
Chapatti, Thepla, Marie biscuit, and Vada Pav, products of wheat flour, undergoing different
conditions of cooking and /processing, were compared for their postprandial glycemic and
insulin effect. They were categorized based on their glycemic control using the GIfood value
for 50g portion (Relative Glycemic Impact – GBE/50g of food) and for 100g portion
(Relative Glycemic Potency – GBE/100g of food).
173
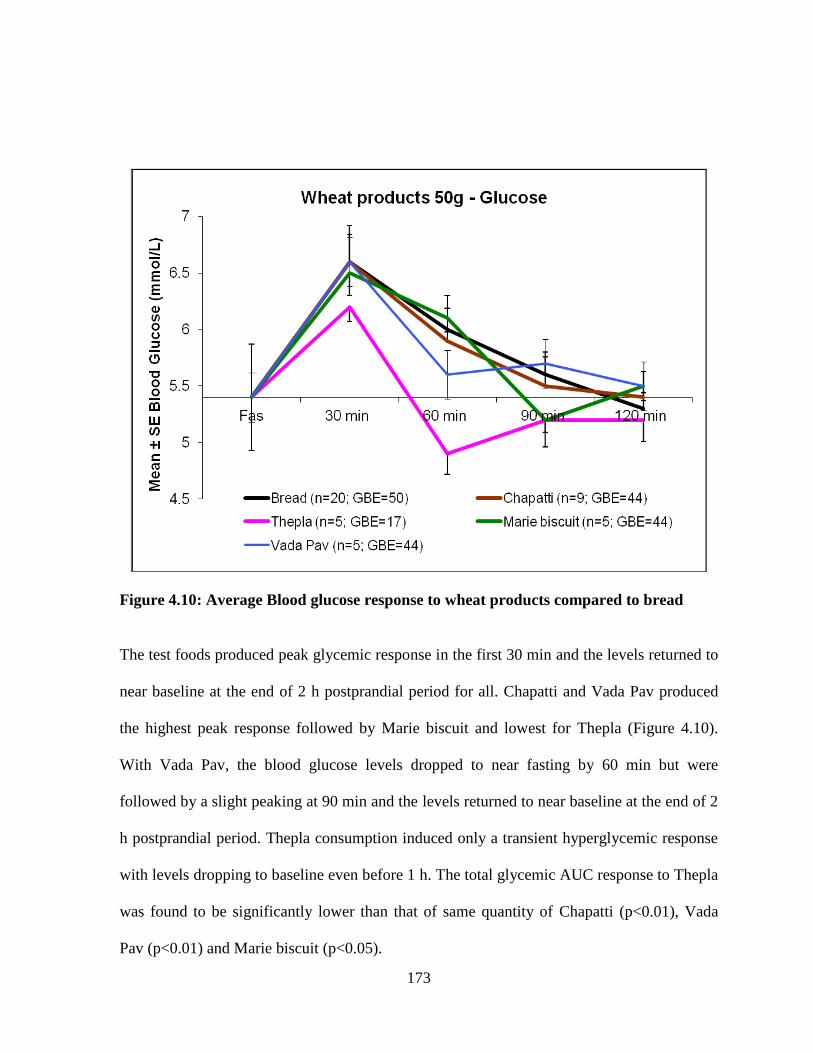
Figure 4.10: Average Blood glucose response to wheat products compared to bread
The test foods produced peak glycemic response in the first 30 min and the levels returned to
near baseline at the end of 2 h postprandial period for all. Chapatti and Vada Pav produced
the highest peak response followed by Marie biscuit and lowest for Thepla (Figure 4.10).
With Vada Pav, the blood glucose levels dropped to near fasting by 60 min but were
followed by a slight peaking at 90 min and the levels returned to near baseline at the end of 2
h postprandial period. Thepla consumption induced only a transient hyperglycemic response
with levels dropping to baseline even before 1 h. The total glycemic AUC response to Thepla
was found to be significantly lower than that of same quantity of Chapatti (p<0.01), Vada
Pav (p<0.01) and Marie biscuit (p<0.05).
174
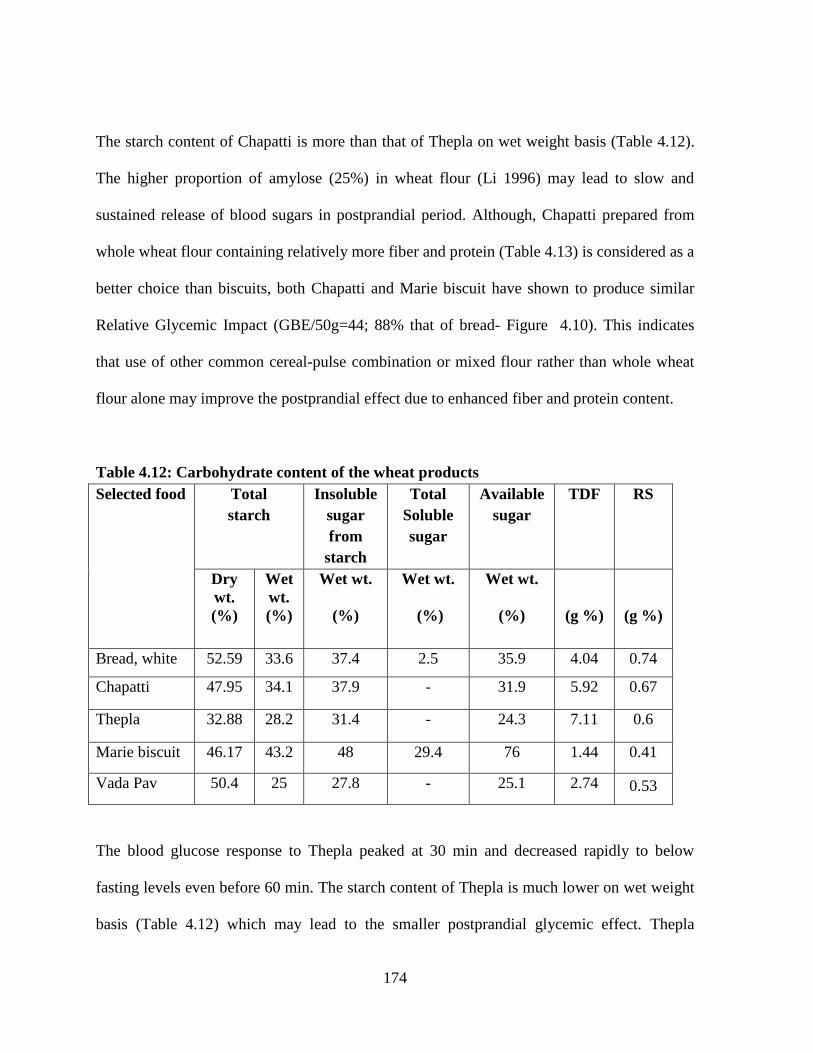
The starch content of Chapatti is more than that of Thepla on wet weight basis (Table 4.12).
The higher proportion of amylose (25%) in wheat flour (Li 1996) may lead to slow and
sustained release of blood sugars in postprandial period. Although, Chapatti prepared from
whole wheat flour containing relatively more fiber and protein (Table 4.13) is considered as a
better choice than biscuits, both Chapatti and Marie biscuit have shown to produce similar
Relative Glycemic Impact (GBE/50g=44; 88% that of bread- Figure 4.10). This indicates
that use of other common cereal-pulse combination or mixed flour rather than whole wheat
flour alone may improve the postprandial effect due to enhanced fiber and protein content.
Table 4.12: Carbohydrate content of the wheat products
Selected food
Total
starch
Insoluble
sugar
from
starch
Total
Soluble
sugar
Available
sugar
TDF RS
Dry
wt.
(%)
Wet
wt.
(%)
Wet wt.
(%)
Wet wt.
(%)
Wet wt.
(%)
(g %)
(g %)
Bread, white 52.59 33.6 37.4 2.5 35.9 4.04 0.74
Chapatti 47.95 34.1 37.9 - 31.9 5.92 0.67
Thepla 32.88 28.2 31.4 - 24.3 7.11 0.6
Marie biscuit 46.17 43.2 48 29.4 76 1.44 0.41
Vada Pav 50.4 25 27.8 - 25.1 2.74 0.53
The blood glucose response to Thepla peaked at 30 min and decreased rapidly to below
fasting levels even before 60 min. The starch content of Thepla is much lower on wet weight
basis (Table 4.12) which may lead to the smaller postprandial glycemic effect. Thepla
175
contains added fat (Table 4.13) which may also play a role in reducing glycemic response by
delaying gastric emptying time (Owen & Wolever 2003). The total AUC glycemic response
to Thepla was significantly lower than that of same quantity of bread (p<0.05).
The preparation of Thepla involves use of Bengal gram flour (25% of total weight of wheat
flour) added to whole wheat flour and small amounts of fresh fenugreek leaves. This
increases the protein and fiber (Table 4.13) content of Thepla which may be responsible for
lowering the blood glucose response to some extent. Fiber delays digestion of starch in the
stomach thereby producing a hypoglycemic effect (Nishimune et al 1991) while protein
ingestion along with carbohydrate has an effect on lowering total postprandial blood glucose
area (Spiller et al 1987). Thepla, prepared using wheat flour and legume flour, has shown to
much lower relative glycemic impact than that of Chapatti made from wheat flour alone.
Similar observations were made by Chandalia et al (1992) where the GI of Wheat flour
Chapatti (86%) was found to be much higher than that of wheat-flour + gram flour (2:1)
Chapatti (66.4%).
The lower glycemic AUC in response to legume-based foods is due to higher food viscosity
(Jenkins et al 1978), high un-absorbable carbohydrates (Jenkins et al 1976) and delayed
gastric emptying (Holt et al 1979).
176
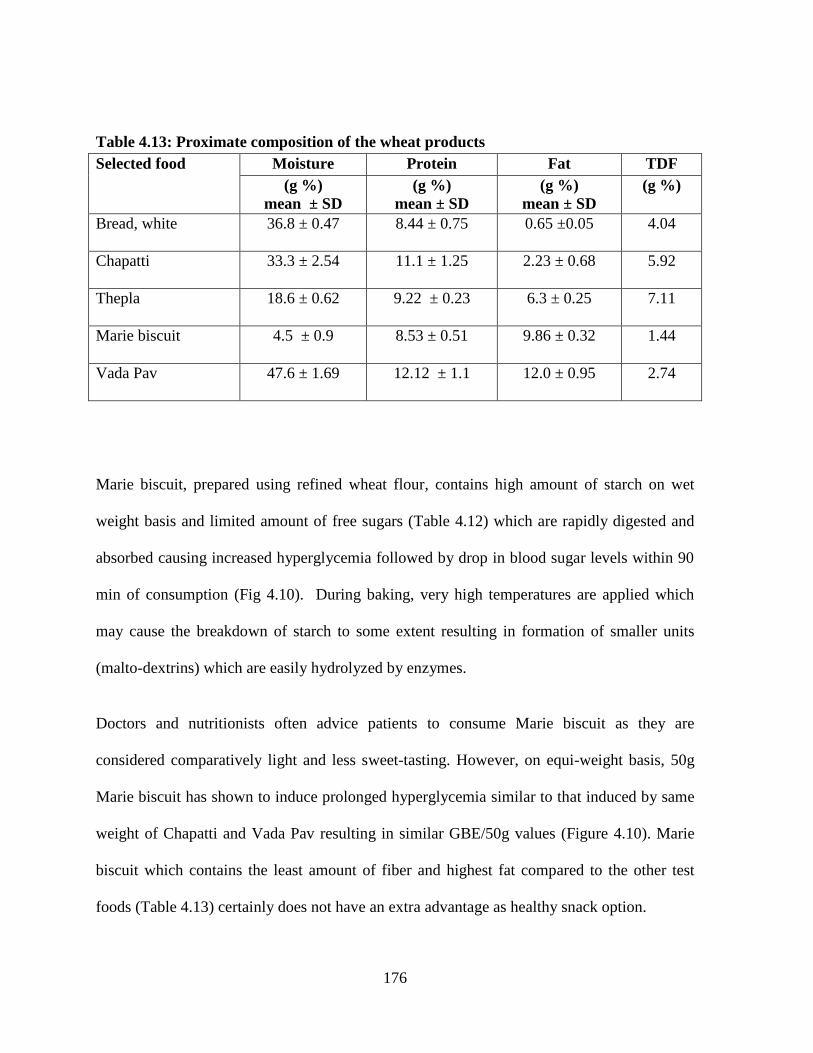
Table 4.13: Proximate composition of the wheat products
Selected food Moisture Protein Fat TDF
(g %)
mean ± SD
(g %)
mean ± SD
(g %)
mean ± SD
(g %)
Bread, white 36.8 ± 0.47 8.44 ± 0.75 0.65 ±0.05 4.04
Chapatti 33.3 ± 2.54 11.1 ± 1.25 2.23 ± 0.68 5.92
Thepla 18.6 ± 0.62 9.22 ± 0.23 6.3 ± 0.25 7.11
Marie biscuit 4.5 ± 0.9 8.53 ± 0.51 9.86 ± 0.32 1.44
Vada Pav 47.6 ± 1.69 12.12 ± 1.1 12.0 ± 0.95 2.74
Marie biscuit, prepared using refined wheat flour, contains high amount of starch on wet
weight basis and limited amount of free sugars (Table 4.12) which are rapidly digested and
absorbed causing increased hyperglycemia followed by drop in blood sugar levels within 90
min of consumption (Fig 4.10). During baking, very high temperatures are applied which
may cause the breakdown of starch to some extent resulting in formation of smaller units
(malto-dextrins) which are easily hydrolyzed by enzymes.
Doctors and nutritionists often advice patients to consume Marie biscuit as they are
considered comparatively light and less sweet-tasting. However, on equi-weight basis, 50g
Marie biscuit has shown to induce prolonged hyperglycemia similar to that induced by same
weight of Chapatti and Vada Pav resulting in similar GBE/50g values (Figure 4.10). Marie
biscuit which contains the least amount of fiber and highest fat compared to the other test
foods (Table 4.13) certainly does not have an extra advantage as healthy snack option.
177
In practical situation we may never consume 9 biscuits (50g) at one go with its lower weight:
volume ratio. So even if an individual consumes upto 4 biscuits at one time, it may not
produce a substantial rise in blood glucose concentrations. During counseling, patients with
diabetes should be explained about the need to regulate the quantity to be consumed at one
time and may be advised to use a high fiber substitute for biscuits for effective long term
management of postprandial blood sugars.
This biphasic glycemic response to Vada Pav (Figure 4.10) may be due to the presence of
Potato as well as bread in Vada Pav. The presence of Bengal gram flour (plant protein
source) used for making the Vada (batata vada) and oil (fat) used for frying of the Vada may
play a role in tapering down the glycemic effect to some extent compared to plain white
bread. Although the starch (wet weight basis) and available sugar content of Vada Pav is
similar to that of Thepla, the higher dietary fiber content of Thepla may be the reason for its
lower glycemic response as compared to Vada Pav.
178
Dose response
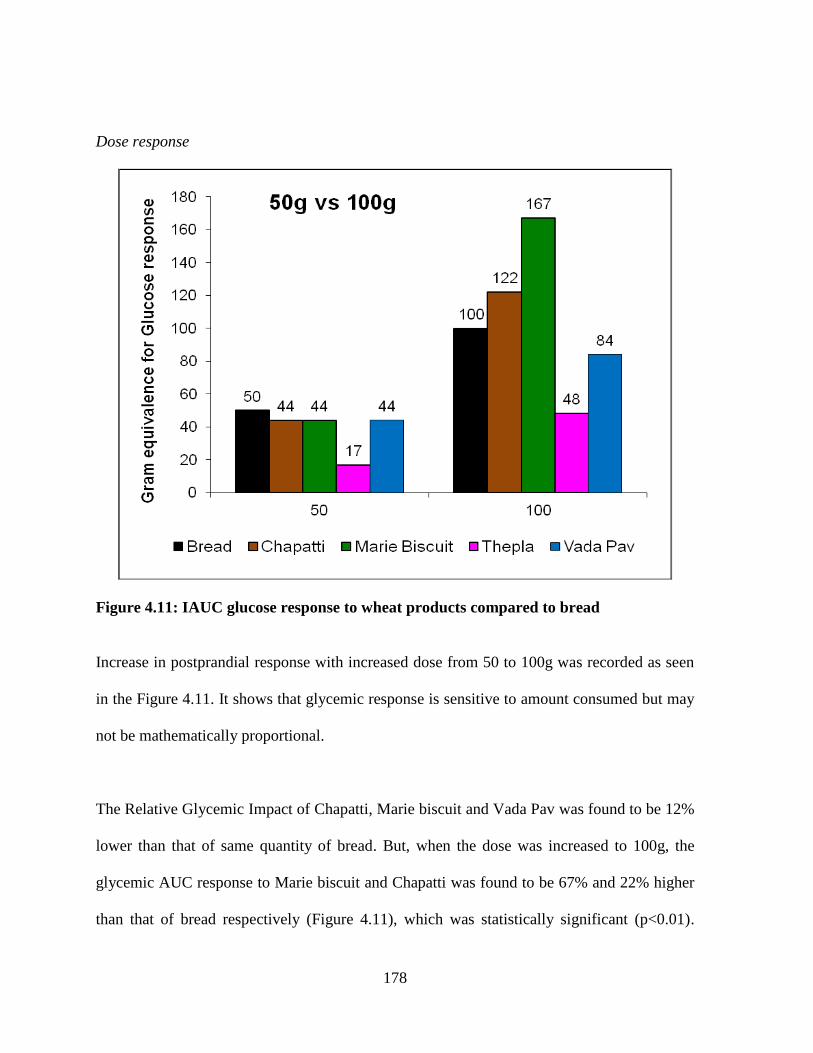
Figure 4.11: IAUC glucose response to wheat products compared to bread
Increase in postprandial response with increased dose from 50 to 100g was recorded as seen
in the Figure 4.11. It shows that glycemic response is sensitive to amount consumed but may
not be mathematically proportional.
The Relative Glycemic Impact of Chapatti, Marie biscuit and Vada Pav was found to be 12%
lower than that of same quantity of bread. But, when the dose was increased to 100g, the
glycemic AUC response to Marie biscuit and Chapatti was found to be 67% and 22% higher
than that of bread respectively (Figure 4.11), which was statistically significant (p<0.01).
179
The Relative Glycemic Potency (GBE/100g) of Thepla and Vada Pav was 52% and 16%
lower than that of equal amounts of bread respectively. 100g Thepla produced significantly
lower total glycemic AUC response compared to same quantity of Chapatti and Marie biscuit
(p<0.01).
Insulin response
Insulin is an important biosynthetic hormone with high levels in the postprandial state
exercising long-term harmful effects on the metabolism. The insulin secretory response to
foods has been studied such that food components that favour maintenance of normal insulin
secretion are emphasized. The IIfood values for specific quantity (e.g. 50g) of test foods depict
the Relative Insulinemic Impact (i.e. IBE/50g of food) and IIfood values for 100g food
portions represent the Relative Insulinemic Potency (i.e. IBE/100g of food)
180
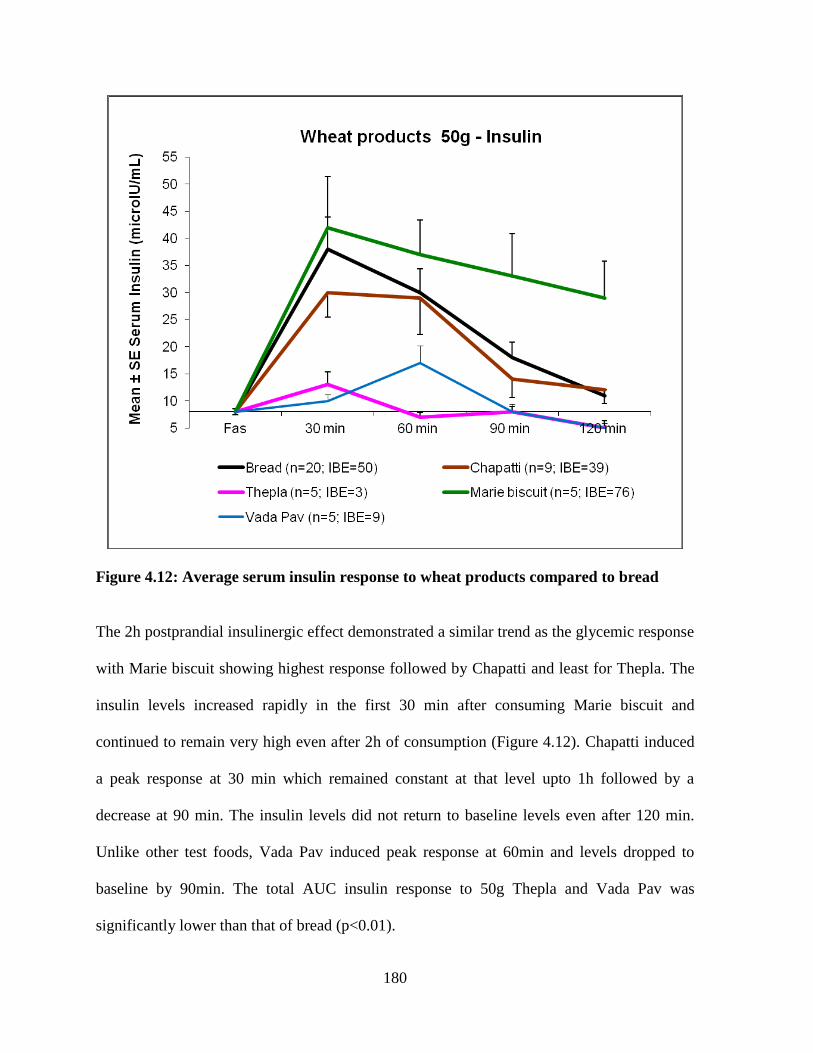
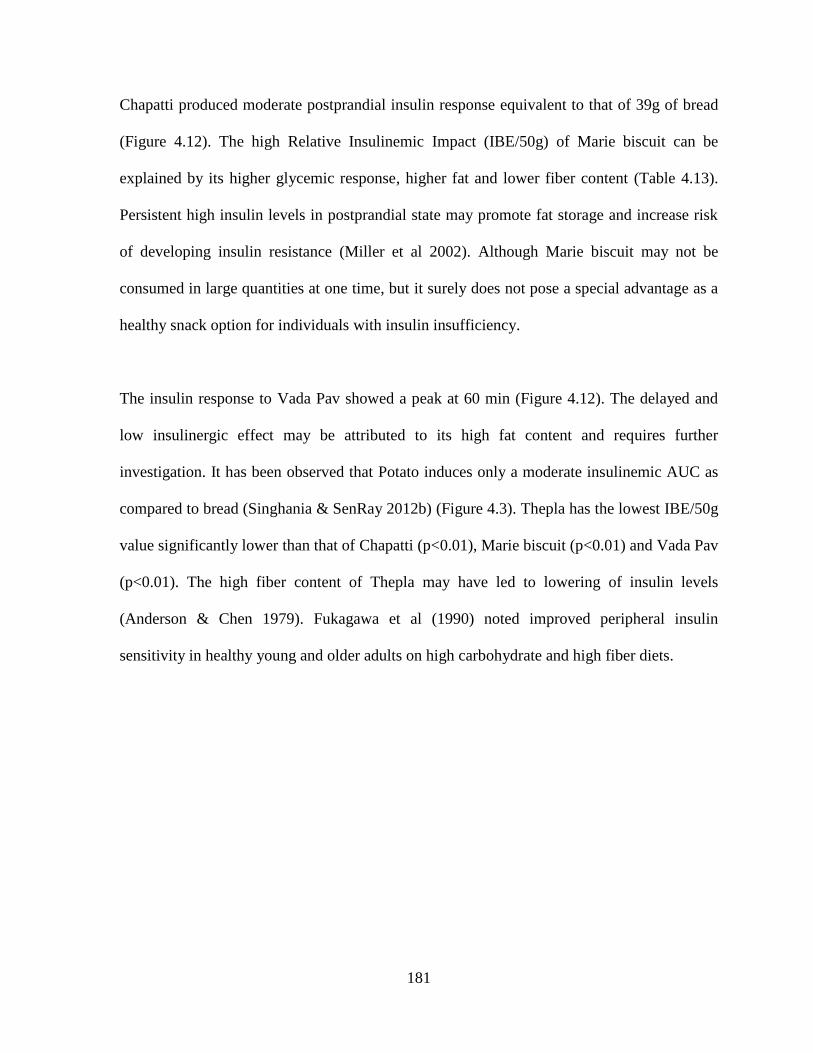
Figure 4.12: Average serum insulin response to wheat products compared to bread
The 2h postprandial insulinergic effect demonstrated a similar trend as the glycemic response
with Marie biscuit showing highest response followed by Chapatti and least for Thepla. The
insulin levels increased rapidly in the first 30 min after consuming Marie biscuit and
continued to remain very high even after 2h of consumption (Figure 4.12). Chapatti induced
a peak response at 30 min which remained constant at that level upto 1h followed by a
decrease at 90 min. The insulin levels did not return to baseline levels even after 120 min.
Unlike other test foods, Vada Pav induced peak response at 60min and levels dropped to
baseline by 90min. The total AUC insulin response to 50g Thepla and Vada Pav was
significantly lower than that of bread (p<0.01).
181
Chapatti produced moderate postprandial insulin response equivalent to that of 39g of bread
(Figure 4.12). The high Relative Insulinemic Impact (IBE/50g) of Marie biscuit can be
explained by its higher glycemic response, higher fat and lower fiber content (Table 4.13).
Persistent high insulin levels in postprandial state may promote fat storage and increase risk
of developing insulin resistance (Miller et al 2002). Although Marie biscuit may not be
consumed in large quantities at one time, but it surely does not pose a special advantage as a
healthy snack option for individuals with insulin insufficiency.
The insulin response to Vada Pav showed a peak at 60 min (Figure 4.12). The delayed and
low insulinergic effect may be attributed to its high fat content and requires further
investigation. It has been observed that Potato induces only a moderate insulinemic AUC as
compared to bread (Singhania & SenRay 2012b) (Figure 4.3). Thepla has the lowest IBE/50g
value significantly lower than that of Chapatti (p<0.01), Marie biscuit (p<0.01) and Vada Pav
(p<0.01). The high fiber content of Thepla may have led to lowering of insulin levels
(Anderson & Chen 1979). Fukagawa et al (1990) noted improved peripheral insulin
sensitivity in healthy young and older adults on high carbohydrate and high fiber diets.
182
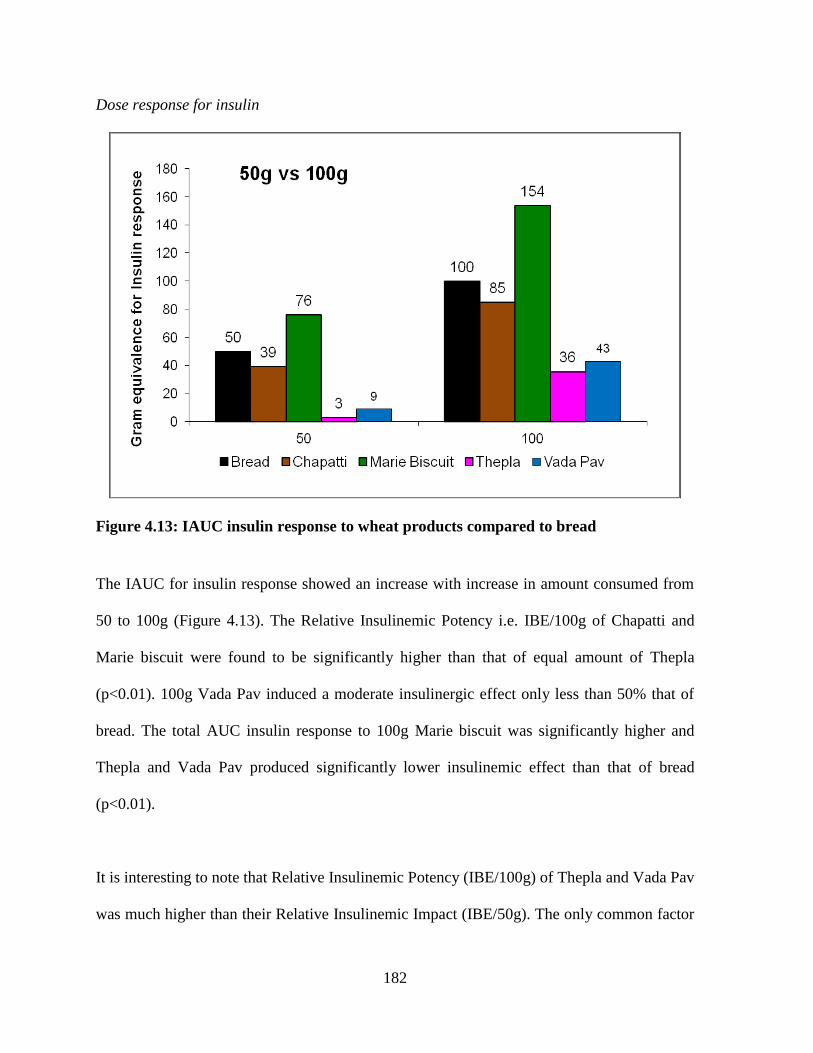
Dose response for insulin
Figure 4.13: IAUC insulin response to wheat products compared to bread
The IAUC for insulin response showed an increase with increase in amount consumed from
50 to 100g (Figure 4.13). The Relative Insulinemic Potency i.e. IBE/100g of Chapatti and
Marie biscuit were found to be significantly higher than that of equal amount of Thepla
(p<0.01). 100g Vada Pav induced a moderate insulinergic effect only less than 50% that of
bread. The total AUC insulin response to 100g Marie biscuit was significantly higher and
Thepla and Vada Pav produced significantly lower insulinemic effect than that of bread
(p<0.01).
It is interesting to note that Relative Insulinemic Potency (IBE/100g) of Thepla and Vada Pav
was much higher than their Relative Insulinemic Impact (IBE/50g). The only common factor
183
between the two foods is the use of Bengal gram flour. In 1992, Chandalia, Neogi & Mehta
have shown similar results wherein gram-flour and wheat+gram flour containing Chapattis
had higher insulin response compared to plain wheat flour ones. It is possible that gram-flour
stimulates insulin secretion because of its amino acid composition (more lysine), which is
different from that of cereals like wheat (more methionine).
From the point of view of postprandial metabolic response in terms of equi-quantity basis,
Thepla seem to the most favourable food compared to Vada Pav, Chapatti and Marie biscuit
since it produces lower glycemic and insulinergic effect. This could be attributed to several
factors other than just the carbohydrate such as presence of protein, fat and fiber. In
comparison to the plain Chapatti made using whole wheat flour, the addition of Bengal gram
flour, fenugreek and fat in Thepla created a balanced meal that can be easily consumed by the
glucose intolerant as well as insulin resistant individuals without stressing the metabolism.
FOOD EXCHANGE VALUE
Glycemic Bread Equivalent (GBE) represents the weight of bread that would induce a
glycemic response equal to that induced by the test food (Monro 2005).
184
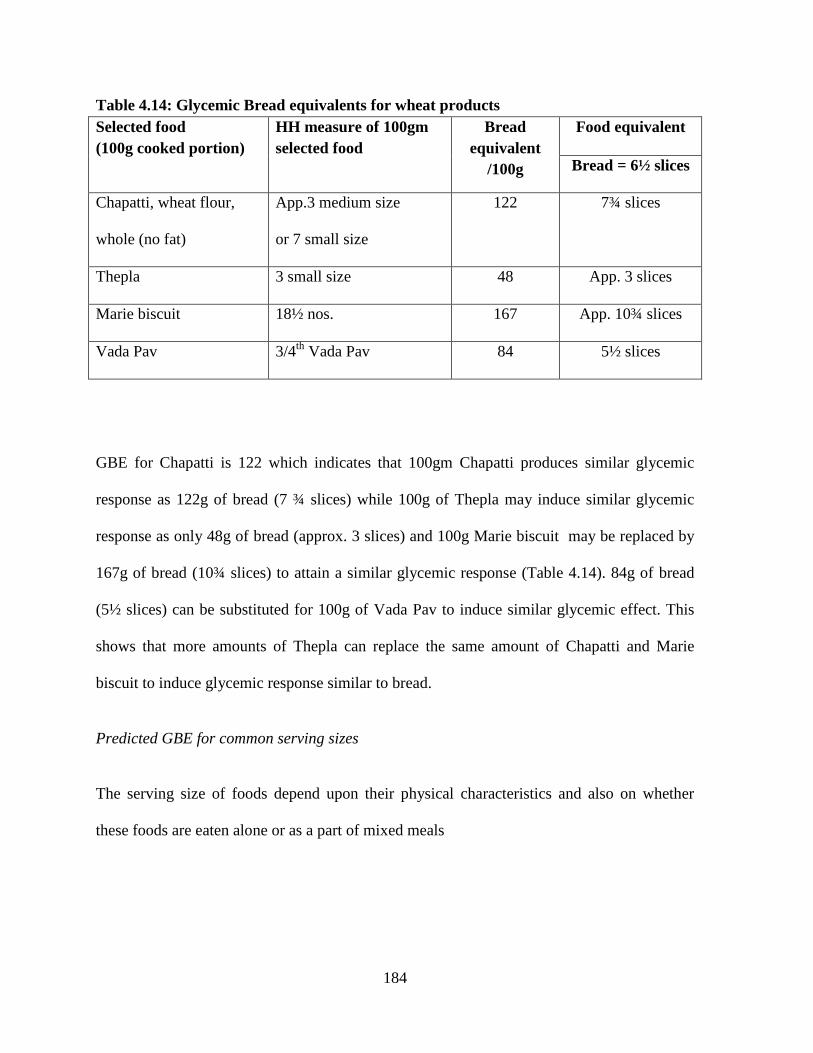
Table 4.14: Glycemic Bread equivalents for wheat products
Selected food
(100g cooked portion)
HH measure of 100gm
selected food
Bread
equivalent
/100g
Food equivalent
Bread = 6½ slices
Chapatti, wheat flour,
whole (no fat)
App.3 medium size
or 7 small size
122 7¾ slices
Thepla 3 small size 48 App. 3 slices
Marie biscuit 18½ nos. 167 App. 10¾ slices
Vada Pav 3/4th
Vada Pav 84 5½ slices
GBE for Chapatti is 122 which indicates that 100gm Chapatti produces similar glycemic
response as 122g of bread (7 ¾ slices) while 100g of Thepla may induce similar glycemic
response as only 48g of bread (approx. 3 slices) and 100g Marie biscuit may be replaced by
167g of bread (10¾ slices) to attain a similar glycemic response (Table 4.14). 84g of bread
(5½ slices) can be substituted for 100g of Vada Pav to induce similar glycemic effect. This
shows that more amounts of Thepla can replace the same amount of Chapatti and Marie
biscuit to induce glycemic response similar to bread.
Predicted GBE for common serving sizes
The serving size of foods depend upon their physical characteristics and also on whether
these foods are eaten alone or as a part of mixed meals
185
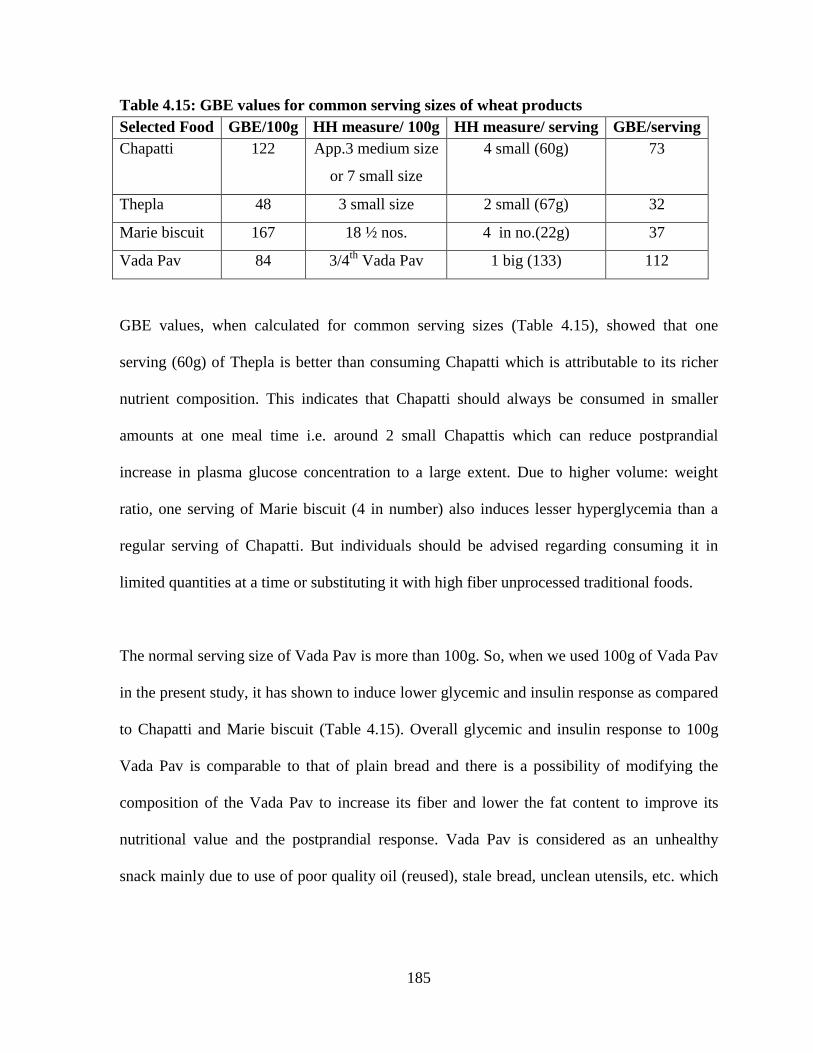
Table 4.15: GBE values for common serving sizes of wheat products
Selected Food GBE/100g HH measure/ 100g HH measure/ serving GBE/serving
Chapatti 122 App.3 medium size
or 7 small size
4 small (60g) 73
Thepla 48 3 small size 2 small (67g) 32
Marie biscuit 167 18 ½ nos. 4 in no.(22g) 37
Vada Pav 84 3/4th
Vada Pav 1 big (133) 112
GBE values, when calculated for common serving sizes (Table 4.15), showed that one
serving (60g) of Thepla is better than consuming Chapatti which is attributable to its richer
nutrient composition. This indicates that Chapatti should always be consumed in smaller
amounts at one meal time i.e. around 2 small Chapattis which can reduce postprandial
increase in plasma glucose concentration to a large extent. Due to higher volume: weight
ratio, one serving of Marie biscuit (4 in number) also induces lesser hyperglycemia than a
regular serving of Chapatti. But individuals should be advised regarding consuming it in
limited quantities at a time or substituting it with high fiber unprocessed traditional foods.
The normal serving size of Vada Pav is more than 100g. So, when we used 100g of Vada Pav
in the present study, it has shown to induce lower glycemic and insulin response as compared
to Chapatti and Marie biscuit (Table 4.15). Overall glycemic and insulin response to 100g
Vada Pav is comparable to that of plain bread and there is a possibility of modifying the
composition of the Vada Pav to increase its fiber and lower the fat content to improve its
nutritional value and the postprandial response. Vada Pav is considered as an unhealthy
snack mainly due to use of poor quality oil (reused), stale bread, unclean utensils, etc. which
186
further cause deterioration of its nutritional quality. The present study has shown that the
protein and fat content is relatively high (Table 4.13) and seems to delay return of hunger.
KEY OBSERVATIONS:
Wheat starch contains higher proportion of amylose units which allows slow release
of blood sugars but the various processing techniques used in preparation of wheat
products lead to modification of the starch characteristic and overall nutritional
composition.
The co-nutrients and co-ingredients present in the products also affect the
postprandial glycemic and insulin response to a large extent.
Amongst the four wheat products, methi Thepla attains a more superior nutritional
composition with a balance of all nutrients and can be a better choice for dietary
management of postprandial hyperglycemia.
187
RICE PRODUCTS
Glycemic and Insulinemic responses to rice and rice products
Rice: Rice (oryza sativa) is one of the most commonly consumed staple cereals in India
constituting 60% of the total calories consumed (Mahadevamma and Tharanathan, 2007). GI
of white Rice has been reported as ranging from 54 to 121 when bread (GI=100) is used as
reference (Jenkins et al., 1981). The wide variation in values could be attributed to
differences in cooking methods, amount of water added, amylose content, temperature at
which it is served etc, beside the variety of Rice tested.
Rice is consumed as a whole and not just the available carbohydrate in it. Therefore the
response to a specific type of Rice will depend on its moisture content in boiled/cooked form
besides the portion size consumed.
Puffed Rice: Puffed Rice (kadle puri), traditionally prepared by popping unpolished raw
Rice, undergoes structural modification due to processing, altering the starch structure and its
functionality.
Rice Kheer: Rice Kheer, prepared from rice cooked in evaporated full fat milk, has a semi-
solid consistency. It is a popular sweet dish in India where milk (protein) and sugar (sucrose)
are the co-ingredients of Rice.
188
The effect of added co-ingredients and food load were studied on postprandial glycemic and
insulinemic responses to Boiled white Rice, Puffed Rice as well as Rice Kheer and compared
to same amount of standard, white bread.
GIfood value for a specific food quantity, also known as Relative glycemic impact (RGI), is
the postprandial glycemic response of given food (Boiled white Rice, Puffed Rice and Rice
Kheer) quantity consumed in a single intake (here, 50g) compared to same quantity of bread
and is expressed as the Glycemic Bread Equivalent (GBE/50g of food). Similarly, GIfood
value for 100g also termed as Relative glycemic potency (RGP), is the glycemic response to
100g of food (Boiled white Rice, Puffed Rice and Rice Kheer) as a percentage of the effect
of equal amount of bread and is expressed as GBE/100g of food.
189
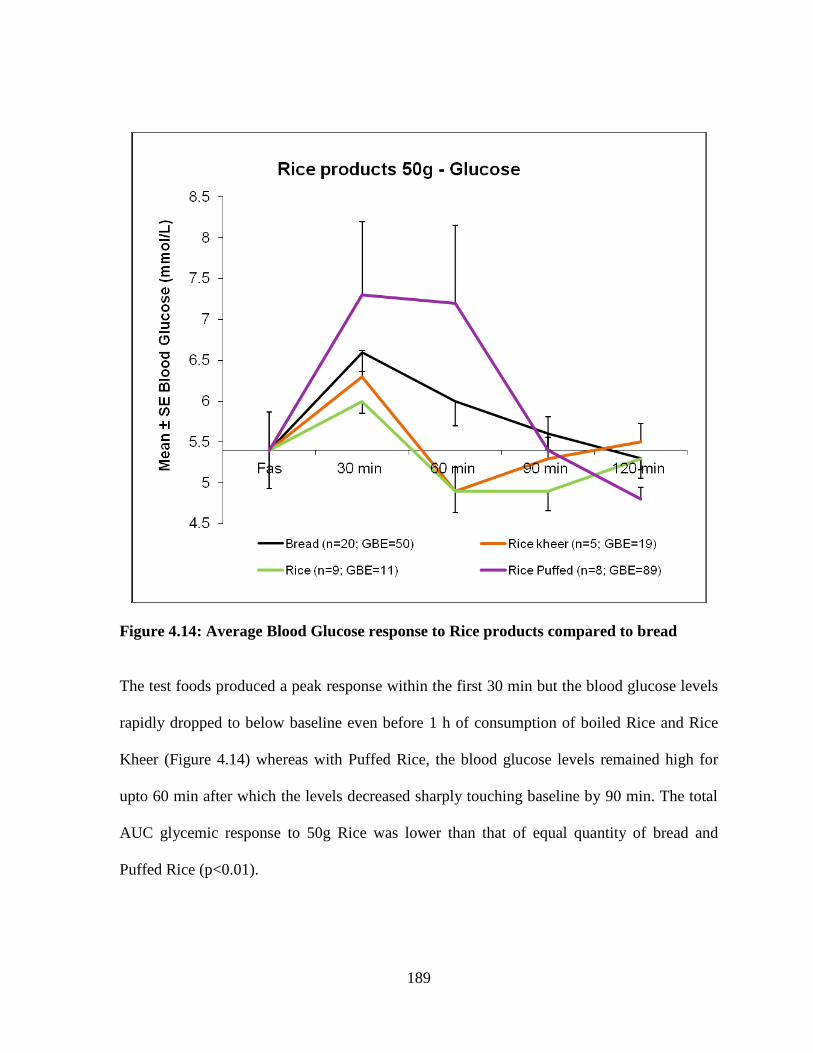
Figure 4.14: Average Blood Glucose response to Rice products compared to bread
The test foods produced a peak response within the first 30 min but the blood glucose levels
rapidly dropped to below baseline even before 1 h of consumption of boiled Rice and Rice
Kheer (Figure 4.14) whereas with Puffed Rice, the blood glucose levels remained high for
upto 60 min after which the levels decreased sharply touching baseline by 90 min. The total
AUC glycemic response to 50g Rice was lower than that of equal quantity of bread and
Puffed Rice (p<0.01).
190
The starch granules in Rice undergo gelatinization upon cooking with water with loss of
birefringence resulting in more swollen starch granules which provide greater surface area
for enzyme action. This may lead to faster breakdown, absorption and utilization of sugars
resulting in small hyperglycemic effect for plain boiled Rice.
The postprandial glycemic response to 50g Rice Kheer also showed a peak at 30 min with a
drop in levels to fasting within 1 h. While plain boiled Rice has starch content of 21.42 g%,
Rice Kheer contains only 5.52 g% starch with rest of the solid made up of soluble added
sugar (Table 4.16). This may be responsible for the slightly higher Relative Glycemic Impact
(GBE/50g) of Rice Kheer as compared to Rice (Figure 4.13). The lower total IAUC glycemic
response to Rice Kheer, which is a sweetened product, compared to same amount of non
sweet tasting foods such as bread and Puffed Rice (p<0.05) highlights the importance of total
quantity and type of sugar consumed in control of postprandial hyperglycemia.
191
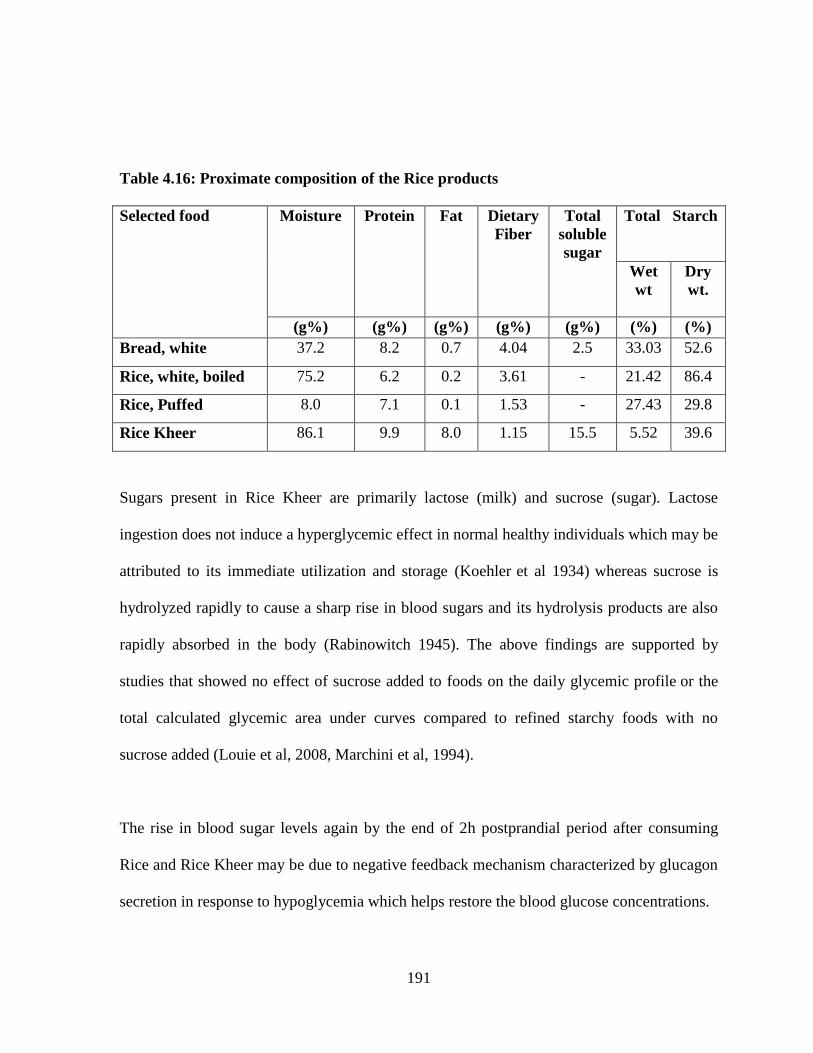
Table 4.16: Proximate composition of the Rice products
Selected food
Moisture Protein Fat Dietary
Fiber
Total
soluble
sugar
Total Starch
Wet
wt
Dry
wt.
(g%) (g%) (g%) (g%) (g%) (%) (%)
Bread, white 37.2 8.2 0.7 4.04 2.5 33.03 52.6
Rice, white, boiled 75.2 6.2 0.2 3.61 - 21.42 86.4
Rice, Puffed 8.0 7.1 0.1 1.53 - 27.43 29.8
Rice Kheer 86.1 9.9 8.0 1.15 15.5 5.52 39.6
Sugars present in Rice Kheer are primarily lactose (milk) and sucrose (sugar). Lactose
ingestion does not induce a hyperglycemic effect in normal healthy individuals which may be
attributed to its immediate utilization and storage (Koehler et al 1934)
whereas sucrose is
hydrolyzed rapidly to cause a sharp rise in blood sugars and its hydrolysis products are also
rapidly absorbed in the body (Rabinowitch 1945). The above findings are supported by
studies that showed no effect of sucrose added to foods on the daily glycemic profile or the
total calculated glycemic area under curves compared to refined starchy foods with no
sucrose added (Louie et al, 2008, Marchini et al, 1994).
The rise in blood sugar levels again by the end of 2h postprandial period after consuming
Rice and Rice Kheer may be due to negative feedback mechanism characterized by glucagon
secretion in response to hypoglycemia which helps restore the blood glucose concentrations.
192
Puffed Rice (50g) produced peak and total glycemic response much higher than same amount
of standard food bread and returned back to fasting level before end of 90 min (Figure 4.13).
The high temperature exposure during extrusion of Puffed Rice results in loss of moisture
(Table 4.16) and breakdown of starch to short-chain glucose units (dextrins) which are more
readily absorbed. Puffed Rice has shown to have in vitro digestibility value of approx. 83%
with high amounts of damaged starch which imbibes more water increasing its susceptibility
to amylolysis (Mahadevamma & Tharanathan, 2007). The total glycemic AUC response to
50g Puffed Rice which is non-sweet tasting was found to be significantly higher than that of
same quantity of Rice Kheer (p< 0.05) which is indeed a sweet dish.
DOSE RESPONSE
The effect of varying amounts of foods on the glycemic response was observed by feeding
50g (Relative Glycemic Impact) and 100g (Relative Glycemic Potency) portions of the test
foods and standard. The total AUC glycemic effect of the foods are presented in the graph
below (Figure 4.15)
193
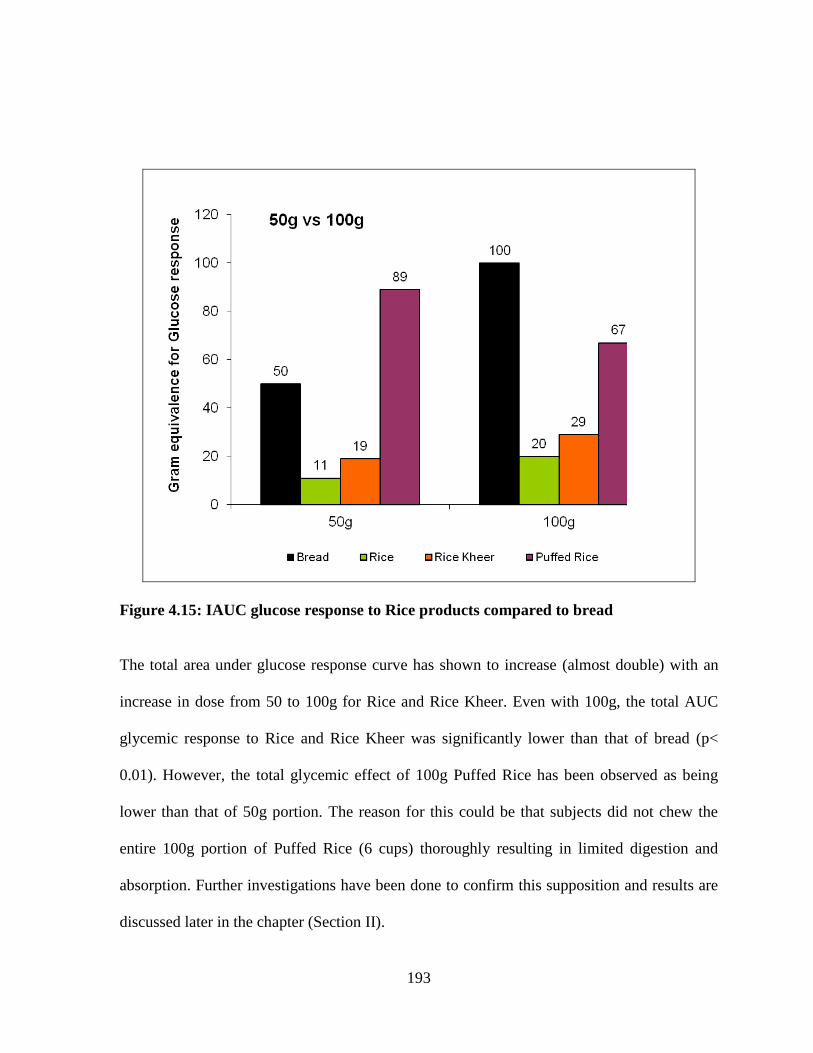
Figure 4.15: IAUC glucose response to Rice products compared to bread
The total area under glucose response curve has shown to increase (almost double) with an
increase in dose from 50 to 100g for Rice and Rice Kheer. Even with 100g, the total AUC
glycemic response to Rice and Rice Kheer was significantly lower than that of bread (p<
0.01). However, the total glycemic effect of 100g Puffed Rice has been observed as being
lower than that of 50g portion. The reason for this could be that subjects did not chew the
entire 100g portion of Puffed Rice (6 cups) thoroughly resulting in limited digestion and
absorption. Further investigations have been done to confirm this supposition and results are
discussed later in the chapter (Section II).
194
Insulin response
Postprandial glycemic effect of food is directly controlled by the level of insulin secretion.
Bonora (2005) reported that 30-40% of normal subjects from general population are insulin
resistant which acts as an independent risk factor for cardiovascular diseases. A U- shaped
relationship exists between both fasting and 2 h postprandial insulin responses and all-cause
mortality with low and high concentrations being associated with an increased risk,
independent of other risk factors (Balkau & Eschwege 1999).
IIfood value for a specific food quantity, also known as Relative Insulinemic impact (RII), is
the postprandial insulin response of given food (Boiled white Rice, Puffed Rice and Rice
Kheer) quantity consumed in a single intake (here, 50g) compared to same quantity of bread
and is expressed as the Insulinemic Bread Equivalent (IBE/50g of food). Similarly, IIfood
value for 100g also termed as Relative Insulinemic potency (RIP), is the insulin response to
100g of food (Boiled white Rice, Puffed Rice and Rice Kheer) as a percentage of the effect
of equal amount of bread and is expressed as IBE/100g of food.
195
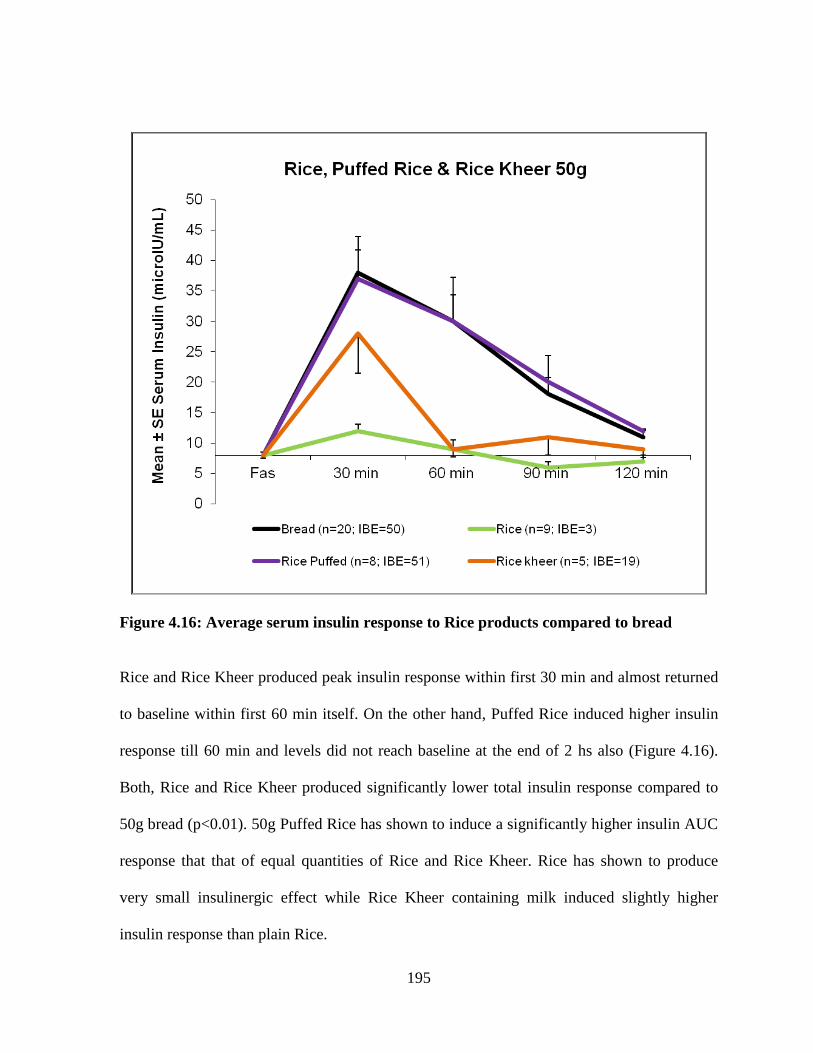
Figure 4.16: Average serum insulin response to Rice products compared to bread
Rice and Rice Kheer produced peak insulin response within first 30 min and almost returned
to baseline within first 60 min itself. On the other hand, Puffed Rice induced higher insulin
response till 60 min and levels did not reach baseline at the end of 2 hs also (Figure 4.16).
Both, Rice and Rice Kheer produced significantly lower total insulin response compared to
50g bread (p<0.01). 50g Puffed Rice has shown to induce a significantly higher insulin AUC
response that that of equal quantities of Rice and Rice Kheer. Rice has shown to produce
very small insulinergic effect while Rice Kheer containing milk induced slightly higher
insulin response than plain Rice.
196
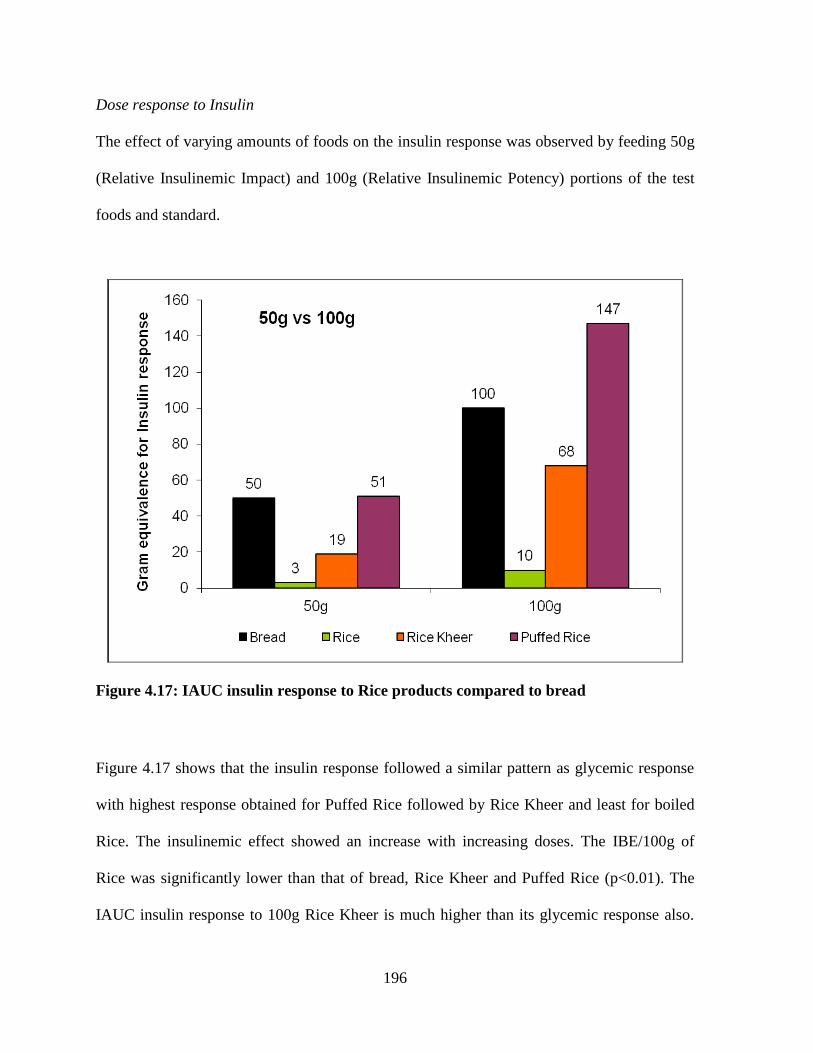
Dose response to Insulin
The effect of varying amounts of foods on the insulin response was observed by feeding 50g
(Relative Insulinemic Impact) and 100g (Relative Insulinemic Potency) portions of the test
foods and standard.
Figure 4.17: IAUC insulin response to Rice products compared to bread
Figure 4.17 shows that the insulin response followed a similar pattern as glycemic response
with highest response obtained for Puffed Rice followed by Rice Kheer and least for boiled
Rice. The insulinemic effect showed an increase with increasing doses. The IBE/100g of
Rice was significantly lower than that of bread, Rice Kheer and Puffed Rice (p<0.01). The
IAUC insulin response to 100g Rice Kheer is much higher than its glycemic response also.
197
This disproportionately high insulinergic effect may be attributed to insulinotropic properties
of milk proteins (Nilsson et al 2004). Milk protein, especially the whey fraction, is insulin
secretagogue in nature. Milk products are generally considered as low GI but milk has shown
to produce higher Insulin Index in healthy subjects (Östman, Elmståhl & Björck 2001,
Liljeberg & Bjorck 2001, Schezenmeir et al. 1989).
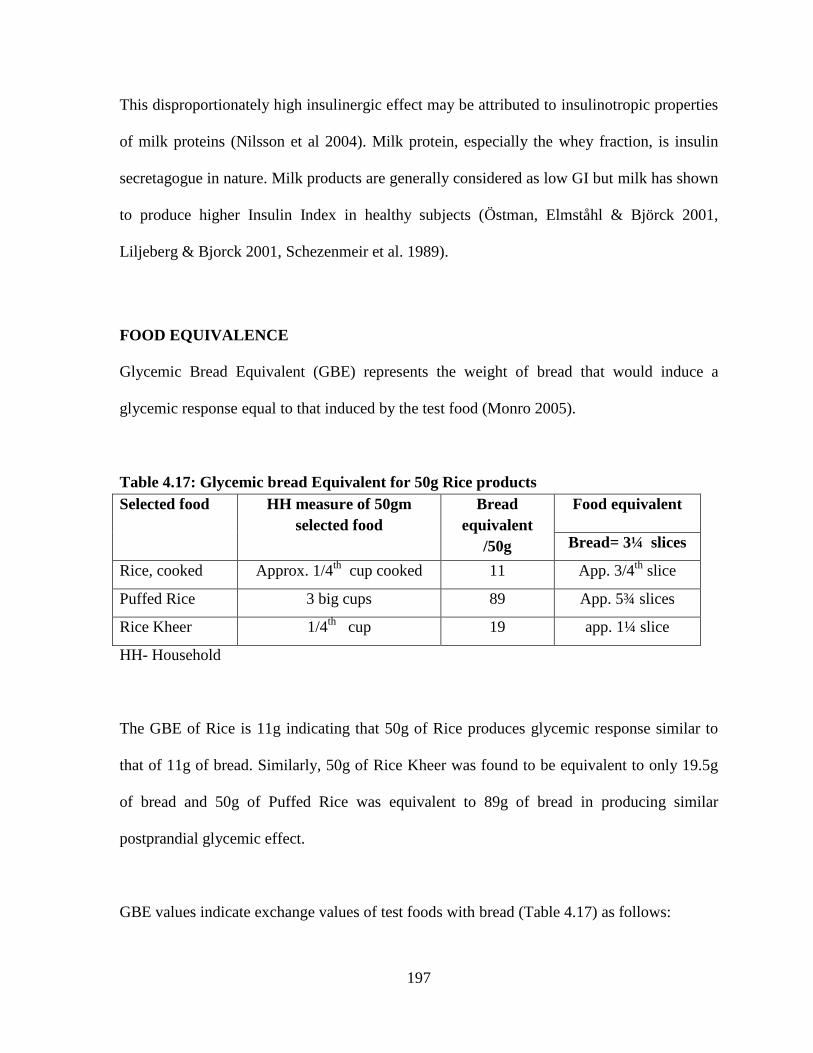
FOOD EQUIVALENCE
Glycemic Bread Equivalent (GBE) represents the weight of bread that would induce a
glycemic response equal to that induced by the test food (Monro 2005).
Table 4.17: Glycemic bread Equivalent for 50g Rice products
Selected food HH measure of 50gm
selected food
Bread
equivalent
/50g
Food equivalent
Bread= 3¼ slices
Rice, cooked Approx. 1/4th
cup cooked 11 App. 3/4th
slice
Puffed Rice 3 big cups 89 App. 5¾ slices
Rice Kheer 1/4th
cup 19 app. 1¼ slice
HH- Household
The GBE of Rice is 11g indicating that 50g of Rice produces glycemic response similar to
that of 11g of bread. Similarly, 50g of Rice Kheer was found to be equivalent to only 19.5g
of bread and 50g of Puffed Rice was equivalent to 89g of bread in producing similar
postprandial glycemic effect.
GBE values indicate exchange values of test foods with bread (Table 4.17) as follows:
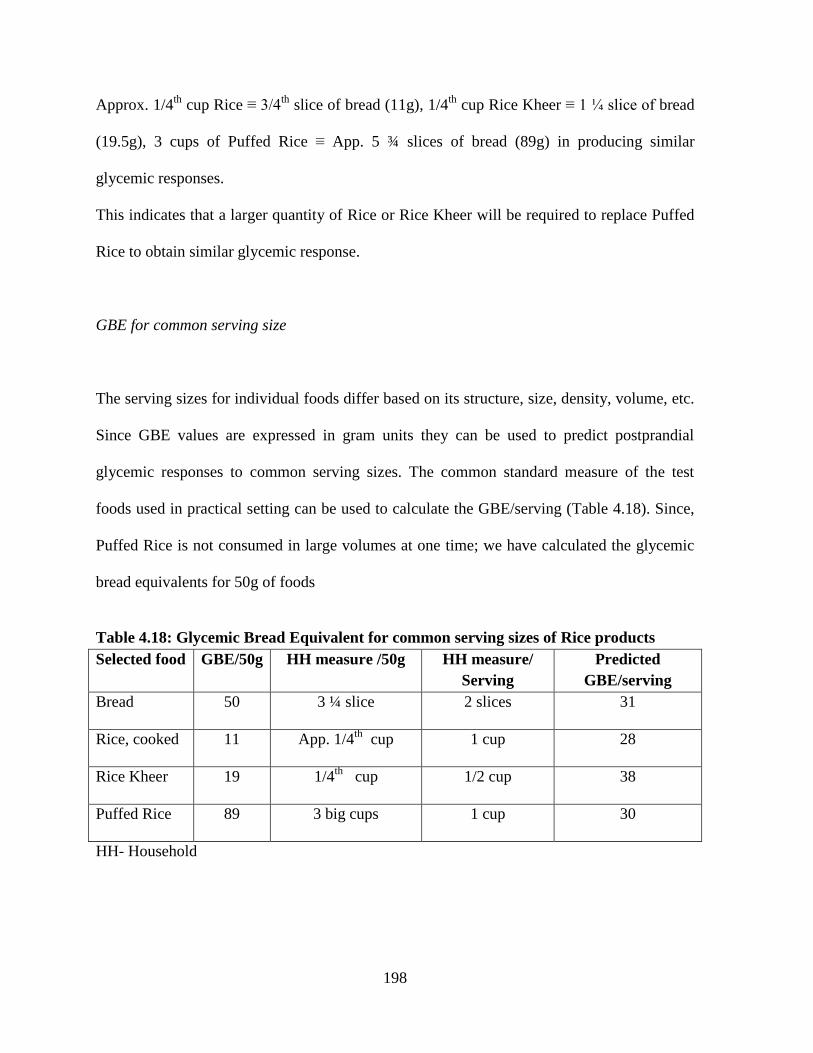
198
Approx. 1/4th
cup Rice ≡ 3/4th
slice of bread (11g), 1/4th
cup Rice Kheer ≡ 1 ¼ slice of bread
(19.5g), 3 cups of Puffed Rice ≡ App. 5 ¾ slices of bread (89g) in producing similar
glycemic responses.
This indicates that a larger quantity of Rice or Rice Kheer will be required to replace Puffed
Rice to obtain similar glycemic response.
GBE for common serving size
The serving sizes for individual foods differ based on its structure, size, density, volume, etc.
Since GBE values are expressed in gram units they can be used to predict postprandial
glycemic responses to common serving sizes. The common standard measure of the test
foods used in practical setting can be used to calculate the GBE/serving (Table 4.18). Since,
Puffed Rice is not consumed in large volumes at one time; we have calculated the glycemic
bread equivalents for 50g of foods
Table 4.18: Glycemic Bread Equivalent for common serving sizes of Rice products
Selected food GBE/50g HH measure /50g HH measure/
Serving
Predicted
GBE/serving
Bread 50 3 ¼ slice 2 slices 31
Rice, cooked 11 App. 1/4th
cup 1 cup 28
Rice Kheer 19 1/4th
cup 1/2 cup 38
Puffed Rice 89 3 big cups 1 cup 30
HH- Household
199
The predicted glycemic response to 1 cup of Puffed Rice was found to be equivalent to 30g
of bread. Due to its high volume to weight ratio, most individuals consume smaller portions
(15-20g) of Puffed Rice at a time which may not produce detrimental effect on metabolic
system, even in diabetic person. However, excessive consumption is definitely not
recommended.
It has been observed that consuming even upto 1 cup of plain boiled Rice (130g) or ½ cup of
Rice Kheer (100g) does not induce very high glycemic response rendering it safe for
consumption in individuals who are obese, glucose intolerant or insulin resistant.
KEY OBSERVATIONS:
The study results show that food products containing sugar or sweet-tasting foods
may not always induce a high glycemic response or vice versa.
White bread and Puffed Rice which do not taste sweet are actually comparable to
glucose in their postprandial effect.
There is a need to understand the impact of foods as a complete entity along with its
co-ingredients, processing conditions, type of sugar, etc rather than studying the
response to its individual nutrient (e.g. available carbohydrate) to attain effective
control of postprandial hyperglycemia and related complications.
High GI value of rice, based on equi-carbohydrate, has marked it as restricted food for
individuals with diabetes. But equi-quantity based GIfood value, representing actual
condition of food consumption, identified Rice as having very low glycemic and
insulin response. This means that it can be consumed by diabetic individuals also
200
without posing increased risk of postprandial hyperglycemia; in normal serving sizes.
To improve its nutrient density other ingredients may be added (dal, vegetables, etc) of
the plain cooked Rice.
Rice Kheer, having a semi-solid consistency is a sweet dish, but did not cause a
substantial increase in postprandial blood glucose or insulin levels. This supports the
contention that the type of sugar and quantity consumed are vital determinants of
postprandial response rather than only available carbohydrate content.
Puffed Rice, as 50g portion, has shown to induce hyperglycemia and hyperinsulinemia
and needs to be consumed in restricted quantities by individuals with diabetes.
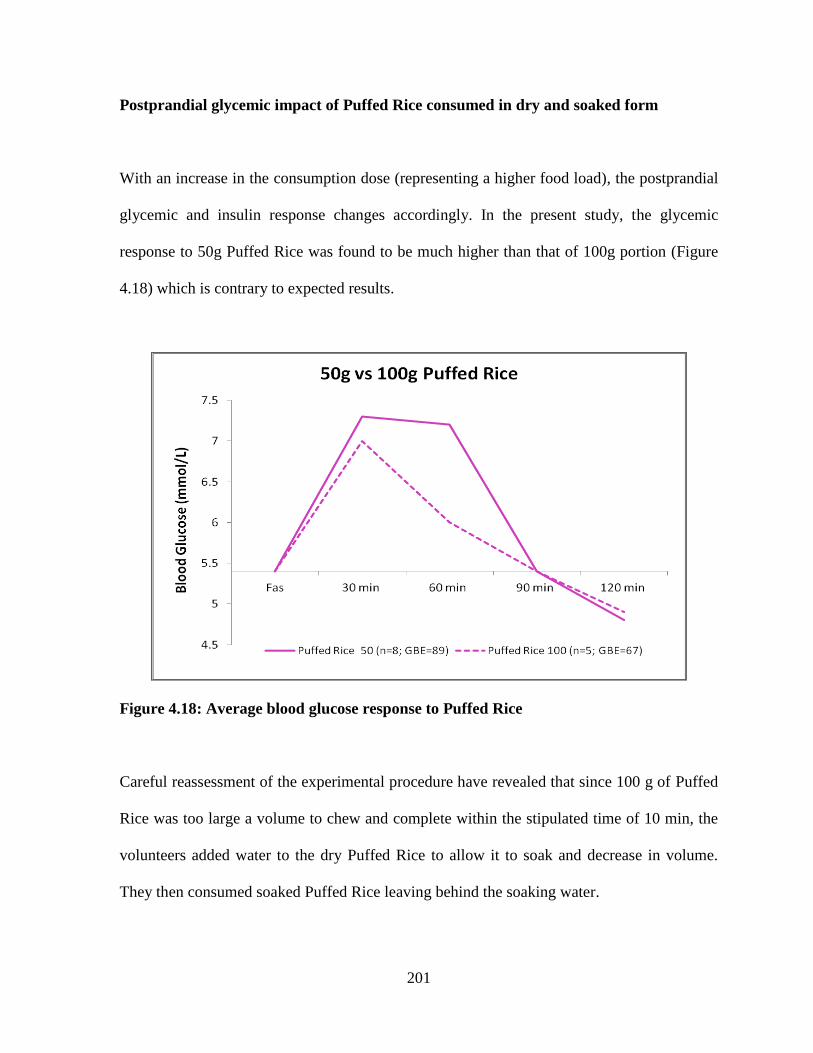
201
Postprandial glycemic impact of Puffed Rice consumed in dry and soaked form
With an increase in the consumption dose (representing a higher food load), the postprandial
glycemic and insulin response changes accordingly. In the present study, the glycemic
response to 50g Puffed Rice was found to be much higher than that of 100g portion (Figure
4.18) which is contrary to expected results.
Figure 4.18: Average blood glucose response to Puffed Rice
Careful reassessment of the experimental procedure have revealed that since 100 g of Puffed
Rice was too large a volume to chew and complete within the stipulated time of 10 min, the
volunteers added water to the dry Puffed Rice to allow it to soak and decrease in volume.
They then consumed soaked Puffed Rice leaving behind the soaking water.
202
The soaking of Puffed Rice as was done for the 100g portion may have led to the rapid
ingestion, digestion and absorption of its starch component resulting in lower AUC response.
This has initiated a few more experiments to understand the different dose response curve
induced by Puffed Rice. New set of experiment were conducted where the effect of soaked
versus dry Puffed Rice has been assessed.
The glycemic and insulin response to test meal was recorded for 4 normal healthy subjects
from same age group. 50g Puffed Rice with and without soaking were consumed by the
subjects on separate occasions. The Figure 4.19 shows the glycemic response curve for dry
versus soaked puffed rice
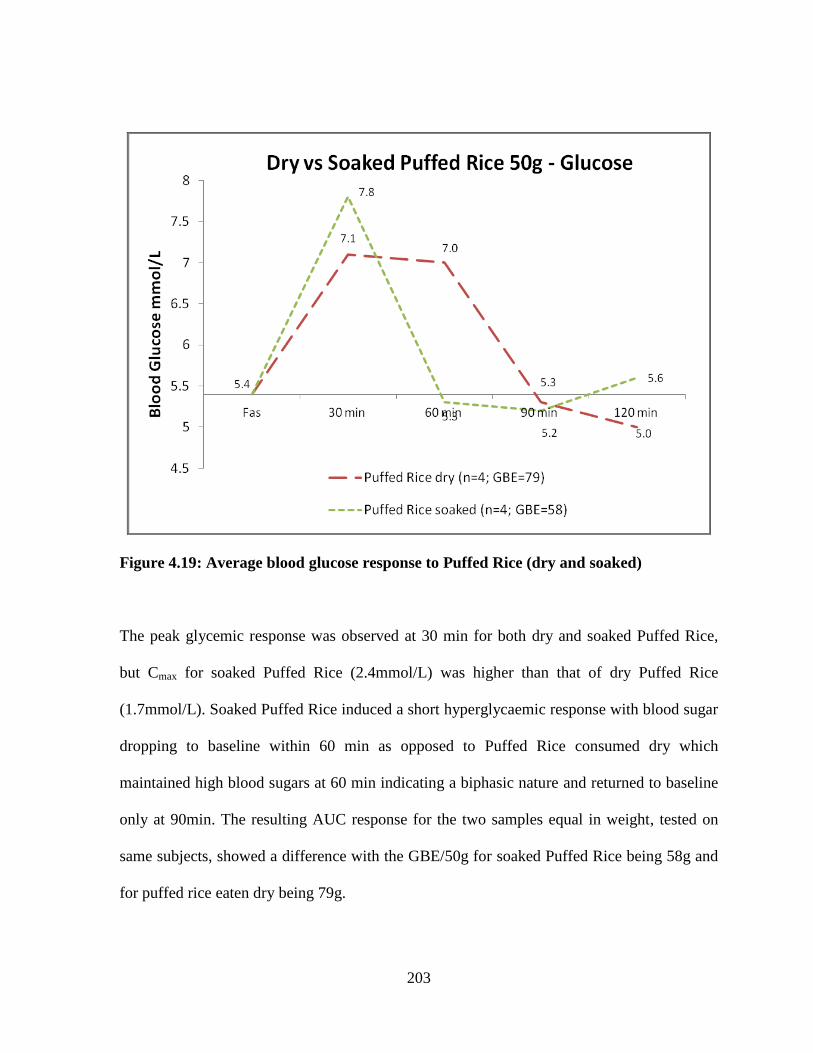
203
Figure 4.19: Average blood glucose response to Puffed Rice (dry and soaked)
The peak glycemic response was observed at 30 min for both dry and soaked Puffed Rice,
but Cmax for soaked Puffed Rice (2.4mmol/L) was higher than that of dry Puffed Rice
(1.7mmol/L). Soaked Puffed Rice induced a short hyperglycaemic response with blood sugar
dropping to baseline within 60 min as opposed to Puffed Rice consumed dry which
maintained high blood sugars at 60 min indicating a biphasic nature and returned to baseline
only at 90min. The resulting AUC response for the two samples equal in weight, tested on
same subjects, showed a difference with the GBE/50g for soaked Puffed Rice being 58g and
for puffed rice eaten dry being 79g.
204
The proposed explanation for the observed difference in AUC response could be that as we
chew our food dry, the saliva in the mouth needs to be mixed with the food particles, where
the ptyalin in saliva comes in contact with the masticated food particles initiating the process
of starch digestion in the mouth itself. This breakdown of starch is supported by the sweet
taste (malto-dextrins) of dry Puffed Rice within the mouth.
Different nature of AUC response and GBE value of dry and soaked Puffed Rice may be due
to:
i) There may be an initial increase in blood sugar level with dry Puffed Rice before 30
min due to initiation of starch breakdown in the mouth itself facilitated by salivary
amylase (ptyalin) and bathochomic shift (shift of peak to the left) that would have
increased the AUC further, which we have failed to record because our first analysis was
at 30 min.
ii) Dry Puffed Rice requires more energy to masticate and therefore the subjects may have
chewed it less thoroughly leading to larger particle size which provides relatively lesser
surface area for enzyme action slowing down the digestion process in the intestine,
resulting in sustained postprandial effect, whereas soaked Puffed Rice may have been
masticated thoroughly to facilitate the action of amylase.
The thoroughly chewed smaller particles of soaked Puffed Rice may provide greater surface
area for amylase action. This may cause rapid digestion, absorption and utilization of the
starch present resulting in a smaller IAUC glycemic response in postprandial period.
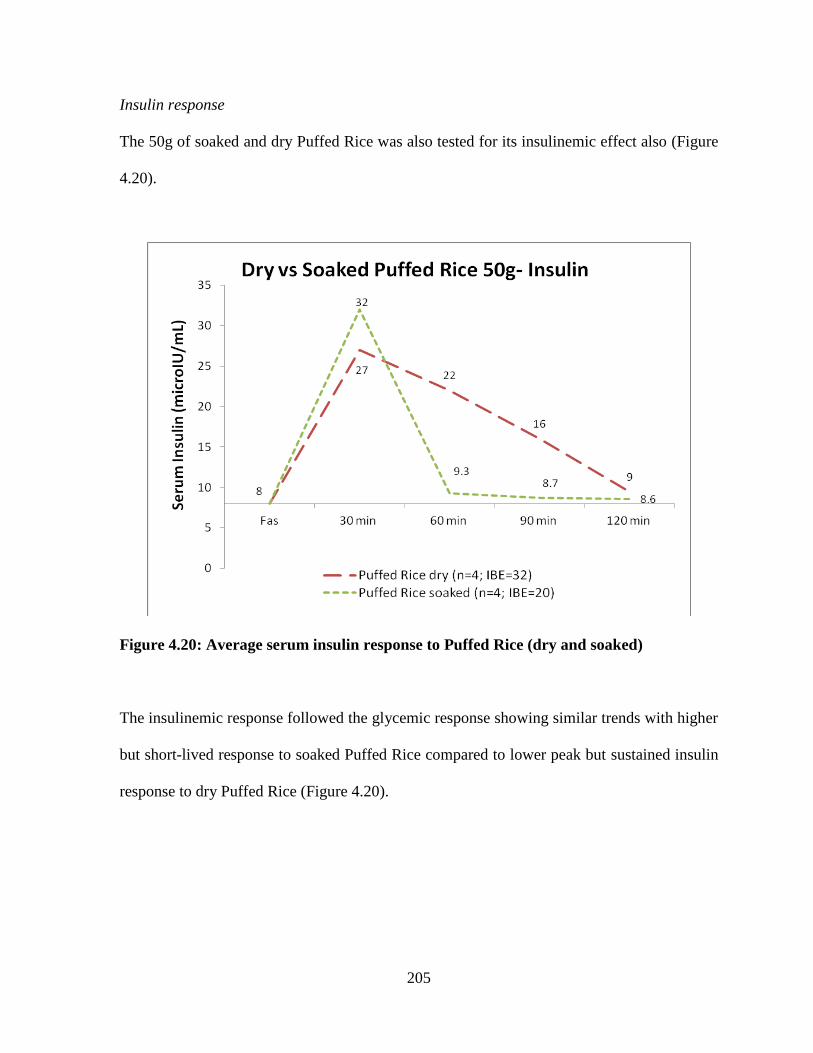
205
Insulin response
The 50g of soaked and dry Puffed Rice was also tested for its insulinemic effect also (Figure
4.20).
Figure 4.20: Average serum insulin response to Puffed Rice (dry and soaked)
The insulinemic response followed the glycemic response showing similar trends with higher
but short-lived response to soaked Puffed Rice compared to lower peak but sustained insulin
response to dry Puffed Rice (Figure 4.20).
206
KEY OBSERVATIONS:
Soaked puffed rice is masticated more thoroughly resulting in smaller particles easily
accessible to amylases. They are then rapidly absorbed and utilized resulting in higher
peak but short glycemic AUC response
The improper mastication of dry puffed rice leads to larger particles entering the
intestine requiring longer time for hydrolysis resulting in smaller peak and sustained
glycemic response.
Insulin follows the same trend as the glycemic response under both the conditions.
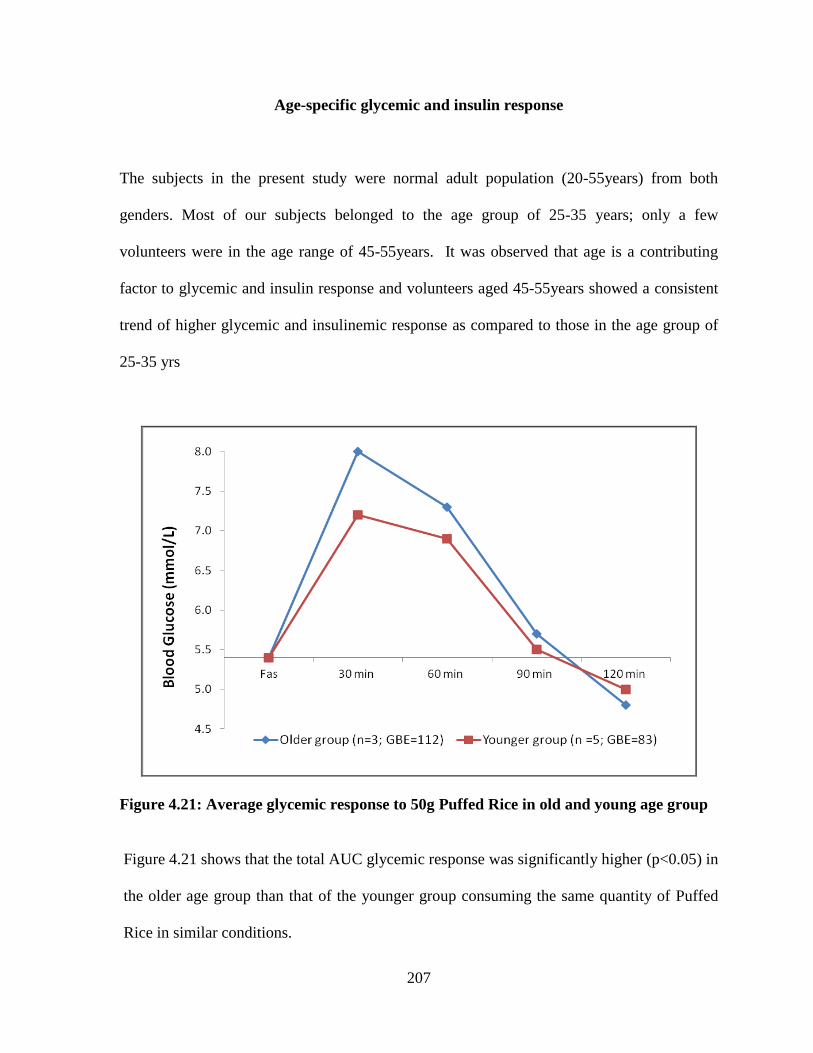
207
Age-specific glycemic and insulin response
The subjects in the present study were normal adult population (20-55years) from both
genders. Most of our subjects belonged to the age group of 25-35 years; only a few
volunteers were in the age range of 45-55years. It was observed that age is a contributing
factor to glycemic and insulin response and volunteers aged 45-55years showed a consistent
trend of higher glycemic and insulinemic response as compared to those in the age group of
25-35 yrs
Figure 4.21: Average glycemic response to 50g Puffed Rice in old and young age group
Figure 4.21 shows that the total AUC glycemic response was significantly higher (p<0.05) in
the older age group than that of the younger group consuming the same quantity of Puffed
Rice in similar conditions.
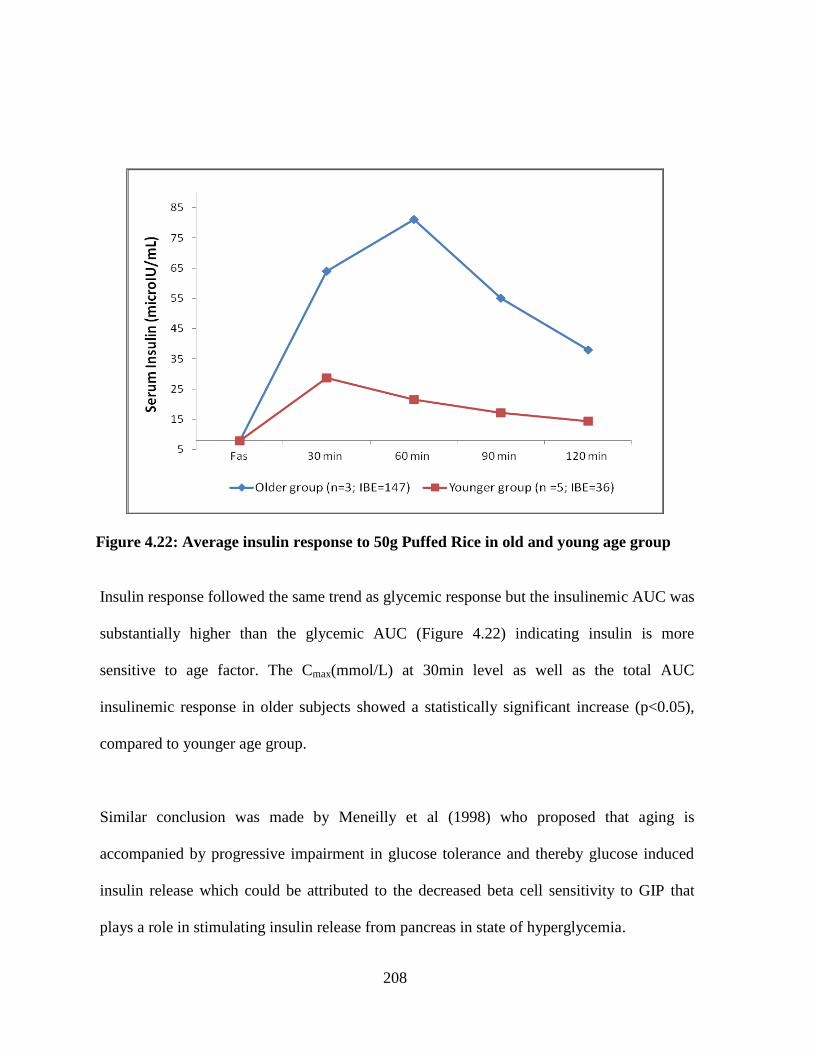
208
Figure 4.22: Average insulin response to 50g Puffed Rice in old and young age group
Insulin response followed the same trend as glycemic response but the insulinemic AUC was
substantially higher than the glycemic AUC (Figure 4.22) indicating insulin is more
sensitive to age factor. The Cmax(mmol/L) at 30min level as well as the total AUC
insulinemic response in older subjects showed a statistically significant increase (p<0.05),
compared to younger age group.
Similar conclusion was made by Meneilly et al (1998) who proposed that aging is
accompanied by progressive impairment in glucose tolerance and thereby glucose induced
insulin release which could be attributed to the decreased beta cell sensitivity to GIP that
plays a role in stimulating insulin release from pancreas in state of hyperglycemia.
209
KEY OBSERVATIONS:
Postprandial metabolic response to food is age-specific, being higher in older age
compared to younger subjects.
Insulin response is more sensitive to age compared to glycemic response
210
POTATO AND SAGO KHICHDI
Fasting is an integral part of Indian religious customs. During periods of fasting, people are
allowed to consume certain selected starchy foods as their source of energy. Out of this
limited list of permitted food, Potato and sago are two most common starchy foods. These
may be categorized as waxy starches which have high amylopectin content and form soft gels
upon gelatinization. The higher amylopectin content may induce faster glucose and insulin
responses compared to products containing high amylose content.
Asia consumes almost half of the world's Potato supply, but consumption per person is a
modest 24kg (FAO 2008). Approximately 80% of Potato tuber is moisture and on dry weight
basis, the carbohydrate is present in the form of starch, free of lipid. Amylose accounts for
20–30%, but amylopectin is typically the major component (80%). Gelatinized cooked
Potato has been shown to have a high GI but the true postprandial glycemic impact depends
upon its concentration and amount of food consumed.
Sago (metroxylin sagu) is the commonest form of native starch tapioca consumed as
sabudana in India. Sago is popularly used for preparation of khichadi in Maharastra &
MadhyaPradesh. But, Sago is primarily rich in starch (30-35%) lacking in other nutrients.
The glycemic and insulin response to 50 and 100g of Potato and Sago Khichdi was compared
to equal quantity of white bread (Figure 4.23). GIfood value for a specific food quantity, also
known as Relative glycemic impact (RGI), is the postprandial glycemic response of given
food (Potato & Sago Khichdi) quantity consumed in a single intake (here, 50g) compared to
same quantity of bread and is expressed as the Glycemic Bread Equivalent (GBE/50g of
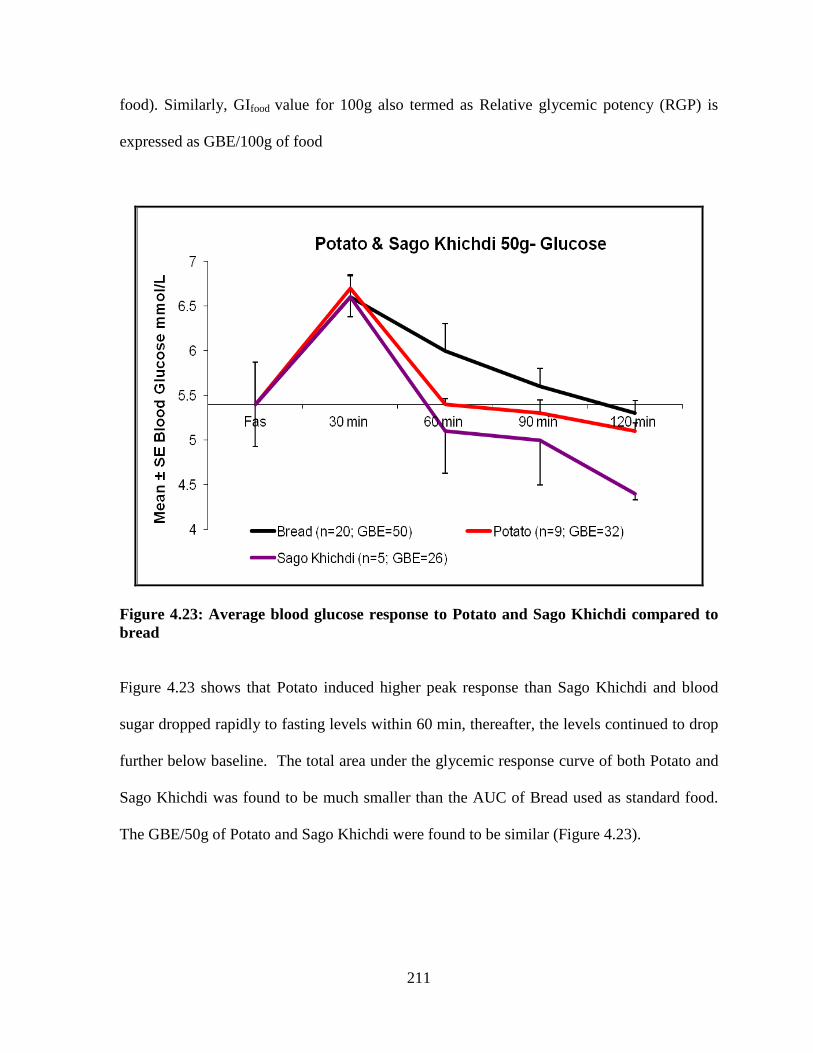
211
food). Similarly, GIfood value for 100g also termed as Relative glycemic potency (RGP) is
expressed as GBE/100g of food
Figure 4.23: Average blood glucose response to Potato and Sago Khichdi compared to
bread
Figure 4.23 shows that Potato induced higher peak response than Sago Khichdi and blood
sugar dropped rapidly to fasting levels within 60 min, thereafter, the levels continued to drop
further below baseline. The total area under the glycemic response curve of both Potato and
Sago Khichdi was found to be much smaller than the AUC of Bread used as standard food.
The GBE/50g of Potato and Sago Khichdi were found to be similar (Figure 4.23).
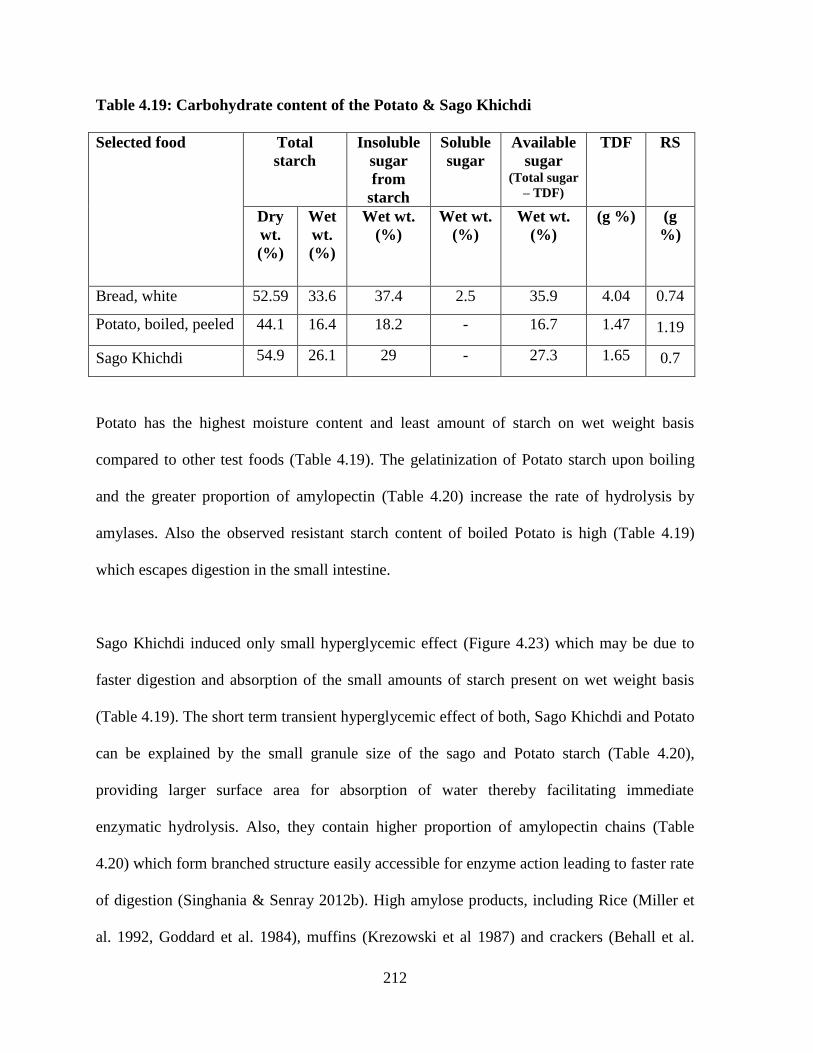
212
Table 4.19: Carbohydrate content of the Potato & Sago Khichdi
Selected food
Total
starch
Insoluble
sugar
from
starch
Soluble
sugar
Available
sugar (Total sugar
– TDF)
TDF RS
Dry
wt.
(%)
Wet
wt.
(%)
Wet wt.
(%)
Wet wt.
(%)
Wet wt.
(%)
(g %) (g
%)
Bread, white 52.59 33.6 37.4 2.5 35.9 4.04 0.74
Potato, boiled, peeled 44.1 16.4 18.2 - 16.7 1.47 1.19
Sago Khichdi 54.9 26.1 29 - 27.3 1.65 0.7
Potato has the highest moisture content and least amount of starch on wet weight basis
compared to other test foods (Table 4.19). The gelatinization of Potato starch upon boiling
and the greater proportion of amylopectin (Table 4.20) increase the rate of hydrolysis by
amylases. Also the observed resistant starch content of boiled Potato is high (Table 4.19)
which escapes digestion in the small intestine.
Sago Khichdi induced only small hyperglycemic effect (Figure 4.23) which may be due to
faster digestion and absorption of the small amounts of starch present on wet weight basis
(Table 4.19). The short term transient hyperglycemic effect of both, Sago Khichdi and Potato
can be explained by the small granule size of the sago and Potato starch (Table 4.20),
providing larger surface area for absorption of water thereby facilitating immediate
enzymatic hydrolysis. Also, they contain higher proportion of amylopectin chains (Table
4.20) which form branched structure easily accessible for enzyme action leading to faster rate
of digestion (Singhania & Senray 2012b). High amylose products, including Rice (Miller et
al. 1992, Goddard et al. 1984), muffins (Krezowski et al 1987) and crackers (Behall et al.
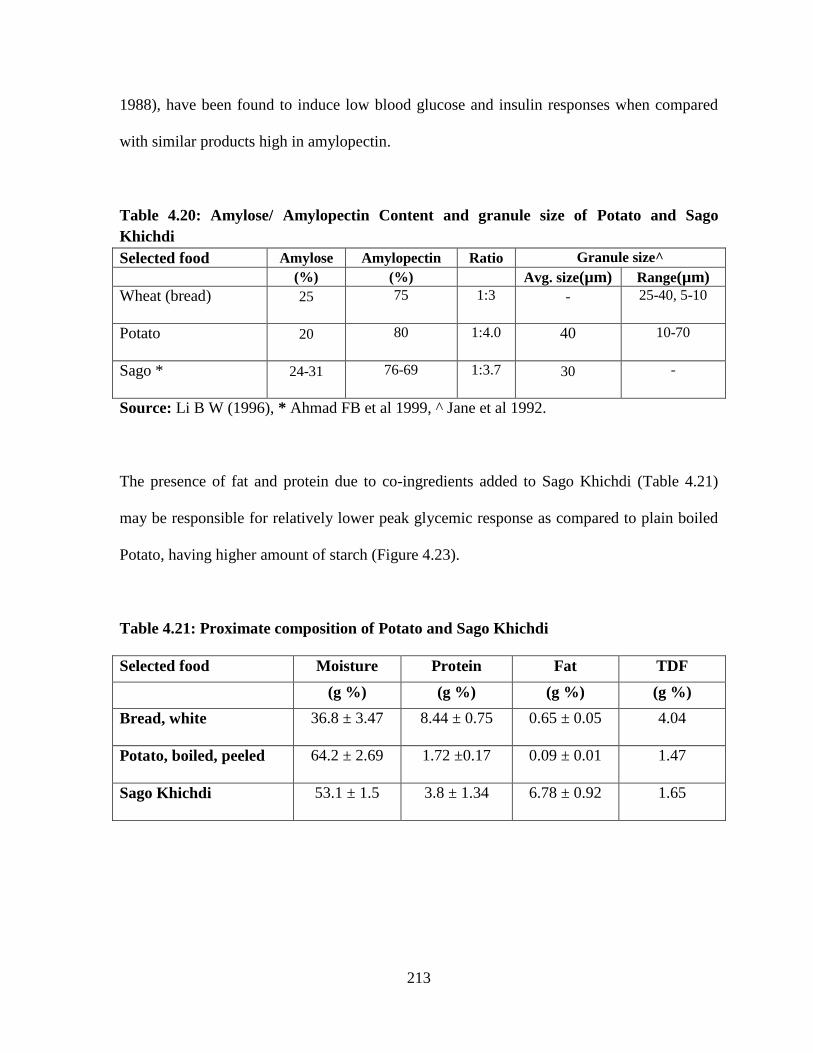
213
1988), have been found to induce low blood glucose and insulin responses when compared
with similar products high in amylopectin.
Table 4.20: Amylose/ Amylopectin Content and granule size of Potato and Sago
Khichdi
Selected food Amylose Amylopectin Ratio Granule size^
(%) (%) Avg. size(µm) Range(µm)
Wheat (bread) 25 75 1:3 - 25-40, 5-10
Potato 20 80 1:4.0 40 10-70
Sago * 24-31 76-69 1:3.7 30 -
Source: Li B W (1996), * Ahmad FB et al 1999, ^ Jane et al 1992.
The presence of fat and protein due to co-ingredients added to Sago Khichdi (Table 4.21)
may be responsible for relatively lower peak glycemic response as compared to plain boiled
Potato, having higher amount of starch (Figure 4.23).
Table 4.21: Proximate composition of Potato and Sago Khichdi
Selected food Moisture Protein Fat TDF
(g %) (g %) (g %) (g %)
Bread, white 36.8 ± 3.47 8.44 ± 0.75 0.65 ± 0.05 4.04
Potato, boiled, peeled 64.2 ± 2.69 1.72 ±0.17 0.09 ± 0.01 1.47
Sago Khichdi 53.1 ± 1.5 3.8 ± 1.34 6.78 ± 0.92 1.65
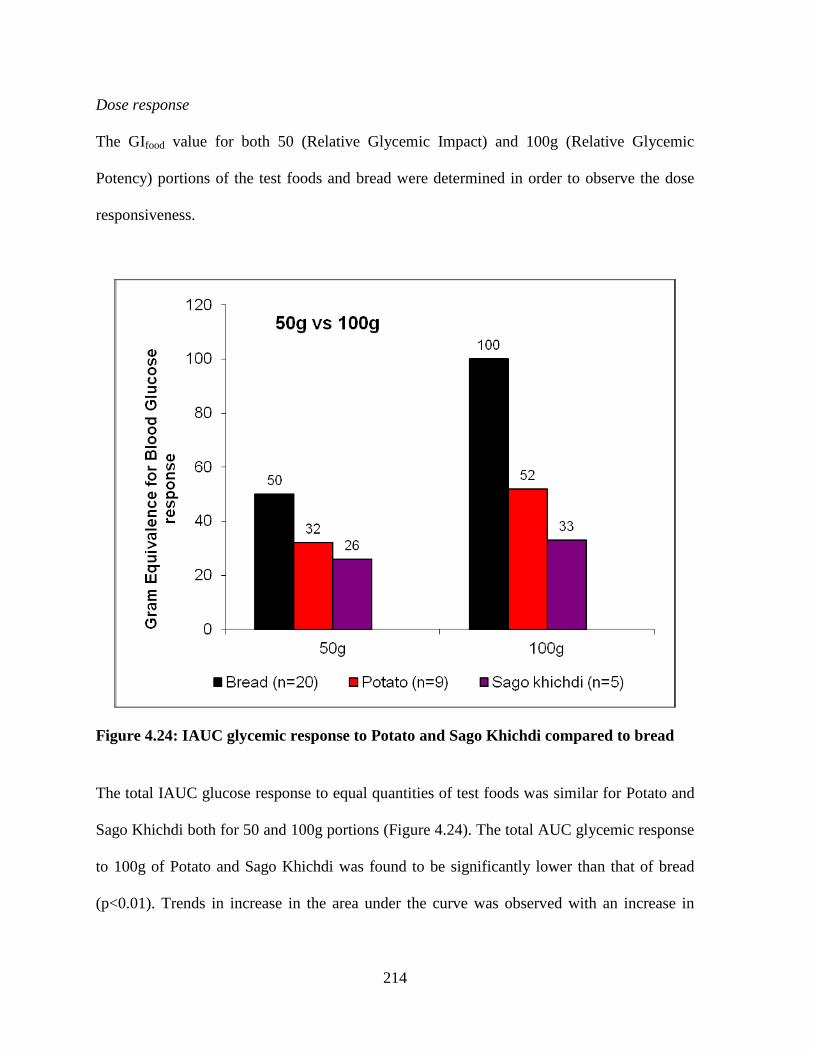
214
Dose response
The GIfood value for both 50 (Relative Glycemic Impact) and 100g (Relative Glycemic
Potency) portions of the test foods and bread were determined in order to observe the dose
responsiveness.
Figure 4.24: IAUC glycemic response to Potato and Sago Khichdi compared to bread
The total IAUC glucose response to equal quantities of test foods was similar for Potato and
Sago Khichdi both for 50 and 100g portions (Figure 4.24). The total AUC glycemic response
to 100g of Potato and Sago Khichdi was found to be significantly lower than that of bread
(p<0.01). Trends in increase in the area under the curve was observed with an increase in
215
amount fed from 50 to 100g reflecting the dose responsiveness of glycemic bread equivalent
as a measure of the glycemic response to equal quantities of whole foods.
Insulin response
After absorption of digested food, the postprandial blood sugar level is mainly controlled by
the insulin, secreted from pancreas. Insulin response may or may not be parallel to the
glycemic response and is affected by the co-nutrients present in food besides carbohydrates
(Holt et al 1997).
Relative Insulin Impact (RII) of the test foods was calculated in the same way as the RGI by
comparing the 2 h postprandial insulin response to 50g test food compared to that of same
quantity of bread to give the Insulinemic Bread Equivalent (IBE/50g of food). Similarly,
Relative Insulinemic potency (RIP) as the insulin response to 100g of food Potato & Sago
Khichdi as a percentage of the effect of equal amount of bread and was expressed as
IBE/100g of food.
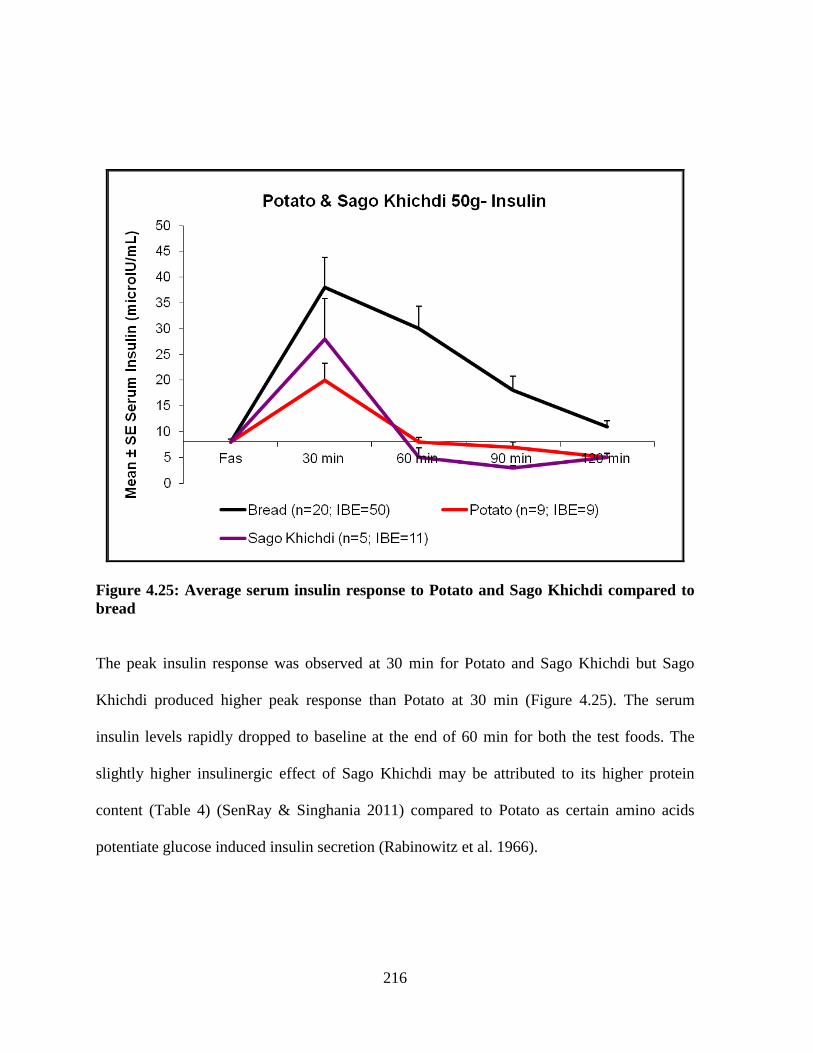
216
Figure 4.25: Average serum insulin response to Potato and Sago Khichdi compared to
bread
The peak insulin response was observed at 30 min for Potato and Sago Khichdi but Sago
Khichdi produced higher peak response than Potato at 30 min (Figure 4.25). The serum
insulin levels rapidly dropped to baseline at the end of 60 min for both the test foods. The
slightly higher insulinergic effect of Sago Khichdi may be attributed to its higher protein
content (Table 4) (SenRay & Singhania 2011) compared to Potato as certain amino acids
potentiate glucose induced insulin secretion (Rabinowitz et al. 1966).
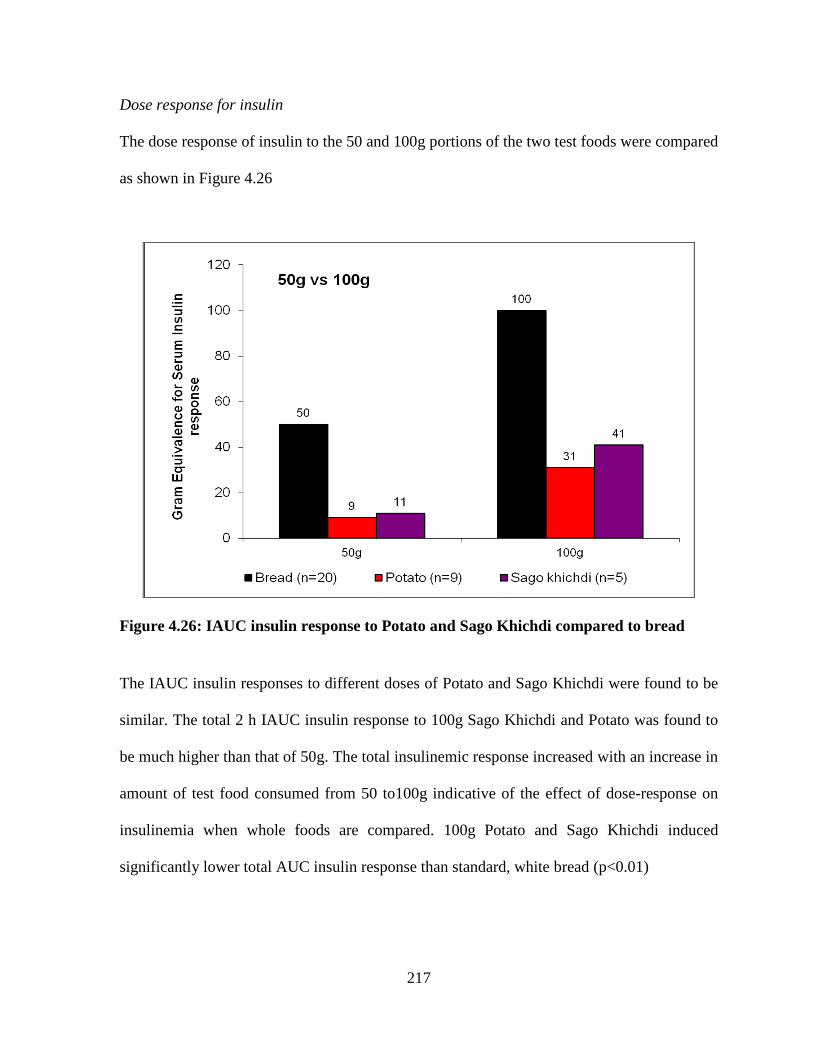
217
Dose response for insulin
The dose response of insulin to the 50 and 100g portions of the two test foods were compared
as shown in Figure 4.26
Figure 4.26: IAUC insulin response to Potato and Sago Khichdi compared to bread
The IAUC insulin responses to different doses of Potato and Sago Khichdi were found to be
similar. The total 2 h IAUC insulin response to 100g Sago Khichdi and Potato was found to
be much higher than that of 50g. The total insulinemic response increased with an increase in
amount of test food consumed from 50 to100g indicative of the effect of dose-response on
insulinemia when whole foods are compared. 100g Potato and Sago Khichdi induced
significantly lower total AUC insulin response than standard, white bread (p<0.01)
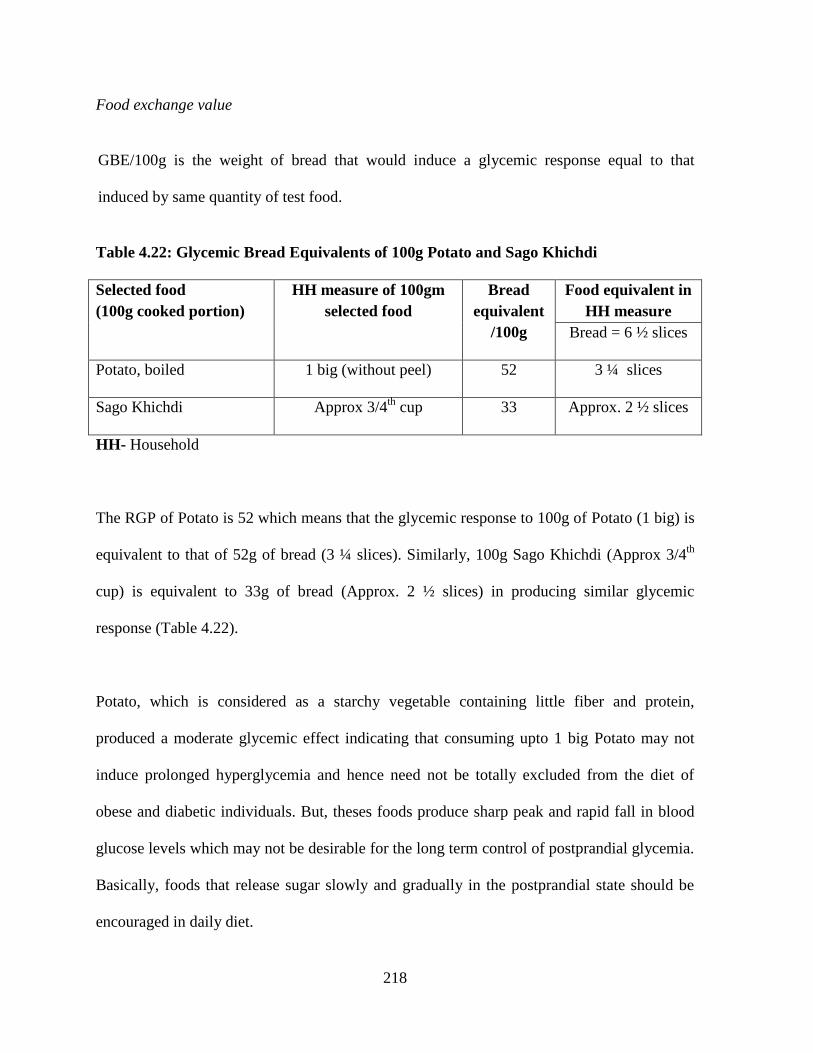
218
Food exchange value
GBE/100g is the weight of bread that would induce a glycemic response equal to that
induced by same quantity of test food.
Table 4.22: Glycemic Bread Equivalents of 100g Potato and Sago Khichdi
Selected food
(100g cooked portion)
HH measure of 100gm
selected food
Bread
equivalent
/100g
Food equivalent in
HH measure
Bread = 6 ½ slices
Potato, boiled 1 big (without peel) 52 3 ¼ slices
Sago Khichdi Approx 3/4th
cup 33 Approx. 2 ½ slices
HH- Household
The RGP of Potato is 52 which means that the glycemic response to 100g of Potato (1 big) is
equivalent to that of 52g of bread (3 ¼ slices). Similarly, 100g Sago Khichdi (Approx 3/4th
cup) is equivalent to 33g of bread (Approx. 2 ½ slices) in producing similar glycemic
response (Table 4.22).
Potato, which is considered as a starchy vegetable containing little fiber and protein,
produced a moderate glycemic effect indicating that consuming upto 1 big Potato may not
induce prolonged hyperglycemia and hence need not be totally excluded from the diet of
obese and diabetic individuals. But, theses foods produce sharp peak and rapid fall in blood
glucose levels which may not be desirable for the long term control of postprandial glycemia.
Basically, foods that release sugar slowly and gradually in the postprandial state should be
encouraged in daily diet.
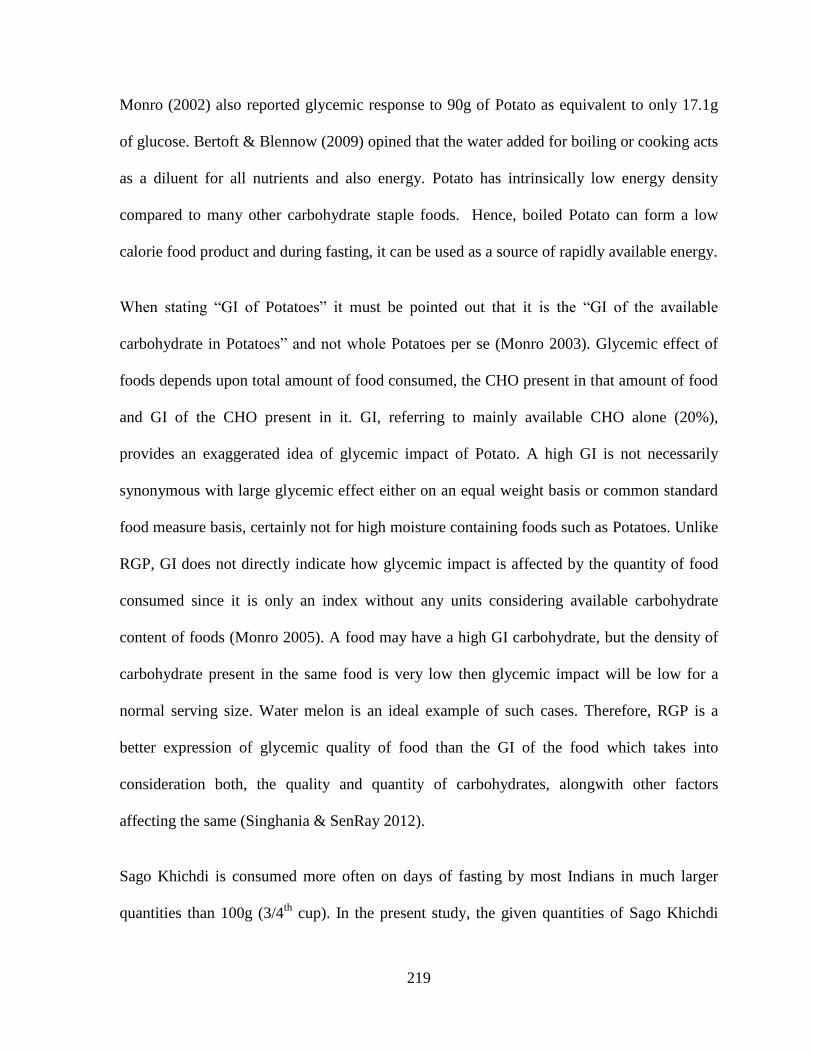
219
Monro (2002) also reported glycemic response to 90g of Potato as equivalent to only 17.1g
of glucose. Bertoft & Blennow (2009) opined that the water added for boiling or cooking acts
as a diluent for all nutrients and also energy. Potato has intrinsically low energy density
compared to many other carbohydrate staple foods. Hence, boiled Potato can form a low
calorie food product and during fasting, it can be used as a source of rapidly available energy.
When stating ―GI of Potatoes‖ it must be pointed out that it is the ―GI of the available
carbohydrate in Potatoes‖ and not whole Potatoes per se (Monro 2003). Glycemic effect of
foods depends upon total amount of food consumed, the CHO present in that amount of food
and GI of the CHO present in it. GI, referring to mainly available CHO alone (20%),
provides an exaggerated idea of glycemic impact of Potato. A high GI is not necessarily
synonymous with large glycemic effect either on an equal weight basis or common standard
food measure basis, certainly not for high moisture containing foods such as Potatoes. Unlike
RGP, GI does not directly indicate how glycemic impact is affected by the quantity of food
consumed since it is only an index without any units considering available carbohydrate
content of foods (Monro 2005). A food may have a high GI carbohydrate, but the density of
carbohydrate present in the same food is very low then glycemic impact will be low for a
normal serving size. Water melon is an ideal example of such cases. Therefore, RGP is a
better expression of glycemic quality of food than the GI of the food which takes into
consideration both, the quality and quantity of carbohydrates, alongwith other factors
affecting the same (Singhania & SenRay 2012).
Sago Khichdi is consumed more often on days of fasting by most Indians in much larger
quantities than 100g (3/4th
cup). In the present study, the given quantities of Sago Khichdi
220
induced very low glycemic area under the curve compared to other test foods. Thus, it may
be predicted that even consuming upto 1 cup (approx. 130g) of Sago Khichdi may not
produce very harmful effects on metabolism. However, the nutritional value of Sago Khichdi
needs to be enhanced by addition of some fiber or protein source in order to improve its
nutrient density.
KEY OBSERVATIONS:
Glycemic responses to starchy food depend on method of cooking / processing and
characteristics of starch rather than total quantity of starch present alone.
On days of fasting, amylopectin rich starchy food acts as quick source of energy
releasing sugar rapidly.
Since, the starch in Potato and sago is easily hydrolyzed leading to rapid increase in
blood sugars, the addition of protein and/or fiber source to these foods can help taper
down the postprandial glycemic and insulinemic response.
221
GLYCEMIC BREAD EQUIVALENT OF TEST FOODS
BASED ON COMMON SERVING SIZES
The glycemic effect of different test foods is indicative of postprandial responses relative to
that of the standard – white bread, expressed as the Relative Glycemic Potency (RGP) (for
100g of food) and Relative Glycemic Impact (e.g. 50g of food). These indices may help the
common man to follow the ranking of foods, categorized on the basis of the GBE and
accordingly the consumption quantity can be decided. An athlete in the power game can
choose food products that facilitate quick release of glucose while the glucose intolerant
individual may choose the food which induces lower glycemic response to a given quantity.
In the present study, 50g portions were used as commonly used index- GI is also calculated
on the basis of 50g available carbohydrate content. Further, 100g portion was used to study
the dose-responsiveness of GIfood, which is a limitation of GI.
However, these 50 and 100g portions of test foods may not be of complete relevance for
certain food products which are consumed in larger or smaller serving sizes. For example,
50g of Puffed Rice (3 cups) or Marie biscuits (9 in no.) are never consumed at one time by an
individual. Similarly, we may consume more than 100g of Rice (3/4th
cup) or Sago Khichdi
(3/4th
cup) at one meal time.
222
GBE/common serving size of test foods
The common serving sizes used in practice differ for each food item, based on its -
i) Physical characteristics- Common serving sizes of the food products usually depend on
structure, size, density, and volume of the specific food. For ex. Puffed Rice is consumed
in smaller portion at one time, since it is extremely light and porous, resulting in larger
volume to weight ratio. Similarly, Marie biscuit is extremely light in weight (1 biscuit
weighs ~5.5gms) and we may consume only 3-4 biscuits at one time. Hence, the
consumed food load of these two products is expected to be lower than 50g portion. On
the other hand, Rice Kheer prepared by boiling the milk to reduce it to half its initial
quantity constitutes a dense sweet dish with higher weight: volume ratio. This may be the
reason why we feel satisfied after consuming even ½ cup of Rice Kheer but needs larger
quantities of Puffed Rice or Marie biscuit to have a filling effect, although similar
quantities of these products can result in exactly opposite glycemic effect.
ii) Eaten alone or part of mixed meals- The quantity of food consumed may also vary
depending upon whether the product is consumed alone or as a part of mixed meals.
Some foods are eaten as a component of main meals (Rice, Chapatti) or separately only
as a snack (eg. Puffed Rice, Marie biscuit).
Expression in terms of Glycemic Index food has the advantage over the traditional Glycemic
Index, which cannot provide a clear distinction of true glycemic response to change in food
intake differing in composition and weight since it denotes an absolute unchanging value
(Monro 2005).
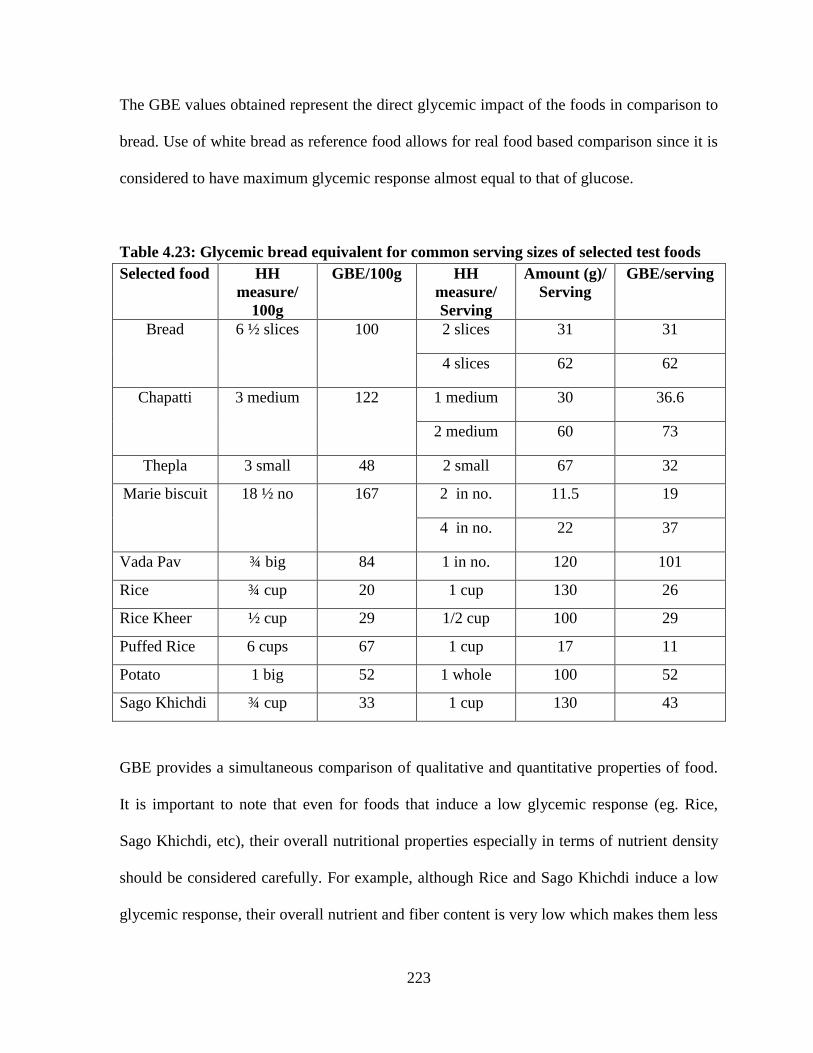
223
The GBE values obtained represent the direct glycemic impact of the foods in comparison to
bread. Use of white bread as reference food allows for real food based comparison since it is
considered to have maximum glycemic response almost equal to that of glucose.
Table 4.23: Glycemic bread equivalent for common serving sizes of selected test foods
Selected food HH
measure/
100g
GBE/100g HH
measure/
Serving
Amount (g)/
Serving
GBE/serving
Bread 6 ½ slices 100 2 slices 31 31
4 slices 62 62
Chapatti 3 medium 122 1 medium 30 36.6
2 medium 60 73
Thepla 3 small 48 2 small 67 32
Marie biscuit 18 ½ no 167 2 in no. 11.5 19
4 in no. 22 37
Vada Pav ¾ big 84 1 in no. 120 101
Rice ¾ cup 20 1 cup 130 26
Rice Kheer ½ cup 29 1/2 cup 100 29
Puffed Rice 6 cups 67 1 cup 17 11
Potato 1 big 52 1 whole 100 52
Sago Khichdi ¾ cup 33 1 cup 130 43
GBE provides a simultaneous comparison of qualitative and quantitative properties of food.
It is important to note that even for foods that induce a low glycemic response (eg. Rice,
Sago Khichdi, etc), their overall nutritional properties especially in terms of nutrient density
should be considered carefully. For example, although Rice and Sago Khichdi induce a low
glycemic response, their overall nutrient and fiber content is very low which makes them less
224
satiating and requires accompaniment to improve nutritional quality whereas Thepla is more
fiber and protein dense.
Table 4.23 shows that high moisture containing foods such as boiled white Rice (1 cup) and
even semi-solid Rice Kheer (1/2 cup), which is sweet in nature, can be safely consumed in
their regular serving size without posing risk of postprandial hyperglycemia.
Regular serving size of Potato (1 big) and Sago Khichdi contains high amounts of moisture
but also relatively higher starch content and may be appropriately combined with fiber and
protein rich foods (Table 4.23).
We can observe that although products such as Marie biscuit and Puffed Rice are
hyperglycemic when consumed as 50g portions, due to their light and porous nature with a
high volume: weight ratio, the normal small serving sizes may not raise postprandial blood
sugars to a very large extent (Table 4.23).
In Indian dietary habits, the normal serving size of Chapatti may be around 2 medium sized,
even when consumed as a part of mixed meals. This regular serving size may produce
prolonged hyperglycemia, even greater than that induced by same amounts of bread and
almost double compared to serving of Thepla (2 small) (Table 4.23). It is beneficial to
exchange 1 Chapatti for 2 small Theplas, which form more complete foods containing
protein, fiber and fat in balanced amounts.
Chapatti prepared from whole wheat flour contains relatively less moisture, higher total solid,
concentrated starch, more fiber and proteins compared to plain boiled white Rice which
225
contains high moisture, low total solid content, predominantly hydrated starch, with
negligible proteins, fiber or other vitamins. Because of these attributes one feels hungry
faster after consuming Rice than after consuming Chapatti. With the current emphasis on
consuming small frequent meals this property of Rice may be considered as beneficial.
Chapatti or Rice is not consumed alone but usually with accompaniments such as dal,
vegetables, curds, etc. When compared for equal quantities consumed (50 or 100g) in the
context of mixed meals also, Rice seems to be a better choice than Chapatti as it does not
contribute to postprandial hyperglycemia. However, since Rice is low in protein and fiber the
nutrient density of meal should be improved by adding yoghurt, dal and/or vegetables to the
Rice. At the same time, it is suggested that one may consume only 1 medium/ 2 small
Chapatti(s) at one meal with other accompaniments to prevent increased hyperglycemic
effect. This emphasizes the importance of nature of starch/sugar (more amylopectin in Rice
which is readily digestible) and co-components (greater moisture, etc) present in foods in
influencing the postprandial metabolic response rather than only available carbohydrate
content. To obtain similar glycemic response, a larger quantity of Rice can be substituted
with Chapatti resulting in greater satiety including a feeling of fullness from Rice.
INDEX OF GLYCEMIC IMPACT
The concept of GIfood involves extension of the definition of GI to include responses to whole
foods rather than available carbohydrate. It is important to study the difference between these
food indices and their application in practical diet counseling.
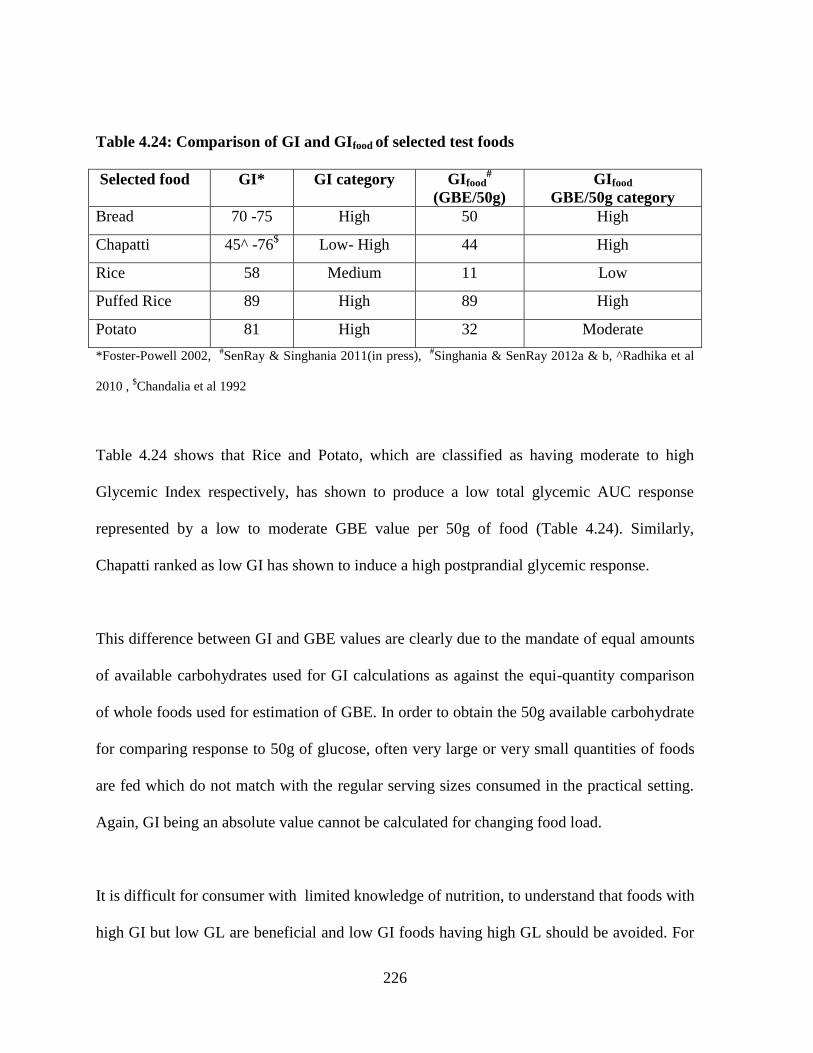
226
Table 4.24: Comparison of GI and GIfood of selected test foods
Selected food GI* GI category GIfood#
(GBE/50g)
GIfood
GBE/50g category
Bread 70 -75 High 50 High
Chapatti 45^ -76$ Low- High 44 High
Rice 58 Medium 11 Low
Puffed Rice 89 High 89 High
Potato 81 High 32 Moderate
*Foster-Powell 2002, #SenRay & Singhania 2011(in press),
#Singhania & SenRay 2012a & b, ^Radhika et al
2010 , $Chandalia et al 1992
Table 4.24 shows that Rice and Potato, which are classified as having moderate to high
Glycemic Index respectively, has shown to produce a low total glycemic AUC response
represented by a low to moderate GBE value per 50g of food (Table 4.24). Similarly,
Chapatti ranked as low GI has shown to induce a high postprandial glycemic response.
This difference between GI and GBE values are clearly due to the mandate of equal amounts
of available carbohydrates used for GI calculations as against the equi-quantity comparison
of whole foods used for estimation of GBE. In order to obtain the 50g available carbohydrate
for comparing response to 50g of glucose, often very large or very small quantities of foods
are fed which do not match with the regular serving sizes consumed in the practical setting.
Again, GI being an absolute value cannot be calculated for changing food load.
It is difficult for consumer with limited knowledge of nutrition, to understand that foods with
high GI but low GL are beneficial and low GI foods having high GL should be avoided. For
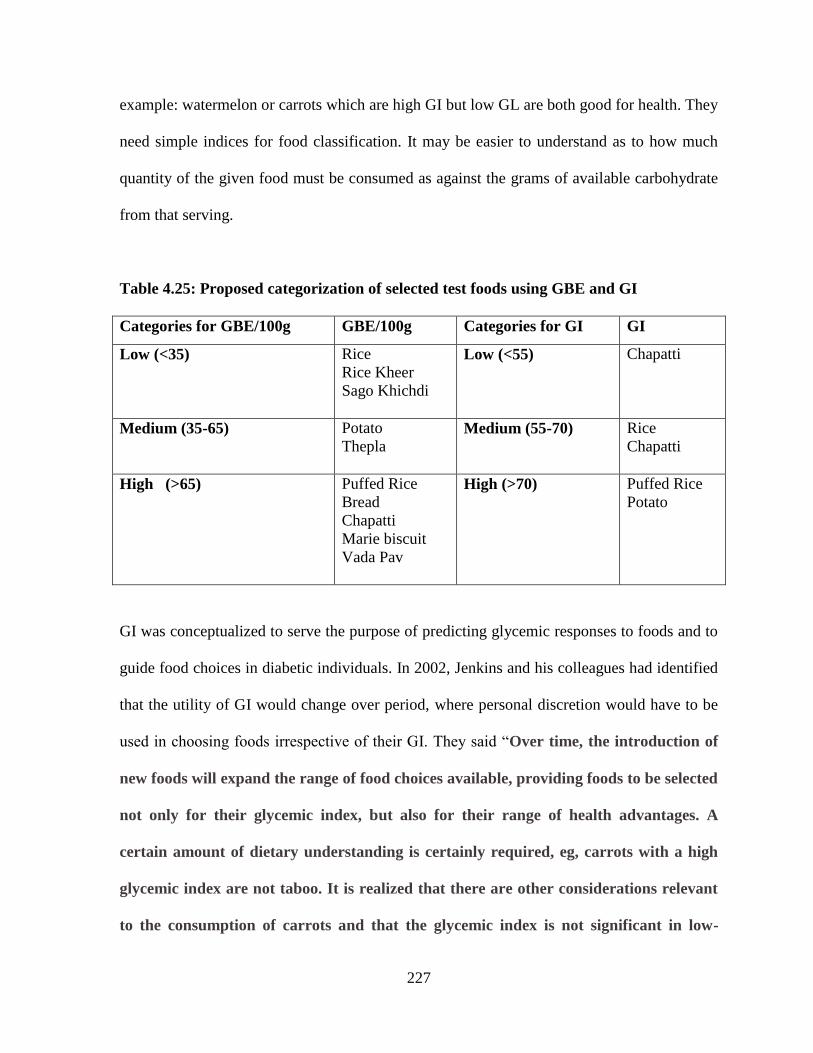
227
example: watermelon or carrots which are high GI but low GL are both good for health. They
need simple indices for food classification. It may be easier to understand as to how much
quantity of the given food must be consumed as against the grams of available carbohydrate
from that serving.
Table 4.25: Proposed categorization of selected test foods using GBE and GI
Categories for GBE/100g GBE/100g Categories for GI GI
Low (<35) Rice
Rice Kheer
Sago Khichdi
Low (<55) Chapatti
Medium (35-65) Potato
Thepla
Medium (55-70) Rice
Chapatti
High (>65) Puffed Rice
Bread
Chapatti
Marie biscuit
Vada Pav
High (>70) Puffed Rice
Potato
GI was conceptualized to serve the purpose of predicting glycemic responses to foods and to
guide food choices in diabetic individuals. In 2002, Jenkins and his colleagues had identified
that the utility of GI would change over period, where personal discretion would have to be
used in choosing foods irrespective of their GI. They said ―Over time, the introduction of
new foods will expand the range of food choices available, providing foods to be selected
not only for their glycemic index, but also for their range of health advantages. A
certain amount of dietary understanding is certainly required, eg, carrots with a high
glycemic index are not taboo. It is realized that there are other considerations relevant
to the consumption of carrots and that the glycemic index is not significant in low-
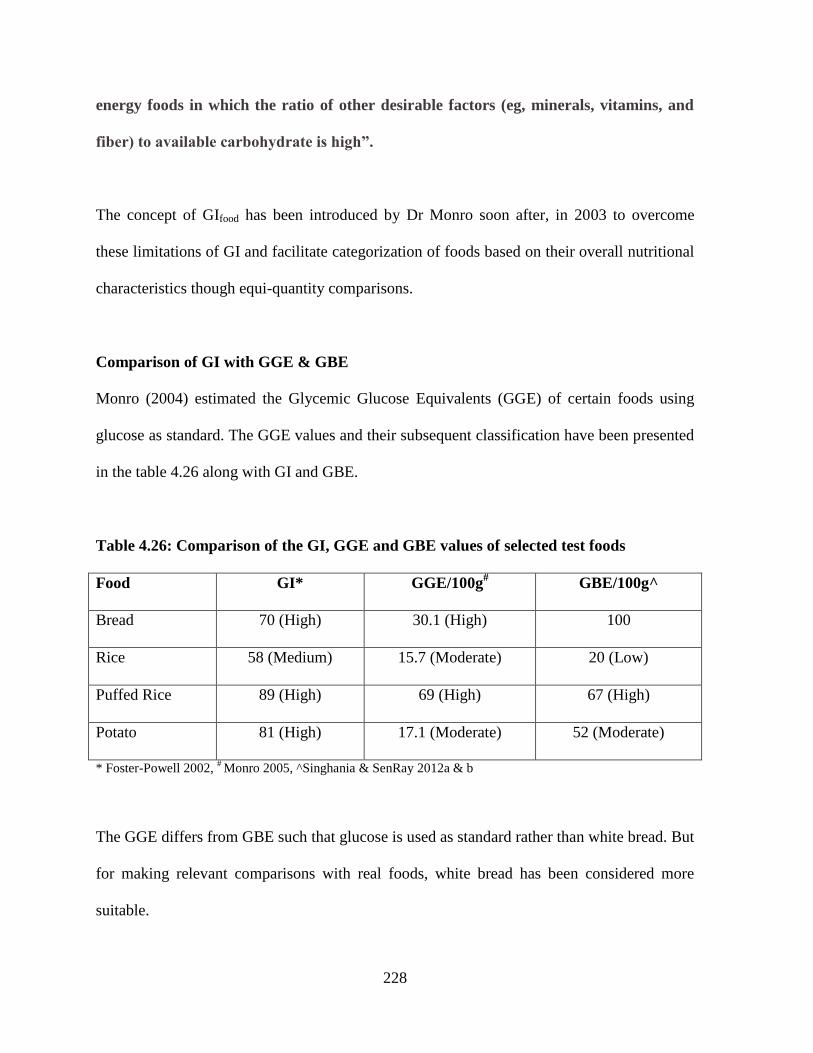
228
energy foods in which the ratio of other desirable factors (eg, minerals, vitamins, and
fiber) to available carbohydrate is high”.
The concept of GIfood has been introduced by Dr Monro soon after, in 2003 to overcome
these limitations of GI and facilitate categorization of foods based on their overall nutritional
characteristics though equi-quantity comparisons.
Comparison of GI with GGE & GBE
Monro (2004) estimated the Glycemic Glucose Equivalents (GGE) of certain foods using
glucose as standard. The GGE values and their subsequent classification have been presented
in the table 4.26 along with GI and GBE.
Table 4.26: Comparison of the GI, GGE and GBE values of selected test foods
Food GI* GGE/100g# GBE/100g^
Bread 70 (High) 30.1 (High) 100
Rice 58 (Medium) 15.7 (Moderate) 20 (Low)
Puffed Rice 89 (High) 69 (High) 67 (High)
Potato 81 (High) 17.1 (Moderate) 52 (Moderate)
* Foster-Powell 2002, # Monro 2005, ^Singhania & SenRay 2012a & b
The GGE differs from GBE such that glucose is used as standard rather than white bread. But
for making relevant comparisons with real foods, white bread has been considered more
suitable.
229
When equal quantities of bread and glucose were compared, the GGE of bread was again
found to be on the higher side (Table 4.26). For estimating GBE values, the area under the
curve response for bread was taken as 100.
Rice has been categorized as high GI, but having medium GGE and low GBE values (Table
4.26). Similarly, Potato which is considered to be having high GI produced moderate
glycemic response indicated by moderate GGE and GBE values. This may be attributed to
higher moisture content of both these foods. But Puffed Rice has shown less difference
throughout the three categories showing high values for GI, GGE as well as GBE. The
observations show that for foods with very low moisture content the values may be similar
across the three classifications but higher moisture content and presence of other co-
components may render the GI values unreliable in predicting true glycemic impact.
This reiterates the theory put forth by Jenkins et al (2002) that as the food variety and
composition grow, the understanding and utility would have to undergo modification to
characterize foods based on their overall nutritional qualities as well as quantity. This
requirement is fulfilled by use of GIfood expressed as Glycemic Bread Equivalents.
KEY OBSERVATIONS:
GBE values, expressed in gram units, can be placed alongside other nutrients in the
food exchange list to facilitate selection of foods based on their glycemic response
relative to that of bread.
230
A product‘s nutrition label informing the consumer about the glycemic effect of one
serving of the product is much easier concept to understand and use rather than
expressing them in terms of effect of available carbohydrate from that food.
During nutrition counseling, it can be explained that food composition that constitute
balanced meals with higher nutrient density (CHO+protein+fat+fiber) are beneficial
for postprandial hyperglycemic control.
Basic principle underlying the effective control and management of postprandial
hyperglycemia, is consumption of small and frequent meals with judicious choice of
food combinations to maximize nutrient intake including fiber.
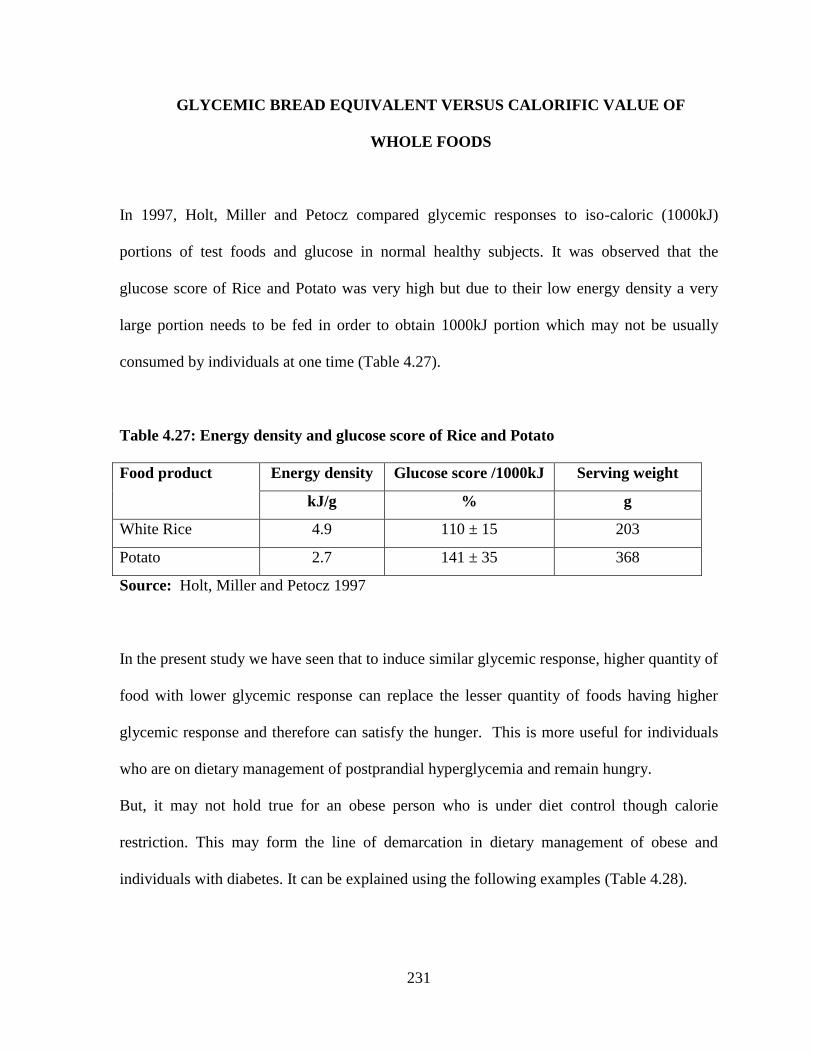
231
GLYCEMIC BREAD EQUIVALENT VERSUS CALORIFIC VALUE OF
WHOLE FOODS
In 1997, Holt, Miller and Petocz compared glycemic responses to iso-caloric (1000kJ)
portions of test foods and glucose in normal healthy subjects. It was observed that the
glucose score of Rice and Potato was very high but due to their low energy density a very
large portion needs to be fed in order to obtain 1000kJ portion which may not be usually
consumed by individuals at one time (Table 4.27).
Table 4.27: Energy density and glucose score of Rice and Potato
Food product Energy density Glucose score /1000kJ Serving weight
kJ/g % g
White Rice 4.9 110 ± 15 203
Potato 2.7 141 ± 35 368
Source: Holt, Miller and Petocz 1997
In the present study we have seen that to induce similar glycemic response, higher quantity of
food with lower glycemic response can replace the lesser quantity of foods having higher
glycemic response and therefore can satisfy the hunger. This is more useful for individuals
who are on dietary management of postprandial hyperglycemia and remain hungry.
But, it may not hold true for an obese person who is under diet control though calorie
restriction. This may form the line of demarcation in dietary management of obese and
individuals with diabetes. It can be explained using the following examples (Table 4.28).
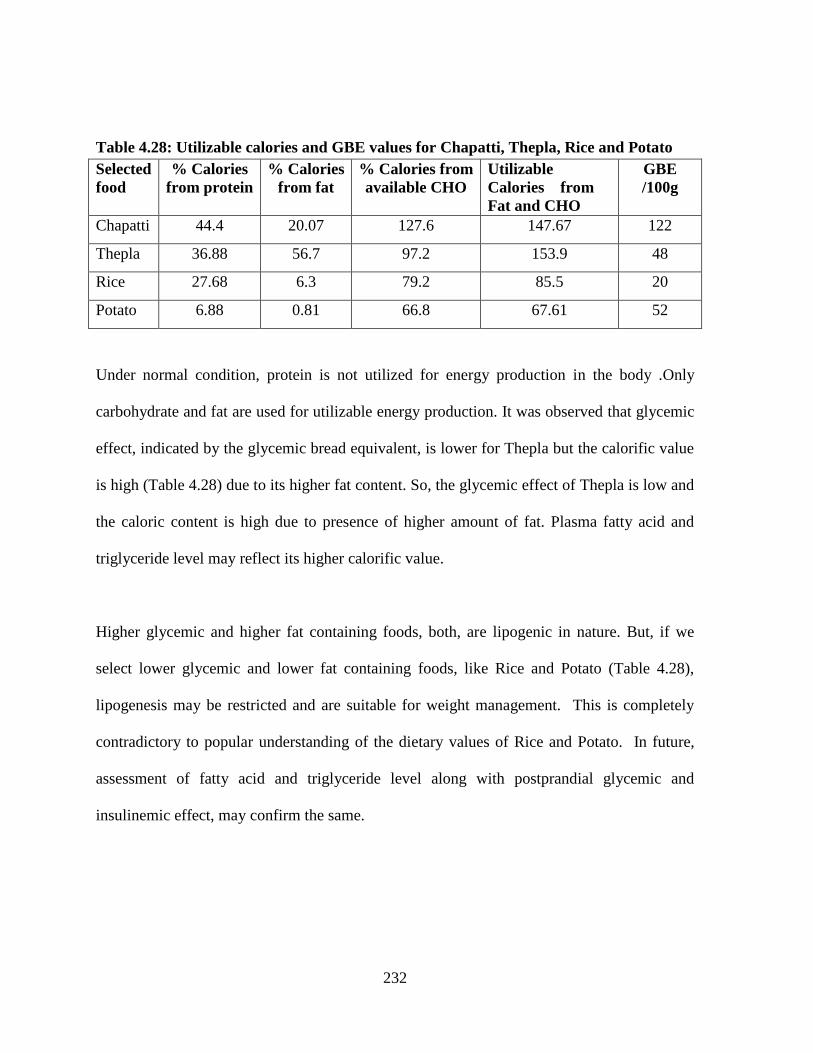
232
Table 4.28: Utilizable calories and GBE values for Chapatti, Thepla, Rice and Potato
Selected
food
% Calories
from protein
% Calories
from fat
% Calories from
available CHO
Utilizable
Calories from
Fat and CHO
GBE
/100g
Chapatti 44.4 20.07 127.6 147.67 122
Thepla 36.88 56.7 97.2 153.9 48
Rice 27.68 6.3 79.2 85.5 20
Potato 6.88 0.81 66.8 67.61 52
Under normal condition, protein is not utilized for energy production in the body .Only
carbohydrate and fat are used for utilizable energy production. It was observed that glycemic
effect, indicated by the glycemic bread equivalent, is lower for Thepla but the calorific value
is high (Table 4.28) due to its higher fat content. So, the glycemic effect of Thepla is low and
the caloric content is high due to presence of higher amount of fat. Plasma fatty acid and
triglyceride level may reflect its higher calorific value.
Higher glycemic and higher fat containing foods, both, are lipogenic in nature. But, if we
select lower glycemic and lower fat containing foods, like Rice and Potato (Table 4.28),
lipogenesis may be restricted and are suitable for weight management. This is completely
contradictory to popular understanding of the dietary values of Rice and Potato. In future,
assessment of fatty acid and triglyceride level along with postprandial glycemic and
insulinemic effect, may confirm the same.
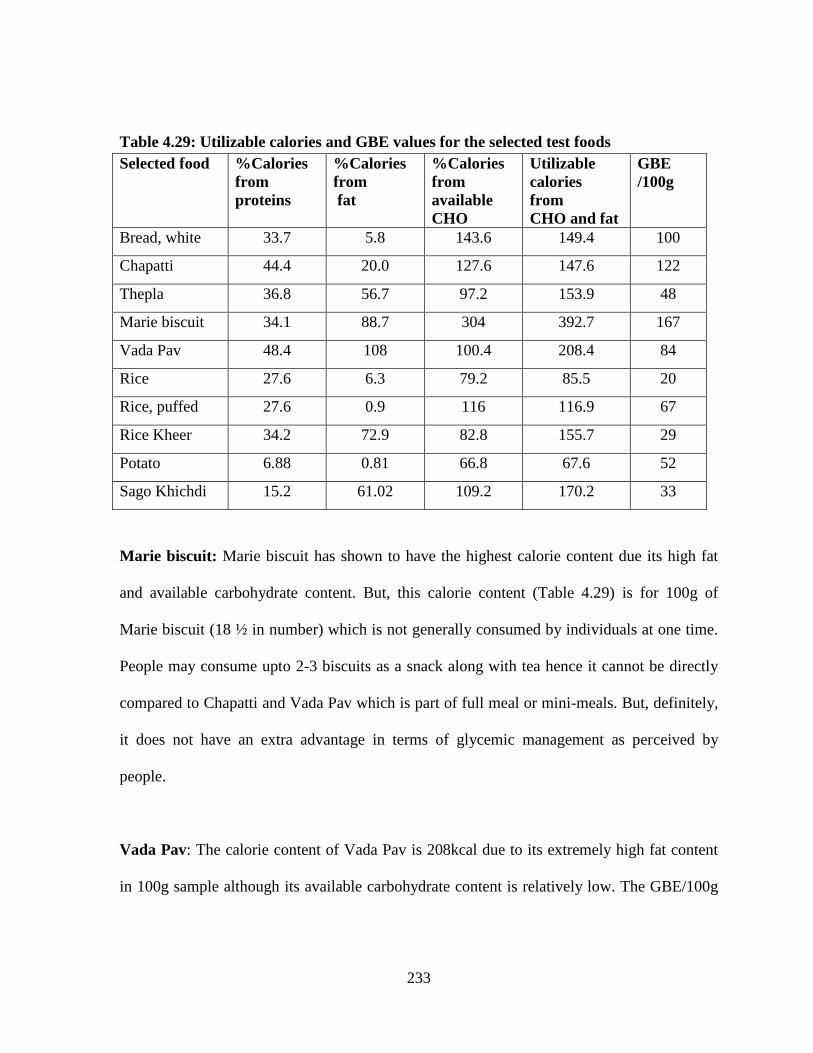
233
Table 4.29: Utilizable calories and GBE values for the selected test foods
Selected food %Calories
from
proteins
%Calories
from
fat
%Calories
from
available
CHO
Utilizable
calories
from
CHO and fat
GBE
/100g
Bread, white 33.7 5.8 143.6 149.4 100
Chapatti 44.4 20.0 127.6 147.6 122
Thepla 36.8 56.7 97.2 153.9 48
Marie biscuit 34.1 88.7 304 392.7 167
Vada Pav 48.4 108 100.4 208.4 84
Rice 27.6 6.3 79.2 85.5 20
Rice, puffed 27.6 0.9 116 116.9 67
Rice Kheer 34.2 72.9 82.8 155.7 29
Potato 6.88 0.81 66.8 67.6 52
Sago Khichdi 15.2 61.02 109.2 170.2 33
Marie biscuit: Marie biscuit has shown to have the highest calorie content due its high fat
and available carbohydrate content. But, this calorie content (Table 4.29) is for 100g of
Marie biscuit (18 ½ in number) which is not generally consumed by individuals at one time.
People may consume upto 2-3 biscuits as a snack along with tea hence it cannot be directly
compared to Chapatti and Vada Pav which is part of full meal or mini-meals. But, definitely,
it does not have an extra advantage in terms of glycemic management as perceived by
people.
Vada Pav: The calorie content of Vada Pav is 208kcal due to its extremely high fat content
in 100g sample although its available carbohydrate content is relatively low. The GBE/100g
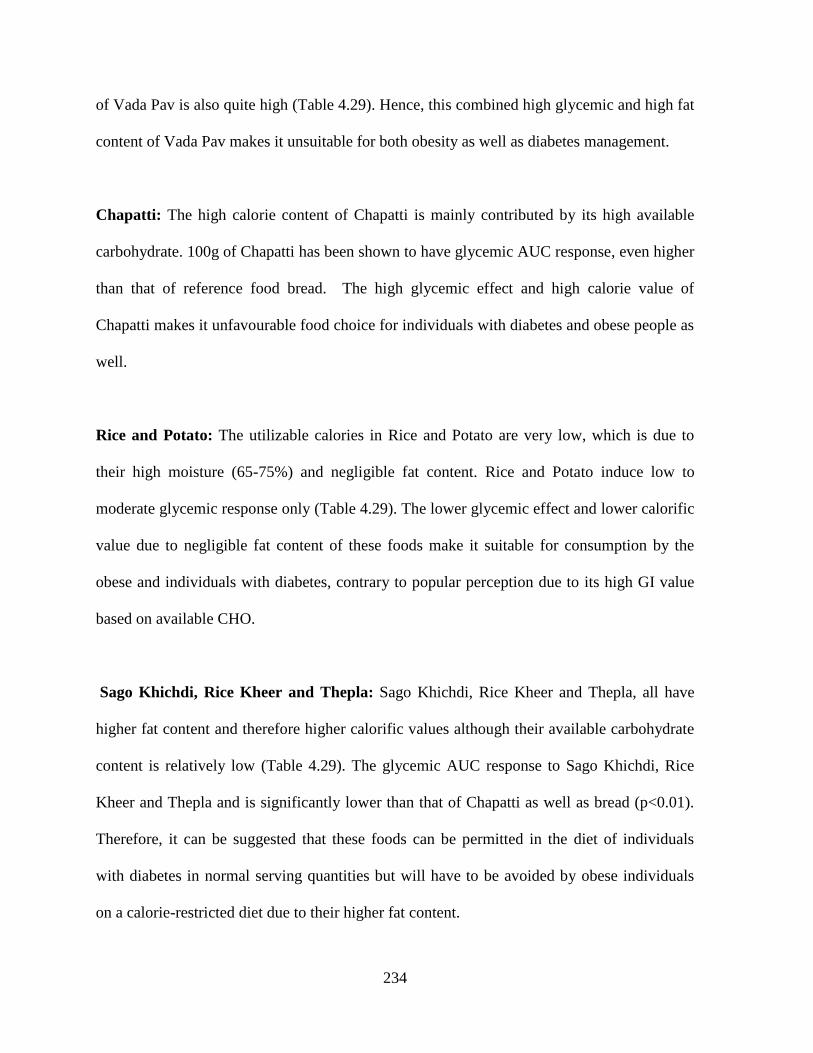
234
of Vada Pav is also quite high (Table 4.29). Hence, this combined high glycemic and high fat
content of Vada Pav makes it unsuitable for both obesity as well as diabetes management.
Chapatti: The high calorie content of Chapatti is mainly contributed by its high available
carbohydrate. 100g of Chapatti has been shown to have glycemic AUC response, even higher
than that of reference food bread. The high glycemic effect and high calorie value of
Chapatti makes it unfavourable food choice for individuals with diabetes and obese people as
well.
Rice and Potato: The utilizable calories in Rice and Potato are very low, which is due to
their high moisture (65-75%) and negligible fat content. Rice and Potato induce low to
moderate glycemic response only (Table 4.29). The lower glycemic effect and lower calorific
value due to negligible fat content of these foods make it suitable for consumption by the
obese and individuals with diabetes, contrary to popular perception due to its high GI value
based on available CHO.
Sago Khichdi, Rice Kheer and Thepla: Sago Khichdi, Rice Kheer and Thepla, all have
higher fat content and therefore higher calorific values although their available carbohydrate
content is relatively low (Table 4.29). The glycemic AUC response to Sago Khichdi, Rice
Kheer and Thepla and is significantly lower than that of Chapatti as well as bread (p<0.01).
Therefore, it can be suggested that these foods can be permitted in the diet of individuals
with diabetes in normal serving quantities but will have to be avoided by obese individuals
on a calorie-restricted diet due to their higher fat content.
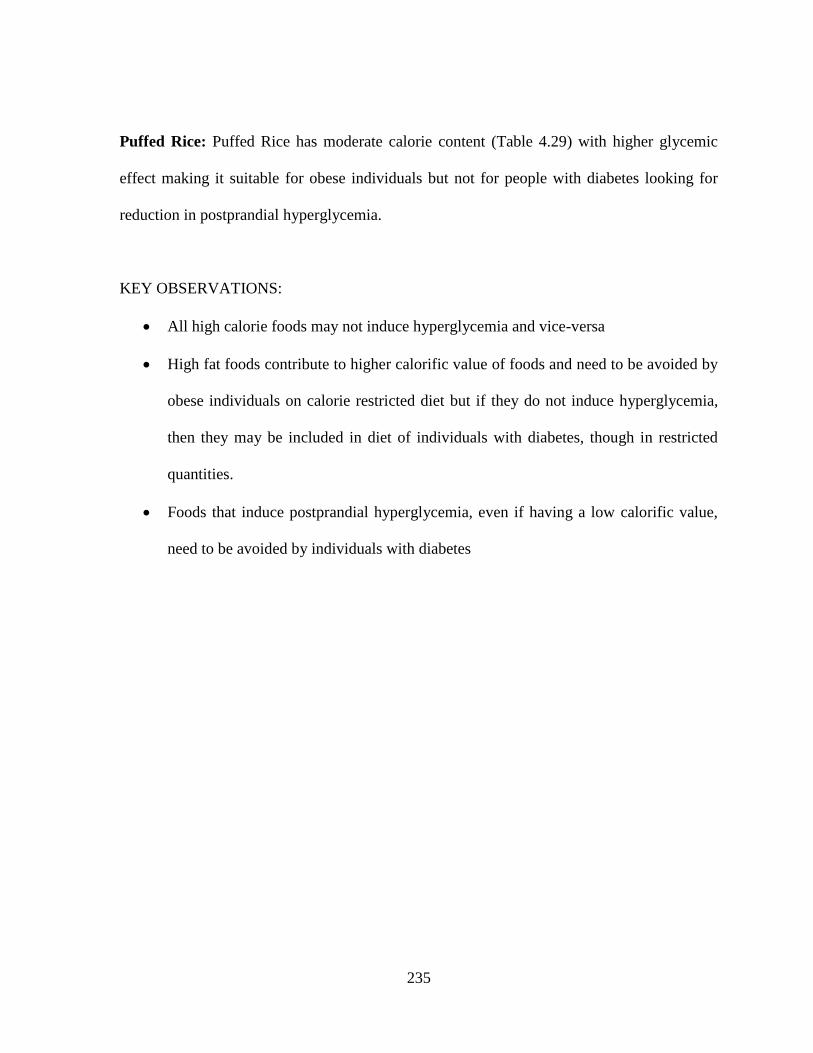
235
Puffed Rice: Puffed Rice has moderate calorie content (Table 4.29) with higher glycemic
effect making it suitable for obese individuals but not for people with diabetes looking for
reduction in postprandial hyperglycemia.
KEY OBSERVATIONS:
All high calorie foods may not induce hyperglycemia and vice-versa
High fat foods contribute to higher calorific value of foods and need to be avoided by
obese individuals on calorie restricted diet but if they do not induce hyperglycemia,
then they may be included in diet of individuals with diabetes, though in restricted
quantities.
Foods that induce postprandial hyperglycemia, even if having a low calorific value,
need to be avoided by individuals with diabetes
236
INSULINEMIC BREAD EQUIVALENT
A U- shaped relationship exists between both fasting and 2 h postprandial insulin responses
and mortality with low and high concentrations, being associated with an increased risk,
independent of other risk factors (Balkau & Eschwege 1999). Hyperinsulinemia has been
recognized as an independent risk factor for ischemic heart disease in men (Després et al
1996). Service et al (1983) proposed that in order to plan treatment strategies for overall
control of meal related glycemia, knowledge of factors affecting both glycemic and insulin
responses need to be studied.
Insulin resistance has been recognized as one of the major causes of obesity. In the insulin
resistant individuals, foods that stimulate increased insulin production should be avoided
because it may cause greater stress on the beta cells to secrete more insulin. This may lead to
beta cell exhaustion further worsening the condition. Also, since the insulin receptors are
decreased, persistent high plasma insulin levels will promote fat storage and obesity. Food or
combination of foods that cause low to moderate insulinergic effect should be included in the
diet.
Insulin responses have been assumed as being proportional to glycemic responses and hence
have been less explored for its specific responses based on food composition. IBE values
have been calculated for all test foods in addition to GBE, primarily to determine whether
glycemic and insulin responses are parallel for the given food products or insulin exerts an
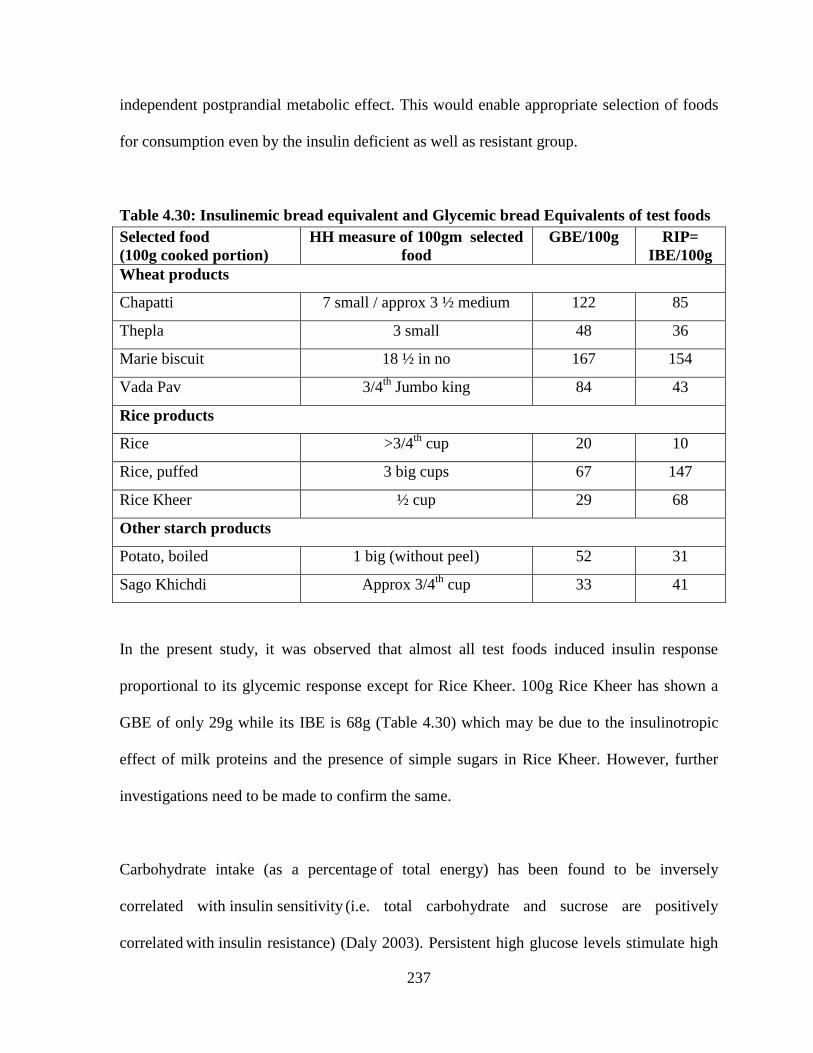
237
independent postprandial metabolic effect. This would enable appropriate selection of foods
for consumption even by the insulin deficient as well as resistant group.
Table 4.30: Insulinemic bread equivalent and Glycemic bread Equivalents of test foods
Selected food
(100g cooked portion)
HH measure of 100gm selected
food
GBE/100g RIP=
IBE/100g
Wheat products
Chapatti 7 small / approx 3 ½ medium 122 85
Thepla 3 small 48 36
Marie biscuit 18 ½ in no 167 154
Vada Pav 3/4th
Jumbo king 84 43
Rice products
Rice >3/4th
cup 20 10
Rice, puffed 3 big cups 67 147
Rice Kheer ½ cup 29 68
Other starch products
Potato, boiled 1 big (without peel) 52 31
Sago Khichdi Approx 3/4th
cup 33 41
In the present study, it was observed that almost all test foods induced insulin response
proportional to its glycemic response except for Rice Kheer. 100g Rice Kheer has shown a
GBE of only 29g while its IBE is 68g (Table 4.30) which may be due to the insulinotropic
effect of milk proteins and the presence of simple sugars in Rice Kheer. However, further
investigations need to be made to confirm the same.
Carbohydrate intake (as a percentage of total energy) has been found to be inversely
correlated with insulin sensitivity (i.e. total carbohydrate and sucrose are positively
correlated with insulin resistance) (Daly 2003). Persistent high glucose levels stimulate high
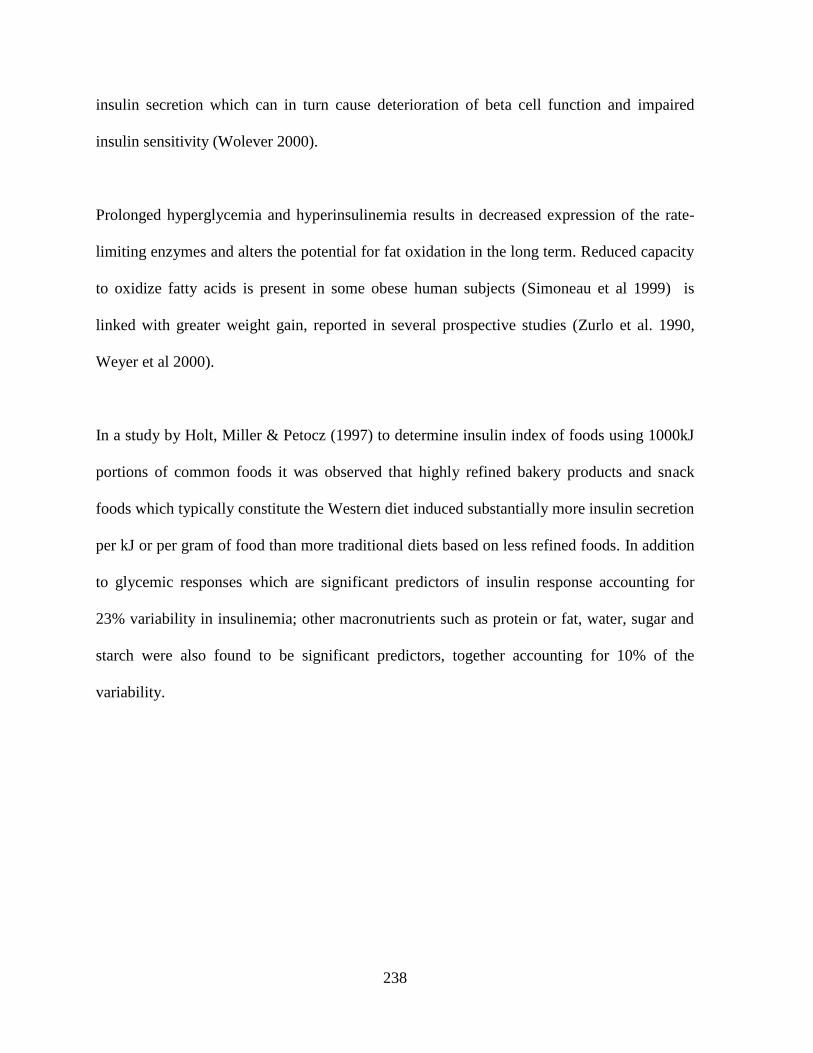
238
insulin secretion which can in turn cause deterioration of beta cell function and impaired
insulin sensitivity (Wolever 2000).
Prolonged hyperglycemia and hyperinsulinemia results in decreased expression of the rate-
limiting enzymes and alters the potential for fat oxidation in the long term. Reduced capacity
to oxidize fatty acids is present in some obese human subjects (Simoneau et al 1999) is
linked with greater weight gain, reported in several prospective studies (Zurlo et al. 1990,
Weyer et al 2000).
In a study by Holt, Miller & Petocz (1997) to determine insulin index of foods using 1000kJ
portions of common foods it was observed that highly refined bakery products and snack
foods which typically constitute the Western diet induced substantially more insulin secretion
per kJ or per gram of food than more traditional diets based on less refined foods. In addition
to glycemic responses which are significant predictors of insulin response accounting for
23% variability in insulinemia; other macronutrients such as protein or fat, water, sugar and
starch were also found to be significant predictors, together accounting for 10% of the
variability.
239
Table 4.31: Reported and proposed Insulin score
Reported by Holt et al 1997 Proposed from current study
Selected
food
Energy
density
Insulin
score /
1000kJ
Serving
weight
Predicted
Insulin
score/100g
serving
weight
Serving
weight
Energy
/100g
IBE
/100g
kJ/g % g % g kJ g
White
bread
10.6 100±0 94 103 100 1028 100
White
Rice
4.9 79±12 203 123 100 1554 10
Potatoes 2.7 121±11 368 95 100 788 31
The insulin index determined by feeding iso-caloric (1000kJ) portions of test foods and
glucose yielded high insulin scores for Rice and Potatoes (Table 4.31). The energy density of
Rice and Potato being very low, a larger quantity is required to be fed to obtain the 1000kJ
portions. Energy density of Rice is low (Table 4.31) and consuming upto 200g of Rice would
induce an insulin response of 79%. Similarly, since Potatoes provide only 2.7kJ/kg, we need
to consume 368g to attain 1000kJ. One may not consume that quantity of Rice or Potato at
one time.
For determining the insulin score for a lesser quantity of Rice, comparison with iso-caloric
portion of bread needs to be made again. The classification of foods considering iso-caloric
quantity, limits its application in practical setting. The use of Insulin bread equivalent which
is presented in gram units can be roughly estimated for a given food quantity thereby
providing a simple and easy-to-understand tool for classification of foods.
240
The Relative Insulinemic Potency (RIP – IBE/100g of food) calculated in the present study
by feeding equal quantities of test foods and white bread to yield the Insulinemic bread
equivalent have shown that insulin response to 100g of cooked Rice and boiled Potato was
found to be not very high (Table 4.31). Hence, these foods may not be detrimental for the
insulin resistant or insulin deficient group by producing a higher insulin demand.
Nevertheless, the quantities of these foods should be monitored and they should be
accompanied by a fiber and protein source in order to attenuate the insulin response.
Insulin sensitivity increases with higher intakes of whole grains as dark breads, high fiber
and cooked cereals as reported in the Insulin Resistance Atherosclerosis Study (IRAS Exam
I, 1992-1994) (Liese et al 2003). Lau et al (2005) noted that the incidence of IR was not
directly associated with habitual intake of high glycemic index and high glycemic load diet
or with a high content of total carbohydrate (including simple sugars) but was inversely
related to dietary fiber intake.
Swinburn et al (1991) showed that high versus low carbohydrate diet led to marked and
significant improvement in oral glucose tolerance and significant reduction in fasting plasma
glucose. Although no significant change in insulin sensitivity was observed, significant
improvements in glucose effectiveness (the ability of glucose to stimulate its own removal)
and in pancreatic responsiveness (plasma insulin response after intravenous glucose
injection) was noted suggesting that carbohydrate intake has more important effect on
pancreatic function and other combined factors than directly on insulin sensitivity alone.
Therefore, it can be proposed that effective diabetes management involves careful selection
241
of both the quality and quantity of carbohydrate and not only quantity. Quantity of
carbohydrate in the diet in fact, have an impact on health of pancreas rather than sensitivity
of insulin, indicating quantity of carbohydrate are more important for Type II diabetic having
insufficient insulin. There is a need for research for a possible specific product development
based on quality and quantity, tailor made for dietary management of insulin deficient or
insulin resistant group.
KEY OBSERVATIONS:
Insulin response to protein rich and refined carbohydrate containing foods is
disproportionately higher than the glycemic response
Insulin response is more sensitive to dose as compared to glycemic response
The understanding of insulin secretory response to foods through IBE value can help
to suggest foods suitable for the insulin resistant or insulin deficient group.