Provincial profile: Mpumalanga - Statistics South Africa · Statistics South Africa Census 2011...
105
Provincial profile: Mpumalanga The South Africa I know, the home I understand
Transcript of Provincial profile: Mpumalanga - Statistics South Africa · Statistics South Africa Census 2011...

Provincial profile: Mpumalanga
The South Africa I know, the home I understand

Provincial profile: Mpumalanga
Census 2011
Statistics South Africa
Pali LehohlaStatistician-GeneralReport No. 03-01-77 (2011)

Statistics South Africa
Census 2011 Provincial Profile: Mpumalanga, Report 03-01-77
ii
Census 2011 Provincial Profile: Mpumalanga / Statistics South Africa Published by Statistics South Africa, Private Bag X44, Pretoria 0001 © Statistics South Africa, 2014 Users may apply or process this data, provided Statistics South Africa (Stats SA) is acknowledged as the original source of the data; that it is specified that the application and/or analysis is the result of the user's independent processing of the data; and that neither the basic data nor any reprocessed version or application thereof may be sold or offered for sale in any form whatsoever without prior permission from Stats SA. Stats SA Library Cataloguing-in-Publication (CIP) Data Census 2011 Provincial Profile: Mpumalanga / Statistics South Africa. Pretoria: Statistics South Africa 2014 103p. [Report No. 03-01-77 (2011)] ISBN: 978-0-621-43216-9 A complete set of Stats SA publications is available at the Stats SA Library and the following libraries: National Library of South Africa, Pretoria Division National Library of South Africa, Cape Town Division Natal Society Library, Pietermaritzburg Library of Parliament, Cape Town Bloemfontein Public Library Johannesburg Public Library Eastern Cape Library Services, King William's Town Central Regional Library, Polokwane Central Reference Library, Nelspruit Central Reference Collection, Kimberley Central Reference Library, Mmabatho This publication is available on the Stats SA website: www.statssa.gov.za Enquiries: Mpumalanga Provincial Office Tel: (013) 762 0000

Statistics South Africa
Census 2011 Provincial Profile: Mpumalanga, Report 03-01-77
iii
Contents Chapter 1: Introduction ................................................................................................................... 1
1.1 Overview ........................................................................................................................................ 1
1.2 How the count was done ............................................................................................................... 1
1.2.1 Planning .................................................................................................................................. 1
1.2.2 Pre-enumeration .................................................................................................................... 1
1.2.3 Enumeration ........................................................................................................................... 2
1.2.4 Data processing ...................................................................................................................... 2
1.2.5 Data editing and validation system ........................................................................................ 2
1.2.5.1 Editing team .................................................................................................................. 3 1.2.5.2 Role of the team ........................................................................................................... 3 1.2.5.3 Editing strategy for Census 2011 .................................................................................. 3
1.2.6 Independent monitoring and evaluation of census field activities ........................................ 4
1.2.7 Post-enumeration survey (PES) .............................................................................................. 4
1.2.7.1 Preparations for the PES ............................................................................................... 5 1.2.7.2 Methodology ................................................................................................................. 6 1.2.7.3 Sampling ........................................................................................................................ 6 1.2.7.4 Questionnaire development ......................................................................................... 6 1.2.7.5 Fieldwork methodology ................................................................................................ 7 1.2.7.6 Matching and reconciliation methodology ................................................................... 7 1.2.7.7 PES data collection ........................................................................................................ 7 1.2.7.8 Matching and reconciliation ......................................................................................... 8 1.2.7.9 Estimation and tabulation............................................................................................. 9
1.3 Conclusion ....................................................................................................................................10
Chapter 2: Geography of South Africa ........................................................................................... 11
2.1 Provincial boundary changes: 2001 to 2011 ................................................................................11
2.2 Local municipal boundary changes, 2001–2011 ..........................................................................13
2.3 Comparing Census 2011 with previous censuses ........................................................................15
Chapter 3: Results pertaining to persons ....................................................................................... 16
3.1 Introduction .................................................................................................................................16
3.2 Population size and distribution ..................................................................................................16
3.3 Population structure: Age and sex ...............................................................................................22
3.4 Language ......................................................................................................................................26
3.5 Migration ......................................................................................................................................27
3.6 General health and functioning ...................................................................................................29
3.6.1 Introduction ..........................................................................................................................29
3.7 Education .....................................................................................................................................30
3.8 The labour market ........................................................................................................................35

Statistics South Africa
Census 2011 Provincial Profile: Mpumalanga, Report 03-01-77
iv
Chapter 4: Results pertaining to households .................................................................................. 39
4.1 Households ...................................................................................................................................39
4.2 Housing conditions .......................................................................................................................43
4.3 Household goods .........................................................................................................................52
Chapter 5: Conclusion ................................................................................................................... 54
Chapter 6: Appendix ...................................................................................................................... 57
Terms and definitions .................................................................................................................... 94
List of tables Table 1.1: Net census coverage error – Total and rate by province ......................................................10
Table 2.1: Geographical land area changes since 2001 .........................................................................11
Table 3.1: Population of South Africa by province and percentage changes, censuses of 1996, 2001 and 2011 ........................................................................................................................................16
Table 3.2: Population of South Africa by province and percentage distribution, censuses of 1996, 2001 and 2011 ........................................................................................................................................17
Table 3.3: Percentage distribution of the South African population by population group and province, censuses of 1996, 2001 and 2011 ..........................................................................................18
Table 3.4: Population size and percentage changes by district and local municipality, censuses of 1996, 2001 and 2011 ..............................................................................................................................19
Table 3.5: Population size and percentage distribution by district and local municipality, censuses of 1996, 2001 and 2011 ..........................................................................................................20
Table 3.6: Percentage distribution of the population groups by population group by district and local municipality, censuses of 1996, 2001 and 2011 ............................................................................21
Table 3.7: Population by language spoken, district, and local municipality, Census 2011 ....................26
Table 3.8: Distribution of population aged 5 years and older by disability status and sex, Census 2011 ........................................................................................................................................................29
Table 4.1: Number of households by district and local municipality, censuses of 1996, 2001 and 2011 ........................................................................................................................................................39
Table 4.2: Number of persons enumerated in households by district and local municipality, censuses of 1996, 2001 and 2011 ..........................................................................................................40
Table 4.3: Average household size by district and local municipality, censuses of 1996, 2001 and 2011 ........................................................................................................................................................41
Table 6.1: Population distribution of South Africa by age and sex, censuses of 1996, 2001 and 2011 ........................................................................................................................................................57
Table 6.2: Population distribution of Mpumalanga by age and sex, censuses of 1996, 2001 and 2011 ........................................................................................................................................................58
Table 6.3: Population of Mpumalanga by sex and district and local municipality, censuses of 1996, 2001 and 2011 ..............................................................................................................................59
Table 6.4: Population of Mpumalanga by broad age groups and district and local municipality, censuses of 1996, 2001 and 2011 ..........................................................................................................60
Table 6.5: Province of previous residence by province of usual residence, between Census 2001 and Census 2011 ....................................................................................................................................61

Statistics South Africa
Census 2011 Provincial Profile: Mpumalanga, Report 03-01-77
v
Table 6.6: Inter-provincial migration by sex, between Census 2001 and Census 2011 .........................61
Table 6.7: In-migration to Mpumalanga by 5-year age groups, between Census 2001 and Census 2011 ........................................................................................................................................................62
Table 6.8: Out-migration from Mpumalanga by 5-year age groups, between Census 2001 and Census 2011 ...........................................................................................................................................63
Table 6.9: In-migration to Mpumalanga by broad age groups, between Census 2001 and Census 2011 ........................................................................................................................................................64
Table 6.10: Out-migration from Mpumalanga by broad age groups, between Census 2001 and Census 2011 ...........................................................................................................................................64
Table 6.11: Percentage distribution of the population aged 5 years and older by type of disability, status and sex, Census 2011 ..................................................................................................65
Table 6.12: Percentage of persons aged 5–24 years attending an educational institution by district and local municipality, Census 2011 ..........................................................................................66
Table 6.13: Percentage of persons aged 5–24 years attending an educational institution by district and local municipality, Census 2001 ..........................................................................................67
Table 6.14: Number of persons aged 5–24 years attending school by district and local municipality, Census 2001 and Census 2011 .........................................................................................68
Table 6.15: Percentage of persons aged 5–24 years attending public or private educational institutions by district and local municipality, Census 2001 and Census 2011 ......................................69
Table 6.16: Highest educational attainment amongst persons aged 20 years and older by municipality, censuses of 1996, 2001 and 2011 (numbers) ...................................................................70
Table 6.17: Highest educational attainment amongst persons aged 20 years and older by municipality, censuses of 1996, 2001 and 2011 (percentages) .............................................................71
Table 6.18: Highest educational attainment amongst persons aged 20 years and older by sex and district, 2011 ...........................................................................................................................................72
Table 6.19: Highest educational attainment amongst persons aged 20 years and older by sex and district, 2001 ...........................................................................................................................................73
Table 6.20: Highest educational attainment amongst persons aged 20 years and older by population group and district, 2011 .......................................................................................................74
Table 6.21: Highest educational attainment amongst persons aged 20 years and older by population group and district, 2001 .......................................................................................................75
Table 6.22: Economically active and inactive population by sex and district and local municipality, 2001 and 2011 (numbers) ................................................................................................76
Table 6.23: Economically active and inactive population by sex and district and local municipality, 2001 and 2011 (percentages) ...........................................................................................77
Table 6.24: Employment and unemployment rates by sex and by district and local municipality, Census 2001 and Census 2011 ...............................................................................................................78
Table 6.25: Employment and unemployment rates by age group and by district and local municipality, Census 2001 and Census 2011 .........................................................................................79
Table 6.26: Percentage distribution of heads of households by sex and age, Census 2001 and Census 2011 ...........................................................................................................................................80
Table 6.27: Percentage distribution of heads of households by sex and by district and local municipality, Census 2001 and Census 2011 .........................................................................................81
Table 6.28: Percentage distribution of heads of households by age group and by district and local municipality, Census 2001 ......................................................................................................................82

Statistics South Africa
Census 2011 Provincial Profile: Mpumalanga, Report 03-01-77
vi
Table 6.29: Percentage distribution of heads of households by age group and by district and local municipality, Census 2011 ......................................................................................................................83
Table 6.30: Percentage distribution of households by type of dwelling and by district and local municipality, censuses of 1996, 2001 and 2011 ....................................................................................84
Table 6.31: Percentage distribution of households by annual average household income and by district municipality, Census 2001 and Census 2011 .............................................................................85
Table 6.32: Percentage distribution of households by type of refuse disposal and by district and local municipality, censuses of 1996, 2001 and 2011 ............................................................................86
Table 6.33: Percentage distribution of households by type of toilet facility and by district and local municipality, censuses of 1996, 2001 and 2011 ............................................................................87
Table 6.34: Percentage distribution of households by type energy used for lighting and by district and local municipality, censuses of 1996, 2001 and 2011 .....................................................................88
Table 6.35: Percentage distribution of households by type of energy/fuel used for cooking and by district and local municipality, censuses of 1996, 2001 and 2011 ....................................................89
Table 6.36: Percentage distribution of households by type energy/fuel used for heating and by district and local municipality, censuses of 1996, 2001 and 2011 .........................................................90
Table 6.37: Percentage of households that have access to piped water by district and local municipality, censuses of 1996, 2001 and 2011 ....................................................................................91
Table 6.38: Percentage of households that own specific household goods by district and local municipality, censuses of 1996, 2001 and 2011 ....................................................................................92
Table 6.39: Number of households that have access to the Internet by district and local municipality, Census 2011 ......................................................................................................................93
List of figures Figure 2.1: Percentage distribution of land area by province, 2011 ......................................................15
Figure 3.1: Population structure by age and sex – South Africa, 2011 ..................................................22
Figure 3.2: Population structure by age and sex – Mpumalanga, 2011 .................................................22
Figure 3.3: Population structure by age and sex – South Africa, 2001 ..................................................23
Figure 3.4: Population structure by age and sex – Mpumalanga, 2001 .................................................23
Figure 3.5: Population structure by age and sex – South Africa, 1996 ..................................................24
Figure 3.6: Population structure by age and sex – Mpumalanga, 1996 .................................................24
Figure 3.7: Dependency ratios by district municipality, censuses of 1996, 2001 and 2011 ..................25
Figure 3.8: Inter-provincial migration, between Census 2001 and Census 2011 ...................................27
Figure 3.9: Provincial in-migration by sex, between Census 2001 and Census 2011 ............................28
Figure 3.10: Provincial out-migration by sex, between Census 2001 and Census 2011 ........................28
Figure 3.11: Percentage of persons aged 5–24 years attending an educational institution, censuses of 1996, 2001 and 2011 ..........................................................................................................30
Figure 3.12: Percentage of persons aged 5–24 years attending an educational institution by district municipality, Census 2001 and Census 2011 .............................................................................31
Figure 3.13: Percentage of persons aged 5–24 years attending an educational institution by type of institution and by district municipality, Census 2001 and Census 2011 ............................................31

Statistics South Africa
Census 2011 Provincial Profile: Mpumalanga, Report 03-01-77
vii
Figure 3.14: Highest educational attainment amongst persons aged 20 years and older by district municipality, Census 2001 and Census 2011 .........................................................................................32
Figure 3.15: Highest educational attainment amongst persons aged 20 years and older by sex, Census 2001 and Census 2011 ...............................................................................................................33
Figure 3.16: Highest educational attainment amongst persons aged 20 years and older by population group, Census 2001 and Census 2011 .................................................................................34
Figure 3.17: Percentage of economically active and inactive population by district municipality, Census 2001 and Census 2011 ...............................................................................................................35
Figure 3.18: Percentage of economically active and inactive population by sex and district municipality, Census 2001 and Census 2011 .........................................................................................36
Figure 3.19: Unemployment rates by district municipality, Census 2001 and Census 2011 .................37
Figure 3.20: Youth unemployment rate by district municipality, Census 2001 and Census 2011 .........37
Figure 3.21: Unemployment rates by sex and district municipality, Census 2001 and Census 2011 ....38
Figure 4.1: Household heads by sex and age, Census 2011 ...................................................................42
Figure 4.2: Household heads by sex and age, Census 2001 ...................................................................42
Figure 4.3: Percentage distribution of households by type of dwelling and by district municipality, censuses of 1996, 2001 and 2011 ....................................................................................43
Figure 4.4: Percentage distribution of households by type of tenure status, Census 2001 and Census 2011 ...........................................................................................................................................44
Figure 4.5: Percentage distribution of households by annual average household income, Census 2001 and Census 2011 ...........................................................................................................................45
Figure 4.6: Percentage distribution of households by type of refuse disposal and by district municipality, censuses of 1996, 2001 and 2011 ....................................................................................46
Figure 4.7: Percentage distribution of households by type of toilet facility and by district municipality, censuses of 1996, 2001 and 2011 ....................................................................................47
Figure 4.8: Percentage distribution of households by type of energy or fuel used for lighting and by district municipality, censuses of 1996, 2001 and 2011 ...................................................................48
Figure 4.9: Percentage distribution of households by type of energy or fuel used for cooking and by district municipality, censuses of 1996, 2001 and 2011 ...................................................................49
Figure 4.10: Percentage distribution of households by type of energy or fuel used for heating and by district municipality, censuses of 1996, 2001 and 2011 ............................................................50
Figure 4.11: Percentage of households having access to piped water by district municipality, censuses of 1996, 2001 and 2011 ..........................................................................................................51
Figure 4.12: Percentage of households owning specific household goods by district municipality, censuses of 1996, 2001 and 2011 ..........................................................................................................52
Figure 4.13: Access to the Internet, Census 2011 ..................................................................................53
List of maps Map 2.1: Provincial boundary changes since 2001 ................................................................................12
Map 2.2: Municipal boundary changes since 2001 ................................................................................14

Statistics South Africa
Census 2011 Provincial Profile: Mpumalanga, Report 03-01-77
1
Chapter 1: Introduction
1.1 Overview
Censuses are a principal means of collecting basic population and housing statistics required for social and economic development, policy interventions, their implementation and evaluation. South Africa has conducted three censuses (1996, 2001 and 2011). Census 2011 was the third census to be conducted since the post-democratic elections in 1994, and a number of population and household attributes were measured and a variety of indicators generated. This chapter provides information on how the count was done.
1.2 How the count was done
Census 2011 was conducted from 9 to 31 October 2011. This section focuses on the various activities that were carried out prior to the finalisation of the results. They can be summarised as follows: Planning, pre-enumeration, enumeration, processing and editing.
1.2.1 Planning
This process involved the development of the overall strategy, the structure for the project, component plans and budget. These processes were started in 2003 and were subsequently reviewed in 2008, after the completion of the Community Survey (CS) in 2007. Methodologies and procedures were then developed and tested in a form of mini-tests and a pilot in 2008 and 2009 respectively. The findings from these tests helped to refine the plans and methods for the final test in 2010 called the “Dress Rehearsal”. The latter was expected to be a replica of how the actual count was to be conducted in 2011, and therefore the timing had to be the same month as the main census, i.e. October month.
1.2.2 Pre-enumeration
The pre-enumeration phase mainly involved the final preparatory work before the actual count. It started with mass production of census instruments like questionnaires, manuals, field gear, etc. The phase also involved acquisition of satellite offices required in the districts, recruitment of the first level of field management staff (District Census Coordinators – 130 DCCs; and Fieldwork Coordinators – 6 000 FWCs). These groups of people were then given intense training based on their key performance areas. At the same time, the country was sub-divided into small pockets called enumeration areas (EAs). The underlying principle for this sub-division is that an EA should be within reach of a Fieldworker and all households in that EA can be covered within the allocated number of days. This process yielded 103 576 EAs. The other benefit for this sub-division is the finalisation of the distribution plan of all materials required in the provinces and districts. It also gives a better estimate of the number of field staff to recruit for the count. The pre-enumeration phase involved over 7 000 staff.

Statistics South Africa
Census 2011 Provincial Profile: Mpumalanga, Report 03-01-77
2
1.2.3 Enumeration
The enumeration phase started with the training of supervisors as listers. Each person had to list all dwellings within an EA and had a minimum of four EAs to cover. These areas were called supervisory units. As they were listing, they were also expected to publicise the activities of the Census 2011 within their supervisory units. Upon completion of listing, final adjustments of workload and number of enumerators required were finalised. Training of enumerators started in earnest, and it mainly covered how to complete the questionnaire and to read a map. The latter was to aid them to identify the boundaries of their assigned areas. Enumerators were also given a few days before the start of the count to update their orientation book with any developments that might have happened since listing, as well as to introduce themselves to the communities they were to work with, through posters bearing their photos and special identification cards. On the night of 9 October, the actual count started with the homeless and special institutions given special attention. The enumeration phase was undertaken by an army of field staff in excess of 160 000, including management.
1.2.4 Data processing
The processing of over 15 million questionnaires commenced in January 2012, immediately after the completion of the reverse logistics in December 2011. Each box and its contents were assigned a store location in the processing centre via a store management system. Each time a box was required for any process it was called through this system. The processing phase was sub-divided into the following processes: primary preparation – where all completed questionnaires were grouped into clusters of 25 and the spine of the questionnaire cut off; Secondary preparation – where questionnaires were finally prepared for scanning, by removing foreign materials in between pages and ensuring that all pages are loose; Scanning – questionnaires were put through a scanner to create an electronic image; and finally, Tiling and completion – where any unrecognised reading/badly-read image by the scanner had to be verified by a data capturer. This process took eight months. Over 2 000 data processors working three shifts per day were employed for this phase to ensure that 225 million single pages were accounted for.
1.2.5 Data editing and validation system
The execution of each phase of the census operations introduces some form of errors in census data. Despite quality assurance methodologies embedded in all the phases, i.e. data collection, data capturing (both manual and automated), coding, and editing, a number of errors creep in and distort the collected information. To promote consistency and improve data quality, editing is a paramount phase in identifying and minimising errors such as invalid values, inconsistent entries or unknown/missing values. The editing process for Census 2011 was based on defined rules (specifications).

Statistics South Africa
Census 2011 Provincial Profile: Mpumalanga, Report 03-01-77
3
The editing of Census 2011 data involved a number of sequential processes: selection of members of the editing team, review of Census 2001 and 2007 Community Survey editing specifications, development of editing specifications for the Census 2011 pre-tests (2009 pilot and 2010 Dress Rehearsal), development of firewall editing specifications, and finalisation of specifications for the main census.
1.2.5.1 Editing team
The Census 2011 editing team was drawn from various divisions of the organisation based on skills and experience in data editing. The team thus comprised subject matter specialists (demographers and programmers), managers and data processors.
1.2.5.2 Role of the team
Among other census activities, editing team roles and responsibilities included:
• Establishment of editing plan/schedule • Formulation and application of clear and concise editing specifications • Validation of census data using other data sources • Ensuring of consistency of editing rules between censuses (2001 and 2011) where
applicable • Provision of imputation flags and rates • Identification of errors and providing corrections where possible • Review and refinement of the edit specifications based on edit trial evaluations, cross
tabulations, and comparison of census data with other datasets • Testing the specifications before confirming and applying them
The editing specification process commenced with activities relating to the review of existing editing specifications guidelines. Census 2001 specifications as well as Community Survey 2007 survey specifications and the UN handbook on Census editing were reviewed to form the basis of the specifications.
1.2.5.3 Editing strategy for Census 2011
The Census 2011 questionnaire was very complex, characterised by many sections, interlinked questions and skipping instructions. Editing of such complex, interlinked data items required application of a combination of editing techniques. Errors relating to structure were resolved using structural query language (SQL) in Oracle dataset. CSPro software was used to resolve content related errors. The strategy used for Census 2011 data editing was the implementation of automated error detection and correction with minimal changes. Combinations of logical and dynamic imputation were used. Logical imputations were preferred, and in many cases, substantial effort was undertaken to deduce a consistent value based on the rest of the household’s information. To profile the extent of changes in the dataset and assess the effects of imputation, a set of imputation flags are included in the edited dataset. Imputation flags values include the following:

Statistics South Africa
Census 2011 Provincial Profile: Mpumalanga, Report 03-01-77
4
0 no imputation was performed; raw data were preserved
1 logical editing was performed; raw data were blank
2 logical editing was performed; raw data were not blank
3 hot-deck imputation was performed; raw data were blank
4 hot-deck imputation was performed; raw data were not blank
1.2.6 Independent monitoring and evaluation of census field activities
Independent monitoring of the Census 2011 field activities was carried out by a team of 31 professionals and 381 monitoring and evaluation monitors from the Monitoring and Evaluation division. These included field training, publicity, listing and enumeration. This was to make sure that the activities were implemented according to the plans and had independent reports on the same. They also conducted Census 2011 and the post-enumeration survey (PES) verification studies to identify the out-of-scope cases within census (a sample of 7 220 EAs) and the PES sample (600 EAs) as reported in the Census 2011 PES EA Summary Books.
1.2.7 Post-enumeration survey (PES)
A post-enumeration survey (PES) is an independent sample survey that is conducted immediately after the completion of census enumeration in order to evaluate the coverage and content errors of the census. The PES for Census 2011 was undertaken shortly after the completion of census enumeration, from November to December 2011, in approximately 600 enumeration areas (EAs), which later increased to 608 due to subdivision of large EAs. The main goal of the PES was to collect high quality data that would be compared with census data in order to determine how many people were missed in the census and how many were counted more than once.
A population census is a massive exercise, and while every effort is made to collect information on all individuals in the country, including the implementation of quality assurance measures, it is inevitable that some people will be missed and some will be counted more than once. A PES assists in identifying the following types of errors:
• Coverage error: this includes both erroneous omissions (e.g. a household that was not enumerated) and erroneous inclusions (e.g. a household that moved into the enumeration area (EA) after census but was still enumerated, or a household that was enumerated more than once).
• Content error: this refers to the errors on the reported characteristics of the people or households enumerated during census.

Statistics South Africa
Census 2011 Provincial Profile: Mpumalanga, Report 03-01-77
5
The errors may emanate from the following reasons:
• Failure to account for all inhabited areas in the EA frame; • EA boundary problems; • Incomplete listing of structures and failure to identify all dwellings within an EA; • Failure to enumerate/visit all listed dwellings within an EA; • Failure to identify all households within a dwelling unit in instances whereby a
dwelling unit has more than one household; • Failure to enumerate households (complete questionnaires) for all households due to
refusals, unreturned questionnaires for self-enumeration, inability to contact households, etc.);
• Failure to include all individuals within households; • Failure to observe the inclusion rule based on a person’s presence on Census night
(i.e. failure to apply the de facto rule accurately); and • Lost questionnaires or damaged questionnaires that could not be processed.
Usually more people are missed during a census, so the census count of the population is lower than the true population. This difference is called net undercount. Rates of net undercount can vary significantly for different population groups depending on factors such as sex, age and geographic location. Stats SA obtains estimates of the net undercount, including the type and extent of content errors (reported characteristics of persons and households enumerated in the census) using information collected through the PES.
1.2.7.1 Preparations for the PES
Planning involved the development of documents outlining the goal and objectives of the PES, timelines of the project, identification of resources (financial, human and otherwise) required for implementing the project, and the development of methodology documents. Timelines for the PES were synchronised with those of Census 2011 to ensure the relevance of the project, and adhered to international best practice for maintaining a closed population between census and PES data collection, i.e. it should be carried out within a few months, preferably within six months, after the completion of census fieldwork to ensure that the impact of natural population changes, such as births, deaths and migration, as well as lapses in respondent recall do not complicate the exercise. Activities of the PES included the following:
• Sampling: sample design and selection; • Development of data collection methodologies: methods and procedures for data
collection (publicity, listing and enumeration), including quality control measures applied during data collection;
• Development of matching and reconciliation procedures and systems: guidelines for matching, including rules for determining the match status of households and individuals, as well as computer-based system for capturing household and person records for matching purposes;

Statistics South Africa
Census 2011 Provincial Profile: Mpumalanga, Report 03-01-77
6
• Questionnaire development: selection of data items which allowed measurement of coverage and content, including layout design and printing of questionnaire;
• Data collection: publicity, listing and enumeration of households in selected enumeration areas (EAs);
• Matching and reconciliation: office matching (comparison) of census and PES household and person records, and revisits to households in order to confirm or get more information that might assist in matching unresolved cases; and
• Analysis and reporting: compilation of tables and report on PES results.
1.2.7.2 Methodology
The PES is an independent survey that replicates the census in sampled enumeration areas (EAs). The major assumption used in the PES is that the census and the PES are independent, the estimate of the percentage missed by the PES but found by the census, and the percentage missed by the census but found by the PES, can be used to construct estimates of the percentage missed by both PES and census. The PES sought to estimate the total number of persons and households in housing units on the night of 09–10 October 2011 (Census night). The units of observation were the persons who spent the Census night and/or the PES night in these living quarters.
1.2.7.3 Sampling
The sampling frame for the PES was the complete list of Census 2011 EAs, amounting to 103 576 EAs. The primary sampling units (PSUs) were the Census EAs. The principle for selecting the PES sample is that the EA boundaries for sampled EAs should have well-defined boundaries, and these boundaries should correspond with those of Census EAs to allow for item-by-item comparison between the Census and PES records. The stratification and sampling process followed will allow for the provision of estimates at national, provincial, urban (geography type = urban) and non-urban (geography type = farm and traditional) levels, but estimates will only be reliable at national and provincial levels. The sample of 600 EAs was selected and allocated to the provinces based on expected standard errors which were based on those obtained in PES 2001. Populations in institutions (other than workers’ hostels), floating and homeless individuals were excluded from the PES sample.
1.2.7.4 Questionnaire development
The approach to questionnaire design focused on capturing the main elements for measuring coverage and content errors. Only a few elements from the Census 2011 questionnaire which were not likely to change within a short period (that is between the census and the PES reference nights) were retained. The questionnaire allowed for the classification of each listed person as ‘non-mover’, ‘in-mover’, ‘out-mover’, or ‘out-of-scope’, with regard to their household presence status on Census night (09–10 October 2011). The data items for the PES questionnaire included first name and surname, date of birth, age, sex, population group and presence of person in dwelling unit on Census and/or PES night.

Statistics South Africa
Census 2011 Provincial Profile: Mpumalanga, Report 03-01-77
7
1.2.7.5 Fieldwork methodology
The PES replicated the census in the sampled EAs, which meant that all methodologies and procedures for data collection were based on census methodologies and procedures. PES fieldwork was split into the following three phases; publicity and listing, enumeration and mop-up operations.
• Publicity and listing were conducted at the same time. Publicity focused on informing and educating respondents and relevant stakeholders about the purpose of the PES to ensure successful coverage of all dwelling units (DUs) in selected EAs. Listing involved the recording of all structures (including all DUs, number of households in DUs and number of persons in households) in the sampled EAs in the EA Summary Books.
• Enumeration involved interviewing respondents and recording responses in the fields provided in the PES questionnaire. Self-enumeration for the PES was discouraged, but was used in instances where the respondent insisted on self-enumeration.
• Mop-up operations were conducted in the form of follow-up visits by senior field staff to households that could not be contacted during the enumeration period.
1.2.7.6 Matching and reconciliation methodology
The matching exercise involved the comparison of household and person records in census data and PES data. A two-way case-by-case matching was conducted using the two sources: PES questionnaires and census questionnaires. Reconciliation visits were conducted in order to confirm or get more information that would assist in matching unresolved cases, i.e. households or individuals enumerated in the census that did not correspond with households or individuals enumerated in the PES. Guidelines for matching, including rules for determining the match status of households and individuals, were developed. A computer-assisted manual matching system was developed for the capturing of data for matching purposes.
1.2.7.7 PES data collection
PES data collection commenced immediately after the completion of census fieldwork. The PES is a much smaller scale operation (and hence easier to control) than the census. These features enable the PES to deliver a more accurate estimate of the percentage of people and dwellings missed by the census. PES data collection (field operations) was independent from census operations and the following measures were taken to maintain the operational independence of the PES:
• independent listing of enumeration areas (EAs) in the PES sample; • using separate/independent office staff in the PES and census where possible; • ensuring the PES interviewers were not employed as census field staff in the same
area, and vice versa; and • maintaining the confidentiality of the PES sample so that census field and office staff
were not aware which areas are included in the PES.

Statistics South Africa
Census 2011 Provincial Profile: Mpumalanga, Report 03-01-77
8
Temporary personnel (Fieldworkers and Fieldwork Supervisors) were recruited from the EAs/districts in which they would be working and underwent rigorous training on fieldwork procedures to ensure that they deliver work of high quality at the end of the fieldwork phase. Experienced permanent staff from Household Surveys (based in provincial offices) was seconded to the project for the duration of data collection in supervisory positions to ensure high quality data and minimise costs. The PES followed the integrated approach towards fieldwork; whereby one Fieldworker conducted publicity, listing and enumeration in one EA. A total of 768 Fieldworkers and Fieldwork Supervisors were appointed for the collection of data in the 608 EAs (initially 600, but increased to 608 due to split EAs). A ratio of one Fieldwork Supervisor for four Fieldworkers was applied, but due to the spread of the sample in various districts, this ratio could not always be applied.
1.2.7.8 Matching and reconciliation
The matching process involved the comparison of household and person records in Census data and PES data. The main phases in the matching process were:
• Initial matching involved searching through the census records in order to find the corresponding cases from the PES enumeration records, and vice-versa (a two-way match);
• Capturing involved the capturing of PES and census information on a capturing tool which formed part of the computer-assisted manual matching system. Information for non-matched households and persons was also captured;
• Computer-assisted matching which was the automated assigning of an initial match status for the household and persons, and persons moving status. This process was done concurrently with the capturing process. Classifications from initial matching are as follows:
1. Matched 2. Possible match
In PES not in census:
3. In PES not in census – definite non-match 4. In PES not in census – insufficient or unclear information 5. In-mover 6. Born after census 7. In census not in PES
• Reconciliation visits are follow-up visits to households in the PES sampled EAs. The purpose of reconciliation visits was to collect relevant information in order to determine the final match status of unresolved cases identified during initial matching. Cases of ‘possible match’, ‘in PES not in census – insufficient or unclear information’, and ‘in census not in PES’ were considered unresolved and were sent to the field for reconciliation; and

Statistics South Africa
Census 2011 Provincial Profile: Mpumalanga, Report 03-01-77
9
• Final matching involved the use of the results obtained from the reconciliation visits and initial matching phases to assign a definite match status to each case. The table below illustrates the outcomes from final matching.
1. Matched In PES not in census:
2. Missed in census 3. PES erroneous inclusion – cases in PES not in census that were outside the EA boundaries or
otherwise erroneously included in PES 4. PES insufficient information – cases in PES not in census for which a final match status
cannot be assigned due to insufficient information 5. In-mover 6. Born after Census
In census not in PES:
7. Correctly enumerated in census, missed in PES 8. Census erroneous inclusion 9. Census insufficient information – cases in census not in PES for which a final match status
cannot be assigned due to insufficient information
1.2.7.9 Estimation and tabulation
Coverage measures were calculated only for cases belonging to the PES universe.
The initial estimates – weighted estimates of total from the sample include the following:
a) Estimated number of non-movers; b) Estimated number of out-movers; c) Estimated number of matched non-movers; d) Estimated number of matched out-movers; e) Estimated number of in-movers; f) Estimated number of erroneous inclusions in the census; and g) Estimated number of correctly enumerated persons missed in the PES
Dual system estimation was used to arrive at the true population of the country. This means that two independent sources or ‘systems’ are used to arrive at the estimate of the true population: the census and the PES. Both estimates contribute to the dual-system estimate, which is more complete than either the census or the PES estimate alone. In the end, this true population is compared with the census-enumerated population and the difference is the net undercount (or overcount). The following table indicates the undercount rates as estimated by the PES.

Statistics South Africa
Census 2011 Provincial Profile: Mpumalanga, Report 03-01-77
10
Table 1.1: Net census coverage error – Total and rate by province
Province Omission rate
for persons Omission rate
for households Western Cape 18,6 17,8 Eastern Cape 12,9 10,3 Northern Cape 13,4 14,8 Free State 10,1 9,4 KwaZulu-Natal 16,7 16,5 North West 14,9 17,0 Gauteng 14,7 15,2 Mpumalanga 15,5 14,4 Limpopo 10,0 9,6 All provinces 14,6 14,3
The adjustment procedure consisted of creating homogeneous adjustment classes with similar coverage rates and calculating a common undercount rate, adjustment factor and adjustment figure for each class separately. The adjusted figure for the total population was obtained by summing across the adjustment classes. In addition, only the population of households received adjustment classes. The totals for the balance of the population, namely people living in collective quarters and the homeless on the streets, were not adjusted.
1.3 Conclusion
The 2011 Census project had its own challenges and successes, like any other massive project. Be that as it may, the following are worth mentioning: the Census fieldworkers who traversed the country to collect information from households and those that we lost in the process. The respondents who opened their doors and locked their dogs to aid the field staff to do their work, the processors who worked 24hrs/7days a week to ensure that the data can be released within a year of enumeration. The Census management team who met daily for two years to steer the project forward, the Stats SA EXCO for the leadership they provided, the Statistics Council and in particular the sub-committee on population and social statistics for their continued guidance and support and finally the Minister in the Presidency: responsible for planning for the robust interrogation of the plans and guidance on this project. It is through such concerted efforts that as a country we can and will continuously improve on our endeavours.

Statistics South Africa
Census 2011 Provincial Profile: Mpumalanga, Report 03-01-77
11
Chapter 2: Geography of South Africa
2.1 Provincial boundary changes: 2001 to 2011
A number of changes occurred in terms of provincial and municipal boundaries during the period between the censuses of 2001 and 2011. Of the nine provinces, only two provinces (Western Cape and Free State) were not affected by changes. The provincial boundary changes were mostly as a result of eight cross-boundary municipalities which were absorbed in full into respective provinces.
Table 2.1: Geographical land area changes since 2001
Province name Provincial code Land area in square
kilometres 2011 Land area in square
kilometres 2001 Western Cape 1 129 462 129 449 Eastern Cape 2 168 966 169 954 Northern Cape 3 372 889 362 599 Free State 4 129 825 129 824 KwaZulu-Natal 5 94 361 92 305 North West 6 104 882 116 231 Gauteng 7 18 178 16 936 Mpumalanga 8 76 495 79 487 Limpopo 9 125 754 122 816 Total 1 220 813 1 219 602
The shift of the national boundary over the Indian Ocean in the North East corner of KwaZulu-Natal to cater for the iSimangaliso Wetland Park led to the increase in South Africa's land area.

Statistics South Africa
Census 2011 Provincial Profile: Mpumalanga, Report 03-01-77
12
Map 2.1: Provincial boundary changes since 2001
Provincial boundary changes mostly affected North West (land size decreased to 11 348,9 square kilometres). Most of this was absorbed by Northern Cape. The second largest decrease in land size was for Mpumalanga which decreased by 2 991,9 square kilometres with Limpopo being the main recipient of this land area.
It should be noted that the increased extent of KwaZulu-Natal is not mainly based on the exchange of Umzimkulu (formerly in the Eastern Cape province) and Matatiele (formerly in KwaZulu-Natal), but due to the shift of the national boundary over the Indian Ocean in the north east corner of the province to cater for the iSimangaliso Wetland Park. In terms of which areas moved to which province, a detailed outline is provided below.
Northern Cape and North West • GaSegonyana and Phokwane municipalities were cross-boundary municipalities
between Northern Cape and North West in 2001 and were allocated to Northern Cape in full based on the current provincial boundaries.
• Kagisano municipality (2001) was split into Kagisano/ Molopo municipality and Joe Morolong municipality, with the former portion now in North West and the latter now part of the Northern Cape province.
• Moshaweng municipality (now part of Joe Morolong municipality) was incorporated in full in Northern Cape based on the current provincial boundaries.

Statistics South Africa
Census 2011 Provincial Profile: Mpumalanga, Report 03-01-77
13
North West and Gauteng • Merafong City municipality (2001) was a cross-boundary local municipality between
North West and Gauteng and was allocated to the Gauteng province based on the current provincial boundaries.
• West Rand (DMA) municipality (2001) was not aligned to the then provincial boundary and was absorbed into Mogale City municipality in full, based on the current provincial boundaries.
• City of Tshwane Metropolitan Municipality was a cross-boundary municipality between Gauteng and North West provinces. The portions adjacent to Moretele and Madibeng municipalities were allocated to Gauteng in full, based on the current provincial boundaries.
North West and Limpopo • Limpopo lost a portion of the Bela-Bela municipality to North West’s Moretele
municipality. In turn, North West lost a portion of the Moretele municipality to Limpopo’s Bela-Bela municipality, based on the current provincial boundaries.
Gauteng and Mpumalanga • A portion of Delmas municipality (2001) (now called Victor Khanye) was allocated to
the City of Tshwane in Gauteng, based on the current provincial boundaries. • Kungwini municipality, now incorporated into the City of Tshwane, was a cross-
boundary municipality and is now fully allocated to Gauteng, based on the current provincial boundaries.
Mpumalanga and Limpopo • Greater Groblersdal, (now called Elias Motsoaledi), Greater Marble Hall (now called
Ephraim Mogale), and Greater Tubatse were cross-boundary municipalities between Mpumalanga and Limpopo and have now been allocated in full to the Limpopo province. Ephraim Mogale municipality absorbed the Schuinsdraai Nature Reserve.
• Bushbuck Ridge municipality was a cross-boundary municipality between Limpopo and Mpumalanga and has now been allocated in full to the Mpumalanga province. (Bushbuck Ridge also absorbed a portion of the Kruger Park cross-boundary District Management Area.)
KwaZulu-Natal and Eastern Cape • Umzimkulu, formerly in Eastern Cape, and Matatiele, formerly in KwaZulu-Natal,
were in effect exchanged, with Umzimkulu now being in KwaZulu-Natal and Matatiele now being in Eastern Cape, based on the current provincial boundaries.
2.2 Local municipal boundary changes, 2001–2011
In 2001, the geographical frame consisted of 262 local municipalities. This total has been reduced to 234 local municipalities in the 2011 geographical frame. The difference of 28 municipalities is explained as follows:

Statistics South Africa
Census 2011 Provincial Profile: Mpumalanga, Report 03-01-77
14
In total, 25 District Management Areas (DMAs) were absorbed into the existing provinces.
• The City of Tshwane absorbed a further two municipalities (Nokeng Tsa Taemane and Kungwini).
• A new municipality (Kagisano Molopo – NW379) was established by merging NW391 (Kagisano) and NW395 (Molopo).
For municipalities, 107 municipalities decreased in geographical area while 155 municipalities had an increase in geographical area.
Map 2.2: Municipal boundary changes since 2001

Statistics South Africa
Census 2011 Provincial Profile: Mpumalanga, Report 03-01-77
15
Figure 2.1: Percentage distribution of land area by province, 2011
2.3 Comparing Census 2011 with previous censuses
Comparison of Census 2011 with previous censuses (1996 and 2001) required alignment of data for the two censuses to 2011 municipal boundaries. This is because the country’s provincial demarcations underwent changes through a number of changes at provincial and municipal boundaries.

Statistics South Africa
Census 2011 Provincial Profile: Mpumalanga, Report 03-01-77
16
Chapter 3: Results pertaining to persons
3.1 Introduction
A census is the basic source of demographic information at all levels of geography in a given area at a defined time. This chapter provides information on size, composition and structure of the population of Mpumalanga by district and local municipality, and highlights national figures. The chapter also includes data pertaining to migration, general health and functioning, education and employment. Data from the population censuses of 1996, 2001 and 2011 have been used.
3.2 Population size and distribution
Table 3.1: Population of South Africa by province and percentage changes, censuses of 1996, 2001 and 2011
Province
Population Percentage change Census
1996 Census
2001 Census
2011 1996 &
2001 2001 &
2011 Western Cape 3 956 875 4 524 335 5 822 734 14,3 28,7 Eastern Cape 6 147 244 6 278 651 6 562 053 2,1 4,5 Northern Cape 1 011 864 991 919 1 145 861 -2,0 15,5 Free State 2 633 504 2 706 775 2 745 590 2,8 1,4 KwaZulu-Natal 8 572 302 9 584 129 10 267 300 11,8 7,1 North West 2 727 223 2 984 098 3 509 953 9,4 17,6 Gauteng 7 834 125 9 388 854 12 272 263 19,9 30,7 Mpumalanga 3 123 869 3 365 554 4 039 939 7,7 20,0 Limpopo 4 576 566 4 995 462 5 404 868 9,2 8,2 South Africa 40 583 573 44 819 778 51 770 560 10,4 15,5
The above table shows the population of South Africa from 1996 to 2011 by province. The population of South Africa increased from 44 819 778 in 2001 to 51 770 560 in 2011, yielding a percentage change of 15,5%. The province with the highest population size was Gauteng with 12 272 263, while Northern Cape recorded the lowest with 1 145 861. Mpumalanga recorded a population size of 4 039 939, ranking it sixth as far as population size is concerned.

Statistics South Africa
Census 2011 Provincial Profile: Mpumalanga, Report 03-01-77
17
Table 3.2: Population of South Africa by province and percentage distribution, censuses of 1996, 2001 and 2011
Province 1996 2001 2011
N % N % N % Western Cape 3 956 875 9,8 4 524 335 10,1 5 822 734 11,3 Eastern Cape 6 147 244 15,2 6 278 651 14,0 6 562 053 12,7 Northern Cape 1 011 864 2,5 991 919 2,2 1 145 861 2,2 Free State 2 633 504 6,5 2 706 775 6,0 2 745 590 5,3 KwaZulu-Natal 8 572 302 21,1 9 584 129 21,4 10 267 300 19,8 North West 2 727 223 6,7 2 984 098 6,7 3 509 953 6,8 Gauteng 7 834 125 19,3 9 388 854 21,0 12 272 263 23,7 Mpumalanga 3 123 869 7,7 3 365 554 7,5 4 039 939 7,8 Limpopo 4 576 566 11,3 4 995 462 11,2 5 404 868 10,4 South Africa 40 583 573 100,0 44 819 778 100,0 51 770 560 100,0
The above table shows the population distribution of the nine provinces of South Africa from 1996 to 2011. The percentage distribution shows that the highest increase was recorded in Gauteng, and the highest decrease was recorded in KwaZulu-Natal from 2001 to 2011. In 2011, Gauteng recorded the highest proportion of the population (23,7%), while Northern Cape recorded the lowest with 2,2%. Mpumalanga recorded a population of 7,8%.

Stat
istic
s Sou
th A
fric
a
Cen
sus 2
011
Prov
inci
al P
rofil
e: M
pum
alan
ga, R
epor
t 03-
01-7
7
18
Tabl
e 3.
3: P
erce
ntag
e di
strib
utio
n of
the
Sout
h Af
rican
pop
ulat
ion
by p
opul
atio
n gr
oup
and
prov
ince
, cen
suse
s of 1
996,
200
1 an
d 20
11
Prov
ince
Bl
ack
Afric
an
Colo
ured
In
dian
or A
sian
W
hite
19
96
2001
20
11
1996
20
01
2011
19
96
2001
20
11
1996
20
01
2011
W
este
rn C
ape
21,6
26
,7
33,4
56
,0
53,9
49
,6
1,1
1,0
1,1
21,4
18
,4
16,0
Ea
ster
n Ca
pe
86,6
87
,2
86,5
7,
7 7,
7 8,
3 0,
3 0,
3 0,
4 5,
4 4,
9 4,
8 N
orth
ern
Cape
44
,9
46,5
51
,2
43,7
42
,9
41,0
0,
2 0,
2 0,
7 11
,2
10,3
7,
2 Fr
ee S
tate
84
,8
88,0
87
,8
3,0
3,1
3,1
0,1
0,1
0,4
12,1
8,
8 8,
7 Kw
aZul
u-N
atal
82
,8
85,2
87
,0
1,4
1,5
1,4
9,3
8,3
7,4
6,6
5,0
4,2
Nor
th W
est
90,1
90
,0
90,1
1,
6 1,
8 2,
0 0,
4 0,
3 0,
6 7,
9 7,
8 7,
3 Ga
uten
g 72
,3
75,2
77
,9
3,6
3,6
3,5
2,1
2,3
2,9
22,0
18
,8
15,7
M
pum
alan
ga
91,0
93
,2
90,9
0,
7 0,
7 0,
9 0,
4 0,
3 0,
7 7,
9 5,
9 7,
5 Li
mpo
po
96,9
97
,0
96,8
0,
2 0,
2 0,
3 0,
1 0,
2 0,
3 2,
8 2,
7 2,
6 So
uth
Afric
a 77
,4
79,0
79
,6
9,0
8,9
9,0
2,6
2,5
2,5
11,0
9,
6 8,
9
This
tabl
e ex
clud
es o
ther
and
uns
peci
fied
popu
latio
n gr
oups
Tabl
e 3.
3 sh
ows
the
perc
enta
ge d
istrib
utio
n of
the
Sout
h Af
rican
pop
ulat
ion
by p
opul
atio
n gr
oup
and
prov
ince
from
199
6 to
201
1. T
he b
lack
Af
rican
pop
ulat
ion
has i
ncre
ased
, whi
lst th
e w
hite
pop
ulat
ion
has d
ecre
ased
. The
col
oure
d po
pula
tion
rem
aine
d al
mos
t the
sam
e fr
om 2
001
to
2011
. The
pro
port
ion
of b
lack
Afr
ican
s ha
s al
so in
crea
sed
in a
ll pr
ovin
ces
exce
pt fo
r N
orth
Wes
t pro
vinc
e. T
he p
ropo
rtio
n of
col
oure
d pe
ople
ha
s in
crea
sed
in m
ost
prov
ince
s, e
xcep
t fo
r W
este
rn C
ape,
Nor
ther
n Ca
pe, K
waZ
ulu-
Nat
al a
nd G
aute
ng. T
he p
ropo
rtio
n of
Indi
ans
rem
aine
d m
ore
or le
ss t
he s
ame
in m
ost
prov
ince
s, e
xcep
t in
Kw
aZul
u-N
atal
, w
hich
rec
orde
d a
decr
ease
fro
m 9
,3%
in 1
996
to 7
,4%
in 2
011.
The
pr
opor
tion
of th
e w
hite
pop
ulat
ion
has d
ecre
ased
in a
ll th
e pr
ovin
ces,
exc
ept i
n M
pum
alan
ga w
here
it h
as in
crea
sed
from
5,9
% in
200
1 to
7,5
%
in 2
011.

Statistics South Africa
Census 2011 Provincial Profile: Mpumalanga, Report 03-01-77
19
Table 3.4: Population size and percentage changes by district and local municipality, censuses of 1996, 2001 and 2011
Municipality Population Percentage change
Census 1996 Census 2001 Census 2011 1996 & 2001 2001 & 2011 Gert Sibande 797 400 900 007 1 043 194 12,9 15,9 Albert Luthuli 182 719 187 751 186 010 2,8 -0,9 Msukaligwa 105 368 124 812 149 377 18,5 19,7 Mkhondo 100 388 143 077 171 982 42,5 20,2 Pixley Ka Seme 70 178 80 737 83 235 15,0 3,1 Lekwa 90 080 103 265 115 662 14,6 12,0 Dipaleseng 39 042 38 618 42 390 -1,1 9,8 Govan Mbeki 209 626 221 747 294 538 5,8 32,8 Nkangala 962 249 1 018 422 1 308 129 5,8 28,4 Victor Khanye 53 208 56 335 75 452 5,9 33,9 Emalahleni 236 040 276 413 395 466 17,1 43,1 Steve Tshwete 135 335 142 772 229 831 5,5 61,0 Emakhazeni 37 004 43 007 47 216 16,2 9,8 Thembisile 241 360 256 583 310 458 6,3 21,0 Dr JS Moroka 259 302 243 313 249 705 -6,2 2,6 Ehlanzeni 1 364 221 1 447 125 1 688 615 6,1 16,7 Thaba Chweu 65 909 81 681 98 387 23,9 20,5 Mbombela 426 090 476 904 588 794 11,9 23,5 Umjindi 48 547 53 744 69 577 10,7 29,5 Nkomazi 277 864 334 669 390 610 20,4 16,7 Bushbuckridge 545 811 500 128 541 248 -8,4 8,2 Mpumalanga 3 123 869 3 365 554 4 039 939 7,7 20,0
Table 3.4 gives the population of Mpumalanga from 1996 to 2011 by district and local municipality within the district. The population of Mpumalanga increased from 3 365 554 in 2001 to 4 039 939 in 2011, yielding a percentage change of 20%. In 2011, the district municipality with the highest population size was Ehlanzeni (1 688 615), while Gert Sibande recorded the lowest population (1 043 194). Mbombela local municipality had the highest population (588 000), and Dipaleseng the lowest (42 390). Steve Tshwete had the highest percentage change of 61%, followed by Emalahleni at 43,1%

Statistics South Africa
Census 2011 Provincial Profile: Mpumalanga, Report 03-01-77
20
Table 3.5: Population size and percentage distribution by district and local municipality, censuses of 1996, 2001 and 2011
Municipality Census 1996 Census 2001 Census 2011
N % N % N % Gert Sibande 797 400 25,5 900 007 26,7 1 043 194 25,8 Albert Luthuli 182 719 5,8 187 751 5,6 186 010 4,6 Msukaligwa 105 368 3,4 124 812 3,7 149 377 3,7 Mkhondo 100 388 3,2 143 077 4,3 171 982 4,3 Pixley Ka Seme 70 178 2,2 80 737 2,4 83 235 2,1 Lekwa 90 080 2,9 103 265 3,1 115 662 2,9 Dipaleseng 39 042 1,2 38 618 1,2 42 390 1,1 Govan Mbeki 209 626 6,7 221 747 6,6 294 538 7,3 Nkangala 962 249 30,8 1 018 422 30,3 1 308 129 32,4 Victor Khanye 53 208 1,7 56 335 1,7 75 452 1,9 Emalahleni 236 040 7,6 276 413 8,2 395 466 9,8 Steve Tshwete 135 335 4,3 142 772 4,2 229 831 5,7 Emakhazeni 37 004 1,2 43 007 1,3 47 216 1,2 Thembisile 241 360 7,7 256 583 7,6 310 458 7,7 Dr JS Moroka 259 302 8,3 243 313 7,2 249 705 6,2 Ehlanzeni 1 364 221 43,7 1 447 125 43,0 1 688 615 41,8 Thaba Chweu 65 909 2,1 81 681 2,4 98 387 2,4 Mbombela 426 090 13,6 476 904 14,2 588 794 14,6 Umjindi 48 547 1,6 53 744 1,6 69 577 1,7 Nkomazi 277 864 8,9 334 669 9,9 390 610 9,7 Bushbuckridge 545 811 17,5 500 128 14,9 541 248 13,4 Mpumalanga 3 123 869 100,0 3 365 554 100,0 4 039 939 100,0
The above table shows that, compared to 1996, the percentage share of the population decreased in Ehlanzeni and Gert Sibande in 2011, but shows growth in Nkangala. Despite the decrease in the percentage share, Ehlanzeni district recorded 41,8%, which was still the highest population percentage share of all the districts, while Gert Sibande recorded 25,8%, which was the lowest. Mbombela local municipality recorded the highest percentage share of 14,6%, whereas Dipaleseng local municipality recorded the lowest share (1,1%).

Stat
istic
s Sou
th A
fric
a
Cen
sus 2
011
Prov
inci
al P
rofil
e: M
pum
alan
ga, R
epor
t 03-
01-7
7
21
Tabl
e 3.
6: P
erce
ntag
e di
strib
utio
n of
the
pop
ulat
ion
grou
ps b
y po
pula
tion
grou
p by
dis
tric
t an
d lo
cal m
unic
ipal
ity, c
ensu
ses
of 1
996,
200
1 an
d 20
11
Mun
icip
ality
Bl
ack
Afric
an
Colo
ured
In
dian
or A
sian
W
hite
19
96
2001
20
11
1996
20
01
2011
19
96
2001
20
11
1996
20
01
2011
Ge
rt S
iban
de
87,0
90
,7
88,8
0,
8 0,
7 1,
0 0,
8 0,
6 1,
1 11
,5
8,0
9,1
Albe
rt L
uthu
li 97
,9
98,2
97
,8
0,1
0,2
0,2
0,2
0,1
0,4
1,8
1,5
1,6
Msu
kalig
wa
82,4
89
,3
88,4
0,
4 0,
3 0,
6 0,
9 0,
7 1,
1 16
,3
9,8
9,9
Mkh
ondo
91
,7
95,4
94
,9
0,5
0,4
0,5
1,1
0,5
0,8
6,8
3,6
3,8
Pixl
ey K
a Se
me
88,6
92
,1
90,8
0,
4 0,
5 0,
6 0,
6 0,
6 1,
2 10
,5
6,8
7,4
Lekw
a 81
,4
86,2
84
,5
2,3
1,9
2,9
1,2
0,9
1,2
15,1
11
,0
11,5
Di
pale
seng
87
,8
90,8
90
,0
0,1
0,2
0,5
0,9
0,7
0,9
11,2
8,
3 8,
6 Go
van
Mbe
ki
79,2
83
,6
80,9
1,
1 1,
1 1,
5 1,
2 0,
9 1,
5 18
,5
14,4
16
,1
Nka
ngal
a 87
,9
91,2
88
,2
0,9
0,9
1,1
0,4
0,3
0,7
10,9
7,
7 9,
9 Vi
ctor
Kha
nye
82,5
88
,3
82,5
0,
5 0,
5 1,
1 0,
2 0,
2 0,
3 16
,9
11,1
16
,0
Emal
ahle
ni
75,0
82
,2
81,7
1,
7 1,
4 1,
7 0,
6 0,
4 0,
9 22
,8
15,9
15
,7
Stev
e Ts
hwet
e 67
,9
80,1
73
,8
2,6
2,5
2,6
1,4
0,9
1,6
28,1
16
,5
21,9
Em
akha
zeni
88
,2
89,1
87
,4
0,5
1,1
1,2
0,5
0,2
0,7
10,9
9,
6 10
,8
Them
bisil
e 99
,8
99,8
99
,4
0,1
0,1
0,2
0,0
0,0
0,3
0,1
0,1
0,1
Dr JS
Mor
oka
99,9
99
,9
99,6
0,
1 0,
1 0,
1 0,
0 0,
0 0,
3 0,
0 0,
1 0,
1 Eh
lanz
eni
95,6
96
,1
94,2
0,
5 0,
5 0,
7 0,
2 0,
2 0,
4 3,
7 3,
2 4,
7 Th
aba
Chw
eu
83,8
86
,1
82,1
2,
1 2,
0 2,
7 0,
5 0,
4 0,
6 13
,6
11,6
14
,6
Mbo
mbe
la
91,1
93
,1
89,6
0,
7 0,
8 1,
0 0,
4 0,
3 0,
7 7,
8 5,
8 8,
8 U
mjin
di
87,5
88
,7
87,2
1,
5 1,
6 2,
0 1,
2 1,
0 1,
0 9,
8 8,
8 9,
8 N
kom
azi
98,7
98
,6
97,8
0,
2 0,
2 0,
2 0,
1 0,
1 0,
3 1,
1 1,
2 1,
6 Bu
shbu
ckrid
ge
99,7
99
,7
99,6
0,
1 0,
2 0,
1 0,
0 0,
0 0,
1 0,
1 0,
2 0,
2 M
pum
alan
ga
91,0
93
,2
90,9
0,
7 0,
7 0,
9 0,
4 0,
3 0,
7 7,
9 5,
9 7,
5
The
abov
e ta
ble
show
s th
at, c
ompa
red
with
200
1, t
he p
ropo
rtio
n of
the
bla
ck A
fric
an p
opul
atio
n ha
s de
crea
sed
in m
ost
of t
he d
istric
ts a
nd
loca
l mun
icip
aliti
es, w
hile
the
prop
ortio
n of
the
colo
ured
pop
ulat
ion
has s
light
ly in
crea
sed
in a
ll di
stric
ts a
nd in
mos
t of t
he lo
cal m
unic
ipal
ities
, ex
cept
in A
lber
t Lut
huli,
Dr J
S M
orok
a, N
kom
azi a
nd B
ushb
uckr
idge
loca
l mun
icip
aliti
es. T
he p
ropo
rtio
n of
the
Indi
an p
opul
atio
n ha
s in
crea
sed
in a
ll th
e di
stric
ts a
nd in
17
loca
l mun
icip
aliti
es, e
xcep
t in
Um
jindi
loca
l mun
icip
ality
. The
pro
port
ion
of th
e w
hite
pop
ulat
ion
has
also
incr
ease
d in
all
the
dist
ricts
and
in 1
4 lo
cal m
unic
ipal
ities
, exc
ept i
n Em
alah
leni
, The
mbi
sile,
Dr J
S M
orok
a an
d Bu
shbu
ckrid
ge lo
cal m
unic
ipal
ities
.

Stat
istic
s Sou
th A
fric
a
Cen
sus 2
011
Prov
inci
al P
rofil
e: M
pum
alan
ga, R
epor
t 03-
01-7
7
22
3.3
Popu
latio
n st
ruct
ure:
Age
and
sex
Figu
re 3
.1: P
opul
atio
n st
ruct
ure
by a
ge a
nd se
x –
Sout
h Af
rica,
201
1 Fi
gure
3.2
: Pop
ulat
ion
stru
ctur
e by
age
and
sex
– M
pum
alan
ga, 2
011

Stat
istic
s Sou
th A
fric
a
Cen
sus 2
011
Prov
inci
al P
rofil
e: M
pum
alan
ga, R
epor
t 03-
01-7
7
23
Figu
re 3
.3: P
opul
atio
n st
ruct
ure
by a
ge a
nd se
x –
Sout
h Af
rica,
200
1 Fi
gure
3.4
: Pop
ulat
ion
stru
ctur
e by
age
and
sex
– M
pum
alan
ga, 2
001
10,411
,311,8
11,4
9,8
8,9
7,4
6,7
5,8
4,5
3,6
2,6
2,1
1,4
1,1
0,6
0,4
0,2
9,5
10,4
10,9
10,8
9,48,
77,57,05,
94,83,
72,8
2,72,
11,71,
00,80,5
-15
-10
-50
510
15
0 -4
5 -9
10 -
1415
-19
20 -
2425
-29
30 -
3435
-39
40 -
4445
-49
50 -
5455
-59
60 -
6465
-69
70 -
7475
-79
80 -
8485+
%
Age group
Figu
re 3
.3: S
outh
Afr
ica:
200
1
Fem
ale
Mal
e
11,712
,513,1
12,5
9,5
8,1
6,7
6,2
5,1
4,2
3,1
2,2
1,8
1,1
1,0
0,6
0,5
0,2
10,9
11,6
12,1
11,7
9,48,
67,26,
65,14,
33,12,
22,
21,7
1,60,
80,
70,4
1510
50
510
15
0 -4
5 -9
10 -
1415
-19
20 -
2425
-29
30 -
3435
-39
40 -
4445
-49
50 -
5455
-59
60 -
6465
-69
70 -
7475
-79
80 -
8485+
%
Age group
Figu
re 3
.4: M
pum
alan
ga: 2
001
Fem
ale
Mal
e

Stat
istic
s Sou
th A
fric
a
Cen
sus 2
011
Prov
inci
al P
rofil
e: M
pum
alan
ga, R
epor
t 03-
01-7
7
24
Figu
re 3
.5: P
opul
atio
n st
ruct
ure
by a
ge a
nd se
x –
Sout
h Af
rica,
199
6 Fi
gure
3.6
: Pop
ulat
ion
stru
ctur
e by
age
and
sex
– M
pum
alan
ga, 1
996
11,512
,112
,010
,610
,08,
67,
66,
75,
34,
23,
12,
51,
81,
61,
00,
70,
30,
2
10,7
11,2
11,310
,29,98,
67,76,
65,34,
13,22,82,62,21,
41,10,6
0,5
1510
50
510
15
0 -4
5 -9
10 -
1415
-19
20 -
2425
-29
30 -
3435
-39
40 -
4445
-49
50 -
5455
-59
60 -
6465
-69
70 -
7475
-79
80 -
8485+
%
Age group
Figu
re 3
.5: S
outh
Afr
ica:
199
6
Fem
ale
Mal
e
12,213
,112
,911
,49,
98,
37,
36,
35,
03,
82,
72,
11,
41,
40,
90,
80,
30,
2
11,7
12,4
12,311
,010,3
8,77,
56,04,
93,52,
62,32,11,91,
01,
00,4
0,3
1510
50
510
15
0 -4
5 -9
10 -
1415
-19
20 -
2425
-29
30 -
3435
-39
40 -
4445
-49
50 -
5455
-59
60 -
6465
-69
70 -
7475
-79
80 -
8485+
%
Age group
Figu
re 3
.6: M
pum
alan
ga: 1
996
Fem
ale
Mal
e
The
abov
e fig
ures
dep
ict t
he p
erce
ntag
e di
strib
utio
n th
e po
pula
tion
by a
ge a
nd s
ex in
Mpu
mal
anga
and
Sou
th A
fric
a in
199
6, 2
001
and
2011
. Bo
th n
atio
nally
and
pro
vinc
ially
, the
figu
res
show
that
the
prop
ortio
n of
mal
es in
the
youn
ger a
ge g
roup
s w
as la
rger
than
that
of t
he fe
mal
es,
whi
lst in
the
olde
r age
gro
ups t
he fe
mal
e pr
opor
tions
wer
e hi
gher
than
thos
e of
the
mal
es. T
he p
opul
atio
n in
199
6 an
d 20
01 b
egan
to in
crea
se
from
the
5–9
age
grou
ps a
nd d
ecre
ased
as
age
incr
ease
s. H
owev
er, i
n 20
11, b
oth
natio
nally
and
pro
vinc
ially
, the
re w
as a
mar
ked
decr
ease
of
mal
es a
nd fe
mal
es a
ged
5–9
and
10–1
4.

Statistics South Africa
Census 2011 Provincial Profile: Mpumalanga, Report 03-01-77
25
Figure 3.7: Dependency ratios by district municipality, censuses of 1996, 2001 and 2011
0
10
20
30
40
50
60
70
80
Gert Sibande Nkangala Ehlanzeni Mpumalanga1996 64,3 64,2 79,9 70,72001 65,0 60,7 73,2 67,02011 56,5 50,4 60,4 56,0
%
Figure 3.7 shows the dependency ratios for Mpumalanga from 1996 to 2011 by district municipality. It can be observed that the dependency ratio in Mpumalanga has decreased from 70,7 in 1996 to 56 in 2011. The figures for all three districts show the same trend. However, the dependency ratio in Ehlanzeni has remained higher than the provincial average for all three censuses, while Gert Sibande in 2011 recorded higher than the provincial average.

Stat
istic
s Sou
th A
fric
a
Cen
sus 2
011
Prov
inci
al P
rofil
e: M
pum
alan
ga, R
epor
t 03-
01-7
7
26
3.4
Lang
uage
Tabl
e 3.
7: P
opul
atio
n by
lang
uage
spok
en, d
istr
ict,
and
loca
l mun
icip
ality
, Cen
sus 2
011
Mun
icip
ality
Af
rikaa
ns
Engl
ish
IsiN
debe
leIs
iXho
saIs
iZul
uSe
pedi
Seso
tho
Sets
wan
aSi
gn la
ngua
geSi
Swat
iTs
hive
nda
Xits
onga
Oth
er
Gert
Sib
ande
9,
1 3,
4 3,
12,
160
,91,
04,
20,
80,
313
,00,
21,
00,
9 Al
bert
Lut
huli
1,6
2,0
1,4
0,2
34,8
0,4
0,4
0,3
0,2
57,0
0,2
0,6
0,7
Msu
kalig
wa
9,8
3,5
1,4
0,6
72,6
0,6
0,7
0,8
0,3
8,5
0,2
0,5
0,7
Mkh
ondo
3,
5 2,
4 1,
00,
189
,10,
20,
20,
60,
31,
80,
10,
10,
6 Pi
xley
Ka
Sem
e 6,
8 2,
3 1,
00,
482
,80,
42,
20,
70,
42,
00,
10,
20,
7 Le
kwa
13,2
3,
6 1,
21,
566
,20,
610
,30,
80,
31,
10,
20,
40,
7 Di
pale
seng
9,
0 3,
0 1,
12,
456
,11,
024
,21,
00,
50,
50,
20,
40,
6 Go
van
Mbe
ki
15,9
5,
1 7,
75,
847
,42,
46,
01,
20,
43,
60,
52,
71,
4 N
kang
ala
10,0
3,
6 28
,41,
923
,214
,73,
84,
60,
34,
70,
43,
21,
3 Vi
ctor
Kha
nye
15,9
3,
6 25
,43,
336
,03,
43,
92,
10,
21,
90,
61,
91,
9 Em
alah
leni
15
,2
5,7
9,0
3,2
39,2
11,4
3,2
1,3
0,3
5,9
0,5
3,5
1,7
Stev
e Ts
hwet
e 22
,6
5,9
14,9
2,3
28,3
10,8
4,0
1,6
0,3
5,3
0,4
2,0
1,6
Emak
haze
ni
10,7
4,
4 18
,80,
621
,86,
74,
00,
90,
528
,40,
32,
11,
1 Th
embi
sile
0,4
1,2
58,5
1,0
12,5
12,6
4,8
1,9
0,3
2,9
0,4
2,6
0,9
Dr JS
Mor
oka
0,3
1,3
36,2
0,5
3,1
30,8
3,4
17,3
0,3
0,8
0,4
5,0
0,7
Ehla
nzen
i 4,
0 2,
6 0,
30,
22,
210
,32,
70,
30,
154
,50,
221
,80,
8 Th
aba
Chw
eu
15,2
4,
3 2,
40,
67,
736
,27,
30,
90,
317
,80,
45,
51,
6 M
bom
bela
6,
8 4,
7 0,
20,
21,
50,
71,
50,
30,
178
,70,
34,
11,
1 U
mjin
di
9,0
5,7
0,1
0,3
1,5
0,5
0,8
0,3
0,1
77,0
0,4
3,2
1,1
Nko
maz
i 1,
4 1,
1 0,
10,
10,
60,
10,
10,
10,
188
,50,
26,
80,
9 Bu
shbu
ckrid
ge
0,2
0,7
0,1
0,1
3,3
24,5
5,4
0,3
0,1
7,8
0,2
56,9
0,4
Mpu
mal
anga
7,
2 3,
1 10
,11,
224
,19,
33,
51,
80,
227
,70,
310
,410
*N
ote:
Thi
s tab
le e
xclu
des c
ases
whe
re th
e la
ngua
ge w
as u
nspe
cifie
d Ta
ble
3.7
give
s th
e pe
rcen
tage
dist
ribut
ion
of th
e po
pula
tion
of M
pum
alan
ga in
201
1 by
dist
rict a
nd lo
cal m
unic
ipal
ity w
ithin
the
dist
ricts
by
the
lang
uage
mos
t spo
ken
by re
spon
dent
s. S
iSw
ati (
27,7
%) w
as th
e m
ost s
poke
n la
ngua
ge in
Mpu
mal
anga
, fol
low
ed b
y Is
iZul
u (2
4,1%
), w
hilst
Si
gn la
ngua
ge w
as th
e le
ast s
poke
n la
ngua
ge w
ith o
nly
0,2%
. SiS
wat
i was
the
mos
t spo
ken
lang
uage
in E
hlan
zeni
dist
rict (
54,5
%),
whi
le Is
iZul
u w
as t
he m
ost
spok
en la
ngua
ge in
Ger
t Si
band
e di
stric
t (6
0,9%
), an
d Is
iNde
bele
was
the
mos
t sp
oken
lang
uage
in N
kang
ala
dist
rict
(28,
4%).

Statistics South Africa
Census 2011 Provincial Profile: Mpumalanga, Report 03-01-77
27
3.5 Migration
Figure 3.8: Inter-provincial migration, between Census 2001 and Census 2011
The above figure shows the migration patterns of the population of Mpumalanga province. More than 63% of Mpumalanga emigrants went to Gauteng province, whilst only 2% went to Western Cape, which recorded the lowest proportion.
More than 30% of Mpumalanga immigrants came from other countries, which recorded the highest proportion, since Mpumalanga share borders with Mozambique and Swaziland and more than a quarter of Mpumalanga immigrants came from Gauteng province, which recorded the second highest proportion, whilst only 1% went to Eastern Cape, which was the lowest and only 1,4% went to other countries.
0,0
10,0
20,0
30,0
40,0
50,0
60,0
70,0
WC EC NC FS KZN NC GP LP Outside RSA
In-migration 2,0 4,9 1,7 4,5 11,8 3,5 25,1 16,2 30,3Out-migration 3,7 1,7 1,0 2,6 6,5 6,8 63,2 13,1 1,4
%

Statistics South Africa
Census 2011 Provincial Profile: Mpumalanga, Report 03-01-77
28
Figure 3.9: Provincial in-migration by sex, between Census 2001 and Census 2011
0
5
10
15
20
25
30
35
WC EC NC FS KZN NW GP LP Outside RSA
Male 1,8 4,7 1,6 4,3 11,5 3,3 23,8 15,6 33,5
Female 2,2 5,2 1,9 4,7 12,4 3,7 27,0 17,0 26,0
%
Figure 3.9 shows the in-migration patterns by sex of the population of Mpumalanga province. A high percentage of Mpumalanga immigrants, both male and female, came from outside South Africa (33,5% and 26% respectively). The second highest percentage of in-migrants came from Gauteng (23,8% males and 27% females). It is observed that, from the other eight provinces of South Africa, more females than males migrated to Mpumalanga.
Figure 3.10: Provincial out-migration by sex, between Census 2001 and Census 2011
010203040506070
WC EC NC FS KZN NW GP LP OutsideRSA
Male 3,7 1,8 1,1 2,7 6,2 7,3 62,1 13,4 1,7Female 3,8 1,6 0,8 2,5 6,8 6,1 64,5 12,7 1,2
%
The above figure shows the out-migration patterns by sex of the population of Mpumalanga province. A high percentage of Mpumalanga emigrants (both male and female) migrated to Gauteng (62,1% and 64,5% respectively), followed by Limpopo (13,4% and 12,7% respectively).

Statistics South Africa
Census 2011 Provincial Profile: Mpumalanga, Report 03-01-77
29
3.6 General health and functioning
3.6.1 Introduction
Note that the question on disability had changed, and therefore Census 2011 data are not comparable with previous censuses. Initial analysis of Census 2011 results clearly showed that this set of questions was not suitable for measuring disability among children aged five years or younger. A large number of children were categorised as 'cannot see, hear, walk, communicate at all', not because they were inherently disabled but because of their level of development. Therefore, the data on children younger than five years was excluded in Census 2011.
Table 3.8: Distribution of population aged 5 years and older by disability status and sex, Census 2011
Province and district
Disability status
Male Female Total Male Female Total N N N % % %
Gert Sibande Not disabled 325 499 335 139 660 638 92,4 89,8 91,1 Disabled 26 710 37 871 64 581 7,6 10,2 8,9 Total 352 209 373 010 725 219 100,0 100,0 100,0
Nkangala Not disabled 443 056 442 244 885 300 93,9 91,9 92,9 Disabled 28 774 38 887 67 661 6,1 8,1 7,1 Total 471 830 481 131 952 961 100,0 100,0 100,0
Ehlanzeni Not disabled 552 848 628 733 1 181 581 94,6 93,8 94,2 Disabled 31 308 41 730 73 038 5,4 6,2 5,8 Total 584 156 670 463 1 254 619 100,0 100,0 100,0
Mpumalanga Not disabled 1 321 403 1 406 116 2 727 519 93,8 92,2 93,0 Disabled 86 792 118 488 205 280 6,2 7,8 7,0 Total 1 408 195 1 524 604 2 932 799 100,0 100,0 100,0
Table 3.8 gives the disability status of persons aged 5 years and older in Mpumalanga province by sex. The profile indicates that 7% of the population were disabled. Gert Sibande recorded the highest proportion (8,9%), while Ehlanzeni recorded the lowest proportion (5,8%) of disabled persons. The comparison among males and females across the province shows that females were more affected than males (6,2% of males as compared to 7,8% of females). This same trend is also observed amongst the districts in the province.

Statistics South Africa
Census 2011 Provincial Profile: Mpumalanga, Report 03-01-77
30
3.7 Education
Figure 3.11: Percentage of persons aged 5–24 years attending an educational institution, censuses of 1996, 2001 and 2011
The above figure shows comparisons between the censuses of 1996, 2001 and 2011 of school attendance in Mpumalanga. Up to age 12 there was a general increase in the percentage of persons attending an educational institution between 1996 and 2011. However, Census 2011 data show slight fluctuations. Significant progress can be seen amongst the age group 5–9 years in terms of increased enrolment rates between 1996 and 2011. Although school attendance declined for the cohort 12 to 24 years, Census 1996 proportions were significantly higher than 2001 and 2011 data points. Focusing on the compulsory age of 9 years that a child must be attending school, the proportion attending school has increased from just above 88% in 1996 to about 96% in 2001, and then again to about 98% in 2011.
0
10
20
30
40
50
60
70
80
90
100
5 6 7 8 9 10 11 12 13 14 15 16 17 18 19 20 21 22 23 241996 22,1 46,9 70,2 81,1 88,4 92,2 94,3 95,0 95,6 95,0 93,5 90,6 86,2 79,4 70,7 60,7 52,0 43,3 34,1 28,0
2001 38,6 66,9 88,1 94,1 95,7 96,0 96,0 96,4 95,9 95,1 92,6 88,9 83,4 73,8 61,9 49,3 37,9 26,3 19,3 13,6
2011 83,1 94,1 97,0 97,4 97,7 97,3 97,5 96,9 96,9 96,6 95,1 92,6 88,2 79,0 62,3 46,2 33,1 22,5 16,2 12,3
%
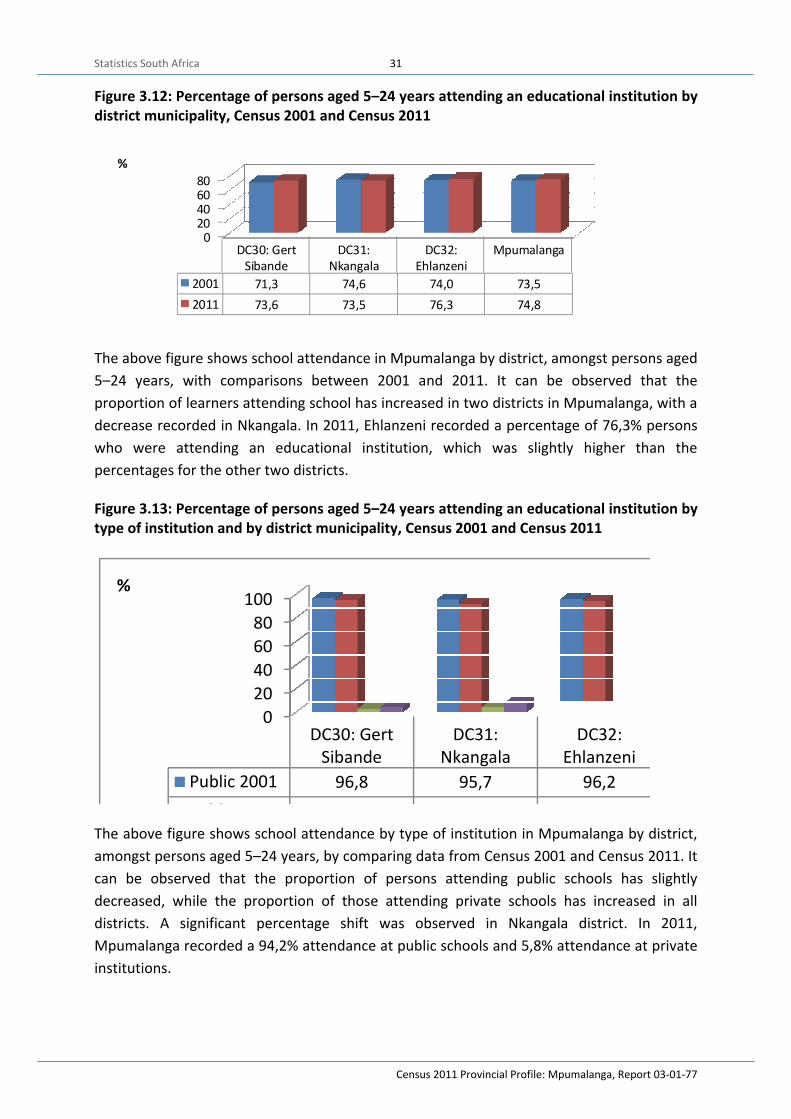
Statistics South Africa
Census 2011 Provincial Profile: Mpumalanga, Report 03-01-77
31
Figure 3.12: Percentage of persons aged 5–24 years attending an educational institution by district municipality, Census 2001 and Census 2011
020406080
DC30: GertSibande
DC31:Nkangala
DC32:Ehlanzeni
Mpumalanga
2001 71,3 74,6 74,0 73,52011 73,6 73,5 76,3 74,8
%
The above figure shows school attendance in Mpumalanga by district, amongst persons aged 5–24 years, with comparisons between 2001 and 2011. It can be observed that the proportion of learners attending school has increased in two districts in Mpumalanga, with a decrease recorded in Nkangala. In 2011, Ehlanzeni recorded a percentage of 76,3% persons who were attending an educational institution, which was slightly higher than the percentages for the other two districts.
Figure 3.13: Percentage of persons aged 5–24 years attending an educational institution by type of institution and by district municipality, Census 2001 and Census 2011
020406080
100
DC30: GertSibande
DC31:Nkangala
DC32:Ehlanzeni
Public 2001 96,8 95,7 96,2P bli 2011
%
The above figure shows school attendance by type of institution in Mpumalanga by district, amongst persons aged 5–24 years, by comparing data from Census 2001 and Census 2011. It can be observed that the proportion of persons attending public schools has slightly decreased, while the proportion of those attending private schools has increased in all districts. A significant percentage shift was observed in Nkangala district. In 2011, Mpumalanga recorded a 94,2% attendance at public schools and 5,8% attendance at private institutions.

Statistics South Africa
Census 2011 Provincial Profile: Mpumalanga, Report 03-01-77
32
Figure 3.14: Highest educational attainment amongst persons aged 20 years and older by district municipality, Census 2001 and Census 2011
It can be observed from the above figure that in Mpumalanga and all its districts, the proportion of persons with either no schooling or some primary education has significantly decreased, whilst the proportion of persons with Grade 12 or a higher education has increased between the two censuses.
In 2011, Mpumalanga recorded a proportion of only 10,2% of persons with a tertiary qualification, while 14,1% of its population was recorded as having no education. Nkangala district recorded the highest proportion of persons with a tertiary education with 11,0%, while Ehlanzeni recorded the highest proportion of persons with no schooling (16,7%).
05
101520253035
DC30: GertSibande
DC31:Nkangala
DC32:Ehlanzeni
Mpuma-langa
DC30: GertSibande
DC31:Nkangala
DC32:Ehlanzeni
Mpuma-langa
2001 2011No schooling 26,3 24,6 33,0 28,5 13,4 11,5 16,7 14,1
Some primary 18,6 14,4 15,2 15,9 13,1 11,4 11,1 11,7
Completed primary 6,2 5,9 5,4 5,8 4,4 4,2 4,0 4,2
Some secondary 27,0 29,0 23,4 26,2 31,4 32,3 29,2 30,8
Grade 12 / Std 10 16,4 19,9 16,8 17,7 28,0 29,5 29,1 29,0
Higher 5,5 6,1 6,2 6,0 9,7 11,0 9,9 10,2
%

Statistics South Africa
Census 2011 Provincial Profile: Mpumalanga, Report 03-01-77
33
Figure 3.15: Highest educational attainment amongst persons aged 20 years and older by sex, Census 2001 and Census 2011
Figure 3.15 shows that, for Mpumalanga and all its districts, the proportion of persons with either no schooling or some primary education has significantly decreased for both males and females, whilst the proportion of persons with Grade 12 or a higher education has increased for both males and females, between the two censuses.
In 2011, Mpumalanga recorded a proportion of 10,7% of males and only 9,8% of females with a tertiary qualification, while the percentage of females with no schooling (16,4%) remained higher than that of males (11,5%).
0
5
10
15
20
25
30
35
Noschooling
Someprimary
Completeprimary
Somesecondary
Std10/Grade
12
Higher Noschooling
Someprimary
Completeprimary
Somesecondary
Std10/Grade
12
Higher
2001 2011Male 24,9 16,7 6,1 27,4 18,7 6,2 11,5 11,7 4,3 32,2 29,6 10,7
Female 31,6 15,1 5,5 25,1 16,9 5,8 16,4 11,8 4,1 29,6 28,4 9,8
%

Statistics South Africa
Census 2011 Provincial Profile: Mpumalanga, Report 03-01-77
34
Figure 3.16: Highest educational attainment amongst persons aged 20 years and older by population group, Census 2001 and Census 2011
Figure 3.16 shows that the proportion of persons with either no schooling or some primary education has decreased for all population groups, except for the white population group, whilst the proportion of persons with Grade 12 or a higher education has increased for all the population groups between Census 2001 and Census 2011. Despite the changes, the proportion of black Africans with no schooling remains significantly higher than that of the other population groups.
In 2011, 32% of the white population in Mpumalanga had a higher education, followed by the Indian/Asian population at 21,4%, the coloured population at 15,8%, and the black African population at only 7,8%.
0
5
10
15
20
25
30
35
40
45
Noschooling
Someprimary Complete
primary
Somesecondary
Std10/Grade
12
Higher Noschooling
Someprimary Complete
d primary
Somesecondary
Grade12 / Std 10
Higher
2001 2011Black African 22,3 18,5 6,9 30,4 16,8 5,2 15,6 12,9 4,5 31,7 27,4 7,8
Coloured 8,3 18,4 9,8 40,1 18,5 4,9 4,8 7,3 3,2 33,5 35,5 15,8
Indian or Asian 5,3 7,7 4,2 33,0 34,9 14,9 4,3 6,3 3,0 24,8 40,2 21,4
White 1,4 1,2 0,8 25,9 40,9 29,8 1,0 1,4 0,9 22,7 42,1 32,0
%

Statistics South Africa
Census 2011 Provincial Profile: Mpumalanga, Report 03-01-77
35
3.8 The labour market
Figure 3.17: Percentage of economically active and inactive population by district municipality, Census 2001 and Census 2011
The above figure shows that the proportion of the economically active population in Mpumalanga has slightly increased from 54,4% in 2001 to 54,8% in 2011, particularly in Nkangala district (an increase from 55,6% to 58,4%). Whereas Ehlanzeni and Gert Sibande districts witnessed a decrease in the proportion of the economically active population (from 51,6% to 51,4% and from 57,1% to 55,3% respectively).
0
10
20
30
40
50
60
DC30:Gert
Sibande
DC31:Nkangala
DC32:Ehlanzeni Mpumala
nga
DC30:Gert
Sibande
DC31:Nkangala
DC32:Ehlanzeni Mpumala
nga
2001 2011Economically active 57,1 55,6 51,6 54,4 55,3 58,4 51,4 54,8
Not economically active 42,9 44,4 48,4 45,6 44,7 41,6 48,6 45,2
%

Statistics South Africa
Census 2011 Provincial Profile: Mpumalanga, Report 03-01-77
36
Figure 3.18: Percentage of economically active and inactive population by sex and district municipality, Census 2001 and Census 2011
The above figure shows that the proportion of economically active males has slightly decreased from 61,9% to 60,5% in Mpumalanga, particularly in Ehlanzeni and Gert Sibande districts (respectively decreased from 58,2% to 55,9% and from 65,2% to 62,2%), between Census 2001 and 2011. Nkangala district witnessed an increase in the proportion of the economically active male population (from 63,6% to 64,5%).
The proportion of the economically active female population has increased from 47,6% to 49,2% in Mpumalanga, particularly in Ehlanzeni and Nkangala districts (respectively increased from 45,9% to 47,5% and from 48,2% to 52,0%) between Census 2001 and 2011. Gert Sibande district witnessed a decrease (from 49,8% to 48,6%).
0
10
20
30
40
50
60
70
DC30:Gert
Sibande
DC31:Nkangal
a
DC32:Ehlanze
ni
Mpumalanga
DC30:Gert
Sibande
DC31:Nkangal
a
DC32:Ehlanze
ni
Mpumalanga
2001 2011Economically active Male 65,2 63,6 58,2 61,9 62,2 64,5 55,9 60,5Economically active Female 49,8 48,2 45,9 47,6 48,6 52,0 47,5 49,2Not economically active Male 34,8 36,4 41,8 38,1 37,8 35,5 44,1 39,5Not economically active Female 50,2 51,8 54,1 52,4 51,4 48,0 52,5 50,8
%

Statistics South Africa
Census 2011 Provincial Profile: Mpumalanga, Report 03-01-77
37
Figure 3.19: Unemployment rates by district municipality, Census 2001 and Census 2011
The figure above shows that the unemployment rate has decreased from 43,1% to 31,6% in Mpumalanga, and a congruent trend can be observed for the three districts, between Census 2001 and Census 2011.
In 2011, Ehlanzeni (34,4%) was the only district to record an unemployment rate that was higher than the provincial average of 31,6%.
Figure 3.20: Youth unemployment rate by district municipality, Census 2001 and Census 2011
The figure above shows that the unemployment rate for the youth has decreased from 52,8% to 40,4% in Mpumalanga. The same trend can be observed for the three districts, between Census 2001 and 2011. In 2011, Ehlanzeni (at 43,4%) was the only district to record an unemployment rate that was higher than the provincial average of 40,4%.
05
1015202530354045
DC30: GertSibande
DC31:Nkangala
DC32:Ehlanzeni
Mpumalanga
2001 42,8 43,8 42,7 43,12011 29,7 30,0 34,4 31,6
%
0
10
20
30
40
50
60
DC30: GertSibande
DC31:Nkangala
DC32:Ehlanzeni
Mpumalanga
2001 52,3 55,4 51,2 52,82011 37,8 38,9 43,4 40,4
%

Statistics South Africa
Census 2011 Provincial Profile: Mpumalanga, Report 03-01-77
38
Figure 3.21: Unemployment rates by sex and district municipality, Census 2001 and Census 2011
The above figure shows that the unemployment rate for both males and females has decreased from 33,7% to 25,2% and 54,1% to 39,2% respectively in Mpumalanga, and a congruent trend can be observed for the three districts, between Census 2001 and 2011. Despite these decreases, the unemployment rate for females remained significantly higher than that of males.
In 2011, Ehlanzeni was the only district to record a female (41,0%) and male (28,1%) unemployment rate that was higher than the provincial average of 38,2% and 25,2% respectively.
0
10
20
30
40
50
60
DC30:Gert
Sibande
DC31:Nkangala
DC32:Ehlanzeni
Mpumalanga
DC30:Gert
Sibande
DC31:Nkangala
DC32:Ehlanzeni
Mpuma-langa
2001 2011Male 32,3 33,8 34,5 33,7 22,9 24,1 28,1 25,2Female 55,4 56,0 51,6 54,1 38,4 37,7 41,0 39,2
%

Statistics South Africa
Census 2011 Provincial Profile: Mpumalanga, Report 03-01-77
39
Chapter 4: Results pertaining to households
4.1 Households
Table 4.1: Number of households by district and local municipality, censuses of 1996, 2001 and 2011
Municipality 1996 2001 2011 Gert Sibande 173 053 211 618 273 490 Albert Luthuli 35 543 39 652 47 705 Msukaligwa 24 876 29 689 40 932 Mkhondo 18 697 27 888 37 433 Pixley Ka Seme 14 538 18 002 19 838 Lekwa 20 463 25 199 31 071 Dipaleseng 9 450 9 474 12 637 Govan Mbeki 49 487 61 714 83 874 Nkangala 207 290 245 429 356 911 Victor Khanye 12 471 13 428 20 548 Emalahleni 56 290 74 917 119 874 Steve Tshwete 33 619 36 229 64 971 Emakhazeni 9 272 9 723 13 722 Thembisile 47 472 57 548 75 634 Dr JS Moroka 48 165 53 583 62 162 Ehlanzeni 289 458 328 377 445 087 Thaba Chweu 20 071 21 257 33 352 Mbombela 91 584 112 321 161 773 Umjindi 11 613 14 458 20 255 Nkomazi 53 043 71 840 95 509 Bushbuckridge 113 147 108 500 134 197 Mpumalanga 669 801 785 424 1 075 488 South Africa 9 059 571 11 205 705 14 450 161
The above table shows that the number of households in Mpumalanga increased from 785 424 in 2001 to 1 075 488 in 2011. In 2011, the district municipality with the highest number of households was Ehlanzeni (445 087 households), while Gert Sibande recorded the lowest number (273 490 households). Mbombela local municipality had the highest number of households (161 773), while Dipaleseng recorded the lowest number (12 637).

Statistics South Africa
Census 2011 Provincial Profile: Mpumalanga, Report 03-01-77
40
Table 4.2: Number of persons enumerated in households by district and local municipality, censuses of 1996, 2001 and 2011
Municipality Census 1996 Census 2001 Census 2011 Gert Sibande 770 953 874 436 1 012 735 Albert Luthuli 180 754 184 050 183 314 Msukaligwa 102 537 121 723 143 632 Mkhondo 97 113 139 827 168 206 Pixley Ka Seme 68 887 79 406 82 256 Lekwa 87 569 99 891 111 510 Dipaleseng 38 902 38 248 41 793 Govan Mbeki 195 192 211 291 282 024 Nkangala 946 553 993 262 1 275 922 Victor Khanye 52 727 54 873 73 667 Emalahleni 228 246 264 265 382 464 Steve Tshwete 131 992 138 707 217 073 Emakhazeni 35 832 39 833 45 642 Thembisile 240 791 254 730 308 890 Dr JS Moroka 256 965 240 855 248 186 Ehlanzeni 1 338 198 1 390 864 1 651 015 Thaba Chweu 62 348 70 950 91 990 Mbombela 413 545 452 184 573 877 Umjindi 43 212 47 448 63 225 Nkomazi 274 962 325 504 384 198 Bushbuckridge 544 130 494 779 537 725 Mpumalanga 3 055 704 3 258 562 3 939 672 South Africa 39 201 672 43 369 667 49 609 278
Table 4.2 shows that the number of persons enumerated in households in Mpumalanga increased from 3 258 562 in 2001 to 3 939 672 in 2011. In 2011, the district municipality with the highest number of persons was Ehlanzeni (1 651 015), while Gert Sibande recorded the lowest number (1 012 735). Mbombela local municipality had the highest number of persons (573 877), followed by Bushbuckridge (537 725), while Dipaleseng recorded the lowest number (41 793).

Statistics South Africa
Census 2011 Provincial Profile: Mpumalanga, Report 03-01-77
41
Table 4.3: Average household size by district and local municipality, censuses of 1996, 2001 and 2011
Municipality Average household size
Census 1996 Census 2001 Census 2011 Gert Sibande 4,5 4,1 3,8 Albert Luthuli 5,1 4,6 3,9 Msukaligwa 4,1 4,1 3,6 Mkhondo 5,2 5,0 4,6 Pixley Ka Seme 4,7 4,4 4,2 Lekwa 4,3 4,0 3,7 Dipaleseng 4,1 4,0 3,4 Govan Mbeki 3,9 3,4 3,5 Nkangala 4,6 4,0 3,7 Victor Khanye 4,2 4,1 3,7 Emalahleni 4,1 3,5 3,3 Steve Tshwete 3,9 3,8 3,5 Emakhazeni 3,9 4,1 3,4 Thembisile 5,1 4,4 4,1 Dr JS Moroka 5,3 4,5 4,0 Ehlanzeni 4,6 4,2 3,8 Thaba Chweu 3,1 3,3 2,9 Mbombela 4,5 4,0 3,6 Umjindi 3,7 3,3 3,4 Nkomazi 5,2 4,5 4,1 Bushbuckridge 4,8 4,6 4,0 Mpumalanga 4,6 4,1 3,8
The above table shows that the average household size in Mpumalanga decreased from 4,1 in 2001 to 3,8 in 2011. In 2011, the district municipalities with the highest average household size were Ehlanzeni and Gert Sibande (both with 3,8), whilst Nkangala recorded a slightly lower household size of 3,7. Mkhondo local municipality had the highest average household size of 4,6, while Thaba Chweu recorded the lowest with 2,9.

Stat
istic
s Sou
th A
fric
a
Cen
sus 2
011
Prov
inci
al P
rofil
e: M
pum
alan
ga, R
epor
t 03-
01-7
7
42
Figu
re 4
.1: H
ouse
hold
hea
ds b
y se
x an
d ag
e, C
ensu
s 201
1 Fi
gure
4.2
: Hou
seho
ld h
eads
by
sex
and
age,
Cen
sus 2
001
The
abov
e fig
ures
giv
e th
e pe
rcen
tage
dist
ribut
ion
of h
ouse
hold
hea
ds b
y ag
e an
d se
x in
Mpu
mal
anga
. The
pro
port
ion
of h
ouse
hold
s he
aded
by
chi
ldre
n ag
ed 1
0–14
yea
rs h
as in
crea
sed
for b
oth
mal
es a
nd fe
mal
es fr
om 0
,27%
to 0
,29%
and
from
0,1
8% to
0,2
1% fo
r mal
es a
nd fe
mal
es
resp
ectiv
ely
betw
een
2001
and
201
1. In
201
1, fa
irly
larg
er p
ropo
rtio
ns o
f mal
es th
an fe
mal
es w
ere
hous
ehol
d he
ads
from
age
gro
ups
15 to
44
year
s, w
hile
in 2
001,
larg
er p
ropo
rtio
ns o
f mal
es th
an fe
mal
es w
ere
hous
ehol
d he
ads
from
age
gro
ups
25 to
59.
A la
rger
pro
port
ion
of fe
mal
es
than
mal
es b
ecam
e ho
useh
old
head
s at h
ighe
r age
s in
both
200
1 an
d 20
11.
0,211,
72
6,82
12,5
4
12,9
3
12,6
7
11,3
7
10,7
2
9,11
7,48
5,43
3,47
2,56
1,31
0,92
0,74
0,29
1,60
5,09
8,58
9,47
10,6
4
10,9
6
11,0
89,368,
406,655,
114,893,
292,671,
94
2015
105
05
1015
20
1
0 - 1
4
1
5 - 1
9
2
0 - 2
4
2
5 - 2
9
3
0 - 3
4
3
5 - 3
9
4
0 - 4
4
4
5 - 4
9
5
0 - 5
4
5
5 - 5
9
6
0 - 6
4
6
5 - 6
9
7
0 - 7
4
7
5 - 7
9
8
0 - 8
4
8
5+
%
Figu
re 4
.1: 2
011
Fem
ale
Mal
e
0,18
2,52
5,84
10,1
512,9
314
,56
13,1
311
,11
8,67
6,16
5,07
3,24
2,92
1,62
1,29
0,61
0,27
3,09
6,00
9,16
11,3
812
,9411
,15
10,1
27,765,
786,
445,194,97
2,39
2,251,
11
2015
105
05
1015
20
1
0 - 1
4
15
- 19
2
0 - 2
4
25
- 29
3
0 - 3
4
35
- 39
4
0 - 4
4
45
- 49
5
0 - 5
4
55
- 59
6
0 - 6
4
65
- 69
7
0 - 7
4
75
- 79
8
0 - 8
4
85+
%
Figu
re 4.
2: 20
01
Fem
ale
Mal
e

Statistics South Africa
Census 2011 Provincial Profile: Mpumalanga, Report 03-01-77
43
4.2 Housing conditions
Figure 4.3: Percentage distribution of households by type of dwelling and by district municipality, censuses of 1996, 2001 and 2011
Figure 4.3 shows that the proportion of households living informal dwellings in Mpumalanga increased from 72,2% to 83,8% between 2001 and 2011. In 2011, Ehlanzeni district recorded the highest proportion (91,8%), followed by Nkangala at 82,8%. Both districts recorded percentages above the national average of 77,6%, whereas Gert Sibande recorded the lowest proportion (72,4%). The proportion of households living in informal and traditional dwellings has significantly decreased.

Statistics South Africa
Census 2011 Provincial Profile: Mpumalanga, Report 03-01-77
44
Figure 4.4: Percentage distribution of households by type of tenure status, Census 2001 and Census 2011
Excludes "other" category
The proportion of households that reported living in rented dwellings in Mpumalanga has significantly increased from 10,5% to 20,9% between 2001 and 2011, whereas the proportion of those who reported that they 'owned but had not yet paid off', 'occupied rent-free' and 'owned and had fully paid off 'their dwelling has decreased between the two censuses.
0
10
20
30
40
50
60
Rented Owned but notyet paid off
Occupied rent-free
Owned and fullypaid off
2001 10,5 9,3 25,9 54,22011 20,9 7,8 17,8 53,5
%

Statistics South Africa
Census 2011 Provincial Profile: Mpumalanga, Report 03-01-77
45
Figure 4.5: Percentage distribution of households by annual average household income, Census 2001 and Census 2011
The above figure shows the distribution of households by annual average household income in Mpumalanga between Census 2001 and Census 2011. The proportion of households that reported having no income has decreased from just above a quarter (25,5%) in 2001 to 14,4% in 2011. A similar trend can be observed for those households that earned from R1 to R4 800 and those that earned from R4 801 to R9 600. However, the proportion of households that received R9 601 and above has increased during the above period.
0
5
10
15
20
25
30
Noincome
R1 - R4800
R4 801 -R 9 600
R9 601 -R 19200
R19 201- R 38400
R38 401- R 76800
R76 801- R153
600
R153601 -R307200
R307201 -R614400
R614401 - R1228 800
R1 228801 - R2457 600
R2 457601 and
more
2001 25,49 10,75 20,29 16,96 12,09 6,89 4,41 2,13 0,58 0,16 0,16 0,08
2011 14,43 5,24 8,76 18,56 19,85 13,26 8,82 6,15 3,42 1,03 0,28 0,21
%

Statistics South Africa
Census 2011 Provincial Profile: Mpumalanga, Report 03-01-77
46
Figure 4.6: Percentage distribution of households by type of refuse disposal and by district municipality, censuses of 1996, 2001 and 2011
Figure 4.6 shows that the proportion of households whose refuse was removed by local authority at least once a week in Mpumalanga has increased from 35,4% to 42,8% between 2001 and 2011. The same trend is depicted for the three district municipalities. Despite the above increases, the proportion of households whose refuse was removed by local authority at least once a week remained significantly lower in Ehlanzeni district when compared to the other two districts. In 2011, Ehlanzeni district also recorded the highest proportion of households that had their own refuse dump (62,6%), which was also above the provincial average of 45,6%.
0,0
10,0
20,0
30,0
40,0
50,0
60,0
70,0
1996 2001 2011 1996 2001 2011 1996 2001 2011 1996 2001 2011 1996 2001 2011
Removed by localauthority at least once a
week
Removed by localauthority less often
Communal refuse dump Own refuse dump No refuse dump
DC30: Gert Sibande 51,5 53,3 64,0 1,9 1,9 1,0 4,0 1,4 1,8 34,3 33,7 25,1 8,3 9,7 8,0
DC31: Nkangala 41,8 41,0 48,6 2,5 2,3 1,4 3,2 2,2 3,6 45,9 44,6 40,1 6,6 9,9 6,3
DC32: Ehlanzeni 17,7 19,6 24,9 1,1 0,9 1,4 2,2 1,0 1,8 65,1 66,9 62,6 13,9 11,6 9,3
Mpumalanga 33,9 35,4 42,8 1,8 1,6 1,3 3,0 1,5 2,4 51,2 51,0 45,6 10,2 10,5 8,0
%

Statistics South Africa
Census 2011 Provincial Profile: Mpumalanga, Report 03-01-77
47
Figure 4.7: Percentage distribution of households by type of toilet facility and by district municipality, censuses of 1996, 2001 and 2011
The above figure shows that the proportion of households using flush or chemical toilets in Mpumalanga has increased from 36,9% to 46,0% between 2001 and 2011. A similar trend can be observed for the three district municipalities. Despite the increases, the proportion of households with flush or chemical toilets in Ehlanzeni district remained significantly lower when compared to the other two districts. In 2011, Ehlanzeni district recorded the highest proportion of households with pit toilets (62,5%), which was also above the provincial average of 46,7%.

Statistics South Africa
Census 2011 Provincial Profile: Mpumalanga, Report 03-01-77
48
Figure 4.8: Percentage distribution of households by type of energy or fuel used for lighting and by district municipality, censuses of 1996, 2001 and 2011
Figure 4.8 shows the percentage distribution of households by type of energy used for lighting by district municipality. The proportion of households using electricity for lighting in Mpumalanga has increased from 68,9% to 86,7% between 2001 and 2011. Among the districts, Ehlanzeni recorded the highest percentage of households using electricity for lighting with 89,2% in 2011. Significant decreases can be observed in households using candles for lighting, provincially and by district municipality.
0,010,020,030,040,050,060,070,080,090,0
1996 2001 2011 1996 2001 2011 1996 2001 2011 1996 2001 2011 1996 2001 2011Electricity Gas Paraffin Candles Other
DC30: Gert Sibande 44,6 57,3 83,6 0,9 0,4 0,4 6,1 3,0 0,8 48,5 38,6 15,0 0,0 0,7 0,3DC31: Nkangala 73,6 79,3 85,9 0,7 0,2 0,2 2,8 1,6 1,1 22,9 18,5 12,5 0,0 0,4 0,2DC32: Ehlanzeni 40,5 68,6 89,2 0,8 0,3 0,3 26,2 7,4 1,1 32,5 23,2 9,2 0,0 0,5 0,3Mpumalanga 51,8 68,9 86,7 0,8 0,3 0,3 13,8 4,4 1,1 33,7 25,9 11,8 0,0 0,5 0,2
%

Statistics South Africa
Census 2011 Provincial Profile: Mpumalanga, Report 03-01-77
49
Figure 4.9: Percentage distribution of households by type of energy or fuel used for cooking and by district municipality, censuses of 1996, 2001 and 2011
Figure 4.9 gives the percentage distribution of households by type of energy used for cooking, by district municipality. The proportion of households using electricity for cooking in Mpumalanga has increased from 38,1% to 69,5% between 2001 and 2011. The same trend is depicted among the three district municipalities. In 2011, the proportion of households that reported the usage of wood was highest in Ehlanzeni with 43,9%, followed by Gert Sibande with 25,6%, whilst Nkangala recorded the lowest with 10,2%. The proportion of households that used coal was highest in Gert Sibande with 10,9%, followed by Nkangala with 5,8%, whilst Ehlanzeni recorded the lowest proportion (0,7%).
0
10
20
30
40
50
60
70
80
1996 2001 2011 1996 2001 2011 1996 2001 2011 1996 2001 2011 1996 2001 2011 1996 2001 2011 1996 2001 2011
Electricity Gas Paraffin Wood Coal Animal dung OtherDC30: Gert Sibande 31,7 29,8 63,1 1,5 1,9 2,0 11,4 12,1 3,9 28,0 34,2 25,6 26,3 28,2 10,9 1,1 2,0 0,6 0,0 0,6 0,2
DC31: Nkangala 43,1 47,8 73,3 1,5 1,3 1,9 17,2 19,2 10,7 11,8 12,9 10,2 26,1 20,6 5,8 0,3 0,4 0,1 0,0 0,6 0,2
DC32: Ehlanzeni 25,2 36,1 70,4 3,6 2,2 1,9 19,2 16,0 3,2 51,4 49,4 43,9 0,6 0,9 0,7 0,1 0,3 0,0 0,0 0,6 0,2
Mpumalanga 32,4 38,1 69,5 2,4 1,8 1,9 16,6 15,9 5,9 33,1 34,2 28,4 15,1 14,4 5,0 0,4 0,8 0,2 0,0 0,6 0,2
%

Statistics South Africa
Census 2011 Provincial Profile: Mpumalanga, Report 03-01-77
50
Figure 4.10: Percentage distribution of households by type of energy or fuel used for heating and by district municipality, censuses of 1996, 2001 and 2011
The above figure shows the percentage distribution of households by type of energy used for heating, by district municipality. The proportion of households using electricity for heating in Mpumalanga has increased from 37,4% to 67,2% between 2001 and 2011. A similar trend can be observed among the three district municipalities. In 2011, the proportion of households that reported the usage of wood was highest in Gert Sibande with 22,8%, followed by Ehlanzeni with 20,6%, whilst Nkangala recorded the lowest proportion (9,8%). Gert Sibande district reported the highest proportion of households that used coal for heating (18,5%), followed by Nkangala (15,6%), whilst Ehlanzeni recorded the lowest proportion (0,5%). Significant decreases can be observed for the proportions of households using paraffin for heating, provincially and by district municipality.
0,0
10,0
20,0
30,0
40,0
50,0
60,0
70,0
80,0
1996 2001 2011 1996 2001 2011 1996 2001 2011 1996 2001 2011 1996 2001 2011 1996 2001 2011 1996 2001 2011Electricity Gas Paraffin Wood Coal Animal dung Other
DC30: Gert Sibande 31,2 27,3 53,7 0,9 1,2 2,5 8,1 8,1 1,7 29,4 26,6 22,8 29,4 33,0 18,5 1,1 1,8 0,7 0,0 2,2 0,2DC31: Nkangala 41,4 46,9 69,1 0,9 0,8 2,2 7,7 7,3 3,1 13,3 10,8 9,8 36,3 30,5 15,6 0,3 0,3 0,1 0,1 3,6 0,2DC32: Ehlanzeni 24,5 36,9 75,2 1,2 0,6 1,4 10,0 6,9 1,9 62,5 48,3 20,6 1,5 1,5 0,5 0,1 0,2 0,1 0,2 5,6 0,3Mpumalanga 31,6 37,4 67,2 1,0 0,8 2,0 8,8 7,3 2,2 38,3 30,7 17,5 19,8 19,1 10,6 0,4 0,7 0,3 0,1 4,1 0,2
%

Statistics South Africa
Census 2011 Provincial Profile: Mpumalanga, Report 03-01-77
51
Figure 4.11: Percentage of households having access to piped water by district municipality, censuses of 1996, 2001 and 2011
Figure 4.11 shows that the proportion of households with access to piped water inside the dwelling and/or yard in Mpumalanga has increased from 56,5% to 71,7% between 2001 and 2011. The figure depicts the same trend for the three district municipalities. Despite the increases, the proportion of households with access to piped water inside the dwelling and/or yard in Ehlanzeni district remained lower when compared to the other two districts. In 2011, Ehlanzeni district recorded the highest proportion of households with no access to piped water with 19%, which was above the provincial average of 12,6%.
0102030
40506070
8090
1996 2001 2011 1996 2001 2011 1996 2001 2011Piped water inside dwelling/yard Piped water outside yard No access to piped water
DC30: Gert Sibande 60,4 60,6 81,3 20,4 25,9 9,9 19,2 13,5 8,9DC31: Nkangala 70,3 68,9 81,6 15,6 19,9 11,0 14,1 11,2 7,3DC32: Ehlanzeni 48,4 44,5 57,8 33,4 38,3 23,2 18,2 17,2 19,0Mpumalanga 58,3 56,5 71,7 24,5 29,3 15,8 17,2 14,3 12,6
%

Statistics South Africa
Census 2011 Provincial Profile: Mpumalanga, Report 03-01-77
52
4.3 Household goods
Figure 4.12: Percentage of households owning specific household goods by district municipality, censuses of 1996, 2001 and 2011
Figure 4.12 shows the percentage of households owning specific household goods, by district municipality. Overall, the proportion of households that reported owning computers, televisions, cellphones and refrigerators in Mpumalanga has increased respectively from just 4,3% to 16,3%, from just below 50% to 75,0%, from 31,1% to 91,1% and from just below 50% to 70,9%, between 2001 and 2011. The three district municipalities show the same trend. Despite the increases, the proportion of households in 2011 with access to computers in Mpumalanga and all the districts was significantly lower than the other categories, except for the proportion of households that had a landline/telephone, which has declined. Comparisons among the districts show that Ehlanzeni district recorded the lowest proportion of households with access to computers in 2011 with only 14%.
0,010,020,030,040,050,060,070,080,090,0
100,0
2001 2011 2001 2011 2001 2011 2001 2011 2001 2011 2001 2011Computer Television Radio Cellphone Telephone Refrigerator
Gert Sibande 5,1 16,4 48,3 75,3 75,9 73,1 29,3 90,1 16,1 7,6 42,9 67,0Nkangala 5,3 19,1 58,9 76,2 77,4 75,7 35,6 92,3 18,8 7,3 58,5 71,7Ehlanzeni 3,1 14,0 42,2 73,9 68,6 68,7 28,8 90,8 10,0 4,8 46,9 72,7Mpumalanga 4,3 16,3 49,1 75,0 73,3 72,1 31,1 91,1 14,4 6,3 49,4 70,9
%

Statistics South Africa
Census 2011 Provincial Profile: Mpumalanga, Report 03-01-77
53
Figure 4.13: Access to the Internet, Census 2011
The proportion of households that had access to the Internet from home, from work and from elsewhere in Mpumalanga, was 5,2%, 3,3% and 4,9% respectively and was below the national figures of 8,6%, 4,7% and 5,6% respectively.
0
10
20
30
40
50
60
70
From home From cellphone
From work Fromelsewhere
No accessto internet
MP 5,2 18,1 3,3 4,9 68,6RSA 8,6 16,3 4,7 5,6 64,8
%

Statistics South Africa
Census 2011 Provincial Profile: Mpumalanga, Report 03-01-77
54
Chapter 5: Conclusion As highlighted in the introduction, Mpumalanga is one of the nine provinces of South Africa. It is situated in the east, and its name means, literally, ‘the place where the sun rises from’. Mpumalanga occupies about 6,3% (76 495 km2) of the land surface area of South Africa. Mpumalanga covers the area between Witbank in the west and Komatipoort in the east. On its southern borders lie the Free State and KwaZulu-Natal, and in the north, the Limpopo provinces. Gauteng borders it in the west. The neighbouring countries of Swaziland and Mozambique also share borders with it in the east.
Demographics of Mpumalanga
In 1996, Mpumalanga had a total population of 3 123 869, approximately 7,7% of South Africa’s total population; this increased to 3 365 554 (approximately 7,5% of South Africa’s total population) in 2001, and then to 4 039 939 (approximately 7,8% of South Africa’s total population) in 2011. Ehlanzeni district comprised 42% of the population, followed by Nkangala with 32,4% and then Gert Sibande with 25,8%.
The population of the province comprised predominantly black Africans who accounted for about 91% of its total population in 2011. The province had a higher proportion of women than men (95 men per 100 women) in 2007.
The highest proportion of the population were those aged 5–9 years (12,7%) recorded in Census 1996, whereas the highest proportion reported in Census 2001 were those aged 10–14 years (12,6%), whilst the highest proportion reported in Census 2011 was the age group 0–4 years at 11,4%.
The dependency ratio has decreased over the years; the province recorded a dependency ratio of 56 in 2011, which implies a decrease from the 67 and 73,6 recorded for 2001 and 1996 respectively.
Migration
Overall, Mpumalanga had a net gain of 52 845 people. Most people who emigrated from the province went to Gauteng province with a net loss of 38,1%, and most immigrants came from outside the country, with a net gain of 28,9%.
General health and functioning
More than 7% of the Mpumalanga population were disabled. The proportion of males and females who were disabled was 6,2% and 7,8% respectively.

Statistics South Africa
Census 2011 Provincial Profile: Mpumalanga, Report 03-01-77
55
Education
Overall, school attendance has increased from 73,5% to 74,8% in Mpumalanga for those aged 5–24 years. Focusing on the compulsory nine years that a child should be attending school, it can be observed that the proportion of those attending school has increased from just above 88% in 1996 to about 96% in 2001, and escalated further to about 98% in 2011. The proportion of those with a higher education has slightly increased from 6% in 2001 to just over 10% in 2011.
The labour market
The unemployment rate has decreased from 43,1% to 31,6% in Mpumalanga, between Census 2001 and Census 2011. In 2011, the unemployment rate in Ehlanzeni district remained higher than the provincial average at 34,4%. Youth and women were the most affected (40,4% and 39,2% respectively).
General household information
Mpumalanga had a total of 1 075 488 households in 2011, of which about 42% were recorded in Ehlanzeni district, followed by Nkangala with 31% and Gert Sibande with about 27%. Approximately 40% of the households in Mpumalanga in 2011 were headed by females, particularly in the Ehlanzeni district (44% female-headed households). There was a slight increase in the proportion of households headed by children aged 10–14 years (from 0,22% to 0,24%) between 2001 and 2011.
Housing conditions
The proportion of households living in formal dwellings in Mpumalanga increased from 72,2% to 83,8% between 2001 and 2011. In 2011, Ehlanzeni had the highest proportion of these households (about 92%).
The proportion of households that owned and had fully paid off for their dwellings in Mpumalanga has slightly decreased from 2001 and 2011, whilst the proportion of households that rented their dwellings has significantly increased from 15,5% to 20,9% between 2001 and 2011.
The proportion of households in Mpumalanga with no income has decreased by more than a quarter in 2001 to 14,4% in 2011. However, the proportion of households that earned R9 601 and more has increased.
The proportion of households whose refuse was removed by a local authority at least once a week in Mpumalanga has increased from 35,4% to 42,8% between 2001 and 2011. The three district municipalities also show the same trend. Despite these increases, the percentage of households whose refuse was removed by a local authority at least once a week in Ehlanzeni district remained significantly lower when compared to the other two districts.

Statistics South Africa
Census 2011 Provincial Profile: Mpumalanga, Report 03-01-77
56
The proportion of households using flush or chemical toilets in Mpumalanga has increased from 36,9% to 46% between 2001 and 2011. A similar trend can be observed for all three district municipalities. Despite these increases, the proportion of households using pit latrines remained the highest in Ehlanzeni district.
The proportion of households using electricity for lighting in Mpumalanga has increased from 68,9% to 86,7% between 2001 and 2011. Among the districts, Ehlanzeni recorded the highest percentage of households using electricity for lighting with 89,2% in 2011.
The proportion of households using electricity for cooking in Mpumalanga has increased from 38,1% to 69,5% between 2001 and 2011. A similar trend can be observed among all three district municipalities.
The proportion of households using electricity for heating in Mpumalanga has increased from 37,4% to 67,2% between 2001 and 2011. A similar trend can be observed among all three district municipalities.
The proportion of households with access to piped water inside the dwelling and/or yard in Mpumalanga has increased from 56,5% to 71,7% between 2001 and 2011. This increase can be observed in all three district municipalities. Despite the increases, the proportion of households with access to piped water inside the dwelling and/or yard in Ehlanzeni district remained significantly lower when compared to the other two districts.
Household goods
Overall, there was an increase in the proportion of households in Mpumalanga that had access to computers (4,3% to 16,3%), televisions (49,1% to 75,0%), cellphones (31,1% to 91,1%) and refrigerators (49,4% to 50,9%).
In Mpumalanga, 5,15% of households had access to the Internet from home, 3,33% had access from work, and 4,9% had access from elsewhere. These percentages are below the national figures of 8,6%, 4,7% and 5,6% respectively, and the proportion of households with no access to the Internet in Mpumalanga was higher than the national average.

Stat
istic
s Sou
th A
fric
a
Cen
sus 2
011
Prov
inci
al P
rofil
e: M
pum
alan
ga, R
epor
t 03-
01-7
7
57
Chap
ter 6
: App
endi
x Ta
ble
6.1:
Pop
ulat
ion
dist
ribut
ion
of S
outh
Afr
ica
by a
ge a
nd se
x, c
ensu
ses o
f 199
6, 2
001
and
2011
Age
grou
p
Cens
us 1
996
Cens
us 2
001
Cens
us 2
011
Cens
us 1
996
Cens
us 2
001
Cens
us 2
011
Mal
e Fe
mal
e M
ale
Fem
ale
Mal
e Fe
mal
e M
ale
Fem
ale
Mal
e Fe
mal
e M
ale
Fem
ale
Pers
ons
Perc
enta
ges
0–4
2 21
6 76
3 2
226
858
2 22
3 73
1 2
226
085
2 86
7 58
5 2
817
867
11,5
10
,7
10,4
9,
5 11
,4
10,6
5–
9 2
333
563
2 33
5 16
0 2
425
804
2 42
7 75
1 2
425
181
2 39
4 57
0 12
,1
11,2
11
,3
10,4
9,
6 9,
0 10
–14
2 30
8 75
9 2
345
341
2 51
8 95
7 2
542
961
2 34
4 27
5 2
250
611
12,0
11
,3
11,8
10
,9
9,3
8,5
15–1
9 2
050
213
2 13
0 50
3 2
453
079
2 52
8 64
2 2
498
573
2 50
4 90
5 10
,6
10,2
11
,4
10,8
9,
9 9,
4 20
–24
1 91
7 91
8 2
064
435
2 09
9 29
3 2
195
230
2 69
4 64
6 2
679
896
10,0
9,
9 9,
8 9,
4 10
,7
10,1
25
–29
1 66
3 06
5 1
792
664
1 89
9 12
5 2
035
814
2 54
2 68
2 2
516
635
8,6
8,6
8,9
8,7
10,1
9,
5 30
–34
1 46
3 49
9 1
610
702
1 59
4 48
8 1
746
413
2 03
6 20
6 1
992
804
7,6
7,7
7,4
7,5
8,1
7,5
35–3
9 1
284
955
1 36
8 80
0 1
441
507
1 63
0 26
4 1
709
347
1 75
8 42
0 6,
7 6,
6 6,
7 7,
0 6,
8 6,
6 40
–44
1 03
0 59
7 1
108
028
1 23
3 63
2 1
385
833
1 40
2 32
8 1
546
291
5,3
5,3
5,8
5,9
5,6
5,8
45–4
9 81
3 81
6 86
3 71
0 96
7 60
4 1
119
776
1 19
5 74
0 1
424
543
4,2
4,1
4,5
4,8
4,7
5,4
50–5
4 60
0 47
7 66
8 41
8 76
9 49
9 86
8 52
1 1
011
349
1 20
6 94
0 3,
1 3,
2 3,
6 3,
7 4,
0 4,
5 55
–59
483
678
586
258
552
323
652
943
811
950
985
458
2,5
2,8
2,6
2,8
3,2
3,7
60–6
4 35
2 05
3 53
8 48
3 44
4 51
0 62
0 78
4 61
2 36
4 77
3 40
4 1,
8 2,
6 2,
1 2,
7 2,
4 2,
9 65
–69
304
013
454
874
304
763
483
164
401
548
556
257
1,6
2,2
1,4
2,1
1,6
2,1
70–7
4 19
5 11
9 28
7 04
4 23
2 54
7 39
8 92
2 29
3 49
8 45
4 83
2 1,
0 1,
4 1,
1 1,
7 1,
2 1,
7 75
–79
141
844
235
584
136
436
231
101
165
283
315
984
0,7
1,1
0,6
1,0
0,7
1,2
80–8
4 62
072
11
6 83
1 90
835
18
0 11
1 10
0 69
4 22
2 22
2 0,
3 0,
6 0,
4 0,
8 0,
4 0,
8 85
+ 43
230
94
054
45
908
11
1 42
5 75
543
18
0 13
0 0,
2 0,
5 0,
2 0,
5 0,
3 0,
7 To
tal
19 2
65 6
34
20 8
27 7
44
21 4
34 0
40
23 3
85 7
37
25 1
88 7
91
26 5
81 7
69
100,
0 10
0,0
100,
0 10
0,0
100,
0 10
0,0

Stat
istic
s Sou
th A
fric
a
Cen
sus 2
011
Prov
inci
al P
rofil
e: M
pum
alan
ga, R
epor
t 03-
01-7
7
58
Tabl
e 6.
2: P
opul
atio
n di
strib
utio
n of
Mpu
mal
anga
by
age
and
sex,
cen
suse
s of 1
996,
200
1 an
d 20
11
Age
grou
p
Cens
us 1
996
Cens
us 2
001
Cens
us 2
011
Cens
us 1
996
Cens
us 2
001
Cens
us 2
011
Mal
e Fe
mal
e M
ale
Fem
ale
Mal
e Fe
mal
e M
ale
Fem
ale
Mal
e Fe
mal
e M
ale
Fem
ale
Pers
ons
Perc
enta
ges
0–4
180
857
185
880
188
085
191
603
231
816
229
744
12,2
11
,7
11,7
10
,9
11,7
11
,1
5–9
193
842
197
039
200
204
203
558
201
771
201
001
13,1
12
,4
12,5
11
,6
10,2
9,
7 10
–14
190
257
195
907
209
840
213
141
201
016
195
331
12,9
12
,3
13,1
12
,1
10,2
9,
5 15
–19
168
376
175
598
200
918
205
744
211
495
212
784
11,4
11
,0
12,5
11
,7
10,7
10
,3
20–2
4 14
7 07
3 16
4 48
7 15
2 42
0 16
5 60
0 21
7 23
2 21
0 30
8 9,
9 10
,3
9,5
9,4
11,0
10
,2
25–2
9 12
2 64
6 13
9 43
2 12
9 08
7 15
0 98
5 19
9 11
3 19
3 98
3 8,
3 8,
7 8,
1 8,
6 10
,1
9,4
30–3
4 10
7 67
6 11
9 59
6 10
7 01
3 12
6 98
5 15
0 00
9 14
7 55
4 7,
3 7,
5 6,
7 7,
2 7,
6 7,
1 35
–39
93 3
75
95 4
25
99 3
87
115
538
124
064
131
844
6,3
6,0
6,2
6,6
6,3
6,4
40–4
4 74
108
77
711
82
470
90
110
10
2 00
6 11
4 83
3 5,
0 4,
9 5,
1 5,
1 5,
2 5,
6 45
–49
56 0
87
55 9
81
66 5
43
74 9
69
88 8
44
104
995
3,8
3,5
4,2
4,3
4,5
5,1
50–5
4 39
277
40
906
50
431
54
779
73
536
83
144
2,
7 2,
6 3,
1 3,
1 3,
7 4,
0 55
–59
31 2
25
37 1
14
34 9
13
39 1
31
59 6
83
69 6
78
2,1
2,3
2,2
2,2
3,0
3,4
60–6
4 20
913
32
790
28
345
39
541
42
761
51
681
1,
4 2,
1 1,
8 2,
2 2,
2 2,
5 65
–69
20 9
76
30 9
92
17 7
47
29 6
79
27 0
53
37 1
63
1,4
1,9
1,1
1,7
1,4
1,8
70–7
4 13
136
16
557
15
819
27
349
19
907
31
856
0,
9 1,
0 1,
0 1,
6 1,
0 1,
5 75
–79
11 4
07
16 0
45
8 99
3 13
338
10
463
20
752
0,
8 1,
0 0,
6 0,
8 0,
5 1,
0 80
–84
4 61
1 6
674
7 32
2 12
709
7
273
16 2
77
0,3
0,4
0,5
0,7
0,4
0,8
85+
3 13
8 5
504
3 83
7 7
423
6 01
4 12
956
0,
2 0,
3 0,
2 0,
4 0,
3 0,
6 To
tal
1 47
8 97
7 1
593
637
1 60
3 37
4 1
762
180
1 97
4 05
5 2
065
883
100,
0 10
0,0
100,
0 10
0,0
100,
0 10
0,0

Stat
istic
s Sou
th A
fric
a
Cen
sus 2
011
Prov
inci
al P
rofil
e: M
pum
alan
ga, R
epor
t 03-
01-7
7
59
Tabl
e 6.
3: P
opul
atio
n of
Mpu
mal
anga
by
sex
and
dist
rict a
nd lo
cal m
unic
ipal
ity, c
ensu
ses o
f 199
6, 2
001
and
2011
Mun
icip
ality
19
96
2001
20
11
Mal
e Fe
mal
e To
tal
Mal
e Fe
mal
e To
tal
Mal
e Fe
mal
e To
tal
Gert
Sib
ande
DM
39
3 54
5 40
3 85
5 79
7 40
0 43
3 42
8 46
6 58
0 90
0 00
7 51
4 40
6 52
8 78
9 1
043
194
Albe
rt L
uthu
li 84
255
98
464
18
2 71
9 86
145
10
1 60
6 18
7 75
1 87
188
98
822
18
6 01
0 M
suka
ligw
a 52
220
53
147
10
5 36
8 60
133
64
680
12
4 81
2 74
113
75
264
14
9 37
7 M
khon
do
48 6
73
51 7
14
100
388
67 9
13
75 1
64
143
077
82 2
63
89 7
19
171
982
Pixl
ey K
a Se
me
33 7
75
36 4
03
70 1
78
37 6
88
43 0
49
80 7
37
39 5
20
43 7
15
83 2
35
Lekw
a 44
684
45
396
90
080
50
629
52
636
10
3 26
5 57
647
58
014
11
5 66
2 Di
pale
seng
19
034
20
008
39
042
18
602
20
016
38
618
21
462
20
928
42
390
Go
van
Mbe
ki
110
904
98 7
22
209
626
112
319
109
429
221
747
152
211
142
327
294
538
Nka
ngal
a DM
46
8 95
5 49
3 29
4 96
2 24
9 49
0 09
9 52
8 32
3 1
018
422
656
247
651
882
1 30
8 12
9 Vi
ctor
Kha
nye
26 4
66
26 7
42
53 2
08
27 7
38
28 5
97
56 3
35
38 8
16
36 6
36
75 4
52
Emal
ahle
ni
122
104
113
936
236
040
140
715
135
698
276
413
208
751
186
715
395
466
Stev
e Ts
hwet
e 68
509
66
826
13
5 33
6 70
593
72
179
14
2 77
2 11
9 41
1 11
0 42
1 22
9 83
1 Em
akha
zeni
18
553
18
451
37
004
21
137
21
870
43
007
24
099
23
117
47
216
Th
embi
sile
112
739
128
621
241
360
118
731
137
852
256
583
147
676
162
783
310
458
Dr JS
Mor
oka
120
583
138
719
259
302
111
186
132
127
243
313
117
494
132
211
249
705
Ehla
nzen
i DM
64
2 96
3 72
1 25
8 1
364
221
679
847
767
277
1 44
7 12
5 80
3 40
3 88
5 21
3 1
688
615
Thab
a Ch
weu
33
174
32
735
65
909
40
716
40
964
81
681
50
415
47
972
98
387
M
bom
bela
20
5 09
1 22
0 99
8 42
6 09
0 22
7 67
1 24
9 23
3 47
6 90
3 28
5 75
0 30
3 04
4 58
8 79
4 U
mjin
di
26 0
79
22 4
68
48 5
47
28 3
52
25 3
92
53 7
44
36 4
07
33 1
70
69 5
77
Nko
maz
i 13
0 34
3 14
7 52
1 27
7 86
4 15
7 86
7 17
6 80
2 33
4 66
9 18
4 80
8 20
5 80
2 39
0 61
0 Bu
shbu
ckrid
ge
248
276
297
536
545
811
225
241
274
887
500
128
246
023
295
224
541
248
Mpu
mal
anga
1
505
462
1 61
8 40
7 3
123
869
1 60
3 37
4 1
762
180
3 36
5 55
4 1
974
055
2 06
5 88
3 4
039
939

Stat
istic
s Sou
th A
fric
a
Cen
sus 2
011
Prov
inci
al P
rofil
e: M
pum
alan
ga, R
epor
t 03-
01-7
7
60
Tabl
e 6.
4: P
opul
atio
n of
Mpu
mal
anga
by
broa
d ag
e gr
oups
and
dis
tric
t and
loca
l mun
icip
ality
, cen
suse
s of 1
996,
200
1 an
d 20
11
Mun
icip
ality
1996
20
01
2011
0–14
15
–64
65+
Depe
nden
cyra
tio
0–14
15
–64
65+
Depe
nden
cyra
tio
0–14
15
–64
65+
Depe
nden
cy
ratio
N
%
N
%
N
%
Ge
rt S
iban
de D
M
277
268
479
592
30 9
52
66,3
31
7 63
4 54
5 41
2 36
961
65
,0
329
426
666
692
47 0
75
56,5
Al
bert
Lut
huli
77 3
48
94 6
56
8 25
4 93
,0
76 2
36
102
461
9 05
4 83
,2
67 8
01
108
342
9 86
7 71
,7
Msu
kalig
wa
35 6
64
65 1
89
4 08
8 61
,6
43 5
66
76 1
33
5 11
4 63
,9
45 4
10
97 9
01
6 06
7 52
,6
Mkh
ondo
36
931
58
609
3
931
71,3
56
532
80
861
5
684
76,9
62
923
10
1 77
9 7
280
69,0
Pi
xley
Ka
Sem
e 25
334
39
755
3
545
76,5
31
166
45
429
4
142
77,7
29
050
49
452
4
733
68,3
Le
kwa
28 8
39
56 6
27
3 86
4 59
,1
33 1
36
65 7
07
4 42
2 57
,2
33 0
85
76 7
84
5 79
3 50
,6
Dipa
lese
ng
12 6
98
23 7
20
1 92
5 64
,6
12 7
08
23 8
67
2 04
3 61
,8
11 9
53
27 9
61
2 47
6 51
,6
Gova
n M
beki
60
454
14
1 03
6 5
345
48,6
64
290
15
0 95
5 6
503
46,9
79
205
20
4 47
4 10
859
44
,0
Nka
ngal
a DM
32
9 84
0 57
6 73
8 40
641
66
,8
339
946
633
861
44 6
15
60,7
37
2 78
8 86
9 92
3 65
419
50
,4
Vict
or K
hany
e 15
834
33
849
2
201
57,2
17
992
35
979
2
364
56,6
21
285
50
604
3
562
49,1
Em
alah
leni
DM
68
078
15
7 74
0 6
658
49,6
78
420
19
0 09
1 7
902
45,4
99
553
28
1 76
8 14
145
40
,4
Stev
e Ts
hwet
e 39
583
88
298
4
381
53,3
42
284
95
720
4
767
49,2
57
569
16
2 41
3 9
849
41,5
Em
akha
zeni
11
877
22
236
2
028
66,4
13
562
27
306
2
139
57,5
13
201
31
271
2
745
51,0
Th
embi
sile
94 8
61
134
757
10 4
67
79,1
95
449
14
9 42
6 11
708
71
,7
99 7
32
195
409
15 3
17
58,9
Dr
JS M
orok
a 99
607
13
9 85
8 14
905
85
,4
92 2
40
135
338
15 7
36
79,8
81
447
14
8 45
7 19
801
68
,2
Ehla
nzen
i DM
53
6 67
3 74
3 46
3 57
447
83
,5
548
850
835
636
62 6
39
73,2
55
8 46
4 1
052
932
77 2
20
60,4
Th
aba
Chw
eu
19 2
53
42 5
08
2 89
2 55
,1
23 2
14
54 8
58
3 60
9 48
,9
24 7
62
68 7
81
4 84
4 43
,0
Mbo
mbe
la
154
909
244
104
16 5
51
74,6
16
4 78
2 29
3 23
6 18
886
62
,6
175
651
388
320
24 8
22
51,6
U
mjin
di
13 0
25
32 8
09
1 63
9 48
,0
14 6
48
37 1
06
1 99
0 44
,8
18 4
20
45 9
30
2 80
7 46
,2
Nko
maz
i 11
9 23
6 13
9 88
7 10
987
98
,6
136
392
184
692
13 5
85
81,2
13
9 27
9 23
7 67
7 16
075
65
,4
Bush
buck
ridge
23
0 25
0 28
4 15
5 25
378
92
,1
209
814
265
744
24 5
70
88,2
20
0 35
2 31
2 22
4 28
671
73
,4
Mpu
mal
anga
1
143
781
1 79
9 79
3 12
9 03
9 73
,6
1 20
6 43
0 2
014
909
144
215
67,0
1
260
679
2 58
9 54
7 18
9 71
4 56
,0

Stat
istic
s Sou
th A
fric
a
Cen
sus 2
011
Prov
inci
al P
rofil
e: M
pum
alan
ga, R
epor
t 03-
01-7
7
61
Tabl
e 6.
5: P
rovi
nce
of p
revi
ous r
esid
ence
by
prov
ince
of u
sual
resi
denc
e, b
etw
een
Cens
us 2
001
and
Cens
us 2
011
Prov
ince
of
prev
ious
re
side
nce
Prov
ince
of u
sual
resi
denc
e O
ut-
mig
ratio
n In
-m
igra
tion
Net
- m
igra
tion
Wes
tern
C
ape
East
ern
Cape
N
orth
ern
Cap
e Fr
ee
Stat
e Kw
aZul
u-N
atal
N
orth
Wes
t Ga
uten
g M
pum
a-la
nga
Lim
popo
W
este
rn C
ape
5 15
8 31
6 4
0 15
2 1
0 56
6 5
155
9
221
5
039
5
0 69
4 4
759
3
381
12
8 96
7 43
2 79
0 30
3 82
3 Ea
ster
n Ca
pe
170
829
6
250
135
5 0
81
15
542
73
831
32
341
117
964
1
2 00
1 8
877
43
6 46
6 15
8 20
5 -2
78 2
61
Nor
ther
n Ca
pe
17
577
4 0
77
1 05
4 84
1 8
559
5
708
1
1 47
8 1
6 01
9 4
202
1
907
69
527
62
792
-6
735
Fr
ee S
tate
1
2 64
4 8
155
7
103
2
524
282
8 8
81
24
090
74
387
10
859
5 2
83
151
402
127
101
-24
301
KwaZ
ulu-
Nat
al
21
857
19
178
2 4
37
11
481
9 81
2 12
9 8
655
1
84 3
37
28
904
4 7
19
281
568
250
884
-30
684
Nor
th W
est
6 0
13
3 0
85
17
000
9 9
17
3 8
82
3 14
6 25
5 1
03 5
50
8 4
95
14
066
166
008
273
177
107
169
Gaut
eng
74
915
40
161
9 4
46
31
455
55
620
75
260
10 4
16 2
58
61
269
54
145
402
271
1 44
0 14
2 1
037
871
Mpu
mal
anga
7
256
3
390
1
932
5
032
1
2 51
1 1
3 09
1 1
22 5
78
3 72
3 84
3 2
5 29
9 19
1 08
9 24
3 93
4 52
845
Li
mpo
po
7 8
26
2 7
42
1 8
47
5 4
81
4 5
74
26
826
283
495
3
9 49
2 5
088
084
372
283
219
426
-152
857
O
utsi
de S
outh
Af
rica
113
873
3
7 26
5 7
380
3
4 47
9 7
6 65
6 7
6 39
7 4
87 1
18
73
953
101
749
Tabl
e 6.
6: In
ter-
prov
inci
al m
igra
tion
by se
x, b
etw
een
Cens
us 2
001
and
Cens
us 2
011
Prov
ince
In
-mig
ratio
n O
ut-m
igra
tion
Mal
e Fe
mal
e M
ale
Fem
ale
Wes
tern
Cap
e 2
494
2 26
5 3
771
3 48
6 Ea
ster
n Ca
pe
6 60
8 5
393
1 87
4 1
516
Nor
ther
n Ca
pe
2 21
1 1
991
1 15
3 77
9 Fr
ee S
tate
6
020
4 83
9 2
718
2 31
4 Kw
aZul
u-N
atal
16
063
12
841
6
298
6 21
3 N
orth
Wes
t 4
662
3 83
4 7
491
5 59
9 Ga
uten
g 33
318
27
951
63
262
59
316
M
pum
alan
ga
1 79
0 86
3 1
932
980
1 79
0 86
3 1
932
980
Lim
popo
21
860
17
632
13
672
11
627
O
utsi
de S
outh
Afr
ica
46 9
90
26 9
63
1 68
8 1
058

Stat
istic
s Sou
th A
fric
a
Cen
sus 2
011
Prov
inci
al P
rofil
e: M
pum
alan
ga, R
epor
t 03-
01-7
7
62
Tabl
e 6.
7: In
-mig
ratio
n to
Mpu
mal
anga
by
5-ye
ar a
ge g
roup
s, b
etw
een
Cens
us 2
001
and
Cens
us 2
011
Age
grou
p W
este
rn C
ape
East
ern
Cap
e N
orth
ern
Cap
e Fr
ee S
tate
Kw
aZul
u-N
atal
N
orth
Wes
t Ga
uten
g M
pum
a-la
nga
Lim
popo
O
utsi
deSo
uth
Afric
a 00
–04
223
556
194
422
1 09
9 39
7 2
923
447
592
1 48
5 3
265
05–0
9 25
4 55
9 27
9 52
4 1
495
549
3 80
0 38
8 18
9 1
820
2 76
0 10
–14
282
598
328
611
1 74
0 59
4 4
058
379
815
2 32
4 2
740
15–1
9 28
6 88
2 27
8 67
3 2
108
538
4 31
8 39
8 40
2 2
968
6 38
6 20
–24
526
2 12
9 43
8 1
472
4 57
0 82
5 6
445
378
784
6 52
9 15
732
25
–29
735
2 57
6 61
2 2
018
5 73
7 1
313
9 09
7 33
4 75
3 7
574
17 1
53
30–3
4 50
6 1
593
534
1 38
5 3
648
1 13
4 7
844
256
806
5 34
2 10
913
35
–39
422
1 00
0 41
3 1
101
2 61
5 92
0 6
455
226
668
3 96
7 6
292
40–4
4 37
3 67
2 32
4 75
5 1
731
679
4 82
8 19
6 49
3 2
686
3 46
0 45
–49
349
442
249
557
1 30
1 43
1 3
416
179
273
1 71
6 1
982
50–5
4 22
8 34
5 19
1 45
6 1
005
384
2 45
3 14
6 25
9 1
139
1 14
8 55
–59
161
212
120
311
664
243
1 78
0 12
1 79
1 73
2 82
7 60
–64
135
151
79
204
418
162
1 45
8 89
523
44
2 46
4 65
–69
120
108
64
146
295
113
982
60 7
44
314
321
70–7
4 84
76
44
10
7 23
4 10
6 67
8 49
005
19
2 19
7 75
–79
38
46
17
70
113
58
351
29 6
23
107
137
80–8
4 16
27
20
28
61
17
23
5 22
374
73
91
85
+ 18
27
17
19
70
33
14
9 17
751
82
85
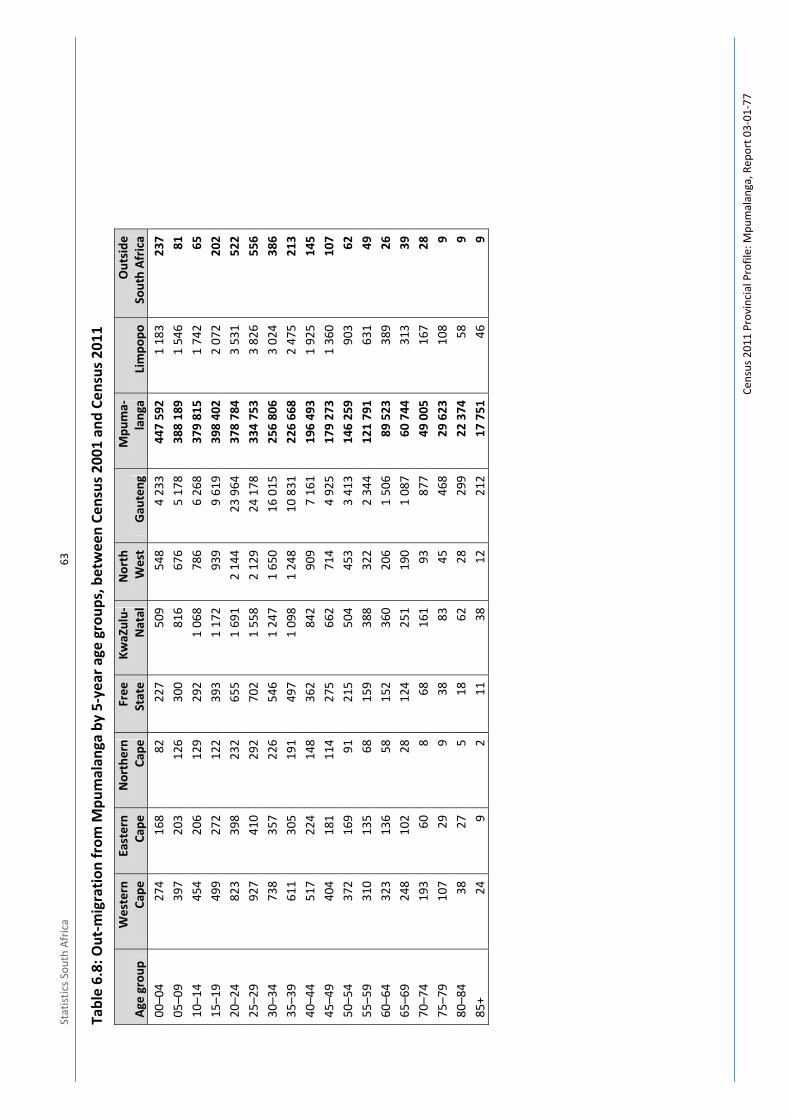
Stat
istic
s Sou
th A
fric
a
Cen
sus 2
011
Prov
inci
al P
rofil
e: M
pum
alan
ga, R
epor
t 03-
01-7
7
63
Tabl
e 6.
8: O
ut-m
igra
tion
from
Mpu
mal
anga
by
5-ye
ar a
ge g
roup
s, b
etw
een
Cens
us 2
001
and
Cens
us 2
011
Age
grou
p W
este
rn
Cape
Ea
ster
n Ca
pe
Nor
ther
n Ca
pe
Free
St
ate
KwaZ
ulu-
Nat
al
Nor
th
Wes
t Ga
uten
g M
pum
a-la
nga
Lim
popo
O
utsi
deSo
uth
Afric
a 00
–04
274
168
82
227
509
548
4 23
3 44
7 59
2 1
183
237
05–0
9 39
7 20
3 12
6 30
0 81
6 67
6 5
178
388
189
1 54
6 81
10
–14
454
206
129
292
1 06
8 78
6 6
268
379
815
1 74
2 65
15
–19
499
272
122
393
1 17
2 93
9 9
619
398
402
2 07
2 20
2 20
–24
823
398
232
655
1 69
1 2
144
23 9
64
378
784
3 53
1 52
2 25
–29
927
410
292
702
1 55
8 2
129
24 1
78
334
753
3 82
6 55
6 30
–34
738
357
226
546
1 24
7 1
650
16 0
15
256
806
3 02
4 38
6 35
–39
611
305
191
497
1 09
8 1
248
10 8
31
226
668
2 47
5 21
3 40
–44
517
224
148
362
842
909
7 16
1 19
6 49
3 1
925
145
45–4
9 40
4 18
1 11
4 27
5 66
2 71
4 4
925
179
273
1 36
0 10
7 50
–54
372
169
91
215
504
453
3 41
3 14
6 25
9 90
3 62
55
–59
310
135
68
159
388
322
2 34
4 12
1 79
1 63
1 49
60
–64
323
136
58
152
360
206
1 50
6 89
523
38
9 26
65
–69
248
102
28
124
251
190
1 08
7 60
744
31
3 39
70
–74
193
60
8 68
16
1 93
87
7 49
005
16
7 28
75
–79
107
29
9 38
83
45
46
8 29
623
10
8 9
80–8
4 38
27
5
18
62
28
299
22 3
74
58
9 85
+ 24
9
2 11
38
12
21
2 17
751
46
9

Statistics South Africa
Census 2011 Provincial Profile: Mpumalanga, Report 03-01-77
64
Table 6.9: In-migration to Mpumalanga by broad age groups, between Census 2001 and Census 2011
Province 00–14 15–64 65+ Western Cape 760 3 721 277 Eastern Cape 1 714 10 003 284 Northern Cape 801 3 238 163 Free State 1 557 8 932 370 KwaZulu-Natal 4 334 23 797 774 North West 1 540 6 628 327 Gauteng 10 781 48 093 2 395 Mpumalanga 1 215 596 2 328 751 179 496 Limpopo 5 629 33 095 768 Outside South Africa 8 765 64 357 831
Table 6.10: Out-migration from Mpumalanga by broad age groups, between Census 2001 and Census 2011
Province 00–14 15–64 65+ Western Cape 1 124 5 523 609 Eastern Cape 577 2 586 227 Northern Cape 337 1 541 53 Free State 819 3 954 259 KwaZulu-Natal 2 393 9 524 595 North West 2 009 10 714 368 Gauteng 15 679 103 957 2 942 Mpumalanga 1 215 596 2 328 751 179 496 Limpopo 4 471 20 136 692 Outside South Africa 384 2 269 94

Statistics South Africa
Census 2011 Provincial Profile: Mpumalanga, Report 03-01-77
65
Table 6.11: Percentage distribution of the population aged 5 years and older by type of disability, status and sex, Census 2011
District municipality
Seeing No difficulty Some difficulty A lot of difficulty Cannot do at all Male Female Male Female Male Female Male Female
Gert Sibande 89,2 84,7 8,9 12,5 1,7 2,6 0,2 0,2 Nkangala 90,0 86,7 8,6 11,4 1,2 1,8 0,1 0,2 Ehlanzeni 93,9 91,6 5,1 7,1 0,8 1,2 0,1 0,1 Mpumalanga 91,4 88,3 7,3 9,8 1,2 1,7 0,1 0,2
District municipality
Hearing No difficulty Some difficulty A lot of difficulty Cannot do at all Male Female Male Female Male Female Male Female
Gert Sibande 95,9 94,8 3,3 4,2 0,7 0,9 0,1 0,1 Nkangala 96,7 96,0 2,7 3,3 0,5 0,6 0,1 0,1 Ehlanzeni 97,7 97,3 1,8 2,1 0,4 0,4 0,1 0,1 Mpumalanga 96,9 96,3 2,5 3,0 0,5 0,6 0,1 0,1
District municipality
Communication No difficulty Some difficulty A lot of difficulty Cannot do at all Male Female Male Female Male Female Male Female
Gert Sibande 98,3 98,3 1,2 1,2 0,3 0,3 0,2 0,2 Nkangala 98,7 98,7 0,9 1,0 0,2 0,2 0,1 0,1 Ehlanzeni 98,6 98,7 0,9 0,9 0,3 0,2 0,2 0,1 Mpumalanga 98,6 98,6 1,0 1,0 0,3 0,2 0,2 0,1
District municipality
Walking or climbing stairs No difficulty Some difficulty A lot of difficulty Cannot do at all Male Female Male Female Male Female Male Female
Gert Sibande 96,9 95,1 2,2 3,4 0,7 1,1 0,3 0,3 Nkangala 97,3 95,7 2,0 3,2 0,5 0,9 0,2 0,2 Ehlanzeni 97,8 96,7 1,5 2,3 0,5 0,7 0,2 0,2 Mpumalanga 97,4 96,0 1,8 2,9 0,6 0,9 0,2 0,2
District municipality
Remembering/Concentrating No difficulty Some difficulty A lot of difficulty Cannot do at all Male Female Male Female Male Female Male Female
Gert Sibande 95,9 94,3 3,0 4,3 0,8 1,2 0,3 0,3 Nkangala 96,9 95,8 2,3 3,2 0,6 0,8 0,2 0,2 Ehlanzeni 97,2 96,8 2,0 2,4 0,6 0,6 0,2 0,2 Mpumalanga 96,7 95,8 2,4 3,1 0,7 0,8 0,2 0,2
District municipality
Self-care No difficulty Some difficulty A lot of difficulty Cannot do at all Male Female Male Female Male Female Male Female
Gert Sibande 96,6 96,3 2,0 2,3 0,7 0,7 0,7 0,7 Nkangala 97,3 97,0 1,6 1,8 0,5 0,5 0,6 0,7 Ehlanzeni 96,4 96,5 2,1 2,1 0,8 0,8 0,7 0,6 Mpumalanga 96,8 96,6 1,9 2,1 0,7 0,7 0,7 0,6

Stat
istic
s Sou
th A
fric
a
Cen
sus 2
011
Prov
inci
al P
rofil
e: M
pum
alan
ga, R
epor
t 03-
01-7
7
66
Tabl
e 6.
12: P
erce
ntag
e of
per
sons
age
d 5–
24 y
ears
att
endi
ng a
n ed
ucat
iona
l ins
titut
ion
by d
istr
ict a
nd lo
cal m
unic
ipal
ity, C
ensu
s 201
1
Mun
icip
ality
20
11
5 6
7 8
9 10
11
12
13
14
15
16
17
18
19
20
21
22
23
24
G
ert S
iban
de
78,7
92
,3
96,0
96
,6
97,1
96
,7
97,1
95
,9
95,9
95
,5
93,9
91
,4
85,9
76
,6
58,7
42
,3
30,0
20
,5
14,9
12
,0
Albe
rt L
uthu
li 87
,3
95,9
96
,7
97,0
97
,7
96,6
97
,7
96,2
96
,3
96,0
94
,8
93,8
89
,1
82,0
65
,3
48,0
33
,5
22,9
17
,4
13,2
M
suka
ligw
a 73
,6
90,5
95
,8
97,3
97
,5
97,1
97
,1
95,9
96
,5
95,9
94
,2
90,7
84
,5
73,2
53
,7
36,7
26
,0
17,7
12
,8
10,7
M
khon
do
69,5
88
,1
93,5
94
,2
95,3
94
,5
95,3
94
,8
94,1
93
,4
91,6
89
,6
83,8
73
,9
58,1
45
,6
33,0
23
,6
18,1
16
,1
Pixl
ey K
a Se
me
74,8
91
,8
96,9
96
,9
97,7
98
,4
96,7
96
,8
96,9
96
,6
95,4
92
,1
88,0
78
,8
62,6
47
,5
30,9
21
,3
15,1
11
,0
Lekw
a 82
,3
94,9
97
,8
98,7
97
,8
97,9
98
,3
97,2
96
,3
96,6
94
,6
91,6
86
,4
76,5
56
,0
42,4
29
,8
19,4
13
,6
10,6
Di
pale
seng
86
,6
94,4
97
,1
97,6
98
,4
97,7
98
,8
95,9
96
,3
95,9
91
,3
88,3
79
,7
71,6
53
,1
35,5
28
,2
16,1
9,
7 5,
9 Go
van
Mbe
ki
80,2
92
,4
96,4
96
,7
96,9
96
,9
97,4
95
,6
96,2
95
,6
94,4
90
,9
85,2
75
,6
57,0
38
,3
28,0
19
,4
14,2
11
,4
Nka
ngal
a 81
,0
93,8
97
,1
97,6
97
,7
97,5
97
,3
97,0
97
,0
96,8
95
,2
92,9
89
,1
79,3
62
,3
46,1
33
,2
22,7
16
,2
12,7
Vi
ctor
Kha
nye
70,3
89
,8
95,4
96
,9
96,1
96
,6
96,1
95
,7
95,0
95
,5
92,0
88
,1
82,7
67
,3
49,7
32
,9
18,7
16
,1
11,5
9,
3 Em
alah
leni
77
,9
91,9
96
,7
97,2
97
,4
97,1
97
,1
96,4
96
,8
96,6
94
,8
91,7
86
,5
75,8
59
,9
42,3
32
,6
22,0
16
,6
13,3
St
eve
Tshw
ete
82,4
92
,6
96,6
96
,9
96,9
96
,5
96,9
96
,1
96,3
95
,5
94,2
92
,0
87,6
74
,9
52,9
38
,7
27,8
20
,3
15,8
13
,3
Emak
haze
ni
83,0
92
,0
95,8
96
,1
96,8
95
,6
94,7
96
,3
95,0
95
,0
93,8
90
,6
88,7
75
,8
61,1
39
,9
27,9
14
,2
9,7
8,9
Them
bisil
e 81
,7
95,1
97
,5
98,0
98
,4
98,1
97
,8
97,5
97
,2
97,5
96
,2
93,7
90
,8
83,8
66
,2
50,7
35
,5
23,5
14
,8
11,2
Dr
JS M
orok
a 85
,3
96,5
98
,1
98,5
98
,2
98,5
97
,9
98,2
98
,1
97,9
95
,8
95,2
92
,3
84,2
70
,6
56,2
40
,8
28,8
20
,5
14,9
Eh
lanz
eni
87,0
95
,4
97,5
97
,8
98,0
97
,7
97,9
97
,4
97,3
97
,0
95,7
93
,2
89,1
80
,2
64,3
48
,4
35,0
23
,6
16,9
12
,3
Thab
a Ch
weu
88
,7
94,9
97
,9
98,6
97
,8
97,8
97
,7
97,0
97
,8
96,6
95
,1
92,5
85
,3
74,7
51
,3
35,7
23
,9
13,0
9,
6 8,
4 M
bom
bela
84
,8
95,4
97
,9
98,1
98
,3
98,0
98
,2
97,5
97
,5
97,3
95
,8
93,4
89
,8
80,4
63
,6
45,7
32
,5
21,2
15
,1
11,0
U
mjin
di
79,8
90
,5
95,7
96
,5
98,1
96
,7
97,5
95
,1
96,1
93
,9
93,9
90
,4
83,6
76
,7
59,9
44
,8
31,9
19
,5
15,0
10
,6
Nko
maz
i 80
,5
92,4
95
,2
96,0
96
,4
95,7
96
,3
96,1
95
,7
95,4
93
,7
90,6
86
,3
78,3
64
,5
52,4
40
,0
31,6
23
,7
18,3
Bu
shbu
ckrid
ge
93,2
97
,9
98,8
98
,9
98,9
98
,8
98,9
98
,5
98,3
98
,1
97,2
95
,0
91,3
82
,3
67,0
50
,4
35,9
22
,5
15,4
10
,4
Mpu
mal
anga
83
,1
94,1
97
,0
97,4
97
,7
97,3
97
,5
96,9
96
,9
96,6
95
,1
92,6
88
,2
79,0
62
,3
46,2
33
,1
22,5
16
,2
12,3

Stat
istic
s Sou
th A
fric
a
Cen
sus 2
011
Prov
inci
al P
rofil
e: M
pum
alan
ga, R
epor
t 03-
01-7
7
67
Tabl
e 6.
13: P
erce
ntag
e of
per
sons
age
d 5–
24 y
ears
att
endi
ng a
n ed
ucat
iona
l ins
titut
ion
by d
istr
ict a
nd lo
cal m
unic
ipal
ity, C
ensu
s 200
1
Mun
icip
ality
20
01
5 6
7 8
9 10
11
12
13
14
15
16
17
18
19
20
21
22
23
24
G
ert S
iban
de
32,8
59
,6
85,5
93
,2
95,1
95
,6
95,7
95
,9
95,1
94
,3
91,1
87
,2
80,6
69
,9
57,6
45
,0
33,2
23
,0
16,1
11
,2
Albe
rt L
uthu
li 38
,4
71,9
92
,4
96,3
97
,1
97,5
97
,3
97,5
97
,0
96,7
94
,8
92,0
86
,7
78,0
68
,4
54,4
42
,2
30,3
21
,0
14,6
M
suka
ligw
a 27
,0
53,6
82
,9
90,9
93
,7
93,9
94
,5
94,3
93
,1
92,5
89
,0
83,0
77
,4
65,6
50
,5
39,5
27
,8
17,5
11
,6
7,7
Mkh
ondo
21
,6
45,3
81
,5
90,4
94
,1
94,4
95
,3
95,3
93
,9
93,1
88
,4
82,3
76
,9
62,5
52
,3
37,9
29
,8
20,3
13
,3
10,9
Pi
xley
Ka
Sem
e 26
,0
55,7
83
,6
93,3
95
,2
96,6
94
,9
95,7
95
,5
93,2
90
,0
85,8
76
,3
67,3
57
,8
47,7
38
,7
28,4
19
,0
13,3
Le
kwa
39,2
59
,2
87,9
93
,9
95,2
97
,0
95,9
96
,7
96,1
94
,3
91,0
87
,6
79,9
70
,1
55,1
41
,8
30,1
19
,0
14,2
8,
6 Di
pale
seng
41
,0
68,8
84
,7
94,2
93
,5
95,7
96
,4
95,1
95
,2
95,2
89
,6
86,0
79
,1
69,7
54
,2
43,5
33
,1
20,7
16
,9
6,8
Gova
n M
beki
38
,6
62,3
82
,3
92,7
94
,3
94,3
95
,1
95,3
94
,4
94,2
91
,2
88,8
81
,1
70,6
56
,2
44,4
30
,1
22,3
16
,4
12,4
N
kang
ala
39,1
68
,7
90,3
95
,1
96,4
96
,7
96,6
97
,1
96,9
96
,1
94,7
92
,1
87,5
78
,4
66,0
52
,4
40,7
28
,7
20,9
15
,6
Vict
or K
hany
e 23
,0
39,9
80
,0
91,6
92
,9
94,6
94
,6
94,6
94
,4
94,2
91
,0
85,0
78
,6
66,2
51
,8
39,9
27
,3
19,5
12
,2
9,9
Emal
ahle
ni
43,6
68
,2
89,0
94
,6
96,3
95
,9
96,4
96
,3
96,4
95
,4
94,1
91
,2
85,3
75
,9
61,5
48
,3
37,3
27
,6
20,7
15
,0
Stev
e Ts
hwet
e 47
,1
76,7
90
,9
95,3
94
,9
96,4
96
,2
97,3
96
,7
94,7
92
,9
91,4
86
,5
77,4
62
,1
44,7
34
,8
24,1
16
,5
11,6
Em
akha
zeni
38
,9
63,5
84
,3
91,8
94
,5
96,5
95
,4
94,9
96
,2
92,7
91
,9
87,6
83
,2
73,1
58
,0
42,5
31
,1
21,1
12
,4
10,4
Th
embi
sile
32,1
66
,1
91,0
95
,9
97,4
97
,3
97,1
98
,0
97,2
97
,0
96,1
93
,8
89,2
80
,8
69,9
57
,7
44,8
31
,8
23,4
18
,2
Dr JS
Mor
oka
41,8
74
,6
92,9
95
,7
97,0
97
,1
96,8
97
,3
97,6
97
,1
95,6
93
,0
90,0
81
,7
72,1
59
,0
47,4
33
,1
25,3
18
,8
Ehla
nzen
i 41
,7
70,0
88
,4
94,1
95
,7
95,9
95
,7
96,3
95
,8
94,8
92
,2
87,9
82
,4
73,0
61
,5
49,6
38
,5
26,6
19
,9
13,6
Th
aba
Chw
eu
51,5
71
,5
89,8
93
,7
95,5
94
,0
95,3
95
,2
95,7
94
,0
92,9
87
,2
80,2
70
,6
48,4
34
,6
25,3
15
,3
10,7
5,
9 M
bom
bela
42
,5
68,6
90
,0
95,0
96
,3
96,4
96
,5
97,1
96
,5
95,9
93
,3
90,0
85
,4
75,5
63
,2
51,7
39
,1
27,3
20
,1
12,7
U
mjin
di
38,5
57
,0
82,4
90
,7
94,3
94
,7
94,5
93
,1
95,6
91
,1
88,8
83
,8
78,5
65
,6
45,9
28
,7
22,5
13
,9
10,3
7,
9 N
kom
azi
29,2
56
,1
82,6
92
,0
94,5
94
,6
94,8
95
,2
94,9
94
,3
91,1
85
,7
78,9
70
,1
59,9
49
,3
39,5
28
,0
20,9
16
,6
Bush
buck
ridge
48
,5
80,9
91
,3
94,9
96
,1
96,5
95
,8
96,7
95
,8
94,6
92
,2
87,9
82
,7
73,6
63
,9
51,9
41
,0
28,5
21
,9
14,7
M
pum
alan
ga
38,6
66
,9
88,1
94
,1
95,7
96
,0
96,0
96
,4
95,9
95
,1
92,6
88
,9
83,4
73
,8
61,9
49
,3
37,9
26
,3
19,3
13
,6

Statistics South Africa
Census 2011 Provincial Profile: Mpumalanga, Report 03-01-77
68
Table 6.14: Number of persons aged 5–24 years attending school by district and local municipality, Census 2001 and Census 2011
Municipality
2001 2011 Attending Not attending Attending Not attending
N % N % N % N % Nkangala 334 236 74,6 113 970 25,4 350 775 73,5 126 521 26,5 Albert Luthuli 75 581 78,8 20 346 21,2 66 700 78,5 18 262 21,5 Msukaligwa 37 083 67,6 17 752 32,4 41 144 71,0 16 794 29,0 Mkhondo 46 691 68,6 21 361 31,4 55 920 74,5 19 124 25,5 Pixley Ka Seme 27 553 72,0 10 704 28,0 27 067 77,0 8 070 23,0 Lekwa 30 537 70,5 12 772 29,5 30 667 73,1 11 310 26,9 Dipaleseng 11 735 70,4 4 928 29,6 10 680 70,7 4 432 29,3 Govan Mbeki 57 762 67,8 27 446 32,2 70 993 69,6 30 976 30,4 Gert Sibande 286 943 71,3 115 309 28,7 303 170 73,6 108 968 26,4 Victor Khanye 14 922 65,3 7 933 34,7 18 037 68,0 8 469 32,0 Emalahleni 74 561 71,0 30 482 29,0 90 943 68,9 41 003 31,1 Steve Tshwete 40 989 72,2 15 769 27,8 51 610 69,5 22 619 30,5 Emakhazeni 12 530 69,7 5 441 30,3 11 726 70,9 4 818 29,1 Thembisile 96 126 76,5 29 471 23,5 96 922 76,9 29 136 23,1 Dr JS Moroka 95 109 79,3 24 874 20,7 81 536 79,9 20 476 20,1 Ehlanzeni 518 716 74,0 182 250 26,0 541 591 76,3 167 833 23,7 Thaba Chweu 20 892 67,6 10 003 32,4 21 637 69,3 9 578 30,7 Mbombela 160 047 73,9 56 571 26,1 167 409 73,7 59 894 26,3 Umjindi 12 557 61,5 7 870 38,5 17 453 72,0 6 791 28,0 Nkomazi 120 889 71,6 47 955 28,4 135 051 76,9 40 582 23,1 Bushbuckridge 204 330 77,3 59 852 22,7 200 041 79,7 50 988 20,3 Mpumalanga 1 139 895 73,5 411 529 26,5 1 195 535 74,8 403 321 25,2

Statistics South Africa
Census 2011 Provincial Profile: Mpumalanga, Report 03-01-77
69
Table 6.15: Percentage of persons aged 5–24 years attending public or private educational institutions by district and local municipality, Census 2001 and Census 2011
Municipality
2001 2011 Public Private Public Private
N % N % N % N % Gert Sibande 277 628 96,8 9 315 3,2 271 229 95,4 12 954 4,6 Albert Luthuli 74 226 98,2 1 355 1,8 63 013 98,5 934 1,5 Msukaligwa 35 934 96,9 1 149 3,1 36 498 94,1 2 277 5,9 Mkhondo 45 527 97,5 1 164 2,5 51 921 98,0 1 058 2,0 Pixley Ka Seme 26 564 96,4 989 3,6 25 332 98,1 497 1,9 Lekwa 29 772 97,5 766 2,5 27 390 95,7 1 232 4,3 Dipaleseng 11 516 98,1 219 1,9 9 652 96,8 322 3,2 Govan Mbeki 54 089 93,6 3 673 6,4 57 423 89,6 6 633 10,4 Nkangala 319 841 95,7 14 395 4,3 303 256 92,1 25 985 7,9 Victor Khanye 14 414 96,6 508 3,4 15 940 95,6 726 4,4 Emalahleni 68 330 91,6 6 231 8,4 71 759 85,9 11 801 14,1 Steve Tshwete 38 438 93,8 2 551 6,2 41 562 88,4 5 459 11,6 Emakhazeni 12 205 97,4 325 2,6 10 288 94,6 589 5,4 Thembisile 93 435 97,2 2 691 2,8 88 619 95,3 4 323 4,7 Dr JS Moroka 93 020 97,8 2 089 2,2 75 088 96,0 3 088 4,0 Ehlanzeni 498 986 96,2 19 729 3,8 486 953 94,8 26 942 5,2 Thaba Chweu 20 042 95,9 850 4,1 18 359 93,5 1 266 6,5 Mbombela 150 956 94,3 9 092 5,7 142 933 90,8 14 450 9,2 Umjindi 12 003 95,6 554 4,4 15 367 94,3 929 5,7 Nkomazi 116 317 96,2 4 572 3,8 122 524 96,5 4 392 3,5 Bushbuckridge 199 669 97,7 4 662 2,3 187 769 97,0 5 905 3,0 Mpumalanga 1 096 456 96,2 43 439 3,8 1 061 438 94,2 65 881 5,8

Stat
istic
s Sou
th A
fric
a
Cen
sus 2
011
Prov
inci
al P
rofil
e: M
pum
alan
ga, R
epor
t 03-
01-7
7
70
Tabl
e 6.
16: H
ighe
st e
duca
tiona
l att
ainm
ent a
mon
gst p
erso
ns a
ged
20 y
ears
and
old
er b
y m
unic
ipal
ity, c
ensu
ses o
f 199
6, 2
001
and
2011
(num
bers
)
Mun
icip
ality
No
scho
olin
g So
me
prim
ary
Com
plet
ed p
rimar
y So
me
seco
ndar
y Gr
ade
12/S
td 1
0 Hi
gher
1996
20
01
2011
19
96
2001
20
11
1996
20
01
2011
19
96
2001
20
11
1996
20
01
2011
19
96
2001
20
11
Ger
t Sib
ande
12
1 18
0 12
5 34
1 79
538
68
132
88
570
77
736
28
115
29
585
26
317
11
8 97
3 12
8 54
2 18
6 73
0 55
137
78
106
16
6 47
4 21
304
25
952
16
6 47
4
Albe
rt L
uthu
li 31
986
31
389
18
622
11
789
13
818
12
600
5
065
4 40
9 4
146
19 6
82
19 4
13
26 4
72
8 11
3 12
079
25
217
2
715
3 90
9 25
217
Msu
kalig
wa
14 3
95
17 7
56
10 6
32
8 46
1 11
381
10
140
3
819
4 02
1 3
859
18 0
28
19 0
79
27 7
87
9 19
5 11
160
25
335
3
357
3 73
3 25
335
Mkh
ondo
18
000
22
805
15
914
9
214
14 9
35
14 5
77
3 36
0 4
304
4 54
4 12
272
15
260
25
406
5
594
8 67
4 22
453
1
759
2 41
1 22
453
Pixl
ey K
a Se
me
13 2
11
13 9
54
8 59
1 5
666
7 66
4 6
604
1 59
6 2
223
2 01
1 8
110
8 85
1 12
782
3
945
4 93
7 10
955
1
494
1 91
6 10
955
Lekw
a 13
046
11
175
7
836
9 13
8 13
365
10
230
3
362
4 22
5 3
241
14 5
46
16 9
42
23 1
48
6 43
9 9
606
17 5
70
2 77
5 3
121
17 5
70
Dipa
lese
ng
6 04
1 5
881
3 13
8 4
147
4 89
4 4
446
1 49
0 1
374
1 31
3 5
956
5 86
6 9
267
2 54
5 2
822
6 28
6 78
4 72
2 6
286
Gova
n M
beki
24
502
22
382
14
806
19
717
22
515
19
139
9
424
9 02
9 7
204
40 3
80
43 1
32
61 8
70
19 3
07
28 8
29
58 6
59
8 42
0 10
139
58
659
Nka
ngal
a 12
3 35
7 13
7 94
9 92
112
70
660
80
976
91
215
34
506
33
018
33
270
15
8 07
4 16
2 68
8 25
7 89
7 79
037
11
1 67
7 23
5 50
1 31
030
34
333
23
5 50
1
Vict
or K
hany
e 8
415
8 40
3 5
529
5 09
6 6
896
6 16
4 2
081
2 28
5 2
234
8 51
6 8
808
16 3
20
4 21
6 4
535
12 4
83
1 55
5 1
554
12 4
83
Emal
ahle
ni
19 3
18
24 8
74
14 9
93
17 6
77
23 0
83
23 1
82
9 79
6 11
011
10
289
52
339
57
868
88
321
24
744
41
328
81
088
13
125
13
415
81
088
Stev
e Ts
hwet
e 13
124
15
281
11
117
9
312
10 8
19
13 1
15
4 95
2 5
077
5 00
1 25
713
26
156
44
192
15
428
20
942
52
291
8
466
7 47
4 52
291
Emak
haze
ni
5 93
4 6
553
4 33
5 3
184
4 02
4 3
228
1 54
5 1
748
1 42
3 5
466
6 92
6 9
362
2 21
4 4
058
8 30
3 78
3 1
388
8 30
3
Them
bisil
e 39
001
43
317
31
711
17
800
19
225
24
447
8
078
7 00
5 7
744
31 7
73
33 0
59
56 7
76
13 9
45
20 6
37
46 1
58
3 12
7 4
441
46 1
58
Dr JS
Mor
oka
37 5
66
39 5
21
24 4
27
17 5
91
16 9
30
21 0
78
8 05
4 5
892
6 57
9 34
268
29
870
42
925
18
491
20
177
35
178
3
975
6 06
0 35
178
Ehla
nzen
i 21
9 68
0 23
6 41
5 15
3 89
0 84
999
10
8 49
4 10
2 77
5 37
597
38
993
37
182
15
4 18
9 16
7 19
6 26
9 28
7 94
349
12
0 26
2 26
8 36
9 31
677
44
366
26
8 36
9
Thab
a Ch
weu
8
554
10 5
01
6 11
0 6
464
9 37
8 7
625
2 94
2 3
525
2 84
3 11
367
14
902
20
801
5
552
9 36
9 18
981
2
775
3 07
0 18
981
Mbo
mbe
la
58 1
60
63 2
56
41 1
69
30 3
92
39 2
97
33 7
19
14 2
34
15 0
20
12 3
03
55 8
64
62 8
16
97 9
23
35 3
18
55 0
14
115
538
14 5
42
19 4
26
115
538
Um
jindi
6
779
6 85
7 3
910
4 79
1 5
636
4 85
7 2
321
2 39
6 1
759
8 64
4 9
504
12 3
55
4 87
8 7
550
12 2
52
1 78
0 1
852
12 2
52
Nko
maz
i 54
247
68
564
51
965
17
453
22
876
23
944
6
740
7 54
0 9
367
22 9
19
28 4
77
51 2
41
11 4
97
20 9
67
51 7
74
3 41
4 6
471
51 7
74
Bush
buck
ridge
91
941
87
236
50
737
25
899
31
307
32
629
11
360
10
512
10
911
55
395
51
497
86
967
37
104
27
362
69
824
9
166
13 5
46
69 8
24
Mpu
mal
anga
46
4 21
7 49
9 70
5 32
5 54
0 22
3 79
1 27
8 04
1 27
1 72
6 10
0 21
8 10
1 59
6 96
770
43
1 23
6 45
8 42
6 71
3 91
4 22
8 52
3 31
0 04
5 67
0 34
3 84
010
10
4 65
1 67
0 34
3

Stat
istic
s Sou
th A
fric
a
Cen
sus 2
011
Prov
inci
al P
rofil
e: M
pum
alan
ga, R
epor
t 03-
01-7
7
71
Tabl
e 6.
17: H
ighe
st e
duca
tiona
l att
ainm
ent
amon
gst
pers
ons
aged
20
year
s an
d ol
der
by m
unic
ipal
ity, c
ensu
ses
of 1
996,
200
1 an
d 20
11
(per
cent
ages
)
Mun
icip
ality
N
o sc
hool
ing
Som
e pr
imar
y Co
mpl
eted
prim
ary
Som
e se
cond
ary
Grad
e 12
/Std
10
High
er
1996
20
01
2011
19
96
2001
20
11
1996
20
01
2011
19
96
2001
20
11
1996
20
01
2011
19
96
2001
20
11
Gert
Sib
ande
29
,4
26,3
13
,4
16,5
18
,6
13,1
6,
8 6,
2 4,
4 28
,8
27,0
31
,4
13,4
16
,4
28,0
5,
2 5,
5 9,
7 Al
bert
Lut
huli
40,3
36
,9
19,9
14
,9
16,3
13
,5
6,4
5,2
4,4
24,8
22
,8
28,4
10
,2
14,2
27
,0
3,4
4,6
6,7
Msu
kalig
wa
25,1
26
,5
12,3
14
,8
17,0
11
,7
6,7
6,0
4,5
31,5
28
,4
32,1
16
,1
16,6
29
,3
5,9
5,6
10,2
M
khon
do
35,9
33
,3
18,1
18
,4
21,8
16
,6
6,7
6,3
5,2
24,4
22
,3
28,9
11
,1
12,7
25
,6
3,5
3,5
5,6
Pixl
ey K
a Se
me
38,8
35
,3
19,4
16
,7
19,4
14
,9
4,7
5,6
4,5
23,8
22
,4
28,8
11
,6
12,5
24
,7
4,4
4,8
7,7
Lekw
a 26
,5
19,1
11
,2
18,5
22
,9
14,6
6,
8 7,
2 4,
6 29
,5
29,0
33
,1
13,1
16
,4
25,1
5,
6 5,
3 11
,3
Dipa
lese
ng
28,8
27
,3
12,0
19
,8
22,7
17
,1
7,1
6,4
5,0
28,4
27
,2
35,6
12
,1
13,1
24
,1
3,7
3,3
6,2
Gova
n M
beki
20
,1
16,5
7,
9 16
,2
16,6
10
,3
7,7
6,6
3,9
33,2
31
,7
33,2
15
,9
21,2
31
,4
6,9
7,5
13,4
N
kang
ala
24,8
24
,6
11,5
14
,2
14,4
11
,4
6,9
5,9
4,2
31,8
29
,0
32,3
15
,9
19,9
29
,5
6,2
6,1
11,0
Vi
ctor
Kha
nye
28,2
25
,9
11,9
17
,1
21,2
13
,2
7,0
7,0
4,8
28,5
27
,1
35,0
14
,1
14,0
26
,8
5,2
4,8
8,3
Emal
ahle
ni
14,1
14
,5
5,8
12,9
13
,5
9,0
7,2
6,4
4,0
38,2
33
,7
34,3
18
,1
24,1
31
,5
9,6
7,8
15,3
St
eve
Tshw
ete
17,0
17
,8
7,5
12,1
12
,6
8,8
6,4
5,9
3,4
33,4
30
,5
29,7
20
,0
24,4
35
,1
11,0
8,
7 15
,6
Emak
haze
ni
31,0
26
,5
15,0
16
,6
16,3
11
,2
8,1
7,1
4,9
28,6
28
,0
32,4
11
,6
16,4
28
,7
4,1
5,6
7,8
Them
bisil
e 34
,3
33,9
18
,0
15,7
15
,1
13,9
7,
1 5,
5 4,
4 27
,9
25,9
32
,2
12,3
16
,2
26,2
2,
7 3,
5 5,
4 Dr
JS M
orok
a 31
,3
33,4
17
,5
14,7
14
,3
15,1
6,
7 5,
0 4,
7 28
,6
25,2
30
,7
15,4
17
,0
25,2
3,
3 5,
1 6,
9 Eh
lanz
eni
35,3
33
,0
16,7
13
,7
15,2
11
,1
6,0
5,4
4,0
24,8
23
,4
29,2
15
,2
16,8
29
,1
5,1
6,2
9,9
Thab
a Ch
weu
22
,7
20,7
9,
7 17
,2
18,5
12
,2
7,8
6,9
4,5
30,2
29
,4
33,2
14
,7
18,5
30
,3
7,4
6,1
10,1
M
bom
bela
27
,9
24,8
11
,9
14,6
15
,4
9,7
6,8
5,9
3,6
26,8
24
,7
28,3
16
,9
21,6
33
,4
7,0
7,6
13,2
U
mjin
di
23,2
20
,3
10,0
16
,4
16,7
12
,4
7,9
7,1
4,5
29,6
28
,1
31,6
16
,7
22,3
31
,4
6,1
5,5
10,0
N
kom
azi
46,7
44
,3
25,7
15
,0
14,8
11
,8
5,8
4,9
4,6
19,7
18
,4
25,3
9,
9 13
,5
25,6
2,
9 4,
2 7,
0 Bu
shbu
ckrid
ge
39,8
39
,4
18,7
11
,2
14,1
12
,0
4,9
4,7
4,0
24,0
23
,3
32,0
16
,1
12,4
25
,7
4,0
6,1
7,7
Mpu
mal
anga
30
,3
28,5
14
,1
14,6
15
,9
11,7
6,
5 5,
8 4,
2 28
,1
26,2
30
,8
14,9
17
,7
29,0
5,
5 6,
0 10
,2

Stat
istic
s Sou
th A
fric
a
Cen
sus 2
011
Prov
inci
al P
rofil
e: M
pum
alan
ga, R
epor
t 03-
01-7
7
72
Tabl
e 6.
18: H
ighe
st e
duca
tiona
l att
ainm
ent a
mon
gst p
erso
ns a
ged
20 y
ears
and
old
er b
y se
x an
d di
stric
t, 20
11
Leve
l Ge
rt S
iban
de
Nka
ngal
a Eh
lanz
eni
Mpu
mal
anga
M
ale
Fem
ale
Tota
l M
ale
Fem
ale
Tota
l M
ale
Fem
ale
Tota
l M
ale
Fem
ale
Tota
l Pe
rson
s N
o sc
hool
ing
32 5
77
46 9
61
79 5
38
36 9
78
55 1
34
92 1
12
57 0
01
96 8
89
153
890
126
556
198
984
325
540
Som
e pr
imar
y 35
219
42
516
77
736
46
229
44
987
91
215
47
515
55
261
10
2 77
5 12
8 96
3 14
2 76
4 27
1 72
6 Co
mpl
eted
prim
ary
12 1
71
14 1
47
26 3
17
17 2
61
16 0
09
33 2
70
17 4
71
19 7
11
37 1
82
46 9
03
49 8
67
96 7
70
Som
e se
cond
ary
92 1
86
94 5
44
186
730
132
732
125
165
257
897
130
007
139
280
269
287
354
926
358
988
713
914
Grad
e 12
/Std
10
85 0
75
81 3
99
166
474
117
163
118
337
235
501
124
220
144
148
268
369
326
459
343
885
670
343
High
er
29 9
82
27 8
78
57 8
59
46 8
99
40 9
52
87 8
51
41 2
29
49 6
30
90 8
59
118
110
118
460
236
569
%
No
scho
olin
g 11
,3
15,3
13
,4
9,3
13,8
11
,5
13,7
19
,2
16,7
11
,5
16,4
14
,1
Som
e pr
imar
y 12
,3
13,8
13
,1
11,6
11
,2
11,4
11
,4
10,9
11
,1
11,7
11
,8
11,7
Co
mpl
eted
prim
ary
4,2
4,6
4,4
4,3
4,0
4,2
4,2
3,9
4,0
4,3
4,1
4,2
Som
e se
cond
ary
32,1
30
,8
31,4
33
,4
31,2
32
,3
31,1
27
,6
29,2
32
,2
29,6
30
,8
Grad
e 12
/Std
10
29,6
26
,5
28,0
29
,5
29,5
29
,5
29,8
28
,5
29,1
29
,6
28,4
29
,0
High
er
10,4
9,
1 9,
7 11
,8
10,2
11
,0
9,9
9,8
9,9
10,7
9,
8 10
,2

Stat
istic
s Sou
th A
fric
a
Cen
sus 2
011
Prov
inci
al P
rofil
e: M
pum
alan
ga, R
epor
t 03-
01-7
7
73
Tabl
e 6.
19: H
ighe
st e
duca
tiona
l att
ainm
ent a
mon
gst p
erso
ns a
ged
20 y
ears
and
old
er b
y se
x an
d di
stric
t, 20
01
Leve
l Ge
rt S
iban
de
Nka
ngal
a Eh
lanz
eni
Mpu
mal
anga
M
ale
Fem
ale
Tota
l M
ale
Fem
ale
Tota
l M
ale
Fem
ale
Tota
l M
ale
Fem
ale
Tota
l Pe
rson
s N
o sc
hool
ing
52 5
20
72 8
21
125
341
56 8
78
81 0
71
137
949
90 6
70
145
746
236
415
200
068
299
637
499
705
Som
e pr
imar
y 42
026
46
545
88
570
40
374
40
602
80
976
52
246
56
248
10
8 49
4 13
4 64
6 14
3 39
5 27
8 04
1 Co
mpl
eted
prim
ary
14 1
74
15 4
12
29 5
85
16 1
96
16 8
22
33 0
18
18 8
85
20 1
08
38 9
93
49 2
55
52 3
41
101
596
Som
e se
cond
ary
61 9
68
66 5
74
128
542
78 8
25
83 8
64
162
688
79 3
98
87 7
98
167
196
220
190
238
236
458
426
Grad
e 12
/Std
10
39 5
34
38 5
73
78 1
06
54 4
23
5 75
5 11
1 67
7 56
313
63
949
12
0 26
2 15
0 26
9 15
9 77
6 31
0 04
5 Hi
gher
13
011
12
940
25
952
17
111
17
223
34
333
19
778
24
588
44
366
49
900
54
750
10
4 65
1 %
N
o sc
hool
ing
23,5
28
,8
26,3
21
,6
27,3
24
,6
28,6
36
,6
33,0
24
,9
31,6
28
,5
Som
e pr
imar
y 18
,8
18,4
18
,6
15,3
13
,7
14,4
16
,5
14,1
15
,2
16,7
15
,1
15,9
Co
mpl
eted
prim
ary
6,3
6,1
6,2
6,1
5,7
5,9
6,0
5,0
5,4
6,1
5,5
5,8
Som
e se
cond
ary
27,8
26
,3
27,0
29
,9
28,3
29
,0
25,0
22
,0
23,4
27
,4
25,1
26
,2
Grad
e 12
/Std
10
17,7
15
,3
16,4
20
,6
19,3
19
,9
17,7
16
,1
16,8
18
,7
16,9
17
,7
High
er
5,8
5,1
5,5
6,5
5,8
6,1
6,2
6,2
6,2
6,2
5,8
6,0

Stat
istic
s Sou
th A
fric
a
Cen
sus 2
011
Prov
inci
al P
rofil
e: M
pum
alan
ga, R
epor
t 03-
01-7
7
74
Tabl
e 6.
20: H
ighe
st e
duca
tiona
l att
ainm
ent a
mon
gst p
erso
ns a
ged
20 y
ears
and
old
er b
y po
pula
tion
grou
p an
d di
stric
t, 20
11
Le
vel
No
scho
olin
g So
me
prim
ary
Com
plet
ed
prim
ary
Som
e
seco
ndar
y Gr
ade
12/
Std
10
High
er
No
scho
olin
g So
me
pr
imar
y Co
mpl
eted
pr
imar
y So
me
se
cond
ary
Grad
e 12
/St
d 10
Hi
gher
Dist
rict
Popu
latio
n
grou
p Pe
rson
s %
Gert
Sib
ande
Blac
k Af
rican
78
050
75
601
25
217
16
6 17
4 13
2 05
5 34
002
15
,3
14,8
4,
9 32
,5
25,8
6,
7 Co
lour
ed
302
435
183
2 08
4 2
154
1 12
7 4,
8 6,
9 2,
9 33
,2
34,3
17
,9
Indi
an o
r As
ian
244
466
193
1 90
2 3
117
1 62
4 3,
2 6,
2 2,
6 25
,2
41,3
21
,5
Whi
te
691
1 01
3 59
1 15
866
28
346
20
841
1,
0 1,
5 0,
9 23
,6
42,1
30
,9
Nka
ngal
a
Blac
k
Afric
an
90 1
82
88 3
47
31 6
30
228
818
189
784
57 7
42
13,1
12
,9
4,6
33,3
27
,6
8,4
Colo
ured
41
7 71
4 31
5 3
176
3 05
8 1
168
4,7
8,1
3,6
35,9
34
,6
13,2
In
dian
or
Asia
n 23
8 43
6 25
0 1
685
2 53
8 1
381
3,6
6,7
3,8
25,8
38
,9
21,2
W
hite
90
0 1
317
870
23 3
35
39 2
96
27 2
85
1,0
1,4
0,9
25,1
42
,3
29,3
Ehla
nzen
i
Blac
k
Afric
an
152
401
101
173
36 4
11
256
023
240
201
67 4
97
17,9
11
,9
4,3
30,0
28
,1
7,9
Colo
ured
30
3 38
3 16
8 1
798
2 26
7 1
037
5,1
6,4
2,8
30,2
38
,1
17,4
In
dian
or
Asia
n 33
8 28
2 12
7 1
110
1 94
7 1
039
7,0
5,8
2,6
22,9
40
,2
21,5
W
hite
47
1 73
5 38
6 9
831
23 4
82
21 0
43
0,8
1,3
0,7
17,6
42
,0
37,6
Mpu
mal
anga
Blac
k
Afric
an
320
633
265
121
93 2
59
651
015
562
040
159
241
15,6
12
,9
4,5
31,7
27
,4
7,8
Colo
ured
1
022
1 53
2 66
6 7
058
7 47
8 3
331
4,8
7,3
3,2
33,5
35
,5
15,8
In
dian
or
Asia
n 81
9 1
185
569
4 69
6 7
602
4 04
4 4,
3 6,
3 3,
0 24
,8
40,2
21
,4
Whi
te
2 06
3 3
065
1 84
8 49
033
91
125
69
169
1,
0 1,
4 0,
9 22
,7
42,1
32
,0

Stat
istic
s Sou
th A
fric
a
Cen
sus 2
011
Prov
inci
al P
rofil
e: M
pum
alan
ga, R
epor
t 03-
01-7
7
75
Tabl
e 6.
21: H
ighe
st e
duca
tiona
l att
ainm
ent a
mon
gst p
erso
ns a
ged
20 y
ears
and
old
er b
y po
pula
tion
grou
p an
d di
stric
t, 20
01
Le
vel
No
scho
olin
g So
me
pr
imar
y Co
mpl
ete
prim
ary
Som
e
seco
ndar
y Gr
ade
12/
Std
10
High
er
No
sc
hool
ing
Som
e
prim
ary
Com
plet
e pr
imar
y So
me
se
cond
ary
Grad
e 12
/St
d 10
Hi
gher
Dist
rict
Popu
latio
n
grou
p Pe
rson
s %
Gert
Sib
ande
Blac
k
Afric
an
123
963
87 1
90
28 7
85
110
824
56 1
60
13 8
52
29,5
20
,7
6,8
26,3
13
,3
3,3
Colo
ured
38
3 38
3 18
9 1
292
933
274
11,1
11
,1
5,5
37,4
27
,0
7,9
Indi
an o
r As
ian
121
213
117
1 11
2 1
345
628
3,4
6,0
3,3
31,4
38
,1
17,8
W
hite
87
4 78
4 49
5 15
314
19
669
11
197
1,
8 1,
6 1,
0 31
,7
40,7
23
,2
Nka
ngal
a
Blac
k
Afric
an
135
917
79 5
17
32 2
14
143
086
87 7
71
22 3
69
27,1
15
,9
6,4
28,6
17
,5
4,5
Colo
ured
69
4 52
9 27
1 1
987
1 25
4 25
9 13
,9
10,6
5,
4 39
,8
25,1
5,
2 In
dian
or
Asia
n 94
10
3 66
50
3 58
5 37
4 5,
5 5,
9 3,
8 29
,2
33,9
21
,7
Whi
te
1 24
4 82
8 46
7 17
112
22
066
11
332
2,
3 1,
6 0,
9 32
,3
41,6
21
,4
Ehla
nzen
i
Blac
k
Afric
an
234
965
107
673
38 4
78
158
277
104
725
33 3
96
34,7
15
,9
5,7
23,4
15
,5
4,9
Colo
ured
49
5 42
9 25
1 1
449
1 17
6 40
7 11
,8
10,2
6,
0 34
,4
28,0
9,
7 In
dian
or
Asia
n 13
2 91
62
50
3 57
2 34
0 7,
8 5,
3 3,
7 29
,6
33,6
20
,0
Whi
te
824
302
201
6 96
8 13
790
10
223
2,
6 0,
9 0,
6 21
,6
42,7
31
,6
Mpu
mal
anga
Blac
k
Afric
an
494
845
274
380
99 4
77
412
187
248
655
69 6
17
30,9
17
,2
6,2
25,8
15
,5
4,4
Colo
ured
1
572
1 34
1 71
0 4
727
3 36
3 93
9 12
,4
10,6
5,
6 37
,4
26,6
7,
4 In
dian
or
Asia
n 34
7 40
6 24
5 2
118
2 50
2 1
342
5,0
5,8
3,5
30,4
36
,0
19,3
W
hite
2
942
1 91
3 1
163
39 3
94
55 5
25
32 7
52
2,2
1,4
0,9
29,5
41
,5
24,5

Stat
istic
s Sou
th A
fric
a
Cen
sus 2
011
Prov
inci
al P
rofil
e: M
pum
alan
ga, R
epor
t 03-
01-7
7
76
Tabl
e 6.
22: E
cono
mic
ally
act
ive
and
inac
tive
popu
latio
n by
sex
and
dist
rict a
nd lo
cal m
unic
ipal
ity, 2
001
and
2011
(num
bers
)
Mun
icip
ality
2001
20
11
Econ
omic
ally
act
ive
Not
eco
nom
ical
ly a
ctiv
e Ec
onom
ical
ly a
ctiv
e N
ot e
cono
mic
ally
act
ive
Mal
e Fe
mal
e To
tal
Mal
e Fe
mal
e To
tal
Mal
e Fe
mal
e To
tal
Mal
e Fe
mal
e To
tal
Gert
Sib
ande
17
1 12
4 14
2 56
1 31
3 68
6 91
488
14
3 71
1 23
5 20
0 20
5 66
9 16
3 11
8 36
8 78
7 12
5 19
7 17
2 70
9 29
7 90
6 Al
bert
Lut
huli
21 7
55
21 2
08
42 9
63
23 3
69
36 9
06
60 2
75
22 8
36
22 2
79
45 1
15
26 4
92
36 7
35
63 2
27
Msu
kalig
wa
24 8
63
20 5
82
45 4
45
11 7
57
19 4
52
31 2
09
31 8
09
25 1
56
56 9
65
17 0
29
23 9
07
40 9
35
Mkh
ondo
22
972
21
777
44
749
14
783
21
848
36
631
25
067
22
566
47
633
23
199
30
947
54
146
Pi
xley
Ka
Sem
e 12
162
11
627
23
789
8
834
13 1
88
22 0
22
11 7
62
10 1
23
21 8
84
11 3
88
16 1
79
27 5
67
Lekw
a 22
770
19
108
41
878
9
726
14 5
13
24 2
39
25 6
57
20 3
56
46 0
13
13 0
12
17 7
60
30 7
71
Dipa
lese
ng
7 77
5 6
217
13 9
92
3 72
0 6
359
10 0
79
9 83
7 6
953
16 7
90
4 62
2 6
550
11 1
72
Gova
n M
beki
58
828
42
042
10
0 87
0 19
301
31
446
50
746
78
702
55
685
13
4 38
6 29
456
40
632
70
088
N
kang
ala
195
126
159
299
354
425
111
499
171
445
282
944
286
125
221
603
507
728
157
590
204
605
362
195
Vict
or K
hany
e 12
969
10
106
23
075
4
876
8 25
6 13
132
18
155
12
260
30
415
8
361
11 8
28
20 1
89
Emal
ahle
ni
73 9
29
50 4
42
124
371
25 2
04
41 3
10
66 5
14
113
935
76 7
28
190
663
38 7
64
52 3
42
91 1
06
Stev
e Ts
hwet
e 35
959
28
517
64
477
11
952
19
668
31
619
63
387
43
682
10
7 06
9 23
017
32
327
55
344
Em
akha
zeni
9
601
7 13
6 16
737
4
037
6 72
1 10
758
10
579
7
875
18 4
54
5 53
0 7
287
12 8
17
Them
bisil
e 34
948
33
759
68
707
32
679
48
899
81
578
48
972
48
772
97
744
43
373
54
293
97
665
Dr
JS M
orok
a 27
719
29
339
57
058
32
751
46
593
79
344
31
098
32
286
63
383
38
545
46
529
85
074
Eh
lanz
eni
225
422
208
207
433
629
161
622
245
553
407
176
276
091
265
291
541
382
218
072
293
478
511
549
Thab
a Ch
weu
21
138
16
236
37
374
6
695
11 1
32
17 8
27
26 1
34
19 1
06
45 2
40
9 82
8 13
712
23
540
M
bom
bela
90
731
83
617
17
4 34
8 48
714
71
721
12
0 43
5 11
7 96
2 11
0 27
5 22
8 23
7 69
389
90
694
16
0 08
3 U
mjin
di
13 7
71
10 5
30
24 3
01
6 57
7 6
413
12 9
90
15 8
89
12 6
86
28 5
75
8 70
5 8
650
17 3
55
Nko
maz
i 50
677
43
400
94
077
35
187
56
573
91
759
57
700
52
769
11
0 46
8 53
197
74
011
12
7 20
8 Bu
shbu
ckrid
ge
49 1
06
54 4
23
103
529
64 4
50
99 7
15
164
165
58 4
07
70 4
55
128
862
76 9
53
106
410
183
363
Mpu
mal
anga
59
1 67
3 51
0 06
7 1
101
739
364
610
560
710
925
320
767
885
650
012
1 41
7 89
7 50
0 85
8 67
0 79
1 1
171
650

Stat
istic
s Sou
th A
fric
a
Cen
sus 2
011
Prov
inci
al P
rofil
e: M
pum
alan
ga, R
epor
t 03-
01-7
7
77
Tabl
e 6.
23: E
cono
mic
ally
act
ive
and
inac
tive
popu
latio
n by
sex
and
dist
rict a
nd lo
cal m
unic
ipal
ity, 2
001
and
2011
(per
cent
ages
)
Mun
icip
ality
2001
20
11
Econ
omic
ally
act
ive
Not
eco
nom
ical
ly a
ctiv
e Ec
onom
ical
ly a
ctiv
e N
ot e
cono
mic
ally
act
ive
Mal
e Fe
mal
e To
tal
Mal
e Fe
mal
e To
tal
Mal
e Fe
mal
e To
tal
Mal
e Fe
mal
e To
tal
Ger
t Sib
ande
65
,2
49,8
57
,1
34,8
50
,2
42,9
62
,2
48,6
55
,3
37,8
51
,4
44,7
Al
bert
Lut
huli
48,2
36
,5
41,6
51
,8
63,5
58
,4
46,3
37
,8
41,6
53
,7
62,2
58
,4
Msu
kalig
wa
67,9
51
,4
59,3
32
,1
48,6
40
,7
65,1
51
,3
58,2
34
,9
48,7
41
,8
Mkh
ondo
60
,8
49,9
55
,0
39,2
50
,1
45,0
51
,9
42,2
46
,8
48,1
57
,8
53,2
Pi
xley
Ka
Sem
e 57
,9
46,9
51
,9
42,1
53
,1
48,1
50
,8
38,5
44
,3
49,2
61
,5
55,7
Le
kwa
70,1
56
,8
63,3
29
,9
43,2
36
,7
66,4
53
,4
59,9
33
,6
46,6
40
,1
Dipa
lese
ng
67,6
49
,4
58,1
32
,4
50,6
41
,9
68,0
51
,5
60,0
32
,0
48,5
40
,0
Gova
n M
beki
75
,3
57,2
66
,5
24,7
42
,8
33,5
72
,8
57,8
65
,7
27,2
42
,2
34,3
N
kang
ala
63,6
48
,2
55,6
36
,4
51,8
44
,4
64,5
52
,0
58,4
35
,5
48,0
41
,6
Vict
or K
hany
e 72
,7
55,0
63
,7
27,3
45
,0
36,3
68
,5
50,9
60
,1
31,5
49
,1
39,9
Em
alah
leni
74
,6
55,0
65
,2
25,4
45
,0
34,8
74
,6
59,4
67
,7
25,4
40
,6
32,3
St
eve
Tshw
ete
75,1
59
,2
67,1
24
,9
40,8
32
,9
73,4
57
,5
65,9
26
,6
42,5
34
,1
Emak
haze
ni
70,4
51
,5
60,9
29
,6
48,5
39
,1
65,7
51
,9
59,0
34
,3
48,1
41
,0
Them
bisil
e 51
,7
40,8
45
,7
48,3
59
,2
54,3
53
,0
47,3
50
,0
47,0
52
,7
50,0
Dr
JS M
orok
a 45
,8
38,6
41
,8
54,2
61
,4
58,2
44
,7
41,0
42
,7
55,3
59
,0
57,3
Eh
lanz
eni
58,2
45
,9
51,6
41
,8
54,1
48
,4
55,9
47
,5
51,4
44
,1
52,5
48
,6
Thab
a Ch
weu
75
,9
59,3
67
,7
24,1
40
,7
32,3
72
,7
58,2
65
,8
27,3
41
,8
34,2
M
bom
bela
65
,1
53,8
59
,1
34,9
46
,2
40,9
63
,0
54,9
58
,8
37,0
45
,1
41,2
U
mjin
di
67,7
62
,2
65,2
32
,3
37,8
34
,8
64,6
59
,5
62,2
35
,4
40,5
37
,8
Nko
maz
i 59
,0
43,4
50
,6
41,0
56
,6
49,4
52
,0
41,6
46
,5
48,0
58
,4
53,5
Bu
shbu
ckrid
ge
43,2
35
,3
38,7
56
,8
64,7
61
,3
43,1
39
,8
41,3
56
,9
60,2
58
,7
Mpu
mal
anga
61
,9
47,6
54
,4
38,1
52
,4
45,6
60
,5
49,2
54
,8
39,5
50
,8
45,2

Stat
istic
s Sou
th A
fric
a
Cen
sus 2
011
Prov
inci
al P
rofil
e: M
pum
alan
ga, R
epor
t 03-
01-7
7
78
Tabl
e 6.
24: E
mpl
oym
ent a
nd u
nem
ploy
men
t rat
es b
y se
x an
d by
dis
tric
t and
loca
l mun
icip
ality
, Cen
sus 2
001
and
Cens
us 2
011
Mun
icip
ality
2001
20
11
Empl
oyed
%
Une
mpl
oyed
%
Empl
oyed
%
Une
mpl
oyed
%
Mal
e Fe
mal
e To
tal
Mal
e Fe
mal
e To
tal
Mal
e Fe
mal
e To
tal
Mal
e Fe
mal
e To
tal
Ger
t Sib
ande
67
,7
44,6
57
,2
32,3
55
,4
42,8
77
,1
61,6
70
,3
22,9
38
,4
29,7
Al
bert
Lut
huli
56,2
39
,1
47,7
43
,8
60,9
52
,3
70,9
58
,2
64,6
29
,1
41,8
35
,4
Msu
kalig
wa
72,2
49
,1
61,7
27
,8
50,9
38
,3
80,6
63
,8
73,2
19
,4
36,2
26
,8
Mkh
ondo
64
,0
43,8
54
,2
36,0
56
,2
45,8
71
,3
56,0
64
,1
28,7
44
,0
35,9
Pi
xley
Ka
Sem
e 58
,2
40,0
49
,3
41,8
60
,0
50,7
71
,4
55,2
63
,9
28,6
44
,8
36,1
Le
kwa
73,5
51
,5
63,4
26
,5
48,5
36
,6
80,5
66
,1
74,1
19
,5
33,9
25
,9
Dipa
lese
ng
66,0
39
,4
54,2
34
,0
60,6
45
,8
70,8
51
,5
62,8
29
,2
48,5
37
,2
Gova
n M
beki
71
,4
44,4
60
,1
28,6
55
,6
39,9
79
,9
65,1
73
,8
20,1
34
,9
26,2
N
kang
ala
66,2
44
,0
56,2
33
,8
56,0
43
,8
75,9
62
,3
70,0
24
,1
37,7
30
,0
Vict
or K
hany
e 69
,2
42,4
57
,4
30,8
57
,6
42,6
78
,4
62,1
71
,8
21,6
37
,9
28,2
Em
alah
leni
72
,1
46,2
61
,6
27,9
53
,8
38,4
79
,2
62,9
72
,7
20,8
37
,1
27,3
St
eve
Tshw
ete
75,6
50
,8
64,6
24
,4
49,2
35
,4
85,8
72
,2
80,3
14
,2
27,8
19
,7
Emak
haze
ni
79,8
56
,7
70,0
20
,2
43,3
30
,0
80,2
65
,9
74,1
19
,8
34,1
25
,9
Them
bisil
e 55
,6
41,6
48
,7
44,4
58
,4
51,3
65
,9
60,1
63
,0
34,1
39
,9
37,0
Dr
JS M
orok
a 45
,1
33,7
39
,3
54,9
66
,3
60,7
56
,7
50,2
53
,4
43,3
49
,8
46,6
Eh
lanz
eni
65,5
48
,4
57,3
34
,5
51,6
42
,7
71,9
59
,0
65,6
28
,1
41,0
34
,4
Thab
a Ch
weu
82
,1
65,4
74
,8
17,9
34
,6
25,2
85
,0
72,0
79
,5
15,0
28
,0
20,5
M
bom
bela
70
,0
53,9
62
,3
30,0
46
,1
37,7
76
,8
66,5
71
,9
23,2
33
,5
28,1
U
mjin
di
81,3
63
,6
73,6
18
,7
36,4
26
,4
79,3
65
,4
73,1
20
,7
34,6
26
,9
Nko
maz
i 67
,9
47,7
58
,6
32,1
52
,3
41,4
73
,2
57,5
65
,7
26,8
42
,5
34,3
Bu
shbu
ckrid
ge
43,0
32
,3
37,3
57
,0
67,7
62
,7
52,8
43
,8
47,9
47
,2
56,2
52
,1
Mpu
mal
anga
66
,3
45,9
56
,9
33,7
54
,1
43,1
74
,8
60,8
68
,4
25,2
39
,2
31,6

Statistics South Africa
Census 2011 Provincial Profile: Mpumalanga, Report 03-01-77
79
Table 6.25: Employment and unemployment rates by age group and by district and local municipality, Census 2001 and Census 2011
Municipality
2001 2011 Employed Unemployed Employed Unemployed
15–35 36–64 15–35 36–64 15–35 36–64 15–35 36–64 Gert Sibande 47,7 68,9 52,3 31,1 62,2 80,5 37,8 19,5 Albert Luthuli 39,5 58,7 60,5 41,3 55,6 76,5 44,4 23,5 Msukaligwa 52,7 73,1 47,3 26,9 66,0 82,7 34,0 17,3 Mkhondo 47,2 64,7 52,8 35,3 56,0 75,5 44,0 24,5 Pixley Ka Seme 40,9 60,2 59,1 39,8 55,5 74,1 44,5 25,9 Lekwa 52,9 75,8 47,1 24,2 65,5 83,9 34,5 16,1 Dipaleseng 44,0 66,5 56,0 33,5 55,4 73,3 44,6 26,7 Govan Mbeki 49,5 72,1 50,5 27,9 66,2 83,1 33,8 16,9 Nkangala 44,6 69,8 55,4 30,2 61,1 80,5 38,9 19,5 Victor Khanye 48,6 68,6 51,4 31,4 65,0 80,2 35,0 19,8 Emalahleni 50,7 73,7 49,3 26,3 64,6 82,8 35,4 17,2 Steve Tshwete 53,9 77,1 46,1 22,9 73,5 87,9 26,5 12,1 Emakhazeni 61,7 80,8 38,3 19,2 66,4 83,6 33,6 16,4 Thembisile 36,2 64,6 63,8 35,4 51,5 75,8 48,5 24,2 Dr JS Moroka 24,7 56,4 75,3 43,6 39,3 68,3 60,7 31,7 Ehlanzeni 48,8 69,4 51,2 30,6 56,6 77,8 43,4 22,2 Thaba Chweu 66,9 84,1 33,1 15,9 73,4 86,5 26,6 13,5 Mbombela 53,9 73,9 46,1 26,1 63,2 83,0 36,8 17,0 Umjindi 67,6 82,4 32,4 17,6 64,4 83,7 35,6 16,3 Nkomazi 52,6 68,4 47,4 31,6 58,5 77,1 41,5 22,9 Bushbuckridge 26,4 53,2 73,6 46,8 36,2 64,0 63,8 36,0 Mpumalanga 47,2 69,4 52,8 30,6 59,6 79,5 40,4 20,5

Statistics South Africa
Census 2011 Provincial Profile: Mpumalanga, Report 03-01-77
80
Table 6.26: Percentage distribution of heads of households by sex and age, Census 2001 and Census 2011
Age
2001 2011 Male Female Male Female Male Female Male Female
N % N % 10-14 809 900 0,2 0,3 1 368 1 239 0,2 0,3 15-19 11 282 10 423 2,5 3,1 11 086 6 888 1,7 1,6 20-24 26 117 20 272 5,8 6,0 43 917 21 967 6,8 5,1 25-29 45 394 30 955 10,2 9,2 80 715 37 043 12,5 8,6 30-34 57 837 38 457 12,9 11,4 83 242 40 872 12,9 9,5 35-39 65 138 43 713 14,6 12,9 81 553 45 934 12,6 10,6 40-44 58 747 37 661 13,1 11,2 73 193 47 306 11,4 11,0 45-49 49 708 34 176 11,1 10,1 69 038 47 848 10,7 11,1 50-54 38 768 26 204 8,7 7,8 58 645 40 393 9,1 9,4 55-59 27 574 19 517 6,2 5,8 48 126 36 280 7,5 8,4 60-64 22 692 21 755 5,1 6,4 34 951 28 702 5,4 6,7 65-69 14 489 17 546 3,2 5,2 22 370 22 061 3,5 5,1 70-74 13 070 16 789 2,9 5,0 16 455 21 095 2,6 4,9 75-79 7 269 8 078 1,6 2,4 8 460 14 200 1,3 3,3 80-84 5 761 7 614 1,3 2,3 5 916 11 514 0,9 2,7 85+ 2 708 3 763 0,6 1,1 4 738 8 369 0,7 1,9 Total 447 362 337 825 100,0 100,0 643 774 431 712 100,0 100,0

Statistics South Africa
Census 2011 Provincial Profile: Mpumalanga, Report 03-01-77
81
Table 6.27: Percentage distribution of heads of households by sex and by district and local municipality, Census 2001 and Census 2011
Municipality 2001 2011
Male Female Total Male Female Total Gert Sibande 60,3 39,7 211 618 61,2 38,8 273 490 Albert Luthuli 47,6 52,4 39 652 50,7 49,3 47 705 Msukaligwa 63,5 36,5 29 689 62,2 37,8 40 932 Mkhondo 54,3 45,7 27 888 54,7 45,3 37 433 Pixley Ka Seme 55,1 44,9 18 002 54,9 45,1 19 838 Lekwa 65,9 34,1 25 199 64,3 35,7 31 071 Dipaleseng 64,8 35,2 9 474 64,8 35,2 12 637 Govan Mbeki 68,1 31,9 61 714 69,2 30,8 83 874 Nkangala 58,0 42,0 245 429 63,8 36,2 356 911 Victor Khanye 71,0 29,0 13 428 69,8 30,2 20 548 Emalahleni 67,2 32,8 74 917 72,1 27,9 119 875 Steve Tshwete 70,5 29,5 36 229 70,6 29,4 64 971 Emakhazeni 63,0 37,0 9 723 64,1 35,9 13 722 Thembisile 47,7 52,3 57 548 53,9 46,1 75 634 Dr JS Moroka 43,6 56,4 53 583 50,7 49,3 62 162 Ehlanzeni 54,1 45,9 328 377 55,9 44,1 445 086 Thaba Chweu 62,4 37,6 21 258 66,8 33,2 33 352 Mbombela 60,0 40,0 112 321 61,1 38,9 161 773 Umjindi 69,2 30,8 14 458 65,2 34,8 20 255 Nkomazi 54,0 46,0 71 840 54,3 45,7 95 508 Bushbuckridge 44,4 55,6 108 501 46,7 53,3 134 197 Mpumalanga 57,0 43,0 785 424 59,9 40,1 1 075 487

Stat
istic
s Sou
th A
fric
a
Cen
sus 2
011
Prov
inci
al P
rofil
e: M
pum
alan
ga, R
epor
t 03-
01-7
7
82
Tabl
e 6.
28: P
erce
ntag
e di
strib
utio
n of
hea
ds o
f hou
seho
lds b
y ag
e gr
oup
and
by d
istr
ict a
nd lo
cal m
unic
ipal
ity, C
ensu
s 200
1
Mun
icip
ality
10
–14
15–1
9 20
–24
25–2
9 30
–34
35–3
9 40
–44
45–4
9 50
–54
55–5
9 60
–64
65–6
9 70
–74
75–7
9 80
–84
85+
Perc
enta
ge
Gert
Sib
ande
0,
11
1,92
4,
85
9,36
12
,50
14,3
0 13
,33
11,1
4 8,
72
6,37
5,
78
4,14
3,
36
1,81
1,
62
0,70
Al
bert
Lut
huli
0,20
3,
27
4,94
7,
23
10,5
2 12
,43
11,5
5 10
,89
8,76
6,
94
6,92
5,
19
4,57
2,
43
2,94
1,
23
Msu
kalig
wa
0,10
1,
29
4,40
9,
88
12,9
2 14
,25
13,1
1 11
,07
9,62
6,
43
5,85
4,
04
3,04
1,
95
1,51
0,
56
Mkh
ondo
0,
13
2,36
5,
53
9,43
12
,55
13,7
3 12
,00
10,8
2 8,
40
6,12
6,
35
4,38
3,
80
1,95
1,
73
0,73
Pi
xley
Ka
Sem
e 0,
26
2,70
5,
21
7,57
10
,01
12,4
4 11
,22
10,7
1 9,
36
7,01
7,
29
5,64
4,
77
2,78
2,
27
0,76
Le
kwa
0,04
1,
55
4,59
9,
98
12,7
5 13
,83
13,1
5 10
,67
9,07
7,
11
6,24
4,
09
3,34
1,
77
1,19
0,
64
Dipa
lese
ng
0,09
2,
15
4,27
8,
88
10,7
9 12
,38
11,7
5 10
,55
9,84
7,
48
7,03
5,
54
4,48
2,
08
1,76
0,
95
Gova
n M
beki
0,
04
1,03
4,
80
10,8
0 14
,46
16,8
1 16
,11
11,8
8 7,
90
5,45
3,
93
2,76
1,
97
0,96
0,
76
0,37
N
kang
ala
0,17
2,
83
5,67
9,
10
11,4
8 13
,58
12,9
9 11
,28
8,82
6,
37
5,42
3,
93
3,61
2,
07
1,73
0,
96
Vict
or K
hany
e 0,
02
0,91
3,
93
8,99
13
,14
14,4
0 13
,33
11,8
5 9,
32
7,20
5,
83
3,93
3,
23
1,64
1,
60
0,67
Em
alah
leni
0,
04
1,36
5,
22
11,0
1 14
,27
16,5
4 15
,39
12,0
9 8,
47
5,48
3,
91
2,47
1,
84
0,97
0,
66
0,30
St
eve
Tshw
ete
0,04
0,
66
3,64
10
,07
14,4
2 16
,07
15,0
9 12
,55
9,21
5,
99
4,57
2,
91
2,39
1,
19
0,81
0,
39
Emak
haze
ni
0,04
1,
15
4,62
8,
87
12,4
2 11
,85
12,4
4 11
,02
9,37
8,
05
6,31
4,
48
3,91
2,
32
2,14
1,
03
Them
bisil
e 0,
33
4,41
6,
90
8,02
9,
26
12,0
9 11
,90
10,9
9 8,
95
6,31
5,
80
4,44
4,
44
2,57
2,
25
1,33
Dr
JS M
orok
a 0,
34
5,45
6,
99
6,99
7,
37
9,44
9,
39
9,48
8,
69
7,44
7,
43
6,02
6,
07
3,74
3,
25
1,91
Eh
lanz
eni
0,32
3,
26
6,77
10
,43
12,7
0 13
,80
11,0
7 9,
95
7,58
5,
47
5,77
4,
16
4,23
1,
96
1,74
0,
81
Thab
a Ch
weu
0,
11
1,89
6,
33
11,5
2 13
,09
13,1
3 11
,52
10,5
5 8,
45
6,72
5,
78
3,75
3,
23
1,73
1,
32
0,89
M
bom
bela
0,
17
2,12
5,
87
10,9
3 13
,44
15,0
3 11
,82
10,5
0 7,
76
5,53
5,
51
3,62
3,
55
1,81
1,
61
0,75
U
mjin
di
0,08
1,
17
6,30
12
,51
15,3
9 15
,08
12,2
9 9,
95
7,69
5,
41
5,17
3,
09
2,91
1,
30
1,07
0,
60
Nko
maz
i 0,
27
3,36
8,
09
11,2
0 12
,98
13,9
0 10
,64
9,51
7,
12
4,74
5,
77
4,07
4,
27
1,.7
6 1,
64
0,68
Bu
shbu
ckrid
ge
0,59
4,
93
6,97
8,
90
11,3
1 12
,41
10,3
4 9,
55
7,51
5,
66
6,11
4,
99
5,28
2,
39
2,10
0,
96
Mpu
mal
anga
0,
2 2,
76
5,91
9,
72
12,2
6 13
,86
12,2
8 10
,68
8,28
6,
00
5,66
4,
08
3,80
1,
96
1,70
0,
82

Stat
istic
s Sou
th A
fric
a
Cen
sus 2
011
Prov
inci
al P
rofil
e: M
pum
alan
ga, R
epor
t 03-
01-7
7
83
Tabl
e 6.
29: P
erce
ntag
e di
strib
utio
n of
hea
ds o
f hou
seho
lds b
y ag
e gr
oup
and
by d
istr
ict a
nd lo
cal m
unic
ipal
ity, C
ensu
s 201
1
Mun
icip
ality
10
–14
15–1
9 20
–24
25–2
9 30
–34
35–3
9 40
–44
45–4
9 50
–54
55–5
9 60
–64
65–6
9 70
–74
75–7
9 80
–84
85+
Perc
enta
ge
Gert
Sib
ande
0,
22
1,38
6,
08
11,5
4 11
,73
11,5
6 11
,10
11,0
1 9,
91
8,05
5,
96
4,06
3,
22
1,91
1,
31
0,95
Al
bert
Lut
huli
0,28
2,
38
6,20
9,
67
9,74
10
,01
10,4
1 10
,35
9,38
8,
45
6,87
5,
04
4,50
2,
76
2,10
1,
86
Msu
kalig
wa
0,22
1,
36
6,79
12
,86
12,5
3 12
,11
11,1
2 10
,78
9,26
7,
78
5,67
3,
28
2,84
1,
63
1,05
0,
72
Mkh
ondo
0,
39
1,64
5,
89
11,2
2 11
,24
12,2
4 11
,22
10,9
1 9,
08
7,88
5,
95
4,18
3,
63
1,93
1,
61
0,99
Pi
xley
Ka
Sem
e 0,
44
1,95
5,
31
8,62
9,
41
10,1
2 10
,22
11,1
9 10
,37
9,10
7,
68
5,37
4,
37
2,69
1,
83
1,36
Le
kwa
0,11
0,
80
4,98
10
,27
11,4
9 11
,81
11,7
5 11
,24
10,6
7 8,
19
6,50
4,
64
3,42
2,
01
1,28
0,
83
Dipa
lese
ng
0,14
1,
12
5,82
11
,44
12,2
7 11
,59
10,3
5 10
,02
9,07
7,
86
6,84
4,
77
3,96
2,
14
1,61
1,
04
Gova
n M
beki
0,
12
0,83
6,
38
13,2
8 13
,25
12,1
3 11
,52
11,5
8 10
,63
7,77
4,
86
3,19
2,
04
1,29
0,
69
0,47
N
kang
ala
0,18
1,
18
5,70
10
,48
10,9
4 11
,21
11,0
1 11
,15
10,1
0 8,
64
6,55
4,
50
3,47
2,
06
1,54
1,
30
Vict
or K
hany
e 0,
22
0,79
5,
86
11,5
9 12
,31
12,6
4 11
,45
11,1
6 9,
49
8,03
6,
07
3,96
3,
04
1,74
0,
99
0,66
Em
alah
leni
0,
10
0,85
6,
84
13,8
9 13
,63
12,7
8 11
,39
11,2
4 9,
96
7,76
4,
77
2,76
1,
89
0,99
0,
64
0,50
St
eve
Tshw
ete
0,12
0,
83
6,52
12
,94
13,0
8 12
,71
12,0
8 11
,10
9,86
7,
70
5,14
3,
13
2,22
1,
28
0,80
0,
51
Emak
haze
ni
0,20
0,
88
6,25
11
,13
12,3
7 11
,83
12,0
2 10
,19
8,79
7,
50
6,21
4,
66
3,50
1,
92
1,40
1,
16
Them
bisil
e 0,
28
1,48
4,
11
6,67
8,
34
10,2
1 11
,12
12,1
1 11
,00
10,0
0 8,
24
5,57
4,
31
2,60
2,
09
1,88
Dr
JS M
orok
a 0,
25
1,99
4,
42
5,43
5,
88
7,21
8,
68
10,0
5 10
,01
10,1
4 9,
61
8,14
6,
95
4,44
3,
62
3,19
Eh
lanz
eni
0,31
2,
25
6,50
10
,97
11,9
1 12
,55
11,4
2 10
,56
8,06
7,
08
5,39
3,
88
3,67
2,
27
1,88
1,
32
Thab
a Ch
weu
0,
15
1,03
7,
12
13,3
9 13
,23
13,3
6 11
,97
10,6
6 8,
37
6,93
4,
68
3,25
2,
57
1,55
1,
04
0,72
M
bom
bela
0,
18
1,36
6,
11
11,9
0 12
,83
13,5
3 11
,89
10,9
0 8,
27
7,14
5,
16
3,39
3,
06
1,79
1,
37
1,12
U
mjin
di
0,17
1,
27
6,50
12
,70
13,2
2 12
,99
12,0
2 10
,87
8,74
7,
16
4,86
3,
31
2,85
1,
75
0,97
0,
61
Nko
maz
i 0,
42
2,65
7,
29
11,7
3 12
,56
12,8
6 11
,09
10,1
0 7,
32
6,32
4,
93
3,52
3,
73
2,25
2,
01
1,25
Bu
shbu
ckrid
ge
0,44
3,
48
6,24
8,
44
9,81
10
,89
10,8
7 10
,39
8,17
7,
59
6,25
4,
97
4,76
3,
12
2,73
1,
86
Mpu
mal
anga
0,
24
1,67
6,
13
10,9
5 11
,54
11,8
5 11
,20
10,8
7 9,
21
7,85
5,
92
4,13
3,
49
2,11
1,
62
1,22

Stat
istic
s Sou
th A
fric
a
Cen
sus 2
011
Prov
inci
al P
rofil
e: M
pum
alan
ga, R
epor
t 03-
01-7
7
84
Tabl
e 6.
30: P
erce
ntag
e di
strib
utio
n of
hou
seho
lds b
y ty
pe o
f dw
ellin
g an
d by
dis
tric
t and
loca
l mun
icip
ality
, cen
suse
s of 1
996,
200
1 an
d 20
11
Mun
icip
ality
19
96
2001
20
11
Form
al
Info
rmal
Tr
aditi
onal
O
ther
Fo
rmal
In
form
al
Trad
ition
al
Oth
er
Form
al
Info
rmal
Tr
aditi
onal
O
ther
Ge
rt S
iban
de
51,2
23
,2
24,8
0,
8 56
,4
21,8
21
,4
0,4
72,4
16
,8
9,9
0,9
Albe
rt L
uthu
li 49
,8
8,4
41,2
0,
6 58
,4
6,7
34,7
0,
2 76
,5
6,0
16,8
0,
8 M
suka
ligw
a 61
,6
15,9
22
,2
0,3
65,4
13
,4
20,9
0,
2 75
,3
14,0
9,
8 1,
0 M
khon
do
37,1
4,
6 58
,1
0,2
38,6
7,
4 53
,8
0,3
65,2
3,
1 29
,5
2,2
Pixl
ey K
a Se
me
48,1
12
,9
38,2
0,
8 58
,5
11,5
29
,9
0,2
76,8
7,
3 15
,6
0,3
Lekw
a 57
,8
26,3
15
,1
0,8
54,3
33
,3
11,3
1,
0 73
,6
23,9
1,
8 0,
7 Di
pale
seng
42
,3
36,9
16
,9
3,9
57,6
34
,6
7,4
0,4
67,4
31
,5
0,6
0,5
Gova
n M
beki
52
,2
44,0
3,
1 0,
7 59
,0
38,4
2,
3 0,
3 71
,0
27,9
0,
4 0,
7 N
kang
ala
70,9
18
,0
10,2
1,
0 74
,8
17,6
7,
4 0,
2 82
,8
13,9
2,
4 1,
0 Vi
ctor
Kha
nye
63,5
21
,3
13,2
1,
9 62
,1
29,0
8,
7 0,
3 79
,3
15,4
2,
5 2,
8 Em
alah
leni
70
,2
23,2
5,
3 1,
4 67
,1
26,1
6,
5 0,
4 77
,2
19,3
2,
3 1,
2 St
eve
Tshw
ete
73,2
15
,5
9,5
1,8
73,9
16
,2
9,7
0,2
83,0
14
,1
1,7
1,2
Emak
haze
ni
60,7
17
,5
21,3
0,
5 68
,1
8,7
22,9
0,
3 81
,8
11,2
5,
4 1,
6 Th
embi
sile
63,6
21
,6
14,5
0,
3 79
,7
13,9
6,
3 0,
2 85
,6
10,2
3,
8 0,
4 Dr
JS M
orok
a 81
,0
9,4
9,3
0,4
85,1
9,
7 5,
0 0,
1 90
,9
7,7
1,1
0,2
Ehla
nzen
i 70
,3
5,7
23,4
0,
6 80
,6
7,5
11,7
0,
2 91
,8
4,8
2,8
0,6
Thab
a Ch
weu
74
,0
13,6
11
,4
1,1
68,7
21
,9
8,9
0,4
74,6
20
,4
3,9
1,1
Mbo
mbe
la
76,1
7,
9 15
,5
0,6
84,8
8,
9 6,
1 0,
2 92
,7
4,8
1,7
0,8
Um
jindi
65
,5
18,5
15
,2
0,8
64,5
22
,1
13,1
0,
3 81
,8
11,9
5,
5 0,
9 N
kom
azi
61,1
3,
7 34
,5
0,7
76,5
5,
3 18
,0
0,2
92,5
2,
9 3,
9 0,
7 Bu
shbu
ckrid
ge
69,7
2,
2 27
,6
0,5
83,3
2,
9 13
,7
0,2
95,9
1,
2 2,
7 0,
2 M
pum
alan
ga
65,5
14
,0
19,7
0,
7 72
,2
14,5
13
,0
0,3
83,8
10
,9
4,5
0,8
Sout
h Af
rica
64,6
16
,2
18,3
0,
8 68
,5
16,4
14
,8
0,3
77,6
13
,6
7,9
0,9
This
tabl
e ex
clud
es u
nspe
cifie
d ca
ses
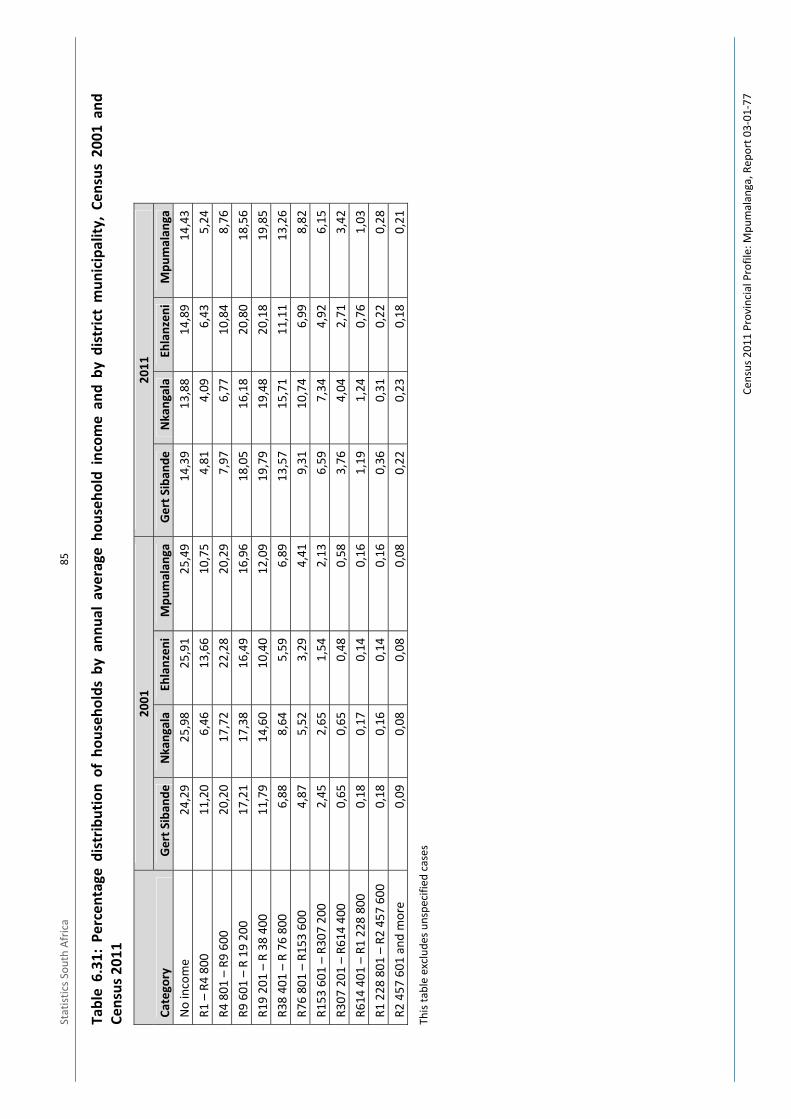
Stat
istic
s Sou
th A
fric
a
Cen
sus 2
011
Prov
inci
al P
rofil
e: M
pum
alan
ga, R
epor
t 03-
01-7
7
85
Tabl
e 6.
31:
Perc
enta
ge d
istr
ibut
ion
of h
ouse
hold
s by
ann
ual
aver
age
hous
ehol
d in
com
e an
d by
dis
tric
t m
unic
ipal
ity,
Cens
us 2
001
and
Cens
us 2
011
Cate
gory
20
01
2011
Ge
rt S
iban
de
Nka
ngal
a Eh
lanz
eni
Mpu
mal
anga
Ge
rt S
iban
de
Nka
ngal
a Eh
lanz
eni
Mpu
mal
anga
N
o in
com
e 24
,29
25,9
8 25
,91
25,4
9 14
,39
13,8
8 14
,89
14,4
3 R1
– R
4 80
0 11
,20
6,46
13
,66
10,7
5 4,
81
4,09
6,
43
5,24
R4
801
– R
9 60
0 20
,20
17,7
2 22
,28
20,2
9 7,
97
6,77
10
,84
8,76
R9
601
– R
19
200
17,2
1 17
,38
16,4
9 16
,96
18,0
5 16
,18
20,8
0 18
,56
R19
201
– R
38 4
00
11,7
9 14
,60
10,4
0 12
,09
19,7
9 19
,48
20,1
8 19
,85
R38
401
– R
76 8
00
6,88
8,
64
5,59
6,
89
13,5
7 15
,71
11,1
1 13
,26
R76
801
– R1
53 6
00
4,87
5,
52
3,29
4,
41
9,31
10
,74
6,99
8,
82
R153
601
– R
307
200
2,45
2,
65
1,54
2,
13
6,59
7,
34
4,92
6,
15
R307
201
– R
614
400
0,65
0,
65
0,48
0,
58
3,76
4,
04
2,71
3,
42
R614
401
– R
1 22
8 80
0 0,
18
0,17
0,
14
0,16
1,
19
1,24
0,
76
1,03
R1
228
801
– R
2 45
7 60
0 0,
18
0,16
0,
14
0,16
0,
36
0,31
0,
22
0,28
R2
457
601
and
mor
e 0,
09
0,08
0,
08
0,08
0,
22
0,23
0,
18
0,21
This
tabl
e ex
clud
es u
nspe
cifie
d ca
ses

Stat
istic
s Sou
th A
fric
a
Cen
sus 2
011
Prov
inci
al P
rofil
e: M
pum
alan
ga, R
epor
t 03-
01-7
7
86
Tabl
e 6.
32: P
erce
ntag
e di
strib
utio
n of
hou
seho
lds
by t
ype
of r
efus
e di
spos
al a
nd b
y di
stric
t an
d lo
cal m
unic
ipal
ity, c
ensu
ses
of 1
996,
200
1 an
d 20
11
Mun
icip
ality
Rem
oved
by
loca
l au
thor
ity/p
rivat
e co
mpa
ny
at le
ast o
nce
a w
eek
Rem
oved
by
loca
l au
thor
ity/p
rivat
e co
mpa
ny
less
oft
en
Com
mun
al re
fuse
dum
pO
wn
refu
se d
ump
No
rubb
ish d
ispo
sal
1996
20
01
2011
19
96
2001
20
11
1996
20
01
2011
19
96
2001
20
11
1996
20
01
2011
Ge
rt S
iban
de
51,5
53
,3
64,0
1,
9 1,
9 1,
0 4,
0 1,
4 1,
8 34
,3
33,7
25
,1
8,3
9,7
8,0
Albe
rt L
uthu
li 12
,2
12,3
19
,5
0,8
1,4
1,0
5,3
1,1
2,7
68,0
68
,4
63,0
13
,7
16,7
13
,8
Msu
kalig
wa
63,2
60
,9
66,2
3,
1 4,
6 1,
4 3,
5 2,
4 3,
1 25
,4
26,3
21
,1
4,9
5,8
8,2
Mkh
ondo
29
,6
31,7
34
,4
1,1
1,5
0,7
2,6
1,5
2,9
50,1
43
,2
43,8
16
,6
22,1
18
,2
Pixl
ey K
a Se
me
49,5
51
,6
62,1
2,
9 0,
3 1,
2 2,
2 0,
6 1,
0 37
,5
35,5
25
,5
7,9
12,0
10
,2
Lekw
a 57
,8
57,8
82
,4
0,5
1,2
0,8
7,7
3,7
1,3
28,6
30
,0
11,5
5,
4 7,
2 3,
9 Di
pale
seng
56
,0
65,5
82
,2
7,9
0,7
0,3
2,1
1,6
0,6
32,8
29
,3
11,2
1,
2 2,
9 5,
6 Go
van
Mbe
ki
79,2
82
,4
92,0
1,
6 1,
8 1,
1 3,
4 0,
4 0,
8 10
,1
12,3
4,
5 5,
8 3,
0 1,
6 N
kang
ala
41,8
41
,0
48,6
2,
5 2,
3 1,
4 3,
2 2,
2 3,
6 45
,9
44,6
40
,1
6,6
9,9
6,3
Vict
or K
hany
e 61
,9
63,3
74
,2
3,4
0,7
2,1
6,0
3,9
1,7
22,4
27
,5
18,6
6,
3 4,
7 3,
5 Em
alah
leni
69
,4
63,2
67
,8
3,2
3,5
1,4
3,3
2,6
3,0
19,1
24
,7
21,0
5,
0 6,
0 6,
9 St
eve
Tshw
ete
74,8
83
,0
84,9
1,
6 2,
3 1,
6 3,
7 0,
7 1,
4 16
,4
11,4
9,
6 3,
6 2,
6 2,
4 Em
akha
zeni
48
,1
61,3
72
,8
2,8
4,7
1,8
1,5
1,1
1,4
31,9
25
,9
19,7
15
,7
7,0
4,3
Them
bisil
e 7,
1 3,
7 4,
6 4,
0 0,
5 0,
5 3,
7 2,
8 8,
8 75
,5
75,5
77
,0
9,6
17,5
9,
1 Dr
JS M
orok
a 13
,8
12,4
13
,7
0,7
2,6
1,7
1,8
1,8
2,0
77,6
69
,3
75,3
6,
2 13
,9
7,2
Ehla
nzen
i 17
,7
19,6
24
,9
1,1
0,9
1,4
2,2
1,0
1,8
65,1
66
,9
62,6
13
,9
11,6
9,
3 Th
aba
Chw
eu
56,4
60
,0
59,1
3,
4 0,
6 5,
9 2,
5 2,
5 1,
2 28
,6
30,3
28
,5
9,2
6,7
5,4
Mbo
mbe
la
24,7
25
,5
29,7
1,
1 1,
1 1,
3 2,
0 1,
0 1,
7 64
,5
65,2
60
,1
7,6
7,2
7,2
Um
jindi
54
,6
67,6
67
,9
2,7
1,5
1,9
4,5
0,4
1,4
21,7
26
,4
24,6
16
,6
4,2
4,1
Nko
maz
i 10
,5
9,6
20,5
1,
4 1,
2 1,
3 2,
3 1,
3 3,
7 67
,9
74,3
63
,1
17,8
13
,6
11,5
Bu
shbu
ckrid
ge
4,6
6,0
7,5
0,4
0,4
0,6
2,1
0,6
0,6
75,3
76
,4
79,3
17
,6
16,6
11
,9
Mpu
mal
anga
33
,9
35,4
42
,8
1,8
1,6
1,3
3,0
1,5
2,4
51,2
51
,0
45,6
10
,2
10,5
8,
0 So
uth
Afric
a 52
,2
55,4
62
,7
2,3
1,5
1,5
3,2
1,7
1,9
32,6
32
,6
28,5
9,
7 8,
7 5,
5
This
tabl
e ex
clud
es u
nspe
cifie
d ca
ses

Stat
istic
s Sou
th A
fric
a
Cen
sus 2
011
Prov
inci
al P
rofil
e: M
pum
alan
ga, R
epor
t 03-
01-7
7
87
Tabl
e 6.
33: P
erce
ntag
e di
strib
utio
n of
hou
seho
lds
by ty
pe o
f toi
let f
acili
ty a
nd b
y di
stric
t and
loca
l mun
icip
ality
, cen
suse
s of
199
6, 2
001
and
2011
Mun
icip
ality
Fl
ush
or c
hem
ical
toile
t Pi
t toi
let
Buck
et to
ilet
Non
e 19
96
2001
20
11
1996
20
01
2011
19
96
2001
20
11
1996
20
01
2011
Ge
rt S
iban
de
48,5
51
,0
68,9
31
,7
30,3
25
,1
10,1
7,
3 0,
8 9,
7 11
,3
5,2
Albe
rt L
uthu
li 12
,7
17,6
23
,1
76,2
71
,0
70,5
3,
7 3,
6 1,
0 7,
4 7,
8 5,
3 M
suka
ligw
a 61
,8
68,9
77
,8
18,8
20
,3
15,9
11
,9
2,7
1,2
7,5
8,2
5,1
Mkh
ondo
27
,7
31,8
46
,7
43,5
43
,1
39,2
10
,0
3,8
0,6
18,7
21
,3
13,5
Pi
xley
Ka
Sem
e 45
,7
52,4
66
,6
28,1
31
,3
28,2
17
,0
4,6
0,6
9,3
11,7
4,
6 Le
kwa
60,8
57
,7
88,3
16
,6
14,6
6,
5 8,
1 12
,1
1,0
14,5
15
,6
4,2
Dipa
lese
ng
41,5
56
,8
78,2
26
,0
16,0
14
,8
28,7
19
,3
0,8
3,8
7,9
6,1
Gova
n M
beki
72
,7
68,6
92
,2
9,9
11,6
5,
4 9,
1 10
,6
0,6
8,3
9,2
1,8
Nka
ngal
a 43
,5
45,1
52
,8
50,8
48
,7
43,4
1,
7 1,
3 1,
3 4,
0 4,
8 2,
5 Vi
ctor
Kha
nye
63,0
68
,1
83,8
24
,8
20,1
10
,3
9,7
7,5
3,5
2,5
4,3
2,3
Emal
ahle
ni
76,7
71
,5
73,0
17
,6
19,9
23
,9
1,6
1,6
0,6
4,2
7,0
2,5
Stev
e Ts
hwet
e 79
,6
81,7
85
,7
12,3
10
,4
9,0
1,6
1,2
3,2
6,4
6,7
2,2
Emak
haze
ni
57,3
72
,8
80,9
26
,8
13,2
11
,1
0,6
1,3
1,3
15,3
12
,7
6,7
Them
bisil
e 5,
2 7,
4 10
,2
92,8
89
,9
86,3
0,
3 0,
4 0,
9 1,
7 2,
4 2,
6 Dr
JS M
orok
a 9,
5 13
,2
15,7
86
,6
84,3
82
,0
1,5
0,6
0,4
2,4
2,0
2,0
Ehla
nzen
i 17
,9
21,7
26
,5
67,3
59
,7
62,5
0,
4 0,
6 0,
6 14
,4
18,1
10
,3
Thab
a Ch
weu
61
,8
63,6
69
,8
33,2
30
,7
26,7
0,
6 0,
4 0,
6 4,
4 5,
4 3,
0 M
bom
bela
26
,8
27,0
34
,3
66,2
62
,0
57,7
0,
3 0,
7 0,
8 6,
6 10
,3
7,3
Um
jindi
52
,7
60,6
64
,1
24,9
28
,4
30,1
0,
3 0,
7 0,
8 22
,2
10,3
5,
0 N
kom
azi
7,6
12,2
14
,9
63,7
58
,0
68,8
0,
4 0,
6 0,
5 28
,3
29,1
15
,8
Bush
buck
ridge
4,
3 9,
0 9,
2 80
,2
68,2
77
,7
0,5
0,5
0,5
15,1
22
,4
12,7
M
pum
alan
ga
33,8
36
,9
46,0
53
,0
48,3
46
,7
3,3
2,7
0,9
9,9
12,1
6,
4
This
tabl
e ex
clud
es u
nspe
cifie
d ca
ses

Stat
istic
s Sou
th A
fric
a
Cen
sus 2
011
Prov
inci
al P
rofil
e: M
pum
alan
ga, R
epor
t 03-
01-7
7
88
Tabl
e 6.
34: P
erce
ntag
e di
strib
utio
n of
hou
seho
lds
by ty
pe e
nerg
y us
ed fo
r lig
htin
g an
d by
dis
tric
t and
loca
l mun
icip
ality
, cen
suse
s of
199
6,
2001
and
201
1
Mun
icip
ality
El
ectr
icity
Ga
s Pa
raffi
n Ca
ndle
s O
ther
19
96
2001
20
11
1996
20
01
2011
19
96
2001
20
11
1996
20
01
2011
19
96
2001
20
11
Gert
Sib
ande
44
,6
57,3
83
,6
0,9
0,4
0,4
6,1
3,0
0,8
48,5
38
,6
15,0
0,
0 0,
7 0,
3 Al
bert
Lut
huli
25,0
50
,4
87,7
1,
7 0,
7 0,
4 6,
6 2,
4 0,
4 66
,8
45,7
11
,2
0,0
0,8
0,3
Msu
kalig
wa
42,7
53
,0
74,8
0,
6 0,
2 0,
5 6,
2 1,
8 0,
8 50
,6
44,1
23
,6
0,0
0,9
0,2
Mkh
ondo
36
,9
34,4
67
,1
1,5
0,5
0,4
3,4
1,0
0,2
58,2
63
,2
31,9
0,
0 0,
9 0,
4 Pi
xley
Ka
Sem
e 64
,7
66,9
85
,5
1,2
0,3
0,2
8,9
2,8
0,7
25,2
29
,3
13,5
0,
0 0,
7 0,
2 Le
kwa
45,9
59
,3
88,8
0,
6 0,
2 0,
7 7,
4 5,
4 1,
1 46
,1
34,6
9,
2 0,
0 0,
5 0,
2 Di
pale
seng
64
,1
67,3
83
,4
0,5
0,2
0,0
2,2
2,2
0,8
33,3
29
,3
15,5
0,
0 0,
9 0,
3 Go
van
Mbe
ki
52,5
69
,0
90,6
0,
3 0,
2 0,
2 6,
0 4,
2 1,
3 41
,2
26,2
7,
7 0,
0 0,
5 0,
3 N
kang
ala
73,6
79
,3
85,9
0,
7 0,
2 0,
2 2,
8 1,
6 1,
1 22
,9
18,5
12
,5
0,0
0,4
0,2
Vict
or K
hany
e 62
,3
64,9
85
,1
2,2
0,2
0,7
3,0
1,3
0,7
32,5
33
,1
13,2
0,
0 0,
5 0,
3 Em
alah
leni
70
,9
68,8
73
,7
0,5
0,2
0,2
3,5
2,9
2,5
25,2
27
,8
23,4
0,
0 0,
4 0,
2 St
eve
Tshw
ete
71,2
74
,7
91,1
0,
6 0,
2 0,
3 3,
9 1,
7 0,
6 24
,3
23,0
7,
8 0,
0 0,
4 0,
2 Em
akha
zeni
55
,1
71,8
83
,9
0,5
0,4
0,2
7,9
3,4
0,8
36,6
23
,8
14,9
0,
0 0,
6 0,
2 Th
embi
sile
84,1
88
,7
92,5
0,
7 0,
3 0,
1 1,
0 0,
5 0,
5 14
,2
10,1
6,
8 0,
0 0,
4 0,
1 Dr
JS M
orok
a 74
,6
92,0
96
,9
0,8
0,3
0,1
2,0
0,4
0,1
22,7
7,
0 2,
8 0,
0 0,
3 0,
2 Eh
lanz
eni
40,5
68
,6
89,2
0,
8 0,
3 0,
3 26
,2
7,4
1,1
32,5
23
,2
9,2
0,0
0,5
0,3
Thab
a Ch
weu
68
,7
76,1
84
,7
0,4
0,3
0,3
5,8
4,7
1,6
25,1
18
,5
13,2
0,
0 0,
5 0,
3 M
bom
bela
49
,4
72,3
90
,5
0,7
0,3
0,3
25,1
8,
4 1,
4 24
,7
18,6
7,
6 0,
0 0,
4 0,
3 U
mjin
di
49,2
56
,9
78,8
0,
6 0,
3 0,
3 10
,0
5,6
2,0
40,2
36
,6
18,5
0,
0 0,
5 0,
3 N
kom
azi
25,6
47
,3
83,6
1,
3 0,
5 0,
7 35
,9
11,6
1,
2 37
,2
39,9
14
,2
0,0
0,7
0,3
Bush
buck
ridge
34
,2
78,9
94
,2
0,7
0,1
0,1
27,9
4,
4 0,
5 37
,2
16,0
5,
1 0,
0 0,
6 0,
2 M
pum
alan
ga
51,8
68
,9
86,7
0,
8 0,
3 0,
3 13
,8
4,4
1,1
33,7
25
,9
11,8
0,
0 0,
5 0,
2 So
uth
Afric
a 58
,1
69,7
85
,0
0,4
0,2
0,2
12,7
6,
8 3,
0 28
,8
22,7
11
,5
0,0
0,5
0,4
This
tabl
e ex
clud
es u
nspe
cifie
d ca
se

Stat
istic
s Sou
th A
fric
a
Cen
sus 2
011
Prov
inci
al P
rofil
e: M
pum
alan
ga, R
epor
t 03-
01-7
7
89
Tabl
e 6.
35: P
erce
ntag
e di
strib
utio
n of
hou
seho
lds
by ty
pe o
f ene
rgy/
fuel
use
d fo
r coo
king
and
by
dist
rict a
nd lo
cal m
unic
ipal
ity, c
ensu
ses
of
1996
, 200
1 an
d 20
11
Mun
icip
ality
El
ectr
icity
Ga
s Pa
raffi
n W
ood
Coal
An
imal
dun
g O
ther
19
96
2001
20
11
1996
20
01
2011
19
96
2001
20
11
1996
20
01
2011
19
96
2001
20
11
1996
20
01
2011
19
96
2001
20
11
Gert
Sib
ande
31
,7
29,8
63
,1
1,5
1,9
2,0
11,4
12
,1
3,9
28,0
34
,2
25,6
26
,3
28,2
10
,9
1,1
2,0
0,6
0,0
0,6
0,2
Albe
rt L
uthu
li 13
,0
21,1
51
,0
1,8
1,7
1,7
9,2
7,6
1,4
55,1
56
,7
51,1
20
,4
17,3
3,
9 0,
5 0,
5 0,
1 0,
0 0,
7 0,
1 M
suka
ligw
a 37
,4
29,3
49
,2
1,2
1,5
2,5
7,4
6,5
3,6
27,1
36
,5
27,8
26
,4
34,0
24
,1
0,5
0,4
0,3
0,0
0,6
0,1
Mkh
ondo
18
,8
17,5
41
,4
2,8
3,5
2,9
6,6
8,2
3,1
70,8
78
,8
68,4
0,
7 0,
7 0,
5 0,
2 1,
0 0,
1 0,
0 0,
7 0,
1 Pi
xley
Ka
Sem
e 27
,0
22,9
52
,5
1,3
1,5
1,6
11,2
6,
1 1,
8 14
,4
22,3
13
,5
44,7
50
,9
30,1
1,
3 4,
6 3,
2 0,
0 0,
5 0,
2 Le
kwa
40,4
42
,9
80,7
1,
2 1,
2 1,
1 11
,5
12,3
3,
8 13
,9
11,0
7,
1 28
,8
28,6
7,
6 4,
1 7,
3 1,
3 0,
1 0,
6 0,
2 Di
pale
seng
29
,1
28,2
73
,5
1,2
2,0
2,0
7,7
9,1
6,0
22,8
17
,1
12,6
36
,9
44,2
10
,0
2,0
3,2
0,4
0,2
0,6
0,2
Gova
n M
beki
45
,7
38,0
80
,8
1,1
1,8
1,9
17,6
21
,6
6,0
3,3
2,4
1,8
31,8
35
,5
9,8
0,6
1,0
0,3
0,0
0,4
0,3
Nka
ngal
a 43
,1
47,8
73
,3
1,5
1,3
1,9
17,2
19
,2
10,7
11
,8
12,9
10
,2
26,1
20
,6
5,8
0,3
0,4
0,1
0,0
0,6
0,2
Vict
or K
hany
e 32
,0
27,2
63
,8
1,1
1,5
3,4
10,4
12
,9
8,2
10,0
9,
3 6,
9 45
,9
50,6
18
,7
0,7
0,5
0,1
0,0
0,5
0,2
Emal
ahle
ni
63,3
60
,8
70,9
1,
0 1,
1 2,
3 16
,7
23,0
21
,5
2,6
1,9
1,7
16,3
12
,4
3,5
0,1
0,4
0,0
0,0
0,6
0,3
Stev
e Ts
hwet
e 60
,4
52,6
82
,0
1,3
1,3
2,0
13,5
18
,0
5,0
9,1
7,6
5,1
15,6
22
,2
7,1
0,0
0,3
0,0
0,2
0,6
0,3
Emak
haze
ni
23,3
33
,6
49,6
1,
3 1,
4 2,
8 7,
9 5,
1 2,
9 34
,0
27,6
21
,6
33,3
37
,2
23,8
0,
1 0,
3 0,
0 0,
1 0,
8 0,
2 Th
embi
sile
22,2
38
,8
80,1
1,
6 1,
2 1,
6 19
,9
21,0
6,
9 5,
6 6,
5 5,
6 50
,4
32,5
5,
8 0,
3 0,
4 0,
1 0,
0 0,
5 0,
1 Dr
JS M
orok
a 34
,6
43,7
69
,3
2,4
1,7
1,0
21,3
16
,8
2,8
26,6
33
,2
29,4
14
,2
7,6
0,7
0,9
0,4
0,1
0,0
0,5
0,1
Ehla
nzen
i 25
,2
36,1
70
,4
3,6
2,2
1,9
19,2
16
,0
3,2
51,4
49
,4
43,9
0,
6 0,
9 0,
7 0,
1 0,
3 0,
0 0,
0 0,
6 0,
2 Th
aba
Chw
eu
34,6
40
,6
71,9
1,
5 1,
6 2,
3 15
,2
18,6
5,
2 45
,4
43,9
35
,5
3,1
3,1
0,6
0,3
0,4
0,0
0,0
0,2
0,2
Mbo
mbe
la
39,1
52
,8
84,0
5,
3 2,
7 2,
7 31
,8
23,7
4,
6 23
,4
22,3
19
,5
0,4
0,4
0,1
0,0
0,3
0,0
0,0
0,6
0,3
Um
jindi
41
,0
45,6
68
,8
5,0
4,5
4,4
17,6
23
,6
5,2
35,4
26
,8
24,2
0,
9 0,
8 0,
1 0,
0 0,
4 0,
0 0,
0 0,
9 0,
3 N
kom
azi
17,5
26
,2
64,7
4,
0 2,
5 1,
8 13
,9
13,6
2,
5 64
,1
58,4
54
,5
0,4
2,3
2,5
0,0
0,3
0,1
0,0
0,7
0,2
Bush
buck
ridge
14
,2
23,3
58
,0
2,1
1,3
0,6
12,4
8,
2 1,
2 70
,7
71,3
66
,2
0,4
0,2
0,1
0,1
0,2
0,0
0,0
0,6
0,1
Mpu
mal
anga
32
,4
38,1
69
,5
2,4
1,8
1,9
16,6
15
,9
5,9
33,1
34
,2
28,4
15
,1
14,4
5,
0 0,
4 0,
8 0,
2 0,
0 0,
6 0,
2 So
uth
Afric
a 47
,4
51,4
74
,0
3,2
2,5
3,5
21,6
21
,4
8,5
23,0
26
,3
20,5
3,
6 2,
8 0,
7 1,
2 1,
0 0,
3 0,
0 0,
5 0,
4
This
tabl
e ex
clud
es u
nspe
cifie
d ca
ses

Stat
istic
s Sou
th A
fric
a
Cen
sus 2
011
Prov
inci
al P
rofil
e: M
pum
alan
ga, R
epor
t 03-
01-7
7
90
Tabl
e 6.
36: P
erce
ntag
e di
strib
utio
n of
hou
seho
lds
by t
ype
ener
gy/f
uel u
sed
for
heat
ing
and
by d
istr
ict
and
loca
l mun
icip
ality
, cen
suse
s of
19
96, 2
001
and
2011
Mun
icip
ality
El
ectr
icity
Ga
s Pa
raffi
n W
ood
Coal
An
imal
dun
g O
ther
19
96
2001
20
11
1996
20
01
2011
19
96
2001
20
11
1996
20
01
2011
19
96
2001
20
11
1996
20
01
2011
19
96
2001
20
11
Gert
Sib
ande
31
,2
27,3
53
,7
0,9
1,2
2,5
8,1
8,1
1,7
29,4
26
,6
22,8
29
,4
33,0
18
,5
1,1
1,8
0,7
0,0
2,2
0,2
Albe
rt L
uthu
li 11
,7
19,0
42
,6
0,9
0,6
1,2
5,6
3,5
0,4
58,1
53
,9
50,5
23
,1
20,0
5,
1 0,
5 0,
3 0,
1 0,
0 2,
8 0,
1 M
suka
ligw
a 36
,8
26,7
45
,0
1,1
1,1
2,8
6,2
5,2
1,4
27,4
28
,6
22,9
28
,0
36,8
27
,5
0,5
0,3
0,4
0,0
1,4
0,1
Mkh
ondo
18
,7
15,4
36
,6
0,9
1,2
1,7
5,5
7,9
1,2
73,5
70
,3
59,5
1,
1 0,
9 0,
7 0,
2 0,
7 0,
2 0,
0 3,
5 0,
2 Pi
xley
Ka
Sem
e 26
,2
23,9
41
,2
0,9
0,9
1,7
10,0
4,
2 0,
9 16
,6
14,2
12
,1
44,2
51
,5
39,8
2,
1 4,
8 4,
1 0,
0 0,
6 0,
2 Le
kwa
39,7
38
,6
65,0
0,
7 0,
9 2,
1 8,
7 7,
3 1,
5 15
,2
7,4
6,4
32,3
37
,6
23,3
3,
3 6,
9 1,
6 0,
1 1,
4 0,
2 Di
pale
seng
29
,7
27,0
62
,2
0,8
1,2
1,9
5,5
5,2
3,5
22,5
13
,3
9,9
39,6
47
,7
22,0
1,
9 3,
2 0,
3 0,
0 2,
5 0,
2 Go
van
Mbe
ki
45,3
34
,6
69,5
1,
0 1,
9 3,
9 11
,5
14,3
2,
6 3,
9 1,
9 1,
6 37
,8
44,5
21
,7
0,6
0,7
0,4
0,0
2,2
0,3
Nka
ngal
a 41
,4
46,9
69
,1
0,9
0,8
2,2
7,7
7,3
3,1
13,3
10
,8
9,8
36,3
30
,5
15,6
0,
3 0,
3 0,
1 0,
1 3,
6 0,
2 Vi
ctor
Kha
nye
32,2
26
,8
50,0
1,
0 0,
9 3,
1 7,
2 6,
6 2,
6 13
,5
7,6
7,9
45,5
56
,2
36,0
0,
7 0,
2 0,
1 0,
0 1,
8 0,
3 Em
alah
leni
61
,5
57,2
71
,6
0,9
0,9
2,8
6,1
7,8
5,5
3,5
3,1
4,9
28,0
25
,9
15,1
0,
1 0,
2 0,
1 0,
0 4,
9 0,
2 St
eve
Tshw
ete
61,6
52
,8
72,5
0,
8 1,
0 3,
2 6,
8 9,
6 1,
8 11
,0
6,0
5,6
19,8
26
,5
16,6
0,
0 0,
3 0,
1 0,
0 3,
8 0,
3 Em
akha
zeni
22
,5
34,2
41
,3
0,6
0,6
2,3
5,7
3,9
1,0
37,3
22
,6
25,4
33
,8
37,1
29
,5
0,1
0,3
0,1
0,1
1,5
0,3
Them
bisil
e 20
,5
36,0
69
,8
0,8
0,6
1,2
7,7
6,4
2,7
7,4
6,6
8,3
63,4
47
,2
17,6
0,
3 0,
3 0,
2 0,
0 2,
9 0,
1 Dr
JS M
orok
a 30
,1
47,3
72
,2
1,2
0,6
0,8
10,9
6,
6 1,
0 28
,0
28,1
22
,4
28,9
13
,9
3,3
0,7
0,4
0,1
0,2
3,1
0,1
Ehla
nzen
i 24
,5
36,9
75
,2
1,2
0,6
1,4
10,0
6,
9 1,
9 62
,5
48,3
20
,6
1,5
1,5
0,5
0,1
0,2
0,1
0,2
5,6
0,3
Thab
a Ch
weu
33
,7
37,9
71
,1
0,7
0,6
1,7
7,4
9,4
2,4
52,9
43
,1
23,6
4,
6 4,
9 0,
8 0,
2 0,
2 0,
2 0,
5 3,
9 0,
3 M
bom
bela
39
,9
49,8
85
,0
1,6
0,7
1,6
14,2
8,
4 1,
9 42
,6
33,6
10
,9
1,4
0,6
0,2
0,0
0,2
0,1
0,3
6,7
0,4
Um
jindi
44
,2
46,4
70
,8
1,1
0,8
1,7
8,8
9,2
1,5
44,5
38
,2
24,7
1,
4 1,
2 1,
0 0,
0 0,
2 0,
1 0,
0 4,
0 0,
3 N
kom
azi
15,6
26
,2
77,2
1,
4 0,
8 2,
1 7,
2 7,
8 2,
4 74
,0
55,0
16
,1
1,5
4,0
1,7
0,1
0,3
0,2
0,3
5,9
0,4
Bush
buck
ridge
13
,3
29,1
63
,2
0,9
0,4
0,6
8,9
3,8
1,6
75,9
61
,3
34,1
0,
9 0,
4 0,
2 0,
1 0,
2 0,
1 0,
0 4,
8 0,
1 M
pum
alan
ga
31,6
37
,4
67,2
1,
0 0,
8 2,
0 8,
8 7,
3 2,
2 38
,3
30,7
17
,5
19,8
19
,1
10,6
0,
4 0,
7 0,
3 0,
1 4,
1 0,
2 So
uth
Afric
a 46
,5
49,0
67
,1
1,2
1,1
2,8
14,9
14
,7
9,7
27,9
24
,6
17,4
8,
5 6,
6 2,
3 1,
0 0,
7 0,
4 0,
1 3,
3 0,
3
This
tabl
e ex
clud
es u
nspe
cifie
d ca
ses

Stat
istic
s Sou
th A
fric
a
Cen
sus 2
011
Prov
inci
al P
rofil
e: M
pum
alan
ga, R
epor
t 03-
01-7
7
91
Tabl
e 6.
37: P
erce
ntag
e of
hou
seho
lds t
hat h
ave
acce
ss to
pip
ed w
ater
by
dist
rict a
nd lo
cal m
unic
ipal
ity, c
ensu
ses o
f 199
6, 2
001
and
2011
Mun
icip
ality
Pipe
d w
ater
insi
de d
wel
ling/
yard
Pipe
d w
ater
outs
ide
yard
No
acce
ss to
pip
ed w
ater
1996
20
01
2011
19
96
2001
20
11
1996
20
01
2011
Ge
rt S
iban
de
60,4
60
,6
81,3
20
,4
25,9
9,
9 19
,2
13,5
8,
9 Al
bert
Lut
huli
40,3
46
,7
70,2
25
,4
29,2
11
,5
34,3
24
,1
18,2
M
suka
ligw
a 68
,4
67,6
78
,1
14,5
22
,1
12,5
17
,1
10,4
9,
4 M
khon
do
38,2
36
,2
58,6
29
,3
30,7
19
,9
32,5
33
,2
21,5
Pi
xley
Ka
Sem
e 61
,2
61,8
84
,4
7,3
20,7
8,
5 31
,5
17,5
7,
1 Le
kwa
70,4
67
,3
90,6
15
,8
29,6
7,
1 13
,8
3,2
2,4
Dipa
lese
ng
57,0
76
,4
84,5
27
,4
17,2
10
,1
15,6
6,
3 5,
4 Go
van
Mbe
ki
75,4
71
,9
94,5
20
,9
24,9
4,
4 3,
6 3,
3 1,
1 N
kang
ala
70,3
68
,9
81,6
15
,6
19,9
11
,0
14,1
11
,2
7,3
Vict
or K
hany
e 67
,7
70,8
83
,2
15,1
22
,8
12,5
17
,2
6,5
4,3
Emal
ahle
ni
80,0
73
,0
80,3
15
,1
20,2
14
,5
4,8
6,8
5,2
Stev
e Ts
hwet
e 81
,4
77,6
85
,7
7,4
18,3
12
,5
11,1
4,
1 1,
8 Em
akha
zeni
69
,6
77,5
87
,9
6,9
13,0
7,
4 23
,5
9,5
4,7
Them
bisil
e 67
,2
72,1
88
,4
22,0
20
,7
7,0
10,7
7,
2 4,
6 Dr
JS M
orok
a 54
,9
51,8
69
,9
17,2
20
,3
7,9
27,9
27
,9
22,1
Eh
lanz
eni
48,4
44
,5
57,8
33
,4
38,3
23
,2
18,2
17
,2
19,0
Th
aba
Chw
eu
70,9
73
,0
79,8
21
,4
21,4
15
,0
7,7
5,6
5,2
Mbo
mbe
la
65,4
54
,2
64,8
19
,2
32,3
13
,1
15,5
13
,5
22,1
U
mjin
di
59,9
61
,4
74,7
24
,1
24,6
19
,7
16,0
14
,1
5,6
Nko
maz
i 46
,8
37,2
57
,7
29,2
49
,2
23,5
24
,0
13,7
18
,8
Bush
buck
ridge
30
,1
31,4
41
,4
50,1
42
,6
37,6
19
,8
25,9
21
,0
Mpu
mal
anga
58
,3
56,5
71
,7
24,5
29
,3
15,8
17
,2
14,3
12
,6
This
tabl
e ex
clud
es u
nspe
cifie
d ca
ses

Stat
istic
s Sou
th A
fric
a
Cen
sus 2
011
Prov
inci
al P
rofil
e: M
pum
alan
ga, R
epor
t 03-
01-7
7
92
Tabl
e 6.
38: P
erce
ntag
e of
hou
seho
lds t
hat o
wn
spec
ific
hous
ehol
d go
ods b
y di
stric
t and
loca
l mun
icip
ality
, cen
suse
s of 1
996,
200
1 an
d 20
11
Mun
icip
ality
Co
mpu
ter
Tele
visi
on
Radi
o Ce
ll-ph
one
Tele
phon
e Re
frig
erat
or
2001
20
11
2001
20
11
2001
20
11
2001
20
11
2001
20
11
2001
20
11
Gert
Sib
ande
5,
1 16
,4
48,3
75
,3
75,9
73
,1
29,3
90
,1
16,1
7,
6 42
,9
67,0
Al
bert
Lut
huli
1,5
9,1
40,1
71
,8
75,1
72
,5
25,3
89
,3
9,1
2,7
39,5
65
,2
Msu
kalig
wa
5,1
16,5
51
,0
73,7
79
,7
77,9
30
,6
90,1
16
,1
6,6
42,4
63
,0
Mkh
ondo
2,
5 9,
2 40
,3
64,1
76
,5
73,0
25
,5
86,0
8,
9 4,
4 33
,5
52,7
Pi
xley
Ka
Sem
e 4,
4 13
,5
49,3
76
,9
79,3
76
,8
23,4
89
,5
16,4
8,
4 41
,7
66,7
Le
kwa
6,2
17,4
54
,9
81,4
75
,6
72,5
31
,6
91,7
22
,3
9,1
46,5
75
,1
Dipa
lese
ng
3,6
14,2
52
,3
74,6
72
,7
66,6
21
,3
86,8
15
,9
6,7
46,2
66
,0
Gova
n M
beki
8,
6 24
,3
52,4
80
,6
73,8
71
,1
35,1
92
,4
21,2
11
,6
47,8
73
,6
Nka
ngal
a 5,
3 19
,1
58,9
76
,2
77,4
75
,7
35,6
92
,3
18,8
7,
3 58
,5
71,7
Vi
ctor
Kha
nye
5,5
15,1
50
,4
75,1
72
,6
59,8
30
,9
89,3
13
,7
5,9
42,5
63
,4
Emal
ahle
ni
8,8
22,7
57
,4
70,0
76
,5
73,6
42
,9
93,4
27
,0
10,0
55
,8
63,9
St
eve
Tshw
ete
9,8
26,3
62
,8
82,0
80
,9
80,9
42
,0
94,1
27
,8
12,8
60
,7
74,7
Em
akha
zeni
5,
2 16
,8
54,2
71
,3
82,0
78
,4
31,0
91
,8
25,1
8,
0 52
,7
67,0
Th
embi
sile
1,5
14,3
58
,9
78,7
77
,7
79,3
32
,4
92,8
10
,5
2,4
60,1
76
,6
Dr JS
Mor
oka
1,3
12,3
61
,2
80,2
76
,6
74,3
26
,5
88,7
10
,4
2,5
64,2
81
,1
Ehla
nzen
i 3,
1 14
,0
42,2
73
,9
68,6
68
,7
28,8
90
,8
10,0
4,
8 46
,9
72,7
Th
aba
Chw
eu
5,7
16,0
45
,4
63,7
69
,7
67,5
29
,2
90,3
19
,3
7,1
48,8
57
,7
Mbo
mbe
la
5,3
20,2
49
,6
77,9
72
,1
74,7
35
,4
92,2
13
,3
7,8
56,1
77
,7
Um
jindi
5,
4 16
,7
47,5
68
,2
72,4
70
,8
27,6
89
,0
15,7
6,
9 47
,3
64,4
N
kom
azi
1,5
9,6
26,1
66
,8
61,3
66
,6
23,7
89
,6
6,4
2,5
36,8
65
,9
Bush
buck
ridge
0,
9 8,
7 43
,9
77,7
69
,2
63,6
25
,6
90,5
6,
4 2,
1 43
,7
76,4
M
pum
alan
ga
4,3
16,3
49
,1
75,0
73
,3
72,1
31
,1
91,1
14
,4
6,3
49,4
70
,9
Sout
h Af
rica
8,6
21,4
53
,8
74,5
73
,0
69,6
32
,3
88,9
24
,4
14,5
51
,2
68,4
This
tabl
e ex
clud
es u
nspe
cifie
d ca
ses

Stat
istic
s Sou
th A
fric
a
Cen
sus 2
011
Prov
inci
al P
rofil
e: M
pum
alan
ga, R
epor
t 03-
01-7
7
93
Tabl
e 6.
39: N
umbe
r of h
ouse
hold
s tha
t hav
e ac
cess
to th
e In
tern
et b
y di
stric
t and
loca
l mun
icip
ality
, Cen
sus 2
011
Mun
icip
ality
From
ho
me
From
cel
l-ph
one
From
w
ork
From
else
whe
re
No
acce
ss
to
Inte
rnet
Tota
lFr
om
hom
e Fr
om c
ell-
phon
e Fr
om
wor
k Fr
omel
sew
here
N
o ac
cess
to
In
tern
et
Tota
l
Hous
ehol
d Pe
rcen
tage
Ge
rt S
iban
de
15 5
48
48 8
80
9 37
1 12
929
18
6 76
2 27
3 49
0 5,
7 17
,9
3,4
4,7
68,3
10
0,0
Albe
rt L
uthu
li 1
092
7 76
4 79
7 1
686
36 3
66
47 7
05
2,3
16,3
1,
7 3,
5 76
,2
100,
0 M
suka
ligw
a 2
515
7 56
3 1
485
2 59
5 26
773
40
932
6,
1 18
,5
3,6
6,3
65,4
10
0,0
Mkh
ondo
1
276
6 01
9 71
2 1
741
27 6
86
37 4
33
3,4
16,1
1,
9 4,
7 74
,0
100,
0 Pi
xley
Ka
Sem
e 93
5 3
423
410
832
14 2
38
19 8
38
4,7
17,3
2,
1 4,
2 71
,8
100,
0 Le
kwa
2 04
4 5
428
1 29
2 2
068
20 2
39
31 0
71
6,6
17,5
4,
2 6,
7 65
,1
100,
0 Di
pale
seng
49
3 2
306
353
262
9 22
3 12
637
3,
9 18
,3
2,8
2,1
73,0
10
0,0
Gova
n M
beki
7
193
16 3
77
4 32
2 3
746
52 2
37
83 8
74
8,6
19,5
5,
2 4,
5 62
,3
100,
0 N
kang
ala
20 8
28
63 7
90
12 9
79
23 0
71
236
243
356
911
5,8
17,9
3,
6 6,
5 66
,2
100,
0 Vi
ctor
Kha
nye
1 00
2 3
242
716
756
14 8
33
20 5
48
4,9
15,8
3,
5 3,
7 72
,2
100,
0 Em
alah
leni
9
988
22 5
97
5 92
3 7
815
73 5
52
119
874
8,3
18,9
4,
9 6,
5 61
,4
100,
0 St
eve
Tshw
ete
6 34
1 11
742
3
861
2 29
0 40
737
64
971
9,
8 18
,1
5,9
3,5
62,7
10
0,0
Emak
haze
ni
847
2 86
5 38
0 47
0 9
160
13 7
22
6,2
20,9
2,
8 3,
4 66
,8
100,
0 Th
embi
sile
1 69
0 13
617
1
254
7 04
7 52
026
75
634
2,
2 18
,0
1,7
9,3
68,8
10
0,0
Dr JS
Mor
oka
960
9 72
7 84
5 4
693
45 9
36
62 1
62
1,5
15,7
1,
4 7,
6 73
,9
100,
0 Eh
lanz
eni
18 9
97
81 5
29
13 4
21
16 6
44
314
496
445
087
4,3
18,3
3,
0 3,
7 70
,7
100,
0 Th
aba
Chw
eu
2 04
3 5
126
1 24
7 90
6 24
030
33
352
6,
1 15
,4
3,7
2,7
72,1
10
0,0
Mbo
mbe
la
10 4
39
33 4
41
8 05
7 5
754
104
083
161
773
6,5
20,7
5,
0 3,
6 64
,3
100,
0 U
mjin
di
1 15
6 4
150
805
543
13 6
01
20 2
55
5,7
20,5
4,
0 2,
7 67
,2
100,
0 N
kom
azi
2 75
8 16
763
1
457
2 85
6 71
675
95
509
2,
9 17
,6
1,5
3,0
75,0
10
0,0
Bush
buck
ridge
2
601
22 0
49
1 85
5 6
586
101
107
134
197
1,9
16,4
1,
4 4,
9 75
,3
100,
0 M
pum
alan
ga
55 3
73
194
199
35 7
71
52 6
44
737
502
1 07
5 48
8 5,
2 18
,1
3,3
4,9
68,6
10
0,0
This
tabl
e ex
clud
es u
nspe
cifie
d ca
ses

Statistics South Africa
Census 2011 Provincial Profile: Mpumalanga, Report 03-01-77
94
Terms and definitions Census (Population Census) The process of counting the number of people, at a given point in time in a country, and collecting information about their demographic, social and economic characteristics. After data collection, the process includes the processing, analysis and dissemination of the information collected.
Census night The night before the census day. It is the decisive point of time for being included in the census (midnight on that night).
De facto census A census in which people are enumerated according to where they were on census night. In this case, at midnight on the night of 9/10 October 2011.
De jure census A census in which people are enumerated according to where they usually live.
Bucket toilet system A toilet system with a pail or other removable receptacle placed directly under the toilet seat, and where no water or chemicals is used.
Disability Difficulties encountered in functioning due to body impairments or activity limitation, with or without assistive devices.
Dwelling unit Structure or part of a structure or group of structures occupied or meant to be occupied by one or more than one household. Includes structure or part of a structure which is vacant and/or under construction, but can be lived in at the time of the survey. Includes units in collective living quarters, unlike housing units. Dwelling units may therefore comprise housing units plus units in collective living quarters when applicable. (Examples of each are a house, a group of huts, and a flat.)
A dwelling unit has a separate entrance from outside or from a common space, as in a block of flats. Premises not intended for use as living quarters, but used for human habitation at the time of the census, such as a barn, warehouse, etc., are also classified as dwelling units for census purposes.
Emigrant A person who leaves a country with the intention of staying in the country of arrival.
Employed Persons who work for pay; profit or family gain in the reference period.

Statistics South Africa
Census 2011 Provincial Profile: Mpumalanga, Report 03-01-77
95
Enumeration area An enumeration area (EA) is the smallest geographical unit (piece of land) into which the country is divided for census or survey purposes. EAs typically contain between 100 and 250 households. Each EA is expected to have clearly defined boundaries.
Formal dwelling A structure built according to approved plans, i.e. house on a separate stand, flat or apartment, townhouse, room in a backyard or rooms or flatlet elsewhere.
Health and functioning Whether a person has difficulty in seeing, hearing, communicating, walking or climbing stairs, remembering or concentrating, and self-care such as washing all over, dressing or feeding.
Household A household is a group of persons who live together and provide themselves jointly with food or other essentials for living, or a single person who lives alone. Note that a household is not necessarily the same as a family.
Household head A person recognised as such by household, usually the main decision-maker, or the person who owns or rents the dwelling, or the person who is the main breadwinner. The head can be either male or female. If two people are equal decision-makers, the oldest can be named as the household head.
Household income All receipts by all members of a household, in cash and in kind, in exchange for employment, or in return for capital investment, or receipts obtained from other sources such as pension.
Immigrant A person who enters a country from another country with the intention of staying in that country.
In-migrants A person who moves from one part of a country to another part with the intention of staying where they move to. This person would be regarded as an in-migrant at the place where they move to.
Informal dwelling Makeshift structure not approved by a local authority and not intended as a permanent dwelling. Typically built with found materials (corrugated iron, cardboard, plastic, etc.). Contrasted with formal dwelling and traditional dwelling.
Labour absorption rate The proportion of the working-age population that is employed.

Statistics South Africa
Census 2011 Provincial Profile: Mpumalanga, Report 03-01-77
96
Labour force All employed and unemployed persons of working age.
Labour force participation rate Labour force as a percentage of the working-age population.
Not economically active Persons who were neither employed or unemployed (e.g. full-time students; retired persons; and homemakers who did not want to work).
Out-migrants A person who moves from one part of a country to another part with the intention of staying where they move to. This person would be regarded as an out-migrant at the place where they move from.
Post-enumeration survey A sample survey conducted immediately after a census to evaluate the census. Results are used to make adjustments for the census undercount or overcount.
Sex Biological distinction between males and females.
Traditional dwelling A dwelling made primarily of clay, mud, reeds or other locally available natural materials. This is a general term that includes huts, rondavels, etc. Such dwellings can be found as single units or in clusters.
Unemployed (official definition) Persons who did not work, but who looked for work and were available to work in the reference period.
Unemployment rate Unemployed persons as a percentage of the labour force.
Unspecified All cases whereby an answer was expected but was left blank during enumeration.
Wattle and daub Traditional construction method whereby walls are built with wooden sticks/poles and covered with mud or a mixture of mud and clay.
Working-age population Persons aged 15–64 years.

ISBN: 978-0-621-43216-9